bp-18-fs-bpa-02a power revenue requirement study documentation · 2017-11-01 · see documentation,...
TRANSCRIPT

B O N N E V I L L E P O W E R A D M I N I S T R A T I O N
BP-18 Rate Proceeding
Final Proposal
Power Revenue Requirement Study Documentation
BP-18-FS-BPA-02A
July 2017


BP-18-FS-BPA-02A
Page i
POWER REVENUE REQUIREMENT STUDY DOCUMENTATION
TABLE OF CONTENTS Page
COMMONLY USED ACRONYMS AND SHORT FORMS ...................................................... iii
1. GENERATION REVENUE REQUIREMENTS ................................................................1 1.1 Introduction ..............................................................................................................1 1.2 Income Statement.....................................................................................................1 1.3 Statement of Cash Flows .........................................................................................5
2. COST ANALYSES ...........................................................................................................10 2.1 Introduction ............................................................................................................10 2.2 Annual Cost Components of COSA Resource Pools ............................................10 2.3 Interbusiness Unit Embedded Costs ......................................................................10
3. GENERATION EXPENSES .............................................................................................14 3.1 Introduction ............................................................................................................14 3.2 Expenses ................................................................................................................14
4. FCRPS GENERATION INVESTMENT BASE ...............................................................29 4.1 Introduction ............................................................................................................29 4.2 Methodology ..........................................................................................................29
5. PROJECTED CASH BALANCES / INTEREST CREDITS ............................................37 5.1 Introduction ............................................................................................................37 5.2 Interest credits on projected cash balances ............................................................37 5.3 Interest credits on funds held for others .................................................................37 5.4 Interest credits on prepay funds .............................................................................37 5.5 Allocation of Interest Credit ..................................................................................37
6. INTEREST RATES FOR TREASURY SOURCES OF CAPITAL AND PRICE DEFLATORS ....................................................................................................................41 6.1 Introduction ............................................................................................................41 6.2 Source of Forecasts ................................................................................................41 6.3 Interest Rate Projections ........................................................................................41 6.4 Deflators .................................................................................................................41
7. PROJECTED BONDS ISSUED TO TREASURY ...........................................................64 7.1 Introduction ............................................................................................................64 7.2 Issuing Bonds .........................................................................................................64
8. CAPITALIZED CONTRACTS AND OTHER LONG TERM RESOURCE ACQUISITION OBLIGATIONS ......................................................................................66 8.1 Introduction ............................................................................................................66 8.2 Methodology ..........................................................................................................66

BP-18-FS-BPA-02A
Page ii
9. IRRIGATION ASSISTANCE ...........................................................................................68 9.1 Introduction ............................................................................................................68 9.2 Background ............................................................................................................68 9.3 Irrigation Repayment .............................................................................................68
10. REPLACEMENTS PROJECTED AFTER THE COST EVALUATION PERIOD 10.1 Introduction ............................................................................................................72 10.2 Methodology ..........................................................................................................72
11. REPAYMENT STUDY DATA, FY 2018 STUDY ..........................................................76
12. REPAYMENT STUDY DATA, FY 2019 STUDY .......................................................130
13. REPAYMENT STUDY DATA, FY 2019 STUDY, POST SHIFT ...............................188
14. REPAYMENT STUDY THEORY AND OPERATION ................................................248 14.1 Introduction ..........................................................................................................248 14.2 Repayment Program Logic ..................................................................................248 14.3 Bond Rollover Feature .........................................................................................249
BP-18-FS-BPA-02A
Page iii
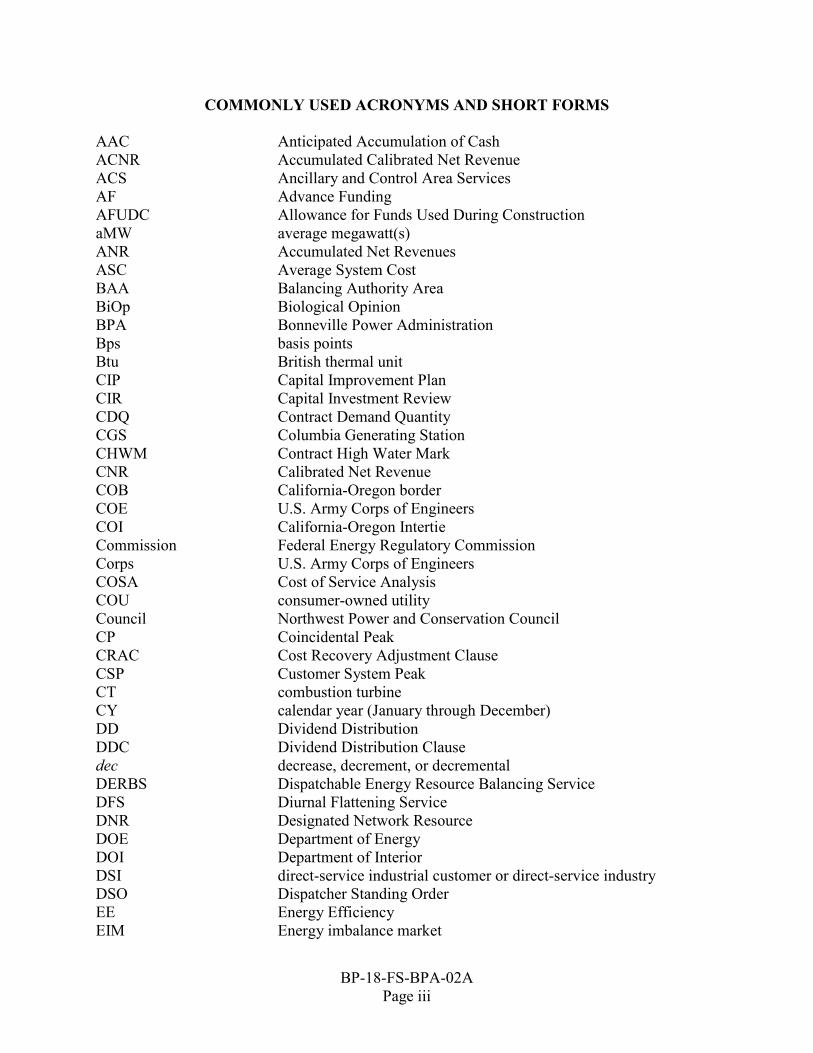
COMMONLY USED ACRONYMS AND SHORT FORMS AAC Anticipated Accumulation of Cash ACNR Accumulated Calibrated Net Revenue ACS Ancillary and Control Area Services AF Advance Funding AFUDC Allowance for Funds Used During Construction aMW average megawatt(s) ANR Accumulated Net Revenues ASC Average System Cost BAA Balancing Authority Area BiOp Biological Opinion BPA Bonneville Power Administration Bps basis points Btu British thermal unit CIP Capital Improvement Plan CIR Capital Investment Review CDQ Contract Demand Quantity CGS Columbia Generating Station CHWM Contract High Water Mark CNR Calibrated Net Revenue COB California-Oregon border COE U.S. Army Corps of Engineers COI California-Oregon Intertie Commission Federal Energy Regulatory Commission Corps U.S. Army Corps of Engineers COSA Cost of Service Analysis COU consumer-owned utility Council Northwest Power and Conservation Council CP Coincidental Peak CRAC Cost Recovery Adjustment Clause CSP Customer System Peak CT combustion turbine CY calendar year (January through December) DD Dividend Distribution DDC Dividend Distribution Clause dec decrease, decrement, or decremental DERBS Dispatchable Energy Resource Balancing Service DFS Diurnal Flattening Service DNR Designated Network Resource DOE Department of Energy DOI Department of Interior DSI direct-service industrial customer or direct-service industry DSO Dispatcher Standing Order EE Energy Efficiency EIM Energy imbalance market

BP-18-FS-BPA-02A
Page iv
EIS Environmental Impact Statement EN Energy Northwest, Inc. ESA Endangered Species Act ESS Energy Shaping Service e-Tag electronic interchange transaction information FBS Federal base system FCRPS Federal Columbia River Power System FCRTS Federal Columbia River Transmission System FELCC firm energy load carrying capability FOIA Freedom Of Information Act FORS Forced Outage Reserve Service FPS Firm Power and Surplus Products and Services FPT Formula Power Transmission FY fiscal year (October through September) G&A general and administrative (costs) GARD Generation and Reserves Dispatch (computer model) GMS Grandfathered Generation Management Service GSP Generation System Peak GSR Generation Supplied Reactive GRSPs General Rate Schedule Provisions GTA General Transfer Agreement GWh gigawatthour HLH Heavy Load Hour(s) HOSS Hourly Operating and Scheduling Simulator (computer model) HYDSIM Hydrosystem Simulator (computer model) IE Eastern Intertie IM Montana Intertie inc increase, increment, or incremental IOU investor-owned utility IP Industrial Firm Power IPR Integrated Program Review IR Integration of Resources IRD Irrigation Rate Discount IRM Irrigation Rate Mitigation IRPL Incremental Rate Pressure Limiter IS Southern Intertie kcfs thousand cubic feet per second kW kilowatt kWh kilowatthour LDD Low Density Discount LGIA Large Generator Interconnection Agreement LLH Light Load Hour(s) LPP Large Project Program LPTAC Large Project Targeted Adjustment Charge LTF Long-term Form Maf million acre-feet

BP-18-FS-BPA-02A
Page v
Mid-C Mid-Columbia MMBtu million British thermal units MNR Modified Net Revenue MRNR Minimum Required Net Revenue MW megawatt MWh megawatthour NCP Non-Coincidental Peak NEPA National Environmental Policy Act NERC North American Electric Reliability Corporation NFB National Marine Fisheries Service (NMFS) Federal Columbia River
Power System (FCRPS) Biological Opinion (BiOp) NLSL New Large Single Load NMFS National Marine Fisheries Service NOAA Fisheries National Oceanographic and Atmospheric Administration Fisheries NOB Nevada-Oregon border NORM Non-Operating Risk Model (computer model) Northwest Power Act Pacific Northwest Electric Power Planning and Conservation Act NP-15 North of Path 15 NPCC Pacific Northwest Electric Power and Conservation Planning
Council NPV net present value NR New Resource Firm Power NRFS NR Resource Flattening Service NT Network Integration NTSA Non-Treaty Storage Agreement NUG non-utility generation NWPP Northwest Power Pool OATT Open Access Transmission Tariff O&M operation and maintenance OATI Open Access Technology International, Inc. OS Oversupply OY operating year (August through July) PDCI Pacific DC Intertie Peak Peak Reliability (assessment/charge) PF Priority Firm Power PFp Priority Firm Public PFx Priority Firm Exchange PNCA Pacific Northwest Coordination Agreement PNRR Planned Net Revenues for Risk PNW Pacific Northwest POD Point of Delivery POI Point of Integration or Point of Interconnection POR Point of Receipt Project Act Bonneville Project Act PS Power Services PSC power sales contract
BP-18-FS-BPA-02A
Page vi
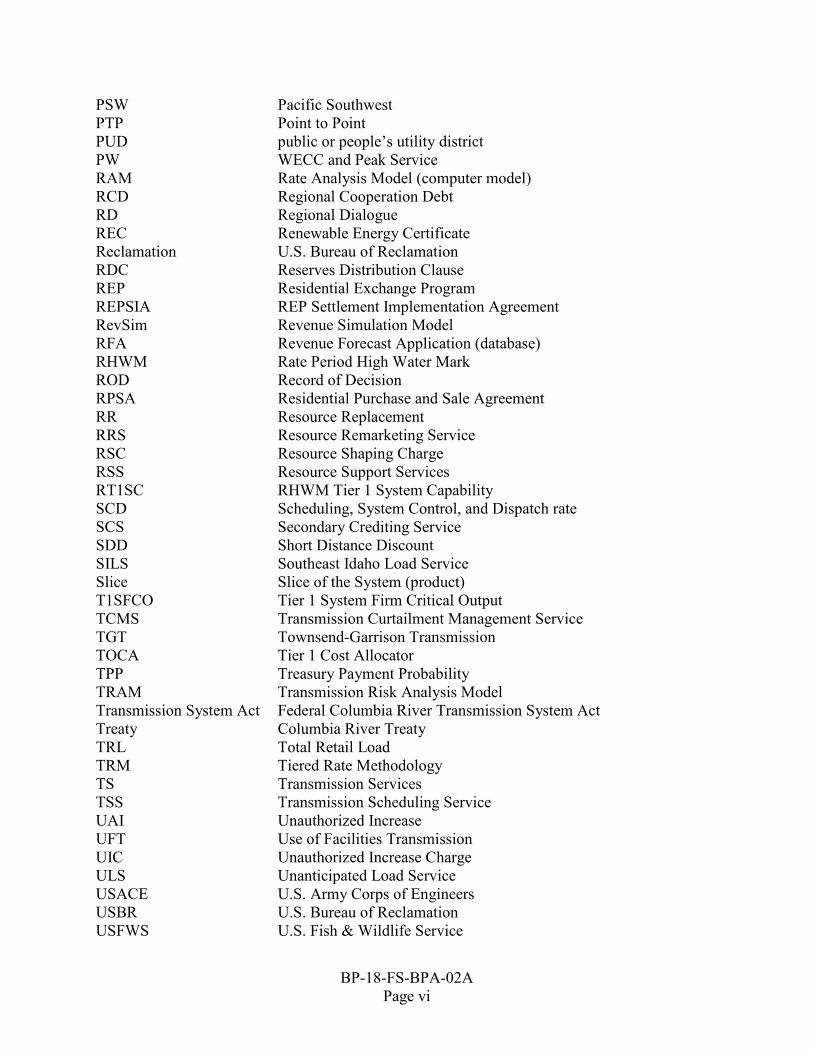
PSW Pacific Southwest PTP Point to Point PUD public or people’s utility district PW WECC and Peak Service RAM Rate Analysis Model (computer model) RCD Regional Cooperation Debt RD Regional Dialogue REC Renewable Energy Certificate Reclamation U.S. Bureau of Reclamation RDC Reserves Distribution Clause REP Residential Exchange Program REPSIA REP Settlement Implementation Agreement RevSim Revenue Simulation Model RFA Revenue Forecast Application (database) RHWM Rate Period High Water Mark ROD Record of Decision RPSA Residential Purchase and Sale Agreement RR Resource Replacement RRS Resource Remarketing Service RSC Resource Shaping Charge RSS Resource Support Services RT1SC RHWM Tier 1 System Capability SCD Scheduling, System Control, and Dispatch rate SCS Secondary Crediting Service SDD Short Distance Discount SILS Southeast Idaho Load Service Slice Slice of the System (product) T1SFCO Tier 1 System Firm Critical Output TCMS Transmission Curtailment Management Service TGT Townsend-Garrison Transmission TOCA Tier 1 Cost Allocator TPP Treasury Payment Probability TRAM Transmission Risk Analysis Model Transmission System Act Federal Columbia River Transmission System Act Treaty Columbia River Treaty TRL Total Retail Load TRM Tiered Rate Methodology TS Transmission Services TSS Transmission Scheduling Service UAI Unauthorized Increase UFT Use of Facilities Transmission UIC Unauthorized Increase Charge ULS Unanticipated Load Service USACE U.S. Army Corps of Engineers USBR U.S. Bureau of Reclamation USFWS U.S. Fish & Wildlife Service

BP-18-FS-BPA-02A
Page vii
VERBS Variable Energy Resources Balancing Service VOR Value of Reserves VR1-2014 First Vintage Rate of the BP-14 rate period (PF Tier 2 rate) VR1-2016 First Vintage Rate of the BP-16 rate period (PF Tier 2 rate) WECC Western Electricity Coordinating Council WSPP Western Systems Power Pool

This page intentionally left blank.

1. GENERATION REVENUE REQUIREMENTS
1.1 Introduction
This chapter documents how Bonneville Power Administration's (BPA) annual generation revenue requirements are determined. Two tables are presented for each year of the rate period (FY 2018-2019). On the first table, revenue requirements for FY 2018-2019 are projected in an income statement format. The second table, a statement of annual cash flows, determines the minimum required net revenues and presents the annual cash flows available for risk mitigation. These revenue requirements form the basis of the program. 1.2 Income Statement
Below is a line-by-line description of the components in the Table 1A, Income Statement Power System Generation Resources (Line 2). This category encompasses the costs associated with power generated by Federal hydroelectric facilities operated by the Corps and Reclamation and power obtained through contracts for non-Federal resources and through energy conservation. This category includes lines 3 through 10, described below. See Documentation, BP-18-FS-BPA-02A, Chapter 3. Operating Generation Resources (Line 3). This category includes the operations and maintenance expenses associated with power-producing resources including the CGS, Reclamation, and Corps, and the annual expenses associated with long-term contract generating projects. Id.
Operating Generation Settlement Payments (Line 4). A settlement agreement between the Confederated Tribes of the Colville Reservation and the United States was signed in 2004 concerning the construction of Grand Coulee Dam. The Settlement Act (Public Law 103-436) ratifying the settlement agreement authorizes BPA to make annual payments to the Tribes for the use of tribal lands for power production at the Columbia Basin project. Id. Non-Operating Generation (Line 5). This category includes the decommissioning costs of the Trojan nuclear plant and the unfinished WNP-1 and WNP-3 nuclear plants. Id. Contracted Power Purchases (Line 6). This category includes short-term (balancing) power purchases and hedging/mitigation. Id. Augmentation Power Purchases (Line 7). This category includes augmentation power purchases and the PNCA headwater benefit. Augmentation power purchase costs reflect the energy that BPA purchases in order to satisfy its obligation to meet the load requirements for public utilities. The PNCA headwater benefit refers to the costs associated with benefits BPA receives from storage projects in Canada. Id. Exchanges and Settlements (Line 8). This category represents the benefits for qualifying public utilities and IOUs that are calculated as part of the Residential Exchange Program. Id.
BP-18-FS-BPA-02A Page 1
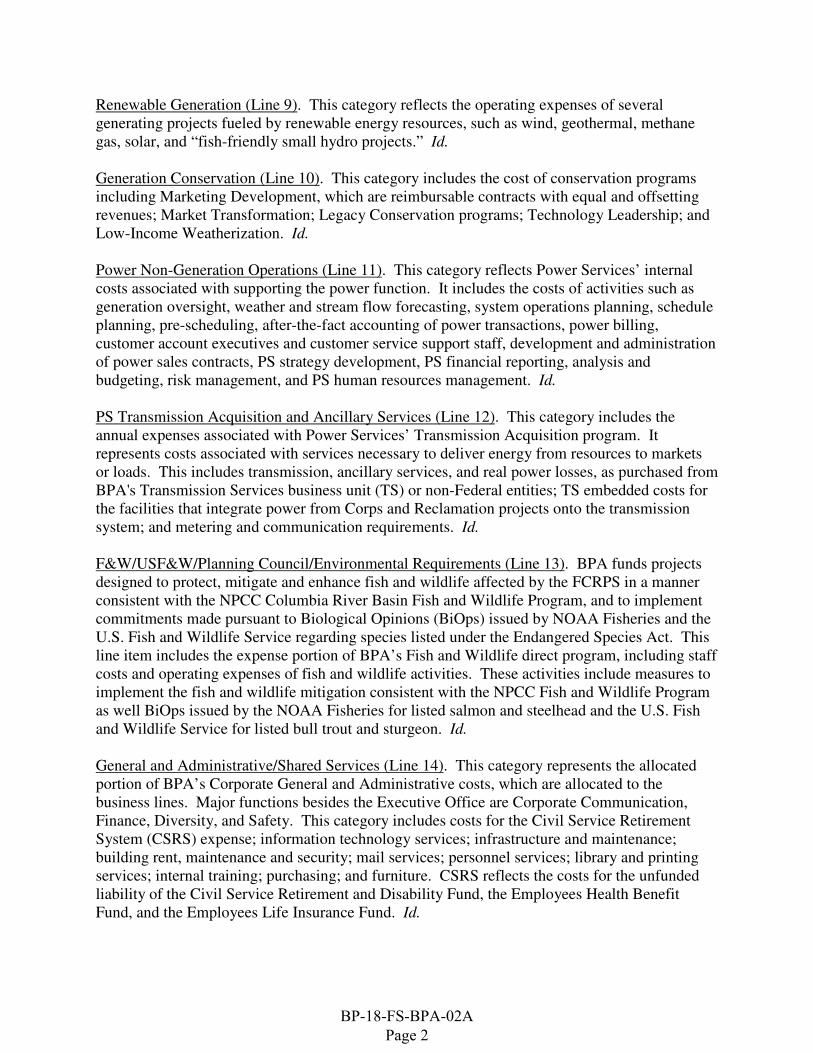
Renewable Generation (Line 9). This category reflects the operating expenses of several generating projects fueled by renewable energy resources, such as wind, geothermal, methane gas, solar, and “fish-friendly small hydro projects.” Id. Generation Conservation (Line 10). This category includes the cost of conservation programs including Marketing Development, which are reimbursable contracts with equal and offsetting revenues; Market Transformation; Legacy Conservation programs; Technology Leadership; and Low-Income Weatherization. Id. Power Non-Generation Operations (Line 11). This category reflects Power Services’ internal costs associated with supporting the power function. It includes the costs of activities such as generation oversight, weather and stream flow forecasting, system operations planning, schedule planning, pre-scheduling, after-the-fact accounting of power transactions, power billing, customer account executives and customer service support staff, development and administration of power sales contracts, PS strategy development, PS financial reporting, analysis and budgeting, risk management, and PS human resources management. Id. PS Transmission Acquisition and Ancillary Services (Line 12). This category includes the annual expenses associated with Power Services’ Transmission Acquisition program. It represents costs associated with services necessary to deliver energy from resources to markets or loads. This includes transmission, ancillary services, and real power losses, as purchased from BPA's Transmission Services business unit (TS) or non-Federal entities; TS embedded costs for the facilities that integrate power from Corps and Reclamation projects onto the transmission system; and metering and communication requirements. Id. F&W/USF&W/Planning Council/Environmental Requirements (Line 13). BPA funds projects designed to protect, mitigate and enhance fish and wildlife affected by the FCRPS in a manner consistent with the NPCC Columbia River Basin Fish and Wildlife Program, and to implement commitments made pursuant to Biological Opinions (BiOps) issued by NOAA Fisheries and the U.S. Fish and Wildlife Service regarding species listed under the Endangered Species Act. This line item includes the expense portion of BPA’s Fish and Wildlife direct program, including staff costs and operating expenses of fish and wildlife activities. These activities include measures to implement the fish and wildlife mitigation consistent with the NPCC Fish and Wildlife Program as well BiOps issued by the NOAA Fisheries for listed salmon and steelhead and the U.S. Fish and Wildlife Service for listed bull trout and sturgeon. Id. General and Administrative/Shared Services (Line 14). This category represents the allocated portion of BPA’s Corporate General and Administrative costs, which are allocated to the business lines. Major functions besides the Executive Office are Corporate Communication, Finance, Diversity, and Safety. This category includes costs for the Civil Service Retirement System (CSRS) expense; information technology services; infrastructure and maintenance; building rent, maintenance and security; mail services; personnel services; library and printing services; internal training; purchasing; and furniture. CSRS reflects the costs for the unfunded liability of the Civil Service Retirement and Disability Fund, the Employees Health Benefit Fund, and the Employees Life Insurance Fund. Id.
BP-18-FS-BPA-02A Page 2
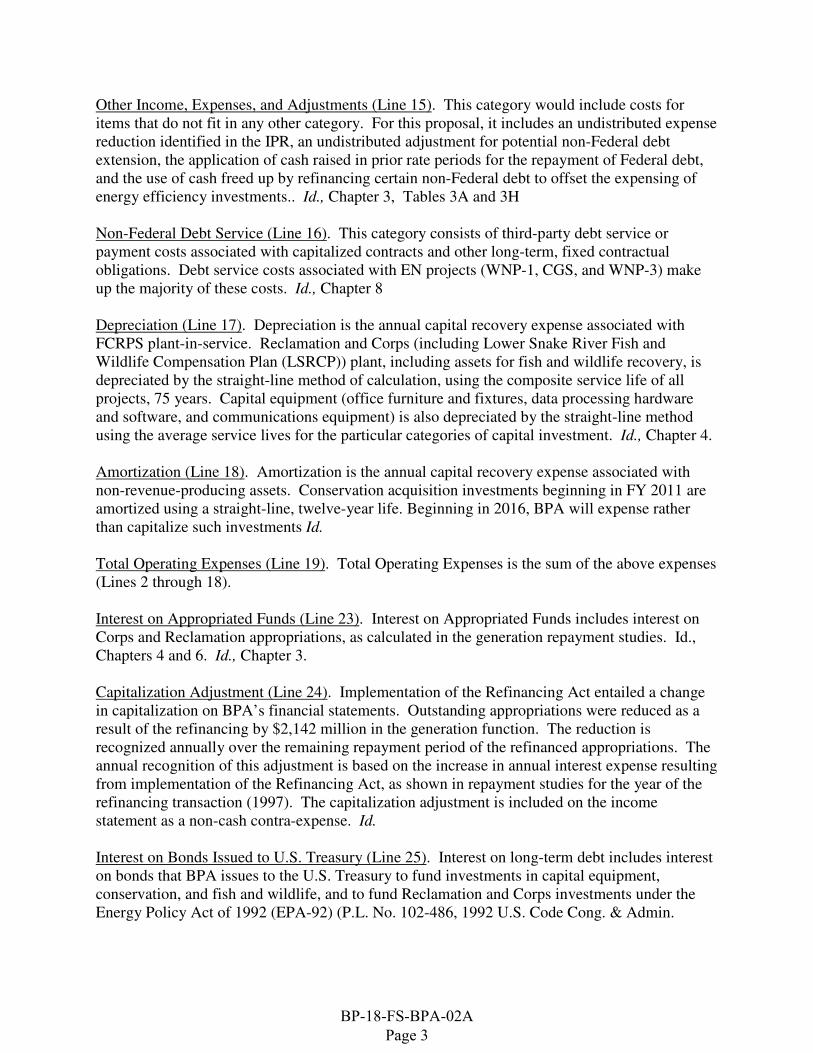
Other Income, Expenses, and Adjustments (Line 15). This category would include costs for items that do not fit in any other category. For this proposal, it includes an undistributed expense reduction identified in the IPR, an undistributed adjustment for potential non-Federal debt extension, the application of cash raised in prior rate periods for the repayment of Federal debt, and the use of cash freed up by refinancing certain non-Federal debt to offset the expensing of energy efficiency investments.. Id., Chapter 3, Tables 3A and 3H Non-Federal Debt Service (Line 16). This category consists of third-party debt service or payment costs associated with capitalized contracts and other long-term, fixed contractual obligations. Debt service costs associated with EN projects (WNP-1, CGS, and WNP-3) make up the majority of these costs. Id., Chapter 8 Depreciation (Line 17). Depreciation is the annual capital recovery expense associated with FCRPS plant-in-service. Reclamation and Corps (including Lower Snake River Fish and Wildlife Compensation Plan (LSRCP)) plant, including assets for fish and wildlife recovery, is depreciated by the straight-line method of calculation, using the composite service life of all projects, 75 years. Capital equipment (office furniture and fixtures, data processing hardware and software, and communications equipment) is also depreciated by the straight-line method using the average service lives for the particular categories of capital investment. Id., Chapter 4. Amortization (Line 18). Amortization is the annual capital recovery expense associated with non-revenue-producing assets. Conservation acquisition investments beginning in FY 2011 are amortized using a straight-line, twelve-year life. Beginning in 2016, BPA will expense rather than capitalize such investments Id. Total Operating Expenses (Line 19). Total Operating Expenses is the sum of the above expenses (Lines 2 through 18). Interest on Appropriated Funds (Line 23). Interest on Appropriated Funds includes interest on Corps and Reclamation appropriations, as calculated in the generation repayment studies. Id., Chapters 4 and 6. Id., Chapter 3. Capitalization Adjustment (Line 24). Implementation of the Refinancing Act entailed a change in capitalization on BPA’s financial statements. Outstanding appropriations were reduced as a result of the refinancing by $2,142 million in the generation function. The reduction is recognized annually over the remaining repayment period of the refinanced appropriations. The annual recognition of this adjustment is based on the increase in annual interest expense resulting from implementation of the Refinancing Act, as shown in repayment studies for the year of the refinancing transaction (1997). The capitalization adjustment is included on the income statement as a non-cash contra-expense. Id. Interest on Bonds Issued to U.S. Treasury (Line 25). Interest on long-term debt includes interest on bonds that BPA issues to the U.S. Treasury to fund investments in capital equipment, conservation, and fish and wildlife, and to fund Reclamation and Corps investments under the Energy Policy Act of 1992 (EPA-92) (P.L. No. 102-486, 1992 U.S. Code Cong. & Admin.
BP-18-FS-BPA-02A Page 3

News, 106 Stat. 2776). The interest expense is calculated in the generation repayment studies. Any payments of call premiums for bonds projected to be amortized are included in this line. Id. Amortization of Capitalized Bond Premiums (Line 26). When a bond issued to the U.S. Treasury is refinanced, any call premium resulting from early retirement of the original bond is capitalized and included in the principal of the new bond. The capitalized call premium is then amortized over the term of the new bond. The annual amortization is a non-cash component of interest expense. No capitalized bond premiums are anticipated in the rate period. Non-Federal Interest (Line 27). This line recognizes the interest component of the annual credits associated with the prepay program. Id. Allowance for Funds Used During Construction (AFUDC) (Line 28). AFUDC is a credit against interest costs on long-term debt (Line 20). This reduction to gross interest reflects an estimate of interest on the funds used during the construction period of facilities that have yet to be placed in service. AFUDC is capitalized along with other construction costs and is recovered through rates over the expected service life of the related plant as part of the depreciation expense after the facilities are placed in service. AFUDC, which is calculated outside the generation repayment studies, is associated with the Corps and Reclamation capital investments direct-funded by BPA, and BPA capital equipment. Id. Interest Credit on Cash Reservese (Line 29). An interest income credit is also computed on the projected year-end cash balance in the BPA fund attributable to Power Services that carries over into the next year. Also included is an interest income credit calculated in the generation repayment studies on funds to be collected during each year for payments of Federal interest and amortization at the end of the fiscal year. Interest income is credited against bond interest. Id., Chapter 5. Net Interest Expense (Line 30). Net Interest Expense is computed as the sum of Interest on Appropriated Funds (Line 22), Capitalization Adjustment (Line 23), Interest on Bonds Issued to U.S. Treasury (Line 24), Amortization of Capitalized Bond Premiums (Line 25), AFUDC (Line 26), and Interest Credit (Line 27). Total Expenses (Line 31). Total Expenses are the sum of Total Operating Expenses (Line 19) and Net Interest Expense (Line 30). Minimum Required Net Revenues (Line 34). MRNR, an input from Line 2 of the Statement of Cash Flows (Table 1B), may be necessary to cover cash requirements in excess of accrued expenses. Planned Net Revenues for Risk (PNRR) (Line 37). PNRR are the amount of net revenues to be included in rates for financial risk mitigation. PNRR, starting reserves, the cash-flow when non-cash expenses exceed cash payments, the CRAC, and other risk mitigation tools are available to mitigate risk in FY 2018-2019, as discussed in the Power Risk and Market Price Study, BP-18-FS-BPA-03.
BP-18-FS-BPA-02A Page 4

Planned Net Revenues, Total (Line 36). Planned Net Revenues is the sum of Minimum Required Net Revenues (Line 34) and PNRR (Line 37). Total Revenue Requirement (Line 38). Total Revenue Requirement is the sum of Total Expenses (Line 32) and Total Planned Net Revenues (Line 36). 1.3 Statement of Cash Flows
Below is a line-by-line description of each of the components in the Table 1B, Statement of Cash Flows. Minimum Required Net Revenues (Line 2). Determination of this line is a result of annual cash inflows and outflows shown on the Statement of Cash Flows. MRNR may be necessary so that the cash provided from operating activities will be sufficient to cover the planned amortization and irrigation assistance payments without causing the Annual Increase (Decrease) in Cash (Line 21) to be negative. The MRNR amount determined in the Statement of Cash Flows is incorporated in the Income Statement (Line 31). Non-Federal Interst (Line 4). The interest component of the prepay credits is a non-cash item. Depreciation and Amortization (Line 5). Depreciation and Amortization are from the Income Statement (Table 1A), lines 17 and 18 respectively. They are included in computing Cash Provided By Operating Activities (Line 10) because they are non-cash expenses of the FCRPS. Non-Cash Expenses (Line 6). Energy Northwest is using lines of credit (LOC) to pay for its O&M costs and interest expense. This enables BPA to use the cash freed up by the LOC for early repayment of Federal obligations. Amortization of Capitalized Bond Premiums (Line 7). Amortization of capitalized bond premiums is from the Income Statement (Table 1A, line 26). It is included in computing Cash Provided By Operating Activities (Line 10) because it is a non-cash expense of the FCRPS. Capitalization Adjustment (Line 8). Capitalization Adjustment is from the Income Statement (Table 1A, Line 24). It is a non-cash contra-expense. Non-Cash Revenues (Line 9). Revenues are associated with settlement agreements reached in prior periods as well as the credits associated with the prepay program. The annual non-cash revenues, which are part of the total revenues recovering the FCRPS revenue requirement, are included here as an adjustment to cash from current operations. Cash Provided By Operating Activities (Line 10). Cash Provided By Current Operations, the sum of Lines 2, 4, 5, 6, 7, 8, and 9, is available for the year to satisfy cash requirements. Investment in Federal Utility Plant (Including AFUDC) (Line 14). Investment in Utility Plant represents the annual increase in additions to appropriated plant-in-service and to capital expenditures for COE, Reclamation, and BPA construction work-in-progress funded by bonds.
BP-18-FS-BPA-02A Page 5

Investment in Conservation (Line 15). Investment in Conservation represents the annual increase in capital expenditures associated with Conservation programs. Investment in Fish and Wildlife (Line 16). Investment in Fish and Wildlife represents the annual increase in BPA’s capital expenditures to fund projects for the protection, mitigation, and enhancement of fish and wildlife affected by the FCRPS in a manner consistent with the NPCC’s Columbia River Basin Fish and Wildlife Program and the BiOp issued by NMFS and USFWS. Cash Used for Investment Activities (Line 17). Cash Used for Investment Activities is the sum of Lines 14, 15, and 16. Increase in Treasury Borrowings (Line 20). This category reflects the new bonds issued by BPA to the U.S. Treasury to fund capital equipment, conservation, and fish and wildlife capital programs and to direct-fund Reclamation and COE investments under the EPA-92. Id., Chapter 7. Repayment of Treasury Borrowings (Line 21). This is BPA’s planned repayment of outstanding bonds issued by BPA to the U.S. Treasury as determined in the generation repayment studies. Id., Chapter 6. Increase in Federal Construction Appropriations (Line 22). Increase in Congressional Capital Appropriations represents congressional appropriations projected to be received during the year for COE and Reclamation capital projects. Id., Chapter 4. Repayment of Federal Construction Appropriations (Line 23). Repayment of Capital Appropriations represents projected amortization of outstanding COE and Reclamation appropriations as determined in the generation repayment studies. Id., Chapter 6. Repayment of Non-Federal Obligations (Line 24). This represents the repayment of the EN LOC issued in the prior year. Customer Proceeds (Line 25). The prepay funds are a source of cash for capital investment. This line recognizes the drawdown of prepay funds as they are used to finance capital investments. See Chapter 3. Payment of Irrigation Assistance (Line 26). Payment of Irrigation Assistance represents the payment of appropriated capital construction costs of Reclamation irrigation facilities that have been determined to be beyond the ability of the irrigators to pay and allocated to generation revenues for repayment. Id., Chapter 9. Cash Provided by Borrowing and Appropriations (Line 27). Cash Provided by Borrowing and Appropriations is the sum of Lines 20 through 25. This is the net cash-flow resulting from increases in cash from new long-term debt and capital appropriations and decreases in cash from repayment of long-term debt and capital appropriations.
BP-18-FS-BPA-02A Page 6

Annual Increase (Decrease) in Cash (Line 29). Annual Increase (Decrease) in Cash is the sum of Lines 10, 17, and 27 and reflects the annual net cash-flow from current operations and investing and financing activities. Revenue requirements are set to meet all projected annual cash-flow requirements, as included on the Statement of Cash Flows. A decrease shown in this line would indicate that annual revenues would be insufficient to cover the year’s cash requirements. In such cases, Minimum Required Net Revenues are included to offset such decrease. Planned Net Revenues for Risk (PNRR) (Line 31). PNRR reflects the amounts included in revenue requirements to meet BPA’s risk mitigation objectives from Table 1A, Line 37. Total Annual Increase (Decrease) in Cash (Line 33). Total Annual Increase (Decrease) in Cash is the sum of Lines 29 and 31. It is the total annual cash that is projected to be available to add to BPA’s cash reserves.
BP-18-FS-BPA-02A Page 7

A B
2018 2019
1 OPERATING EXPENSES
2 POWER SYSTEM GENERATION RESOURCES
3 OPERATING GENERATION RESOURCES 703,407 759,721
4 OPERATING GENERATION SETTLEMENT PAYMENTS 22,612 22,997
5 NON-OPERATING GENERATION 1,500 1,534
6 CONTRACTED POWER PURCHASES 100,634 99,621
7 AUGMENTATION POWER PURCHASES 0 12,222
8 EXCHANGES & SETTLEMENTS 317,902 317,916
9 RENEWABLE GENERATION 38,332 39,060
10 GENERATION CONSERVATION 126,267 126,187
11 POWER NON-GENERATION OPERATIONS 90,411 94,319
12 PS TRANSMISSION ACQUISITION AND ANCILLARY SERVICES 215,044 211,640
13 F&W/USF&W/PLANNING COUNCIL 321,821 322,101
14 GENERAL AND ADMINISTRATIVE/SHARED SERVICES 79,353 81,417
15 OTHER INCOME, EXPENSES AND ADJUSTMENTS (128,728) (74,168)
16 NON-FEDERAL DEBT SERVICE 490,562 420,704
17 DEPRECIATION 144,092 144,065
18 AMORTIZATION 86,796 87,458
19 TOTAL OPERATING EXPENSES 2,610,006 2,666,794
20
21 INTEREST EXPENSE:
22 INTEREST
23 APPROPRIATED FUNDS 83,294 82,687
24 CAPITALIZATION ADJUSTMENT (45,937) (45,937)
25 BONDS ISSUED TO U.S. TREASURY 56,449 63,302
26 AMORTIZATION OF CAPITALIZED BOND PREMIUMS 0 0
27 NON-FEDERAL INTEREST 11,628 10,747
28 ALLOWANCE FOR FUNDS USED DURING CONSTRUCTION (8,379) (8,307)
29 INTEREST CREDIT ON CASH RESERVES (1,392) (2,205)
30 NET INTEREST EXPENSE 95,662 100,287
31
32 TOTAL EXPENSES 2,705,668 2,767,081
33
34 MINIMUM REQUIRED NET REVENUE 1/ 220,252 67,984
35 PLANNED NET REVENUE FOR RISK 20,000 20,000
36 PLANNED NET REVENUE, TOTAL (30+31) 240,252 87,984
37
38 TOTAL REVENUE REQUIREMENT 2,945,919 2,855,065
1/ SEE NOTE ON TABLE 1B
Table 1A
GENERATION REVENUE REQUIREMENT
INCOME STATEMENT
($000s)
BP-18-FS-BPA-02A Page 8

A B
2018 2019
1 CASH FROM OPERATING ACTIVITIES
2 MINIMUM REQUIRED NET REVENUE 1/ 220,252 67,984
3 NON-CASH ITEMS:
4 NON-FEDERAL INTEREST 11,628 10,747
5 DEPRECIATION AND AMORTIZATION 230,888 231,524
6 NON-CASH EXPENSES 0 0
7 AMORTIZATION OF CAPITALIZED BOND PREMIUMS 0 0
8 CAPITALIZATION ADJUSTMENT (45,937) (45,937)
9 NON-CASH REVENUES (34,124) (34,124)
10 CASH PROVIDED BY OPERATING ACTIVITIES 382,706 230,194
11
12 CASH FROM INVESTMENT ACTIVITIES
13 INVESTMENT IN:
14 UTILITY PLANT (INCLUDING AFUDC) (401,786) (339,696)
15 ENERGY EFFICIENCY 0 0
16 FISH & WILDLIFE (51,000) (44,000)
17 CASH USED FOR INVESTMENT ACTIVITIES (452,786) (383,696)
18
19 CASH FROM BORROWING AND APPROPRIATIONS:
20 INCREASE IN BONDS ISSUED TO U.S. TREASURY 305,600 319,950
21 REPAYMENT OF BONDS ISSUED TO U.S. TREASURY (44,150) (156,250)
22 INCREASE IN FEDERAL CONSTRUCTION APPROPRIATIONS 147,186 63,746
23 REPAYMENT OF FEDERAL CONSTRUCTION APPROPRIATIONS (91,070) (17,371)
24 REPAYMENT OF NON-FEDERAL OBLIGATIONS (220,252) 0
25 CUSTOMER PROCEEDS 0 0
26 PAYMENT OF IRRIGATION ASSISTANCE (27,234) (56,573)
27 CASH PROVIDED BY BORROWING AND APPROPRIATIONS 70,080 153,502
28
29 ANNUAL INCREASE (DECREASE) IN CASH 0 0
30
31 PLANNED NET REVENUE FOR RISK 20,000 20,000
32
33 TOTAL ANNUAL INCREASE (DECREASE) IN CASH 20,000 20,000
1/ Line 26 must be greater than or equal to zero to indicate that cash cost recovery requirements are being
achieved. If not, net revenues (MRNR) are added so that net cash flows for the year (Line 21) are zero.
Table 1B
STATEMENT OF CASH FLOWS
($000s)
GENERATION REVENUE REQUIREMENT
BP-18-FS-BPA-02A Page 9

2. COST ANALYSES
2.1 Introduction
This chapter documents the development of the costs necessary for ratemaking from the annual generation revenue requirements. For Cost of Service Analysis (COSA), net interest expense and planned net revenues are assigned to each Federal Columbia River Power System (FCRPS) resource pool according to the necessary level of detail. The interbusiness unit embedded costs, generation inputs to ancillary services, synchronous condensing and Corps and Reclamation transmission, are developed from the COSA data. Data development for the COSA and interbusiness unit embedded costs are derived from the annual costs identified in Table 1A - Generation Income Statement. For the COSA, net interest expenses and planned net revenues, which are first split between Federal hydro projects and the remainder of generation by the use of equivalent annual costs (defined below). The generation portions are then divided between Fish & Wildlife, Conservation and BPA generation programs based on average net investment. These allocations, in turn, form the basis for the association of net interest expenses and MRNR with the interbusiness unit embedded costs. 2.2 Annual Capital-Related Cost Components of COSA Resource Pools
Equivalent Annual Costs: Equivalent annual costs are used to prorate net interest expense and planned net revenues between Federal Hydro and the remainder of generation. They compensate for the differences in Federal Hydro of a 75-year service life, but a 50-year repayment period, whereas the other capital areas have the same service lives and repayment periods. Consequently, net investment, the typical allocator, is distorted for Hydro. Equivalent annual costs are calculated as levelized principal and interest payments (mortgage basis) using gross plant investment and projected additions. A weighted average interest rate is used for the historical plant and projected interest rates are used for additions. The prorating is based on the sum of all calculated proxy-payments for Corps and Reclamation (Federal Hydro), and BPA plant, BPA fish and wildlife investment and all BPA conservation investments (all other generation). The non-Hydro portion is then allocated based on average net plant investment. 2.3 Interbusiness Unit Embedded Costs
All tables related to the development of interbusiness unit costs have been deleted because generation inputs rates were settled and did not depend on these embedded costs as would be typical if the rates were contested.
BP-18-FS-BPA-02A Page 10
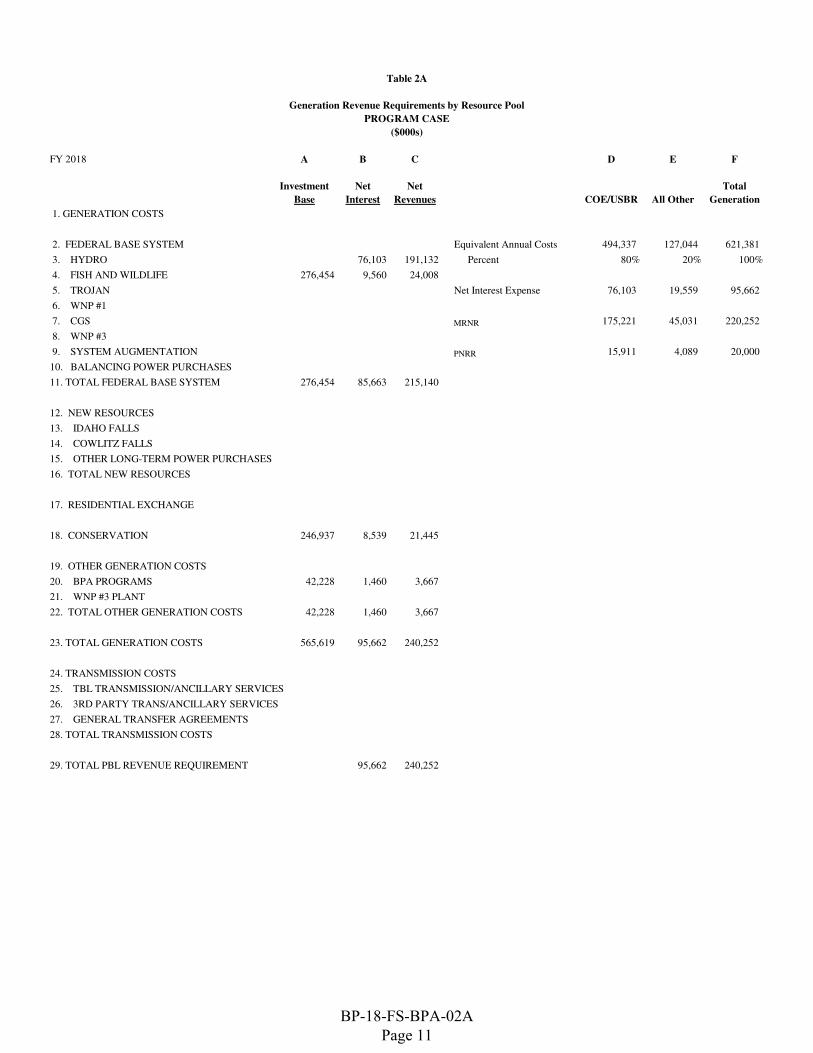
FY 2018 A B C D E F
Investment Net Net Total
Base Interest Revenues COE/USBR All Other Generation
1. GENERATION COSTS
2. FEDERAL BASE SYSTEM Equivalent Annual Costs 494,337 127,044 621,381
3. HYDRO 76,103 191,132 Percent 80% 20% 100%
4. FISH AND WILDLIFE 276,454 9,560 24,008
5. TROJAN Net Interest Expense 76,103 19,559 95,662
6. WNP #1
7. CGS MRNR 175,221 45,031 220,252
8. WNP #3
9. SYSTEM AUGMENTATION PNRR 15,911 4,089 20,000
10. BALANCING POWER PURCHASES
11. TOTAL FEDERAL BASE SYSTEM 276,454 85,663 215,140
12. NEW RESOURCES
13. IDAHO FALLS
14. COWLITZ FALLS
15. OTHER LONG-TERM POWER PURCHASES
16. TOTAL NEW RESOURCES
17. RESIDENTIAL EXCHANGE
18. CONSERVATION 246,937 8,539 21,445
19. OTHER GENERATION COSTS
20. BPA PROGRAMS 42,228 1,460 3,667
21. WNP #3 PLANT
22. TOTAL OTHER GENERATION COSTS 42,228 1,460 3,667
23. TOTAL GENERATION COSTS 565,619 95,662 240,252
24. TRANSMISSION COSTS
25. TBL TRANSMISSION/ANCILLARY SERVICES
26. 3RD PARTY TRANS/ANCILLARY SERVICES
27. GENERAL TRANSFER AGREEMENTS
28. TOTAL TRANSMISSION COSTS
29. TOTAL PBL REVENUE REQUIREMENT 95,662 240,252
Table 2A
Generation Revenue Requirements by Resource Pool
PROGRAM CASE
($000s)
BP-18-FS-BPA-02A Page 11

Table 2A
Generation Revenue Requirements by Resource Pool
PROGRAM CASE
($000s)
FY 2019
A B C D E F
Investment Net Net Total
Base Interest Revenues Hydro All Other Generation
1. GENERATION COSTS
2. FEDERAL BASE SYSTEM Equivalent Annual Costs 498,713 131,307 630,020
3. HYDRO 79,386 69,647 Percent 79% 21% 100%
4. FISH AND WILDLIFE 287,781 10,984 9,637
5. TROJAN Net Interest Expense 79,386 20,901 100,287
6. WNP #1
7. CGS MRNR 53,815 14,169 67,984
8. WNP #3
9. SYSTEM AUGMENTATION PNRR 15,832 4,168 20,000
10. BALANCING POWER PURCHASES
11. TOTAL FEDERAL BASE SYSTEM 287,781 90,370 79,284
12. NEW RESOURCES
13. IDAHO FALLS
14. COWLITZ FALLS
15. OTHER LONG-TERM POWER PURCHASES
16. TOTAL NEW RESOURCES
17. RESIDENTIAL EXCHANGE
18. CONSERVATION 226,219 8,635 7,575
19. OTHER GENERATION COSTS
20. BPA PROGRAMS 33,583 1,282 1,125
21. WNP #3 PLANT
22. TOTAL OTHER GENERATION COSTS 33,583 1,282 1,125
23. TOTAL GENERATION COSTS 547,583 100,287 87,984
24. TRANSMISSION COSTS
25. TBL TRANSMISSION/ANCILLARY SERVICES
26. 3RD PARTY TRANS/ANCILLARY SERVICES
27. GENERAL TRANSFER AGREEMENTS
28. TOTAL TRANSMISSION COSTS
29. TOTAL PBL REVENUE REQUIREMENT 100,287 87,984
BP-18-FS-BPA-02A Page 12

Table 2B
Equivalent Annual Costs
($000s)
A B C D E F G
COMP WT AV 2014 COMP WT AV 2015
AVG PLANT INT EQ ANN PLANT INT EQ ANN
LIFE 9/30/2018 RATE COSTS 9/30/2019 RATE COSTS
1 Corps of Engineers/Bureau of Reclamation 50 10,440,023 4.10% $494,337 10,744,710 3.98% $498,713
2 BPA F&W
3 PBL General Plant 15 526,639 3.26% 44,932 554,929 3.24% 47,299
4 CONSERVATION 8 173,437 1.62% 21,760 180,638 1.79% 23,638
5 Sub-Total 42 1,696,389 2.01% 60,351 1,696,389 2.05% 60,370
127,044 131,307
INV. BASE INV. BASE
WTD AS OF ANNUAL AVG AS OF ANNUAL
LIFE 9/30/2018 DEPR/AMORT LIFE 9/30/2019 DEPR/AMORT
6 OFFICE FURNITURE & FIXTURES
7 DATA PROCESSING EQUIPMENT
8 DATA PROCESSING SOFTWARE
9 TOTAL GENERAL PLANT - PBL 8 173,437 20,162 8 180,638 21,783
CONSERVATION
10 LEGACY
11 CONAUG
12 CONSERVATION ACQUISITION
13 TOTAL CONSERVATION 42 1,696,389 40,512 42 1,696,389 40,162
BP-18-FS-BPA-02A Page 13

3. GENERATION EXPENSES
3.1 Introduction This chapter compiles the expenses that are the basis for cost recovery in determination of generation revenue requirements for the rate approval period and the outyears. 3.2 Expenses
Table 3A displays the expenses used in the revenue requirement income statement and statement of cash flows of the Study. Revenue Requirement Study, BP-18-FS-BPA-02, Tables 4 and 5. O&M program expenses are from the Integrated Program Review with revisions. Id. Federal Projects Depreciation calculations are found in Chapter 4 of this document. Interest expense is summarized here from the results of the annual generation repayment studies. The calculation of AFUDC is also shown in this chapter. Debt service for Energy Northwest (EN) projects are based on the tables found in Chapter 8, Capitalized Contract Obligations, of this document. Corps and Reclamation O&M must be functionalized between generation and the transmission component that will be included in transmission rates. Depreciation expense, calculated using the straight-line method, is functionalized according to the associated investment used in the calculations as identified in Chapter 4 of this document. Interest expense is calculated in the repayment studies for generation using the generation capital appropriations and BPA revenue bonds issued to Treasury at individual interest rates. Generation AFUDC is associated with BPA’s direct funding of Corps and Reclamation power-related capital projects.
BP-18-FS-BPA-02A Page 14
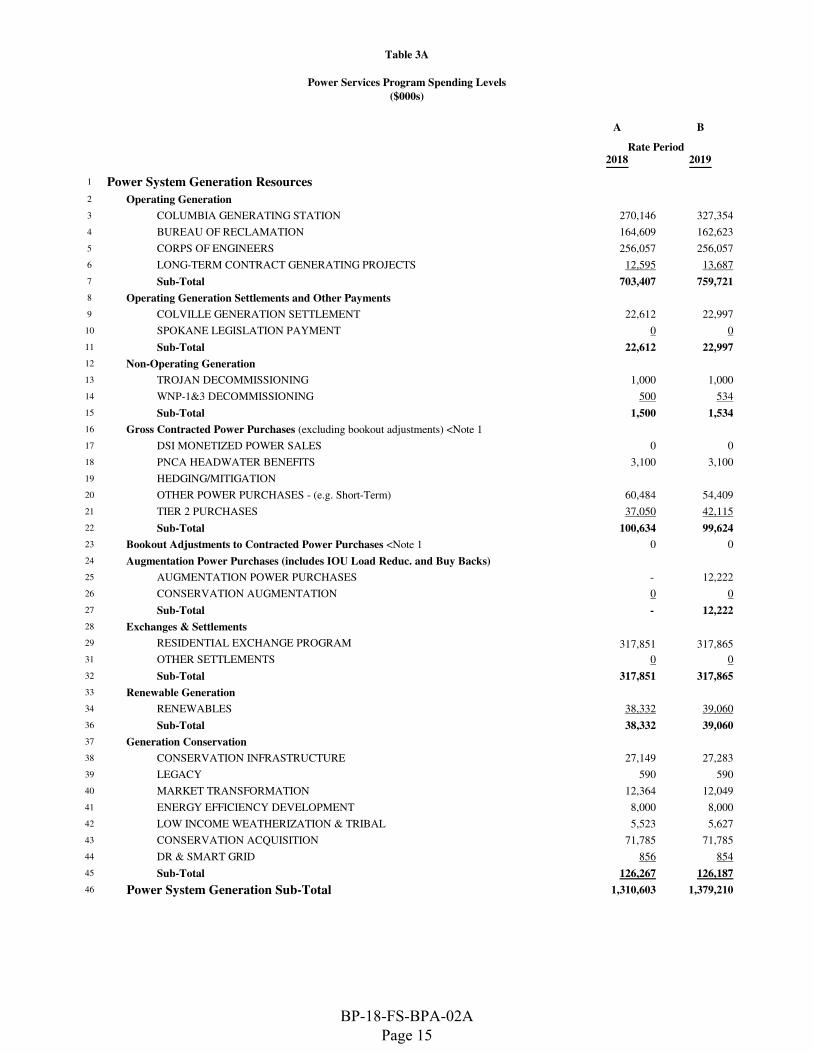
Table 3A
Power Services Program Spending Levels
($000s)
A B
2018 2019
1 Power System Generation Resources
2 Operating Generation
3 COLUMBIA GENERATING STATION 270,146 327,354
4 BUREAU OF RECLAMATION 164,609 162,623
5 CORPS OF ENGINEERS 256,057 256,057
6 LONG-TERM CONTRACT GENERATING PROJECTS 12,595 13,687
7 Sub-Total 703,407 759,721
8 Operating Generation Settlements and Other Payments
9 COLVILLE GENERATION SETTLEMENT 22,612 22,997
10 SPOKANE LEGISLATION PAYMENT 0 0
11 Sub-Total 22,612 22,997
12 Non-Operating Generation
13 TROJAN DECOMMISSIONING 1,000 1,000
14 WNP-1&3 DECOMMISSIONING 500 534
15 Sub-Total 1,500 1,534
16 Gross Contracted Power Purchases (excluding bookout adjustments) <Note 1
17 DSI MONETIZED POWER SALES 0 0
18 PNCA HEADWATER BENEFITS 3,100 3,100
19 HEDGING/MITIGATION
20 OTHER POWER PURCHASES - (e.g. Short-Term) 60,484 54,409
21 TIER 2 PURCHASES 37,050 42,115
22 Sub-Total 100,634 99,624
23 Bookout Adjustments to Contracted Power Purchases <Note 1 0 0
24 Augmentation Power Purchases (includes IOU Load Reduc. and Buy Backs)
25 AUGMENTATION POWER PURCHASES - 12,222
26 CONSERVATION AUGMENTATION 0 0
27 Sub-Total - 12,222
28 Exchanges & Settlements
29 RESIDENTIAL EXCHANGE PROGRAM 317,851 317,865
31 OTHER SETTLEMENTS 0 0
32 Sub-Total 317,851 317,865
33 Renewable Generation
34 RENEWABLES 38,332 39,060
36 Sub-Total 38,332 39,060
37 Generation Conservation
38 CONSERVATION INFRASTRUCTURE 27,149 27,283
39 LEGACY 590 590
40 MARKET TRANSFORMATION 12,364 12,049
41 ENERGY EFFICIENCY DEVELOPMENT 8,000 8,000
42 LOW INCOME WEATHERIZATION & TRIBAL 5,523 5,627
43 CONSERVATION ACQUISITION 71,785 71,785
44 DR & SMART GRID 856 854
45 Sub-Total 126,267 126,187
46 Power System Generation Sub-Total 1,310,603 1,379,210
Rate Period
BP-18-FS-BPA-02A Page 15

Table 3A
Power Services Program Spending Levels
($000s)
A B
2018 2019Rate Period
47
48 Power Non-Generation Operations
49 Power Services System Operations
50 INFORMATION TECHNOLOGY 6,976 7,294
51 GENERATION PROJECT COORDINATION 6,174 6,409
52 SLICE IMPLEMENTATION 1,024 1,061
53 Sub-Total 14,174 14,764
54 Power Services Scheduling
55 OPERATIONS SCHEDULING 10,054 10,404
56 OPERATIONS PLANNING 8,528 8,416
57 Sub-Total 18,582 18,820
58 Power Services Marketing and Business Support
59 POWER R&D 4,705 4,600
60 SALES & SUPPORT 22,885 23,485
61 STRATEGY, FINANCE & RISK MGMT 16,852 19,037
62 EXECUTIVE AND ADMINISTRATIVE SERVICES 4,120 4,205
63 CONSERVATION SUPPORT 9,094 9,409
64 Sub-Total 57,655 60,735
65 Power Non-Generation Operations Sub-Total 90,411 94,319
66
67 Power Services Transmission Acquisition and Ancillary Services
68 PBL Transmission Acquisition and Ancillary Services
69 POWER SERVICES TRANSMISSION & ANCILLARY SERVICES 108,555 104,198
70 3RD PARTY GTA WHEELING 91,759 92,516
71 POWER SERVICES - 3RD PARTY TRANS & ANCILLARY SVCS 2,251 2,292
72 GENERATION INTEGRATION / TS WIT 12,480 12,634
73 Power Srvcs Trans Acquisition and Ancillary Services Sub-Total 215,044 211,640
74
75 Fish and Wildlife/USF&W/Planning Council/Environmental Req
76 BPA Fish and Wildlife
77 Fish & Wildlife 276,713 276,704
78 USF&W Lower Snake Hatcheries 33,483 33,483
79 Planning Council 11,624 11,914
80 Fish and Wildlife/USF&W/Planning Council Sub-Total 321,821 322,101
81
82 BPA Internal Support
83 Additional Post-Retirement Contribution 14,962 15,620
84 Agency Services G&A (excludes direct project support) 64,391 65,796
85 BPA Internal Support Sub-Total 79,353 81,417
86
BP-18-FS-BPA-02A Page 16

Table 3A
Power Services Program Spending Levels
($000s)
A B
2018 2019Rate Period
87 Bad Debt Expense 0 0
88 Other Income, Expenses, Adjustments (10,000) (10,000)
89
90
91 Disaggregation of Selected Expenses From Revenue Requirement to RAM Cost Table
92 RENEWABLES (line 34) 38,332 39,060
93 Tier 1 Augmentation Resource (i.e. Klondike III) 10,048 10,158
94 Renewable Generation (excl. Klondike III) 28,284 28,902
95
96 POWER R&D (line 59) 4,705 4,600
97 Generation Conservation R&D 2,923 2,858
98 Other Power R&D 1,782 1,742
99
100 POWER SERVICES TRANSMISSION & ANCILLARY SERVICES (line 69) 108,555 104,198
101 Transmission & Ancillary Services 75 71
102 Transmission & Ancillary Services (sys. oblig.) 34 33
103
BP-18-FS-BPA-02A Page 17

A B
2018 2019
1 INTEREST EXPENSE (GROSS)
2 APPROPRIATIONS 56,449 63,302
3 BONDS ISSUED TO TREASURY 62,434 73,462
BOND PREMIUMS/DISCOUNTS 0 0
4 TOTAL INTEREST EXPENSE 118,883 136,764
5
6 PLANNED AMORTIZATION
7 APPROPRIATIONS 91,070 17,371
8 BONDS ISSUED TO TREASURY 44,150 156,250
9 TOTAL GENERATION AMORTIZATION 135,220 173,621
10 IRRIGATION ASSISTANCE 27,234 56,573
11 TOTAL AMORTIZATION/IRRIGATION 162,454 230,194
Table 3B
Summary of Generation Repayment Study Data
($000s)
BP-18-FS-BPA-02A Page 18

A B
2018 2019
1 BPA (Power + CORP GP) 18,080 13,609
2 Corps 1/ 2/ 97,725 100,816
3 Reclamation 28,287 29,641
4 Total Depreciation 142,911 142,860
5 Amortization of Legacy Conservation 923 367
6 Amortization of Conservation Acquisitions 40,145 40,145
7 Amortization of CRFM Intangible Investment 10,398 10,398
8 Amortization of Fish & Wildlife 35,330 36,548
9 Total Amortization 88,504 89,166
10 Total Federal Projects Depreciation 231,415 232,027
1/ Excludes depreciation from investments
paid for by BPA-TS 23 23
2/ Includes US Fish & Wildlife 3,228 3,228
Table 3C
Federal Projects Depreciation Summary
($000s)
BP-18-FS-BPA-02A Page 19

A B
2018 2019
1 Strategy, Finance, & Risk Mgmt 16,852 19,037
2 Residential Exchange Program Support portion 1,006 732
3 Net to Power Non-Generating Operations (ln 1 - ln 2) 15,846 18,305
4 Executive & Administrative Svc 4,120 4,205
5 Residential Exchange Program Support portion 2 2
6 Net to Power Non-Generating Operations (ln 4 - ln 5) 4,119 4,204
7 Residential Exchange Program Support (ln 2 + ln 5) 1,008 733
8 Strategy, Finance, & Risk Mgmt (to Pwr NonGen Ops) (ln 3) 15,846 18,305
9 Executive & Administrative Svc (to Pwr NonGen Ops) (ln 6) 4,119 4,204
Table 3D
Separation of Residential Exchange Program Support Costs
from Power Non-Generating Operations
($000s)
BP-18-FS-BPA-02A Page 20
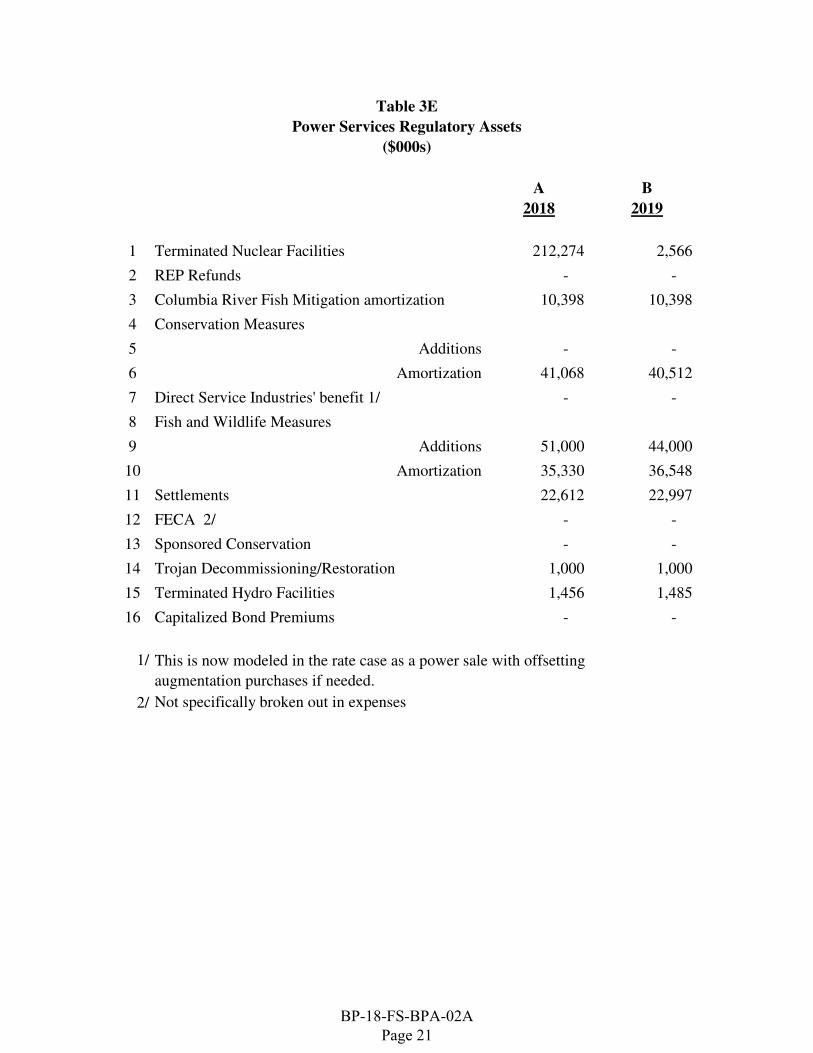
A B
2018 2019
1 Terminated Nuclear Facilities 212,274 2,566
2 REP Refunds - -
3 Columbia River Fish Mitigation amortization 10,398 10,398
4 Conservation Measures
5 Additions - -
6 Amortization 41,068 40,512
7 Direct Service Industries' benefit 1/ - -
8 Fish and Wildlife Measures
9 Additions 51,000 44,000
10 Amortization 35,330 36,548
11 Settlements 22,612 22,997
12 FECA 2/ - -
13 Sponsored Conservation - -
14 Trojan Decommissioning/Restoration 1,000 1,000
15 Terminated Hydro Facilities 1,456 1,485
16 Capitalized Bond Premiums - -
1/
2/ Not specifically broken out in expenses
This is now modeled in the rate case as a power sale with offsetting
augmentation purchases if needed.
Table 3E
Power Services Regulatory Assets
($000s)
BP-18-FS-BPA-02A Page 21
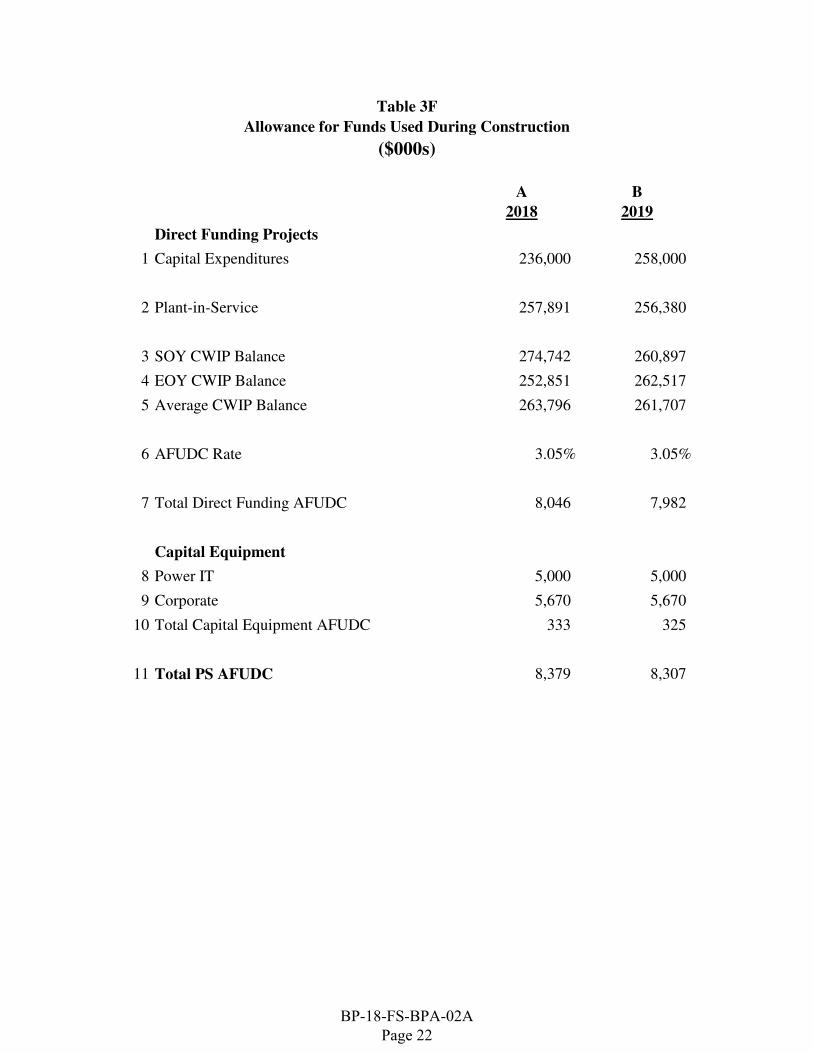
A B
2018 2019
Direct Funding Projects
1 Capital Expenditures 236,000 258,000
2 Plant-in-Service 257,891 256,380
3 SOY CWIP Balance 274,742 260,897
4 EOY CWIP Balance 252,851 262,517
5 Average CWIP Balance 263,796 261,707
6 AFUDC Rate 3.05% 3.05%
7 Total Direct Funding AFUDC 8,046 7,982
Capital Equipment
8 Power IT 5,000 5,000
9 Corporate 5,670 5,670
10 Total Capital Equipment AFUDC 333 325
11 Total PS AFUDC 8,379 8,307
Allowance for Funds Used During Construction
Table 3F
($000s)
BP-18-FS-BPA-02A Page 22
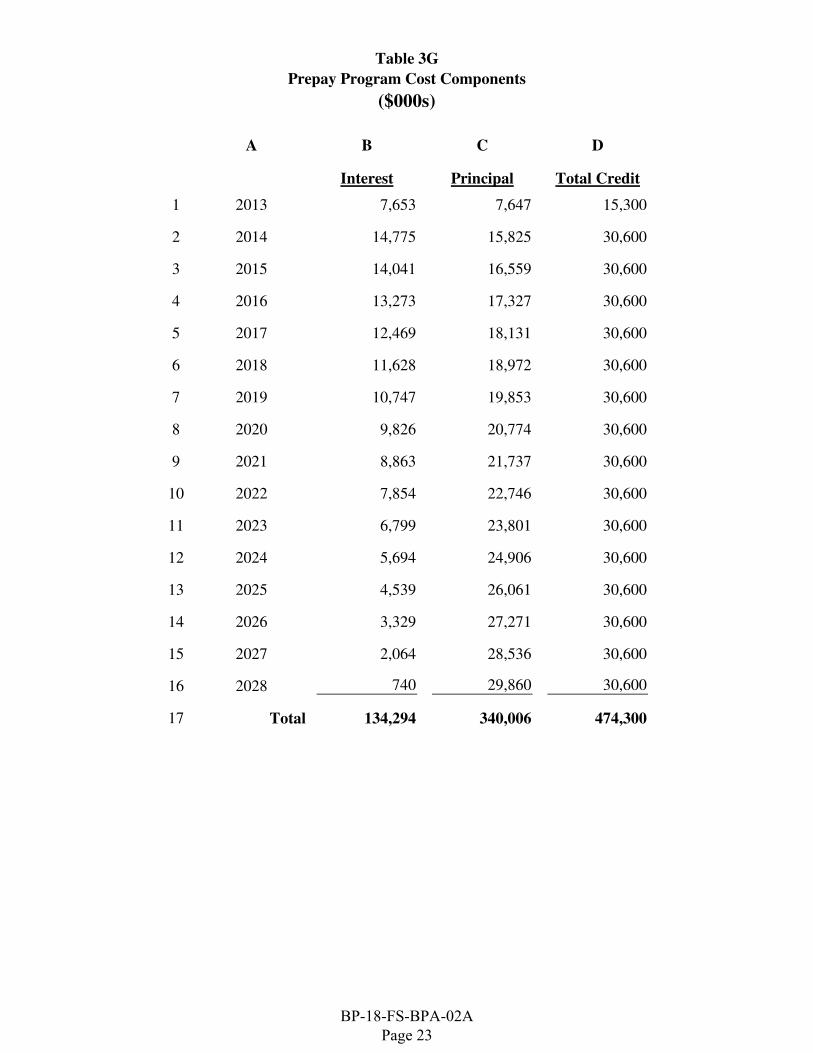
A B C D
Interest Principal Total Credit
1 2013 7,653 7,647 15,300
2 2014 14,775 15,825 30,600
3 2015 14,041 16,559 30,600
4 2016 13,273 17,327 30,600
5 2017 12,469 18,131 30,600
6 2018 11,628 18,972 30,600
7 2019 10,747 19,853 30,600
8 2020 9,826 20,774 30,600
9 2021 8,863 21,737 30,600
10 2022 7,854 22,746 30,600
11 2023 6,799 23,801 30,600
12 2024 5,694 24,906 30,600
13 2025 4,539 26,061 30,600
14 2026 3,329 27,271 30,600
15 2027 2,064 28,536 30,600
16 2028 740 29,860 30,600
17 Total 134,294 340,006 474,300
Table 3G
Prepay Program Cost Components
($000s)
BP-18-FS-BPA-02A Page 23
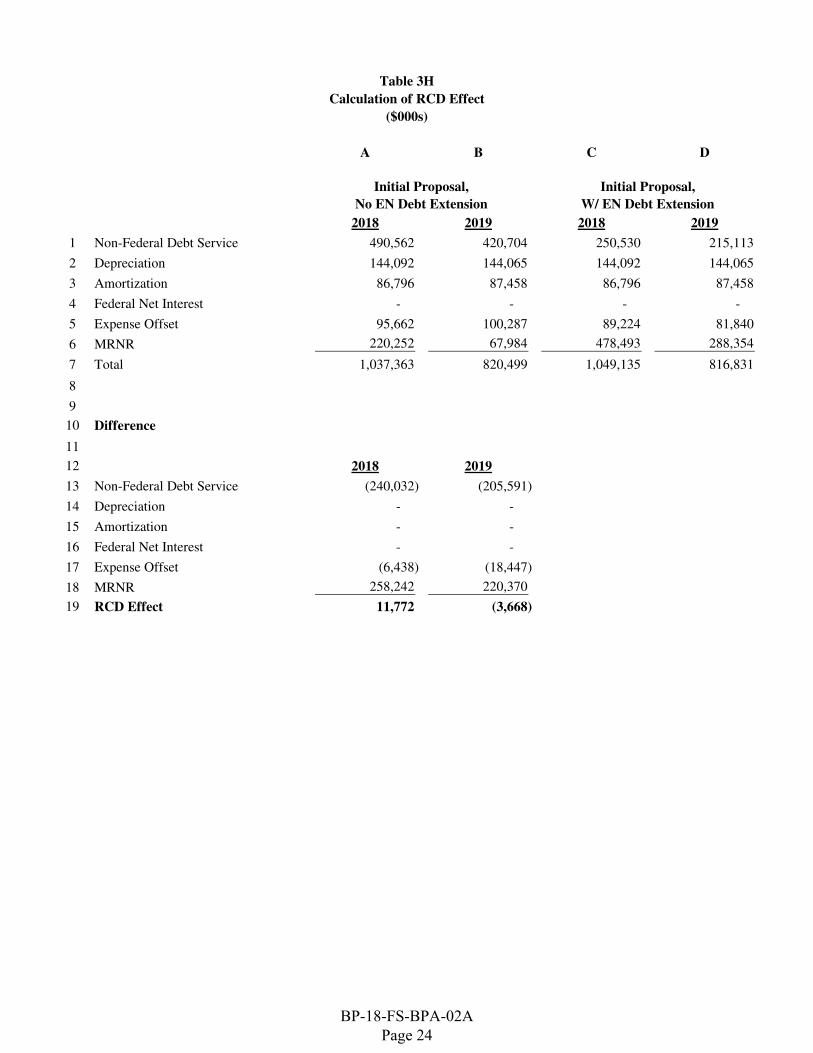
A B C D
2018 2019 2018 2019
1 Non-Federal Debt Service 490,562 420,704 250,530 215,113
2 Depreciation 144,092 144,065 144,092 144,065
3 Amortization 86,796 87,458 86,796 87,458
4 Federal Net Interest - - - -
5 Expense Offset 95,662 100,287 89,224 81,840
6 MRNR 220,252 67,984 478,493 288,354
7 Total 1,037,363 820,499 1,049,135 816,831
8
9
10 Difference
11
12 2018 2019
13 Non-Federal Debt Service (240,032) (205,591)
14 Depreciation - -
15 Amortization - -
16 Federal Net Interest - -
17 Expense Offset (6,438) (18,447)
18 MRNR 258,242 220,370
19 RCD Effect 11,772 (3,668)
Table 3H
Calculation of RCD Effect
($000s)
Initial Proposal,
W/ EN Debt Extension
Initial Proposal,
No EN Debt Extension
BP-18-FS-BPA-02A Page 24

A B
2018 2019
Input from Repayment Study
1 Non-Federal Principal 518,684 132,037
2 Non-Federal Interest 230,598 224,165
3 Federal Principal 369,937 423,028
4 Bond Premiums 11,719 10,680
5 Bond Discounts
6 Federal Interest 120,975 115,718
7 Irrigation Assistance 27,234 56,573
8 Total Repayment Debt Service 1,279,147 962,200
9
10 Calculation of Revenue Requirement
11 Expense - -
12 Non-Federal Debt Service (Ln 1 + Ln 2) 250,530 215,113
13 Depreciation 144,092 144,065
14 Amortization 86,796 87,458
15 Expense Offset - -
16 Federal Net Interest 1/ 89,224 81,840
17 MRNR 2/ 478,493 288,354
18 Total Revenue Requirement 1,049,135 816,831
19
20
21
22
23 1/ Net Interest Calculation
24 Gross Federal Interest 132,694 126,398
25 Prepay Interest 11,628 10,747
26 AFUDC (8,379) (8,307)
27 Capitalization Adjustment (45,937) (45,937)
28 Interest Credit (781) (1,061)
29 Net interest 89,224 81,840
30
Calculating the EN Debt Extension Revenue Requirement
($000s)
Table 3I
BP-18-FS-BPA-02A Page 25

A B
2018 2019
Calculating the EN Debt Extension Revenue Requirement
($000s)
Table 3I
31 Calculation of Interest Credit
32 Beginning cash reserves 170,000 180,300
33 ending cash reserves 180,300 139,800
34 Average cash reserves 175,150 160,050
35 Income Rates (melded) 0.45% 0.66%
36 Interest credit on reserves 781 1,061
37 Prepay Program Interest Earnings - -
38 Total interest credit 781 1,061
39
40
41 2/ Calculation of MRNR
42 Depreciation 144,092 144,065
43 Amortization 86,796 87,458
44 Non-Cash Expenses (EN) 141,088 168,575
45 Cash Freed up by DSR Refinancing 113,888 1,550
46 Capitalization Adjustment (45,937) (45,937)
47 Prepay Interest 11,628 10,747
48 Prepay Credits (30,600) (30,600)
49 Non-Cash Revenues (3,524) (3,524)
50 Federal Principal Payments (369,937) (423,028)
51 Repayment of EN Line of Credit (498,752) (141,088)
52 Irrigation Assistance Payments (27,234) (56,573)
53 MRNR 478,493 288,354
BP-18-FS-BPA-02A Page 26

A B C D E F G
POWER TRAN POWER TRAN
1G&A EXEC/PLANNING/
GOVERNANCE50% 50% 50% 50%
Standard rate with no consistent, measurable method of assigning support
costs. Functions are general in nature. This rate does not get adjusted year-to-
year. Appropriateness of costs charged to this pool were reviewed.
Corporate awards were moved from this cost pool to a separate awards pool
and Asset Management was moved from Strategy to Finance.
2G&A APPLICATION
SYSTEM SUPPORT35% 65% 35% 65%
Applications in this cost pool follow the profile of benefiting Power and
Transmission at a rate of 35%-65%.
Applications should fit the profile of 35%-65% to be in this IT application
cost pool.
3 G&A SECURITY SERVICES 12% 88% 12% 88%Rate established by a direction of effort study (time spent by security staff for
Power and Transmission).
This cost pool includes security for the Transmission system and BPA
administrative buildings. Headquarters is a very small part of the overall
program.
4 G&A LEGAL SERVICES 50% 50% 50% 50%Standard rate that does not get adjusted year-to-year. Cost charged to the
pool are reviewed to determine that they are appropriate.
Higher percents were budgeted as Corporate Business Unit rather than direct
charged to the business lines in the fiscal year 2016 budget.
5G&A HUMAN RESOURCE
SERVICES23% 77% 24% 76% BFTE count by business unit.
Organizationally the library was moved from HR to Communications in 2016
but the library remains in the HR cost pool as the benefits are more consistent
with the HR cost pool. Administrator's Award Program moved to Public
Affairs cost pool. Medical surveillance moved to Safety cost pool.
6G&A ACCOUNTING &
FINANCE45% 55% 45% 55%
Most costs in this pool are 50-50%. Exceptions are budget, payroll and
Accounts Payable. Rate impact for these costs are based on budget support
for Power and Transmission, BFTE for payroll, and number of vouchers for
AP.
Asset Management moved from Strategic Affairs to Finance.
7 G&A SAFETY 6% 94% 18% 82%Direction of effort study looking at business line program support provided
by the Safety organization.
Safety is a key agency target and budgets were increased accordingly. Safety
had a major reorganization in FY16. Medical surveillance was moved from
HR to Safety.
8 STRATEGIC INTEGRATION 50% 50% 50% 50%Standard agency rate that does not get adjusted year-to-year. Confirmed that
the rate is still appropriate. As initiatives mature, they are moved as direct
charge into the business lines.
Certain functions for this program are ramping down. The EIM/SCED
initiative is being transformed into the Commercial Operations KSI and may
be moved to the business lines.
9 RISK MANAGEMENT 62% 38% 60% 40%Direction of effort study looking at risk support for Power and Transmission
Services.Allocation percentages by department are provided by the Risk Office.
10 G&A IT ADMINISTRATION 29% 71% 31% 69% Rate based on weighted average for the other IT cost pools.More quality assurance, administration and training moved into the IT
Administration pool starting in fiscal year 2015.
11/12 DEDICATED IT PROJECTS 100% 100% 100% 100%Dedicated applications for Power and Transmission Services. Rate does not
get adjusted year-to-year.
This actually consists of two separate pools, one for Power and one for
Transmission.
13 G&A IT INFRASTRUCTURE 22% 78% 25% 75%FTE count by business line. For comparative purposes also looked at number
of IT devices and phone services by business line which would have produced
similar results.
IT provides a detailed list of devices by Department and Employee. These are
assigned to high level agency functions in support of Power, F&W and
Transmission.
14G&A CROSS AGENCY IT
PROJECTS50% 50% 50% 50%
Standard agency rate that does not get adjusted year-to-year. Projects in this
cost pool benefit Power and Transmission Services equally.Very few projects are charged to this 50-50% pool.
15G&A WORKPLACE
SERVICES46% 54% 47% 53%
B/CFTE count by business unit for employees in leased space. Also use a
combination of B/CFTE by location for other services, as applicable to the
nature of the cost.
Almost 40% of the costs in this pool are for leases at HQ, Washington DC
(DOE Forrestal) , and field administrative offices. Munro maintenance,
janitorial, utilities and furniture are charged into this Corporate workplace
services cost pool.
16SUPPLY CHAIN
ADMINISTRATION11% 89% 7% 93% Overall rate based on program level support by Supply Chain management. Rate is based on the underlying rates for all other Supply Chain cost pools.
17 G&A PUBLIC AFFAIRS 50% 50% 50% 50%Standard agency rate that does not get adjusted year-to-year. Costs charged
into this cost pool were reviewed for appropriateness.
Organizationally the library was moved from HR to Communications in
2016. Communications picked up the Administrator's Award program from
HR.
18SUPPLY CHAIN
PURCHASING SERVICES64% 36% 66% 34%
Weighted average of actual costs charged to environment, EE, Power, IT and
Corporate work orders within the Agency Purchasing cost pool.
The rate is determined by Work Order costs in this cost pool charged
specifically to IT, Eniv, F&W, Power, etc.
19TECHNOLOGY
INNOVATION50% 50% 50% 50% Standard agency rate that does not get adjusted year-to-year. As projects mature, they are passed to either Power or Transmission.
21/22G&A WORKPLACE DIRECT
PROJECTS100% 100% 100% 100% Dedicated workplace services for Power and Transmission
There are two cost pools for Workplace Direct Projects--one exclusively for
Power and the other one for Transmission.
23BILLING & METERING
SERVICES48% 52% 47% 53%
Direction of effort study with information provided by the responsible
Department managers.
Study looks at drivers such as the number of bills, complexity of bills, and
metering services.
24CONTRACTING &
FORECASTING SRVC47% 53% 54% 46%
Direction of effort study with information provided by the responsible
Department managers.
Increase to Trans due to more workload for CCM/CDM associated with # of
contracts, active tasks, contract templates, workflow and internal users of
CCM and CDM.
AWARDS 40% 60% 0% 0%Based on overall Corporate G&A personnel costs for Power and
Transmission
This is a new cost pool. Costs were moved from the G&A
Exec/Planning/Governance cost pool.
Table 3J
Agency Services G&A Allocators
BP-18 Rates/IPR BP-16 Rates
DRIVERS COMMENTSCOST POOL
BP-18-FS-BPA-02A Page 27
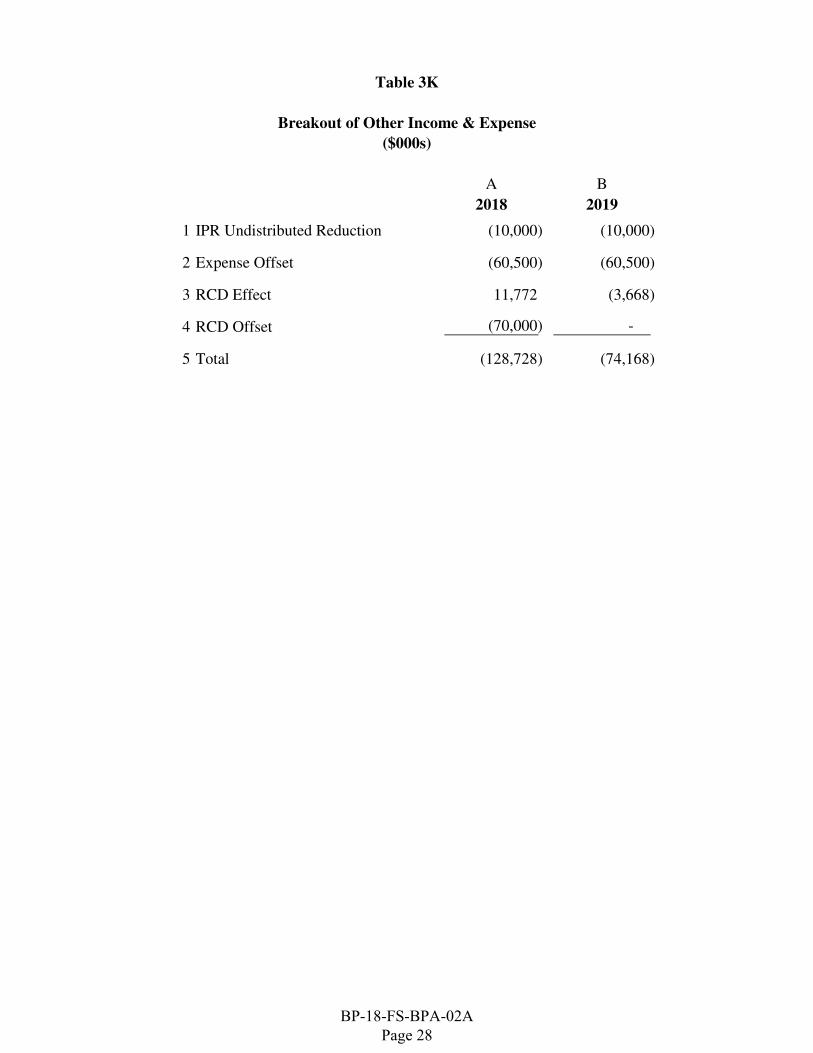
A B
2018 2019
1 IPR Undistributed Reduction (10,000) (10,000)
2 Expense Offset (60,500) (60,500)
3 RCD Effect 11,772 (3,668)
4 RCD Offset (70,000) -
5 Total (128,728) (74,168)
Table 3K
Breakout of Other Income & Expense
($000s)
BP-18-FS-BPA-02A Page 28
4. FCRPS GENERATION INVESTMENT BASE
4.1 Introduction
This chapter documents the development of the FCRPS generation investment base by year for the rate approval period and the outyears. The investment data are the source of depreciation calculations and provide certain inputs to the generation repayment studies. It is also the basis for allocations of net interest expense and planned net revenues in the development of the COSA tables and the generation inputs to ancillary services. 4.2 Methodology
The FCRPS plant investment information is separately compiled for the Corps, Reclamation, and BPA, including BPA conservation and fish and wildlife investments. BPA generation (general) plant investment consists of office furniture and fixtures and data processing software and hardware associated with the Power Business Line, including the Energy Efficiency Group. Historical investment data are taken from the supporting documents of FCRPS financial statements. All plant investment is depreciated and intangible plant is amortized using the straight-line method. For BPA facilities, forecasted depreciation expense is calculated consistent with the group concept methodology used for plant accounting records. For general plant categories, average service lives incorporate an adjustment for salvage applicable to the individual groups. Both historical investment and forecast additions are depreciated according to their adjusted group life. BPA conservation acquisitioninvestments made after 2011 are amortized over 12 years. Beginning with 2016, BPA discontinued the capitalization of conservation investmetns and converted it into an expense program. Legacy conservation investments occurred through FY 1999 and have a 20 year life. All other conservation investmetns have been fully amortized and no longer appear in the revenue requirement. BPA fish and wildlife investments are amortized over 15 years. Corps and Reclamation investments are depreciated according to the weighted-average service lives of the projects. Depreciation forecasts factor in plant retirements using the 5-year average of plant retirement by project Projected investments and projected depreciation expenses are accumulated with historical amounts to provide projected cumulative investments and accumulated depreciation for each forecasted year. The investment base is calculated for each year of the rate period and outyears as an annual average.
BP-18-FS-BPA-02A Page 29
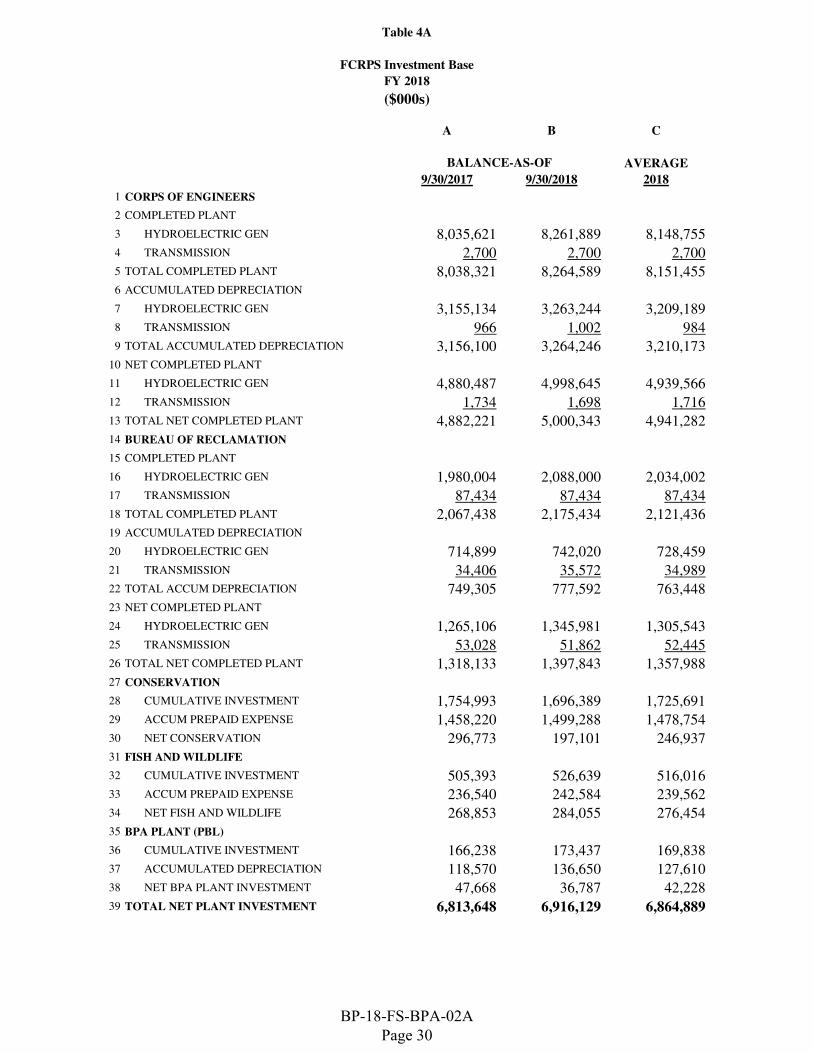
A B C
AVERAGE
9/30/2017 9/30/2018 2018
1 CORPS OF ENGINEERS
2 COMPLETED PLANT
3 HYDROELECTRIC GEN 8,035,621 8,261,889 8,148,7554 TRANSMISSION 2,700 2,700 2,7005 TOTAL COMPLETED PLANT 8,038,321 8,264,589 8,151,4556 ACCUMULATED DEPRECIATION
7 HYDROELECTRIC GEN 3,155,134 3,263,244 3,209,1898 TRANSMISSION 966 1,002 9849 TOTAL ACCUMULATED DEPRECIATION 3,156,100 3,264,246 3,210,173
10 NET COMPLETED PLANT
11 HYDROELECTRIC GEN 4,880,487 4,998,645 4,939,56612 TRANSMISSION 1,734 1,698 1,71613 TOTAL NET COMPLETED PLANT 4,882,221 5,000,343 4,941,28214 BUREAU OF RECLAMATION
15 COMPLETED PLANT
16 HYDROELECTRIC GEN 1,980,004 2,088,000 2,034,00217 TRANSMISSION 87,434 87,434 87,43418 TOTAL COMPLETED PLANT 2,067,438 2,175,434 2,121,43619 ACCUMULATED DEPRECIATION
20 HYDROELECTRIC GEN 714,899 742,020 728,45921 TRANSMISSION 34,406 35,572 34,98922 TOTAL ACCUM DEPRECIATION 749,305 777,592 763,44823 NET COMPLETED PLANT
24 HYDROELECTRIC GEN 1,265,106 1,345,981 1,305,54325 TRANSMISSION 53,028 51,862 52,44526 TOTAL NET COMPLETED PLANT 1,318,133 1,397,843 1,357,98827 CONSERVATION
28 CUMULATIVE INVESTMENT 1,754,993 1,696,389 1,725,69129 ACCUM PREPAID EXPENSE 1,458,220 1,499,288 1,478,75430 NET CONSERVATION 296,773 197,101 246,93731 FISH AND WILDLIFE
32 CUMULATIVE INVESTMENT 505,393 526,639 516,01633 ACCUM PREPAID EXPENSE 236,540 242,584 239,56234 NET FISH AND WILDLIFE 268,853 284,055 276,45435 BPA PLANT (PBL)
36 CUMULATIVE INVESTMENT 166,238 173,437 169,83837 ACCUMULATED DEPRECIATION 118,570 136,650 127,61038 NET BPA PLANT INVESTMENT 47,668 36,787 42,22839 TOTAL NET PLANT INVESTMENT 6,813,648 6,916,129 6,864,889
Table 4A
BALANCE-AS-OF
FCRPS Investment Base
FY 2018
($000s)
BP-18-FS-BPA-02A Page 30
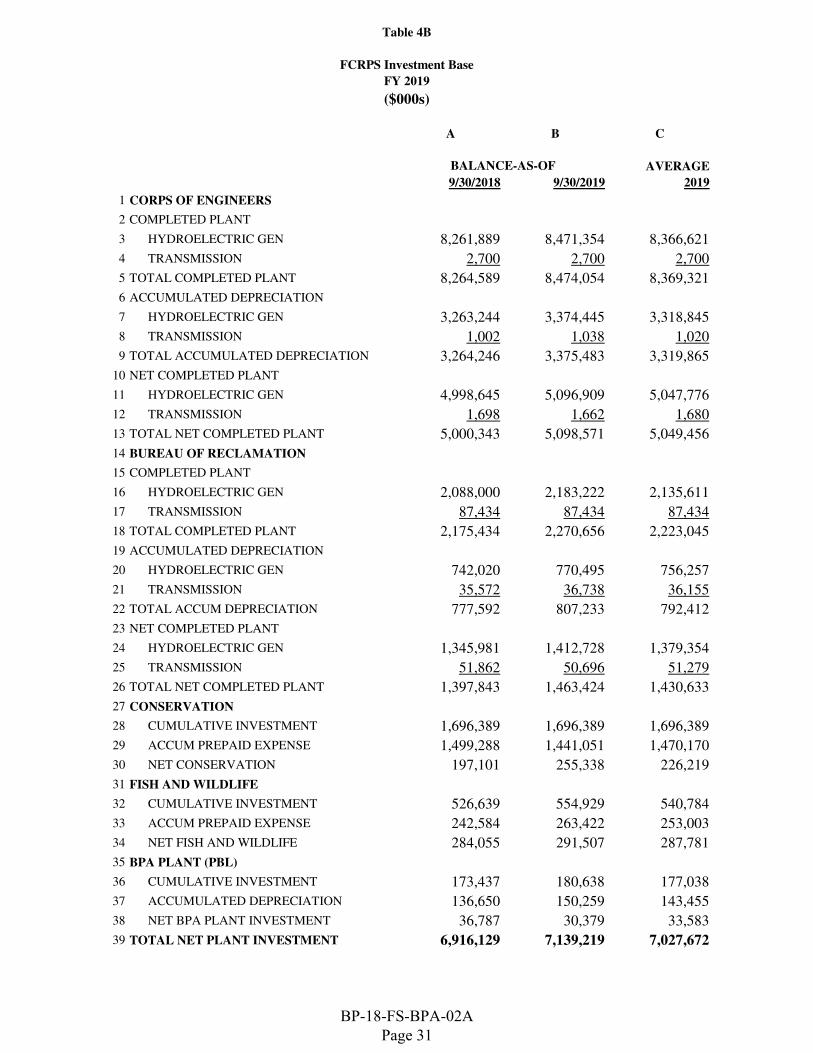
A B C
AVERAGE
9/30/2018 9/30/2019 2019
1 CORPS OF ENGINEERS
2 COMPLETED PLANT
3 HYDROELECTRIC GEN 8,261,889 8,471,354 8,366,621
4 TRANSMISSION 2,700 2,700 2,700
5 TOTAL COMPLETED PLANT 8,264,589 8,474,054 8,369,321
6 ACCUMULATED DEPRECIATION
7 HYDROELECTRIC GEN 3,263,244 3,374,445 3,318,845
8 TRANSMISSION 1,002 1,038 1,020
9 TOTAL ACCUMULATED DEPRECIATION 3,264,246 3,375,483 3,319,865
10 NET COMPLETED PLANT
11 HYDROELECTRIC GEN 4,998,645 5,096,909 5,047,776
12 TRANSMISSION 1,698 1,662 1,680
13 TOTAL NET COMPLETED PLANT 5,000,343 5,098,571 5,049,456
14 BUREAU OF RECLAMATION
15 COMPLETED PLANT
16 HYDROELECTRIC GEN 2,088,000 2,183,222 2,135,611
17 TRANSMISSION 87,434 87,434 87,434
18 TOTAL COMPLETED PLANT 2,175,434 2,270,656 2,223,045
19 ACCUMULATED DEPRECIATION
20 HYDROELECTRIC GEN 742,020 770,495 756,257
21 TRANSMISSION 35,572 36,738 36,155
22 TOTAL ACCUM DEPRECIATION 777,592 807,233 792,412
23 NET COMPLETED PLANT
24 HYDROELECTRIC GEN 1,345,981 1,412,728 1,379,354
25 TRANSMISSION 51,862 50,696 51,279
26 TOTAL NET COMPLETED PLANT 1,397,843 1,463,424 1,430,633
27 CONSERVATION
28 CUMULATIVE INVESTMENT 1,696,389 1,696,389 1,696,389
29 ACCUM PREPAID EXPENSE 1,499,288 1,441,051 1,470,170
30 NET CONSERVATION 197,101 255,338 226,219
31 FISH AND WILDLIFE
32 CUMULATIVE INVESTMENT 526,639 554,929 540,784
33 ACCUM PREPAID EXPENSE 242,584 263,422 253,003
34 NET FISH AND WILDLIFE 284,055 291,507 287,781
35 BPA PLANT (PBL)
36 CUMULATIVE INVESTMENT 173,437 180,638 177,038
37 ACCUMULATED DEPRECIATION 136,650 150,259 143,455
38 NET BPA PLANT INVESTMENT 36,787 30,379 33,583
39 TOTAL NET PLANT INVESTMENT 6,916,129 7,139,219 7,027,672
Table 4B
BALANCE-AS-OF
FCRPS Investment Base
FY 2019
($000s)
BP-18-FS-BPA-02A Page 31
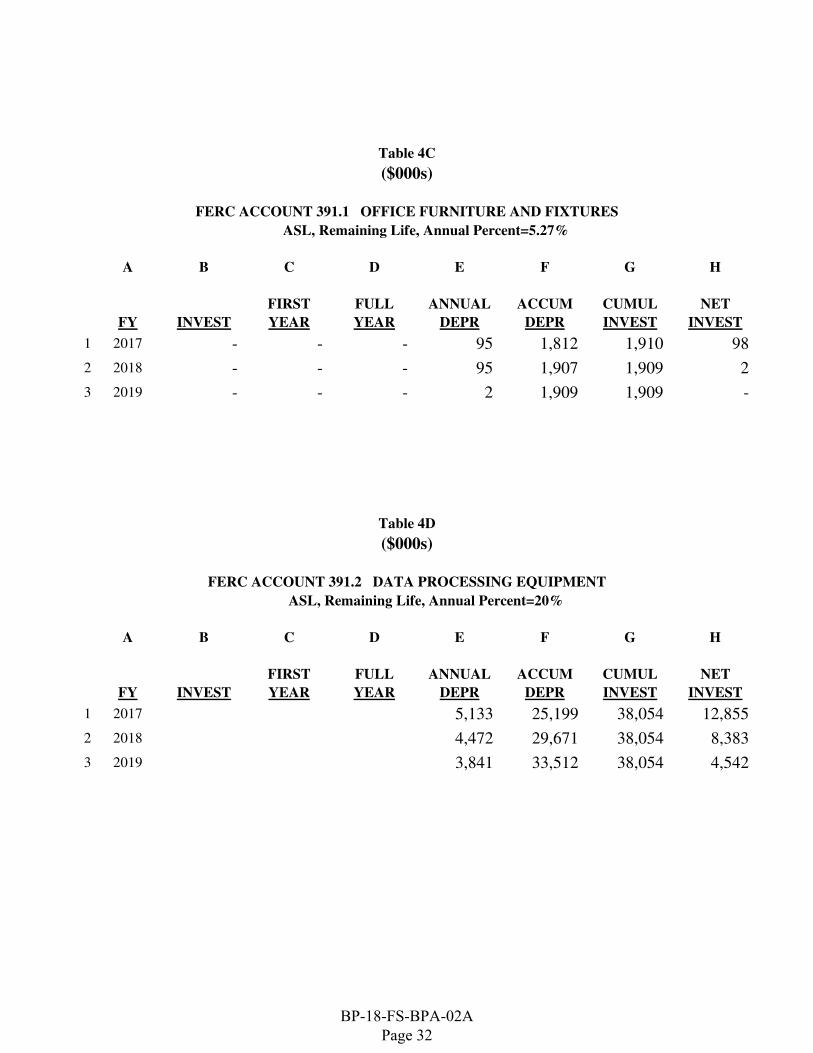
ASL, Remaining Life, Annual Percent=5.27%
A B C D E F G H
FIRST FULL ANNUAL ACCUM CUMUL NET
FY INVEST YEAR YEAR DEPR DEPR INVEST INVEST
1 2017 - - - 95 1,812 1,910 98
2 2018 - - - 95 1,907 1,909 2
3 2019 - - - 2 1,909 1,909 -
ASL, Remaining Life, Annual Percent=20%
A B C D E F G H
FIRST FULL ANNUAL ACCUM CUMUL NET
FY INVEST YEAR YEAR DEPR DEPR INVEST INVEST
1 2017 5,133 25,199 38,054 12,855
2 2018 4,472 29,671 38,054 8,383
3 2019 3,841 33,512 38,054 4,542
Table 4C
FERC ACCOUNT 391.1 OFFICE FURNITURE AND FIXTURES
Table 4D
FERC ACCOUNT 391.2 DATA PROCESSING EQUIPMENT
($000s)
($000s)
BP-18-FS-BPA-02A Page 32

A B C D E F G H I J
FIRST FULL ANNUAL ACCUM CUMUL NET CORP PS
FY INVEST YEAR YEAR DEPR DEPR INVEST INVEST ADDITNS ADDITNS
1 2017 10,611 1,061 2,122 15,746 86,602 114,207 27,605 5,611 5,000
2 2018 7,200 720 1,440 12,704 99,306 121,408 22,101 5,900 1,300
3 2019 7,201 720 1,440 8,957 108,263 128,608 20,345 5,901 1,300
A B C D E F G H
FIRST FULL ANNUAL ACCUM CUMUL NET
FY INVEST YEAR YEAR DEPR DEPR INVEST INVEST
1 2017 0 - 0 582 4,616 8,685 4,069
2 2018 0 - 0 582 5,198 8,685 3,487
3 2019 0 - 0 582 5,780 8,685 2,905
A B C D E
ANNUAL ACCUM CUMUL NET
FY DEPR DEPR INVEST INVEST
1 2017 21,783 118,570 166,238 47,668
2 2018 18,080 136,650 173,437 36,787
3 2019 13,609 150,259 180,638 30,379
Table 4E
($000s)
FERC ACCOUNT 391.3 DATA PROCESSING SOFTWARE
ASL, Remaining Life, Annual Percent=20% 18.33% as of FY 2006
Table 4F
SUMMARY - PBL GENERAL PLANT
Table 4G
($000s)
($000s)
FERC ACCOUNT 397/398 COMMUNICATION/MISC EQUIPMENT
ASL, Remaining Life, Annual Percent=6.70%
BP-18-FS-BPA-02A Page 33
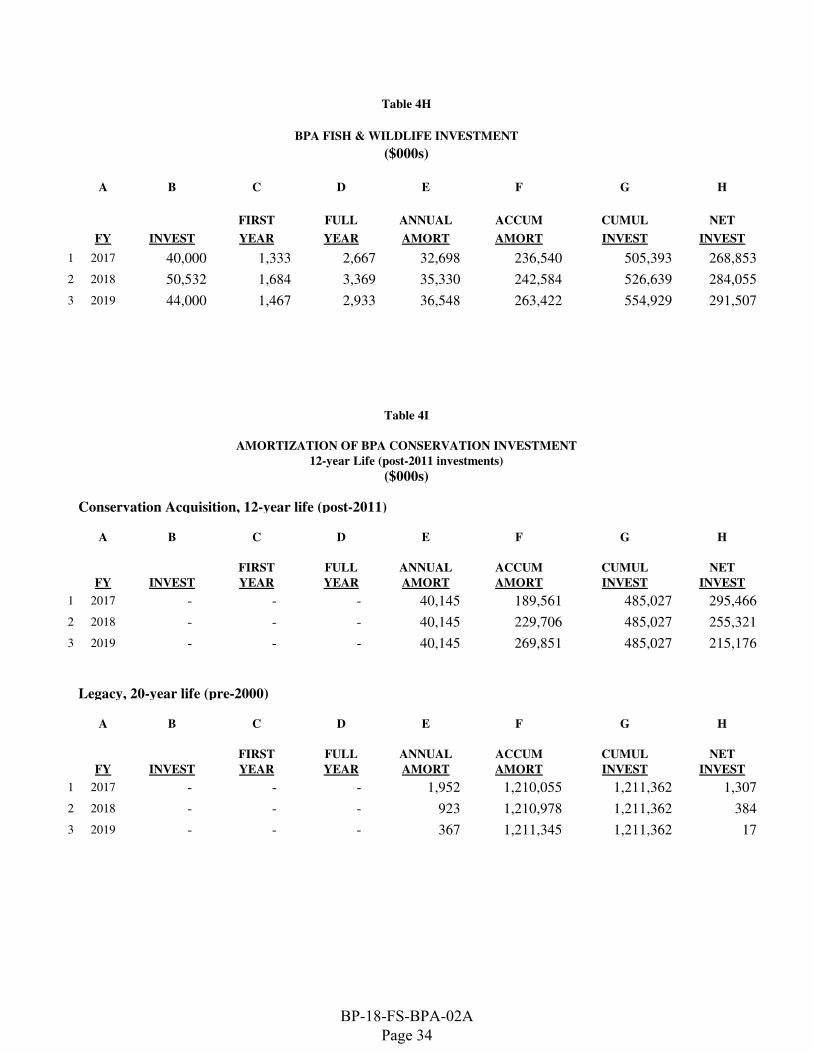
A B C D E F G H
FIRST FULL ANNUAL ACCUM CUMUL NET
FY INVEST YEAR YEAR AMORT AMORT INVEST INVEST
1 2017 40,000 1,333 2,667 32,698 236,540 505,393 268,853
2 2018 50,532 1,684 3,369 35,330 242,584 526,639 284,055
3 2019 44,000 1,467 2,933 36,548 263,422 554,929 291,507
Conservation Acquisition, 12-year life (post-2011)
A B C D E F G H
FIRST FULL ANNUAL ACCUM CUMUL NET
FY INVEST YEAR YEAR AMORT AMORT INVEST INVEST
1 2017 - - - 40,145 189,561 485,027 295,466
2 2018 - - - 40,145 229,706 485,027 255,321
3 2019 - - - 40,145 269,851 485,027 215,176
Legacy, 20-year life (pre-2000)
A B C D E F G H
FIRST FULL ANNUAL ACCUM CUMUL NET
FY INVEST YEAR YEAR AMORT AMORT INVEST INVEST
1 2017 - - - 1,952 1,210,055 1,211,362 1,307
2 2018 - - - 923 1,210,978 1,211,362 384
3 2019 - - - 367 1,211,345 1,211,362 17
($000s)
Table 4H
BPA FISH & WILDLIFE INVESTMENT
($000s)
Table 4I
AMORTIZATION OF BPA CONSERVATION INVESTMENT
12-year Life (post-2011 investments)
BP-18-FS-BPA-02A Page 34

Table 4J
Bureau of Reclamation:
Investment and Depreciation
($000s)
1
2
3
4
5
6
7
8
9
10
11
12
13
14
15
16
17
18
19
20
21
22
23
24
25
26
27
28
A B C D E F G H I J K
5-Year 2018 2018 2018 2019 2019 2019
Average INVESTMENT DEPR ACCUM INVESTMENT DEPR ACCUM INVESTMENT
Retirements 9/30/17 ADDTNS EXP DEPR 9/30/18 ADDTNS EXP DEPR 9/30/19
BOISE
GENERATION 1 35,104 14,568 565 13,025 49,671 16,562 773 13,798 66,232
COLUMBIA BASIN
GENERATION 50 1,595,667 72,239 21,757 604,627 1,667,856 71,332 22,713 627,340 1,739,138
TRANSMISSION /DELIVERY 84,549 1,127 33,314 84,549 1,127 34,442 84,549
TOTAL 1,680,216 72,239 22,884 637,942 1,752,405 71,332 23,840 661,782 1,823,687
GREEN SPRINGS
GENERATION - 11,495 1,103 161 9,054 12,598 754 173 9,227 13,352
HUNGRY HORSE
GENERATION 4 151,150 13,433 2,105 65,962 164,579 6,377 2,237 68,199 170,952
TRANSMISSION /DELIVERY 1,745 23 1,838 1,745 23 1,861 1,745
TOTAL 152,895 13,433 2,128 67,801 166,324 6,377 2,260 70,061 172,697
MINIDOKA-PALISADES
GENERATION 29 164,172 6,737 2,234 43,929 170,880 281 2,280 46,209 171,132
TRANSMISSION /DELIVERY 1,140 15 420 1,140 15 435 1,140
TOTAL 165,312 6,737 2,249 44,349 172,020 281 2,295 46,644 172,272
YAKIMA
GENERATION - 22,417 - 299 5,422 22,417 - 299 5,721 22,417
TOTAL USBR 2,067,438 108,080 28,287 777,592 2,175,434 29,641 807,233 2,270,656
GENERATION 1,980,004 27,121 742,020 2,088,000 28,475 770,495 2,183,222
TRANSMISSION 87,434 1,166 35,572 87,434 1,166 36,738 87,434
TOTAL 2,067,438 28,287 777,592 2,175,434 29,641 807,233 2,270,656
BP-18-FS-BPA-02A Page 35
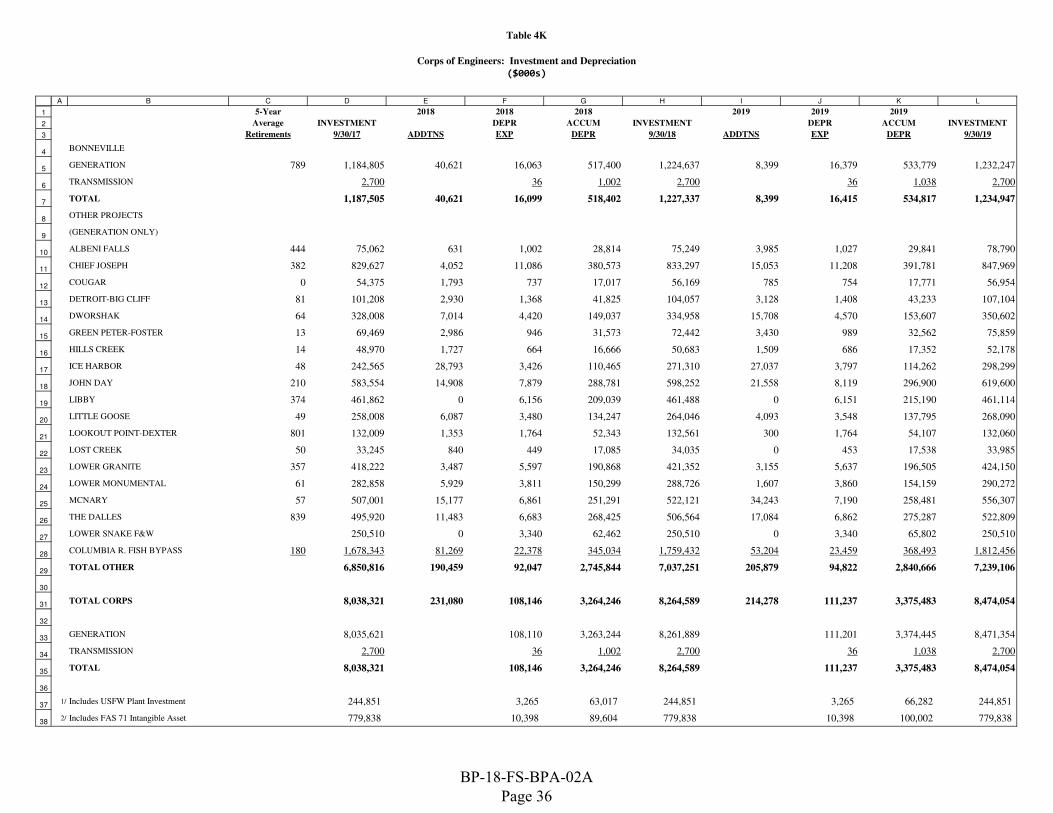
Table 4K
Corps of Engineers: Investment and Depreciation
($000s)
1
2
3
4
5
6
7
8
9
10
11
12
13
14
15
16
17
18
19
20
21
22
23
24
25
26
27
28
29
30
31
32
33
34
35
36
37
38
A B C D E F G H I J K L
5-Year 2018 2018 2018 2019 2019 2019
Average INVESTMENT DEPR ACCUM INVESTMENT DEPR ACCUM INVESTMENT
Retirements 9/30/17 ADDTNS EXP DEPR 9/30/18 ADDTNS EXP DEPR 9/30/19
BONNEVILLE
GENERATION 789 1,184,805 40,621 16,063 517,400 1,224,637 8,399 16,379 533,779 1,232,247
TRANSMISSION 2,700 36 1,002 2,700 36 1,038 2,700
TOTAL 1,187,505 40,621 16,099 518,402 1,227,337 8,399 16,415 534,817 1,234,947
OTHER PROJECTS
(GENERATION ONLY)
ALBENI FALLS 444 75,062 631 1,002 28,814 75,249 3,985 1,027 29,841 78,790
CHIEF JOSEPH 382 829,627 4,052 11,086 380,573 833,297 15,053 11,208 391,781 847,969
COUGAR 0 54,375 1,793 737 17,017 56,169 785 754 17,771 56,954
DETROIT-BIG CLIFF 81 101,208 2,930 1,368 41,825 104,057 3,128 1,408 43,233 107,104
DWORSHAK 64 328,008 7,014 4,420 149,037 334,958 15,708 4,570 153,607 350,602
GREEN PETER-FOSTER 13 69,469 2,986 946 31,573 72,442 3,430 989 32,562 75,859
HILLS CREEK 14 48,970 1,727 664 16,666 50,683 1,509 686 17,352 52,178
ICE HARBOR 48 242,565 28,793 3,426 110,465 271,310 27,037 3,797 114,262 298,299
JOHN DAY 210 583,554 14,908 7,879 288,781 598,252 21,558 8,119 296,900 619,600
LIBBY 374 461,862 0 6,156 209,039 461,488 0 6,151 215,190 461,114
LITTLE GOOSE 49 258,008 6,087 3,480 134,247 264,046 4,093 3,548 137,795 268,090
LOOKOUT POINT-DEXTER 801 132,009 1,353 1,764 52,343 132,561 300 1,764 54,107 132,060
LOST CREEK 50 33,245 840 449 17,085 34,035 0 453 17,538 33,985
LOWER GRANITE 357 418,222 3,487 5,597 190,868 421,352 3,155 5,637 196,505 424,150
LOWER MONUMENTAL 61 282,858 5,929 3,811 150,299 288,726 1,607 3,860 154,159 290,272
MCNARY 57 507,001 15,177 6,861 251,291 522,121 34,243 7,190 258,481 556,307
THE DALLES 839 495,920 11,483 6,683 268,425 506,564 17,084 6,862 275,287 522,809
LOWER SNAKE F&W 250,510 0 3,340 62,462 250,510 0 3,340 65,802 250,510
COLUMBIA R. FISH BYPASS 180 1,678,343 81,269 22,378 345,034 1,759,432 53,204 23,459 368,493 1,812,456
TOTAL OTHER 6,850,816 190,459 92,047 2,745,844 7,037,251 205,879 94,822 2,840,666 7,239,106
TOTAL CORPS 8,038,321 231,080 108,146 3,264,246 8,264,589 214,278 111,237 3,375,483 8,474,054
GENERATION 8,035,621 108,110 3,263,244 8,261,889 111,201 3,374,445 8,471,354
TRANSMISSION 2,700 36 1,002 2,700 36 1,038 2,700
TOTAL 8,038,321 108,146 3,264,246 8,264,589 111,237 3,375,483 8,474,054
1/ Includes USFW Plant Investment 244,851 3,265 63,017 244,851 3,265 66,282 244,851
2/ Includes FAS 71 Intangible Asset 779,838 10,398 89,604 779,838 10,398 100,002 779,838
BP-18-FS-BPA-02A Page 36
5. PROJECTED CASH BALANCES / INTEREST CREDITS
5.1 Introduction This chapter documents the projection of the generation interest income (credited to interest expense) to be earned during the rate approval period and the outyears on BPA's projected cash balances and on funds attributable to generation to be returned to Treasury at year-end. 5.2 Interest credits on projected reserves for risk
The internal cash flows from revenue requirements are added to the ending rate period reserves for risk balances separately for the program and averaged. The projected interest earnings rateis multiplied by the average reserves balance to determine the annual interest income on the BPA Fund/Investments. The resulting interest income is applied as a credit against interest expense in the generation revenue requirements. 5.3 Interest credits on reserves not for risk
Reserves not for risk are those funds dedicated to specific purposes. Generally these funds were not raised through power rates. The interest income on these reserves is calculated in the same way as that for reserves for risk. 5.4 Interest income (repayment program calculation)
The interest income rates listed in this chapter are calculated and used in repayment studies to determine an interest income credit on funds collected during each year for year-end payment of amortization and interest on Corps and Reclamation appropriations and bonds BPA issued to Treasury. The repayment program assumes that cash accumulates at a uniform rate throughout the year, except for interest paid on bonds issued to Treasury at mid-year. In the repayment study output, such as in Table 11C of this document, the interest income is identified as the “float.” 5.5 Allocation of Interest Credit
The interest credit is a component in the calculation of net interest, offsetting interest accrued on outstanding Treasury bonds and appropriations. The credit is allocated between the two cost pools. The Composite cost pool receives an interest credit based on $495.6 million in reserves, the amount of reserves attributed to Power at the end of FY 2001, with adjustments. The amount of reserves has been adjusted for receipts/payments related to pre-2002 transactions that have not been distributed to Slice customers. The Non-Slice cost pool receives a credit that is the net of the total annual credit calculated in the generation revenue requirement less the amount calculated for the Composite cost pool and the interest earned on the prepay funds. The Non-Slice allocation may be negative or positive depending on the relationship between the Composite cost pool allocation and the total annual credit.
BP-18-FS-BPA-02A Page 37

A B
Calculation of Total Interest Income 2018 2019
1 Cash flow generated 20,000 20,000
2
Reserves for Risk
3 SOY Cash Balance 21,000 41,000
4 EOY Cash Balance 41,000 61,000
5 Average Cash Balance 31,000 51,000
6
7 Interest Income Rate 0.45% 0.66%
8 Interest on BPA Fund/Investments 138 338
9
10 Repayment Study Interest Credit 611 1,144
11
12 Reserves not for Risk
13 SOY Cash Balance 149,000 139,300
14 EOY Cash Balance 139,300 78,800
15 Average Cash Balance 144,150 109,050
16 Interest Income 643 723
17
18 Prepay Program Proceeds
19 SOY Cash Balance 0 0
20 EOY Cash Balance 0 0
21 Average Cash Balance 0 0
22 Interest Income 0 0
23
24 Total Interest Credit (ln 8 + 10 + 16 ) 1,392 2,205
25
26
27 Allocation between TRM Cost Pools 2018 2019
28 Reserves Prior to FY 2002 570,255 570,255
29 Adjustments for pre-2002 Sales/Purchases 0 0
30 Other Adjustments 0 0
31 Total Composite Cost Pool Reserves (ln 23 + ln 24 + ln 25) 570,255 570,255
32 Interest rate 0.45% 0.66%
33 Composite Pool interest credit (ln 26 X ln 27) (2,543) (3,781)
34 Total interest credit from Rev Req (1,392) (2,205)
35 Non-Slice Pool interest credit (ln 29 - ln 28) 1,151 1,576
TABLE 5A
Interest Income from Projected Cash Balances
Generation Revenue Requirement
($000s)
BP-18-FS-BPA-02A Page 38

A B
2018 2019
1 Annual Cash Surplus/(Deficit) (100,021) (14,469)2
3 Reserves for Risk
4 SOY Cash Balance 21,000 (18,521)
5 EOY Cash Balance (18,521) (93,490)
6 Average Cash Balance 1,240 (56,005)
7
8 Interest Income Rate 0.45% 0.66%
9 Interest on BPA Fund/Investments 6 (371)
10
11 Repayment Study Interest Income 611 1,144
12
13 Reserves not for Risk
14 SOY Cash Balance 149,000 139,300
15 EOY Cash Balance 139,300 78,800
16 Average Cash Balance 144,150 109,050
17 Interest Income 643 723
18
19 Annual Interest Income 1,260 1,496
Interest Income from Projected Cash Balances
Generation Current Revenue Test
($000s)
Table 5B
BP-18-FS-BPA-02A Page 39

A B
2018 2019
1 Annual Cash Surplus/(Deficit) 9 40,553
2
3 Reserves for Risk
4 SOY Cash Balance 21,000 81,509
5 EOY Cash Balance 81,509 61,561
6 Average Cash Balance 51,254 71,535
7
8 Interest Income Rate 0.45% 0.66%
9 Interest on BPA Fund/Investments 229 474
10
11 Repayment Study Interest Income 611 1,144
12
13 Reserves not for Risk
14 SOY Cash Balance 149,000 139,300
15 EOY Cash Balance 139,300 78,800
16 Average Cash Balance 144,150 109,050
17 Interest Income 643 723
18
19 Annual Interest Income 1,483 2,341
Table 5C
Interest Income from Projected Cash Balances
Generation Revised Revenue Test
($000s)
BP-18-FS-BPA-02A Page 40

6. INTEREST RATES FOR TREASURY SOURCES OF CAPITAL AND PRICE
DEFLATORS
6.1 Introduction Interest rates on bonds issued by BPA to Treasury and interest rates for Corps and Reclamation appropriations are used in development of repayment studies and projections of Federal interest expense in revenue requirements. Price deflators are used for developing spending levels in revenue requirements. 6.2 Source of Forecasts
To project interest rates on bonds issued to Treasury, BPA uses Treasury yield curve forecasts provided by the Global Insights Group (GI). GI is also the source of price deflators that BPA treats as escalators for purposes of developing spending levels. GI develops the price deflators taking into account projections of Gross Domestic Product (GDP). The GDP consists of the sum of consumption, investment, government purchases and net exports, excluding transfers to foreigners. 6.3 Interest Rate Projections
Projected interest rates for BPA bonds issued to Treasury are based on GI’s yield curve projections of Treasury market rates, plus a markup of up to 56 basis points depending on the length of time to maturity. The markup estimate reflects an interagency agreement that Treasury price BPA bonds at a level comparable to securities (bonds) issued by U.S. government corporations. The markup estimate reflects the average basis point markup on recent intermediate and long-term bonds issued by BPA. Interest rates on projected capital investments funded by appropriations are also based on GI’s projections of Treasury yield curves. The yield curves used for appropriations do not include the basis point markup. 6.4 Deflators
The current and cumulative price deflator used to escalate midyear dollars are derived from the fiscal and calendar year price deflators provided by GI. They are calculated as follows: [(FY1/100) x 0.5] + 1 = Cumulative Price Deflator1 The fiscal year GDP price deflator for the current year is divided by one hundred and multiplied by one half. The result, when added to one, yields the cumulative price deflator for the first year. [1 + (FYt/100)] x Cumulative Price Deflatort-1 = Cumulative Price Deflatort, when t > 1 The fiscal year GDP price deflator for a future year is divided by one hundred and added to one. The result, when multiplied by the cumulative price deflator from the previous year, yields the cumulative price deflator for the each successive year. To the extent deflators are used in developing the FY 2018-2019 spending levels they are based on the price deflators from the Third Quarter, August 2016 GI Base Case forecast.
BP-18-FS-BPA-02A Page 41

DOE F 1325.8e Electronic Form Approved by Forms Mgmt. 04/19/2006 (08-89)
United States Government Department of Energy
memorandum Bonneville Power Administration
DATE: 11/30/2016
REPLY TO ATTN OF:
FTC-2
SUBJECT:
FY 2017 Interest Rate and Inflation Forecast
See Attached “cc:” List Please see the attached BPA interest rate and inflation forecast for the period FY 2017 through 2046. These forecasts provide an internally consistent basis for BPA decisions regarding debt management, budget formulation and other financial analyses, as well as capital budgeting and strategic planning efforts. The FY 2017 forecast is summarized in the following tables:
Table 1: 30 Year Treasury Yields and BPA Borrowing Rates Table 2: Forecast Comparison – 30 Year BPA Borrowing Rates – Callable at Par Table 3: 20 Year Treasury Yields and BPA Borrowing Rates Table 4: 15 Year Treasury Yields and BPA Borrowing Rates Table 5: BPA FY 2017 Appropriation Borrowing Rates Table 6: BPA FY 2017 BPA Borrowing Rates – No Premium Table 7: BPA FY 2017 BPA Borrowing Rates – Coupon Scale-Down Table 8: BPA FY 2017 BPA Borrowing Rates – Callable at Par Table 9: BPA FY 2017 Third-Party Taxable Borrowing Rates Table 10: BPA FY 2017 Third-Party Tax-Exempt Borrowing Rates Table 11: BPA FY 2017 FERC Borrowing Rates (Bank Prime) Table 12: BPA FY 2017 May 3 Month LIBOR Rates Table 13: Comparison of FY 2017 Inflation Forecast Components
Borrowing Rate Forecast Methodology The FY 2017 forecast is based on the Global Insight (GI) Third Quarter August 2016 Long-Term Economic Outlook. Tables 1, 3, and 4 illustrate the components of BPA’s Treasury borrowing rate forecasts. GI calendar year (CY) projections of 30 Year Treasury bond yields are shown in Column A. BPA fiscal year (FY) projections are shown in Column B. Column C, D, and E reflect BPA’s Treasury borrowing rate options. BPA borrowing rates from the U.S. Treasury reflect a mark-up over the Treasury yield curve. Table 6 is the Government Agency borrowing rate and reflects the rate BPA would borrow at without a call premium. The other two rates {Table 7 and Table 8} reflect the two additional borrowing options BPA can exercise with Treasury: callable at par and coupon-scale down. A callable at par call option allows BPA to redeem the
TO:
BP-18-FS-BPA-02A Page 42

2 bond before maturity without paying a call premium at the time of the call. The cost of this call option results in a mark-up to the coupon rate, resulting in higher interest expense paid over the life of the bond. With a coupon scale down call option the call premium is determined at the time of bond issuance for each option call date over the bond’s term; this call premium is only paid if the bond is called. In addition to paying a call premium at the time the bond is called, there is also a mark-up to the coupon rate for the coupon scale down option. The premium for these two call options are calculated using historical spread premiums. Table Descriptions
Tables 1, 3, and 4: Shows the steps involved to arrive at the BPA borrowing rate. Table 2: Compares the current forecast of the BPA Borrowing Rate - Callable at Par to the FY 2016 forecast. Table 5: Forecasts a rate equivalent to the Treasury yield curve. Table 6: Forecasts the rate at which Bonneville would borrow from the U.S. Treasury for a bullet bond with no call option. Table 7: Forecasts the rate at which Bonneville would borrow from the U.S. Treasury for a bullet bond with a coupon scale-down call option. Table 8: Forecasts the rate at which Bonneville would borrow from the U.S. Treasury for a bullet bond with a callable at par call option. Table 9: Forecasts the rate at which Bonneville would back third-party bonds on a taxable basis, as with the Lease Purchase Program. Table 10: Forecasts the rate at which Bonneville would back third-party bonds on a tax-exempt basis, as with Bonneville-backed Energy Northwest bonds. Table 11: Forecasts the Prime rate, the rate at which banks charge interest for their most creditworthy customers. Table 12: Forecasts the 3 Month LIBOR rate, the rate charged by London banks, used as a benchmark rate worldwide. Table 13: Forecasts the projected change in the Gross Domestic Product (GDP) price deflator and compares to the FY 2016 inflation forecast. The table also forecasts future inflation rates. Inflation Forecast BPA inflation assumptions reflect projected changes in the U.S. GDP Price Deflator. The GDP Price Deflator is the broadest measure of inflation in the U.S. economy. GDP reflects the value of all goods and services produced by domestic and foreign capital and labor within the United States. Major components of GDP include: total consumption, investment, government purchases, and net exports. The real GDP calculations reflect both the changing mix of the components in GDP and the relative price changes in these components. This index assumes a base year of 2009. The projected change in the GDP price deflator and comparison with the FY 2016 inflation forecast is summarized in Table 13. Column A shows the projected trend in GDP inflation rates between 2017-2046 on a calendar year basis and in column B by BPA fiscal year. Column C provides the cumulative price index projections. The forecast expresses fiscal year dollar values as mid-year dollar values.
BP-18-FS-BPA-02A Page 43

3 If you have questions, or suggestions concerning the FY 2017 Interest Rate and Inflation Forecasts, please contact Bill Hendricks at (503) 230-5389.
Bill Hendricks Financial Analyst, Debt and Investment Management Attachment cc: See Front List Official File – http://internal.bpa.gov/finance/FT/FTC/Common%20Agency%20Assumptions/Forms/AllItems.aspx
BP-18-FS-BPA-02A Page 44

A B C D EAppropriation Appropriation BPA Rate 3/ BPA Rate 4/ BPA Rate 5/
Rate 1/ Rate 2/ No Premium Coupon Scale-Down Callable at ParYear Calendar Year Fiscal Year Fiscal Year Fiscal Year Fiscal Year
2016 3.452017 2.94 2.38 2.93 3.92 4.092018 3.44 3.32 3.87 5.00 5.172019 4.01 3.87 4.43 5.69 5.862020 4.22 4.17 4.74 5.89 6.102021 4.22 4.22 4.79 5.94 6.162022 4.22 4.22 4.79 5.94 6.162023 4.22 4.22 4.79 5.94 6.162024 4.22 4.22 4.79 5.94 6.162025 4.22 4.22 4.79 5.94 6.162026 4.22 4.22 4.79 5.94 6.162027 4.22 4.22 4.79 5.94 6.162028 4.22 4.22 4.79 5.94 6.162029 4.22 4.22 4.79 5.94 6.162030 4.22 4.22 4.79 5.94 6.162031 4.22 4.22 4.79 5.94 6.162032 4.22 4.22 4.79 5.94 6.162033 4.22 4.22 4.79 5.94 6.162034 4.22 4.22 4.79 5.94 6.162035 4.22 4.22 4.79 5.94 6.162036 4.22 4.22 4.79 5.94 6.162037 4.22 4.22 4.79 5.94 6.162038 4.22 4.22 4.79 5.94 6.162039 4.22 4.22 4.79 5.94 6.162040 4.22 4.22 4.79 5.94 6.162041 4.22 4.22 4.79 5.94 6.162042 4.22 4.22 4.79 5.94 6.162043 4.22 4.22 4.79 5.94 6.162044 4.22 4.22 4.79 5.94 6.162045 4.22 4.22 4.79 5.94 6.162046 4.22 4.22 4.79 5.94 6.16
2/ FY 2017 Appropriation rates are determined in accordance with BPA Appropriations Refinancing Act, 16 U.S.C. 8381 enacted on April 26, 1996, and are independent of the Global Insight Treasury Yield forecasts.
5/ Column E = Column B + U.S. Treasury borrowing markup + Callable at Par premium.
4/ Column D = Column B + U.S. Treasury borrowing markup + Coupon Scale-Down premium.
Calendar/Fiscal Years 2017-2046
1/ Global Insight: The U.S. Economy: 30 Year Focus, August 2016 Forecast, Base Case.
3/ Column C = Column B + U.S. Treasury borrowing markup, no premium.
Table 1
30 Year Treasury Yields and BPA Borrowing RatesFY 2017 Forecast of BPA Borrowing Rates
BP-18-FS-BPA-02A Page 45

A B CFY 2017 Forecast FY 2016 Forecast Difference
BPA Rate 1/ BPA Rate 2/Year Callable at Par Callable at Par (A-B)
2017 4.09 5.86 -1.782018 5.17 6.11 -0.942019 5.86 6.16 -0.302020 6.10 6.17 -0.072021 6.16 6.17 -0.022022 6.16 6.17 -0.022023 6.16 6.17 -0.022024 6.16 6.17 -0.022025 6.16 6.17 -0.022026 6.16 6.17 -0.022027 6.16 6.17 -0.022028 6.16 6.17 -0.022029 6.16 6.17 -0.022030 6.16 6.17 -0.022031 6.16 6.17 -0.022032 6.16 6.17 -0.022033 6.16 6.17 -0.022034 6.16 6.17 -0.022035 6.16 6.17 -0.022036 6.16 6.17 -0.022037 6.16 6.17 -0.022038 6.16 6.17 -0.022039 6.16 6.17 -0.022040 6.16 6.17 -0.022041 6.16 6.17 -0.022042 6.16 6.17 -0.022043 6.16 6.17 -0.022044 6.16 6.17 -0.022045 6.16 6.17 -0.022046 6.16
2/ Global Insight: The U.S. Economy: 30 Year Focus, August 2015 Forecast, Base Case.
Forecast Comparison - 30 Year BPA Borrowing Rates - Callable at Par
Fiscal Years 2017-2046
Table 2
1/ Global Insight: The U.S. Economy: 30 Year Focus, August 2016 Forecast, Base Case.
BPA FY 2017 vs. BPA FY 2016
BP-18-FS-BPA-02A Page 46
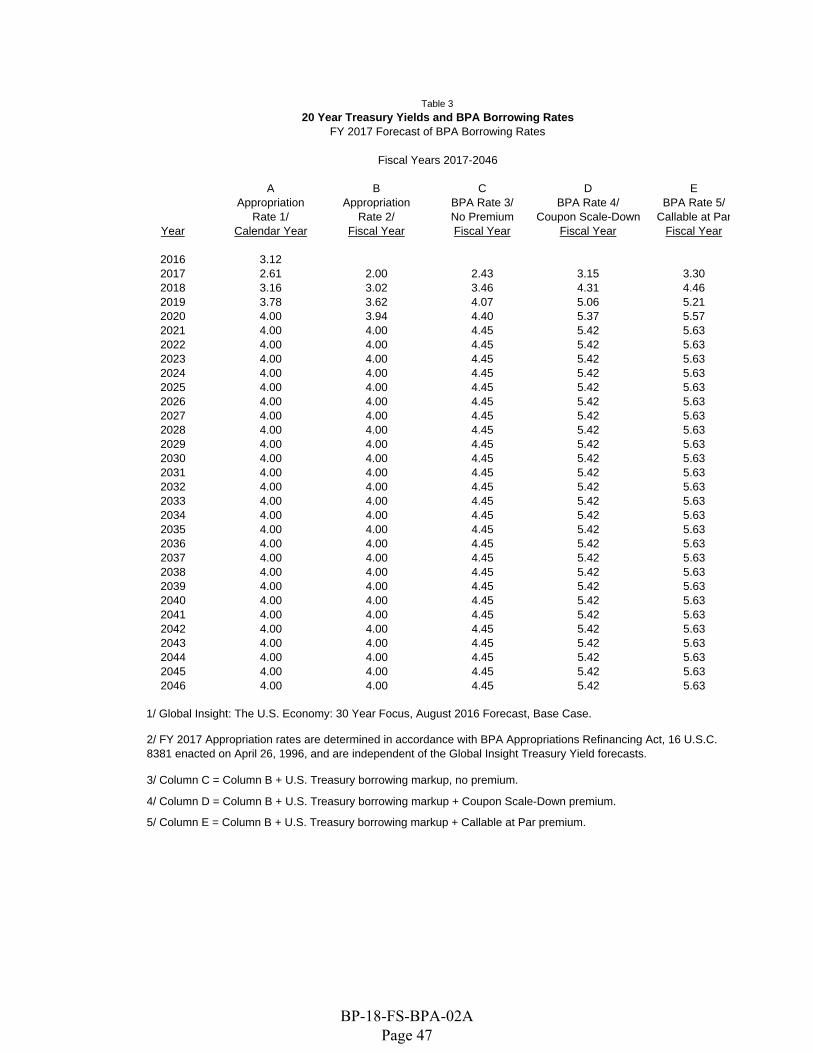
A B C D EAppropriation Appropriation BPA Rate 3/ BPA Rate 4/ BPA Rate 5/
Rate 1/ Rate 2/ No Premium Coupon Scale-Down Callable at ParYear Calendar Year Fiscal Year Fiscal Year Fiscal Year Fiscal Year
2016 3.122017 2.61 2.00 2.43 3.15 3.302018 3.16 3.02 3.46 4.31 4.462019 3.78 3.62 4.07 5.06 5.212020 4.00 3.94 4.40 5.37 5.572021 4.00 4.00 4.45 5.42 5.632022 4.00 4.00 4.45 5.42 5.632023 4.00 4.00 4.45 5.42 5.632024 4.00 4.00 4.45 5.42 5.632025 4.00 4.00 4.45 5.42 5.632026 4.00 4.00 4.45 5.42 5.632027 4.00 4.00 4.45 5.42 5.632028 4.00 4.00 4.45 5.42 5.632029 4.00 4.00 4.45 5.42 5.632030 4.00 4.00 4.45 5.42 5.632031 4.00 4.00 4.45 5.42 5.632032 4.00 4.00 4.45 5.42 5.632033 4.00 4.00 4.45 5.42 5.632034 4.00 4.00 4.45 5.42 5.632035 4.00 4.00 4.45 5.42 5.632036 4.00 4.00 4.45 5.42 5.632037 4.00 4.00 4.45 5.42 5.632038 4.00 4.00 4.45 5.42 5.632039 4.00 4.00 4.45 5.42 5.632040 4.00 4.00 4.45 5.42 5.632041 4.00 4.00 4.45 5.42 5.632042 4.00 4.00 4.45 5.42 5.632043 4.00 4.00 4.45 5.42 5.632044 4.00 4.00 4.45 5.42 5.632045 4.00 4.00 4.45 5.42 5.632046 4.00 4.00 4.45 5.42 5.63
2/ FY 2017 Appropriation rates are determined in accordance with BPA Appropriations Refinancing Act, 16 U.S.C. 8381 enacted on April 26, 1996, and are independent of the Global Insight Treasury Yield forecasts.
5/ Column E = Column B + U.S. Treasury borrowing markup + Callable at Par premium.
3/ Column C = Column B + U.S. Treasury borrowing markup, no premium.
4/ Column D = Column B + U.S. Treasury borrowing markup + Coupon Scale-Down premium.
Fiscal Years 2017-2046
Table 3
20 Year Treasury Yields and BPA Borrowing RatesFY 2017 Forecast of BPA Borrowing Rates
1/ Global Insight: The U.S. Economy: 30 Year Focus, August 2016 Forecast, Base Case.
BP-18-FS-BPA-02A Page 47

A B C D EAppropriation Appropriation BPA Rate 3/ BPA Rate 4/ BPA Rate 5/
Rate 1/ Rate 2/ No Premium Coupon Scale-Down Callable at ParYear Calendar Year Fiscal Year Fiscal Year Fiscal Year Fiscal Year
2016 2.952017 2.44 1.86 2.18 2.77 2.902018 3.02 2.87 3.25 3.97 4.112019 3.66 3.50 3.89 4.74 4.882020 3.89 3.83 4.23 5.11 5.312021 3.89 3.89 4.28 5.17 5.362022 3.89 3.89 4.28 5.17 5.362023 3.89 3.89 4.28 5.17 5.362024 3.89 3.89 4.28 5.17 5.362025 3.89 3.89 4.28 5.17 5.362026 3.89 3.89 4.28 5.17 5.362027 3.89 3.89 4.28 5.17 5.362028 3.89 3.89 4.28 5.17 5.362029 3.89 3.89 4.28 5.17 5.362030 3.89 3.89 4.28 5.17 5.362031 3.89 3.89 4.28 5.17 5.362032 3.89 3.89 4.28 5.17 5.362033 3.89 3.89 4.28 5.17 5.362034 3.89 3.89 4.28 5.17 5.362035 3.89 3.89 4.28 5.17 5.362036 3.89 3.89 4.28 5.17 5.362037 3.89 3.89 4.28 5.17 5.362038 3.89 3.89 4.28 5.17 5.362039 3.89 3.89 4.28 5.17 5.362040 3.89 3.89 4.28 5.17 5.362041 3.89 3.89 4.28 5.17 5.362042 3.89 3.89 4.28 5.17 5.362043 3.89 3.89 4.28 5.17 5.362044 3.89 3.89 4.28 5.17 5.362045 3.89 3.89 4.28 5.17 5.362046 3.89 3.89 4.28 5.17 5.36
5/ Column E = Column B + U.S. Treasury borrowing markup + Callable at Par premium.
4/ Column D = Column B + U.S. Treasury borrowing markup + Coupon Scale-Down premium.
3/ Column C = Column B + U.S. Treasury borrowing markup, no premium.
1/ Global Insight: The U.S. Economy: 30 Year Focus, August 2016 Forecast, Base Case.
Table 4
15 Year Treasury Yields and BPA Borrowing RatesFY 2017 Forecast of BPA Borrowing Rates
Fiscal Years 2017-2046
2/ FY 2017 Appropriation rates are determined in accordance with BPA Appropriations Refinancing Act, 16 U.S.C. 8381 enacted on April 26, 1996, and are independent of the Global Insight Treasury Yield forecasts.
BP-18-FS-BPA-02A Page 48
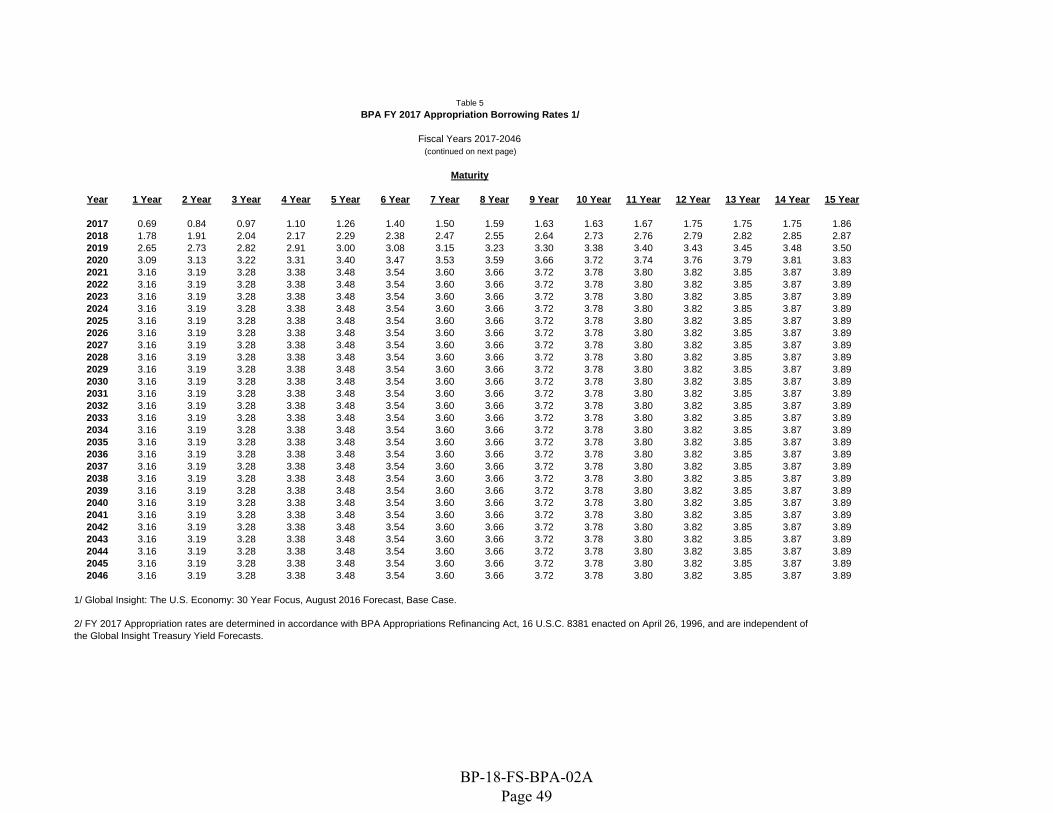
Year 1 Year 2 Year 3 Year 4 Year 5 Year 6 Year 7 Year 8 Year 9 Year 10 Year 11 Year 12 Year 13 Year 14 Year 15 Year
2017 0.69 0.84 0.97 1.10 1.26 1.40 1.50 1.59 1.63 1.63 1.67 1.75 1.75 1.75 1.862018 1.78 1.91 2.04 2.17 2.29 2.38 2.47 2.55 2.64 2.73 2.76 2.79 2.82 2.85 2.872019 2.65 2.73 2.82 2.91 3.00 3.08 3.15 3.23 3.30 3.38 3.40 3.43 3.45 3.48 3.502020 3.09 3.13 3.22 3.31 3.40 3.47 3.53 3.59 3.66 3.72 3.74 3.76 3.79 3.81 3.832021 3.16 3.19 3.28 3.38 3.48 3.54 3.60 3.66 3.72 3.78 3.80 3.82 3.85 3.87 3.892022 3.16 3.19 3.28 3.38 3.48 3.54 3.60 3.66 3.72 3.78 3.80 3.82 3.85 3.87 3.892023 3.16 3.19 3.28 3.38 3.48 3.54 3.60 3.66 3.72 3.78 3.80 3.82 3.85 3.87 3.892024 3.16 3.19 3.28 3.38 3.48 3.54 3.60 3.66 3.72 3.78 3.80 3.82 3.85 3.87 3.892025 3.16 3.19 3.28 3.38 3.48 3.54 3.60 3.66 3.72 3.78 3.80 3.82 3.85 3.87 3.892026 3.16 3.19 3.28 3.38 3.48 3.54 3.60 3.66 3.72 3.78 3.80 3.82 3.85 3.87 3.892027 3.16 3.19 3.28 3.38 3.48 3.54 3.60 3.66 3.72 3.78 3.80 3.82 3.85 3.87 3.892028 3.16 3.19 3.28 3.38 3.48 3.54 3.60 3.66 3.72 3.78 3.80 3.82 3.85 3.87 3.892029 3.16 3.19 3.28 3.38 3.48 3.54 3.60 3.66 3.72 3.78 3.80 3.82 3.85 3.87 3.892030 3.16 3.19 3.28 3.38 3.48 3.54 3.60 3.66 3.72 3.78 3.80 3.82 3.85 3.87 3.892031 3.16 3.19 3.28 3.38 3.48 3.54 3.60 3.66 3.72 3.78 3.80 3.82 3.85 3.87 3.892032 3.16 3.19 3.28 3.38 3.48 3.54 3.60 3.66 3.72 3.78 3.80 3.82 3.85 3.87 3.892033 3.16 3.19 3.28 3.38 3.48 3.54 3.60 3.66 3.72 3.78 3.80 3.82 3.85 3.87 3.892034 3.16 3.19 3.28 3.38 3.48 3.54 3.60 3.66 3.72 3.78 3.80 3.82 3.85 3.87 3.892035 3.16 3.19 3.28 3.38 3.48 3.54 3.60 3.66 3.72 3.78 3.80 3.82 3.85 3.87 3.892036 3.16 3.19 3.28 3.38 3.48 3.54 3.60 3.66 3.72 3.78 3.80 3.82 3.85 3.87 3.892037 3.16 3.19 3.28 3.38 3.48 3.54 3.60 3.66 3.72 3.78 3.80 3.82 3.85 3.87 3.892038 3.16 3.19 3.28 3.38 3.48 3.54 3.60 3.66 3.72 3.78 3.80 3.82 3.85 3.87 3.892039 3.16 3.19 3.28 3.38 3.48 3.54 3.60 3.66 3.72 3.78 3.80 3.82 3.85 3.87 3.892040 3.16 3.19 3.28 3.38 3.48 3.54 3.60 3.66 3.72 3.78 3.80 3.82 3.85 3.87 3.892041 3.16 3.19 3.28 3.38 3.48 3.54 3.60 3.66 3.72 3.78 3.80 3.82 3.85 3.87 3.892042 3.16 3.19 3.28 3.38 3.48 3.54 3.60 3.66 3.72 3.78 3.80 3.82 3.85 3.87 3.892043 3.16 3.19 3.28 3.38 3.48 3.54 3.60 3.66 3.72 3.78 3.80 3.82 3.85 3.87 3.892044 3.16 3.19 3.28 3.38 3.48 3.54 3.60 3.66 3.72 3.78 3.80 3.82 3.85 3.87 3.892045 3.16 3.19 3.28 3.38 3.48 3.54 3.60 3.66 3.72 3.78 3.80 3.82 3.85 3.87 3.892046 3.16 3.19 3.28 3.38 3.48 3.54 3.60 3.66 3.72 3.78 3.80 3.82 3.85 3.87 3.89
1/ Global Insight: The U.S. Economy: 30 Year Focus, August 2016 Forecast, Base Case.
Table 5
BPA FY 2017 Appropriation Borrowing Rates 1/
Fiscal Years 2017-2046
Maturity
(continued on next page)
2/ FY 2017 Appropriation rates are determined in accordance with BPA Appropriations Refinancing Act, 16 U.S.C. 8381 enacted on April 26, 1996, and are independent of the Global Insight Treasury Yield Forecasts.
BP-18-FS-BPA-02A Page 49

16 Year 17 Year 18 Year 19 Year 20 Year 21 Year 22 Year 23 Year 24 Year 25 Year 26 Year 27 Year 28 Year 29 Year 30 Year 50 Year Year
1.88 1.88 1.93 2.00 2.00 2.01 2.13 2.13 2.18 2.25 2.25 2.25 2.32 2.38 2.38 2.38 20172.90 2.93 2.96 2.99 3.02 3.05 3.08 3.11 3.14 3.17 3.20 3.23 3.26 3.29 3.32 3.32 20183.52 3.55 3.57 3.60 3.62 3.65 3.67 3.70 3.72 3.74 3.77 3.79 3.82 3.84 3.87 3.87 20193.85 3.88 3.90 3.92 3.94 3.97 3.99 4.01 4.03 4.06 4.08 4.10 4.12 4.15 4.17 4.17 20203.91 3.93 3.96 3.98 4.00 4.02 4.05 4.07 4.09 4.11 4.13 4.16 4.18 4.20 4.22 4.22 20213.91 3.93 3.96 3.98 4.00 4.02 4.05 4.07 4.09 4.11 4.13 4.16 4.18 4.20 4.22 4.22 20223.91 3.93 3.96 3.98 4.00 4.02 4.05 4.07 4.09 4.11 4.13 4.16 4.18 4.20 4.22 4.22 20233.91 3.93 3.96 3.98 4.00 4.02 4.05 4.07 4.09 4.11 4.13 4.16 4.18 4.20 4.22 4.22 20243.91 3.93 3.96 3.98 4.00 4.02 4.05 4.07 4.09 4.11 4.13 4.16 4.18 4.20 4.22 4.22 20253.91 3.93 3.96 3.98 4.00 4.02 4.05 4.07 4.09 4.11 4.13 4.16 4.18 4.20 4.22 4.22 20263.91 3.93 3.96 3.98 4.00 4.02 4.05 4.07 4.09 4.11 4.13 4.16 4.18 4.20 4.22 4.22 20273.91 3.93 3.96 3.98 4.00 4.02 4.05 4.07 4.09 4.11 4.13 4.16 4.18 4.20 4.22 4.22 20283.91 3.93 3.96 3.98 4.00 4.02 4.05 4.07 4.09 4.11 4.13 4.16 4.18 4.20 4.22 4.22 20293.91 3.93 3.96 3.98 4.00 4.02 4.05 4.07 4.09 4.11 4.13 4.16 4.18 4.20 4.22 4.22 20303.91 3.93 3.96 3.98 4.00 4.02 4.05 4.07 4.09 4.11 4.13 4.16 4.18 4.20 4.22 4.22 20313.91 3.93 3.96 3.98 4.00 4.02 4.05 4.07 4.09 4.11 4.13 4.16 4.18 4.20 4.22 4.22 20323.91 3.93 3.96 3.98 4.00 4.02 4.05 4.07 4.09 4.11 4.13 4.16 4.18 4.20 4.22 4.22 20333.91 3.93 3.96 3.98 4.00 4.02 4.05 4.07 4.09 4.11 4.13 4.16 4.18 4.20 4.22 4.22 20343.91 3.93 3.96 3.98 4.00 4.02 4.05 4.07 4.09 4.11 4.13 4.16 4.18 4.20 4.22 4.22 20353.91 3.93 3.96 3.98 4.00 4.02 4.05 4.07 4.09 4.11 4.13 4.16 4.18 4.20 4.22 4.22 20363.91 3.93 3.96 3.98 4.00 4.02 4.05 4.07 4.09 4.11 4.13 4.16 4.18 4.20 4.22 4.22 20373.91 3.93 3.96 3.98 4.00 4.02 4.05 4.07 4.09 4.11 4.13 4.16 4.18 4.20 4.22 4.22 20383.91 3.93 3.96 3.98 4.00 4.02 4.05 4.07 4.09 4.11 4.13 4.16 4.18 4.20 4.22 4.22 20393.91 3.93 3.96 3.98 4.00 4.02 4.05 4.07 4.09 4.11 4.13 4.16 4.18 4.20 4.22 4.22 20403.91 3.93 3.96 3.98 4.00 4.02 4.05 4.07 4.09 4.11 4.13 4.16 4.18 4.20 4.22 4.22 20413.91 3.93 3.96 3.98 4.00 4.02 4.05 4.07 4.09 4.11 4.13 4.16 4.18 4.20 4.22 4.22 20423.91 3.93 3.96 3.98 4.00 4.02 4.05 4.07 4.09 4.11 4.13 4.16 4.18 4.20 4.22 4.22 20433.91 3.93 3.96 3.98 4.00 4.02 4.05 4.07 4.09 4.11 4.13 4.16 4.18 4.20 4.22 4.22 20443.91 3.93 3.96 3.98 4.00 4.02 4.05 4.07 4.09 4.11 4.13 4.16 4.18 4.20 4.22 4.22 20453.91 3.93 3.96 3.98 4.00 4.02 4.05 4.07 4.09 4.11 4.13 4.16 4.18 4.20 4.22 4.22 2046
1/ Global Insight: The U.S. Economy: 30 Year Focus, August 2016 Forecast, Base Case.
Maturity
Fiscal Years 2017-2046
BPA FY 2017 Appropriation Borrowing Rates 1/Table 5
2/ FY 2017 Appropriation rates are determined in accordance with BPA Appropriations Refinancing Act, 16 U.S.C. 8381 enacted on April 26, 1996, and are independent of the Global Insight Treasury Yield Forecasts.
BP-18-FS-BPA-02A Page 50

Year 1 Year 2 Year 3 Year 4 Year 5 Year 6 Year 7 Year 8 Year 9 Year 10 Year 11 Year 12 Year 13 Year 14 Year 15 Year
2017 0.75 0.92 1.08 1.24 1.40 1.51 1.61 1.72 1.83 1.93 1.98 2.03 2.08 2.13 2.182018 1.85 2.00 2.15 2.29 2.44 2.56 2.68 2.80 2.92 3.04 3.09 3.13 3.17 3.21 3.252019 2.72 2.83 2.94 3.05 3.16 3.27 3.38 3.49 3.59 3.70 3.74 3.78 3.81 3.85 3.892020 3.16 3.24 3.35 3.46 3.57 3.67 3.76 3.86 3.96 4.06 4.09 4.13 4.16 4.19 4.232021 3.23 3.30 3.41 3.53 3.64 3.74 3.83 3.93 4.02 4.12 4.15 4.18 4.22 4.25 4.282022 3.23 3.30 3.41 3.53 3.64 3.74 3.83 3.93 4.02 4.12 4.15 4.18 4.22 4.25 4.282023 3.23 3.30 3.41 3.53 3.64 3.74 3.83 3.93 4.02 4.12 4.15 4.18 4.22 4.25 4.282024 3.23 3.30 3.41 3.53 3.64 3.74 3.83 3.93 4.02 4.12 4.15 4.18 4.22 4.25 4.282025 3.23 3.30 3.41 3.53 3.64 3.74 3.83 3.93 4.02 4.12 4.15 4.18 4.22 4.25 4.282026 3.23 3.30 3.41 3.53 3.64 3.74 3.83 3.93 4.02 4.12 4.15 4.18 4.22 4.25 4.282027 3.23 3.30 3.41 3.53 3.64 3.74 3.83 3.93 4.02 4.12 4.15 4.18 4.22 4.25 4.282028 3.23 3.30 3.41 3.53 3.64 3.74 3.83 3.93 4.02 4.12 4.15 4.18 4.22 4.25 4.282029 3.23 3.30 3.41 3.53 3.64 3.74 3.83 3.93 4.02 4.12 4.15 4.18 4.22 4.25 4.282030 3.23 3.30 3.41 3.53 3.64 3.74 3.83 3.93 4.02 4.12 4.15 4.18 4.22 4.25 4.282031 3.23 3.30 3.41 3.53 3.64 3.74 3.83 3.93 4.02 4.12 4.15 4.18 4.22 4.25 4.282032 3.23 3.30 3.41 3.53 3.64 3.74 3.83 3.93 4.02 4.12 4.15 4.18 4.22 4.25 4.282033 3.23 3.30 3.41 3.53 3.64 3.74 3.83 3.93 4.02 4.12 4.15 4.18 4.22 4.25 4.282034 3.23 3.30 3.41 3.53 3.64 3.74 3.83 3.93 4.02 4.12 4.15 4.18 4.22 4.25 4.282035 3.23 3.30 3.41 3.53 3.64 3.74 3.83 3.93 4.02 4.12 4.15 4.18 4.22 4.25 4.282036 3.23 3.30 3.41 3.53 3.64 3.74 3.83 3.93 4.02 4.12 4.15 4.18 4.22 4.25 4.282037 3.23 3.30 3.41 3.53 3.64 3.74 3.83 3.93 4.02 4.12 4.15 4.18 4.22 4.25 4.282038 3.23 3.30 3.41 3.53 3.64 3.74 3.83 3.93 4.02 4.12 4.15 4.18 4.22 4.25 4.282039 3.23 3.30 3.41 3.53 3.64 3.74 3.83 3.93 4.02 4.12 4.15 4.18 4.22 4.25 4.282040 3.23 3.30 3.41 3.53 3.64 3.74 3.83 3.93 4.02 4.12 4.15 4.18 4.22 4.25 4.282041 3.23 3.30 3.41 3.53 3.64 3.74 3.83 3.93 4.02 4.12 4.15 4.18 4.22 4.25 4.282042 3.23 3.30 3.41 3.53 3.64 3.74 3.83 3.93 4.02 4.12 4.15 4.18 4.22 4.25 4.282043 3.23 3.30 3.41 3.53 3.64 3.74 3.83 3.93 4.02 4.12 4.15 4.18 4.22 4.25 4.282044 3.23 3.30 3.41 3.53 3.64 3.74 3.83 3.93 4.02 4.12 4.15 4.18 4.22 4.25 4.282045 3.23 3.30 3.41 3.53 3.64 3.74 3.83 3.93 4.02 4.12 4.15 4.18 4.22 4.25 4.282046 3.23 3.30 3.41 3.53 3.64 3.74 3.83 3.93 4.02 4.12 4.15 4.18 4.22 4.25 4.28
1/ Global Insight: The U.S. Economy: 30 Year Focus, August 2016 Forecast, Base Case.
(continued on next page)
Maturity
Table 6
BPA FY 2017 BPA Borrowing Rates - No Premium 1/
Fiscal Years 2017-2046
BP-18-FS-BPA-02A Page 51
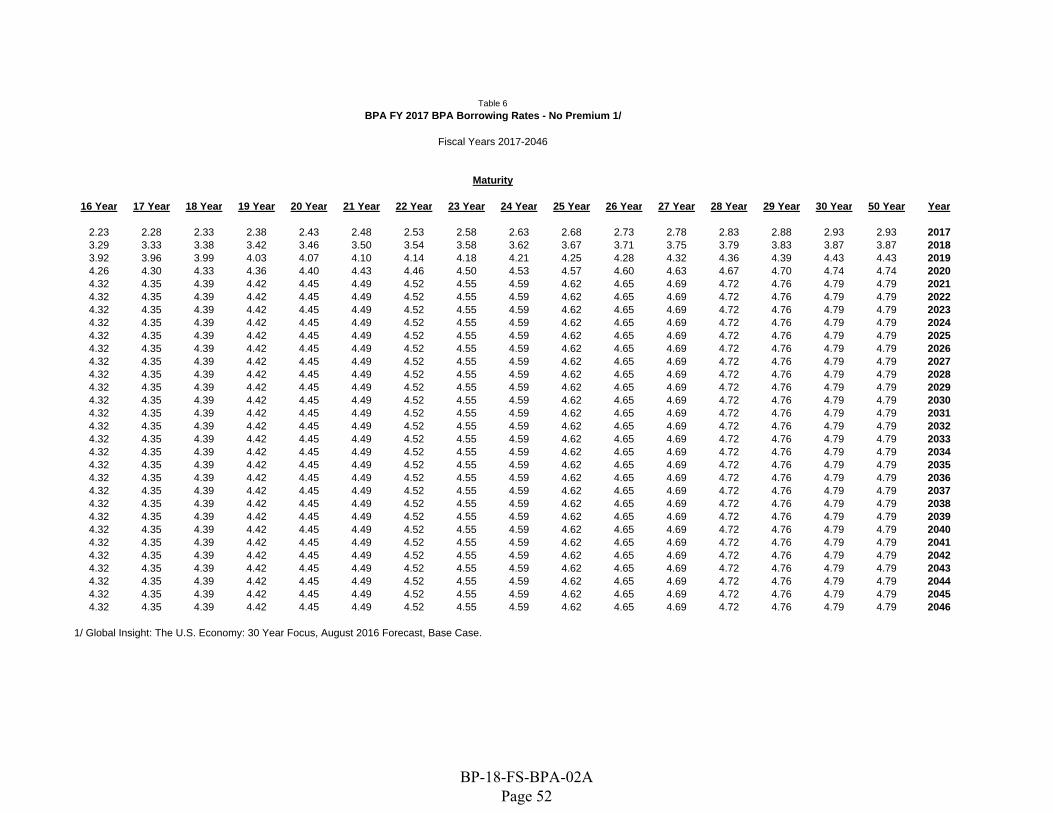
16 Year 17 Year 18 Year 19 Year 20 Year 21 Year 22 Year 23 Year 24 Year 25 Year 26 Year 27 Year 28 Year 29 Year 30 Year 50 Year Year
2.23 2.28 2.33 2.38 2.43 2.48 2.53 2.58 2.63 2.68 2.73 2.78 2.83 2.88 2.93 2.93 20173.29 3.33 3.38 3.42 3.46 3.50 3.54 3.58 3.62 3.67 3.71 3.75 3.79 3.83 3.87 3.87 20183.92 3.96 3.99 4.03 4.07 4.10 4.14 4.18 4.21 4.25 4.28 4.32 4.36 4.39 4.43 4.43 20194.26 4.30 4.33 4.36 4.40 4.43 4.46 4.50 4.53 4.57 4.60 4.63 4.67 4.70 4.74 4.74 20204.32 4.35 4.39 4.42 4.45 4.49 4.52 4.55 4.59 4.62 4.65 4.69 4.72 4.76 4.79 4.79 20214.32 4.35 4.39 4.42 4.45 4.49 4.52 4.55 4.59 4.62 4.65 4.69 4.72 4.76 4.79 4.79 20224.32 4.35 4.39 4.42 4.45 4.49 4.52 4.55 4.59 4.62 4.65 4.69 4.72 4.76 4.79 4.79 20234.32 4.35 4.39 4.42 4.45 4.49 4.52 4.55 4.59 4.62 4.65 4.69 4.72 4.76 4.79 4.79 20244.32 4.35 4.39 4.42 4.45 4.49 4.52 4.55 4.59 4.62 4.65 4.69 4.72 4.76 4.79 4.79 20254.32 4.35 4.39 4.42 4.45 4.49 4.52 4.55 4.59 4.62 4.65 4.69 4.72 4.76 4.79 4.79 20264.32 4.35 4.39 4.42 4.45 4.49 4.52 4.55 4.59 4.62 4.65 4.69 4.72 4.76 4.79 4.79 20274.32 4.35 4.39 4.42 4.45 4.49 4.52 4.55 4.59 4.62 4.65 4.69 4.72 4.76 4.79 4.79 20284.32 4.35 4.39 4.42 4.45 4.49 4.52 4.55 4.59 4.62 4.65 4.69 4.72 4.76 4.79 4.79 20294.32 4.35 4.39 4.42 4.45 4.49 4.52 4.55 4.59 4.62 4.65 4.69 4.72 4.76 4.79 4.79 20304.32 4.35 4.39 4.42 4.45 4.49 4.52 4.55 4.59 4.62 4.65 4.69 4.72 4.76 4.79 4.79 20314.32 4.35 4.39 4.42 4.45 4.49 4.52 4.55 4.59 4.62 4.65 4.69 4.72 4.76 4.79 4.79 20324.32 4.35 4.39 4.42 4.45 4.49 4.52 4.55 4.59 4.62 4.65 4.69 4.72 4.76 4.79 4.79 20334.32 4.35 4.39 4.42 4.45 4.49 4.52 4.55 4.59 4.62 4.65 4.69 4.72 4.76 4.79 4.79 20344.32 4.35 4.39 4.42 4.45 4.49 4.52 4.55 4.59 4.62 4.65 4.69 4.72 4.76 4.79 4.79 20354.32 4.35 4.39 4.42 4.45 4.49 4.52 4.55 4.59 4.62 4.65 4.69 4.72 4.76 4.79 4.79 20364.32 4.35 4.39 4.42 4.45 4.49 4.52 4.55 4.59 4.62 4.65 4.69 4.72 4.76 4.79 4.79 20374.32 4.35 4.39 4.42 4.45 4.49 4.52 4.55 4.59 4.62 4.65 4.69 4.72 4.76 4.79 4.79 20384.32 4.35 4.39 4.42 4.45 4.49 4.52 4.55 4.59 4.62 4.65 4.69 4.72 4.76 4.79 4.79 20394.32 4.35 4.39 4.42 4.45 4.49 4.52 4.55 4.59 4.62 4.65 4.69 4.72 4.76 4.79 4.79 20404.32 4.35 4.39 4.42 4.45 4.49 4.52 4.55 4.59 4.62 4.65 4.69 4.72 4.76 4.79 4.79 20414.32 4.35 4.39 4.42 4.45 4.49 4.52 4.55 4.59 4.62 4.65 4.69 4.72 4.76 4.79 4.79 20424.32 4.35 4.39 4.42 4.45 4.49 4.52 4.55 4.59 4.62 4.65 4.69 4.72 4.76 4.79 4.79 20434.32 4.35 4.39 4.42 4.45 4.49 4.52 4.55 4.59 4.62 4.65 4.69 4.72 4.76 4.79 4.79 20444.32 4.35 4.39 4.42 4.45 4.49 4.52 4.55 4.59 4.62 4.65 4.69 4.72 4.76 4.79 4.79 20454.32 4.35 4.39 4.42 4.45 4.49 4.52 4.55 4.59 4.62 4.65 4.69 4.72 4.76 4.79 4.79 2046
1/ Global Insight: The U.S. Economy: 30 Year Focus, August 2016 Forecast, Base Case.
Maturity
Fiscal Years 2017-2046
BPA FY 2017 BPA Borrowing Rates - No Premium 1/Table 6
BP-18-FS-BPA-02A Page 52
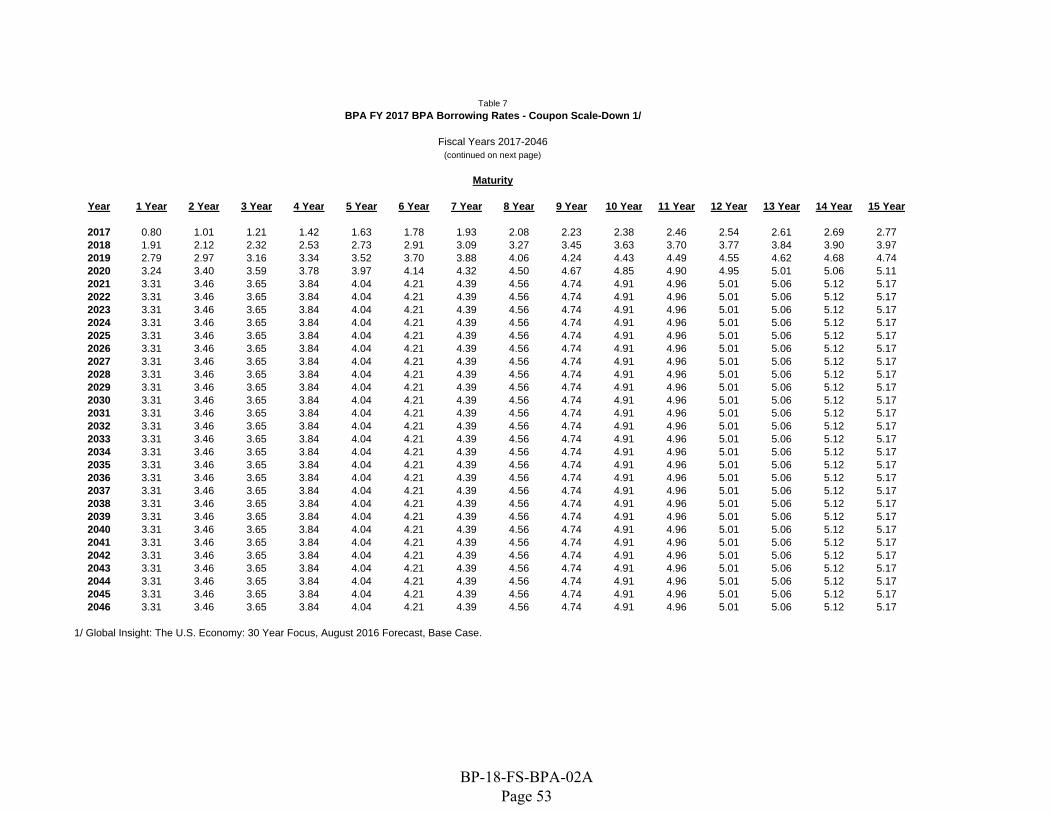
Year 1 Year 2 Year 3 Year 4 Year 5 Year 6 Year 7 Year 8 Year 9 Year 10 Year 11 Year 12 Year 13 Year 14 Year 15 Year
2017 0.80 1.01 1.21 1.42 1.63 1.78 1.93 2.08 2.23 2.38 2.46 2.54 2.61 2.69 2.772018 1.91 2.12 2.32 2.53 2.73 2.91 3.09 3.27 3.45 3.63 3.70 3.77 3.84 3.90 3.972019 2.79 2.97 3.16 3.34 3.52 3.70 3.88 4.06 4.24 4.43 4.49 4.55 4.62 4.68 4.742020 3.24 3.40 3.59 3.78 3.97 4.14 4.32 4.50 4.67 4.85 4.90 4.95 5.01 5.06 5.112021 3.31 3.46 3.65 3.84 4.04 4.21 4.39 4.56 4.74 4.91 4.96 5.01 5.06 5.12 5.172022 3.31 3.46 3.65 3.84 4.04 4.21 4.39 4.56 4.74 4.91 4.96 5.01 5.06 5.12 5.172023 3.31 3.46 3.65 3.84 4.04 4.21 4.39 4.56 4.74 4.91 4.96 5.01 5.06 5.12 5.172024 3.31 3.46 3.65 3.84 4.04 4.21 4.39 4.56 4.74 4.91 4.96 5.01 5.06 5.12 5.172025 3.31 3.46 3.65 3.84 4.04 4.21 4.39 4.56 4.74 4.91 4.96 5.01 5.06 5.12 5.172026 3.31 3.46 3.65 3.84 4.04 4.21 4.39 4.56 4.74 4.91 4.96 5.01 5.06 5.12 5.172027 3.31 3.46 3.65 3.84 4.04 4.21 4.39 4.56 4.74 4.91 4.96 5.01 5.06 5.12 5.172028 3.31 3.46 3.65 3.84 4.04 4.21 4.39 4.56 4.74 4.91 4.96 5.01 5.06 5.12 5.172029 3.31 3.46 3.65 3.84 4.04 4.21 4.39 4.56 4.74 4.91 4.96 5.01 5.06 5.12 5.172030 3.31 3.46 3.65 3.84 4.04 4.21 4.39 4.56 4.74 4.91 4.96 5.01 5.06 5.12 5.172031 3.31 3.46 3.65 3.84 4.04 4.21 4.39 4.56 4.74 4.91 4.96 5.01 5.06 5.12 5.172032 3.31 3.46 3.65 3.84 4.04 4.21 4.39 4.56 4.74 4.91 4.96 5.01 5.06 5.12 5.172033 3.31 3.46 3.65 3.84 4.04 4.21 4.39 4.56 4.74 4.91 4.96 5.01 5.06 5.12 5.172034 3.31 3.46 3.65 3.84 4.04 4.21 4.39 4.56 4.74 4.91 4.96 5.01 5.06 5.12 5.172035 3.31 3.46 3.65 3.84 4.04 4.21 4.39 4.56 4.74 4.91 4.96 5.01 5.06 5.12 5.172036 3.31 3.46 3.65 3.84 4.04 4.21 4.39 4.56 4.74 4.91 4.96 5.01 5.06 5.12 5.172037 3.31 3.46 3.65 3.84 4.04 4.21 4.39 4.56 4.74 4.91 4.96 5.01 5.06 5.12 5.172038 3.31 3.46 3.65 3.84 4.04 4.21 4.39 4.56 4.74 4.91 4.96 5.01 5.06 5.12 5.172039 3.31 3.46 3.65 3.84 4.04 4.21 4.39 4.56 4.74 4.91 4.96 5.01 5.06 5.12 5.172040 3.31 3.46 3.65 3.84 4.04 4.21 4.39 4.56 4.74 4.91 4.96 5.01 5.06 5.12 5.172041 3.31 3.46 3.65 3.84 4.04 4.21 4.39 4.56 4.74 4.91 4.96 5.01 5.06 5.12 5.172042 3.31 3.46 3.65 3.84 4.04 4.21 4.39 4.56 4.74 4.91 4.96 5.01 5.06 5.12 5.172043 3.31 3.46 3.65 3.84 4.04 4.21 4.39 4.56 4.74 4.91 4.96 5.01 5.06 5.12 5.172044 3.31 3.46 3.65 3.84 4.04 4.21 4.39 4.56 4.74 4.91 4.96 5.01 5.06 5.12 5.172045 3.31 3.46 3.65 3.84 4.04 4.21 4.39 4.56 4.74 4.91 4.96 5.01 5.06 5.12 5.172046 3.31 3.46 3.65 3.84 4.04 4.21 4.39 4.56 4.74 4.91 4.96 5.01 5.06 5.12 5.17
1/ Global Insight: The U.S. Economy: 30 Year Focus, August 2016 Forecast, Base Case.
(continued on next page)
Maturity
Table 7
BPA FY 2017 BPA Borrowing Rates - Coupon Scale-Down 1/
Fiscal Years 2017-2046
BP-18-FS-BPA-02A Page 53
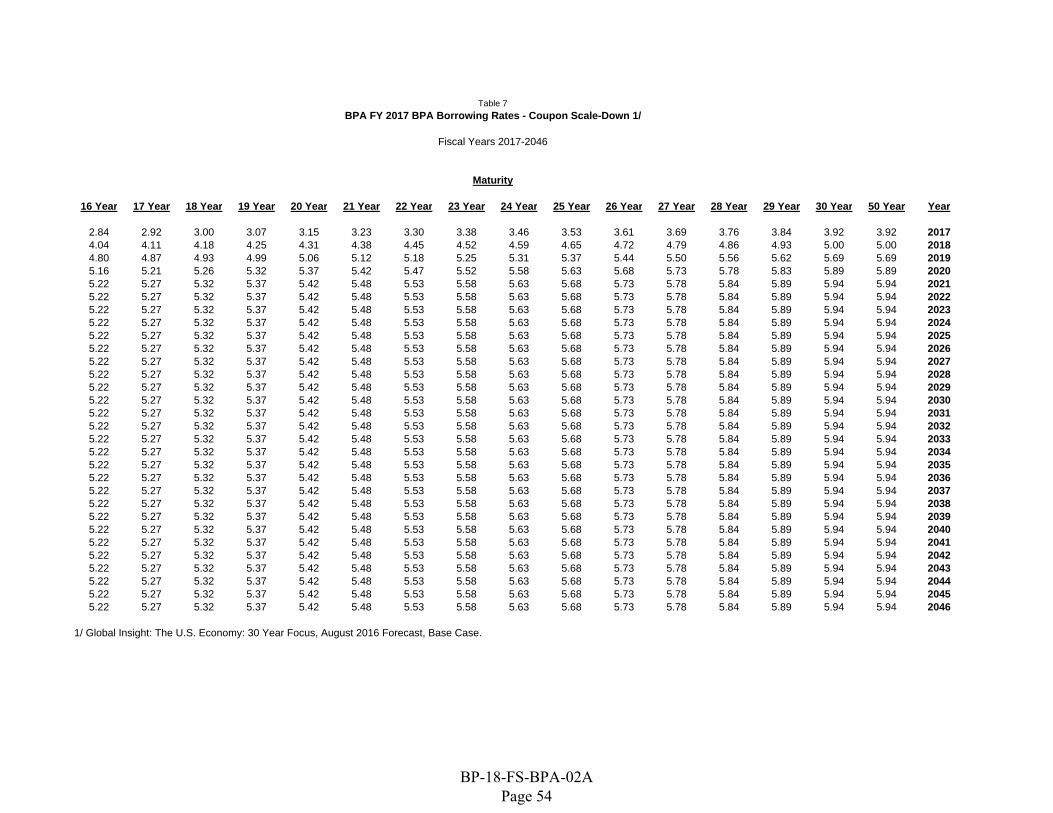
16 Year 17 Year 18 Year 19 Year 20 Year 21 Year 22 Year 23 Year 24 Year 25 Year 26 Year 27 Year 28 Year 29 Year 30 Year 50 Year Year
2.84 2.92 3.00 3.07 3.15 3.23 3.30 3.38 3.46 3.53 3.61 3.69 3.76 3.84 3.92 3.92 20174.04 4.11 4.18 4.25 4.31 4.38 4.45 4.52 4.59 4.65 4.72 4.79 4.86 4.93 5.00 5.00 20184.80 4.87 4.93 4.99 5.06 5.12 5.18 5.25 5.31 5.37 5.44 5.50 5.56 5.62 5.69 5.69 20195.16 5.21 5.26 5.32 5.37 5.42 5.47 5.52 5.58 5.63 5.68 5.73 5.78 5.83 5.89 5.89 20205.22 5.27 5.32 5.37 5.42 5.48 5.53 5.58 5.63 5.68 5.73 5.78 5.84 5.89 5.94 5.94 20215.22 5.27 5.32 5.37 5.42 5.48 5.53 5.58 5.63 5.68 5.73 5.78 5.84 5.89 5.94 5.94 20225.22 5.27 5.32 5.37 5.42 5.48 5.53 5.58 5.63 5.68 5.73 5.78 5.84 5.89 5.94 5.94 20235.22 5.27 5.32 5.37 5.42 5.48 5.53 5.58 5.63 5.68 5.73 5.78 5.84 5.89 5.94 5.94 20245.22 5.27 5.32 5.37 5.42 5.48 5.53 5.58 5.63 5.68 5.73 5.78 5.84 5.89 5.94 5.94 20255.22 5.27 5.32 5.37 5.42 5.48 5.53 5.58 5.63 5.68 5.73 5.78 5.84 5.89 5.94 5.94 20265.22 5.27 5.32 5.37 5.42 5.48 5.53 5.58 5.63 5.68 5.73 5.78 5.84 5.89 5.94 5.94 20275.22 5.27 5.32 5.37 5.42 5.48 5.53 5.58 5.63 5.68 5.73 5.78 5.84 5.89 5.94 5.94 20285.22 5.27 5.32 5.37 5.42 5.48 5.53 5.58 5.63 5.68 5.73 5.78 5.84 5.89 5.94 5.94 20295.22 5.27 5.32 5.37 5.42 5.48 5.53 5.58 5.63 5.68 5.73 5.78 5.84 5.89 5.94 5.94 20305.22 5.27 5.32 5.37 5.42 5.48 5.53 5.58 5.63 5.68 5.73 5.78 5.84 5.89 5.94 5.94 20315.22 5.27 5.32 5.37 5.42 5.48 5.53 5.58 5.63 5.68 5.73 5.78 5.84 5.89 5.94 5.94 20325.22 5.27 5.32 5.37 5.42 5.48 5.53 5.58 5.63 5.68 5.73 5.78 5.84 5.89 5.94 5.94 20335.22 5.27 5.32 5.37 5.42 5.48 5.53 5.58 5.63 5.68 5.73 5.78 5.84 5.89 5.94 5.94 20345.22 5.27 5.32 5.37 5.42 5.48 5.53 5.58 5.63 5.68 5.73 5.78 5.84 5.89 5.94 5.94 20355.22 5.27 5.32 5.37 5.42 5.48 5.53 5.58 5.63 5.68 5.73 5.78 5.84 5.89 5.94 5.94 20365.22 5.27 5.32 5.37 5.42 5.48 5.53 5.58 5.63 5.68 5.73 5.78 5.84 5.89 5.94 5.94 20375.22 5.27 5.32 5.37 5.42 5.48 5.53 5.58 5.63 5.68 5.73 5.78 5.84 5.89 5.94 5.94 20385.22 5.27 5.32 5.37 5.42 5.48 5.53 5.58 5.63 5.68 5.73 5.78 5.84 5.89 5.94 5.94 20395.22 5.27 5.32 5.37 5.42 5.48 5.53 5.58 5.63 5.68 5.73 5.78 5.84 5.89 5.94 5.94 20405.22 5.27 5.32 5.37 5.42 5.48 5.53 5.58 5.63 5.68 5.73 5.78 5.84 5.89 5.94 5.94 20415.22 5.27 5.32 5.37 5.42 5.48 5.53 5.58 5.63 5.68 5.73 5.78 5.84 5.89 5.94 5.94 20425.22 5.27 5.32 5.37 5.42 5.48 5.53 5.58 5.63 5.68 5.73 5.78 5.84 5.89 5.94 5.94 20435.22 5.27 5.32 5.37 5.42 5.48 5.53 5.58 5.63 5.68 5.73 5.78 5.84 5.89 5.94 5.94 20445.22 5.27 5.32 5.37 5.42 5.48 5.53 5.58 5.63 5.68 5.73 5.78 5.84 5.89 5.94 5.94 20455.22 5.27 5.32 5.37 5.42 5.48 5.53 5.58 5.63 5.68 5.73 5.78 5.84 5.89 5.94 5.94 2046
1/ Global Insight: The U.S. Economy: 30 Year Focus, August 2016 Forecast, Base Case.
Maturity
Fiscal Years 2017-2046
BPA FY 2017 BPA Borrowing Rates - Coupon Scale-Down 1/Table 7
BP-18-FS-BPA-02A Page 54

Year 1 Year 2 Year 3 Year 4 Year 5 Year 6 Year 7 Year 8 Year 9 Year 10 Year 11 Year 12 Year 13 Year 14 Year 15 Year
2017 0.81 1.03 1.25 1.47 1.69 1.85 2.02 2.18 2.35 2.51 2.59 2.67 2.75 2.83 2.902018 1.92 2.14 2.36 2.58 2.80 2.99 3.18 3.37 3.56 3.76 3.83 3.90 3.97 4.04 4.112019 2.81 3.00 3.19 3.39 3.58 3.77 3.97 4.16 4.36 4.55 4.62 4.68 4.75 4.81 4.882020 3.26 3.43 3.64 3.85 4.06 4.26 4.45 4.65 4.84 5.04 5.09 5.15 5.20 5.25 5.312021 3.33 3.50 3.71 3.92 4.13 4.33 4.52 4.71 4.90 5.10 5.15 5.20 5.26 5.31 5.362022 3.33 3.50 3.71 3.92 4.13 4.33 4.52 4.71 4.90 5.10 5.15 5.20 5.26 5.31 5.362023 3.33 3.50 3.71 3.92 4.13 4.33 4.52 4.71 4.90 5.10 5.15 5.20 5.26 5.31 5.362024 3.33 3.50 3.71 3.92 4.13 4.33 4.52 4.71 4.90 5.10 5.15 5.20 5.26 5.31 5.362025 3.33 3.50 3.71 3.92 4.13 4.33 4.52 4.71 4.90 5.10 5.15 5.20 5.26 5.31 5.362026 3.33 3.50 3.71 3.92 4.13 4.33 4.52 4.71 4.90 5.10 5.15 5.20 5.26 5.31 5.362027 3.33 3.50 3.71 3.92 4.13 4.33 4.52 4.71 4.90 5.10 5.15 5.20 5.26 5.31 5.362028 3.33 3.50 3.71 3.92 4.13 4.33 4.52 4.71 4.90 5.10 5.15 5.20 5.26 5.31 5.362029 3.33 3.50 3.71 3.92 4.13 4.33 4.52 4.71 4.90 5.10 5.15 5.20 5.26 5.31 5.362030 3.33 3.50 3.71 3.92 4.13 4.33 4.52 4.71 4.90 5.10 5.15 5.20 5.26 5.31 5.362031 3.33 3.50 3.71 3.92 4.13 4.33 4.52 4.71 4.90 5.10 5.15 5.20 5.26 5.31 5.362032 3.33 3.50 3.71 3.92 4.13 4.33 4.52 4.71 4.90 5.10 5.15 5.20 5.26 5.31 5.362033 3.33 3.50 3.71 3.92 4.13 4.33 4.52 4.71 4.90 5.10 5.15 5.20 5.26 5.31 5.362034 3.33 3.50 3.71 3.92 4.13 4.33 4.52 4.71 4.90 5.10 5.15 5.20 5.26 5.31 5.362035 3.33 3.50 3.71 3.92 4.13 4.33 4.52 4.71 4.90 5.10 5.15 5.20 5.26 5.31 5.362036 3.33 3.50 3.71 3.92 4.13 4.33 4.52 4.71 4.90 5.10 5.15 5.20 5.26 5.31 5.362037 3.33 3.50 3.71 3.92 4.13 4.33 4.52 4.71 4.90 5.10 5.15 5.20 5.26 5.31 5.362038 3.33 3.50 3.71 3.92 4.13 4.33 4.52 4.71 4.90 5.10 5.15 5.20 5.26 5.31 5.362039 3.33 3.50 3.71 3.92 4.13 4.33 4.52 4.71 4.90 5.10 5.15 5.20 5.26 5.31 5.362040 3.33 3.50 3.71 3.92 4.13 4.33 4.52 4.71 4.90 5.10 5.15 5.20 5.26 5.31 5.362041 3.33 3.50 3.71 3.92 4.13 4.33 4.52 4.71 4.90 5.10 5.15 5.20 5.26 5.31 5.362042 3.33 3.50 3.71 3.92 4.13 4.33 4.52 4.71 4.90 5.10 5.15 5.20 5.26 5.31 5.362043 3.33 3.50 3.71 3.92 4.13 4.33 4.52 4.71 4.90 5.10 5.15 5.20 5.26 5.31 5.362044 3.33 3.50 3.71 3.92 4.13 4.33 4.52 4.71 4.90 5.10 5.15 5.20 5.26 5.31 5.362045 3.33 3.50 3.71 3.92 4.13 4.33 4.52 4.71 4.90 5.10 5.15 5.20 5.26 5.31 5.362046 3.33 3.50 3.71 3.92 4.13 4.33 4.52 4.71 4.90 5.10 5.15 5.20 5.26 5.31 5.36
1/ Global Insight: The U.S. Economy: 30 Year Focus, August 2016 Forecast, Base Case.
(continued on next page)
Maturity
Table 8
BPA FY 2017 BPA Borrowing Rates - Callable at Par 1/
Fiscal Years 2017-2046
BP-18-FS-BPA-02A Page 55

16 Year 17 Year 18 Year 19 Year 20 Year 21 Year 22 Year 23 Year 24 Year 25 Year 26 Year 27 Year 28 Year 29 Year 30 Year 50 Year Year
2.98 3.06 3.14 3.22 3.30 3.38 3.46 3.54 3.61 3.69 3.77 3.85 3.93 4.01 4.09 4.09 20174.18 4.25 4.32 4.39 4.46 4.53 4.60 4.67 4.74 4.82 4.89 4.96 5.03 5.10 5.17 5.17 20184.94 5.01 5.07 5.14 5.21 5.27 5.34 5.40 5.47 5.53 5.60 5.66 5.73 5.79 5.86 5.86 20195.36 5.41 5.47 5.52 5.57 5.63 5.68 5.73 5.78 5.84 5.89 5.94 6.00 6.05 6.10 6.10 20205.42 5.47 5.52 5.57 5.63 5.68 5.73 5.79 5.84 5.89 5.95 6.00 6.05 6.10 6.16 6.16 20215.42 5.47 5.52 5.57 5.63 5.68 5.73 5.79 5.84 5.89 5.95 6.00 6.05 6.10 6.16 6.16 20225.42 5.47 5.52 5.57 5.63 5.68 5.73 5.79 5.84 5.89 5.95 6.00 6.05 6.10 6.16 6.16 20235.42 5.47 5.52 5.57 5.63 5.68 5.73 5.79 5.84 5.89 5.95 6.00 6.05 6.10 6.16 6.16 20245.42 5.47 5.52 5.57 5.63 5.68 5.73 5.79 5.84 5.89 5.95 6.00 6.05 6.10 6.16 6.16 20255.42 5.47 5.52 5.57 5.63 5.68 5.73 5.79 5.84 5.89 5.95 6.00 6.05 6.10 6.16 6.16 20265.42 5.47 5.52 5.57 5.63 5.68 5.73 5.79 5.84 5.89 5.95 6.00 6.05 6.10 6.16 6.16 20275.42 5.47 5.52 5.57 5.63 5.68 5.73 5.79 5.84 5.89 5.95 6.00 6.05 6.10 6.16 6.16 20285.42 5.47 5.52 5.57 5.63 5.68 5.73 5.79 5.84 5.89 5.95 6.00 6.05 6.10 6.16 6.16 20295.42 5.47 5.52 5.57 5.63 5.68 5.73 5.79 5.84 5.89 5.95 6.00 6.05 6.10 6.16 6.16 20305.42 5.47 5.52 5.57 5.63 5.68 5.73 5.79 5.84 5.89 5.95 6.00 6.05 6.10 6.16 6.16 20315.42 5.47 5.52 5.57 5.63 5.68 5.73 5.79 5.84 5.89 5.95 6.00 6.05 6.10 6.16 6.16 20325.42 5.47 5.52 5.57 5.63 5.68 5.73 5.79 5.84 5.89 5.95 6.00 6.05 6.10 6.16 6.16 20335.42 5.47 5.52 5.57 5.63 5.68 5.73 5.79 5.84 5.89 5.95 6.00 6.05 6.10 6.16 6.16 20345.42 5.47 5.52 5.57 5.63 5.68 5.73 5.79 5.84 5.89 5.95 6.00 6.05 6.10 6.16 6.16 20355.42 5.47 5.52 5.57 5.63 5.68 5.73 5.79 5.84 5.89 5.95 6.00 6.05 6.10 6.16 6.16 20365.42 5.47 5.52 5.57 5.63 5.68 5.73 5.79 5.84 5.89 5.95 6.00 6.05 6.10 6.16 6.16 20375.42 5.47 5.52 5.57 5.63 5.68 5.73 5.79 5.84 5.89 5.95 6.00 6.05 6.10 6.16 6.16 20385.42 5.47 5.52 5.57 5.63 5.68 5.73 5.79 5.84 5.89 5.95 6.00 6.05 6.10 6.16 6.16 20395.42 5.47 5.52 5.57 5.63 5.68 5.73 5.79 5.84 5.89 5.95 6.00 6.05 6.10 6.16 6.16 20405.42 5.47 5.52 5.57 5.63 5.68 5.73 5.79 5.84 5.89 5.95 6.00 6.05 6.10 6.16 6.16 20415.42 5.47 5.52 5.57 5.63 5.68 5.73 5.79 5.84 5.89 5.95 6.00 6.05 6.10 6.16 6.16 20425.42 5.47 5.52 5.57 5.63 5.68 5.73 5.79 5.84 5.89 5.95 6.00 6.05 6.10 6.16 6.16 20435.42 5.47 5.52 5.57 5.63 5.68 5.73 5.79 5.84 5.89 5.95 6.00 6.05 6.10 6.16 6.16 20445.42 5.47 5.52 5.57 5.63 5.68 5.73 5.79 5.84 5.89 5.95 6.00 6.05 6.10 6.16 6.16 20455.42 5.47 5.52 5.57 5.63 5.68 5.73 5.79 5.84 5.89 5.95 6.00 6.05 6.10 6.16 6.16 2046
1/ Global Insight: The U.S. Economy: 30 Year Focus, August 2016 Forecast, Base Case.
Maturity
Fiscal Years 2017-2046
BPA FY 2017 BPA Borrowing Rates - Callable at Par 1/Table 8
BP-18-FS-BPA-02A Page 56

Year 1 Year 2 Year 3 Year 4 Year 5 Year 6 Year 7 Year 8 Year 9 Year 10 Year 11 Year 12 Year 13 Year 14 Year 15 Year
2017 1.63 1.90 2.15 2.39 2.64 2.81 2.98 3.16 3.33 3.50 3.56 3.61 3.66 3.72 3.772018 2.47 2.64 2.81 2.97 3.14 3.32 3.50 3.68 3.86 4.05 4.10 4.15 4.20 4.25 4.302019 3.67 3.77 3.87 3.96 4.05 4.23 4.41 4.59 4.77 4.95 4.99 5.04 5.08 5.13 5.182020 4.27 4.32 4.41 4.50 4.59 4.76 4.93 5.10 5.27 5.44 5.48 5.52 5.57 5.61 5.652021 4.37 4.40 4.50 4.59 4.69 4.85 5.02 5.19 5.35 5.52 5.57 5.61 5.65 5.70 5.742022 4.37 4.40 4.50 4.59 4.69 4.85 5.02 5.19 5.35 5.52 5.57 5.61 5.65 5.70 5.742023 4.37 4.40 4.50 4.59 4.69 4.85 5.02 5.19 5.35 5.52 5.57 5.61 5.65 5.70 5.742024 4.37 4.40 4.50 4.59 4.69 4.85 5.02 5.19 5.35 5.52 5.57 5.61 5.65 5.70 5.742025 4.37 4.40 4.50 4.59 4.69 4.85 5.02 5.19 5.35 5.52 5.57 5.61 5.65 5.70 5.742026 4.37 4.40 4.50 4.59 4.69 4.85 5.02 5.19 5.35 5.52 5.57 5.61 5.65 5.70 5.742027 4.37 4.40 4.50 4.59 4.69 4.85 5.02 5.19 5.35 5.52 5.57 5.61 5.65 5.70 5.742028 4.37 4.40 4.50 4.59 4.69 4.85 5.02 5.19 5.35 5.52 5.57 5.61 5.65 5.70 5.742029 4.37 4.40 4.50 4.59 4.69 4.85 5.02 5.19 5.35 5.52 5.57 5.61 5.65 5.70 5.742030 4.37 4.40 4.50 4.59 4.69 4.85 5.02 5.19 5.35 5.52 5.57 5.61 5.65 5.70 5.742031 4.37 4.40 4.50 4.59 4.69 4.85 5.02 5.19 5.35 5.52 5.57 5.61 5.65 5.70 5.742032 4.37 4.40 4.50 4.59 4.69 4.85 5.02 5.19 5.35 5.52 5.57 5.61 5.65 5.70 5.742033 4.37 4.40 4.50 4.59 4.69 4.85 5.02 5.19 5.35 5.52 5.57 5.61 5.65 5.70 5.742034 4.37 4.40 4.50 4.59 4.69 4.85 5.02 5.19 5.35 5.52 5.57 5.61 5.65 5.70 5.742035 4.37 4.40 4.50 4.59 4.69 4.85 5.02 5.19 5.35 5.52 5.57 5.61 5.65 5.70 5.742036 4.37 4.40 4.50 4.59 4.69 4.85 5.02 5.19 5.35 5.52 5.57 5.61 5.65 5.70 5.742037 4.37 4.40 4.50 4.59 4.69 4.85 5.02 5.19 5.35 5.52 5.57 5.61 5.65 5.70 5.742038 4.37 4.40 4.50 4.59 4.69 4.85 5.02 5.19 5.35 5.52 5.57 5.61 5.65 5.70 5.742039 4.37 4.40 4.50 4.59 4.69 4.85 5.02 5.19 5.35 5.52 5.57 5.61 5.65 5.70 5.742040 4.37 4.40 4.50 4.59 4.69 4.85 5.02 5.19 5.35 5.52 5.57 5.61 5.65 5.70 5.742041 4.37 4.40 4.50 4.59 4.69 4.85 5.02 5.19 5.35 5.52 5.57 5.61 5.65 5.70 5.742042 4.37 4.40 4.50 4.59 4.69 4.85 5.02 5.19 5.35 5.52 5.57 5.61 5.65 5.70 5.742043 4.37 4.40 4.50 4.59 4.69 4.85 5.02 5.19 5.35 5.52 5.57 5.61 5.65 5.70 5.742044 4.37 4.40 4.50 4.59 4.69 4.85 5.02 5.19 5.35 5.52 5.57 5.61 5.65 5.70 5.742045 4.37 4.40 4.50 4.59 4.69 4.85 5.02 5.19 5.35 5.52 5.57 5.61 5.65 5.70 5.742046 4.37 4.40 4.50 4.59 4.69 4.85 5.02 5.19 5.35 5.52 5.57 5.61 5.65 5.70 5.74
1/ Global Insight: The U.S. Economy: 30 Year Focus, August 2016 Forecast, Base Case.
Table 9
BPA FY 2017 Third-Party Taxable Borrowing Rates 1/
Fiscal Years 2017-2046(continued on next page)
Maturity
BP-18-FS-BPA-02A Page 57

16 Year 17 Year 18 Year 19 Year 20 Year 21 Year 22 Year 23 Year 24 Year 25 Year 26 Year 27 Year 28 Year 29 Year 30 Year 50 Year Year
3.82 3.88 3.93 3.98 4.04 4.09 4.14 4.20 4.25 4.30 4.36 4.41 4.46 4.52 4.57 4.57 20174.35 4.40 4.45 4.50 4.56 4.61 4.66 4.71 4.76 4.81 4.86 4.91 4.96 5.01 5.07 5.07 20185.22 5.27 5.31 5.36 5.40 5.45 5.50 5.54 5.59 5.63 5.68 5.73 5.77 5.82 5.86 5.86 20195.70 5.74 5.78 5.83 5.87 5.92 5.96 6.00 6.05 6.09 6.13 6.18 6.22 6.26 6.31 6.31 20205.78 5.83 5.87 5.91 5.95 6.00 6.04 6.08 6.13 6.17 6.21 6.26 6.30 6.34 6.39 6.39 20215.78 5.83 5.87 5.91 5.95 6.00 6.04 6.08 6.13 6.17 6.21 6.26 6.30 6.34 6.39 6.39 20225.78 5.83 5.87 5.91 5.95 6.00 6.04 6.08 6.13 6.17 6.21 6.26 6.30 6.34 6.39 6.39 20235.78 5.83 5.87 5.91 5.95 6.00 6.04 6.08 6.13 6.17 6.21 6.26 6.30 6.34 6.39 6.39 20245.78 5.83 5.87 5.91 5.95 6.00 6.04 6.08 6.13 6.17 6.21 6.26 6.30 6.34 6.39 6.39 20255.78 5.83 5.87 5.91 5.95 6.00 6.04 6.08 6.13 6.17 6.21 6.26 6.30 6.34 6.39 6.39 20265.78 5.83 5.87 5.91 5.95 6.00 6.04 6.08 6.13 6.17 6.21 6.26 6.30 6.34 6.39 6.39 20275.78 5.83 5.87 5.91 5.95 6.00 6.04 6.08 6.13 6.17 6.21 6.26 6.30 6.34 6.39 6.39 20285.78 5.83 5.87 5.91 5.95 6.00 6.04 6.08 6.13 6.17 6.21 6.26 6.30 6.34 6.39 6.39 20295.78 5.83 5.87 5.91 5.95 6.00 6.04 6.08 6.13 6.17 6.21 6.26 6.30 6.34 6.39 6.39 20305.78 5.83 5.87 5.91 5.95 6.00 6.04 6.08 6.13 6.17 6.21 6.26 6.30 6.34 6.39 6.39 20315.78 5.83 5.87 5.91 5.95 6.00 6.04 6.08 6.13 6.17 6.21 6.26 6.30 6.34 6.39 6.39 20325.78 5.83 5.87 5.91 5.95 6.00 6.04 6.08 6.13 6.17 6.21 6.26 6.30 6.34 6.39 6.39 20335.78 5.83 5.87 5.91 5.95 6.00 6.04 6.08 6.13 6.17 6.21 6.26 6.30 6.34 6.39 6.39 20345.78 5.83 5.87 5.91 5.95 6.00 6.04 6.08 6.13 6.17 6.21 6.26 6.30 6.34 6.39 6.39 20355.78 5.83 5.87 5.91 5.95 6.00 6.04 6.08 6.13 6.17 6.21 6.26 6.30 6.34 6.39 6.39 20365.78 5.83 5.87 5.91 5.95 6.00 6.04 6.08 6.13 6.17 6.21 6.26 6.30 6.34 6.39 6.39 20375.78 5.83 5.87 5.91 5.95 6.00 6.04 6.08 6.13 6.17 6.21 6.26 6.30 6.34 6.39 6.39 20385.78 5.83 5.87 5.91 5.95 6.00 6.04 6.08 6.13 6.17 6.21 6.26 6.30 6.34 6.39 6.39 20395.78 5.83 5.87 5.91 5.95 6.00 6.04 6.08 6.13 6.17 6.21 6.26 6.30 6.34 6.39 6.39 20405.78 5.83 5.87 5.91 5.95 6.00 6.04 6.08 6.13 6.17 6.21 6.26 6.30 6.34 6.39 6.39 20415.78 5.83 5.87 5.91 5.95 6.00 6.04 6.08 6.13 6.17 6.21 6.26 6.30 6.34 6.39 6.39 20425.78 5.83 5.87 5.91 5.95 6.00 6.04 6.08 6.13 6.17 6.21 6.26 6.30 6.34 6.39 6.39 20435.78 5.83 5.87 5.91 5.95 6.00 6.04 6.08 6.13 6.17 6.21 6.26 6.30 6.34 6.39 6.39 20445.78 5.83 5.87 5.91 5.95 6.00 6.04 6.08 6.13 6.17 6.21 6.26 6.30 6.34 6.39 6.39 20455.78 5.83 5.87 5.91 5.95 6.00 6.04 6.08 6.13 6.17 6.21 6.26 6.30 6.34 6.39 6.39 2046
1/ Global Insight: The U.S. Economy: 30 Year Focus, August 2016 Forecast, Base Case.
BPA FY 2017 Third-Party Taxable Borrowing Rates 1/Table 9
Maturity
Fiscal Years 2017-2046
BP-18-FS-BPA-02A Page 58

Year 1 Year 2 Year 3 Year 4 Year 5 Year 6 Year 7 Year 8 Year 9 Year 10 Year 11 Year 12 Year 13 Year 14 Year 15 Year
2017 1.01 1.18 1.33 1.47 1.62 1.78 1.94 2.10 2.26 2.42 2.47 2.52 2.57 2.63 2.682018 1.51 1.63 1.72 1.81 1.90 2.08 2.26 2.43 2.61 2.79 2.84 2.89 2.94 2.99 3.042019 2.24 2.33 2.38 2.44 2.49 2.68 2.87 3.07 3.26 3.45 3.50 3.55 3.60 3.64 3.692020 2.61 2.67 2.72 2.77 2.83 3.02 3.22 3.41 3.60 3.80 3.85 3.90 3.94 3.99 4.042021 2.67 2.72 2.78 2.83 2.89 3.08 3.28 3.47 3.66 3.86 3.91 3.96 4.01 4.05 4.102022 2.67 2.72 2.78 2.83 2.89 3.08 3.28 3.47 3.66 3.86 3.91 3.96 4.01 4.05 4.102023 2.67 2.72 2.78 2.83 2.89 3.08 3.28 3.47 3.66 3.86 3.91 3.96 4.01 4.05 4.102024 2.67 2.72 2.78 2.83 2.89 3.08 3.28 3.47 3.66 3.86 3.91 3.96 4.01 4.05 4.102025 2.67 2.72 2.78 2.83 2.89 3.08 3.28 3.47 3.66 3.86 3.91 3.96 4.01 4.05 4.102026 2.67 2.72 2.78 2.83 2.89 3.08 3.28 3.47 3.66 3.86 3.91 3.96 4.01 4.05 4.102027 2.67 2.72 2.78 2.83 2.89 3.08 3.28 3.47 3.66 3.86 3.91 3.96 4.01 4.05 4.102028 2.67 2.72 2.78 2.83 2.89 3.08 3.28 3.47 3.66 3.86 3.91 3.96 4.01 4.05 4.102029 2.67 2.72 2.78 2.83 2.89 3.08 3.28 3.47 3.66 3.86 3.91 3.96 4.01 4.05 4.102030 2.67 2.72 2.78 2.83 2.89 3.08 3.28 3.47 3.66 3.86 3.91 3.96 4.01 4.05 4.102031 2.67 2.72 2.78 2.83 2.89 3.08 3.28 3.47 3.66 3.86 3.91 3.96 4.01 4.05 4.102032 2.67 2.72 2.78 2.83 2.89 3.08 3.28 3.47 3.66 3.86 3.91 3.96 4.01 4.05 4.102033 2.67 2.72 2.78 2.83 2.89 3.08 3.28 3.47 3.66 3.86 3.91 3.96 4.01 4.05 4.102034 2.67 2.72 2.78 2.83 2.89 3.08 3.28 3.47 3.66 3.86 3.91 3.96 4.01 4.05 4.102035 2.67 2.72 2.78 2.83 2.89 3.08 3.28 3.47 3.66 3.86 3.91 3.96 4.01 4.05 4.102036 2.67 2.72 2.78 2.83 2.89 3.08 3.28 3.47 3.66 3.86 3.91 3.96 4.01 4.05 4.102037 2.67 2.72 2.78 2.83 2.89 3.08 3.28 3.47 3.66 3.86 3.91 3.96 4.01 4.05 4.102038 2.67 2.72 2.78 2.83 2.89 3.08 3.28 3.47 3.66 3.86 3.91 3.96 4.01 4.05 4.102039 2.67 2.72 2.78 2.83 2.89 3.08 3.28 3.47 3.66 3.86 3.91 3.96 4.01 4.05 4.102040 2.67 2.72 2.78 2.83 2.89 3.08 3.28 3.47 3.66 3.86 3.91 3.96 4.01 4.05 4.102041 2.67 2.72 2.78 2.83 2.89 3.08 3.28 3.47 3.66 3.86 3.91 3.96 4.01 4.05 4.102042 2.67 2.72 2.78 2.83 2.89 3.08 3.28 3.47 3.66 3.86 3.91 3.96 4.01 4.05 4.102043 2.67 2.72 2.78 2.83 2.89 3.08 3.28 3.47 3.66 3.86 3.91 3.96 4.01 4.05 4.102044 2.67 2.72 2.78 2.83 2.89 3.08 3.28 3.47 3.66 3.86 3.91 3.96 4.01 4.05 4.102045 2.67 2.72 2.78 2.83 2.89 3.08 3.28 3.47 3.66 3.86 3.91 3.96 4.01 4.05 4.102046 2.67 2.72 2.78 2.83 2.89 3.08 3.28 3.47 3.66 3.86 3.91 3.96 4.01 4.05 4.10
1/ Global Insight: The U.S. Economy: 30 Year Focus, August 2016 Forecast, Base Case.
Maturity
Table 10
BPA FY 2017 Third-Party Tax-Exempt Borrowing Rates 1/
Fiscal Years 2017-2046(continued on next page)
BP-18-FS-BPA-02A Page 59

16 Year 17 Year 18 Year 19 Year 20 Year 21 Year 22 Year 23 Year 24 Year 25 Year 26 Year 27 Year 28 Year 29 Year 30 Year 50 Year Year
2.73 2.79 2.84 2.89 2.94 3.00 3.05 3.10 3.15 3.21 3.26 3.31 3.36 3.42 3.47 3.47 20173.09 3.14 3.19 3.24 3.29 3.34 3.39 3.44 3.49 3.55 3.60 3.65 3.70 3.75 3.80 3.80 20183.74 3.79 3.84 3.89 3.94 3.99 4.04 4.09 4.14 4.19 4.23 4.28 4.33 4.38 4.43 4.43 20194.09 4.14 4.19 4.24 4.29 4.34 4.39 4.43 4.48 4.53 4.58 4.63 4.68 4.73 4.78 4.78 20204.15 4.20 4.25 4.30 4.35 4.40 4.45 4.50 4.54 4.59 4.64 4.69 4.74 4.79 4.84 4.84 20214.15 4.20 4.25 4.30 4.35 4.40 4.45 4.50 4.54 4.59 4.64 4.69 4.74 4.79 4.84 4.84 20224.15 4.20 4.25 4.30 4.35 4.40 4.45 4.50 4.54 4.59 4.64 4.69 4.74 4.79 4.84 4.84 20234.15 4.20 4.25 4.30 4.35 4.40 4.45 4.50 4.54 4.59 4.64 4.69 4.74 4.79 4.84 4.84 20244.15 4.20 4.25 4.30 4.35 4.40 4.45 4.50 4.54 4.59 4.64 4.69 4.74 4.79 4.84 4.84 20254.15 4.20 4.25 4.30 4.35 4.40 4.45 4.50 4.54 4.59 4.64 4.69 4.74 4.79 4.84 4.84 20264.15 4.20 4.25 4.30 4.35 4.40 4.45 4.50 4.54 4.59 4.64 4.69 4.74 4.79 4.84 4.84 20274.15 4.20 4.25 4.30 4.35 4.40 4.45 4.50 4.54 4.59 4.64 4.69 4.74 4.79 4.84 4.84 20284.15 4.20 4.25 4.30 4.35 4.40 4.45 4.50 4.54 4.59 4.64 4.69 4.74 4.79 4.84 4.84 20294.15 4.20 4.25 4.30 4.35 4.40 4.45 4.50 4.54 4.59 4.64 4.69 4.74 4.79 4.84 4.84 20304.15 4.20 4.25 4.30 4.35 4.40 4.45 4.50 4.54 4.59 4.64 4.69 4.74 4.79 4.84 4.84 20314.15 4.20 4.25 4.30 4.35 4.40 4.45 4.50 4.54 4.59 4.64 4.69 4.74 4.79 4.84 4.84 20324.15 4.20 4.25 4.30 4.35 4.40 4.45 4.50 4.54 4.59 4.64 4.69 4.74 4.79 4.84 4.84 20334.15 4.20 4.25 4.30 4.35 4.40 4.45 4.50 4.54 4.59 4.64 4.69 4.74 4.79 4.84 4.84 20344.15 4.20 4.25 4.30 4.35 4.40 4.45 4.50 4.54 4.59 4.64 4.69 4.74 4.79 4.84 4.84 20354.15 4.20 4.25 4.30 4.35 4.40 4.45 4.50 4.54 4.59 4.64 4.69 4.74 4.79 4.84 4.84 20364.15 4.20 4.25 4.30 4.35 4.40 4.45 4.50 4.54 4.59 4.64 4.69 4.74 4.79 4.84 4.84 20374.15 4.20 4.25 4.30 4.35 4.40 4.45 4.50 4.54 4.59 4.64 4.69 4.74 4.79 4.84 4.84 20384.15 4.20 4.25 4.30 4.35 4.40 4.45 4.50 4.54 4.59 4.64 4.69 4.74 4.79 4.84 4.84 20394.15 4.20 4.25 4.30 4.35 4.40 4.45 4.50 4.54 4.59 4.64 4.69 4.74 4.79 4.84 4.84 20404.15 4.20 4.25 4.30 4.35 4.40 4.45 4.50 4.54 4.59 4.64 4.69 4.74 4.79 4.84 4.84 20414.15 4.20 4.25 4.30 4.35 4.40 4.45 4.50 4.54 4.59 4.64 4.69 4.74 4.79 4.84 4.84 20424.15 4.20 4.25 4.30 4.35 4.40 4.45 4.50 4.54 4.59 4.64 4.69 4.74 4.79 4.84 4.84 20434.15 4.20 4.25 4.30 4.35 4.40 4.45 4.50 4.54 4.59 4.64 4.69 4.74 4.79 4.84 4.84 20444.15 4.20 4.25 4.30 4.35 4.40 4.45 4.50 4.54 4.59 4.64 4.69 4.74 4.79 4.84 4.84 20454.15 4.20 4.25 4.30 4.35 4.40 4.45 4.50 4.54 4.59 4.64 4.69 4.74 4.79 4.84 4.84 2046
1/ Global Insight: The U.S. Economy: 30 Year Focus, August 2016 Forecast, Base Case.
Maturity
Fiscal Years 2017-2046
BPA FY 2017 Third-Party Tax-Exempt Borrowing Rates 1/Table 10
BP-18-FS-BPA-02A Page 60

A BFERC Rate FERC Rate
Year Calendar Year Fiscal Year
2017 3.97 4.012018 4.72 4.532019 5.65 5.422020 6.00 5.912021 6.00 6.002022 6.00 6.002023 6.00 6.002024 6.00 6.002025 6.00 6.002026 6.00 6.002027 6.00 6.002028 6.00 6.002029 6.00 6.002030 6.00 6.002031 6.00 6.002032 6.00 6.002033 6.00 6.002034 6.00 6.002035 6.00 6.002036 6.00 6.002037 6.00 6.002038 6.00 6.002039 6.00 6.002040 6.00 6.002041 6.00 6.002042 6.00 6.002043 6.00 6.002044 6.00 6.002045 6.00 6.002046 6.00 6.00
1/ Global Insight: The U.S. Economy: 30 Year Focus, August 2016 Forecast, Base Case.
Table 11
BPA FY 2017 FERC Borrowing Rates (Bank Prime) 1/
Calendar/Fiscal Years 2017-2046
BP-18-FS-BPA-02A Page 61

A B3-Mo LIBOR 3-Mo LIBOR
Year Calendar Year Fiscal Year
2017 1.20 1.252018 2.02 1.812019 2.97 2.732020 3.29 3.212021 3.29 3.292022 3.29 3.292023 3.29 3.292024 3.29 3.292025 3.29 3.292026 3.29 3.292027 3.29 3.292028 3.29 3.292029 3.29 3.292030 3.29 3.292031 3.29 3.292032 3.29 3.292033 3.29 3.292034 3.29 3.292035 3.29 3.292036 3.29 3.292037 3.29 3.292038 3.29 3.292039 3.29 3.292040 3.29 3.292041 3.29 3.292042 3.29 3.292043 3.29 3.292044 3.29 3.292045 3.29 3.292046 3.29 3.29
1/ Global Insight: The U.S. Economy: 30 Year Focus, August 2016 Forecast, Base Case.
BPA FY 2017 May 3 Month LIBOR Rates 1/
Calendar/Fiscal Years 2017-2046
Table 12
BP-18-FS-BPA-02A Page 62

A B C D E F GCY 2017 1/ FY 2017 1/ FY 2017 2/ FY 2016 3/ FY 2016 3/
Calendar Year Fiscal Year Fiscal Year Fiscal Year Fiscal Year Change in the Change in the GDP Price GDP Price Cumulative GDP Price Cumulative GDP Price Cumulative
YEAR Deflator Deflator Price Deflator Deflator Price Deflator Deflator Price Deflator(%) (%) (Base Year 2016) (%) (Base Year 2015) (B-D) (C-E)
2017 2.15% 1.97% 1.010 1.81% 1.026 0.16% -0.0162018 2.08% 2.10% 1.031 1.84% 1.045 0.26% -0.0142019 2.06% 2.07% 1.052 1.90% 1.065 0.17% -0.0122020 2.11% 2.10% 1.074 1.97% 1.086 0.14% -0.0112021 2.11% 2.11% 1.097 2.04% 1.108 0.07% -0.0112022 2.05% 2.07% 1.120 2.11% 1.131 -0.04% -0.0112023 2.02% 2.03% 1.143 2.12% 1.155 -0.09% -0.0132024 2.00% 2.00% 1.165 2.10% 1.179 -0.09% -0.0142025 2.01% 2.01% 1.189 2.10% 1.204 -0.09% -0.0152026 2.00% 2.00% 1.213 2.12% 1.230 -0.12% -0.0172027 2.04% 2.03% 1.237 2.14% 1.256 -0.11% -0.0192028 2.00% 2.01% 1.262 2.14% 1.283 -0.12% -0.0212029 2.02% 2.02% 1.288 2.15% 1.310 -0.13% -0.0232030 2.06% 2.05% 1.314 2.16% 1.339 -0.11% -0.0252031 2.10% 2.09% 1.342 2.22% 1.368 -0.12% -0.0272032 2.11% 2.11% 1.370 2.23% 1.399 -0.12% -0.0292033 2.12% 2.11% 1.399 2.23% 1.430 -0.12% -0.0312034 2.11% 2.11% 1.428 2.25% 1.462 -0.13% -0.0342035 2.10% 2.11% 1.458 2.23% 1.495 -0.12% -0.0362036 2.11% 2.11% 1.489 2.22% 1.528 -0.12% -0.0392037 2.10% 2.10% 1.520 2.23% 1.562 -0.13% -0.0422038 2.11% 2.11% 1.553 2.25% 1.597 -0.14% -0.0452039 2.12% 2.11% 1.585 2.27% 1.633 -0.15% -0.0482040 2.11% 2.11% 1.619 2.28% 1.671 -0.16% -0.0522041 2.13% 2.12% 1.653 2.30% 1.709 -0.17% -0.0562042 2.13% 2.13% 1.688 2.32% 1.749 -0.19% -0.0602043 2.13% 2.13% 1.724 2.34% 1.789 -0.21% -0.0652044 2.13% 2.13% 1.761 2.36% 1.832 -0.23% -0.0702045 2.12% 2.12% 1.799 2.37% 1.875 -0.25% -0.0762046 2.12% 2.12% 1.837
3/ Global Insight: The U.S. Economy: 30 Year Focus, August 2015 Forecast, Base Case.
2/ Fiscal Year Cumulative Price Deflator escalates to midyear dollars. The first year, 2017, is determined as follows: 1.010={(1.97/100)*.5}+1. An example of subsequent year cumulative growth, such as in 2018, is found as: 1.031={1+(2.10/100)}*1.010
Table 13
Comparison of FY 2017 Inflation Forecast ComponentsCalendar/Fiscal Year Forecasts 2017 vs. 2016
Calendar/Fiscal Years 2017-2046
1/ Global Insight: The U.S. Economy: 30 Year Focus, August 2016 Forecast, Base Case.
BP-18-FS-BPA-02A Page 63

7. PROJECTED BONDS ISSUED TO TREASURY
7.1 Introduction
This chapter documents all the bonds that BPA has issued and those it projects it will issue to the U.S. Treasury to finance BPA capital investments and Reclamation/Corps investments that will be direct-funded by BPA. 7.2 Issuing Bonds
BPA primarily funds capital outlays by issuing new long-term debt in the form of bonds issued to the U.S. Treasury. BPA issues four types of bonds for Power Services: Construction, Conservation Fish and Wildlife/Environment, and Reclamation/Corps direct-funded. Construction bonds included in the generation study are the portions of bonds that fund furniture, information technology (IT) hardware and software for PS. (Construction bonds are also issued to fund capital expenditures of the transmission function including IT hardware and software and furniture.) Conservation bonds, which will no longer be issued after the conclusion of FY 2015, are used to fund investments in energy efficiency projects. Fish and Wildlife bonds are issued to fund the capital portion of BPA’s Fish and Wildlife program. Environment bonds are issued to fund work done by the Transmission Business Line and are not included in the generation repayment study. BPA also issues bonds to fund Reclamation/Corps generation efficiency and reliability improvements. All bonds projected for issuance have been entered into the generation repayment study. BPA no longer issues conservation bonds to fund the capital portion of BPA’s conservation program. Instead, the program is treated as a current year expense. Reclamation/Corps direct funding bonds have a maximum maturity of 30 years although they may be issued for shorter durations or refinanced up to a maximum maturity of 45 years. Construction bonds are given a maximum repayment period of 6 years. Conservation bonds, issued through FY 2015, have a maximum maturity of 12 years. Fish and Wildlife bonds have a maximum maturity of 15 years. New bonds are based on projected BPA and Reclamation/Corps capital program outlays. Maturities reflect decisions about debt placement. The assignment practices for interest rates are discussed in Chapter 2 of the Study. The interest rates used are in Chapter 6 of this document.
BP-18-FS-BPA-02A Page 64
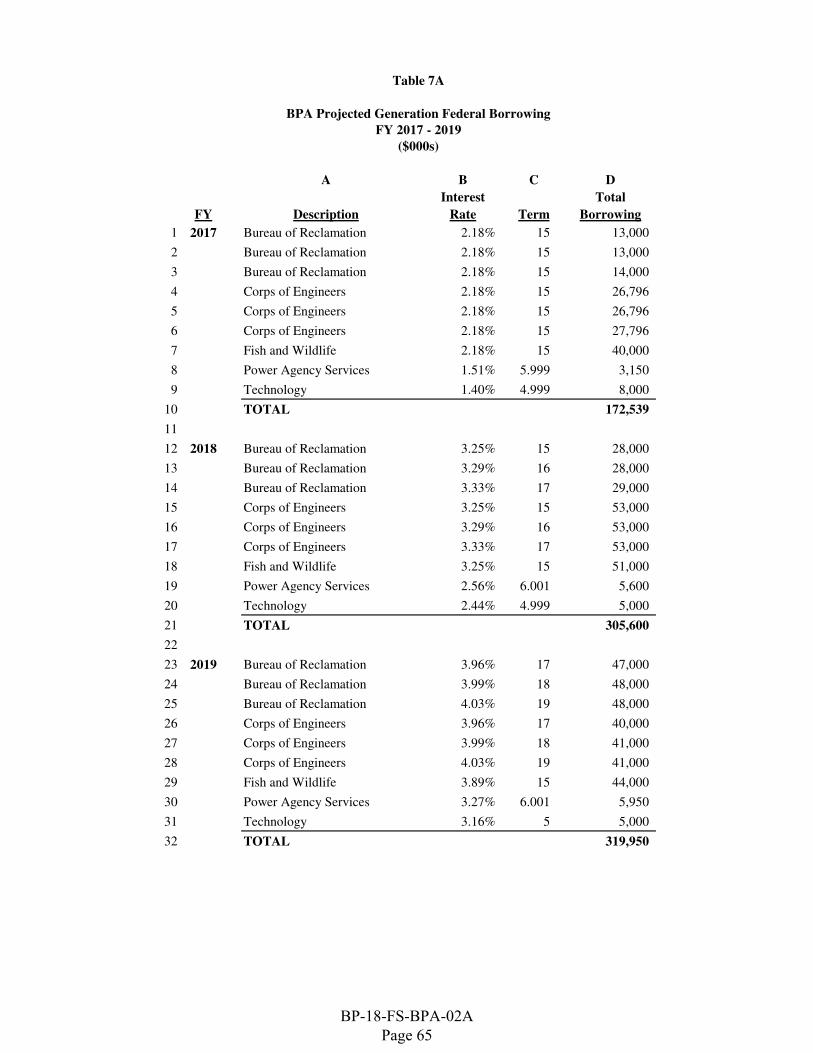
A B C D
Interest Total
FY Description Rate Term Borrowing
1 2017 Bureau of Reclamation 2.18% 15 13,000
2 Bureau of Reclamation 2.18% 15 13,000
3 Bureau of Reclamation 2.18% 15 14,000
4 Corps of Engineers 2.18% 15 26,796
5 Corps of Engineers 2.18% 15 26,796
6 Corps of Engineers 2.18% 15 27,796
7 Fish and Wildlife 2.18% 15 40,000
8 Power Agency Services 1.51% 5.999 3,150
9 Technology 1.40% 4.999 8,000
10 TOTAL 172,539
11
12 2018 Bureau of Reclamation 3.25% 15 28,000
13 Bureau of Reclamation 3.29% 16 28,000
14 Bureau of Reclamation 3.33% 17 29,000
15 Corps of Engineers 3.25% 15 53,000
16 Corps of Engineers 3.29% 16 53,000
17 Corps of Engineers 3.33% 17 53,000
18 Fish and Wildlife 3.25% 15 51,000
19 Power Agency Services 2.56% 6.001 5,600
20 Technology 2.44% 4.999 5,000
21 TOTAL 305,600
22
23 2019 Bureau of Reclamation 3.96% 17 47,000
24 Bureau of Reclamation 3.99% 18 48,000
25 Bureau of Reclamation 4.03% 19 48,000
26 Corps of Engineers 3.96% 17 40,000
27 Corps of Engineers 3.99% 18 41,000
28 Corps of Engineers 4.03% 19 41,000
29 Fish and Wildlife 3.89% 15 44,000
30 Power Agency Services 3.27% 6.001 5,950
31 Technology 3.16% 5 5,000
32 TOTAL 319,950
($000s)
Table 7A
BPA Projected Generation Federal Borrowing
FY 2017 - 2019
BP-18-FS-BPA-02A Page 65

8. CAPITALIZED CONTRACTS AND OTHER LONG TERM RESOURCE
ACQUISITION OBLIGATIONS
8.1 Introduction
This chapter documents the data on third-party debt service or payment costs associated with capitalized contracts and other long-term, fixed contractual obligations. This chapter does not include replacements for the Columbia Generating Station (CGS). This information is included in Chapter 10 of this document. 8.2 Methodology
To determine debt service streams for EN Nuclear Projects WNP-1, CGS, and WNP-3, BPA uses a commercial municipal bond debt management model, DBC Debt Manager. All base debt service streams shown in Tables 8A are based on the amount of non-Federal debt outstanding. The debt service streams reflect all EN refinancings to date and projected CGS capital investments. CGS debt service is displayed net of anticipated revenues expected from the Tennessee Valley Authority for the purchase of nuclear fuel from EN. Debt service streams are derived from such sources as Official Statements, Agency agreements, Agency contracts, and budgetary data.
BP-18-FS-BPA-02A Page 66

A B C D E F G H I J K L M
2018 2019 2020 2021 2022 2023 2024 2025 2026 2027 2028 2029 2030
1 WNP-1 60,431 40,738 40,572 39,322 39,322 39,322 98,564 267,082 228,508 190,536 130,251 - -
2 CGS 369,867 531,980 464,454 455,106 432,434 383,703 314,731 91,786 96,263 107,707 150,092 214,422 346,710
3 CGS Adjustments (4,067) (4,067) (4,015) (3,803) (3,577) (3,230) (2,041) - - - - - -
4 CGS Expenses (2,813) 179 176 175 173 172 128 - - - - - -
5 TVA Revenue Offset (178,250) (189,500) (72,500) (81,000) (49,500)
6 CGS Total 184,737 338,592 388,115 370,478 379,530 380,645 312,818 91,786 96,263 107,707 150,092 214,422 346,710
7 WNP-3 236,158 32,139 31,476 40,911 63,733 39,131 57,226 142,920 153,105 192,381 242,334 - -
8 Wasco 1,934 1,932 1,937 1,948 1,950 1,947 1,947 331 - - - - -
9 Cowlitz 7,302 7,304 7,301 7,300 7,299 7,303 7,301 7,302 7,300 7,304 7,299 7,299 7,304
10 Total 490,562 420,704 469,402 459,959 491,835 468,348 477,856 509,421 485,176 497,927 529,976 221,722 354,014
Table 8A
($000s)
Capitalized Contracts
BP-18-FS-BPA-02A Page 67

9. IRRIGATION ASSISTANCE
9.1 Introduction
This chapter documents the irrigation construction costs for Federal reclamation projects in the Pacific Northwest that the FCRPS has an obligation to repay. These payments, known as irrigation assistance, have been included in the repayment study. 9.2 Background
In an effort to encourage settlement of the arid and semiarid lands of the Western United States, the 1902 Reclamation Act created the Reclamation to develop water resources for irrigation. The 1902 Reclamation Act provided that irrigators using the reclamation projects had 10 years to repay the construction costs of such projects. Title to the reclamation projects, however, remained with the Federal government even after all construction costs were repaid. By the 1920s, a 10-year repayment period for irrigators was determined to be economically unrealistic. After several leniency acts and extensions, Congress passed the 1939 Reclamation Act, which changed the repayment period on reclamation projects to 40 years after a 10-year development period. Later revisions and project-specific legislation extended repayment periods for most reclamation projects to 50 years after a 10-year development period. However, the Kennewick project has a 66-year repayment period. Originally, irrigators were responsible for repaying all project construction costs without interest. However, hydropower is a by-product of many reclamation projects and not all of the power generated is needed for irrigation works. As early as the Town Sites and Power Development Act (April 16, 1906, ch. 1631, 34 Stat. 116) Congress authorized Reclamation to lease surplus power and use the proceeds to repay part of the costs of the reclamation projects. The concept of power revenues contributing to the repayment of Reclamation’s multipurpose projects evolved to the current policy, in which power revenues are used to repay that portion of the project construction costs allocated to irrigation use that are beyond the irrigators' "ability to repay." Moreover, the costs to be repaid by power revenues, known as irrigation assistance, are to be repaid without interest. Reclamation has the responsibility to make the determination of the amount that is beyond the irrigators' "ability to repay" through a farm budget analysis. The results of this analysis are used to establish the irrigators' repayment responsibility. The irrigators, as an irrigation district, and Reclamation formalize this repayment responsibility in irrigation contracts. 9.3 Irrigation Repayment
In the Pacific Northwest, the Third Powerplant, Grand Coulee Dam legislation, P.L. 89-448, authorized repayment of the irrigation assistance costs from net revenues of the entire FCRPS. There are, however, limitations on the FCRPS's repayment responsibility. These limitations were added in amendment to the Third Powerplant, Grand Coulee Dam legislation, P.L. 89-561, and apply to reclamation projects, including projects not previously receiving similar assistance, which are authorized to receive such assistance, for which construction was authorized after September 7, 1966.
BP-18-FS-BPA-02A Page 68
The irrigation assistance for such projects is to be paid only from net revenues of the power system. Net revenues are defined as those revenues over and above the amount needed to recover all costs allocated to power, including the cost of acquiring power by purchase or exchange, and previously authorized irrigation assistance. The construction of such projects shall be scheduled so that the repayment of the irrigation assistance associated with such projects from power revenues will not require an increase in BPA's power rates. The total of all irrigation assistance to be repaid from power revenues shall not average more than $30 million per year in any period of 20 consecutive years. Reclamation provides BPA with the irrigation assistance to be repaid from each reclamation project. The current generation repayment study includes information provided in July 2008. Because irrigation assistance costs are repaid without interest and BPA repays highest interest-bearing investment first, irrigation assistance is generally scheduled to be repaid in the last year of the repayment period for each reclamation project.
BP-18-FS-BPA-02A Page 69
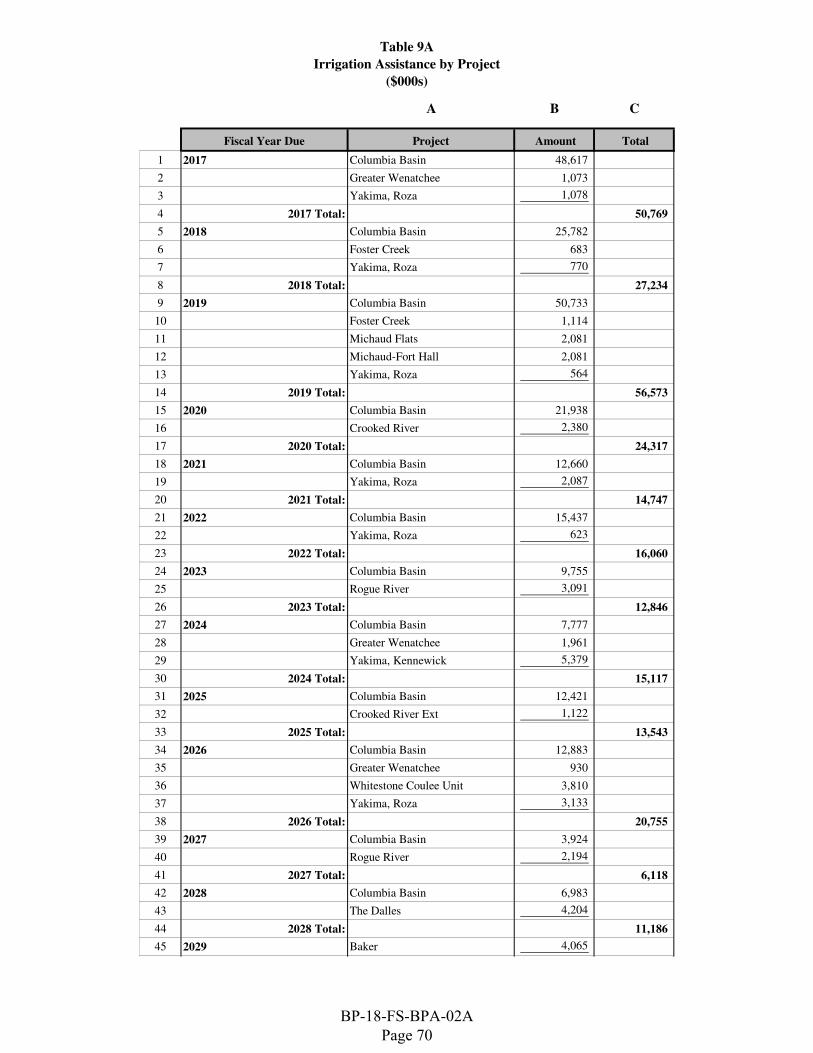
Table 9A
Irrigation Assistance by Project
($000s)
A B C
Fiscal Year Due Project Amount Total
1 2017 Columbia Basin 48,617
2 Greater Wenatchee 1,073
3 Yakima, Roza 1,078
4 2017 Total: 50,769
5 2018 Columbia Basin 25,782
6 Foster Creek 683
7 Yakima, Roza 770
8 2018 Total: 27,234
9 2019 Columbia Basin 50,733
10 Foster Creek 1,114
11 Michaud Flats 2,081
12 Michaud-Fort Hall 2,081
13 Yakima, Roza 564
14 2019 Total: 56,573
15 2020 Columbia Basin 21,938
16 Crooked River 2,380
17 2020 Total: 24,317
18 2021 Columbia Basin 12,660
19 Yakima, Roza 2,087
20 2021 Total: 14,747
21 2022 Columbia Basin 15,437
22 Yakima, Roza 623
23 2022 Total: 16,060
24 2023 Columbia Basin 9,755
25 Rogue River 3,091
26 2023 Total: 12,846
27 2024 Columbia Basin 7,777
28 Greater Wenatchee 1,961
29 Yakima, Kennewick 5,379
30 2024 Total: 15,117
31 2025 Columbia Basin 12,421
32 Crooked River Ext 1,122
33 2025 Total: 13,543
34 2026 Columbia Basin 12,883
35 Greater Wenatchee 930
36 Whitestone Coulee Unit 3,810
37 Yakima, Roza 3,133
38 2026 Total: 20,755
39 2027 Columbia Basin 3,924
40 Rogue River 2,194
41 2027 Total: 6,118
42 2028 Columbia Basin 6,983
43 The Dalles 4,204
44 2028 Total: 11,186
45 2029 Baker 4,065
BP-18-FS-BPA-02A Page 70
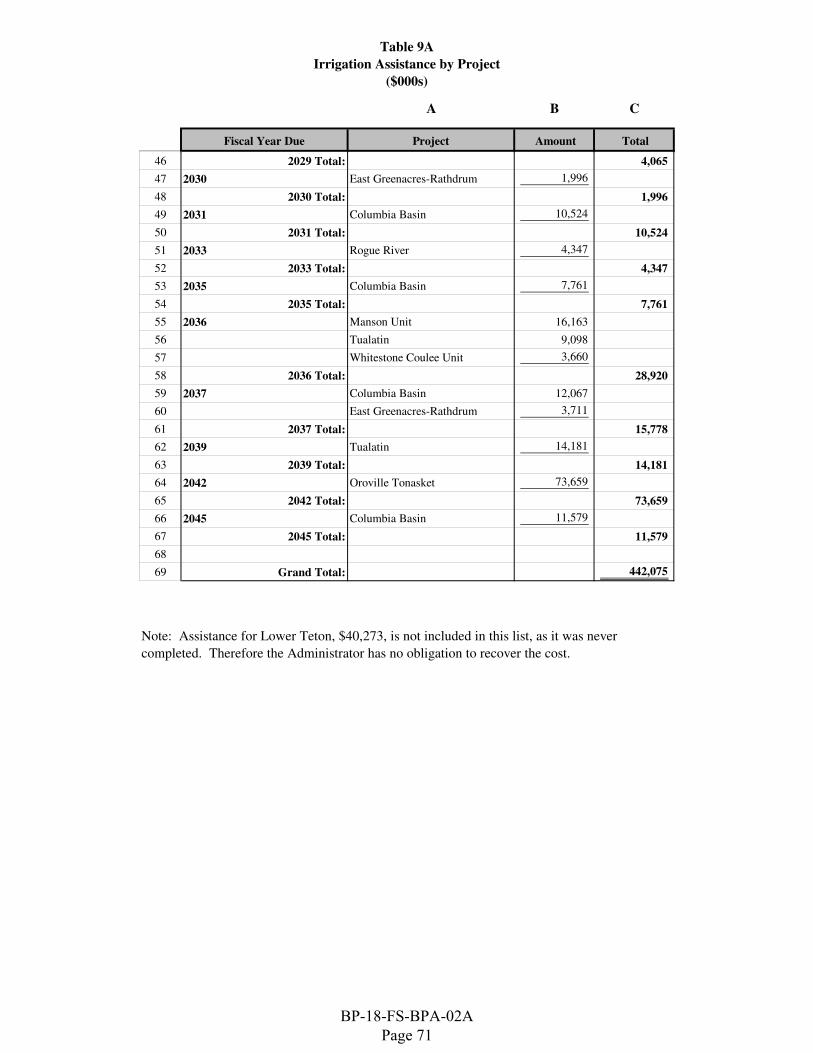
Table 9A
Irrigation Assistance by Project
($000s)
A B C
Fiscal Year Due Project Amount Total
46 2029 Total: 4,065
47 2030 East Greenacres-Rathdrum 1,996
48 2030 Total: 1,996
49 2031 Columbia Basin 10,524
50 2031 Total: 10,524
51 2033 Rogue River 4,347
52 2033 Total: 4,347
53 2035 Columbia Basin 7,761
54 2035 Total: 7,761
55 2036 Manson Unit 16,163
56 Tualatin 9,098
57 Whitestone Coulee Unit 3,660
58 2036 Total: 28,920
59 2037 Columbia Basin 12,067
60 East Greenacres-Rathdrum 3,711
61 2037 Total: 15,778
62 2039 Tualatin 14,181
63 2039 Total: 14,181
64 2042 Oroville Tonasket 73,659
65 2042 Total: 73,659
66 2045 Columbia Basin 11,579
67 2045 Total: 11,579
68
69 Grand Total: 442,075
Note: Assistance for Lower Teton, $40,273, is not included in this list, as it was never
completed. Therefore the Administrator has no obligation to recover the cost.
BP-18-FS-BPA-02A Page 71

10. REPLACEMENTS PROJECTED AFTER THE COST EVALUATION PERIOD
10.1 Introduction
This chapter documents the process used to develop the capital investments necessary to maintain the existing Federal generating projects at their current operating level during the repayment period. This chapter also includes replacement costs for CGS. Replacement forecasts are included in repayment studies as required by RA 6120.2. 10.2 Methodology
The repayment study incorporates a schedule of Federal investment with the replacements that are expected to occur over the repayment period for existing generation projects. This schedule, expressed in mid-year dollars for each repayment study, FY 2018 and 2019, is based on the amount of investment in the generating projects for the Corps and Reclamation through the end of the cost evaluation period. Replacements are based on data provided by BPA’s Federal Hydro Projects group, the organization responsible for managing the capital program that funds Corps and Reclamation powerhouse replacements. They prepare a project-by-project analysis of future funding requirements extending far into the future. The data are adjusted for several factors. First, adjustments are made to remove the effect of gaining efficiencies from replacing old equipment. The BPA Federal Hydro Projects group estimates that 12.5 percent of total costs reflect upgrades for efficiencies. Second, replacements exclude the portion of the budget for “small capital,” those investments outside of the powerhouses.
A schedule of replacement investments for CGS is based on the original investment adjusted by the use of the Handy-Whitman indices for a nuclear power plant. The Handy-Whitman Index is widely used in industry for estimating replacement costs for plant. The result of this calculation was converted into a mortgage-style investment with payments sufficient to retire the replacement cost in 37 years.
BP-18-FS-BPA-02A Page 72

Table 10A
Corps/Reclamation Replacments (FY 2016)
($000s)
A B C D
In Service Date Current Principal Interest Rate Due Date
1 2019 219,724 3.870% 2064
2 2020 219,724 3.870% 2065
3 2021 219,724 3.870% 2066
4 2022 219,724 3.870% 2067
5 2023 219,724 3.870% 2068
6 2024 219,724 3.870% 2069
7 2025 219,724 3.870% 2070
8 2026 219,724 3.870% 2071
9 2027 219,724 3.870% 2072
10 2028 219,724 3.870% 2073
11 2029 219,724 3.870% 2074
12 2030 219,724 3.870% 2075
13 2031 219,724 3.870% 2076
14 2032 219,724 3.870% 2077
15 2033 219,724 3.870% 2078
16 2034 219,724 3.870% 2079
17 2035 219,724 3.870% 2080
18 2036 219,724 3.870% 2081
19 2037 219,724 3.870% 2082
20 2038 219,724 3.870% 2083
21 2039 219,724 3.870% 2084
22 2040 219,724 3.870% 2085
23 2041 219,724 3.870% 2086
24 2042 219,724 3.870% 2087
25 2043 219,724 3.870% 2088
26 2044 219,724 3.870% 2089
27 2045 219,724 3.870% 2090
28 2046 219,724 3.870% 2091
29 2047 219,724 3.870% 2092
30 2048 219,724 3.870% 2093
31 2049 219,724 3.870% 2094
32 2050 219,724 3.870% 2095
33 2051 219,724 3.870% 2096
34 2052 219,724 3.870% 2097
35 2053 219,724 3.870% 2098
36 2054 219,724 3.870% 2099
37 2055 219,724 3.870% 2100
38 2056 219,724 3.870% 2101
39 2057 219,724 3.870% 2102
40 2058 219,724 3.870% 2103
41 2059 219,724 3.870% 2104
42 2060 219,724 3.870% 2105
43 2061 219,724 3.870% 2106
44 2062 219,724 3.870% 2107
45 2063 219,724 3.870% 2108
46 2064 219,724 3.870% 2109
47 2065 219,724 3.870% 2110
48 2066 219,724 3.870% 2111
49 2067 219,724 3.870% 2112
50 2068 219,724 3.870% 2113
BP-18-FS-BPA-02A Page 73
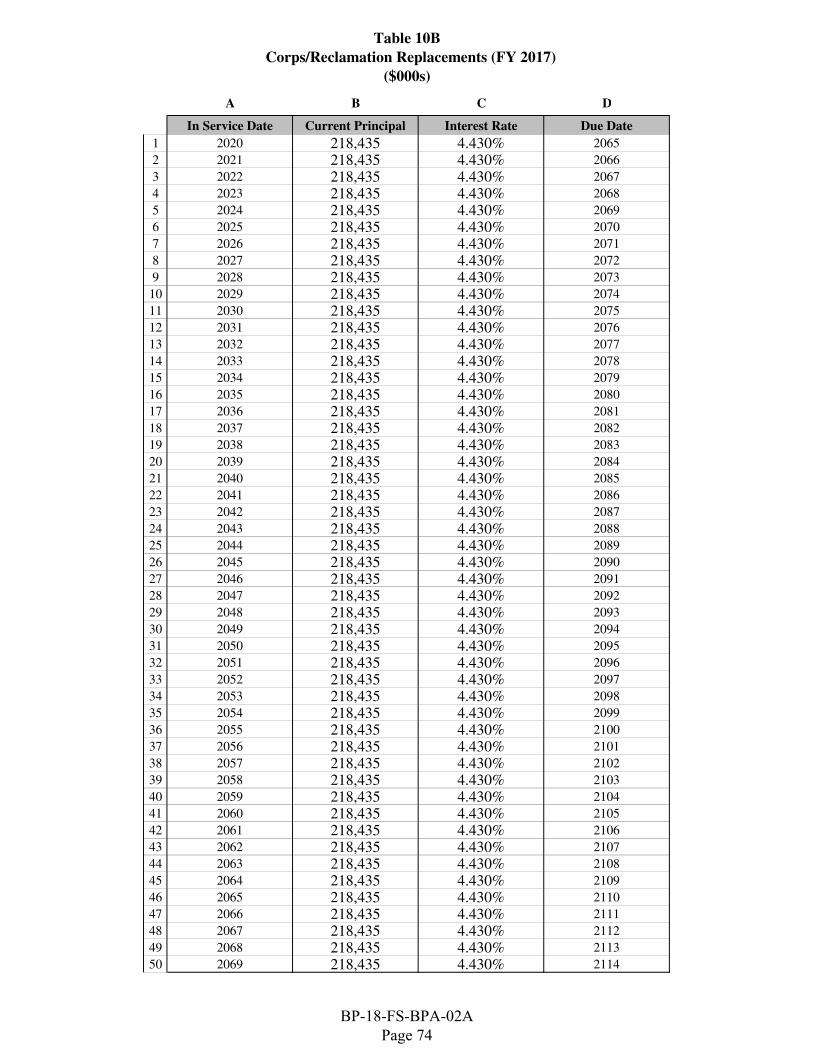
Table 10B
Corps/Reclamation Replacements (FY 2017)
($000s)
A B C D
In Service Date Current Principal Interest Rate Due Date
1 2020 218,435 4.430% 2065
2 2021 218,435 4.430% 2066
3 2022 218,435 4.430% 2067
4 2023 218,435 4.430% 2068
5 2024 218,435 4.430% 2069
6 2025 218,435 4.430% 2070
7 2026 218,435 4.430% 2071
8 2027 218,435 4.430% 2072
9 2028 218,435 4.430% 2073
10 2029 218,435 4.430% 2074
11 2030 218,435 4.430% 2075
12 2031 218,435 4.430% 2076
13 2032 218,435 4.430% 2077
14 2033 218,435 4.430% 2078
15 2034 218,435 4.430% 2079
16 2035 218,435 4.430% 2080
17 2036 218,435 4.430% 2081
18 2037 218,435 4.430% 2082
19 2038 218,435 4.430% 2083
20 2039 218,435 4.430% 2084
21 2040 218,435 4.430% 2085
22 2041 218,435 4.430% 2086
23 2042 218,435 4.430% 2087
24 2043 218,435 4.430% 2088
25 2044 218,435 4.430% 2089
26 2045 218,435 4.430% 2090
27 2046 218,435 4.430% 2091
28 2047 218,435 4.430% 2092
29 2048 218,435 4.430% 2093
30 2049 218,435 4.430% 2094
31 2050 218,435 4.430% 2095
32 2051 218,435 4.430% 2096
33 2052 218,435 4.430% 2097
34 2053 218,435 4.430% 2098
35 2054 218,435 4.430% 2099
36 2055 218,435 4.430% 2100
37 2056 218,435 4.430% 2101
38 2057 218,435 4.430% 2102
39 2058 218,435 4.430% 2103
40 2059 218,435 4.430% 2104
41 2060 218,435 4.430% 2105
42 2061 218,435 4.430% 2106
43 2062 218,435 4.430% 2107
44 2063 218,435 4.430% 2108
45 2064 218,435 4.430% 2109
46 2065 218,435 4.430% 2110
47 2066 218,435 4.430% 2111
48 2067 218,435 4.430% 2112
49 2068 218,435 4.430% 2113
50 2069 218,435 4.430% 2114
BP-18-FS-BPA-02A Page 74

Table 10C
Columbia Generating Station Replacements
($000s)
A B
Fiscal Year Total Debt Service
1 2045 489,0372 2046 489,0343 2047 489,0384 2048 489,0355 2049 489,0366 2050 489,0367 2051 489,0358 2052 489,0359 2053 489,035
10 2054 489,03611 2055 489,03712 2056 489,03413 2057 489,03414 2058 489,03315 2059 489,03916 2060 489,03717 2061 489,03818 2062 489,03519 2063 489,03520 2064 489,03821 2065 489,03522 2066 489,03423 2067 489,03824 2068 489,03425 2069 489,03526 2070 489,03427 2071 489,03428 2072 489,03829 2073 489,03630 2074 489,03631 2075 489,03832 2076 489,03633 2077 489,03434 2078 489,03335 2079 489,03436 2080 462,22537 2081 462,22538 2082 462,22539 2083 462,22540 2084 462,22541 2085 462,22542 2086 462,22543 2087 462,22544 2088 462,22545 2089 462,22546 2090 462,22547 2091 462,22548 2092 462,22549 2093 462,22550 2094 462,225
BP-18-FS-BPA-02A Page 75

11. REPAYMENT STUDY DATA, FY 2018 STUDY
BP-18-FS-BPA-02A Page 76

TABLE 11A:
HISTORICAL INVESTMENTS
October 1, 2015 - September 30, 2018 Cost Evaluation period
($000s) (FY 2018)A B C D E F G H
Project In Service Date Due Date Interest Rate Initial Principal Current Principal
Roll Maturity
Date
Rollover
Rate
1 Albeni Falls 09/1955 09/2005 6.910% 25,494 02 Albeni Falls 09/1956 09/2005 6.910% 11 03 Albeni Falls 09/1957 09/2005 6.910% 10 04 Albeni Falls 09/1958 09/2005 6.910% 11 05 Albeni Falls 09/1959 09/2005 6.910% 11 06 Albeni Falls 09/1960 09/2005 6.910% 10 07 Albeni Falls 09/1961 09/2005 6.910% 11 08 Albeni Falls 09/1962 09/2005 6.910% 11 09 Albeni Falls 09/1963 09/2005 6.910% 10 010 Albeni Falls 09/1964 09/2005 6.910% 11 011 Albeni Falls 09/1965 09/2005 6.910% 11 012 Albeni Falls 09/1966 09/2005 6.910% 10 013 Albeni Falls 09/1967 09/2005 6.910% 11 014 Albeni Falls 09/1968 09/2005 6.910% 11 015 Albeni Falls 09/1969 09/2005 6.910% 10 016 Albeni Falls 09/1970 09/2005 6.910% 11 017 Albeni Falls 09/1971 09/2005 6.910% 11 018 Albeni Falls 09/1972 09/2005 6.910% 10 019 Albeni Falls 09/1973 09/2005 6.910% 11 020 Albeni Falls 09/1974 09/2005 6.910% 11 021 Albeni Falls 09/1975 09/2005 6.910% 10 022 Albeni Falls 09/1976 09/2005 6.910% 11 023 Albeni Falls 09/1977 09/2005 6.910% 11 024 Albeni Falls 09/1978 09/2005 6.910% 10 025 Albeni Falls 09/1979 09/2005 6.910% 11 026 Albeni Falls 09/1980 09/2005 6.910% 11 027 Albeni Falls 09/1981 09/2005 6.910% 10 028 Albeni Falls 09/1982 09/2005 6.910% 11 029 Albeni Falls 09/1983 09/2005 6.910% 11 030 Albeni Falls 09/1985 09/2005 6.910% 7 031 Albeni Falls 09/1986 09/2005 6.910% 293 032 Albeni Falls 09/1987 09/2005 6.910% 12 033 Albeni Falls 09/1987 09/2005 8.888% 15 034 Albeni Falls 09/1988 09/2005 8.500% 328 035 Albeni Falls 09/1989 09/2005 9.250% 221 036 Albeni Falls 09/1990 09/2005 8.875% 1,287 037 Albeni Falls 09/1991 09/2005 8.750% 43 038 Albeni Falls 09/1991 09/2005 8.750% 111 039 Albeni Falls 09/1992 09/2005 8.500% 7 040 Albeni Falls 09/1992 09/2005 8.500% 106 041 Albeni Falls 09/1993 09/2005 7.875% 295 042 Albeni Falls 09/1993 09/2005 7.875% 714 043 Albeni Falls 09/1994 09/2019 7.125% 61 044 Albeni Falls 09/1994 09/2019 7.125% 173 045 Albeni Falls 09/1995 09/2010 7.090% 17 046 Albeni Falls 09/1995 09/2010 7.890% 51 047 Albeni Falls 09/1995 09/2045 7.150% 443 44348 Albeni Falls 09/1995 09/2045 7.150% 531 53149 Albeni Falls 09/1995 09/2045 7.150% 1,105 1,10550 Albeni Falls 09/1996 09/2016 7.290% 130 051 Albeni Falls 09/1997 09/2047 7.150% 431 43152 Albeni Falls 09/2005 09/2055 5.125% 481 48153 Albeni Falls 09/2009 09/2059 4.375% 57 5754 Albeni Falls 09/2010 09/2060 4.250% 42 4255 Boise 09/1912 09/1962 3.000% 1,249 056 Boise 09/1912 09/1962 3.000% 285 057 Boise 09/1926 09/1976 3.000% 190 058 Boise 09/1926 09/1976 3.000% 832 059 Boise 09/1950 09/2000 3.000% 416 060 Boise 09/1950 09/2000 3.000% 95 061 Boise 09/1951 09/2001 3.000% 1,873 062 Boise 09/1951 09/2001 3.000% 428 063 Boise 09/1952 09/2001 3.000% 11 064 Boise 09/1952 09/2001 3.000% 3 065 Boise 09/1953 09/2001 3.000% 11 066 Boise 09/1953 09/2001 3.000% 3 067 Boise 09/1954 09/2001 3.000% 11 068 Boise 09/1954 09/2001 3.000% 3 069 Boise 09/1955 09/2001 3.000% 11 070 Boise 09/1955 09/2001 3.000% 3 071 Boise 09/1956 09/2001 3.000% 11 072 Boise 09/1956 09/2001 3.000% 3 073 Boise 09/1957 09/2001 3.000% 11 074 Boise 09/1957 09/2001 3.000% 3 075 Boise 09/1958 09/2001 3.000% 11 076 Boise 09/1958 09/2001 3.000% 3 077 Boise 09/1959 09/2001 3.000% 11 078 Boise 09/1959 09/2001 3.000% 3 079 Boise 09/1960 09/2001 3.000% 11 080 Boise 09/1960 09/2001 3.000% 3 081 Boise 09/1961 09/2001 3.000% 11 082 Boise 09/1961 09/2001 3.000% 3 0
BP-18-FS-BPA-02A Page 77

TABLE 11A:
HISTORICAL INVESTMENTS
October 1, 2015 - September 30, 2018 Cost Evaluation period
($000s) (FY 2018)A B C D E F G H
Project In Service Date Due Date Interest Rate Initial Principal Current Principal
Roll Maturity
Date
Rollover
Rate
83 Boise 09/1962 09/2001 3.000% 11 084 Boise 09/1962 09/2001 3.000% 3 085 Boise 09/1963 09/2001 3.000% 11 086 Boise 09/1963 09/2001 3.000% 3 087 Boise 09/1964 09/2001 3.000% 11 088 Boise 09/1964 09/2001 3.000% 3 089 Boise 09/1965 09/2001 3.000% 11 090 Boise 09/1965 09/2001 3.000% 3 091 Boise 09/1966 09/2001 3.000% 11 092 Boise 09/1966 09/2001 3.000% 3 093 Boise 09/1967 09/2001 3.000% 11 094 Boise 09/1967 09/2001 3.000% 3 095 Boise 09/1968 09/2001 3.000% 11 096 Boise 09/1968 09/2001 3.000% 3 097 Boise 09/1969 09/2001 3.000% 11 098 Boise 09/1969 09/2001 3.000% 3 099 Boise 09/1970 09/2001 3.000% 11 0
100 Boise 09/1970 09/2001 3.000% 3 0101 Boise 09/1971 09/2001 3.000% 11 0102 Boise 09/1971 09/2001 3.000% 3 0103 Boise 09/1972 09/2001 3.000% 11 0104 Boise 09/1972 09/2001 3.000% 3 0105 Boise 09/1973 09/2001 3.000% 11 0106 Boise 09/1973 09/2001 3.000% 3 0107 Boise 09/1974 09/2001 3.000% 11 0108 Boise 09/1974 09/2001 3.000% 3 0109 Boise 09/1975 09/2001 3.000% 11 0110 Boise 09/1975 09/2001 3.000% 3 0111 Boise 09/1976 09/2001 3.000% 11 0112 Boise 09/1976 09/2001 3.000% 3 0113 Boise 09/1977 09/2001 3.000% 11 0114 Boise 09/1977 09/2001 3.000% 3 0115 Boise 09/1978 09/2001 3.000% 11 0116 Boise 09/1978 09/2001 3.000% 3 0117 Boise 09/1979 09/2001 3.000% 11 0118 Boise 09/1979 09/2001 3.000% 3 0119 Boise 09/1980 09/2001 3.000% 18 0120 Boise 09/1980 09/2001 3.000% 4 0121 Boise 09/1981 09/2001 3.000% 8 0122 Boise 09/1981 09/2001 3.000% 2 0123 Boise 09/1982 09/2001 3.000% 1 0124 Boise 09/1982 09/2001 3.000% 1 0125 Boise 09/1983 09/2001 3.000% 1 0126 Boise 09/1984 09/2001 10.750% 1,325 0127 Boise 09/1984 09/2001 10.750% 303 0128 Boise 09/1986 09/2001 6.710% 94 0129 Boise 09/1988 09/2001 8.500% 3 0130 Boise 09/1989 09/2001 9.250% 3,264 0131 Boise 09/1990 09/2001 8.875% 38 0132 Boise 09/1991 09/2001 8.750% 50 0133 Boise 09/1993 09/2001 7.875% 418 0134 Boise 09/1994 09/1999 7.125% 7 0135 Boise 09/1996 09/2046 6.950% 7 0136 Boise 09/1996 09/2046 7.150% 442 442137 Boise 09/1996 09/2046 7.150% 656 656138 Boise 09/1997 09/2047 6.950% 9 0139 Boise 09/1997 09/2047 7.150% 2,266 2,266140 Boise 09/2005 09/2055 5.125% 903 903141 Boise 09/2006 09/2056 4.500% 15 15142 Boise 09/2007 09/2057 5.000% 76 76143 Boise 09/2008 09/2058 4.875% 64 64144 Boise 09/2009 09/2059 4.375% 2 2145 Boise 09/2015 09/2065 3.250% 0 0146 Bonneville 2nd Powerhouse 09/1981 09/2031 7.150% 40,964 0147 Bonneville 2nd Powerhouse 09/1981 09/2031 7.150% 455 0148 Bonneville 2nd Powerhouse 09/1982 09/2032 7.150% 203,535 0149 Bonneville 2nd Powerhouse 09/1982 09/2032 7.150% 2,264 0150 Bonneville 2nd Powerhouse 09/1983 09/2033 7.150% 62,409 0151 Bonneville 2nd Powerhouse 09/1983 09/2033 7.150% 694 0152 Bonneville 2nd Powerhouse 09/1985 09/2033 7.150% 9,138 0153 Bonneville 2nd Powerhouse 09/1986 09/2033 7.150% 30,578 21,534154 Bonneville 2nd Powerhouse 09/1987 09/2033 7.150% 2,801 2,801155 Bonneville 2nd Powerhouse 09/1988 09/2033 7.150% 1,271 1,271156 Bonneville 2nd Powerhouse 09/1989 09/2033 7.150% 1,232 1,232157 Bonneville 2nd Powerhouse 09/1990 09/2033 7.150% 1,588 1,588158 Bonneville 2nd Powerhouse 09/1991 09/2033 8.750% 3,998 0159 Bonneville 2nd Powerhouse 09/1991 09/2033 8.750% 26 0160 Bonneville 2nd Powerhouse 09/1992 09/2033 8.500% 2,446 0161 Bonneville 2nd Powerhouse 09/1993 09/2033 7.875% 3,668 0162 Bonneville 2nd Powerhouse 09/1994 09/2044 7.150% 5,700 5,700163 Bonneville 2nd Powerhouse 09/1995 09/2045 7.150% 3,791 3,791164 Bonneville 2nd Powerhouse 09/1996 09/2046 7.150% 376 376
BP-18-FS-BPA-02A Page 78

TABLE 11A:
HISTORICAL INVESTMENTS
October 1, 2015 - September 30, 2018 Cost Evaluation period
($000s) (FY 2018)A B C D E F G H
Project In Service Date Due Date Interest Rate Initial Principal Current Principal
Roll Maturity
Date
Rollover
Rate
165 Bonneville Dam 09/1938 09/1988 2.500% 11,726 0166 Bonneville Dam 09/1938 09/1988 2.500% 130 0167 Bonneville Dam 09/1941 09/1991 2.500% 17,589 0168 Bonneville Dam 09/1941 09/1991 2.500% 196 0169 Bonneville Dam 09/1942 09/1992 2.500% 5,863 0170 Bonneville Dam 09/1942 09/1992 2.500% 65 0171 Bonneville Dam 09/1943 09/1993 2.500% 17,589 0172 Bonneville Dam 09/1943 09/1993 2.500% 196 0173 Bonneville Dam 09/1944 09/1994 2.500% 5,860 0174 Bonneville Dam 09/1944 09/1994 2.500% 65 0175 Bonneville Dam 09/1945 09/1994 2.500% 82 0176 Bonneville Dam 09/1945 09/1994 2.500% 1 0177 Bonneville Dam 09/1946 09/1994 2.500% 81 0178 Bonneville Dam 09/1946 09/1994 2.500% 1 0179 Bonneville Dam 09/1947 09/1994 2.500% 82 0180 Bonneville Dam 09/1947 09/1994 2.500% 1 0181 Bonneville Dam 09/1948 09/1994 2.500% 81 0182 Bonneville Dam 09/1948 09/1994 2.500% 1 0183 Bonneville Dam 09/1949 09/1994 2.500% 82 0184 Bonneville Dam 09/1949 09/1994 2.500% 1 0185 Bonneville Dam 09/1950 09/1994 2.500% 81 0186 Bonneville Dam 09/1950 09/1994 2.500% 11 0187 Bonneville Dam 09/1951 09/1994 2.500% 81 0188 Bonneville Dam 09/1951 09/1994 2.500% 11 0189 Bonneville Dam 09/1952 09/1994 2.500% 82 0190 Bonneville Dam 09/1952 09/1994 2.500% 1 0191 Bonneville Dam 09/1953 09/1994 2.500% 81 0192 Bonneville Dam 09/1953 09/1994 2.500% 1 0193 Bonneville Dam 09/1954 09/1994 2.500% 82 0194 Bonneville Dam 09/1954 09/1994 2.500% 1 0195 Bonneville Dam 09/1955 09/1994 2.500% 81 0196 Bonneville Dam 09/1955 09/1994 2.500% 1 0197 Bonneville Dam 09/1956 09/1994 2.500% 81 0198 Bonneville Dam 09/1956 09/1994 2.500% 1 0199 Bonneville Dam 09/1957 09/1994 2.500% 82 0200 Bonneville Dam 09/1957 09/1994 2.500% 1 0201 Bonneville Dam 09/1958 09/1994 2.500% 81 0202 Bonneville Dam 09/1958 09/1994 2.500% 1 0203 Bonneville Dam 09/1959 09/1994 2.500% 82 0204 Bonneville Dam 09/1959 09/1994 2.500% 1 0205 Bonneville Dam 09/1960 09/1994 2.500% 81 0206 Bonneville Dam 09/1960 09/1994 2.500% 1 0207 Bonneville Dam 09/1961 09/1994 2.500% 81 0208 Bonneville Dam 09/1961 09/1994 2.500% 1 0209 Bonneville Dam 09/1962 09/1994 2.500% 82 0210 Bonneville Dam 09/1962 09/1994 2.500% 1 0211 Bonneville Dam 09/1963 09/1994 2.500% 81 0212 Bonneville Dam 09/1963 09/1994 2.500% 1 0213 Bonneville Dam 09/1964 09/1994 2.500% 82 0214 Bonneville Dam 09/1964 09/1994 2.500% 1 0215 Bonneville Dam 09/1965 09/1994 2.500% 81 0216 Bonneville Dam 09/1965 09/1994 2.500% 1 0217 Bonneville Dam 09/1966 09/1994 2.500% 81 0218 Bonneville Dam 09/1966 09/1994 2.500% 1 0219 Bonneville Dam 09/1967 09/1994 2.500% 82 0220 Bonneville Dam 09/1967 09/1994 2.500% 1 0221 Bonneville Dam 09/1968 09/1994 2.500% 81 0222 Bonneville Dam 09/1968 09/1994 2.500% 1 0223 Bonneville Dam 09/1969 09/1994 2.500% 82 0224 Bonneville Dam 09/1969 09/1994 2.500% 1 0225 Bonneville Dam 09/1970 09/1994 2.500% 81 0226 Bonneville Dam 09/1970 09/1994 2.500% 1 0227 Bonneville Dam 09/1971 09/1994 2.500% 81 0228 Bonneville Dam 09/1971 09/1994 2.500% 1 0229 Bonneville Dam 09/1972 09/1994 2.500% 82 0230 Bonneville Dam 09/1972 09/1994 2.500% 1 0231 Bonneville Dam 09/1973 09/1994 2.500% 81 0232 Bonneville Dam 09/1973 09/1994 2.500% 1 0233 Bonneville Dam 09/1974 09/1994 2.500% 82 0234 Bonneville Dam 09/1974 09/1994 2.500% 1 0235 Bonneville Dam 09/1975 09/1994 2.500% 81 0236 Bonneville Dam 09/1975 09/1994 2.500% 1 0237 Bonneville Dam 09/1976 09/1994 2.500% 81 0238 Bonneville Dam 09/1976 09/1994 2.500% 1 0239 Bonneville Dam 09/1977 09/1994 2.500% 82 0240 Bonneville Dam 09/1977 09/1994 2.500% 1 0241 Bonneville Dam 09/1977 09/2027 7.150% 15,670 0242 Bonneville Dam 09/1978 09/1994 2.500% 81 0243 Bonneville Dam 09/1978 09/1994 2.500% 1 0244 Bonneville Dam 09/1979 09/1994 2.500% 82 0245 Bonneville Dam 09/1979 09/1994 2.500% 1 0246 Bonneville Dam 09/1980 09/1994 2.500% 81 0
BP-18-FS-BPA-02A Page 79

TABLE 11A:
HISTORICAL INVESTMENTS
October 1, 2015 - September 30, 2018 Cost Evaluation period
($000s) (FY 2018)A B C D E F G H
Project In Service Date Due Date Interest Rate Initial Principal Current Principal
Roll Maturity
Date
Rollover
Rate
247 Bonneville Dam 09/1980 09/1994 2.500% 1 0248 Bonneville Dam 09/1981 09/1994 2.500% 81 0249 Bonneville Dam 09/1981 09/1994 2.500% 1 0250 Bonneville Dam 09/1982 09/1994 2.500% 82 0251 Bonneville Dam 09/1982 09/1994 2.500% 2 0252 Bonneville Dam 09/1983 09/1994 2.500% 81 0253 Bonneville Dam 09/1983 09/1994 2.500% 1 0254 Bonneville Dam 09/1984 09/1994 10.750% 873 0255 Bonneville Dam 09/1984 09/1994 10.750% 10 0256 Bonneville Dam 09/1985 09/1994 2.500% 119 0257 Bonneville Dam 09/1986 09/1994 2.500% 555 0258 Bonneville Dam 09/1986 09/1994 11.375% 454 0259 Bonneville Dam 09/1987 09/1994 2.500% 260 0260 Bonneville Dam 09/1987 09/1994 8.875% 26 0261 Bonneville Dam 09/1988 09/1994 8.500% 4,199 0262 Bonneville Dam 09/1988 09/1994 8.500% 10 0263 Bonneville Dam 09/1989 09/1994 9.250% 877 0264 Bonneville Dam 09/1990 09/1994 8.875% 519 0265 Bonneville Dam 09/1990 09/1994 8.875% 651 0266 Bonneville Dam 09/1991 09/1994 8.750% 35 0267 Bonneville Dam 09/1991 09/1994 8.750% 3,193 0268 Bonneville Dam 09/1992 09/1994 8.500% 99 0269 Bonneville Dam 09/1992 09/1994 8.500% 25 0270 Bonneville Dam 09/1993 09/2018 7.880% 5,011 0271 Bonneville Dam 09/1994 09/2029 7.125% 536 0272 Bonneville Dam 09/1995 09/2000 7.330% 8 0273 Bonneville Dam 09/1995 09/2010 7.090% 25 0274 Bonneville Dam 09/1995 09/2020 7.250% 20 0275 Bonneville Dam 09/1995 09/2020 7.250% 22 0276 Bonneville Dam 09/1995 09/2030 7.860% 53 0277 Bonneville Dam 09/1995 09/2035 7.860% 98 0278 Bonneville Dam 09/1995 09/2045 7.150% 243 243279 Bonneville Dam 09/1995 09/2045 7.150% 410 410280 Bonneville Dam 09/1995 09/2045 7.150% 440 440281 Bonneville Dam 09/1995 09/2045 7.860% 374 0282 Bonneville Dam 09/1996 09/2016 7.290% 834 0283 Bonneville Dam 09/1996 09/2031 7.150% 22 0284 Bonneville Dam 09/1996 09/2046 7.150% 18 18285 Bonneville Dam 09/1996 09/2046 7.150% 18 18286 Bonneville Dam 09/1996 09/2046 7.150% 80 80287 Bonneville Dam 09/1996 09/2046 7.150% 109 109288 Bonneville Dam 09/1996 09/2046 7.150% 142 142289 Bonneville Dam 09/1996 09/2046 7.150% 223 223290 Bonneville Dam 09/1996 09/2046 7.150% 751 751291 Bonneville Dam 09/1996 09/2046 7.150% 1,322 1,322292 Bonneville Dam 09/1997 09/2022 7.230% 122 0293 Bonneville Dam 09/1997 09/2032 7.150% 518 0294 Bonneville Dam 09/1997 09/2047 7.150% 161 161295 Bonneville Dam 09/1999 09/2049 5.375% 19,368 19,368296 Bonneville Dam 09/2000 09/2050 6.125% 24,446 24,446297 Bonneville Dam 09/2001 09/2051 5.875% 2,530 2,530298 Bonneville Dam 09/2002 09/2052 5.500% 448 448299 Bonneville Dam 09/2003 09/2053 5.125% 4,581 4,581300 Bonneville Dam 09/2004 09/2054 5.375% 26,741 26,741301 Bonneville Dam 09/2005 09/2055 5.125% 19,725 19,725302 Bonneville Dam 09/2006 09/2056 4.500% 2,628 2,628303 Bonneville Dam 09/2007 09/2057 5.000% 1,124 1,124304 Bonneville Dam 09/2008 09/2058 4.875% 14,609 14,609305 Bonneville Dam 09/2009 09/2059 4.375% 2,744 2,744306 Bonneville Dam 09/2010 09/2060 4.250% 1,425 1,425307 Bonneville Dam 09/2011 09/2061 3.750% 10,962 10,962308 Bonneville Dam 09/2013 09/2063 2.875% 268 268309 Bonneville Dam 09/2014 09/2064 3.875%310 Bonneville Dam 09/2015 09/2065 3.250% 102 102311 Chief Joseph 09/1955 09/2005 6.910% 29,164 0312 Chief Joseph 09/1956 09/2006 6.950% 13,643 0313 Chief Joseph 09/1957 09/2007 6.980% 39,586 0314 Chief Joseph 09/1958 09/2008 7.020% 31,901 0315 Chief Joseph 09/1959 09/2008 7.020% 223 0316 Chief Joseph 09/1960 09/2008 7.020% 223 0317 Chief Joseph 09/1961 09/2008 7.020% 223 0318 Chief Joseph 09/1962 09/2008 7.020% 223 0319 Chief Joseph 09/1963 09/2008 7.020% 224 0320 Chief Joseph 09/1964 09/2008 7.020% 223 0321 Chief Joseph 09/1965 09/2008 7.020% 223 0322 Chief Joseph 09/1966 09/2008 7.020% 223 0323 Chief Joseph 09/1967 09/2008 7.020% 223 0324 Chief Joseph 09/1968 09/2008 7.020% 224 0325 Chief Joseph 09/1969 09/2008 7.020% 223 0326 Chief Joseph 09/1970 09/2008 7.020% 223 0327 Chief Joseph 09/1971 09/2008 7.020% 223 0328 Chief Joseph 09/1972 09/2008 7.020% 223 0
BP-18-FS-BPA-02A Page 80
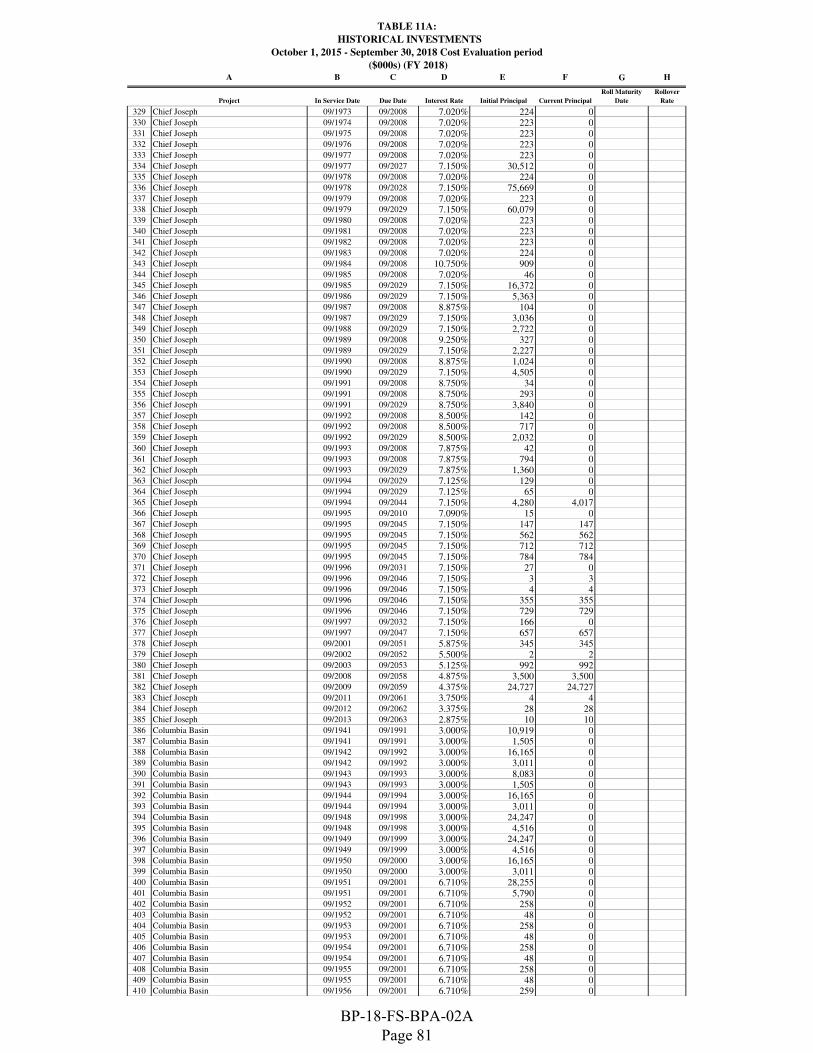
TABLE 11A:
HISTORICAL INVESTMENTS
October 1, 2015 - September 30, 2018 Cost Evaluation period
($000s) (FY 2018)A B C D E F G H
Project In Service Date Due Date Interest Rate Initial Principal Current Principal
Roll Maturity
Date
Rollover
Rate
329 Chief Joseph 09/1973 09/2008 7.020% 224 0330 Chief Joseph 09/1974 09/2008 7.020% 223 0331 Chief Joseph 09/1975 09/2008 7.020% 223 0332 Chief Joseph 09/1976 09/2008 7.020% 223 0333 Chief Joseph 09/1977 09/2008 7.020% 223 0334 Chief Joseph 09/1977 09/2027 7.150% 30,512 0335 Chief Joseph 09/1978 09/2008 7.020% 224 0336 Chief Joseph 09/1978 09/2028 7.150% 75,669 0337 Chief Joseph 09/1979 09/2008 7.020% 223 0338 Chief Joseph 09/1979 09/2029 7.150% 60,079 0339 Chief Joseph 09/1980 09/2008 7.020% 223 0340 Chief Joseph 09/1981 09/2008 7.020% 223 0341 Chief Joseph 09/1982 09/2008 7.020% 223 0342 Chief Joseph 09/1983 09/2008 7.020% 224 0343 Chief Joseph 09/1984 09/2008 10.750% 909 0344 Chief Joseph 09/1985 09/2008 7.020% 46 0345 Chief Joseph 09/1985 09/2029 7.150% 16,372 0346 Chief Joseph 09/1986 09/2029 7.150% 5,363 0347 Chief Joseph 09/1987 09/2008 8.875% 104 0348 Chief Joseph 09/1987 09/2029 7.150% 3,036 0349 Chief Joseph 09/1988 09/2029 7.150% 2,722 0350 Chief Joseph 09/1989 09/2008 9.250% 327 0351 Chief Joseph 09/1989 09/2029 7.150% 2,227 0352 Chief Joseph 09/1990 09/2008 8.875% 1,024 0353 Chief Joseph 09/1990 09/2029 7.150% 4,505 0354 Chief Joseph 09/1991 09/2008 8.750% 34 0355 Chief Joseph 09/1991 09/2008 8.750% 293 0356 Chief Joseph 09/1991 09/2029 8.750% 3,840 0357 Chief Joseph 09/1992 09/2008 8.500% 142 0358 Chief Joseph 09/1992 09/2008 8.500% 717 0359 Chief Joseph 09/1992 09/2029 8.500% 2,032 0360 Chief Joseph 09/1993 09/2008 7.875% 42 0361 Chief Joseph 09/1993 09/2008 7.875% 794 0362 Chief Joseph 09/1993 09/2029 7.875% 1,360 0363 Chief Joseph 09/1994 09/2029 7.125% 129 0364 Chief Joseph 09/1994 09/2029 7.125% 65 0365 Chief Joseph 09/1994 09/2044 7.150% 4,280 4,017366 Chief Joseph 09/1995 09/2010 7.090% 15 0367 Chief Joseph 09/1995 09/2045 7.150% 147 147368 Chief Joseph 09/1995 09/2045 7.150% 562 562369 Chief Joseph 09/1995 09/2045 7.150% 712 712370 Chief Joseph 09/1995 09/2045 7.150% 784 784371 Chief Joseph 09/1996 09/2031 7.150% 27 0372 Chief Joseph 09/1996 09/2046 7.150% 3 3373 Chief Joseph 09/1996 09/2046 7.150% 4 4374 Chief Joseph 09/1996 09/2046 7.150% 355 355375 Chief Joseph 09/1996 09/2046 7.150% 729 729376 Chief Joseph 09/1997 09/2032 7.150% 166 0377 Chief Joseph 09/1997 09/2047 7.150% 657 657378 Chief Joseph 09/2001 09/2051 5.875% 345 345379 Chief Joseph 09/2002 09/2052 5.500% 2 2380 Chief Joseph 09/2003 09/2053 5.125% 992 992381 Chief Joseph 09/2008 09/2058 4.875% 3,500 3,500382 Chief Joseph 09/2009 09/2059 4.375% 24,727 24,727383 Chief Joseph 09/2011 09/2061 3.750% 4 4384 Chief Joseph 09/2012 09/2062 3.375% 28 28385 Chief Joseph 09/2013 09/2063 2.875% 10 10386 Columbia Basin 09/1941 09/1991 3.000% 10,919 0387 Columbia Basin 09/1941 09/1991 3.000% 1,505 0388 Columbia Basin 09/1942 09/1992 3.000% 16,165 0389 Columbia Basin 09/1942 09/1992 3.000% 3,011 0390 Columbia Basin 09/1943 09/1993 3.000% 8,083 0391 Columbia Basin 09/1943 09/1993 3.000% 1,505 0392 Columbia Basin 09/1944 09/1994 3.000% 16,165 0393 Columbia Basin 09/1944 09/1994 3.000% 3,011 0394 Columbia Basin 09/1948 09/1998 3.000% 24,247 0395 Columbia Basin 09/1948 09/1998 3.000% 4,516 0396 Columbia Basin 09/1949 09/1999 3.000% 24,247 0397 Columbia Basin 09/1949 09/1999 3.000% 4,516 0398 Columbia Basin 09/1950 09/2000 3.000% 16,165 0399 Columbia Basin 09/1950 09/2000 3.000% 3,011 0400 Columbia Basin 09/1951 09/2001 6.710% 28,255 0401 Columbia Basin 09/1951 09/2001 6.710% 5,790 0402 Columbia Basin 09/1952 09/2001 6.710% 258 0403 Columbia Basin 09/1952 09/2001 6.710% 48 0404 Columbia Basin 09/1953 09/2001 6.710% 258 0405 Columbia Basin 09/1953 09/2001 6.710% 48 0406 Columbia Basin 09/1954 09/2001 6.710% 258 0407 Columbia Basin 09/1954 09/2001 6.710% 48 0408 Columbia Basin 09/1955 09/2001 6.710% 258 0409 Columbia Basin 09/1955 09/2001 6.710% 48 0410 Columbia Basin 09/1956 09/2001 6.710% 259 0
BP-18-FS-BPA-02A Page 81

TABLE 11A:
HISTORICAL INVESTMENTS
October 1, 2015 - September 30, 2018 Cost Evaluation period
($000s) (FY 2018)A B C D E F G H
Project In Service Date Due Date Interest Rate Initial Principal Current Principal
Roll Maturity
Date
Rollover
Rate
411 Columbia Basin 09/1956 09/2001 6.710% 48 0412 Columbia Basin 09/1957 09/2001 6.710% 258 0413 Columbia Basin 09/1957 09/2001 6.710% 48 0414 Columbia Basin 09/1958 09/2001 6.710% 258 0415 Columbia Basin 09/1958 09/2001 6.710% 48 0416 Columbia Basin 09/1959 09/2001 6.710% 258 0417 Columbia Basin 09/1959 09/2001 6.710% 48 0418 Columbia Basin 09/1960 09/2001 6.710% 258 0419 Columbia Basin 09/1960 09/2001 6.710% 48 0420 Columbia Basin 09/1961 09/2001 6.710% 259 0421 Columbia Basin 09/1961 09/2001 6.710% 48 0422 Columbia Basin 09/1962 09/2001 6.710% 258 0423 Columbia Basin 09/1962 09/2001 6.710% 48 0424 Columbia Basin 09/1963 09/2001 6.710% 258 0425 Columbia Basin 09/1963 09/2001 6.710% 48 0426 Columbia Basin 09/1964 09/2001 6.710% 258 0427 Columbia Basin 09/1964 09/2001 6.710% 48 0428 Columbia Basin 09/1965 09/2001 6.710% 258 0429 Columbia Basin 09/1965 09/2001 6.710% 48 0430 Columbia Basin 09/1966 09/2001 6.710% 259 0431 Columbia Basin 09/1966 09/2001 6.710% 48 0432 Columbia Basin 09/1967 09/2001 6.710% 258 0433 Columbia Basin 09/1967 09/2001 6.710% 48 0434 Columbia Basin 09/1967 09/2017 7.290% 758 0435 Columbia Basin 09/1968 09/2001 6.710% 258 0436 Columbia Basin 09/1968 09/2001 6.710% 48 0437 Columbia Basin 09/1969 09/2001 6.710% 258 0438 Columbia Basin 09/1969 09/2001 6.710% 48 0439 Columbia Basin 09/1970 09/2001 6.710% 258 0440 Columbia Basin 09/1970 09/2001 6.710% 48 0441 Columbia Basin 09/1971 09/2001 6.710% 259 0442 Columbia Basin 09/1971 09/2001 6.710% 48 0443 Columbia Basin 09/1972 09/2001 6.710% 258 0444 Columbia Basin 09/1972 09/2001 6.710% 48 0445 Columbia Basin 09/1973 09/2001 6.710% 258 0446 Columbia Basin 09/1973 09/2001 6.710% 48 0447 Columbia Basin 09/1974 09/2001 6.710% 258 0448 Columbia Basin 09/1974 09/2001 6.710% 48 0449 Columbia Basin 09/1975 09/2001 6.710% 258 0450 Columbia Basin 09/1975 09/2001 6.710% 48 0451 Columbia Basin 09/1976 09/2001 6.710% 259 0452 Columbia Basin 09/1976 09/2001 6.710% 48 0453 Columbia Basin 09/1977 09/2001 6.710% 258 0454 Columbia Basin 09/1977 09/2001 6.710% 48 0455 Columbia Basin 09/1978 09/2001 6.710% 258 0456 Columbia Basin 09/1978 09/2001 6.710% 48 0457 Columbia Basin 09/1979 09/2001 6.710% 258 0458 Columbia Basin 09/1979 09/2001 6.710% 48 0459 Columbia Basin 09/1980 09/2001 6.710% 258 0460 Columbia Basin 09/1980 09/2001 6.710% 48 0461 Columbia Basin 09/1981 09/2001 6.710% 259 0462 Columbia Basin 09/1981 09/2001 6.710% 48 0463 Columbia Basin 09/1982 09/2001 6.710% 258 0464 Columbia Basin 09/1982 09/2001 6.710% 48 0465 Columbia Basin 09/1983 09/2001 6.710% 258 0466 Columbia Basin 09/1983 09/2001 6.710% 48 0467 Columbia Basin 09/1984 09/2001 10.750% 7,815 0468 Columbia Basin 09/1984 09/2001 10.750% 1,455 0469 Columbia Basin 09/1985 09/2001 6.710% 236 0470 Columbia Basin 09/1985 09/2001 6.710% 11 0471 Columbia Basin 09/1985 09/2001 12.375% 7,338 0472 Columbia Basin 09/1985 09/2001 12.375% 362 0473 Columbia Basin 09/1986 09/2001 6.710% 127 0474 Columbia Basin 09/1987 09/2001 6.710% 13 0475 Columbia Basin 09/1988 09/2001 8.500% 184 0476 Columbia Basin 09/1988 09/2001 8.500% 2 0477 Columbia Basin 09/1989 09/2001 9.250% 1,166 0478 Columbia Basin 09/1990 09/2001 8.875% 928 0479 Columbia Basin 09/1991 09/2001 8.750% 177 0480 Columbia Basin 09/1991 09/2001 8.750% 1,661 0481 Columbia Basin 09/1992 09/2001 8.500% 445 0482 Columbia Basin 09/1992 09/2001 8.500% 652 0483 Columbia Basin 09/1993 09/2001 6.710% 792 0484 Columbia Basin 09/1995 09/2000 6.620% 25 0485 Columbia Basin 09/1995 09/2020 7.250% 206 0486 Columbia Basin 09/1995 09/2030 7.150% 25 0487 Columbia Basin 09/1995 09/2030 7.860% 270 0488 Columbia Basin 09/1995 09/2030 7.860% 321 0489 Columbia Basin 09/1995 09/2030 7.860% 323 0490 Columbia Basin 09/1995 09/2030 7.860% 20 0491 Columbia Basin 09/1995 09/2045 7.150% 287 287492 Columbia Basin 09/1995 09/2045 7.150% 2,511 2,453
BP-18-FS-BPA-02A Page 82

TABLE 11A:
HISTORICAL INVESTMENTS
October 1, 2015 - September 30, 2018 Cost Evaluation period
($000s) (FY 2018)A B C D E F G H
Project In Service Date Due Date Interest Rate Initial Principal Current Principal
Roll Maturity
Date
Rollover
Rate
493 Columbia Basin 09/1995 09/2045 7.860% 450 0494 Columbia Basin 09/1995 09/2045 7.860% 450 0495 Columbia Basin 09/1996 09/2026 7.150% 72 0496 Columbia Basin 09/1996 09/2031 7.150% 109 0497 Columbia Basin 09/1996 09/2031 7.150% 251 0498 Columbia Basin 09/1996 09/2046 7.150% 426 426499 Columbia Basin 09/1996 09/2046 7.150% 368 368500 Columbia Basin 09/1997 09/2047 7.150% 3,393 3,393501 Columbia Basin 09/2001 09/2051 5.875% 69,226 69,226502 Columbia Basin 09/2005 09/2055 5.125% 10,963 10,963503 Columbia Basin 09/2006 09/2056 4.500% 1,987 1,987504 Columbia Basin 09/2007 09/2057 5.000% 929 929505 Columbia Basin 09/2008 09/2058 4.875% 835 835506 Columbia Basin 09/2009 09/2059 4.375% 1,338 1,338507 Columbia Basin 09/2010 09/2060 4.250% 877 877508 Columbia Basin 09/2011 09/2061 3.750% 1,723 1,723509 Columbia Basin 09/2012 09/2062 3.375% 11 11510 Columbia Basin 09/2013 09/2063 2.875% 3,083 3,083511 Columbia Basin 09/2014 09/2064 3.875% 18 18512 Columbia Basin 09/2015 09/2065 3.250% 0 0513 Columbia Basin 3rd Powerhouse 09/1975 09/2025 7.160% 47,328 0514 Columbia Basin 3rd Powerhouse 09/1975 09/2025 7.160% 8,702 0515 Columbia Basin 3rd Powerhouse 09/1976 09/2026 7.150% 41,330 0516 Columbia Basin 3rd Powerhouse 09/1976 09/2026 7.150% 8,037 0517 Columbia Basin 3rd Powerhouse 09/1977 09/2027 7.150% 42,764 0518 Columbia Basin 3rd Powerhouse 09/1977 09/2027 7.150% 7,964 0519 Columbia Basin 3rd Powerhouse 09/1978 09/2028 7.150% 42,399 0520 Columbia Basin 3rd Powerhouse 09/1978 09/2028 7.150% 7,896 0521 Columbia Basin 3rd Powerhouse 09/1979 09/2029 7.150% 84,118 0522 Columbia Basin 3rd Powerhouse 09/1979 09/2029 7.150% 15,666 0523 Columbia Basin 3rd Powerhouse 09/1983 09/2033 7.150% 712 0524 Columbia Basin 3rd Powerhouse 09/1983 09/2033 7.150% 13,003 0525 Columbia Basin 3rd Powerhouse 09/1984 09/2033 7.150% 16,965 0526 Columbia Basin 3rd Powerhouse 09/1984 09/2033 7.150% 13,192 0527 Columbia Basin 3rd Powerhouse 09/1984 09/2033 7.150% 3,160 0528 Columbia Basin 3rd Powerhouse 09/1985 09/2033 7.150% 2,060 0529 Columbia Basin 3rd Powerhouse 09/1985 09/2033 7.150% 41,772 0530 Columbia Basin 3rd Powerhouse 09/1985 09/2033 7.150% 107 0531 Columbia Basin 3rd Powerhouse 09/1986 09/2033 7.150% 1,851 0532 Columbia Basin 3rd Powerhouse 09/1986 09/2033 7.150% 15,538 0533 Columbia Basin 3rd Powerhouse 09/1987 09/2033 7.150% 1,730 0534 Columbia Basin 3rd Powerhouse 09/1987 09/2033 7.150% 14,439 0535 Columbia Basin 3rd Powerhouse 09/1988 09/2033 7.150% 2,294 0536 Columbia Basin 3rd Powerhouse 09/1988 09/2033 7.150% 4,351 0537 Columbia Basin 3rd Powerhouse 09/1989 09/2033 7.150% 10,902 0538 Columbia Basin 3rd Powerhouse 09/1990 09/2033 7.150% 6,383 0539 Columbia Basin 3rd Powerhouse 09/1994 09/2044 7.150% 12,631 12,631540 Columbia River Fish Mitigation 09/1991 09/2041 8.500% 3,969 0541 Columbia River Fish Mitigation 09/1992 09/2042 8.500% 874 0542 Columbia River Fish Mitigation 09/1993 09/2043 8.500% 85,846 0543 Columbia River Fish Mitigation 09/1994 09/2044 8.500% 39,454 0544 Columbia River Fish Mitigation 09/1995 09/2045 7.150% 43,343 39,282545 Columbia River Fish Mitigation 09/1996 09/2046 7.150% 2,431 2,431546 Columbia River Fish Mitigation 09/1999 09/2049 5.375% 14,115 14,115547 Columbia River Fish Mitigation 09/2000 09/2050 6.125% 47,006 47,006548 Columbia River Fish Mitigation 09/2001 09/2051 5.875% 6,168 6,168549 Columbia River Fish Mitigation 09/2002 09/2052 5.500% 8,797 8,797550 Columbia River Fish Mitigation 09/2003 09/2053 5.125% 68,440 68,440551 Columbia River Fish Mitigation 09/2004 09/2054 5.375% 60,581 60,581552 Columbia River Fish Mitigation 09/2005 09/2055 5.125% 52,039 52,039553 Columbia River Fish Mitigation 09/2006 09/2056 4.500% 366,395 366,395554 Columbia River Fish Mitigation 09/2007 09/2057 5.000% 53,525 53,525555 Columbia River Fish Mitigation 09/2008 09/2058 4.875% 36,554 36,554556 Columbia River Fish Mitigation 09/2009 09/2059 4.375% 103,203 103,203557 Columbia River Fish Mitigation 09/2010 09/2060 4.250% 56,832 56,832558 Columbia River Fish Mitigation 09/2011 09/2061 3.750% 106,014 106,014559 Columbia River Fish Mitigation 09/2012 09/2062 3.375% 101,616 101,616560 Columbia River Fish Mitigation 09/2013 09/2063 2.875% 95,274 95,274561 Columbia River Fish Mitigation 09/2014 09/2064 3.875% 110,071 110,071562 Columbia River Fish Mitigation 09/2015 09/2065 3.250% 64,291 64,291563 Columbia River Fish Mitigation 09/2016 09/2066 3.000% 30,190 30,190564 Cougar 09/1964 09/2014 7.230% 10,414 0565 Cougar 09/1965 09/2014 7.230% 20 0566 Cougar 09/1966 09/2014 7.230% 20 0567 Cougar 09/1967 09/2014 7.230% 20 0568 Cougar 09/1968 09/2014 7.230% 20 0569 Cougar 09/1969 09/2014 7.230% 20 0570 Cougar 09/1970 09/2014 7.230% 20 0571 Cougar 09/1971 09/2014 7.230% 20 0572 Cougar 09/1972 09/2014 7.230% 20 0573 Cougar 09/1973 09/2014 7.230% 20 0574 Cougar 09/1974 09/2014 7.230% 19 0
BP-18-FS-BPA-02A Page 83
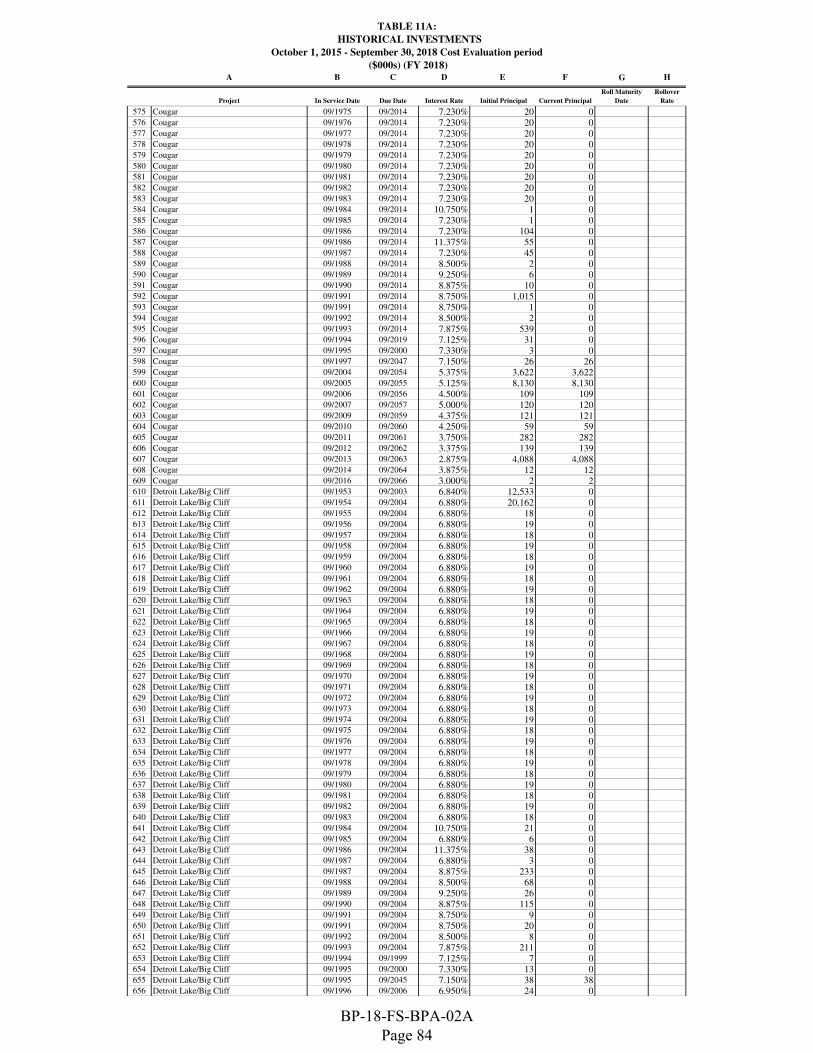
TABLE 11A:
HISTORICAL INVESTMENTS
October 1, 2015 - September 30, 2018 Cost Evaluation period
($000s) (FY 2018)A B C D E F G H
Project In Service Date Due Date Interest Rate Initial Principal Current Principal
Roll Maturity
Date
Rollover
Rate
575 Cougar 09/1975 09/2014 7.230% 20 0576 Cougar 09/1976 09/2014 7.230% 20 0577 Cougar 09/1977 09/2014 7.230% 20 0578 Cougar 09/1978 09/2014 7.230% 20 0579 Cougar 09/1979 09/2014 7.230% 20 0580 Cougar 09/1980 09/2014 7.230% 20 0581 Cougar 09/1981 09/2014 7.230% 20 0582 Cougar 09/1982 09/2014 7.230% 20 0583 Cougar 09/1983 09/2014 7.230% 20 0584 Cougar 09/1984 09/2014 10.750% 1 0585 Cougar 09/1985 09/2014 7.230% 1 0586 Cougar 09/1986 09/2014 7.230% 104 0587 Cougar 09/1986 09/2014 11.375% 55 0588 Cougar 09/1987 09/2014 7.230% 45 0589 Cougar 09/1988 09/2014 8.500% 2 0590 Cougar 09/1989 09/2014 9.250% 6 0591 Cougar 09/1990 09/2014 8.875% 10 0592 Cougar 09/1991 09/2014 8.750% 1,015 0593 Cougar 09/1991 09/2014 8.750% 1 0594 Cougar 09/1992 09/2014 8.500% 2 0595 Cougar 09/1993 09/2014 7.875% 539 0596 Cougar 09/1994 09/2019 7.125% 31 0597 Cougar 09/1995 09/2000 7.330% 3 0598 Cougar 09/1997 09/2047 7.150% 26 26599 Cougar 09/2004 09/2054 5.375% 3,622 3,622600 Cougar 09/2005 09/2055 5.125% 8,130 8,130601 Cougar 09/2006 09/2056 4.500% 109 109602 Cougar 09/2007 09/2057 5.000% 120 120603 Cougar 09/2009 09/2059 4.375% 121 121604 Cougar 09/2010 09/2060 4.250% 59 59605 Cougar 09/2011 09/2061 3.750% 282 282606 Cougar 09/2012 09/2062 3.375% 139 139607 Cougar 09/2013 09/2063 2.875% 4,088 4,088608 Cougar 09/2014 09/2064 3.875% 12 12609 Cougar 09/2016 09/2066 3.000% 2 2610 Detroit Lake/Big Cliff 09/1953 09/2003 6.840% 12,533 0611 Detroit Lake/Big Cliff 09/1954 09/2004 6.880% 20,162 0612 Detroit Lake/Big Cliff 09/1955 09/2004 6.880% 18 0613 Detroit Lake/Big Cliff 09/1956 09/2004 6.880% 19 0614 Detroit Lake/Big Cliff 09/1957 09/2004 6.880% 18 0615 Detroit Lake/Big Cliff 09/1958 09/2004 6.880% 19 0616 Detroit Lake/Big Cliff 09/1959 09/2004 6.880% 18 0617 Detroit Lake/Big Cliff 09/1960 09/2004 6.880% 19 0618 Detroit Lake/Big Cliff 09/1961 09/2004 6.880% 18 0619 Detroit Lake/Big Cliff 09/1962 09/2004 6.880% 19 0620 Detroit Lake/Big Cliff 09/1963 09/2004 6.880% 18 0621 Detroit Lake/Big Cliff 09/1964 09/2004 6.880% 19 0622 Detroit Lake/Big Cliff 09/1965 09/2004 6.880% 18 0623 Detroit Lake/Big Cliff 09/1966 09/2004 6.880% 19 0624 Detroit Lake/Big Cliff 09/1967 09/2004 6.880% 18 0625 Detroit Lake/Big Cliff 09/1968 09/2004 6.880% 19 0626 Detroit Lake/Big Cliff 09/1969 09/2004 6.880% 18 0627 Detroit Lake/Big Cliff 09/1970 09/2004 6.880% 19 0628 Detroit Lake/Big Cliff 09/1971 09/2004 6.880% 18 0629 Detroit Lake/Big Cliff 09/1972 09/2004 6.880% 19 0630 Detroit Lake/Big Cliff 09/1973 09/2004 6.880% 18 0631 Detroit Lake/Big Cliff 09/1974 09/2004 6.880% 19 0632 Detroit Lake/Big Cliff 09/1975 09/2004 6.880% 18 0633 Detroit Lake/Big Cliff 09/1976 09/2004 6.880% 19 0634 Detroit Lake/Big Cliff 09/1977 09/2004 6.880% 18 0635 Detroit Lake/Big Cliff 09/1978 09/2004 6.880% 19 0636 Detroit Lake/Big Cliff 09/1979 09/2004 6.880% 18 0637 Detroit Lake/Big Cliff 09/1980 09/2004 6.880% 19 0638 Detroit Lake/Big Cliff 09/1981 09/2004 6.880% 18 0639 Detroit Lake/Big Cliff 09/1982 09/2004 6.880% 19 0640 Detroit Lake/Big Cliff 09/1983 09/2004 6.880% 18 0641 Detroit Lake/Big Cliff 09/1984 09/2004 10.750% 21 0642 Detroit Lake/Big Cliff 09/1985 09/2004 6.880% 6 0643 Detroit Lake/Big Cliff 09/1986 09/2004 11.375% 38 0644 Detroit Lake/Big Cliff 09/1987 09/2004 6.880% 3 0645 Detroit Lake/Big Cliff 09/1987 09/2004 8.875% 233 0646 Detroit Lake/Big Cliff 09/1988 09/2004 8.500% 68 0647 Detroit Lake/Big Cliff 09/1989 09/2004 9.250% 26 0648 Detroit Lake/Big Cliff 09/1990 09/2004 8.875% 115 0649 Detroit Lake/Big Cliff 09/1991 09/2004 8.750% 9 0650 Detroit Lake/Big Cliff 09/1991 09/2004 8.750% 20 0651 Detroit Lake/Big Cliff 09/1992 09/2004 8.500% 8 0652 Detroit Lake/Big Cliff 09/1993 09/2004 7.875% 211 0653 Detroit Lake/Big Cliff 09/1994 09/1999 7.125% 7 0654 Detroit Lake/Big Cliff 09/1995 09/2000 7.330% 13 0655 Detroit Lake/Big Cliff 09/1995 09/2045 7.150% 38 38656 Detroit Lake/Big Cliff 09/1996 09/2006 6.950% 24 0
BP-18-FS-BPA-02A Page 84

TABLE 11A:
HISTORICAL INVESTMENTS
October 1, 2015 - September 30, 2018 Cost Evaluation period
($000s) (FY 2018)A B C D E F G H
Project In Service Date Due Date Interest Rate Initial Principal Current Principal
Roll Maturity
Date
Rollover
Rate
657 Detroit Lake/Big Cliff 09/2001 09/2051 5.875% 282 282658 Detroit Lake/Big Cliff 09/2002 09/2052 5.500% 18 18659 Detroit Lake/Big Cliff 09/2003 09/2053 5.125% 223 223660 Detroit Lake/Big Cliff 09/2005 09/2055 5.125% 1,031 1,031661 Detroit Lake/Big Cliff 09/2013 09/2063 2.875% 528 528662 Detroit Lake/Big Cliff 09/2014 09/2064 3.875% 18 18663 Detroit Lake/Big Cliff 09/2016 09/2066 3.000% 31 31664 Dworshak 09/1973 09/2023 7.190% 138,443 0665 Dworshak 09/1973 09/2023 7.190% 836 0666 Dworshak 09/1974 09/2023 7.190% 515 0667 Dworshak 09/1974 09/2023 7.190% 3 0668 Dworshak 09/1975 09/2023 7.190% 518 0669 Dworshak 09/1975 09/2023 7.190% 3 0670 Dworshak 09/1976 09/2023 7.190% 518 0671 Dworshak 09/1976 09/2023 7.190% 3 0672 Dworshak 09/1977 09/2023 7.190% 518 0673 Dworshak 09/1977 09/2023 7.190% 3 0674 Dworshak 09/1978 09/2023 7.190% 518 0675 Dworshak 09/1978 09/2023 7.190% 3 0676 Dworshak 09/1979 09/2023 7.190% 518 0677 Dworshak 09/1979 09/2023 7.190% 3 0678 Dworshak 09/1980 09/2023 7.190% 518 0679 Dworshak 09/1980 09/2023 7.190% 3 0680 Dworshak 09/1981 09/2023 7.190% 518 0681 Dworshak 09/1981 09/2023 7.190% 3 0682 Dworshak 09/1982 09/2023 7.190% 518 0683 Dworshak 09/1982 09/2023 7.190% 3 0684 Dworshak 09/1983 09/2023 7.190% 523 0685 Dworshak 09/1983 09/2023 7.190% 3 0686 Dworshak 09/1984 09/2023 10.750% 2,499 0687 Dworshak 09/1984 09/2023 10.750% 15 0688 Dworshak 09/1985 09/2023 7.190% 1,141 0689 Dworshak 09/1986 09/2023 7.190% 197 0690 Dworshak 09/1987 09/2023 7.190% 36 0691 Dworshak 09/1987 09/2023 8.875% 65 0692 Dworshak 09/1988 09/2023 8.500% 61 0693 Dworshak 09/1989 09/2023 9.250% 63 0694 Dworshak 09/1990 09/2023 8.875% 245 0695 Dworshak 09/1990 09/2023 8.875% 24 0696 Dworshak 09/1991 09/2023 8.750% 224 0697 Dworshak 09/1992 09/2023 2.625% 4 0698 Dworshak 09/1992 09/2023 8.500% 28 0699 Dworshak 09/1992 09/2023 8.500% 24 0700 Dworshak 09/1993 09/2023 7.875% 41 0701 Dworshak 09/1993 09/2023 7.875% 1,872 0702 Dworshak 09/1994 09/2029 7.125% 1,351 0703 Dworshak 09/1994 09/2029 7.125% 964 0704 Dworshak 09/1995 09/2020 7.930% 55 0705 Dworshak 09/1995 09/2030 7.150% 218 0706 Dworshak 09/1995 09/2045 7.150% 1,162 1,162707 Dworshak 09/1996 09/2011 7.130% 107 0708 Dworshak 09/1996 09/2021 7.230% 26 0709 Dworshak 09/1996 09/2021 7.230% 184 0710 Dworshak 09/1996 09/2031 7.150% 6 0711 Dworshak 09/1996 09/2031 7.150% 203 0712 Dworshak 09/1996 09/2046 7.150% 3 3713 Dworshak 09/1996 09/2046 7.150% 4 4714 Dworshak 09/1996 09/2046 7.150% 46 46715 Dworshak 09/1997 09/2047 7.150% 7,588 7,588716 Dworshak 09/1999 09/2049 5.375% 630 630717 Dworshak 09/2002 09/2052 5.500% 199 199718 Dworshak 09/2003 09/2053 5.125% 761 761719 Dworshak 09/2005 09/2055 5.125% 713 713720 Dworshak 09/2006 09/2056 4.500% 73 73721 Dworshak 09/2008 09/2058 4.875% 10 10722 Dworshak 09/2009 09/2059 4.375% 2,307 2,307723 Dworshak 09/2014 09/2064 3.875% 50 0724 Green Peter/Foster 09/1967 09/2017 7.290% 24,445 0725 Green Peter/Foster 09/1968 09/2018 7.280% 12,180 0726 Green Peter/Foster 09/1969 09/2018 7.280% 39 0727 Green Peter/Foster 09/1970 09/2018 7.280% 40 0728 Green Peter/Foster 09/1971 09/2018 7.280% 39 0729 Green Peter/Foster 09/1972 09/2018 7.280% 39 0730 Green Peter/Foster 09/1973 09/2018 7.280% 39 0731 Green Peter/Foster 09/1974 09/2018 7.280% 39 0732 Green Peter/Foster 09/1975 09/2018 7.280% 39 0733 Green Peter/Foster 09/1976 09/2018 7.280% 39 0734 Green Peter/Foster 09/1977 09/2018 7.280% 39 0735 Green Peter/Foster 09/1978 09/2018 7.280% 39 0736 Green Peter/Foster 09/1979 09/2018 7.280% 39 0737 Green Peter/Foster 09/1980 09/2018 7.280% 40 0738 Green Peter/Foster 09/1981 09/2018 7.280% 39 0
BP-18-FS-BPA-02A Page 85

TABLE 11A:
HISTORICAL INVESTMENTS
October 1, 2015 - September 30, 2018 Cost Evaluation period
($000s) (FY 2018)A B C D E F G H
Project In Service Date Due Date Interest Rate Initial Principal Current Principal
Roll Maturity
Date
Rollover
Rate
739 Green Peter/Foster 09/1982 09/2018 7.280% 39 0740 Green Peter/Foster 09/1983 09/2018 7.280% 39 0741 Green Peter/Foster 09/1984 09/2018 10.750% 15 0742 Green Peter/Foster 09/1985 09/2018 7.280% 16 0743 Green Peter/Foster 09/1986 09/2018 7.280% 3 0744 Green Peter/Foster 09/1986 09/2018 11.375% 3 0745 Green Peter/Foster 09/1987 09/2018 7.280% 1 0746 Green Peter/Foster 09/1987 09/2018 8.875% 2 0747 Green Peter/Foster 09/1988 09/2018 8.500% 13 0748 Green Peter/Foster 09/1989 09/2018 9.250% 24 0749 Green Peter/Foster 09/1990 09/2018 8.875% 5 0750 Green Peter/Foster 09/1991 09/2018 8.750% 48 0751 Green Peter/Foster 09/1992 09/2018 8.500% 2 0752 Green Peter/Foster 09/1993 09/2018 7.875% 41 0753 Green Peter/Foster 09/1994 09/1999 7.125% 6 0754 Green Peter/Foster 09/1995 09/2000 7.330% 4 0755 Green Peter/Foster 09/1995 09/2020 7.250% 11 0756 Green Peter/Foster 09/1995 09/2020 7.250% 24 0757 Green Peter/Foster 09/1996 09/2046 7.150% 26 26758 Green Peter/Foster 09/2001 09/2051 5.875% 200 200759 Green Peter/Foster 09/2011 09/2061 3.750% 87 87760 Green Peter/Foster 09/2012 09/2062 3.375% 28 28761 Green Peter/Foster 09/2014 09/2064 3.875% 385 385762 Green Peter/Foster 09/2015 09/2065 3.250% 68 68763 Green Peter/Foster 09/2016 09/2066 3.000% 70 70764 Hills Creek 09/1962 09/2012 7.160% 10,353 0765 Hills Creek 09/1963 09/2012 7.160% 12 0766 Hills Creek 09/1964 09/2012 7.160% 13 0767 Hills Creek 09/1965 09/2012 7.160% 13 0768 Hills Creek 09/1966 09/2012 7.160% 13 0769 Hills Creek 09/1967 09/2012 7.160% 13 0770 Hills Creek 09/1968 09/2012 7.160% 13 0771 Hills Creek 09/1969 09/2012 7.160% 13 0772 Hills Creek 09/1970 09/2012 7.160% 13 0773 Hills Creek 09/1971 09/2012 7.160% 13 0774 Hills Creek 09/1972 09/2012 7.160% 13 0775 Hills Creek 09/1973 09/2012 7.160% 13 0776 Hills Creek 09/1974 09/2012 7.160% 13 0777 Hills Creek 09/1975 09/2012 7.160% 13 0778 Hills Creek 09/1976 09/2012 7.160% 13 0779 Hills Creek 09/1977 09/2012 7.160% 13 0780 Hills Creek 09/1978 09/2012 7.160% 13 0781 Hills Creek 09/1979 09/2012 7.160% 13 0782 Hills Creek 09/1980 09/2012 7.160% 13 0783 Hills Creek 09/1981 09/2012 7.160% 13 0784 Hills Creek 09/1982 09/2012 7.160% 13 0785 Hills Creek 09/1983 09/2012 7.160% 13 0786 Hills Creek 09/1984 09/2012 10.750% 52 0787 Hills Creek 09/1985 09/2012 7.160% 6 0788 Hills Creek 09/1987 09/2012 8.875% 3 0789 Hills Creek 09/1988 09/2012 8.500% 3 0790 Hills Creek 09/1990 09/2012 8.875% 3 0791 Hills Creek 09/1991 09/2012 8.750% 17 0792 Hills Creek 09/1992 09/2012 8.500% 1 0793 Hills Creek 09/1993 09/2012 7.875% 13 0794 Hills Creek 09/1996 09/2046 7.150% 28 28795 Hills Creek 09/2000 09/2050 6.125% 2,630 2,630796 Hills Creek 09/2001 09/2051 5.875% 8 8797 Hills Creek 09/2002 09/2052 5.500% 2 2798 Hills Creek 09/2005 09/2055 5.125% 46 46799 Hills Creek 09/2011 09/2061 3.750% 12 12800 Hills Creek 09/2012 09/2062 3.375% 142 142801 Hungry Horse Dam 09/1953 09/2003 6.840% 75,076 0802 Hungry Horse Dam 09/1953 09/2003 6.840% 2,126 0803 Hungry Horse Dam 09/1954 09/2003 6.840% 17 0804 Hungry Horse Dam 09/1954 09/2003 6.840% 1 0805 Hungry Horse Dam 09/1955 09/2003 6.840% 17 0806 Hungry Horse Dam 09/1955 09/2003 6.840% 1 0807 Hungry Horse Dam 09/1956 09/2003 6.840% 17 0808 Hungry Horse Dam 09/1956 09/2003 6.840% 1 0809 Hungry Horse Dam 09/1957 09/2003 6.840% 18 0810 Hungry Horse Dam 09/1957 09/2003 6.840% 1 0811 Hungry Horse Dam 09/1958 09/2003 6.840% 18 0812 Hungry Horse Dam 09/1958 09/2003 6.840% 1 0813 Hungry Horse Dam 09/1959 09/2003 6.840% 18 0814 Hungry Horse Dam 09/1959 09/2003 6.840% 1 0815 Hungry Horse Dam 09/1960 09/2003 6.840% 18 0816 Hungry Horse Dam 09/1960 09/2003 6.840% 1 0817 Hungry Horse Dam 09/1961 09/2003 6.840% 18 0818 Hungry Horse Dam 09/1961 09/2003 6.840% 1 0819 Hungry Horse Dam 09/1962 09/2003 6.840% 18 0820 Hungry Horse Dam 09/1962 09/2003 6.840% 1 0
BP-18-FS-BPA-02A Page 86
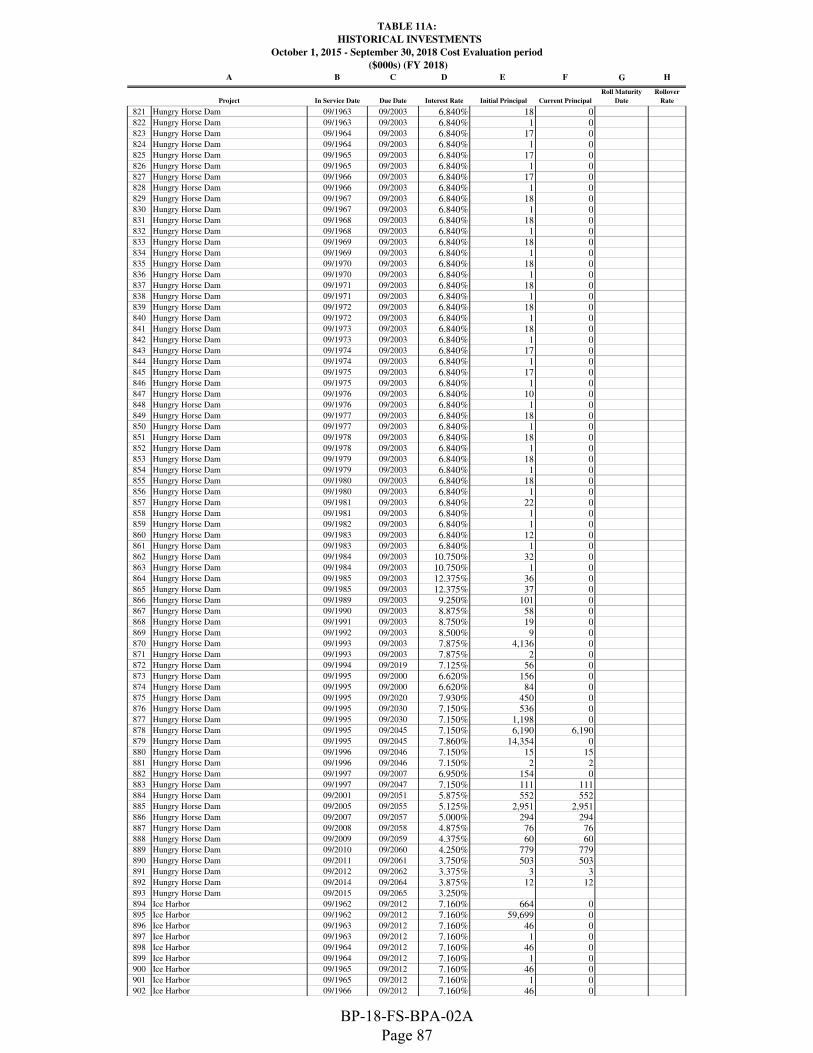
TABLE 11A:
HISTORICAL INVESTMENTS
October 1, 2015 - September 30, 2018 Cost Evaluation period
($000s) (FY 2018)A B C D E F G H
Project In Service Date Due Date Interest Rate Initial Principal Current Principal
Roll Maturity
Date
Rollover
Rate
821 Hungry Horse Dam 09/1963 09/2003 6.840% 18 0822 Hungry Horse Dam 09/1963 09/2003 6.840% 1 0823 Hungry Horse Dam 09/1964 09/2003 6.840% 17 0824 Hungry Horse Dam 09/1964 09/2003 6.840% 1 0825 Hungry Horse Dam 09/1965 09/2003 6.840% 17 0826 Hungry Horse Dam 09/1965 09/2003 6.840% 1 0827 Hungry Horse Dam 09/1966 09/2003 6.840% 17 0828 Hungry Horse Dam 09/1966 09/2003 6.840% 1 0829 Hungry Horse Dam 09/1967 09/2003 6.840% 18 0830 Hungry Horse Dam 09/1967 09/2003 6.840% 1 0831 Hungry Horse Dam 09/1968 09/2003 6.840% 18 0832 Hungry Horse Dam 09/1968 09/2003 6.840% 1 0833 Hungry Horse Dam 09/1969 09/2003 6.840% 18 0834 Hungry Horse Dam 09/1969 09/2003 6.840% 1 0835 Hungry Horse Dam 09/1970 09/2003 6.840% 18 0836 Hungry Horse Dam 09/1970 09/2003 6.840% 1 0837 Hungry Horse Dam 09/1971 09/2003 6.840% 18 0838 Hungry Horse Dam 09/1971 09/2003 6.840% 1 0839 Hungry Horse Dam 09/1972 09/2003 6.840% 18 0840 Hungry Horse Dam 09/1972 09/2003 6.840% 1 0841 Hungry Horse Dam 09/1973 09/2003 6.840% 18 0842 Hungry Horse Dam 09/1973 09/2003 6.840% 1 0843 Hungry Horse Dam 09/1974 09/2003 6.840% 17 0844 Hungry Horse Dam 09/1974 09/2003 6.840% 1 0845 Hungry Horse Dam 09/1975 09/2003 6.840% 17 0846 Hungry Horse Dam 09/1975 09/2003 6.840% 1 0847 Hungry Horse Dam 09/1976 09/2003 6.840% 10 0848 Hungry Horse Dam 09/1976 09/2003 6.840% 1 0849 Hungry Horse Dam 09/1977 09/2003 6.840% 18 0850 Hungry Horse Dam 09/1977 09/2003 6.840% 1 0851 Hungry Horse Dam 09/1978 09/2003 6.840% 18 0852 Hungry Horse Dam 09/1978 09/2003 6.840% 1 0853 Hungry Horse Dam 09/1979 09/2003 6.840% 18 0854 Hungry Horse Dam 09/1979 09/2003 6.840% 1 0855 Hungry Horse Dam 09/1980 09/2003 6.840% 18 0856 Hungry Horse Dam 09/1980 09/2003 6.840% 1 0857 Hungry Horse Dam 09/1981 09/2003 6.840% 22 0858 Hungry Horse Dam 09/1981 09/2003 6.840% 1 0859 Hungry Horse Dam 09/1982 09/2003 6.840% 1 0860 Hungry Horse Dam 09/1983 09/2003 6.840% 12 0861 Hungry Horse Dam 09/1983 09/2003 6.840% 1 0862 Hungry Horse Dam 09/1984 09/2003 10.750% 32 0863 Hungry Horse Dam 09/1984 09/2003 10.750% 1 0864 Hungry Horse Dam 09/1985 09/2003 12.375% 36 0865 Hungry Horse Dam 09/1985 09/2003 12.375% 37 0866 Hungry Horse Dam 09/1989 09/2003 9.250% 101 0867 Hungry Horse Dam 09/1990 09/2003 8.875% 58 0868 Hungry Horse Dam 09/1991 09/2003 8.750% 19 0869 Hungry Horse Dam 09/1992 09/2003 8.500% 9 0870 Hungry Horse Dam 09/1993 09/2003 7.875% 4,136 0871 Hungry Horse Dam 09/1993 09/2003 7.875% 2 0872 Hungry Horse Dam 09/1994 09/2019 7.125% 56 0873 Hungry Horse Dam 09/1995 09/2000 6.620% 156 0874 Hungry Horse Dam 09/1995 09/2000 6.620% 84 0875 Hungry Horse Dam 09/1995 09/2020 7.930% 450 0876 Hungry Horse Dam 09/1995 09/2030 7.150% 536 0877 Hungry Horse Dam 09/1995 09/2030 7.150% 1,198 0878 Hungry Horse Dam 09/1995 09/2045 7.150% 6,190 6,190879 Hungry Horse Dam 09/1995 09/2045 7.860% 14,354 0880 Hungry Horse Dam 09/1996 09/2046 7.150% 15 15881 Hungry Horse Dam 09/1996 09/2046 7.150% 2 2882 Hungry Horse Dam 09/1997 09/2007 6.950% 154 0883 Hungry Horse Dam 09/1997 09/2047 7.150% 111 111884 Hungry Horse Dam 09/2001 09/2051 5.875% 552 552885 Hungry Horse Dam 09/2005 09/2055 5.125% 2,951 2,951886 Hungry Horse Dam 09/2007 09/2057 5.000% 294 294887 Hungry Horse Dam 09/2008 09/2058 4.875% 76 76888 Hungry Horse Dam 09/2009 09/2059 4.375% 60 60889 Hungry Horse Dam 09/2010 09/2060 4.250% 779 779890 Hungry Horse Dam 09/2011 09/2061 3.750% 503 503891 Hungry Horse Dam 09/2012 09/2062 3.375% 3 3892 Hungry Horse Dam 09/2014 09/2064 3.875% 12 12893 Hungry Horse Dam 09/2015 09/2065 3.250%894 Ice Harbor 09/1962 09/2012 7.160% 664 0895 Ice Harbor 09/1962 09/2012 7.160% 59,699 0896 Ice Harbor 09/1963 09/2012 7.160% 46 0897 Ice Harbor 09/1963 09/2012 7.160% 1 0898 Ice Harbor 09/1964 09/2012 7.160% 46 0899 Ice Harbor 09/1964 09/2012 7.160% 1 0900 Ice Harbor 09/1965 09/2012 7.160% 46 0901 Ice Harbor 09/1965 09/2012 7.160% 1 0902 Ice Harbor 09/1966 09/2012 7.160% 46 0
BP-18-FS-BPA-02A Page 87

TABLE 11A:
HISTORICAL INVESTMENTS
October 1, 2015 - September 30, 2018 Cost Evaluation period
($000s) (FY 2018)A B C D E F G H
Project In Service Date Due Date Interest Rate Initial Principal Current Principal
Roll Maturity
Date
Rollover
Rate
903 Ice Harbor 09/1966 09/2012 7.160% 1 0904 Ice Harbor 09/1967 09/2012 7.160% 46 0905 Ice Harbor 09/1967 09/2012 7.160% 1 0906 Ice Harbor 09/1968 09/2012 7.160% 46 0907 Ice Harbor 09/1968 09/2012 7.160% 1 0908 Ice Harbor 09/1969 09/2012 7.160% 46 0909 Ice Harbor 09/1969 09/2012 7.160% 1 0910 Ice Harbor 09/1970 09/2012 7.160% 46 0911 Ice Harbor 09/1970 09/2012 7.160% 1 0912 Ice Harbor 09/1971 09/2012 7.160% 46 0913 Ice Harbor 09/1971 09/2012 7.160% 1 0914 Ice Harbor 09/1972 09/2012 7.160% 46 0915 Ice Harbor 09/1972 09/2012 7.160% 1 0916 Ice Harbor 09/1973 09/2012 7.160% 46 0917 Ice Harbor 09/1973 09/2012 7.160% 1 0918 Ice Harbor 09/1974 09/2012 7.160% 46 0919 Ice Harbor 09/1974 09/2012 7.160% 1 0920 Ice Harbor 09/1975 09/2012 7.160% 46 0921 Ice Harbor 09/1975 09/2012 7.160% 1 0922 Ice Harbor 09/1976 09/2012 7.160% 46 0923 Ice Harbor 09/1976 09/2012 7.160% 1 0924 Ice Harbor 09/1976 09/2026 7.150% 20,472 0925 Ice Harbor 09/1976 09/2026 7.150% 228 0926 Ice Harbor 09/1977 09/2012 7.160% 46 0927 Ice Harbor 09/1977 09/2012 7.160% 1 0928 Ice Harbor 09/1978 09/2012 7.160% 46 0929 Ice Harbor 09/1978 09/2012 7.160% 1 0930 Ice Harbor 09/1979 09/2012 7.160% 46 0931 Ice Harbor 09/1979 09/2012 7.160% 1 0932 Ice Harbor 09/1980 09/2012 7.160% 46 0933 Ice Harbor 09/1980 09/2012 7.160% 1 0934 Ice Harbor 09/1981 09/2012 7.160% 46 0935 Ice Harbor 09/1981 09/2012 7.160% 1 0936 Ice Harbor 09/1982 09/2012 7.160% 46 0937 Ice Harbor 09/1982 09/2012 7.160% 1 0938 Ice Harbor 09/1983 09/2012 7.160% 46 0939 Ice Harbor 09/1983 09/2012 7.160% 1 0940 Ice Harbor 09/1985 09/2012 7.160% 41 0941 Ice Harbor 09/1985 09/2026 7.150% 21 0942 Ice Harbor 09/1986 09/2012 7.160% 137 0943 Ice Harbor 09/1987 09/2012 7.160% 3 0944 Ice Harbor 09/1987 09/2012 8.875% 71 0945 Ice Harbor 09/1987 09/2012 8.875% 1 0946 Ice Harbor 09/1988 09/2012 8.500% 8 0947 Ice Harbor 09/1988 09/2012 8.500% 57 0948 Ice Harbor 09/1989 09/2012 9.250% 51 0949 Ice Harbor 09/1990 09/2012 8.875% 427 0950 Ice Harbor 09/1991 09/2012 8.750% 348 0951 Ice Harbor 09/1992 09/2012 8.500% 177 0952 Ice Harbor 09/1993 09/2012 7.875% 3,192 0953 Ice Harbor 09/1993 09/2012 7.875% 1,645 0954 Ice Harbor 09/1994 09/2029 7.125% 328 0955 Ice Harbor 09/1994 09/2029 7.125% 520 0956 Ice Harbor 09/1995 09/2000 7.330% 2 0957 Ice Harbor 09/1995 09/2019 7.270% 84 0958 Ice Harbor 09/1995 09/2019 7.270% 171 0959 Ice Harbor 09/1995 09/2019 7.270% 849 0960 Ice Harbor 09/1996 09/2031 7.150% 78 0961 Ice Harbor 09/1996 09/2041 7.150% 371 371962 Ice Harbor 09/1997 09/2022 7.230% 66 0963 Ice Harbor 09/1997 09/2047 7.150% 67 67964 Ice Harbor 09/1999 09/2049 5.375% 5,516 5,516965 Ice Harbor 09/2000 09/2050 6.125% 548 548966 Ice Harbor 09/2001 09/2051 5.875% 764 764967 Ice Harbor 09/2002 09/2052 5.500% 1,014 1,014968 Ice Harbor 09/2003 09/2053 5.125% 50 50969 Ice Harbor 09/2004 09/2054 5.375% 3,321 3,321970 Ice Harbor 09/2008 09/2058 4.875% 14 14971 Ice Harbor 09/2009 09/2059 4.375% 2,615 2,615972 Ice Harbor 09/2010 09/2060 4.250% 207 207973 Ice Harbor 09/2011 09/2061 3.750% 819 819974 Ice Harbor 09/2012 09/2062 3.375% 115 115975 Ice Harbor 09/2015 09/2065 3.250% 3,175 3,175976 Ice Harbor 09/2016 09/2066 3.000% 558 558977 John Day 09/1968 09/2018 7.280% 27,254 0978 John Day 09/1969 09/2019 7.270% 96,104 0979 John Day 09/1970 09/2020 7.250% 23,656 0980 John Day 09/1971 09/2021 7.230% 34,974 0981 John Day 09/1972 09/2022 7.210% 11,502 0982 John Day 09/1984 09/2022 10.750% 3,677 0983 John Day 09/1985 09/2022 7.210% 6,490 0984 John Day 09/1985 09/2022 12.375% 1,209 0
BP-18-FS-BPA-02A Page 88

TABLE 11A:
HISTORICAL INVESTMENTS
October 1, 2015 - September 30, 2018 Cost Evaluation period
($000s) (FY 2018)A B C D E F G H
Project In Service Date Due Date Interest Rate Initial Principal Current Principal
Roll Maturity
Date
Rollover
Rate
985 John Day 09/1986 09/2022 7.210% 3,227 0986 John Day 09/1986 09/2022 11.375% 713 0987 John Day 09/1987 09/2022 7.210% 706 0988 John Day 09/1987 09/2022 8.875% 4,353 0989 John Day 09/1988 09/2022 8.500% 332 0990 John Day 09/1988 09/2022 8.500% 199 0991 John Day 09/1989 09/2022 7.210% 30 0992 John Day 09/1989 09/2022 9.250% 377 0993 John Day 09/1990 09/2022 7.210% 37 0994 John Day 09/1990 09/2022 8.875% 543 0995 John Day 09/1991 09/2022 8.750% 13,218 0996 John Day 09/1991 09/2022 8.750% 144 0997 John Day 09/1992 09/2022 7.210% 19 0998 John Day 09/1992 09/2022 8.500% 95 0999 John Day 09/1993 09/2022 7.875% 7,810 01000 John Day 09/1993 09/2022 7.875% 9,585 01001 John Day 09/1994 09/2019 7.125% 14 01002 John Day 09/1994 09/2029 7.125% 1,252 01003 John Day 09/1995 09/2000 7.330% 2 01004 John Day 09/1995 09/2000 7.330% 9 01005 John Day 09/1995 09/2020 7.250% 79 01006 John Day 09/1995 09/2035 7.150% 22 221007 John Day 09/1995 09/2035 7.150% 52 521008 John Day 09/1995 09/2035 7.150% 121 1211009 John Day 09/1995 09/2045 7.150% 37 371010 John Day 09/1995 09/2045 7.150% 608 6081011 John Day 09/1995 09/2045 7.150% 7,653 7,6531012 John Day 09/1996 09/2011 7.130% 237 01013 John Day 09/1996 09/2016 7.290% 1,072 01014 John Day 09/1997 09/2022 7.230% 133 01015 John Day 09/1997 09/2047 7.150% 179 1791016 John Day 09/1999 09/2049 5.375% 3,510 3,5101017 John Day 09/2000 09/2050 6.125% 2,761 2,7611018 John Day 09/2001 09/2051 5.875% 619 6191019 John Day 09/2004 09/2054 5.375% 2,830 2,8301020 John Day 09/2005 09/2055 5.125% 2,827 2,8271021 John Day 09/2006 09/2056 4.500% 601 6011022 John Day 09/2007 09/2057 5.000% 233 2331023 John Day 09/2009 09/2059 4.375% 1,548 1,5481024 John Day 09/2010 09/2060 4.250% 356 3561025 John Day 09/2011 09/2061 3.750% 175 1751026 John Day 09/2012 09/2062 3.375% 6,161 6,1611027 John Day 09/2013 09/2063 2.875% 17 171028 John Day 09/2015 09/2065 3.250% 163 1631029 Libby 09/1975 09/2025 7.160% 54,644 01030 Libby 09/1976 09/2026 7.150% 153,432 01031 Libby 09/1977 09/2026 7.150% 1,465 01032 Libby 09/1978 09/2026 7.150% 1,465 01033 Libby 09/1979 09/2026 7.150% 1,465 01034 Libby 09/1980 09/2026 7.150% 1,465 01035 Libby 09/1981 09/2026 7.150% 1,465 01036 Libby 09/1982 09/2026 7.150% 1,465 01037 Libby 09/1983 09/2026 7.150% 1,465 01038 Libby 09/1984 09/2026 10.750% 104 01039 Libby 09/1985 09/2026 7.150% 518 01040 Libby 09/1986 09/2026 7.150% 283 01041 Libby 09/1987 09/2026 7.150% 2 01042 Libby 09/1988 09/2026 8.505% 35 01043 Libby 09/1988 09/2038 7.150% 18,043 14,7811044 Libby 09/1989 09/2026 7.150% 1 01045 Libby 09/1989 09/2026 9.250% 131 01046 Libby 09/1990 09/2026 8.875% 11 01047 Libby 09/1991 09/2026 8.750% 134 01048 Libby 09/1992 09/2026 8.500% 100 01049 Libby 09/1992 09/2026 8.500% 70 01050 Libby 09/1993 09/2026 7.875% 600 01051 Libby 09/1994 09/2029 7.125% 215 01052 Libby 09/1994 09/2029 7.150% 286 01053 Libby 09/1995 09/2030 7.150% 15 01054 Libby 09/1995 09/2030 7.150% 41 01055 Libby 09/1995 09/2030 7.150% 94 01056 Libby 09/1997 09/2022 7.230% 432 01057 Libby 09/1997 09/2047 7.150% 660 6601058 Libby 09/2001 09/2051 5.875% 5,562 5,5621059 Libby 09/2008 09/2058 4.875% 1,567 1,5671060 Libby 09/2010 09/2060 4.250% 40 401061 Libby 09/2011 09/2061 3.750% 152 1521062 Libby 09/2012 09/2062 3.375% 16 161063 Little Goose 09/1970 09/2020 7.250% 22,326 01064 Little Goose 09/1971 09/2021 7.230% 42,962 01065 Little Goose 09/1972 09/2021 7.230% 28 01066 Little Goose 09/1973 09/2021 7.230% 29 0
BP-18-FS-BPA-02A Page 89

TABLE 11A:
HISTORICAL INVESTMENTS
October 1, 2015 - September 30, 2018 Cost Evaluation period
($000s) (FY 2018)A B C D E F G H
Project In Service Date Due Date Interest Rate Initial Principal Current Principal
Roll Maturity
Date
Rollover
Rate
1067 Little Goose 09/1974 09/2021 7.230% 28 01068 Little Goose 09/1975 09/2021 7.230% 29 01069 Little Goose 09/1976 09/2021 7.230% 28 01070 Little Goose 09/1977 09/2021 7.230% 29 01071 Little Goose 09/1978 09/2021 7.230% 28 01072 Little Goose 09/1978 09/2028 7.150% 49,578 01073 Little Goose 09/1979 09/2021 7.230% 29 01074 Little Goose 09/1980 09/2021 7.230% 28 01075 Little Goose 09/1981 09/2021 7.230% 29 01076 Little Goose 09/1982 09/2021 7.230% 28 01077 Little Goose 09/1983 09/2021 7.230% 29 01078 Little Goose 09/1984 09/2021 10.750% 201 01079 Little Goose 09/1985 09/2021 7.230% 174 01080 Little Goose 09/1985 09/2028 7.150% 47 01081 Little Goose 09/1986 09/2021 7.230% 239 01082 Little Goose 09/1987 09/2021 7.230% 6 01083 Little Goose 09/1987 09/2021 8.875% 72 01084 Little Goose 09/1988 09/2021 8.500% 12 01085 Little Goose 09/1988 09/2021 8.500% 68 01086 Little Goose 09/1989 09/2021 9.250% 77 01087 Little Goose 09/1990 09/2021 8.875% 408 01088 Little Goose 09/1990 09/2021 8.875% 21 01089 Little Goose 09/1991 09/2021 8.750% 266 01090 Little Goose 09/1992 09/2021 8.500% 66 01091 Little Goose 09/1992 09/2021 8.500% 27 01092 Little Goose 09/1993 09/2021 7.875% 276 01093 Little Goose 09/1993 09/2021 7.875% 3,359 01094 Little Goose 09/1994 09/2019 7.125% 37 01095 Little Goose 09/1994 09/2029 7.125% 2,044 01096 Little Goose 09/1995 09/2040 7.150% 17 171097 Little Goose 09/1995 09/2040 7.150% 450 4501098 Little Goose 09/1995 09/2040 7.150% 733 7331099 Little Goose 09/1996 09/2046 7.150% 10 101100 Little Goose 09/1996 09/2046 7.150% 10 101101 Little Goose 09/1996 09/2046 7.150% 211 2111102 Little Goose 09/1996 09/2046 7.150% 241 2411103 Little Goose 09/1996 09/2046 7.150% 520 5201104 Little Goose 09/1996 09/2046 7.150% 3,909 3,9091105 Little Goose 09/1997 09/2047 7.150% 1 11106 Little Goose 09/2001 09/2051 5.875% 4,608 4,6081107 Little Goose 09/2002 09/2052 5.500% 27 271108 Little Goose 09/2003 09/2053 5.125% 146 1461109 Little Goose 09/2004 09/2054 5.375% 67 671110 Little Goose 09/2008 09/2058 4.875% 13 131111 Little Goose 09/2009 09/2059 4.375% 3,171 3,1711112 Little Goose 09/2010 09/2060 4.250% 30 301113 Little Goose 09/2013 09/2063 2.875% 66 661114 Lookout Dam 09/1955 09/2005 6.910% 34,290 01115 Lookout Dam 09/1956 09/2005 6.910% 52 01116 Lookout Dam 09/1957 09/2005 6.910% 51 01117 Lookout Dam 09/1958 09/2005 6.910% 51 01118 Lookout Dam 09/1959 09/2005 6.910% 51 01119 Lookout Dam 09/1960 09/2005 6.910% 51 01120 Lookout Dam 09/1961 09/2005 6.910% 52 01121 Lookout Dam 09/1962 09/2005 6.910% 51 01122 Lookout Dam 09/1963 09/2005 6.910% 51 01123 Lookout Dam 09/1964 09/2005 6.910% 51 01124 Lookout Dam 09/1965 09/2005 6.910% 51 01125 Lookout Dam 09/1966 09/2005 6.910% 51 01126 Lookout Dam 09/1967 09/2005 6.910% 52 01127 Lookout Dam 09/1968 09/2005 6.910% 51 01128 Lookout Dam 09/1969 09/2005 6.910% 51 01129 Lookout Dam 09/1970 09/2005 6.910% 51 01130 Lookout Dam 09/1971 09/2005 6.910% 51 01131 Lookout Dam 09/1972 09/2005 6.910% 51 01132 Lookout Dam 09/1973 09/2005 6.910% 52 01133 Lookout Dam 09/1974 09/2005 6.910% 51 01134 Lookout Dam 09/1975 09/2005 6.910% 51 01135 Lookout Dam 09/1976 09/2005 6.910% 51 01136 Lookout Dam 09/1977 09/2005 6.910% 51 01137 Lookout Dam 09/1978 09/2005 6.910% 51 01138 Lookout Dam 09/1979 09/2005 6.910% 52 01139 Lookout Dam 09/1980 09/2005 6.910% 51 01140 Lookout Dam 09/1981 09/2005 6.910% 51 01141 Lookout Dam 09/1982 09/2005 6.910% 51 01142 Lookout Dam 09/1983 09/2005 6.910% 51 01143 Lookout Dam 09/1984 09/2005 10.750% 185 01144 Lookout Dam 09/1985 09/2005 6.910% 52 01145 Lookout Dam 09/1986 09/2005 6.910% 42 01146 Lookout Dam 09/1987 09/2005 6.910% 9 01147 Lookout Dam 09/1987 09/2005 8.875% 12 01148 Lookout Dam 09/1988 09/2005 8.500% 46 0
BP-18-FS-BPA-02A Page 90

TABLE 11A:
HISTORICAL INVESTMENTS
October 1, 2015 - September 30, 2018 Cost Evaluation period
($000s) (FY 2018)A B C D E F G H
Project In Service Date Due Date Interest Rate Initial Principal Current Principal
Roll Maturity
Date
Rollover
Rate
1149 Lookout Dam 09/1988 09/2005 8.500% 17 01150 Lookout Dam 09/1989 09/2005 9.250% 23 01151 Lookout Dam 09/1990 09/2005 8.875% 147 01152 Lookout Dam 09/1990 09/2005 8.875% 4 01153 Lookout Dam 09/1991 09/2005 8.750% 6 01154 Lookout Dam 09/1991 09/2005 8.750% 50 01155 Lookout Dam 09/1992 09/2005 8.500% 181 01156 Lookout Dam 09/1992 09/2005 8.500% 4 01157 Lookout Dam 09/1993 09/2005 7.875% 18 01158 Lookout Dam 09/1993 09/2005 7.875% 189 01159 Lookout Dam 09/1994 09/2019 7.125% 73 01160 Lookout Dam 09/1995 09/2045 7.150% 80 391161 Lookout Dam 09/1995 09/2045 7.150% 33 331162 Lookout Dam 09/1995 09/2045 7.860% 9 01163 Lookout Dam 09/1995 09/2045 7.860% 15 01164 Lookout Dam 09/1995 09/2045 7.860% 31 01165 Lookout Dam 09/1995 09/2045 7.860% 157 01166 Lookout Dam 09/2000 09/2050 6.125% 5,098 5,0981167 Lookout Dam 09/2003 09/2053 5.125% 135 1351168 Lookout Dam 09/2005 09/2055 5.125% 7,355 7,3551169 Lookout Dam 09/2007 09/2057 5.000% 572 5721170 Lookout Dam 09/2011 09/2061 3.750% 17 171171 Lookout Dam 09/2012 09/2062 3.375% 294 2941172 Lost Creek 09/1977 09/2027 7.150% 14,293 01173 Lost Creek 09/1978 09/2027 7.150% 58 01174 Lost Creek 09/1979 09/2027 7.150% 60 01175 Lost Creek 09/1980 09/2027 7.150% 60 01176 Lost Creek 09/1981 09/2027 7.150% 60 01177 Lost Creek 09/1982 09/2027 7.150% 60 01178 Lost Creek 09/1983 09/2027 7.150% 60 01179 Lost Creek 09/1984 09/2027 10.750% 243 01180 Lost Creek 09/1985 09/2027 7.150% 12 01181 Lost Creek 09/1986 09/2027 7.150% 6 01182 Lost Creek 09/1986 09/2027 11.375% 5 01183 Lost Creek 09/1987 09/2027 7.150% 4 01184 Lost Creek 09/1987 09/2027 8.875% 3 01185 Lost Creek 09/1988 09/2027 8.500% 7 01186 Lost Creek 09/1989 09/2027 9.250% 9 01187 Lost Creek 09/1990 09/2027 8.875% 1 01188 Lost Creek 09/1991 09/2027 8.750% 31 01189 Lost Creek 09/1992 09/2027 8.500% 1 01190 Lost Creek 09/1992 09/2027 8.500% 1 01191 Lost Creek 09/1993 09/2027 7.875% 1 01192 Lost Creek 09/1993 09/2027 7.875% 14 01193 Lost Creek 09/1995 09/2000 7.330% 4 01194 Lost Creek 09/1995 09/2045 7.150% 94 941195 Lost Creek 09/1996 09/2031 7.150% 31 01196 Lost Creek 09/1996 09/2046 7.150% 24 241197 Lost Creek 09/2001 09/2051 5.875% 147 1471198 Lost Creek 09/2011 09/2061 3.750% 7 71199 Lower Granite 09/1975 09/2025 7.160% 119,237 01200 Lower Granite 09/1976 09/2025 7.160% 510 01201 Lower Granite 09/1977 09/2025 7.160% 510 01202 Lower Granite 09/1978 09/2025 7.160% 510 01203 Lower Granite 09/1978 09/2028 7.150% 40,611 01204 Lower Granite 09/1979 09/2025 7.160% 510 01205 Lower Granite 09/1980 09/2025 7.160% 510 01206 Lower Granite 09/1981 09/2025 7.160% 510 01207 Lower Granite 09/1982 09/2025 7.160% 510 01208 Lower Granite 09/1983 09/2025 7.160% 510 01209 Lower Granite 09/1984 09/2025 10.750% 311 01210 Lower Granite 09/1985 09/2025 7.160% 328 01211 Lower Granite 09/1986 09/2025 7.160% 215 01212 Lower Granite 09/1986 09/2025 11.375% 4 01213 Lower Granite 09/1987 09/2025 7.160% 8 01214 Lower Granite 09/1987 09/2025 8.875% 60 01215 Lower Granite 09/1988 09/2025 8.500% 22 01216 Lower Granite 09/1988 09/2025 8.500% 95 01217 Lower Granite 09/1989 09/2025 9.250% 112 01218 Lower Granite 09/1990 09/2025 8.875% 392 01219 Lower Granite 09/1991 09/2025 8.750% 281 01220 Lower Granite 09/1991 09/2025 8.750% 6 01221 Lower Granite 09/1992 09/2025 8.500% 83 01222 Lower Granite 09/1992 09/2025 8.500% 121 01223 Lower Granite 09/1993 09/2025 7.875% 26 01224 Lower Granite 09/1993 09/2025 7.875% 3,272 01225 Lower Granite 09/1994 09/2019 7.125% 38 01226 Lower Granite 09/1994 09/2029 7.150% 3,543 01227 Lower Granite 09/1995 09/2017 7.290% 77 01228 Lower Granite 09/1995 09/2017 7.290% 388 01229 Lower Granite 09/1995 09/2017 7.290% 458 01230 Lower Granite 09/1995 09/2025 7.160% 96 0
BP-18-FS-BPA-02A Page 91

TABLE 11A:
HISTORICAL INVESTMENTS
October 1, 2015 - September 30, 2018 Cost Evaluation period
($000s) (FY 2018)A B C D E F G H
Project In Service Date Due Date Interest Rate Initial Principal Current Principal
Roll Maturity
Date
Rollover
Rate
1231 Lower Granite 09/1996 09/2011 7.130% 255 01232 Lower Granite 09/1996 09/2031 7.150% 206 01233 Lower Granite 09/1996 09/2046 7.150% 9 91234 Lower Granite 09/1996 09/2046 7.150% 625 6251235 Lower Granite 09/1997 09/2047 7.150% 677 6771236 Lower Granite 09/1999 09/2049 5.375% 856 8561237 Lower Granite 09/2001 09/2051 5.875% 2,025 2,0251238 Lower Granite 09/2002 09/2052 5.500% 1,275 1,2751239 Lower Granite 09/2003 09/2053 5.125% 42 421240 Lower Granite 09/2005 09/2055 5.125% 393 3931241 Lower Granite 09/2008 09/2058 4.875% 24 241242 Lower Granite 09/2009 09/2059 4.375% 5,669 5,6691243 Lower Granite 09/2010 09/2060 4.250% 1,156 1,1561244 Lower Granite 09/2011 09/2061 3.750% 8 81245 Lower Granite 09/2014 09/2064 3.875% 2,644 2,6441246 Lower Granite 09/2015 09/2065 3.250% 1,597 1,5971247 Lower Granite 09/2016 09/2066 3.000% 1,878 1,8781248 Lower Monument 09/1969 09/2019 7.270% 26,974 01249 Lower Monument 09/1970 09/2020 7.250% 51,218 01250 Lower Monument 09/1971 09/2020 7.250% 214 01251 Lower Monument 09/1972 09/2020 7.250% 214 01252 Lower Monument 09/1973 09/2020 7.250% 214 01253 Lower Monument 09/1974 09/2020 7.250% 214 01254 Lower Monument 09/1975 09/2020 7.250% 214 01255 Lower Monument 09/1976 09/2020 7.250% 214 01256 Lower Monument 09/1977 09/2020 7.250% 214 01257 Lower Monument 09/1978 09/2020 7.250% 214 01258 Lower Monument 09/1979 09/2020 7.250% 214 01259 Lower Monument 09/1979 09/2029 7.150% 40,669 01260 Lower Monument 09/1980 09/2020 7.250% 214 01261 Lower Monument 09/1981 09/2020 7.250% 214 01262 Lower Monument 09/1982 09/2020 7.250% 214 01263 Lower Monument 09/1983 09/2020 7.250% 214 01264 Lower Monument 09/1985 09/2020 7.250% 8 01265 Lower Monument 09/1985 09/2029 7.150% 256 01266 Lower Monument 09/1986 09/2020 7.250% 132 01267 Lower Monument 09/1987 09/2020 7.250% 3 01268 Lower Monument 09/1987 09/2020 8.875% 50 01269 Lower Monument 09/1988 09/2020 8.500% 1 01270 Lower Monument 09/1988 09/2020 8.500% 58 01271 Lower Monument 09/1989 09/2020 9.250% 93 01272 Lower Monument 09/1990 09/2020 8.875% 358 01273 Lower Monument 09/1991 09/2020 8.750% 594 01274 Lower Monument 09/1992 09/2020 8.500% 4,484 01275 Lower Monument 09/1993 09/2020 7.875% 24 01276 Lower Monument 09/1993 09/2020 7.875% 2,175 01277 Lower Monument 09/1994 09/2019 7.125% 107 01278 Lower Monument 09/1994 09/2029 7.125% 2,167 01279 Lower Monument 09/1995 09/2000 7.330% 6 01280 Lower Monument 09/1995 09/2045 7.150% 41 411281 Lower Monument 09/1995 09/2045 7.150% 99 991282 Lower Monument 09/1995 09/2045 7.150% 624 6241283 Lower Monument 09/1995 09/2045 7.150% 1,122 1,1221284 Lower Monument 09/1996 09/2016 7.290% 668 01285 Lower Monument 09/1996 09/2021 7.230% 37 01286 Lower Monument 09/1996 09/2021 7.230% 51 01287 Lower Monument 09/1996 09/2036 7.150% 264 2641288 Lower Monument 09/1996 09/2046 7.150% 10 101289 Lower Monument 09/2001 09/2051 5.875% 3,301 3,3011290 Lower Monument 09/2002 09/2052 5.500% 29 291291 Lower Monument 09/2003 09/2053 5.125% 22 221292 Lower Monument 09/2004 09/2054 5.375% 3,423 3,4231293 Lower Monument 09/2005 09/2055 5.125% 527 5271294 Lower Monument 09/2006 09/2056 4.500% 285 2851295 Lower Monument 09/2008 09/2058 4.875% 9 91296 Lower Monument 09/2009 09/2059 4.375% 2,332 2,3321297 Lower Monument 09/2012 09/2062 3.375% 89 891298 Lower Monument 09/2014 09/2064 3.875% 1,430 1,4301299 Lower Monument 09/2016 09/2066 3.000% 155 1551300 Lower Snake Fish and Wildlife 09/1983 09/2033 7.150% 30,488 9,4721301 Lower Snake Fish and Wildlife 09/1985 09/2035 7.150% 47,921 47,9211302 Lower Snake Fish and Wildlife 09/1987 09/2037 7.150% 72,536 72,5361303 Lower Snake Fish and Wildlife 09/1988 09/2038 7.150% 805 8051304 Lower Snake Fish and Wildlife 09/1990 09/2040 7.150% 1,557 1,5571305 Lower Snake Fish and Wildlife 09/1991 09/2041 7.150% 4,411 4,4111306 Lower Snake Fish and Wildlife 09/1993 09/2043 7.150% 71,632 71,6321307 Lower Snake Fish and Wildlife 09/1994 09/2044 7.150% 4,722 4,7221308 Lower Snake Fish and Wildlife 09/1996 09/2046 7.150% 12,085 12,0851309 Lower Snake Fish and Wildlife 09/1997 09/2047 7.150% 2,173 2,1731310 Lower Snake Fish and Wildlife 09/1999 09/2049 5.375% 7 71311 Lower Snake Fish and Wildlife 09/2000 09/2050 6.125% 1,529 1,5291312 Lower Snake Fish and Wildlife 09/2001 09/2051 5.875% 325 325
BP-18-FS-BPA-02A Page 92

TABLE 11A:
HISTORICAL INVESTMENTS
October 1, 2015 - September 30, 2018 Cost Evaluation period
($000s) (FY 2018)A B C D E F G H
Project In Service Date Due Date Interest Rate Initial Principal Current Principal
Roll Maturity
Date
Rollover
Rate
1313 Lower Snake Fish and Wildlife 09/2002 09/2052 5.500% 890 8901314 Lower Snake Fish and Wildlife 09/2003 09/2053 5.125% 98 981315 Lower Snake Fish and Wildlife 09/2004 09/2054 5.375% 230 2301316 Lower Snake Fish and Wildlife 09/2005 09/2055 5.125% 4 41317 Lower Snake Fish and Wildlife 09/2006 09/2056 4.500% 379 3791318 Lower Snake Fish and Wildlife 09/2008 09/2058 4.875% 74 741319 Lower Snake Fish and Wildlife 09/2009 09/2059 4.375% 1,540 1,5401320 Lower Snake Fish and Wildlife 09/2010 09/2060 4.250% 6 61321 Lower Snake Fish and Wildlife 09/2011 09/2061 3.750% 122 1221322 Lower Snake Fish and Wildlife 09/2014 09/2064 3.875% 222 2221323 Lower Snake Fish and Wildlife 09/2016 09/2066 3.000% 1,256 1,2561324 McNary 09/1954 09/2004 6.880% 80,256 01325 McNary 09/1955 09/2005 6.910% 53,493 01326 McNary 09/1956 09/2006 6.950% 38,748 01327 McNary 09/1957 09/2007 6.980% 24,985 01328 McNary 09/1958 09/2007 6.980% 468 01329 McNary 09/1959 09/2007 6.980% 468 01330 McNary 09/1960 09/2007 6.980% 468 01331 McNary 09/1961 09/2007 6.980% 468 01332 McNary 09/1962 09/2007 6.980% 467 01333 McNary 09/1963 09/2007 6.980% 468 01334 McNary 09/1964 09/2007 6.980% 468 01335 McNary 09/1965 09/2007 6.980% 468 01336 McNary 09/1966 09/2007 6.980% 468 01337 McNary 09/1967 09/2007 6.980% 467 01338 McNary 09/1968 09/2007 6.980% 468 01339 McNary 09/1969 09/2007 6.980% 468 01340 McNary 09/1970 09/2007 6.980% 468 01341 McNary 09/1971 09/2007 6.980% 468 01342 McNary 09/1972 09/2007 6.980% 468 01343 McNary 09/1973 09/2007 6.980% 467 01344 McNary 09/1974 09/2007 6.980% 468 01345 McNary 09/1975 09/2007 6.980% 468 01346 McNary 09/1976 09/2007 6.980% 468 01347 McNary 09/1977 09/2007 6.980% 467 01348 McNary 09/1978 09/2007 6.980% 468 01349 McNary 09/1979 09/2007 6.980% 468 01350 McNary 09/1980 09/2007 6.980% 468 01351 McNary 09/1981 09/2007 6.980% 468 01352 McNary 09/1982 09/2007 6.980% 467 01353 McNary 09/1983 09/2007 6.980% 468 01354 McNary 09/1985 09/2007 6.980% 557 01355 McNary 09/1986 09/2007 6.980% 454 01356 McNary 09/1987 09/2007 6.980% 24 01357 McNary 09/1995 09/2010 7.090% 509 01358 McNary 09/1995 09/2045 7.150% 16 161359 McNary 09/1996 09/2006 6.950% 778 01360 McNary 09/1996 09/2011 7.130% 3 01361 McNary 09/1996 09/2026 7.150% 74 01362 McNary 09/1996 09/2026 7.150% 277 01363 McNary 09/1996 09/2046 7.150% 619 6191364 McNary 09/1997 09/2032 7.150% 30 01365 McNary 09/2001 09/2051 5.875% 1,046 1,0461366 McNary 09/2003 09/2053 5.125% 97 971367 McNary 09/2004 09/2054 5.375% 6,138 6,1381368 McNary 09/2005 09/2055 5.125% 550 5501369 McNary 09/2006 09/2056 4.500% 4,080 4,0801370 McNary 09/2008 09/2058 4.875% 215 2151371 McNary 09/2011 09/2061 3.750% 565 5651372 McNary 09/2012 09/2062 3.375% 11 111373 McNary 09/2013 09/2063 2.875% 1,000 1,0001374 McNary 09/2014 09/2064 3.875% 759 7591375 Minidoka/Palisades 09/1909 09/1959 3.000% 854 01376 Minidoka/Palisades 09/1909 09/1959 3.000% 226 01377 Minidoka/Palisades 09/1910 09/1960 3.000% 1,709 01378 Minidoka/Palisades 09/1910 09/1960 3.000% 451 01379 Minidoka/Palisades 09/1911 09/1961 3.000% 1,709 01380 Minidoka/Palisades 09/1911 09/1961 3.000% 451 01381 Minidoka/Palisades 09/1927 09/1977 3.000% 854 01382 Minidoka/Palisades 09/1927 09/1977 3.000% 226 01383 Minidoka/Palisades 09/1942 09/1992 3.000% 854 01384 Minidoka/Palisades 09/1942 09/1992 3.000% 226 01385 Minidoka/Palisades 09/1957 09/2007 3.000% 2,561 01386 Minidoka/Palisades 09/1957 09/2007 3.000% 677 01387 Minidoka/Palisades 09/1958 09/2008 3.000% 854 01388 Minidoka/Palisades 09/1958 09/2008 3.000% 226 01389 Minidoka/Palisades 09/1959 09/2008 3.000% 108 01390 Minidoka/Palisades 09/1959 09/2008 3.000% 28 01391 Minidoka/Palisades 09/1960 09/2008 3.000% 108 01392 Minidoka/Palisades 09/1960 09/2008 3.000% 29 01393 Minidoka/Palisades 09/1961 09/2008 3.000% 108 01394 Minidoka/Palisades 09/1961 09/2008 3.000% 29 0
BP-18-FS-BPA-02A Page 93

TABLE 11A:
HISTORICAL INVESTMENTS
October 1, 2015 - September 30, 2018 Cost Evaluation period
($000s) (FY 2018)A B C D E F G H
Project In Service Date Due Date Interest Rate Initial Principal Current Principal
Roll Maturity
Date
Rollover
Rate
1395 Minidoka/Palisades 09/1962 09/2008 3.000% 108 01396 Minidoka/Palisades 09/1962 09/2008 3.000% 28 01397 Minidoka/Palisades 09/1963 09/2008 3.000% 108 01398 Minidoka/Palisades 09/1963 09/2008 3.000% 29 01399 Minidoka/Palisades 09/1964 09/2008 3.000% 108 01400 Minidoka/Palisades 09/1964 09/2008 3.000% 28 01401 Minidoka/Palisades 09/1965 09/2008 3.000% 108 01402 Minidoka/Palisades 09/1965 09/2008 3.000% 29 01403 Minidoka/Palisades 09/1966 09/2008 3.000% 108 01404 Minidoka/Palisades 09/1966 09/2008 3.000% 29 01405 Minidoka/Palisades 09/1967 09/2008 3.000% 108 01406 Minidoka/Palisades 09/1967 09/2008 3.000% 28 01407 Minidoka/Palisades 09/1968 09/2008 3.000% 108 01408 Minidoka/Palisades 09/1968 09/2008 3.000% 29 01409 Minidoka/Palisades 09/1969 09/2008 3.000% 3 01410 Minidoka/Palisades 09/1969 09/2008 3.000% 28 01411 Minidoka/Palisades 09/1970 09/2008 3.000% 108 01412 Minidoka/Palisades 09/1970 09/2008 3.000% 29 01413 Minidoka/Palisades 09/1971 09/2008 3.000% 108 01414 Minidoka/Palisades 09/1971 09/2008 3.000% 29 01415 Minidoka/Palisades 09/1972 09/2008 3.000% 108 01416 Minidoka/Palisades 09/1972 09/2008 3.000% 28 01417 Minidoka/Palisades 09/1973 09/2008 3.000% 108 01418 Minidoka/Palisades 09/1973 09/2008 3.000% 29 01419 Minidoka/Palisades 09/1974 09/2008 3.000% 108 01420 Minidoka/Palisades 09/1974 09/2008 3.000% 28 01421 Minidoka/Palisades 09/1975 09/2008 3.000% 108 01422 Minidoka/Palisades 09/1975 09/2008 3.000% 29 01423 Minidoka/Palisades 09/1976 09/2008 3.000% 108 01424 Minidoka/Palisades 09/1976 09/2008 3.000% 29 01425 Minidoka/Palisades 09/1977 09/2008 7.020% 83 01426 Minidoka/Palisades 09/1977 09/2008 7.020% 28 01427 Minidoka/Palisades 09/1978 09/2008 7.020% 75 01428 Minidoka/Palisades 09/1978 09/2008 7.020% 20 01429 Minidoka/Palisades 09/1979 09/2008 7.020% 75 01430 Minidoka/Palisades 09/1979 09/2008 7.020% 19 01431 Minidoka/Palisades 09/1980 09/2008 7.020% 75 01432 Minidoka/Palisades 09/1980 09/2008 7.020% 20 01433 Minidoka/Palisades 09/1981 09/2008 7.020% 75 01434 Minidoka/Palisades 09/1981 09/2008 7.020% 20 01435 Minidoka/Palisades 09/1982 09/2008 7.020% 75 01436 Minidoka/Palisades 09/1982 09/2008 7.020% 19 01437 Minidoka/Palisades 09/1983 09/2008 7.020% 65 01438 Minidoka/Palisades 09/1983 09/2008 7.020% 20 01439 Minidoka/Palisades 09/1984 09/2008 10.075% 44 01440 Minidoka/Palisades 09/1984 09/2008 10.075% 11 01441 Minidoka/Palisades 09/1985 09/2008 7.020% 21 01442 Minidoka/Palisades 09/1986 09/2008 7.020% 21 01443 Minidoka/Palisades 09/1986 09/2008 11.375% 48 01444 Minidoka/Palisades 09/1987 09/2008 7.020% 16 01445 Minidoka/Palisades 09/1988 09/2008 8.500% 31 01446 Minidoka/Palisades 09/1989 09/2008 9.250% 20 01447 Minidoka/Palisades 09/1990 09/2008 8.875% 33 01448 Minidoka/Palisades 09/1991 09/2008 8.750% 62 01449 Minidoka/Palisades 09/1991 09/2008 8.750% 11 01450 Minidoka/Palisades 09/1991 09/2008 8.750% 32 01451 Minidoka/Palisades 09/1992 09/2008 8.500% 6 01452 Minidoka/Palisades 09/1994 09/2029 7.125% 351 01453 Minidoka/Palisades 09/1995 09/2000 7.330% 6 01454 Minidoka/Palisades 09/1995 09/2010 7.890% 40 01455 Minidoka/Palisades 09/1996 09/2011 7.130% 54 01456 Minidoka/Palisades 09/1997 09/2007 6.950% 66 01457 Minidoka/Palisades 09/1997 09/2047 7.150% 50,911 50,9111458 Minidoka/Palisades 09/2001 09/2051 5.875% 42 421459 Minidoka/Palisades 09/2012 09/2062 3.375% 7 71460 Minidoka/Palisades 09/2015 09/2065 3.250% 19,237 19,2371461 Minidoka/Palisades 09/2016 09/2066 3.000% 206 2061462 RRP - Green Springs 09/2001 09/2051 5.875% 11,145 11,1451463 RRP - Green Springs 09/2012 09/2062 3.375% 2 21464 RRP - Green Springs 09/2013 09/2063 2.875% 1 11465 The Dalles 09/1957 09/2007 2.500% 15,908 01466 The Dalles 09/1958 09/2008 7.020% 45,837 01467 The Dalles 09/1959 09/2009 7.060% 40,415 01468 The Dalles 09/1960 09/2010 7.090% 39,179 01469 The Dalles 09/1961 09/2011 7.130% 9,492 01470 The Dalles 09/1962 09/2011 7.130% 56 01471 The Dalles 09/1963 09/2011 7.130% 57 01472 The Dalles 09/1964 09/2011 7.130% 57 01473 The Dalles 09/1965 09/2011 7.130% 56 01474 The Dalles 09/1966 09/2011 7.130% 57 01475 The Dalles 09/1967 09/2011 7.130% 57 01476 The Dalles 09/1968 09/2011 7.130% 56 0
BP-18-FS-BPA-02A Page 94

TABLE 11A:
HISTORICAL INVESTMENTS
October 1, 2015 - September 30, 2018 Cost Evaluation period
($000s) (FY 2018)A B C D E F G H
Project In Service Date Due Date Interest Rate Initial Principal Current Principal
Roll Maturity
Date
Rollover
Rate
1477 The Dalles 09/1969 09/2011 7.130% 57 01478 The Dalles 09/1970 09/2011 7.130% 57 01479 The Dalles 09/1971 09/2011 7.130% 56 01480 The Dalles 09/1972 09/2011 7.130% 57 01481 The Dalles 09/1973 09/2011 7.130% 57 01482 The Dalles 09/1973 09/2023 7.190% 21,983 01483 The Dalles 09/1974 09/2011 7.130% 56 01484 The Dalles 09/1974 09/2024 7.170% 7,268 01485 The Dalles 09/1975 09/2011 7.130% 57 01486 The Dalles 09/1976 09/2011 7.130% 57 01487 The Dalles 09/1977 09/2011 7.130% 56 01488 The Dalles 09/1978 09/2011 7.130% 57 01489 The Dalles 09/1979 09/2011 7.130% 57 01490 The Dalles 09/1980 09/2011 7.130% 56 01491 The Dalles 09/1981 09/2011 7.130% 57 01492 The Dalles 09/1982 09/2011 7.130% 57 01493 The Dalles 09/1983 09/2011 7.130% 56 01494 The Dalles 09/1984 09/2011 10.750% 961 01495 The Dalles 09/1985 09/2011 7.130% 95 01496 The Dalles 09/1985 09/2011 12.375% 280 01497 The Dalles 09/1986 09/2011 7.130% 95 01498 The Dalles 09/1986 09/2011 11.375% 4 01499 The Dalles 09/1987 09/2011 7.130% 1,417 01500 The Dalles 09/1987 09/2011 8.875% 81 01501 The Dalles 09/1988 09/2011 8.500% 685 01502 The Dalles 09/1988 09/2011 8.500% 1 01503 The Dalles 09/1989 09/2011 9.250% 898 0
1504 The Dalles 09/1990 09/2011 8.875% 319 0
1505 The Dalles 09/1990 09/2011 8.875% 745 0
1506 The Dalles 09/1991 09/2011 8.750% 89 0
1507 The Dalles 09/1991 09/2011 8.750% 2,452 01508 The Dalles 09/1992 09/2011 8.500% 57 01509 The Dalles 09/1992 09/2011 8.500% 130 01510 The Dalles 09/1993 09/2011 7.875% 2,028 01511 The Dalles 09/1993 09/2011 7.875% 2,929 01512 The Dalles 09/1994 09/2029 7.125% 1,425 01513 The Dalles 09/1996 09/2008 7.020% 196 01514 The Dalles 09/1996 09/2011 7.130% 457 01515 The Dalles 09/1996 09/2046 7.150% 1,991 1,9911516 The Dalles 09/2000 09/2050 6.125% 2,588 2,5881517 The Dalles 09/2002 09/2052 5.500% 1,226 1,2261518 The Dalles 09/2004 09/2054 5.375% 182 1821519 The Dalles 09/2005 09/2055 5.125% 36,019 36,0191520 The Dalles 09/2006 09/2056 4.500% 2,030 2,0301521 The Dalles 09/2007 09/2057 5.000% 140 1401522 The Dalles 09/2008 09/2058 4.875% 1,651 1,6511523 The Dalles 09/2015 09/2065 3.250% 302 3021524 The Dalles 09/2016 09/2066 3.000% 4 41525 Yakima Chandler/Kenniwick 09/1956 09/2022 7.210% 1,068 01526 Yakima Chandler/Kenniwick 09/1956 09/2022 7.210% 481 01527 Yakima Chandler/Kenniwick 09/1959 09/2022 7.210% 1 01528 Yakima Chandler/Kenniwick 09/1960 09/2022 7.210% 1 01529 Yakima Chandler/Kenniwick 09/1961 09/2022 7.210% 1 01530 Yakima Chandler/Kenniwick 09/1984 09/2022 10.750% 35 01531 Yakima Chandler/Kenniwick 09/1984 09/2022 10.750% 10 01532 Yakima Chandler/Kenniwick 09/1985 09/2022 12.375% 357 01533 Yakima Chandler/Kenniwick 09/1986 09/2022 7.210% 439 01534 Yakima Chandler/Kenniwick 09/1986 09/2022 11.375% 7 01535 Yakima Chandler/Kenniwick 09/1987 09/2022 8.875% 126 01536 Yakima Chandler/Kenniwick 09/1989 09/2022 9.250% 18 01537 Yakima Chandler/Kenniwick 09/1990 09/2022 8.875% 40 01538 Yakima Chandler/Kenniwick 09/1991 09/2022 8.750% 109 01539 Yakima Chandler/Kenniwick 09/2005 09/2055 5.125% 833 8331540 Yakima Chandler/Kenniwick 09/2009 09/2059 4.375% 15 151541 Yakima Roza 09/1958 09/2008 7.020% 1,194 01542 Yakima Roza 09/1958 09/2008 7.020% 383 01543 Yakima Roza 09/1984 09/2008 10.750% 5 01544 Yakima Roza 09/1984 09/2008 10.750% 17 01545 Yakima Roza 09/1985 09/2008 7.020% 69 01546 Yakima Roza 09/1985 09/2008 12.375% 5 01547 Yakima Roza 09/1986 09/2008 7.020% 6 01548 Yakima Roza 09/1987 09/2008 7.020% 2 01549 Yakima Roza 09/1987 09/2008 8.875% 9 01550 Yakima Roza 09/2001 09/2051 5.875% 15 141551 Bureau Direct 05/1995 05/2015 7.500% 35,000 01552 Bureau Direct 05/1997 05/2000 6.500% 50,000 01553 Bureau Direct 04/1998 05/2008 6.000% 25,000 01554 Bureau Direct 09/1999 09/2004 6.400% 20,000 01555 Bureau Direct 04/2000 04/2003 6.850% 40,000 01556 Bureau Direct 09/2000 09/2005 6.700% 20,000 01557 Bureau Direct 06/2001 06/2004 4.750% 50,000 01558 Bureau Direct 03/2002 03/2005 4.600% 30,000 0
BP-18-FS-BPA-02A Page 95

TABLE 11A:
HISTORICAL INVESTMENTS
October 1, 2015 - September 30, 2018 Cost Evaluation period
($000s) (FY 2018)A B C D E F G H
Project In Service Date Due Date Interest Rate Initial Principal Current Principal
Roll Maturity
Date
Rollover
Rate
1559 Bureau Direct 09/2002 09/2006 3.050% 20,000 01560 Bureau Direct 12/2002 12/2006 3.050% 40,000 01561 Bureau Direct 04/2003 04/2006 2.400% 40,000 01562 Bureau Direct 04/2003 04/2006 2.400% 25,000 01563 Bureau Direct 07/2003 07/2006 2.300% 30,000 01564 Bureau Direct 09/2003 09/2006 2.500% 25,000 01565 Bureau Direct 01/2004 01/2007 2.500% 25,000 01566 Bureau Direct 04/2004 04/2007 2.950% 35,000 01567 Bureau Direct 07/2004 07/2007 3.450% 25,000 01568 Bureau Direct 09/2004 09/2007 3.100% 30,000 01569 Bureau Direct 11/2004 11/2007 3.500% 20,000 01570 Bureau Direct 01/2005 01/2008 3.600% 20,000 01571 Bureau Direct 06/2005 06/2008 3.950% 30,000 01572 Bureau Direct 09/2005 09/2008 4.250% 25,000 01573 Bureau Direct 03/2006 03/2009 5.050% 25,000 01574 Bureau Direct 07/2006 07/2009 5.350% 45,000 01575 Bureau Direct 09/2006 09/2009 4.950% 15,000 01576 Bureau Direct 01/2007 01/2010 5.100% 35,000 01577 Bureau Direct 03/2007 03/2010 4.800% 30,000 01578 Bureau Direct 06/2007 06/2010 5.350% 30,000 01579 Bureau Direct 01/2008 01/2011 2.850% 35,000 01580 Bureau Direct 01/2008 01/2011 2.850% 20,000 01581 Bureau Direct 05/2008 05/2011 3.358% 35,000 01582 Bureau Direct 05/2008 05/2011 3.358% 25,000 01583 Bureau Direct 06/2008 06/2012 3.974% 30,000 01584 Bureau Direct 07/2008 07/2012 3.913% 35,000 01585 Bureau Direct 09/2008 09/2012 3.444% 35,000 01586 Bureau Direct 01/2009 01/2021 3.999% 25,000 25,0001587 Bureau Direct 04/2009 04/2023 4.391% 25,000 25,000 04/2028 3.64%1588 Bureau Direct 06/2009 06/2039 5.192% 25,000 25,0001589 Bureau Direct 09/2009 09/2019 3.699% 25,000 25,000 09/2029 3.71%1590 Bureau Direct 10/2009 10/2018 3.719% 24,000 24,0001591 Bureau Direct 10/2009 10/2019 3.842% 20,000 20,0001592 Bureau Direct 11/2009 11/2019 3.637% 7,000 7,0001593 Bureau Direct 12/2009 12/2019 4.194% 13,000 13,0001594 Bureau Direct 01/2010 01/2019 3.714% 10,000 10,000 01/2029 3.71%1595 Bureau Direct 02/2010 02/2019 0.165% 10,000 01596 Bureau Direct 03/2010 03/2020 4.083% 30,000 30,0001597 Bureau Direct 04/2010 04/2020 3.973% 18,000 18,0001598 Bureau Direct 05/2010 05/2020 3.574% 15,000 15,0001599 Bureau Direct 06/2010 06/2020 3.243% 10,000 10,000 06/2030 4.06%1600 Bureau Direct 06/2010 06/2020 3.243% 30,000 30,000 06/2030 4.06%1601 Bureau Direct 07/2010 07/2020 3.118% 17,000 17,0001602 Bureau Direct 08/2010 08/2020 0.165% 5,000 01603 Bureau Direct 09/2010 09/2021 2.883% 22,000 22,0001604 Bureau Direct 10/2010 10/2034 4.211% 20,000 20,0001605 Bureau Direct 01/2011 09/2011 0.244% 20,000 01606 Bureau Direct 01/2011 09/2011 0.244% 35,000 01607 Bureau Direct 01/2011 01/2039 5.040% 35,000 35,0001608 Bureau Direct 02/2011 02/2040 4.995% 50,000 50,0001609 Bureau Direct 05/2011 09/2011 0.076% 35,000 01610 Bureau Direct 05/2011 09/2011 0.076% 25,000 01611 Bureau Direct 06/2011 06/2036 4.629% 30,000 30,0001612 Bureau Direct 06/2011 06/2038 4.700% 30,000 30,0001613 Bureau Direct 08/2011 08/2037 4.208% 30,000 30,0001614 Bureau Direct 09/2011 07/2041 3.825% 30,000 01615 Bureau Direct 12/2011 12/2038 3.880% 35,000 01616 Bureau Direct 01/2012 01/2038 3.893% 15,000 01617 Bureau Direct 02/2012 02/2034 0.697% 55,000 55,0001618 Bureau Direct 06/2012 06/2041 3.666% 50,000 01619 Bureau Direct 06/2012 09/2012 0.119% 30,000 01620 Bureau Direct 08/2012 07/2042 3.834% 44,000 01621 Bureau Direct 09/2012 09/2013 0.174% 35,000 01622 Bureau Direct 09/2012 09/2042 3.668% 25,000 01623 Bureau Direct 01/2013 01/2043 6.194% 70,000 01624 Bureau Direct 02/2013 02/2043 5.993% 18,000 01625 Bureau Direct 03/2013 03/2043 5.958% 15,000 01626 Bureau Direct 04/2013 04/2043 5.633% 15,000 01627 Bureau Direct 05/2013 05/2043 6.192% 18,000 01628 Bureau Direct 06/2013 01/2039 0.674% 35,000 35,0001629 Bureau Direct 06/2013 06/2043 6.938% 21,000 01630 Bureau Direct 07/2013 07/2034 7.164% 25,000 01631 Bureau Direct 08/2013 08/2034 7.413% 15,000 01632 Bureau Direct 11/2013 09/2014 0.140% 77,000 01633 Bureau Direct 11/2013 09/2021 2.812% 50,000 50,0001634 Bureau Direct 11/2013 09/2022 3.125% 19,000 19,0001635 Bureau Direct 11/2013 09/2020 2.473% 51,000 51,000 09/2030 4.06%1636 Bureau Direct 01/2014 12/2018 1.943% 43,000 43,0001637 Bureau Direct 01/2014 12/2018 1.943% 38,000 38,0001638 Bureau Direct 01/2014 12/2018 1.943% 21,000 21,000 12/2028 3.71%1639 Bureau Direct 01/2014 12/2018 1.943% 26,000 26,000 12/2028 3.71%1640 Bureau Direct 01/2014 12/2018 1.943% 14,000 14,000 12/2028 3.71%
BP-18-FS-BPA-02A Page 96

TABLE 11A:
HISTORICAL INVESTMENTS
October 1, 2015 - September 30, 2018 Cost Evaluation period
($000s) (FY 2018)A B C D E F G H
Project In Service Date Due Date Interest Rate Initial Principal Current Principal
Roll Maturity
Date
Rollover
Rate
1641 Bureau Direct 09/2014 05/2032 0.713% 16,000 16,0001642 Bureau Direct 09/2014 05/2032 0.713% 10,000 10,0001643 Bureau Direct 09/2014 06/2033 0.732% 11,000 11,0001644 Bureau Direct 09/2014 06/2033 0.732% 12,000 12,0001645 Bureau Direct 09/2014 07/2033 0.674% 15,000 15,0001646 Bureau Direct 09/2015 09/2033 3.134% 10,000 10,0001647 Bureau Direct 04/2016 04/2031 2.661% 17,000 17,0001648 Bureau Direct 07/2016 07/2030 2.145% 12,000 12,0001649 Bureau Direct 07/2016 07/2030 2.145% 25,000 25,0001650 Conservation 09/1983 09/2003 12.200% 140,000 01651 Conservation 09/1984 09/2004 13.050% 150,000 01652 Conservation 09/1985 09/1990 10.150% 50,000 01653 Conservation 03/1986 03/1991 7.800% 50,000 01654 Conservation 03/1986 03/1996 8.150% 50,000 01655 Conservation 04/1987 04/2007 9.300% 75,000 01656 Conservation 06/1987 06/1992 8.350% 50,000 01657 Conservation 04/1988 04/2008 9.900% 90,000 01658 Conservation 07/1989 07/2009 8.550% 40,000 01659 Conservation 09/1989 09/1995 8.600% 66,000 01660 Conservation 09/1989 09/2002 8.650% 66,000 01661 Conservation 07/1992 07/1997 5.800% 80,200 01662 Conservation 07/1992 07/2007 7.140% 100,000 01663 Conservation 10/1992 10/2012 8.050% 50,000 01664 Conservation 02/1993 02/2013 7.400% 50,000 01665 Conservation 08/1993 08/2013 6.750% 40,000 01666 Conservation 01/1994 01/2014 6.750% 50,000 01667 Conservation 05/1994 05/1998 7.100% 50,000 01668 Conservation 05/1995 05/2015 7.500% 85,000 01669 Conservation 01/1996 01/2011 6.700% 30,000 01670 Conservation 11/1996 11/2016 7.200% 40,000 01671 Conservation 05/1998 05/2009 6.000% 37,700 01672 Conservation 09/1998 09/2008 5.300% 104,300 01673 Conservation 09/1998 09/2013 5.600% 52,800 01674 Conservation 07/2000 07/2003 6.950% 32,000 01675 Conservation 06/2002 06/2005 3.750% 40,000 01676 Conservation 01/2004 01/2008 2.950% 30,000 01677 Conservation 03/2006 03/2009 5.050% 20,000 01678 Conservation 06/2007 06/2010 5.350% 20,000 01679 Conservation 09/2008 09/2013 3.701% 10,000 01680 Conservation 09/2009 09/2014 2.746% 15,000 01681 Conservation 01/2010 01/2015 2.609% 15,000 01682 Conservation 04/2010 04/2015 2.677% 20,000 01683 Conservation 08/2010 08/2015 1.619% 15,000 01684 Conservation 09/2010 09/2015 1.534% 10,000 01685 Conservation 01/2011 01/2023 4.046% 40,000 40,0001686 Conservation 04/2011 04/2023 3.932% 35,000 35,0001687 Conservation 08/2011 08/2023 3.206% 40,000 40,0001688 Conservation 10/2011 08/2012 0.204% 55,000 01689 Conservation 12/2011 12/2037 0.189% 55,000 01690 Conservation 05/2012 09/2015 0.676% 30,000 01691 Conservation 06/2012 09/2015 0.671% 15,000 01692 Conservation 08/2012 08/2024 2.788% 15,000 01693 Conservation 11/2012 11/2016 0.630% 20,000 01694 Conservation 01/2013 01/2018 1.107% 9,000 9,0001695 Conservation 03/2013 03/2025 4.992% 10,000 01696 Conservation 04/2013 04/2025 4.553% 12,000 01697 Conservation 08/2013 08/2025 6.973% 5,000 01698 Conservation 10/2013 10/2025 3.568% 34,000 34,0001699 Conservation 11/2013 09/2023 3.375% 27,000 27,0001700 Conservation 12/2013 12/2021 3.142% 6,000 6,0001701 Conservation 12/2013 12/2023 0.732% 55,000 55,0001702 Conservation 01/2014 01/2026 3.621% 5,000 5,0001703 Conservation 04/2014 06/2025 0.732% 30,000 30,0001704 Conservation 05/2014 04/2024 0.526% 15,000 15,0001705 Conservation 05/2014 04/2025 0.526% 3,000 3,0001706 Conservation 06/2014 10/2024 0.526% 5,000 5,0001707 Conservation 07/2014 07/2025 0.674% 12,000 12,0001708 Conservation 08/2014 09/2025 0.947% 4,000 4,0001709 Conservation 10/2014 12/2024 0.732% 10,000 10,0001710 Conservation 11/2014 03/2027 0.947% 6,000 6,0001711 Conservation 12/2014 12/2023 2.403% 7,000 7,0001712 Conservation 01/2015 09/2015 0.204% 15,000 01713 Conservation 01/2015 01/2024 1.908% 7,000 7,0001714 Conservation 02/2015 02/2024 2.251% 8,000 8,0001715 Conservation 03/2015 03/2025 2.295% 5,000 5,0001716 Conservation 04/2015 04/2024 2.269% 5,000 5,0001717 Conservation 05/2015 05/2021 1.898% 5,000 5,0001718 Conservation 07/2015 07/2021 2.067% 14,000 14,0001719 Conservation 08/2015 08/2022 2.233% 6,000 6,0001720 Conservation 09/2015 09/2022 2.062% 4,000 4,0001721 Conservation 10/2015 10/2027 0.732% 25,000 25,0001722 Conservation 11/2016 04/2017 0.684% 20,000 0
BP-18-FS-BPA-02A Page 97

TABLE 11A:
HISTORICAL INVESTMENTS
October 1, 2015 - September 30, 2018 Cost Evaluation period
($000s) (FY 2018)A B C D E F G H
Project In Service Date Due Date Interest Rate Initial Principal Current Principal
Roll Maturity
Date
Rollover
Rate
1723 Conservation 04/2017 01/2018 1.051% 20,000 20,0001724 Construction (AS) 10/1992 10/2032 8.350% 38 01725 Construction (AS) 07/1995 07/2025 7.700% 67 01726 Construction (AS) 01/1996 01/2003 5.900% 5,622 01727 Construction (AS) 01/1997 01/2004 6.800% 7,400 01728 Construction (AS) 08/1998 08/2008 5.750% 3,181 01729 Construction (AS) 02/1999 02/2014 5.900% 950 01730 Construction (AS) 07/2000 07/2004 7.000% 10,948 01731 Construction (AS) 01/2001 01/2010 6.050% 68 01732 Construction (AS) 03/2002 03/2005 4.600% 1,990 01733 Construction (AS) 10/2002 10/2005 3.000% 45,062 01734 Construction (AS) 01/2004 01/2007 2.500% 13,357 01735 Construction (AS) 11/2004 11/2008 3.750% 7,990 01736 Construction (AS) 09/2006 09/2010 4.950% 9,681 01737 Construction (AS) 01/2008 01/2012 3.200% 10,000 01738 Construction (AS) 09/2008 09/2012 3.444% 10,000 01739 Construction (AS) 09/2009 09/2014 2.746% 14,000 01740 Construction (AS) 02/2010 02/2015 0.165% 7,500 01741 Construction (AS) 08/2010 08/2015 1.619% 5,000 01742 Construction (AS) 06/2011 06/2016 1.957% 7,000 01743 Construction (AS) 08/2011 08/2016 1.423% 3,500 01744 Construction (AS) 01/2012 09/2012 0.146% 10,000 01745 Construction (AS) 06/2012 09/2015 0.671% 7,700 01746 Construction (AS) 11/2012 11/2018 1.109% 5,250 5,2501747 Construction (AS) 04/2013 04/2017 0.622% 2,450 01748 Construction (AS) 06/2013 06/2017 1.271% 3,000 3,000 06/2018 0.75%1749 Construction (AS) 08/2013 08/2017 1.494% 2,000 2,000 08/2018 0.75%1750 Construction (AS) 10/2013 10/2019 2.039% 4,200 4,2001751 Construction (AS) 10/2013 10/2019 2.039% 5,000 5,0001752 Construction (AS) 01/2014 01/2020 2.183% 1,750 1,7501753 Construction (AS) 01/2014 01/2020 2.183% 2,000 2,0001754 Construction (AS) 02/2014 09/2014 0.117% 950 01755 Construction (AS) 04/2014 03/2020 0.947% 1,400 1,4001756 Construction (AS) 04/2014 03/2020 0.947% 2,000 2,0001757 Construction (AS) 05/2014 04/2020 0.526% 700 7001758 Construction (AS) 07/2014 07/2020 0.674% 1,050 1,0501759 Construction (AS) 11/2014 11/2020 1.809% 2,100 2,1001760 Construction (AS) 12/2014 12/2020 1.922% 1,050 1,0501761 Construction (AS) 02/2015 02/2021 1.761% 1,750 1,7501762 Construction (AS) 05/2015 05/2021 1.898% 2,100 2,1001763 Construction (AS) 09/2015 09/2017 0.744% 7,700 7,700 09/2018 0.75%1764 Construction (AS) 10/2015 10/2021 1.942% 2,800 2,8001765 Construction (AS) 02/2016 02/2022 0.697% 3,000 3,0001766 Construction (AS) 06/2016 09/2016 0.436% 7,000 01767 Construction (AS) 04/2017 01/2018 1.051% 2,450 2,4501768 Corps 09/2015 09/2033 3.134% 4,000 4,0001769 Corps 02/2016 02/2045 0.697% 3,000 3,0001770 Corps 04/2016 04/2031 2.661% 53,000 53,0001771 Corps 05/2016 05/2030 2.599% 15,000 15,0001772 Fish and Wildlife 05/1989 05/1999 8.950% 25,000 01773 Fish and Wildlife 05/1991 05/1996 7.950% 50,000 01774 Fish and Wildlife 02/1993 02/2008 6.950% 20,000 01775 Fish and Wildlife 09/1994 09/1999 7.650% 20,000 01776 Fish and Wildlife 08/1995 08/2010 7.200% 35,000 01777 Fish and Wildlife 01/1998 01/2013 6.100% 60,000 01778 Fish and Wildlife 09/1999 09/2003 6.300% 20,000 01779 Fish and Wildlife 01/2001 01/2005 5.650% 25,000 01780 Fish and Wildlife 09/2003 09/2007 3.100% 20,000 01781 Fish and Wildlife 09/2005 09/2008 4.250% 20,000 01782 Fish and Wildlife 09/2006 09/2010 4.950% 20,000 01783 Fish and Wildlife 06/2007 06/2010 5.350% 30,000 01784 Fish and Wildlife 09/2007 09/2011 4.700% 20,000 01785 Fish and Wildlife 09/2008 09/2012 3.444% 20,000 01786 Fish and Wildlife 06/2009 06/2024 4.556% 20,000 20,0001787 Fish and Wildlife 12/2009 12/2018 4.069% 26,000 26,0001788 Fish and Wildlife 08/2010 08/2019 2.646% 20,000 20,0001789 Fish and Wildlife 01/2011 01/2026 4.440% 50,000 50,0001790 Fish and Wildlife 02/2011 02/2026 4.398% 15,000 15,0001791 Fish and Wildlife 06/2011 06/2026 4.205% 15,000 15,0001792 Fish and Wildlife 01/2012 01/2038 3.893% 30,000 01793 Fish and Wildlife 05/2012 05/2029 0.140% 5,000 01794 Fish and Wildlife 06/2012 06/2041 3.666% 11,000 01795 Fish and Wildlife 08/2012 08/2027 3.090% 11,000 01796 Fish and Wildlife 11/2012 11/2027 5.046% 25,000 01797 Fish and Wildlife 01/2013 09/2013 0.149% 60,000 01798 Fish and Wildlife 03/2013 03/2028 5.445% 10,000 01799 Fish and Wildlife 04/2013 04/2028 5.042% 6,000 01800 Fish and Wildlife 06/2013 06/2028 6.607% 8,000 01801 Fish and Wildlife 08/2013 08/2028 7.249% 5,000 01802 Fish and Wildlife 10/2013 12/2026 3.717% 28,000 28,0001803 Fish and Wildlife 10/2013 05/2027 3.762% 11,000 11,0001804 Fish and Wildlife 10/2013 10/2028 3.880% 22,000 22,000
BP-18-FS-BPA-02A Page 98

TABLE 11A:
HISTORICAL INVESTMENTS
October 1, 2015 - September 30, 2018 Cost Evaluation period
($000s) (FY 2018)A B C D E F G H
Project In Service Date Due Date Interest Rate Initial Principal Current Principal
Roll Maturity
Date
Rollover
Rate
1805 Fish and Wildlife 11/2013 09/2022 3.125% 31,000 31,0001806 Fish and Wildlife 11/2013 09/2023 3.375% 23,000 23,000 09/2028 3.64%1807 Fish and Wildlife 11/2013 05/2027 0.713% 5,000 5,0001808 Fish and Wildlife 01/2014 01/2029 3.896% 7,000 7,000
BP-18-FS-BPA-02A Page 99

TABLE 11B:
PROJECTED INVESTMENTS
October 1, 2015 - September 30, 2018 Cost Evaluation period
($000s) (FY 2018)
A B C D E F G
Project In Service Date Due Date Interest Rate
Current
Principal
Roll Maturity
Date Rollover Rate
1 Bureau Direct 07/2017 07/2032 2.180% 13,0002 Bureau Direct 08/2017 08/2032 2.180% 13,0003 Bureau Direct 09/2017 09/2032 2.180% 14,0004 Bureau Direct 07/2018 07/2033 3.250% 28,0005 Bureau Direct 08/2018 08/2034 3.290% 28,0006 Bureau Direct 09/2018 09/2035 3.330% 29,0007 Columbia River Fish Mitigation 09/2017 09/2067 2.380% 63,6298 Columbia River Fish Mitigation 09/2018 09/2068 3.320% 147,1869 Construction (AS) 09/2017 09/2023 1.510% 3,15010 Construction (AS) 09/2018 09/2024 2.560% 5,60011 Corps 07/2017 07/2032 2.180% 26,79612 Corps 08/2017 08/2032 2.180% 26,79613 Corps 09/2017 09/2032 2.180% 27,79614 Corps 07/2018 07/2033 3.250% 53,00015 Corps 08/2018 08/2034 3.290% 53,00016 Corps 09/2018 09/2035 3.330% 53,00017 Fish and Wildlife 09/2017 09/2032 2.180% 40,00018 Fish and Wildlife 09/2018 09/2033 3.250% 51,00019 Technology (G) 09/2017 09/2022 1.400% 8,00020 Technology (G) 09/2018 09/2023 2.440% 5,00021 Totals: 688,954
BP-18-FS-BPA-02A Page 100
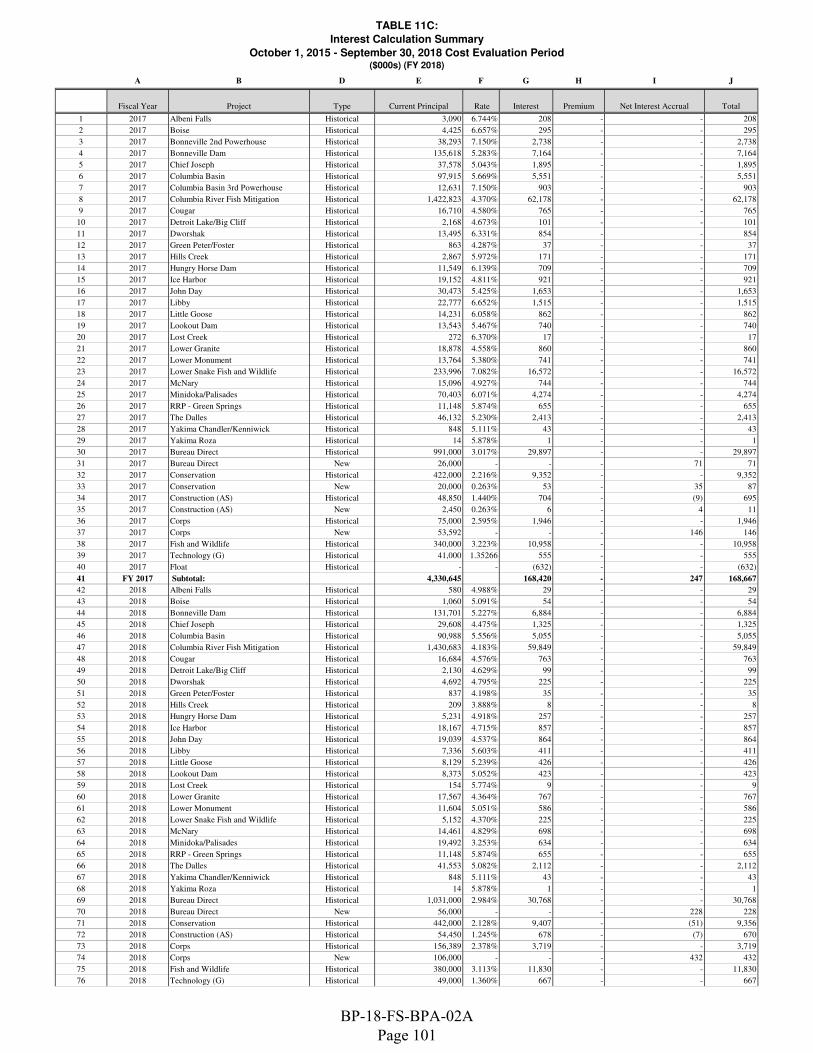
TABLE 11C:
Interest Calculation Summary
October 1, 2015 - September 30, 2018 Cost Evaluation Period($000s) (FY 2018)
A B D E F G H I J
Column1 Fiscal Year Project Type Current Principal Rate Interest Premium Net Interest Accrual Total
1 2017 Albeni Falls Historical 3,090 6.744% 208 - - 208
2 2017 Boise Historical 4,425 6.657% 295 - - 295
3 2017 Bonneville 2nd Powerhouse Historical 38,293 7.150% 2,738 - - 2,738
4 2017 Bonneville Dam Historical 135,618 5.283% 7,164 - - 7,164
5 2017 Chief Joseph Historical 37,578 5.043% 1,895 - - 1,895
6 2017 Columbia Basin Historical 97,915 5.669% 5,551 - - 5,551
7 2017 Columbia Basin 3rd Powerhouse Historical 12,631 7.150% 903 - - 903
8 2017 Columbia River Fish Mitigation Historical 1,422,823 4.370% 62,178 - - 62,178
9 2017 Cougar Historical 16,710 4.580% 765 - - 765
10 2017 Detroit Lake/Big Cliff Historical 2,168 4.673% 101 - - 101
11 2017 Dworshak Historical 13,495 6.331% 854 - - 854
12 2017 Green Peter/Foster Historical 863 4.287% 37 - - 37
13 2017 Hills Creek Historical 2,867 5.972% 171 - - 171
14 2017 Hungry Horse Dam Historical 11,549 6.139% 709 - - 709
15 2017 Ice Harbor Historical 19,152 4.811% 921 - - 921
16 2017 John Day Historical 30,473 5.425% 1,653 - - 1,653
17 2017 Libby Historical 22,777 6.652% 1,515 - - 1,515
18 2017 Little Goose Historical 14,231 6.058% 862 - - 862
19 2017 Lookout Dam Historical 13,543 5.467% 740 - - 740
20 2017 Lost Creek Historical 272 6.370% 17 - - 17
21 2017 Lower Granite Historical 18,878 4.558% 860 - - 860
22 2017 Lower Monument Historical 13,764 5.380% 741 - - 741
23 2017 Lower Snake Fish and Wildlife Historical 233,996 7.082% 16,572 - - 16,572
24 2017 McNary Historical 15,096 4.927% 744 - - 744
25 2017 Minidoka/Palisades Historical 70,403 6.071% 4,274 - - 4,274
26 2017 RRP - Green Springs Historical 11,148 5.874% 655 - - 655
27 2017 The Dalles Historical 46,132 5.230% 2,413 - - 2,413
28 2017 Yakima Chandler/Kenniwick Historical 848 5.111% 43 - - 43
29 2017 Yakima Roza Historical 14 5.878% 1 - - 1
30 2017 Bureau Direct Historical 991,000 3.017% 29,897 - - 29,897
31 2017 Bureau Direct New 26,000 - - - 71 71
32 2017 Conservation Historical 422,000 2.216% 9,352 - - 9,352
33 2017 Conservation New 20,000 0.263% 53 - 35 87
34 2017 Construction (AS) Historical 48,850 1.440% 704 - (9) 695
35 2017 Construction (AS) New 2,450 0.263% 6 - 4 11
36 2017 Corps Historical 75,000 2.595% 1,946 - - 1,946
37 2017 Corps New 53,592 - - - 146 146
38 2017 Fish and Wildlife Historical 340,000 3.223% 10,958 - - 10,958
39 2017 Technology (G) Historical 41,000 1.35266 555 - - 555
40 2017 Float Historical - - (632) - - (632)
41 FY 2017 Subtotal: 4,330,645 168,420 - 247 168,667
42 2018 Albeni Falls Historical 580 4.988% 29 - - 29
43 2018 Boise Historical 1,060 5.091% 54 - - 54
44 2018 Bonneville Dam Historical 131,701 5.227% 6,884 - - 6,884
45 2018 Chief Joseph Historical 29,608 4.475% 1,325 - - 1,325
46 2018 Columbia Basin Historical 90,988 5.556% 5,055 - - 5,055
47 2018 Columbia River Fish Mitigation Historical 1,430,683 4.183% 59,849 - - 59,849
48 2018 Cougar Historical 16,684 4.576% 763 - - 763
49 2018 Detroit Lake/Big Cliff Historical 2,130 4.629% 99 - - 99
50 2018 Dworshak Historical 4,692 4.795% 225 - - 225
51 2018 Green Peter/Foster Historical 837 4.198% 35 - - 35
52 2018 Hills Creek Historical 209 3.888% 8 - - 8
53 2018 Hungry Horse Dam Historical 5,231 4.918% 257 - - 257
54 2018 Ice Harbor Historical 18,167 4.715% 857 - - 857
55 2018 John Day Historical 19,039 4.537% 864 - - 864
56 2018 Libby Historical 7,336 5.603% 411 - - 411
57 2018 Little Goose Historical 8,129 5.239% 426 - - 426
58 2018 Lookout Dam Historical 8,373 5.052% 423 - - 423
59 2018 Lost Creek Historical 154 5.774% 9 - - 9
60 2018 Lower Granite Historical 17,567 4.364% 767 - - 767
61 2018 Lower Monument Historical 11,604 5.051% 586 - - 586
62 2018 Lower Snake Fish and Wildlife Historical 5,152 4.370% 225 - - 225
63 2018 McNary Historical 14,461 4.829% 698 - - 698
64 2018 Minidoka/Palisades Historical 19,492 3.253% 634 - - 634
65 2018 RRP - Green Springs Historical 11,148 5.874% 655 - - 655
66 2018 The Dalles Historical 41,553 5.082% 2,112 - - 2,112
67 2018 Yakima Chandler/Kenniwick Historical 848 5.111% 43 - - 43
68 2018 Yakima Roza Historical 14 5.878% 1 - - 1
69 2018 Bureau Direct Historical 1,031,000 2.984% 30,768 - - 30,768
70 2018 Bureau Direct New 56,000 - - - 228 228
71 2018 Conservation Historical 442,000 2.128% 9,407 - (51) 9,356
72 2018 Construction (AS) Historical 54,450 1.245% 678 - (7) 670
73 2018 Corps Historical 156,389 2.378% 3,719 - - 3,719
74 2018 Corps New 106,000 - - - 432 432
75 2018 Fish and Wildlife Historical 380,000 3.113% 11,830 - - 11,830
76 2018 Technology (G) Historical 49,000 1.360% 667 - - 667
BP-18-FS-BPA-02A Page 101
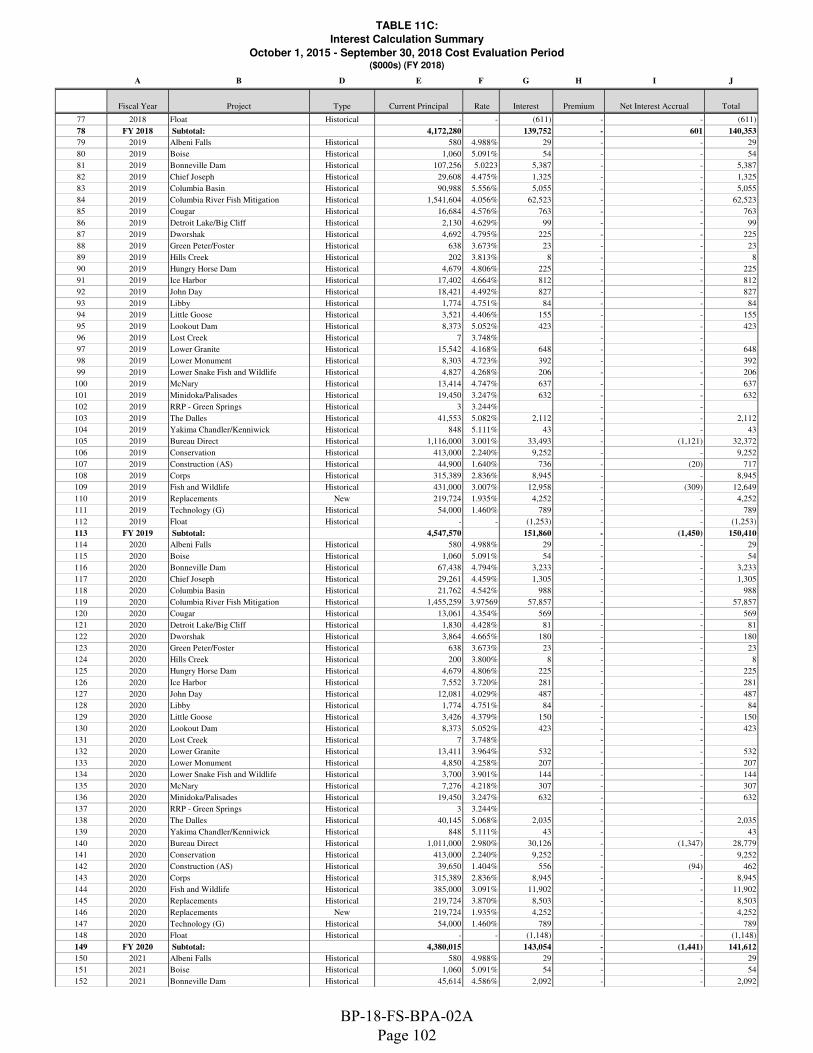
TABLE 11C:
Interest Calculation Summary
October 1, 2015 - September 30, 2018 Cost Evaluation Period($000s) (FY 2018)
A B D E F G H I J
Column1 Fiscal Year Project Type Current Principal Rate Interest Premium Net Interest Accrual Total
77 2018 Float Historical - - (611) - - (611)
78 FY 2018 Subtotal: 4,172,280 139,752 - 601 140,353
79 2019 Albeni Falls Historical 580 4.988% 29 - - 29
80 2019 Boise Historical 1,060 5.091% 54 - - 54
81 2019 Bonneville Dam Historical 107,256 5.0223 5,387 - - 5,387
82 2019 Chief Joseph Historical 29,608 4.475% 1,325 - - 1,325
83 2019 Columbia Basin Historical 90,988 5.556% 5,055 - - 5,055
84 2019 Columbia River Fish Mitigation Historical 1,541,604 4.056% 62,523 - - 62,523
85 2019 Cougar Historical 16,684 4.576% 763 - - 763
86 2019 Detroit Lake/Big Cliff Historical 2,130 4.629% 99 - - 99
87 2019 Dworshak Historical 4,692 4.795% 225 - - 225
88 2019 Green Peter/Foster Historical 638 3.673% 23 - - 23
89 2019 Hills Creek Historical 202 3.813% 8 - - 8
90 2019 Hungry Horse Dam Historical 4,679 4.806% 225 - - 225
91 2019 Ice Harbor Historical 17,402 4.664% 812 - - 812
92 2019 John Day Historical 18,421 4.492% 827 - - 827
93 2019 Libby Historical 1,774 4.751% 84 - - 84
94 2019 Little Goose Historical 3,521 4.406% 155 - - 155
95 2019 Lookout Dam Historical 8,373 5.052% 423 - - 423
96 2019 Lost Creek Historical 7 3.748% - -
97 2019 Lower Granite Historical 15,542 4.168% 648 - - 648
98 2019 Lower Monument Historical 8,303 4.723% 392 - - 392
99 2019 Lower Snake Fish and Wildlife Historical 4,827 4.268% 206 - - 206
100 2019 McNary Historical 13,414 4.747% 637 - - 637
101 2019 Minidoka/Palisades Historical 19,450 3.247% 632 - - 632
102 2019 RRP - Green Springs Historical 3 3.244% - -
103 2019 The Dalles Historical 41,553 5.082% 2,112 - - 2,112
104 2019 Yakima Chandler/Kenniwick Historical 848 5.111% 43 - - 43
105 2019 Bureau Direct Historical 1,116,000 3.001% 33,493 - (1,121) 32,372
106 2019 Conservation Historical 413,000 2.240% 9,252 - - 9,252
107 2019 Construction (AS) Historical 44,900 1.640% 736 - (20) 717
108 2019 Corps Historical 315,389 2.836% 8,945 - - 8,945
109 2019 Fish and Wildlife Historical 431,000 3.007% 12,958 - (309) 12,649
110 2019 Replacements New 219,724 1.935% 4,252 - - 4,252
111 2019 Technology (G) Historical 54,000 1.460% 789 - - 789
112 2019 Float Historical - - (1,253) - - (1,253)
113 FY 2019 Subtotal: 4,547,570 151,860 - (1,450) 150,410
114 2020 Albeni Falls Historical 580 4.988% 29 - - 29
115 2020 Boise Historical 1,060 5.091% 54 - - 54
116 2020 Bonneville Dam Historical 67,438 4.794% 3,233 - - 3,233
117 2020 Chief Joseph Historical 29,261 4.459% 1,305 - - 1,305
118 2020 Columbia Basin Historical 21,762 4.542% 988 - - 988
119 2020 Columbia River Fish Mitigation Historical 1,455,259 3.97569 57,857 - - 57,857
120 2020 Cougar Historical 13,061 4.354% 569 - - 569
121 2020 Detroit Lake/Big Cliff Historical 1,830 4.428% 81 - - 81
122 2020 Dworshak Historical 3,864 4.665% 180 - - 180
123 2020 Green Peter/Foster Historical 638 3.673% 23 - - 23
124 2020 Hills Creek Historical 200 3.800% 8 - - 8
125 2020 Hungry Horse Dam Historical 4,679 4.806% 225 - - 225
126 2020 Ice Harbor Historical 7,552 3.720% 281 - - 281
127 2020 John Day Historical 12,081 4.029% 487 - - 487
128 2020 Libby Historical 1,774 4.751% 84 - - 84
129 2020 Little Goose Historical 3,426 4.379% 150 - - 150
130 2020 Lookout Dam Historical 8,373 5.052% 423 - - 423
131 2020 Lost Creek Historical 7 3.748% - -
132 2020 Lower Granite Historical 13,411 3.964% 532 - - 532
133 2020 Lower Monument Historical 4,850 4.258% 207 - - 207
134 2020 Lower Snake Fish and Wildlife Historical 3,700 3.901% 144 - - 144
135 2020 McNary Historical 7,276 4.218% 307 - - 307
136 2020 Minidoka/Palisades Historical 19,450 3.247% 632 - - 632
137 2020 RRP - Green Springs Historical 3 3.244% - -
138 2020 The Dalles Historical 40,145 5.068% 2,035 - - 2,035
139 2020 Yakima Chandler/Kenniwick Historical 848 5.111% 43 - - 43
140 2020 Bureau Direct Historical 1,011,000 2.980% 30,126 - (1,347) 28,779
141 2020 Conservation Historical 413,000 2.240% 9,252 - - 9,252
142 2020 Construction (AS) Historical 39,650 1.404% 556 - (94) 462
143 2020 Corps Historical 315,389 2.836% 8,945 - - 8,945
144 2020 Fish and Wildlife Historical 385,000 3.091% 11,902 - - 11,902
145 2020 Replacements Historical 219,724 3.870% 8,503 - - 8,503
146 2020 Replacements New 219,724 1.935% 4,252 - - 4,252
147 2020 Technology (G) Historical 54,000 1.460% 789 - - 789
148 2020 Float Historical - - (1,148) - - (1,148)
149 FY 2020 Subtotal: 4,380,015 143,054 - (1,441) 141,612
150 2021 Albeni Falls Historical 580 4.988% 29 - - 29
151 2021 Boise Historical 1,060 5.091% 54 - - 54
152 2021 Bonneville Dam Historical 45,614 4.586% 2,092 - - 2,092
BP-18-FS-BPA-02A Page 102
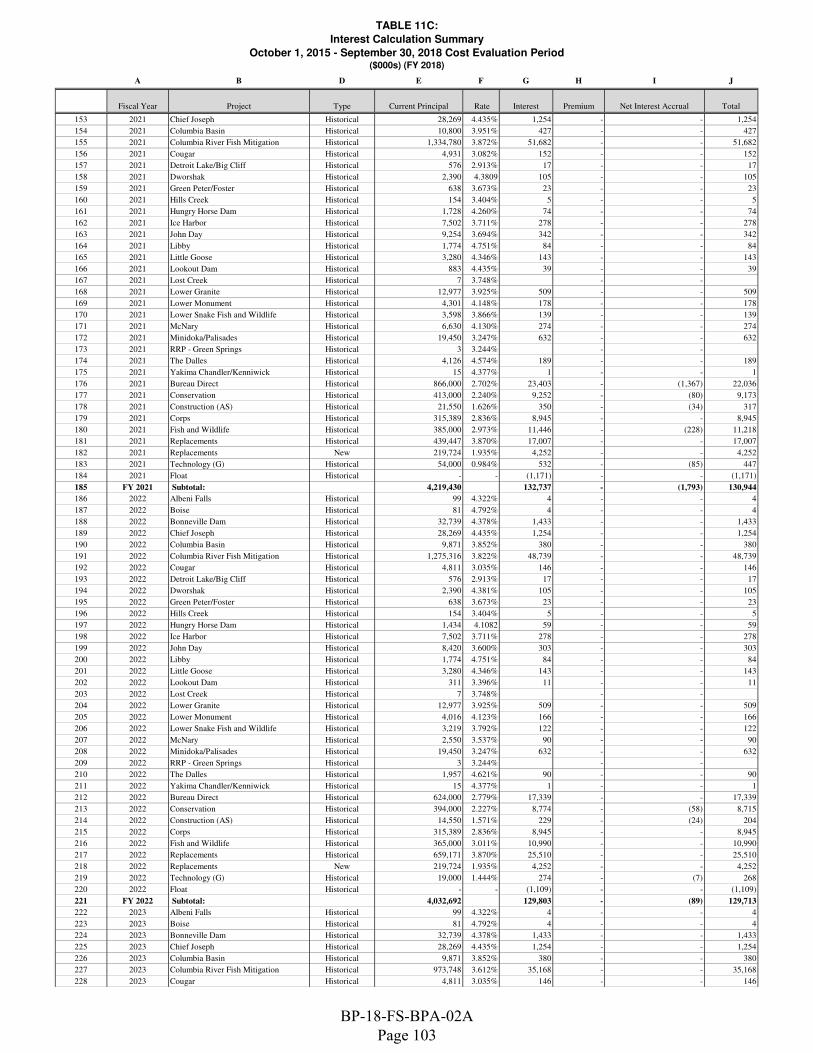
TABLE 11C:
Interest Calculation Summary
October 1, 2015 - September 30, 2018 Cost Evaluation Period($000s) (FY 2018)
A B D E F G H I J
Column1 Fiscal Year Project Type Current Principal Rate Interest Premium Net Interest Accrual Total
153 2021 Chief Joseph Historical 28,269 4.435% 1,254 - - 1,254
154 2021 Columbia Basin Historical 10,800 3.951% 427 - - 427
155 2021 Columbia River Fish Mitigation Historical 1,334,780 3.872% 51,682 - - 51,682
156 2021 Cougar Historical 4,931 3.082% 152 - - 152
157 2021 Detroit Lake/Big Cliff Historical 576 2.913% 17 - - 17
158 2021 Dworshak Historical 2,390 4.3809 105 - - 105
159 2021 Green Peter/Foster Historical 638 3.673% 23 - - 23
160 2021 Hills Creek Historical 154 3.404% 5 - - 5
161 2021 Hungry Horse Dam Historical 1,728 4.260% 74 - - 74
162 2021 Ice Harbor Historical 7,502 3.711% 278 - - 278
163 2021 John Day Historical 9,254 3.694% 342 - - 342
164 2021 Libby Historical 1,774 4.751% 84 - - 84
165 2021 Little Goose Historical 3,280 4.346% 143 - - 143
166 2021 Lookout Dam Historical 883 4.435% 39 - - 39
167 2021 Lost Creek Historical 7 3.748% - -
168 2021 Lower Granite Historical 12,977 3.925% 509 - - 509
169 2021 Lower Monument Historical 4,301 4.148% 178 - - 178
170 2021 Lower Snake Fish and Wildlife Historical 3,598 3.866% 139 - - 139
171 2021 McNary Historical 6,630 4.130% 274 - - 274
172 2021 Minidoka/Palisades Historical 19,450 3.247% 632 - - 632
173 2021 RRP - Green Springs Historical 3 3.244% - -
174 2021 The Dalles Historical 4,126 4.574% 189 - - 189
175 2021 Yakima Chandler/Kenniwick Historical 15 4.377% 1 - - 1
176 2021 Bureau Direct Historical 866,000 2.702% 23,403 - (1,367) 22,036
177 2021 Conservation Historical 413,000 2.240% 9,252 - (80) 9,173
178 2021 Construction (AS) Historical 21,550 1.626% 350 - (34) 317
179 2021 Corps Historical 315,389 2.836% 8,945 - - 8,945
180 2021 Fish and Wildlife Historical 385,000 2.973% 11,446 - (228) 11,218
181 2021 Replacements Historical 439,447 3.870% 17,007 - - 17,007
182 2021 Replacements New 219,724 1.935% 4,252 - - 4,252
183 2021 Technology (G) Historical 54,000 0.984% 532 - (85) 447
184 2021 Float Historical - - (1,171) - - (1,171)
185 FY 2021 Subtotal: 4,219,430 132,737 - (1,793) 130,944
186 2022 Albeni Falls Historical 99 4.322% 4 - - 4
187 2022 Boise Historical 81 4.792% 4 - - 4
188 2022 Bonneville Dam Historical 32,739 4.378% 1,433 - - 1,433
189 2022 Chief Joseph Historical 28,269 4.435% 1,254 - - 1,254
190 2022 Columbia Basin Historical 9,871 3.852% 380 - - 380
191 2022 Columbia River Fish Mitigation Historical 1,275,316 3.822% 48,739 - - 48,739
192 2022 Cougar Historical 4,811 3.035% 146 - - 146
193 2022 Detroit Lake/Big Cliff Historical 576 2.913% 17 - - 17
194 2022 Dworshak Historical 2,390 4.381% 105 - - 105
195 2022 Green Peter/Foster Historical 638 3.673% 23 - - 23
196 2022 Hills Creek Historical 154 3.404% 5 - - 5
197 2022 Hungry Horse Dam Historical 1,434 4.1082 59 - - 59
198 2022 Ice Harbor Historical 7,502 3.711% 278 - - 278
199 2022 John Day Historical 8,420 3.600% 303 - - 303
200 2022 Libby Historical 1,774 4.751% 84 - - 84
201 2022 Little Goose Historical 3,280 4.346% 143 - - 143
202 2022 Lookout Dam Historical 311 3.396% 11 - - 11
203 2022 Lost Creek Historical 7 3.748% - -
204 2022 Lower Granite Historical 12,977 3.925% 509 - - 509
205 2022 Lower Monument Historical 4,016 4.123% 166 - - 166
206 2022 Lower Snake Fish and Wildlife Historical 3,219 3.792% 122 - - 122
207 2022 McNary Historical 2,550 3.537% 90 - - 90
208 2022 Minidoka/Palisades Historical 19,450 3.247% 632 - - 632
209 2022 RRP - Green Springs Historical 3 3.244% - -
210 2022 The Dalles Historical 1,957 4.621% 90 - - 90
211 2022 Yakima Chandler/Kenniwick Historical 15 4.377% 1 - - 1
212 2022 Bureau Direct Historical 624,000 2.779% 17,339 - - 17,339
213 2022 Conservation Historical 394,000 2.227% 8,774 - (58) 8,715
214 2022 Construction (AS) Historical 14,550 1.571% 229 - (24) 204
215 2022 Corps Historical 315,389 2.836% 8,945 - - 8,945
216 2022 Fish and Wildlife Historical 365,000 3.011% 10,990 - - 10,990
217 2022 Replacements Historical 659,171 3.870% 25,510 - - 25,510
218 2022 Replacements New 219,724 1.935% 4,252 - - 4,252
219 2022 Technology (G) Historical 19,000 1.444% 274 - (7) 268
220 2022 Float Historical - - (1,109) - - (1,109)
221 FY 2022 Subtotal: 4,032,692 129,803 - (89) 129,713
222 2023 Albeni Falls Historical 99 4.322% 4 - - 4
223 2023 Boise Historical 81 4.792% 4 - - 4
224 2023 Bonneville Dam Historical 32,739 4.378% 1,433 - - 1,433
225 2023 Chief Joseph Historical 28,269 4.435% 1,254 - - 1,254
226 2023 Columbia Basin Historical 9,871 3.852% 380 - - 380
227 2023 Columbia River Fish Mitigation Historical 973,748 3.612% 35,168 - - 35,168
228 2023 Cougar Historical 4,811 3.035% 146 - - 146
BP-18-FS-BPA-02A Page 103
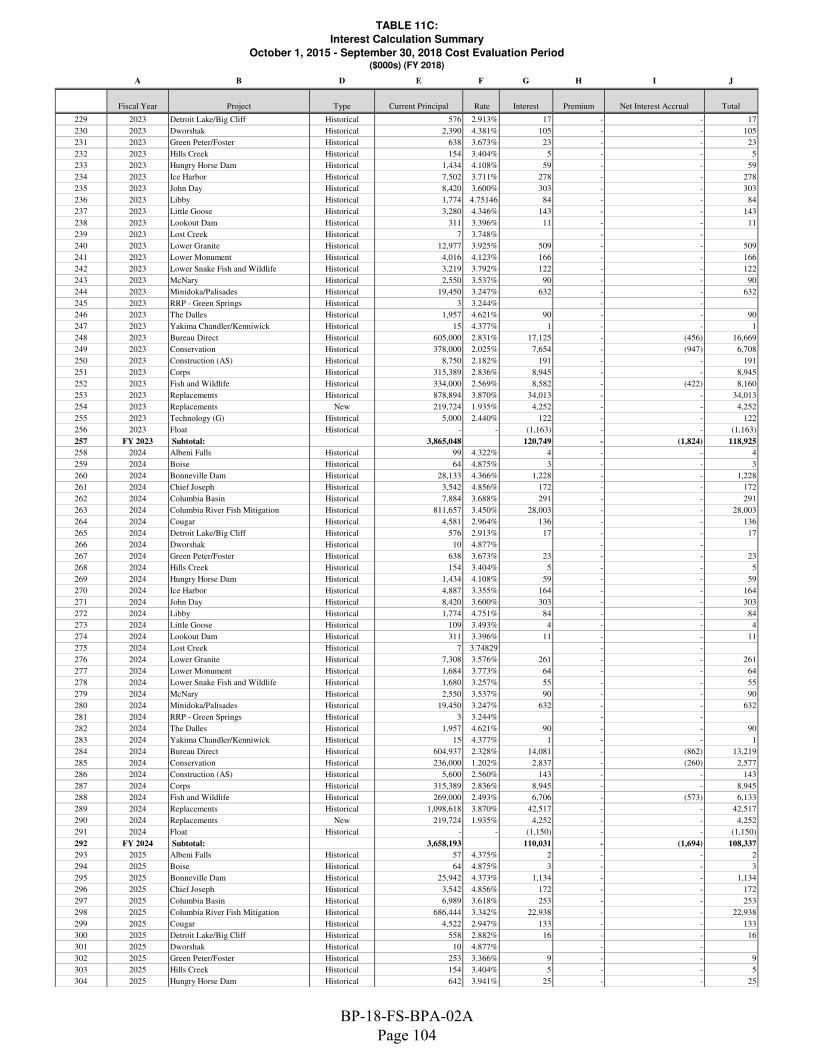
TABLE 11C:
Interest Calculation Summary
October 1, 2015 - September 30, 2018 Cost Evaluation Period($000s) (FY 2018)
A B D E F G H I J
Column1 Fiscal Year Project Type Current Principal Rate Interest Premium Net Interest Accrual Total
229 2023 Detroit Lake/Big Cliff Historical 576 2.913% 17 - - 17
230 2023 Dworshak Historical 2,390 4.381% 105 - - 105
231 2023 Green Peter/Foster Historical 638 3.673% 23 - - 23
232 2023 Hills Creek Historical 154 3.404% 5 - - 5
233 2023 Hungry Horse Dam Historical 1,434 4.108% 59 - - 59
234 2023 Ice Harbor Historical 7,502 3.711% 278 - - 278
235 2023 John Day Historical 8,420 3.600% 303 - - 303
236 2023 Libby Historical 1,774 4.75146 84 - - 84
237 2023 Little Goose Historical 3,280 4.346% 143 - - 143
238 2023 Lookout Dam Historical 311 3.396% 11 - - 11
239 2023 Lost Creek Historical 7 3.748% - -
240 2023 Lower Granite Historical 12,977 3.925% 509 - - 509
241 2023 Lower Monument Historical 4,016 4.123% 166 - - 166
242 2023 Lower Snake Fish and Wildlife Historical 3,219 3.792% 122 - - 122
243 2023 McNary Historical 2,550 3.537% 90 - - 90
244 2023 Minidoka/Palisades Historical 19,450 3.247% 632 - - 632
245 2023 RRP - Green Springs Historical 3 3.244% - -
246 2023 The Dalles Historical 1,957 4.621% 90 - - 90
247 2023 Yakima Chandler/Kenniwick Historical 15 4.377% 1 - - 1
248 2023 Bureau Direct Historical 605,000 2.831% 17,125 - (456) 16,669
249 2023 Conservation Historical 378,000 2.025% 7,654 - (947) 6,708
250 2023 Construction (AS) Historical 8,750 2.182% 191 - - 191
251 2023 Corps Historical 315,389 2.836% 8,945 - - 8,945
252 2023 Fish and Wildlife Historical 334,000 2.569% 8,582 - (422) 8,160
253 2023 Replacements Historical 878,894 3.870% 34,013 - - 34,013
254 2023 Replacements New 219,724 1.935% 4,252 - - 4,252
255 2023 Technology (G) Historical 5,000 2.440% 122 - - 122
256 2023 Float Historical - - (1,163) - - (1,163)
257 FY 2023 Subtotal: 3,865,048 120,749 - (1,824) 118,925
258 2024 Albeni Falls Historical 99 4.322% 4 - - 4
259 2024 Boise Historical 64 4.875% 3 - - 3
260 2024 Bonneville Dam Historical 28,133 4.366% 1,228 - - 1,228
261 2024 Chief Joseph Historical 3,542 4.856% 172 - - 172
262 2024 Columbia Basin Historical 7,884 3.688% 291 - - 291
263 2024 Columbia River Fish Mitigation Historical 811,657 3.450% 28,003 - - 28,003
264 2024 Cougar Historical 4,581 2.964% 136 - - 136
265 2024 Detroit Lake/Big Cliff Historical 576 2.913% 17 - - 17
266 2024 Dworshak Historical 10 4.877% - -
267 2024 Green Peter/Foster Historical 638 3.673% 23 - - 23
268 2024 Hills Creek Historical 154 3.404% 5 - - 5
269 2024 Hungry Horse Dam Historical 1,434 4.108% 59 - - 59
270 2024 Ice Harbor Historical 4,887 3.355% 164 - - 164
271 2024 John Day Historical 8,420 3.600% 303 - - 303
272 2024 Libby Historical 1,774 4.751% 84 - - 84
273 2024 Little Goose Historical 109 3.493% 4 - - 4
274 2024 Lookout Dam Historical 311 3.396% 11 - - 11
275 2024 Lost Creek Historical 7 3.74829 - -
276 2024 Lower Granite Historical 7,308 3.576% 261 - - 261
277 2024 Lower Monument Historical 1,684 3.773% 64 - - 64
278 2024 Lower Snake Fish and Wildlife Historical 1,680 3.257% 55 - - 55
279 2024 McNary Historical 2,550 3.537% 90 - - 90
280 2024 Minidoka/Palisades Historical 19,450 3.247% 632 - - 632
281 2024 RRP - Green Springs Historical 3 3.244% - -
282 2024 The Dalles Historical 1,957 4.621% 90 - - 90
283 2024 Yakima Chandler/Kenniwick Historical 15 4.377% 1 - - 1
284 2024 Bureau Direct Historical 604,937 2.328% 14,081 - (862) 13,219
285 2024 Conservation Historical 236,000 1.202% 2,837 - (260) 2,577
286 2024 Construction (AS) Historical 5,600 2.560% 143 - - 143
287 2024 Corps Historical 315,389 2.836% 8,945 - - 8,945
288 2024 Fish and Wildlife Historical 269,000 2.493% 6,706 - (573) 6,133
289 2024 Replacements Historical 1,098,618 3.870% 42,517 - - 42,517
290 2024 Replacements New 219,724 1.935% 4,252 - - 4,252
291 2024 Float Historical - - (1,150) - - (1,150)
292 FY 2024 Subtotal: 3,658,193 110,031 - (1,694) 108,337
293 2025 Albeni Falls Historical 57 4.375% 2 - - 2
294 2025 Boise Historical 64 4.875% 3 - - 3
295 2025 Bonneville Dam Historical 25,942 4.373% 1,134 - - 1,134
296 2025 Chief Joseph Historical 3,542 4.856% 172 - - 172
297 2025 Columbia Basin Historical 6,989 3.618% 253 - - 253
298 2025 Columbia River Fish Mitigation Historical 686,444 3.342% 22,938 - - 22,938
299 2025 Cougar Historical 4,522 2.947% 133 - - 133
300 2025 Detroit Lake/Big Cliff Historical 558 2.882% 16 - - 16
301 2025 Dworshak Historical 10 4.877% - -
302 2025 Green Peter/Foster Historical 253 3.366% 9 - - 9
303 2025 Hills Creek Historical 154 3.404% 5 - - 5
304 2025 Hungry Horse Dam Historical 642 3.941% 25 - - 25
BP-18-FS-BPA-02A Page 104

TABLE 11C:
Interest Calculation Summary
October 1, 2015 - September 30, 2018 Cost Evaluation Period($000s) (FY 2018)
A B D E F G H I J
Column1 Fiscal Year Project Type Current Principal Rate Interest Premium Net Interest Accrual Total
305 2025 Ice Harbor Historical 4,680 3.316% 155 - - 155
306 2025 John Day Historical 8,064 3.571% 288 - - 288
307 2025 Libby Historical 1,734 4.763% 83 - - 83
308 2025 Little Goose Historical 79 3.203% 3 - - 3
309 2025 Lookout Dam Historical 311 3.396% 11 - - 11
310 2025 Lost Creek Historical 7 3.748% - -
311 2025 Lower Granite Historical 3,507 3.128% 110 - - 110
312 2025 Lower Monument Historical 254 3.199% 8 - - 8
313 2025 Lower Snake Fish and Wildlife Historical 1,674 3.254% 54 - - 54
314 2025 McNary Historical 1,791 3.39431 61 - - 61
315 2025 Minidoka/Palisades Historical 19,450 3.247% 632 - - 632
316 2025 RRP - Green Springs Historical 3 3.244% - -
317 2025 The Dalles Historical 1,957 4.621% 90 - - 90
318 2025 Yakima Chandler/Kenniwick Historical 15 4.377% 1 - - 1
319 2025 Bureau Direct Historical 463,899 1.839% 8,532 - - 8,532
320 2025 Conservation Historical 139,000 1.507% 2,095 - (104) 1,991
321 2025 Corps Historical 315,389 2.836% 8,945 - - 8,945
322 2025 Fish and Wildlife Historical 220,000 2.060% 4,531 - (399) 4,133
323 2025 Replacements Historical 1,318,341 3.870% 51,020 - - 51,020
324 2025 Replacements New 219,724 1.935% 4,252 - - 4,252
325 2025 Float Historical - - (1,087) - - (1,087)
326 FY 2025 Subtotal: 3,449,057 104,475 - (503) 103,972
327 2026 Albeni Falls Historical 57 4.375% 2 - - 2
328 2026 Boise Historical 64 4.875% 3 - - 3
329 2026 Bonneville Dam Historical 14,979 4.828% 723 - - 723
330 2026 Chief Joseph Historical 3,538 4.857% 172 - - 172
331 2026 Columbia Basin Historical 5,266 3.574% 188 - - 188
332 2026 Columbia River Fish Mitigation Historical 538,741 3.220% 17,347 - - 17,347
333 2026 Cougar Historical 4,229 2.892% 122 - - 122
334 2026 Detroit Lake/Big Cliff Historical 558 2.882% 16 - - 16
335 2026 Dworshak Historical 10 4.877% - -
336 2026 Green Peter/Foster Historical 166 3.166% 5 - - 5
337 2026 Hills Creek Historical 142 3.375% 5 - - 5
338 2026 Hungry Horse Dam Historical 139 4.628% 6 - - 6
339 2026 Ice Harbor Historical 3,862 3.224% 124 - - 124
340 2026 John Day Historical 7,890 3.567% 281 - - 281
341 2026 Libby Historical 1,582 4.860% 77 - - 77
342 2026 Little Goose Historical 79 3.203% 3 - - 3
343 2026 Lookout Dam Historical 294 3.375% 10 - - 10
344 2026 Lower Granite Historical 3,499 3.127% 109 - - 109
345 2026 Lower Monument Historical 254 3.199% 8 - - 8
346 2026 Lower Snake Fish and Wildlife Historical 1,330 3.105% 41 - - 41
347 2026 McNary Historical 1,226 3.230% 40 - - 40
348 2026 Minidoka/Palisades Historical 19,450 3.247% 632 - - 632
349 2026 RRP - Green Springs Historical 3 3.244% - -
350 2026 The Dalles Historical 1,957 4.621% 90 - - 90
351 2026 Yakima Chandler/Kenniwick Historical 15 4.37675 1 - - 1
352 2026 Bureau Direct Historical 343,000 1.695% 5,815 - - 5,815
353 2026 Conservation Historical 70,000 1.338% 937 - (533) 404
354 2026 Corps Historical 315,389 2.286% 7,210 - (144) 7,066
355 2026 Fish and Wildlife Historical 164,468 1.932% 3,178 - - 3,178
356 2026 Replacements Historical 1,538,065 3.870% 59,523 - - 59,523
357 2026 Replacements New 219,724 1.935% 4,252 - - 4,252
358 2026 Float Historical - - (1,150) - - (1,150)
359 FY 2026 Subtotal: 3,259,976 99,773 - (677) 99,096
360 2027 Albeni Falls Historical 57 4.375% 2 - - 2
361 2027 Boise Historical 64 4.875% 3 - - 3
362 2027 Bonneville Dam Historical 14,979 4.828% 723 - - 723
363 2027 Chief Joseph Historical 3,510 4.869% 171 - - 171
364 2027 Columbia Basin Historical 5,255 3.575% 188 - - 188
365 2027 Columbia River Fish Mitigation Historical 289,939 3.115% 9,031 - - 9,031
366 2027 Cougar Historical 4,090 2.875% 118 - - 118
367 2027 Detroit Lake/Big Cliff Historical 558 2.882% 16 - - 16
368 2027 Dworshak Historical 10 4.877% - -
369 2027 Green Peter/Foster Historical 138 3.123% 4 - - 4
370 2027 Hungry Horse Dam Historical 137 4.653% 6 - - 6
371 2027 Ice Harbor Historical 3,747 3.219% 121 - - 121
372 2027 John Day Historical 1,729 4.253% 74 - - 74
373 2027 Libby Historical 1,567 4.875% 76 - - 76
374 2027 Little Goose Historical 79 3.203% 3 - - 3
375 2027 Lower Granite Historical 3,499 3.127% 109 - - 109
376 2027 Lower Monument Historical 165 3.104% 5 - - 5
377 2027 Lower Snake Fish and Wildlife Historical 1,330 3.105% 41 - - 41
378 2027 McNary Historical 1,215 3.229% 39 - - 39
379 2027 Minidoka/Palisades Historical 19,443 3.247% 631 - - 631
380 2027 RRP - Green Springs Historical 1 2.843% - -
BP-18-FS-BPA-02A Page 105
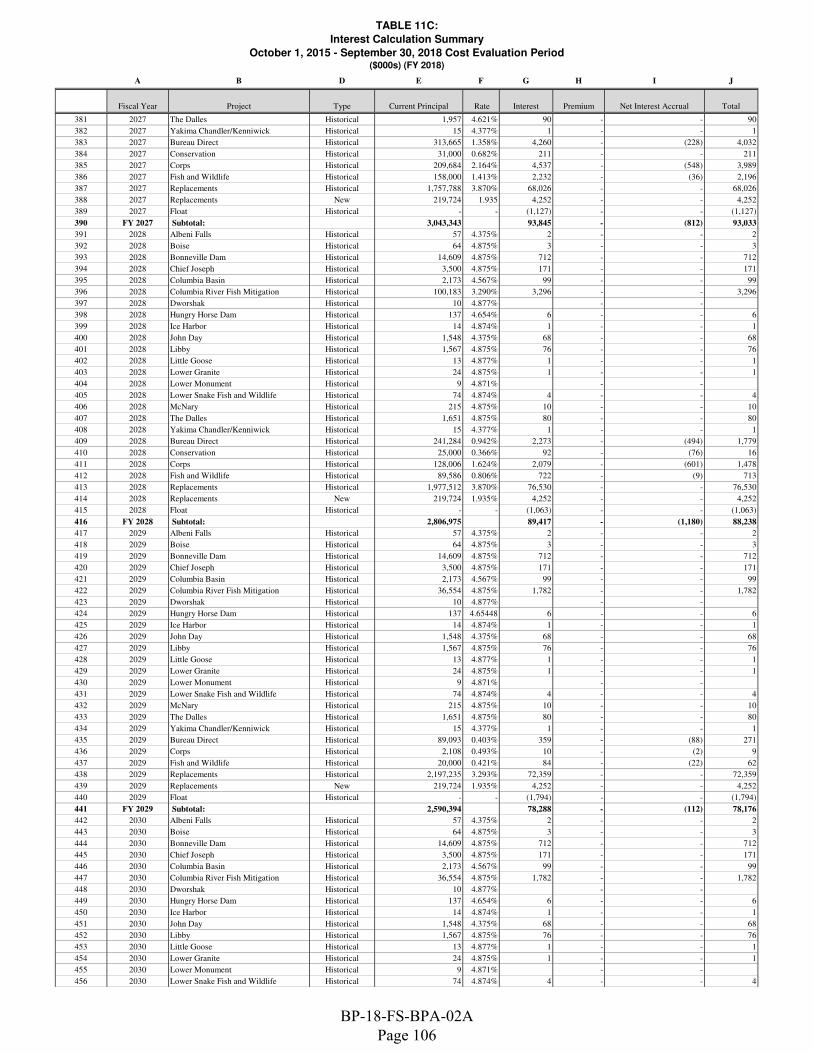
TABLE 11C:
Interest Calculation Summary
October 1, 2015 - September 30, 2018 Cost Evaluation Period($000s) (FY 2018)
A B D E F G H I J
Column1 Fiscal Year Project Type Current Principal Rate Interest Premium Net Interest Accrual Total
381 2027 The Dalles Historical 1,957 4.621% 90 - - 90
382 2027 Yakima Chandler/Kenniwick Historical 15 4.377% 1 - - 1
383 2027 Bureau Direct Historical 313,665 1.358% 4,260 - (228) 4,032
384 2027 Conservation Historical 31,000 0.682% 211 - - 211
385 2027 Corps Historical 209,684 2.164% 4,537 - (548) 3,989
386 2027 Fish and Wildlife Historical 158,000 1.413% 2,232 - (36) 2,196
387 2027 Replacements Historical 1,757,788 3.870% 68,026 - - 68,026
388 2027 Replacements New 219,724 1.935 4,252 - - 4,252
389 2027 Float Historical - - (1,127) - - (1,127)
390 FY 2027 Subtotal: 3,043,343 93,845 - (812) 93,033
391 2028 Albeni Falls Historical 57 4.375% 2 - - 2
392 2028 Boise Historical 64 4.875% 3 - - 3
393 2028 Bonneville Dam Historical 14,609 4.875% 712 - - 712
394 2028 Chief Joseph Historical 3,500 4.875% 171 - - 171
395 2028 Columbia Basin Historical 2,173 4.567% 99 - - 99
396 2028 Columbia River Fish Mitigation Historical 100,183 3.290% 3,296 - - 3,296
397 2028 Dworshak Historical 10 4.877% - -
398 2028 Hungry Horse Dam Historical 137 4.654% 6 - - 6
399 2028 Ice Harbor Historical 14 4.874% 1 - - 1
400 2028 John Day Historical 1,548 4.375% 68 - - 68
401 2028 Libby Historical 1,567 4.875% 76 - - 76
402 2028 Little Goose Historical 13 4.877% 1 - - 1
403 2028 Lower Granite Historical 24 4.875% 1 - - 1
404 2028 Lower Monument Historical 9 4.871% - -
405 2028 Lower Snake Fish and Wildlife Historical 74 4.874% 4 - - 4
406 2028 McNary Historical 215 4.875% 10 - - 10
407 2028 The Dalles Historical 1,651 4.875% 80 - - 80
408 2028 Yakima Chandler/Kenniwick Historical 15 4.377% 1 - - 1
409 2028 Bureau Direct Historical 241,284 0.942% 2,273 - (494) 1,779
410 2028 Conservation Historical 25,000 0.366% 92 - (76) 16
411 2028 Corps Historical 128,006 1.624% 2,079 - (601) 1,478
412 2028 Fish and Wildlife Historical 89,586 0.806% 722 - (9) 713
413 2028 Replacements Historical 1,977,512 3.870% 76,530 - - 76,530
414 2028 Replacements New 219,724 1.935% 4,252 - - 4,252
415 2028 Float Historical - - (1,063) - - (1,063)
416 FY 2028 Subtotal: 2,806,975 89,417 - (1,180) 88,238
417 2029 Albeni Falls Historical 57 4.375% 2 - - 2
418 2029 Boise Historical 64 4.875% 3 - - 3
419 2029 Bonneville Dam Historical 14,609 4.875% 712 - - 712
420 2029 Chief Joseph Historical 3,500 4.875% 171 - - 171
421 2029 Columbia Basin Historical 2,173 4.567% 99 - - 99
422 2029 Columbia River Fish Mitigation Historical 36,554 4.875% 1,782 - - 1,782
423 2029 Dworshak Historical 10 4.877% - -
424 2029 Hungry Horse Dam Historical 137 4.65448 6 - - 6
425 2029 Ice Harbor Historical 14 4.874% 1 - - 1
426 2029 John Day Historical 1,548 4.375% 68 - - 68
427 2029 Libby Historical 1,567 4.875% 76 - - 76
428 2029 Little Goose Historical 13 4.877% 1 - - 1
429 2029 Lower Granite Historical 24 4.875% 1 - - 1
430 2029 Lower Monument Historical 9 4.871% - -
431 2029 Lower Snake Fish and Wildlife Historical 74 4.874% 4 - - 4
432 2029 McNary Historical 215 4.875% 10 - - 10
433 2029 The Dalles Historical 1,651 4.875% 80 - - 80
434 2029 Yakima Chandler/Kenniwick Historical 15 4.377% 1 - - 1
435 2029 Bureau Direct Historical 89,093 0.403% 359 - (88) 271
436 2029 Corps Historical 2,108 0.493% 10 - (2) 9
437 2029 Fish and Wildlife Historical 20,000 0.421% 84 - (22) 62
438 2029 Replacements Historical 2,197,235 3.293% 72,359 - - 72,359
439 2029 Replacements New 219,724 1.935% 4,252 - - 4,252
440 2029 Float Historical - - (1,794) - - (1,794)
441 FY 2029 Subtotal: 2,590,394 78,288 - (112) 78,176
442 2030 Albeni Falls Historical 57 4.375% 2 - - 2
443 2030 Boise Historical 64 4.875% 3 - - 3
444 2030 Bonneville Dam Historical 14,609 4.875% 712 - - 712
445 2030 Chief Joseph Historical 3,500 4.875% 171 - - 171
446 2030 Columbia Basin Historical 2,173 4.567% 99 - - 99
447 2030 Columbia River Fish Mitigation Historical 36,554 4.875% 1,782 - - 1,782
448 2030 Dworshak Historical 10 4.877% - -
449 2030 Hungry Horse Dam Historical 137 4.654% 6 - - 6
450 2030 Ice Harbor Historical 14 4.874% 1 - - 1
451 2030 John Day Historical 1,548 4.375% 68 - - 68
452 2030 Libby Historical 1,567 4.875% 76 - - 76
453 2030 Little Goose Historical 13 4.877% 1 - - 1
454 2030 Lower Granite Historical 24 4.875% 1 - - 1
455 2030 Lower Monument Historical 9 4.871% - -
456 2030 Lower Snake Fish and Wildlife Historical 74 4.874% 4 - - 4
BP-18-FS-BPA-02A Page 106
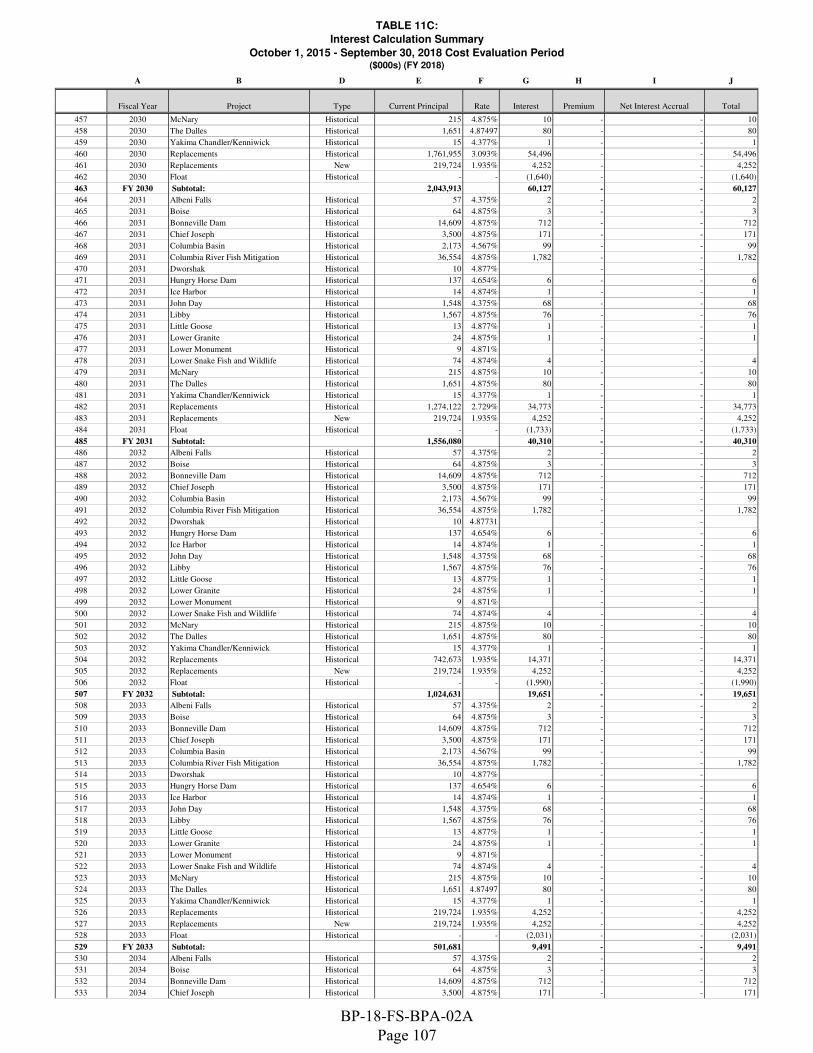
TABLE 11C:
Interest Calculation Summary
October 1, 2015 - September 30, 2018 Cost Evaluation Period($000s) (FY 2018)
A B D E F G H I J
Column1 Fiscal Year Project Type Current Principal Rate Interest Premium Net Interest Accrual Total
457 2030 McNary Historical 215 4.875% 10 - - 10
458 2030 The Dalles Historical 1,651 4.87497 80 - - 80
459 2030 Yakima Chandler/Kenniwick Historical 15 4.377% 1 - - 1
460 2030 Replacements Historical 1,761,955 3.093% 54,496 - - 54,496
461 2030 Replacements New 219,724 1.935% 4,252 - - 4,252
462 2030 Float Historical - - (1,640) - - (1,640)
463 FY 2030 Subtotal: 2,043,913 60,127 - - 60,127
464 2031 Albeni Falls Historical 57 4.375% 2 - - 2
465 2031 Boise Historical 64 4.875% 3 - - 3
466 2031 Bonneville Dam Historical 14,609 4.875% 712 - - 712
467 2031 Chief Joseph Historical 3,500 4.875% 171 - - 171
468 2031 Columbia Basin Historical 2,173 4.567% 99 - - 99
469 2031 Columbia River Fish Mitigation Historical 36,554 4.875% 1,782 - - 1,782
470 2031 Dworshak Historical 10 4.877% - -
471 2031 Hungry Horse Dam Historical 137 4.654% 6 - - 6
472 2031 Ice Harbor Historical 14 4.874% 1 - - 1
473 2031 John Day Historical 1,548 4.375% 68 - - 68
474 2031 Libby Historical 1,567 4.875% 76 - - 76
475 2031 Little Goose Historical 13 4.877% 1 - - 1
476 2031 Lower Granite Historical 24 4.875% 1 - - 1
477 2031 Lower Monument Historical 9 4.871% - -
478 2031 Lower Snake Fish and Wildlife Historical 74 4.874% 4 - - 4
479 2031 McNary Historical 215 4.875% 10 - - 10
480 2031 The Dalles Historical 1,651 4.875% 80 - - 80
481 2031 Yakima Chandler/Kenniwick Historical 15 4.377% 1 - - 1
482 2031 Replacements Historical 1,274,122 2.729% 34,773 - - 34,773
483 2031 Replacements New 219,724 1.935% 4,252 - - 4,252
484 2031 Float Historical - - (1,733) - - (1,733)
485 FY 2031 Subtotal: 1,556,080 40,310 - - 40,310
486 2032 Albeni Falls Historical 57 4.375% 2 - - 2
487 2032 Boise Historical 64 4.875% 3 - - 3
488 2032 Bonneville Dam Historical 14,609 4.875% 712 - - 712
489 2032 Chief Joseph Historical 3,500 4.875% 171 - - 171
490 2032 Columbia Basin Historical 2,173 4.567% 99 - - 99
491 2032 Columbia River Fish Mitigation Historical 36,554 4.875% 1,782 - - 1,782
492 2032 Dworshak Historical 10 4.87731 - -
493 2032 Hungry Horse Dam Historical 137 4.654% 6 - - 6
494 2032 Ice Harbor Historical 14 4.874% 1 - - 1
495 2032 John Day Historical 1,548 4.375% 68 - - 68
496 2032 Libby Historical 1,567 4.875% 76 - - 76
497 2032 Little Goose Historical 13 4.877% 1 - - 1
498 2032 Lower Granite Historical 24 4.875% 1 - - 1
499 2032 Lower Monument Historical 9 4.871% - -
500 2032 Lower Snake Fish and Wildlife Historical 74 4.874% 4 - - 4
501 2032 McNary Historical 215 4.875% 10 - - 10
502 2032 The Dalles Historical 1,651 4.875% 80 - - 80
503 2032 Yakima Chandler/Kenniwick Historical 15 4.377% 1 - - 1
504 2032 Replacements Historical 742,673 1.935% 14,371 - - 14,371
505 2032 Replacements New 219,724 1.935% 4,252 - - 4,252
506 2032 Float Historical - - (1,990) - - (1,990)
507 FY 2032 Subtotal: 1,024,631 19,651 - - 19,651
508 2033 Albeni Falls Historical 57 4.375% 2 - - 2
509 2033 Boise Historical 64 4.875% 3 - - 3
510 2033 Bonneville Dam Historical 14,609 4.875% 712 - - 712
511 2033 Chief Joseph Historical 3,500 4.875% 171 - - 171
512 2033 Columbia Basin Historical 2,173 4.567% 99 - - 99
513 2033 Columbia River Fish Mitigation Historical 36,554 4.875% 1,782 - - 1,782
514 2033 Dworshak Historical 10 4.877% - -
515 2033 Hungry Horse Dam Historical 137 4.654% 6 - - 6
516 2033 Ice Harbor Historical 14 4.874% 1 - - 1
517 2033 John Day Historical 1,548 4.375% 68 - - 68
518 2033 Libby Historical 1,567 4.875% 76 - - 76
519 2033 Little Goose Historical 13 4.877% 1 - - 1
520 2033 Lower Granite Historical 24 4.875% 1 - - 1
521 2033 Lower Monument Historical 9 4.871% - -
522 2033 Lower Snake Fish and Wildlife Historical 74 4.874% 4 - - 4
523 2033 McNary Historical 215 4.875% 10 - - 10
524 2033 The Dalles Historical 1,651 4.87497 80 - - 80
525 2033 Yakima Chandler/Kenniwick Historical 15 4.377% 1 - - 1
526 2033 Replacements Historical 219,724 1.935% 4,252 - - 4,252
527 2033 Replacements New 219,724 1.935% 4,252 - - 4,252
528 2033 Float Historical - - (2,031) - - (2,031)
529 FY 2033 Subtotal: 501,681 9,491 - - 9,491
530 2034 Albeni Falls Historical 57 4.375% 2 - - 2
531 2034 Boise Historical 64 4.875% 3 - - 3
532 2034 Bonneville Dam Historical 14,609 4.875% 712 - - 712
533 2034 Chief Joseph Historical 3,500 4.875% 171 - - 171
BP-18-FS-BPA-02A Page 107

TABLE 11C:
Interest Calculation Summary
October 1, 2015 - September 30, 2018 Cost Evaluation Period($000s) (FY 2018)
A B D E F G H I J
Column1 Fiscal Year Project Type Current Principal Rate Interest Premium Net Interest Accrual Total
534 2034 Columbia Basin Historical 2,173 4.567% 99 - - 99
535 2034 Columbia River Fish Mitigation Historical 36,554 4.875% 1,782 - - 1,782
536 2034 Dworshak Historical 10 4.877% - -
537 2034 Hungry Horse Dam Historical 137 4.654% 6 - - 6
538 2034 Ice Harbor Historical 14 4.874% 1 - - 1
539 2034 John Day Historical 1,548 4.375% 68 - - 68
540 2034 Libby Historical 1,567 4.875% 76 - - 76
541 2034 Little Goose Historical 13 4.877% 1 - - 1
542 2034 Lower Granite Historical 24 4.875% 1 - - 1
543 2034 Lower Monument Historical 9 4.871% - -
544 2034 Lower Snake Fish and Wildlife Historical 74 4.874% 4 - - 4
545 2034 McNary Historical 215 4.875% 10 - - 10
546 2034 The Dalles Historical 1,651 4.875% 80 - - 80
547 2034 Yakima Chandler/Kenniwick Historical 15 4.377% 1 - - 1
548 2034 Replacements Historical 219,724 1.935 4,252 - - 4,252
549 2034 Replacements New 219,724 1.935% 4,252 - - 4,252
550 2034 Float Historical - - (2,020) - - (2,020)
551 FY 2034 Subtotal: 501,681 9,502 - - 9,502
552 2035 Albeni Falls Historical 57 4.375% 2 - - 2
553 2035 Boise Historical 64 4.875% 3 - - 3
554 2035 Bonneville Dam Historical 14,609 4.875% 712 - - 712
555 2035 Chief Joseph Historical 3,500 4.875% 171 - - 171
556 2035 Columbia Basin Historical 2,173 4.567% 99 - - 99
557 2035 Columbia River Fish Mitigation Historical 36,554 4.875% 1,782 - - 1,782
558 2035 Dworshak Historical 10 4.877% - -
559 2035 Hungry Horse Dam Historical 137 4.654% 6 - - 6
560 2035 Ice Harbor Historical 14 4.874% 1 - - 1
561 2035 John Day Historical 1,548 4.375% 68 - - 68
562 2035 Libby Historical 1,567 4.875% 76 - - 76
563 2035 Little Goose Historical 13 4.877% 1 - - 1
564 2035 Lower Granite Historical 24 4.875% 1 - - 1
565 2035 Lower Monument Historical 9 4.871% - -
566 2035 Lower Snake Fish and Wildlife Historical 74 4.874% 4 - - 4
567 2035 McNary Historical 215 4.875% 10 - - 10
568 2035 The Dalles Historical 1,651 4.875% 80 - - 80
569 2035 Yakima Chandler/Kenniwick Historical 15 4.377% 1 - - 1
570 2035 Replacements Historical 219,724 1.935 4,252 - - 4,252
571 2035 Replacements New 219,724 1.935% 4,252 - - 4,252
572 2035 Float Historical - - (2,042) - - (2,042)
573 FY 2035 Subtotal: 501,681 9,480 - - 9,480
574 2036 Albeni Falls Historical 57 4.375% 2 - - 2
575 2036 Boise Historical 64 4.875% 3 - - 3
576 2036 Bonneville Dam Historical 14,609 4.875% 712 - - 712
577 2036 Chief Joseph Historical 3,500 4.875% 171 - - 171
578 2036 Columbia Basin Historical 2,173 4.567% 99 - - 99
579 2036 Columbia River Fish Mitigation Historical 36,554 4.875% 1,782 - - 1,782
580 2036 Dworshak Historical 10 4.877% - -
581 2036 Hungry Horse Dam Historical 137 4.654% 6 - - 6
582 2036 Ice Harbor Historical 14 4.874% 1 - - 1
583 2036 John Day Historical 1,548 4.375% 68 - - 68
584 2036 Libby Historical 1,567 4.875% 76 - - 76
585 2036 Little Goose Historical 13 4.877% 1 - - 1
586 2036 Lower Granite Historical 24 4.875% 1 - - 1
587 2036 Lower Monument Historical 9 4.871% - -
588 2036 Lower Snake Fish and Wildlife Historical 74 4.874% 4 - - 4
589 2036 McNary Historical 215 4.875% 10 - - 10
590 2036 The Dalles Historical 1,651 4.875% 80 - - 80
591 2036 Yakima Chandler/Kenniwick Historical 15 4.377% 1 - - 1
592 2036 Replacements Historical 219,724 1.935 4,252 - - 4,252
593 2036 Replacements New 219,724 1.935% 4,252 - - 4,252
594 2036 Float Historical - - (2,107) - - (2,107)
595 FY 2036 Subtotal: 501,681 9,415 - - 9,415
596 2037 Albeni Falls Historical 57 4.375% 2 - - 2
597 2037 Boise Historical 64 4.875% 3 - - 3
598 2037 Bonneville Dam Historical 14,609 4.875% 712 - - 712
599 2037 Chief Joseph Historical 3,500 4.875% 171 - - 171
600 2037 Columbia Basin Historical 2,173 4.567% 99 - - 99
601 2037 Columbia River Fish Mitigation Historical 36,554 4.875% 1,782 - - 1,782
602 2037 Dworshak Historical 10 4.877% - -
603 2037 Hungry Horse Dam Historical 137 4.654% 6 - - 6
604 2037 Ice Harbor Historical 14 4.874% 1 - - 1
605 2037 John Day Historical 1,548 4.375% 68 - - 68
606 2037 Libby Historical 1,567 4.875% 76 - - 76
607 2037 Little Goose Historical 13 4.877% 1 - - 1
608 2037 Lower Granite Historical 24 4.875% 1 - - 1
609 2037 Lower Monument Historical 9 4.871% - -
610 2037 Lower Snake Fish and Wildlife Historical 74 4.874% 4 - - 4
BP-18-FS-BPA-02A Page 108

TABLE 11C:
Interest Calculation Summary
October 1, 2015 - September 30, 2018 Cost Evaluation Period($000s) (FY 2018)
A B D E F G H I J
Column1 Fiscal Year Project Type Current Principal Rate Interest Premium Net Interest Accrual Total
611 2037 McNary Historical 215 4.875% 10 - - 10
612 2037 The Dalles Historical 1,651 4.875% 80 - - 80
613 2037 Yakima Chandler/Kenniwick Historical 15 4.377% 1 - - 1
614 2037 Replacements Historical 219,724 1.935 4,252 - - 4,252
615 2037 Replacements New 219,724 1.935% 4,252 - - 4,252
616 2037 Float Historical - - (2,108) - - (2,108)
617 FY 2037 Subtotal: 501,681 9,414 - - 9,414
618 2038 Albeni Falls Historical 57 4.375% 2 - - 2
619 2038 Boise Historical 64 4.875% 3 - - 3
620 2038 Bonneville Dam Historical 14,609 4.875% 712 - - 712
621 2038 Chief Joseph Historical 3,500 4.875% 171 - - 171
622 2038 Columbia Basin Historical 2,173 4.567% 99 - - 99
623 2038 Columbia River Fish Mitigation Historical 36,554 4.875% 1,782 - - 1,782
624 2038 Dworshak Historical 10 4.877% - -
625 2038 Hungry Horse Dam Historical 137 4.654% 6 - - 6
626 2038 Ice Harbor Historical 14 4.874% 1 - - 1
627 2038 John Day Historical 1,548 4.375% 68 - - 68
628 2038 Libby Historical 1,567 4.875% 76 - - 76
629 2038 Little Goose Historical 13 4.877% 1 - - 1
630 2038 Lower Granite Historical 24 4.875% 1 - - 1
631 2038 Lower Monument Historical 9 4.871% - -
632 2038 Lower Snake Fish and Wildlife Historical 74 4.874% 4 - - 4
633 2038 McNary Historical 215 4.875% 10 - - 10
634 2038 The Dalles Historical 1,651 4.875% 80 - - 80
635 2038 Yakima Chandler/Kenniwick Historical 15 4.377% 1 - - 1
636 2038 Replacements Historical 219,724 1.935 4,252 - - 4,252
637 2038 Replacements New 219,724 1.935% 4,252 - - 4,252
638 2038 Float Historical - - (2,131) - - (2,131)
639 FY 2038 Subtotal: 501,681 9,391 - - 9,391
640 2039 Albeni Falls Historical 57 4.375% 2 - - 2
641 2039 Boise Historical 64 4.875% 3 - - 3
642 2039 Bonneville Dam Historical 14,609 4.875% 712 - - 712
643 2039 Chief Joseph Historical 3,500 4.875% 171 - - 171
644 2039 Columbia Basin Historical 2,173 4.567% 99 - - 99
645 2039 Columbia River Fish Mitigation Historical 36,554 4.875% 1,782 - - 1,782
646 2039 Dworshak Historical 10 4.877% - -
647 2039 Hungry Horse Dam Historical 137 4.654% 6 - - 6
648 2039 Ice Harbor Historical 14 4.874% 1 - - 1
649 2039 John Day Historical 1,548 4.375% 68 - - 68
650 2039 Libby Historical 1,567 4.875% 76 - - 76
651 2039 Little Goose Historical 13 4.877% 1 - - 1
652 2039 Lower Granite Historical 24 4.875% 1 - - 1
653 2039 Lower Monument Historical 9 4.871% - -
654 2039 Lower Snake Fish and Wildlife Historical 74 4.874% 4 - - 4
655 2039 McNary Historical 215 4.875% 10 - - 10
656 2039 The Dalles Historical 1,651 4.875% 80 - - 80
657 2039 Yakima Chandler/Kenniwick Historical 15 4.377% 1 - - 1
658 2039 Replacements Historical 219,724 1.935 4,252 - - 4,252
659 2039 Replacements New 219,724 1.935% 4,252 - - 4,252
660 2039 Float Historical - - (2,203) - - (2,203)
661 FY 2039 Subtotal: 501,681 9,320 - - 9,320
662 2040 Albeni Falls Historical 57 4.375% 2 - - 2
663 2040 Boise Historical 64 4.875% 3 - - 3
664 2040 Bonneville Dam Historical 14,609 4.875% 712 - - 712
665 2040 Chief Joseph Historical 3,500 4.875% 171 - - 171
666 2040 Columbia Basin Historical 2,173 4.567% 99 - - 99
667 2040 Columbia River Fish Mitigation Historical 36,554 4.875% 1,782 - - 1,782
668 2040 Dworshak Historical 10 4.877% - -
669 2040 Hungry Horse Dam Historical 137 4.654% 6 - - 6
670 2040 Ice Harbor Historical 14 4.874% 1 - - 1
671 2040 John Day Historical 1,548 4.375% 68 - - 68
672 2040 Libby Historical 1,567 4.875% 76 - - 76
673 2040 Little Goose Historical 13 4.877% 1 - - 1
674 2040 Lower Granite Historical 24 4.875% 1 - - 1
675 2040 Lower Monument Historical 9 4.871% - -
676 2040 Lower Snake Fish and Wildlife Historical 74 4.874% 4 - - 4
677 2040 McNary Historical 215 4.875% 10 - - 10
678 2040 The Dalles Historical 1,651 4.875% 80 - - 80
679 2040 Yakima Chandler/Kenniwick Historical 15 4.377% 1 - - 1
680 2040 Replacements Historical 219,724 1.935 4,252 - - 4,252
681 2040 Replacements New 219,724 1.935% 4,252 - - 4,252
682 2040 Float Historical - - (2,208) - - (2,208)
683 FY 2040 Subtotal: 501,681 9,314 - - 9,314
684 2041 Albeni Falls Historical 57 4.375% 2 - - 2
685 2041 Boise Historical 64 4.875% 3 - - 3
686 2041 Bonneville Dam Historical 14,609 4.875% 712 - - 712
687 2041 Chief Joseph Historical 3,500 4.875% 171 - - 171
BP-18-FS-BPA-02A Page 109

TABLE 11C:
Interest Calculation Summary
October 1, 2015 - September 30, 2018 Cost Evaluation Period($000s) (FY 2018)
A B D E F G H I J
Column1 Fiscal Year Project Type Current Principal Rate Interest Premium Net Interest Accrual Total
688 2041 Columbia Basin Historical 2,173 4.567% 99 - - 99
689 2041 Columbia River Fish Mitigation Historical 36,554 4.875% 1,782 - - 1,782
690 2041 Dworshak Historical 10 4.877% - -
691 2041 Hungry Horse Dam Historical 137 4.654% 6 - - 6
692 2041 Ice Harbor Historical 14 4.874% 1 - - 1
693 2041 John Day Historical 1,548 4.375% 68 - - 68
694 2041 Libby Historical 1,567 4.875% 76 - - 76
695 2041 Little Goose Historical 13 4.877% 1 - - 1
696 2041 Lower Granite Historical 24 4.875% 1 - - 1
697 2041 Lower Monument Historical 9 4.871% - -
698 2041 Lower Snake Fish and Wildlife Historical 74 4.874% 4 - - 4
699 2041 McNary Historical 215 4.875% 10 - - 10
700 2041 The Dalles Historical 1,651 4.875% 80 - - 80
701 2041 Yakima Chandler/Kenniwick Historical 15 4.377% 1 - - 1
702 2041 Replacements Historical 219,724 1.935 4,252 - - 4,252
703 2041 Replacements New 219,724 1.935% 4,252 - - 4,252
704 2041 Float Historical - - (2,223) - - (2,223)
705 FY 2041 Subtotal: 501,681 9,299 - - 9,299
706 2042 Albeni Falls Historical 57 4.375% 2 - - 2
707 2042 Boise Historical 64 4.875% 3 - - 3
708 2042 Bonneville Dam Historical 14,609 4.875% 712 - - 712
709 2042 Chief Joseph Historical 3,500 4.875% 171 - - 171
710 2042 Columbia Basin Historical 2,173 4.567% 99 - - 99
711 2042 Columbia River Fish Mitigation Historical 36,554 4.875% 1,782 - - 1,782
712 2042 Dworshak Historical 10 4.877% - -
713 2042 Hungry Horse Dam Historical 137 4.654% 6 - - 6
714 2042 Ice Harbor Historical 14 4.874% 1 - - 1
715 2042 John Day Historical 1,548 4.375% 68 - - 68
716 2042 Libby Historical 1,567 4.875% 76 - - 76
717 2042 Little Goose Historical 13 4.877% 1 - - 1
718 2042 Lower Granite Historical 24 4.875% 1 - - 1
719 2042 Lower Monument Historical 9 4.871% - -
720 2042 Lower Snake Fish and Wildlife Historical 74 4.874% 4 - - 4
721 2042 McNary Historical 215 4.875% 10 - - 10
722 2042 The Dalles Historical 1,651 4.875% 80 - - 80
723 2042 Yakima Chandler/Kenniwick Historical 15 4.377% 1 - - 1
724 2042 Replacements Historical 219,724 1.935 4,252 - - 4,252
725 2042 Replacements New 219,724 1.935% 4,252 - - 4,252
726 2042 Float Historical - - (2,223) - - (2,223)
727 FY 2042 Subtotal: 501,681 9,299 - - 9,299
728 2043 Albeni Falls Historical 57 4.375% 2 - - 2
729 2043 Boise Historical 64 4.875% 3 - - 3
730 2043 Bonneville Dam Historical 14,609 4.875% 712 - - 712
731 2043 Chief Joseph Historical 3,500 4.875% 171 - - 171
732 2043 Columbia Basin Historical 2,173 4.567% 99 - - 99
733 2043 Columbia River Fish Mitigation Historical 36,554 4.875% 1,782 - - 1,782
734 2043 Dworshak Historical 10 4.877% - -
735 2043 Hungry Horse Dam Historical 137 4.654% 6 - - 6
736 2043 Ice Harbor Historical 14 4.874% 1 - - 1
737 2043 John Day Historical 1,548 4.375% 68 - - 68
738 2043 Libby Historical 1,567 4.875% 76 - - 76
739 2043 Little Goose Historical 13 4.877% 1 - - 1
740 2043 Lower Granite Historical 24 4.875% 1 - - 1
741 2043 Lower Monument Historical 9 4.871% - -
742 2043 Lower Snake Fish and Wildlife Historical 74 4.874% 4 - - 4
743 2043 McNary Historical 215 4.875% 10 - - 10
744 2043 The Dalles Historical 1,651 4.875% 80 - - 80
745 2043 Yakima Chandler/Kenniwick Historical 15 4.377% 1 - - 1
746 2043 Replacements Historical 219,724 1.935 4,252 - - 4,252
747 2043 Replacements New 219,724 1.935% 4,252 - - 4,252
748 2043 Float Historical - - (2,223) - - (2,223)
749 FY 2043 Subtotal: 501,681 9,299 - - 9,299
750 2044 Albeni Falls Historical 57 4.375% 2 - - 2
751 2044 Boise Historical 64 4.875% 3 - - 3
752 2044 Bonneville Dam Historical 14,609 4.875% 712 - - 712
753 2044 Chief Joseph Historical 3,500 4.875% 171 - - 171
754 2044 Columbia Basin Historical 2,173 4.567% 99 - - 99
755 2044 Columbia River Fish Mitigation Historical 36,554 4.875% 1,782 - - 1,782
756 2044 Dworshak Historical 10 4.877% - -
757 2044 Hungry Horse Dam Historical 137 4.654% 6 - - 6
758 2044 Ice Harbor Historical 14 4.874% 1 - - 1
759 2044 John Day Historical 1,548 4.375% 68 - - 68
760 2044 Libby Historical 1,567 4.875% 76 - - 76
761 2044 Little Goose Historical 13 4.877% 1 - - 1
762 2044 Lower Granite Historical 24 4.875% 1 - - 1
763 2044 Lower Monument Historical 9 4.871% - -
764 2044 Lower Snake Fish and Wildlife Historical 74 4.874% 4 - - 4
BP-18-FS-BPA-02A Page 110

TABLE 11C:
Interest Calculation Summary
October 1, 2015 - September 30, 2018 Cost Evaluation Period($000s) (FY 2018)
A B D E F G H I J
Column1 Fiscal Year Project Type Current Principal Rate Interest Premium Net Interest Accrual Total
765 2044 McNary Historical 215 4.875% 10 - - 10
766 2044 The Dalles Historical 1,651 4.875% 80 - - 80
767 2044 Yakima Chandler/Kenniwick Historical 15 4.377% 1 - - 1
768 2044 Replacements Historical 219,724 1.935 4,252 - - 4,252
769 2044 Replacements New 219,724 1.935% 4,252 - - 4,252
770 2044 Float Historical - - (1,956) - - (1,956)
771 FY 2044 Subtotal: 501,681 9,566 - - 9,566
772 2045 Albeni Falls Historical 57 4.375% 2 - - 2
773 2045 Boise Historical 64 4.875% 3 - - 3
774 2045 Bonneville Dam Historical 14,609 4.875% 712 - - 712
775 2045 Chief Joseph Historical 3,500 4.875% 171 - - 171
776 2045 Columbia Basin Historical 2,173 4.567% 99 - - 99
777 2045 Columbia River Fish Mitigation Historical 36,554 4.875% 1,782 - - 1,782
778 2045 Dworshak Historical 10 4.877% - -
779 2045 Hungry Horse Dam Historical 137 4.654% 6 - - 6
780 2045 Ice Harbor Historical 14 4.874% 1 - - 1
781 2045 John Day Historical 1,548 4.375% 68 - - 68
782 2045 Libby Historical 1,567 4.875% 76 - - 76
783 2045 Little Goose Historical 13 4.877% 1 - - 1
784 2045 Lower Granite Historical 24 4.875% 1 - - 1
785 2045 Lower Monument Historical 9 4.871% - -
786 2045 Lower Snake Fish and Wildlife Historical 74 4.874% 4 - - 4
787 2045 McNary Historical 215 4.875% 10 - - 10
788 2045 The Dalles Historical 1,651 4.875% 80 - - 80
789 2045 Yakima Chandler/Kenniwick Historical 15 4.377% 1 - - 1
790 2045 Replacements Historical 219,724 1.935 4,252 - - 4,252
791 2045 Replacements New 219,724 1.935% 4,252 - - 4,252
792 2045 Float Historical - - (1,160) - - (1,160)
793 FY 2045 Subtotal: 501,681 10,362 - - 10,362
794 2046 Albeni Falls Historical 57 4.375% 2 - - 2
795 2046 Boise Historical 64 4.875% 3 - - 3
796 2046 Bonneville Dam Historical 14,609 4.875% 712 - - 712
797 2046 Chief Joseph Historical 3,500 4.875% 171 - - 171
798 2046 Columbia Basin Historical 2,173 4.567% 99 - - 99
799 2046 Columbia River Fish Mitigation Historical 36,554 4.875% 1,782 - - 1,782
800 2046 Dworshak Historical 10 4.877% - -
801 2046 Hungry Horse Dam Historical 137 4.654% 6 - - 6
802 2046 Ice Harbor Historical 14 4.874% 1 - - 1
803 2046 John Day Historical 1,548 4.375% 68 - - 68
804 2046 Libby Historical 1,567 4.875% 76 - - 76
805 2046 Little Goose Historical 13 4.877% 1 - - 1
806 2046 Lower Granite Historical 24 4.875% 1 - - 1
807 2046 Lower Monument Historical 9 4.871% - -
808 2046 Lower Snake Fish and Wildlife Historical 74 4.874% 4 - - 4
809 2046 McNary Historical 215 4.875% 10 - - 10
810 2046 The Dalles Historical 1,651 4.875% 80 - - 80
811 2046 Yakima Chandler/Kenniwick Historical 15 4.377% 1 - - 1
812 2046 Replacements Historical 219,724 1.935 4,252 - - 4,252
813 2046 Replacements New 219,724 1.935% 4,252 - - 4,252
814 2046 Float Historical - - (1,160) - - (1,160)
815 FY 2046 Subtotal: 501,681 10,362 - - 10,362
816 2047 Albeni Falls Historical 57 4.375% 2 - - 2
817 2047 Boise Historical 64 4.875% 3 - - 3
818 2047 Bonneville Dam Historical 14,609 4.875% 712 - - 712
819 2047 Chief Joseph Historical 3,500 4.875% 171 - - 171
820 2047 Columbia Basin Historical 2,173 4.567% 99 - - 99
821 2047 Columbia River Fish Mitigation Historical 36,554 4.875% 1,782 - - 1,782
822 2047 Dworshak Historical 10 4.877% - -
823 2047 Hungry Horse Dam Historical 137 4.654% 6 - - 6
824 2047 Ice Harbor Historical 14 4.874% 1 - - 1
825 2047 John Day Historical 1,548 4.375% 68 - - 68
826 2047 Libby Historical 1,567 4.875% 76 - - 76
827 2047 Little Goose Historical 13 4.877% 1 - - 1
828 2047 Lower Granite Historical 24 4.875% 1 - - 1
829 2047 Lower Monument Historical 9 4.871% - -
830 2047 Lower Snake Fish and Wildlife Historical 74 4.874% 4 - - 4
831 2047 McNary Historical 215 4.875% 10 - - 10
832 2047 The Dalles Historical 1,651 4.875% 80 - - 80
833 2047 Yakima Chandler/Kenniwick Historical 15 4.377% 1 - - 1
834 2047 Replacements Historical 219,724 1.935 4,252 - - 4,252
835 2047 Replacements New 219,724 1.935% 4,252 - - 4,252
836 2047 Float Historical - - (1,160) - - (1,160)
837 FY 2047 Subtotal: 501,681 10,362 - - 10,362
838 2048 Albeni Falls Historical 57 4.375% 2 - - 2
839 2048 Boise Historical 64 4.875% 3 - - 3
840 2048 Bonneville Dam Historical 14,609 4.875% 712 - - 712
841 2048 Chief Joseph Historical 3,500 4.875% 171 - - 171
BP-18-FS-BPA-02A Page 111

TABLE 11C:
Interest Calculation Summary
October 1, 2015 - September 30, 2018 Cost Evaluation Period($000s) (FY 2018)
A B D E F G H I J
Column1 Fiscal Year Project Type Current Principal Rate Interest Premium Net Interest Accrual Total
842 2048 Columbia Basin Historical 2,173 4.567% 99 - - 99
843 2048 Columbia River Fish Mitigation Historical 36,554 4.875% 1,782 - - 1,782
844 2048 Dworshak Historical 10 4.877% - -
845 2048 Hungry Horse Dam Historical 137 4.654% 6 - - 6
846 2048 Ice Harbor Historical 14 4.874% 1 - - 1
847 2048 John Day Historical 1,548 4.375% 68 - - 68
848 2048 Libby Historical 1,567 4.875% 76 - - 76
849 2048 Little Goose Historical 13 4.877% 1 - - 1
850 2048 Lower Granite Historical 24 4.875% 1 - - 1
851 2048 Lower Monument Historical 9 4.871% - -
852 2048 Lower Snake Fish and Wildlife Historical 74 4.874% 4 - - 4
853 2048 McNary Historical 215 4.875% 10 - - 10
854 2048 The Dalles Historical 1,651 4.875% 80 - - 80
855 2048 Yakima Chandler/Kenniwick Historical 15 4.377% 1 - - 1
856 2048 Replacements Historical 219,724 1.935 4,252 - - 4,252
857 2048 Replacements New 219,724 1.935% 4,252 - - 4,252
858 2048 Float Historical - - (1,160) - - (1,160)
859 FY 2048 Subtotal: 501,681 10,362 - - 10,362
860 2049 Albeni Falls Historical 57 4.375% 2 - - 2
861 2049 Boise Historical 64 4.875% 3 - - 3
862 2049 Bonneville Dam Historical 14,609 4.875% 712 - - 712
863 2049 Chief Joseph Historical 3,500 4.875% 171 - - 171
864 2049 Columbia Basin Historical 2,173 4.567% 99 - - 99
865 2049 Columbia River Fish Mitigation Historical 36,554 4.875% 1,782 - - 1,782
866 2049 Dworshak Historical 10 4.877% - -
867 2049 Hungry Horse Dam Historical 137 4.654% 6 - - 6
868 2049 Ice Harbor Historical 14 4.874% 1 - - 1
869 2049 John Day Historical 1,548 4.375% 68 - - 68
870 2049 Libby Historical 1,567 4.875% 76 - - 76
871 2049 Little Goose Historical 13 4.877% 1 - - 1
872 2049 Lower Granite Historical 24 4.875% 1 - - 1
873 2049 Lower Monument Historical 9 4.871% - -
874 2049 Lower Snake Fish and Wildlife Historical 74 4.874% 4 - - 4
875 2049 McNary Historical 215 4.875% 10 - - 10
876 2049 The Dalles Historical 1,651 4.875% 80 - - 80
877 2049 Yakima Chandler/Kenniwick Historical 15 4.377% 1 - - 1
878 2049 Replacements Historical 219,724 1.935 4,252 - - 4,252
879 2049 Replacements New 219,724 1.935% 4,252 - - 4,252
880 2049 Float Historical - - (1,160) - - (1,160)
881 FY 2049 Subtotal: 501,681 10,362 - - 10,362
882 2050 Albeni Falls Historical 57 4.375% 2 - - 2
883 2050 Boise Historical 64 4.875% 3 - - 3
884 2050 Bonneville Dam Historical 14,609 4.875% 712 - - 712
885 2050 Chief Joseph Historical 3,500 4.875% 171 - - 171
886 2050 Columbia Basin Historical 2,173 4.567% 99 - - 99
887 2050 Columbia River Fish Mitigation Historical 36,554 4.875% 1,782 - - 1,782
888 2050 Dworshak Historical 10 4.877% - -
889 2050 Hungry Horse Dam Historical 137 4.654% 6 - - 6
890 2050 Ice Harbor Historical 14 4.874% 1 - - 1
891 2050 John Day Historical 1,548 4.375% 68 - - 68
892 2050 Libby Historical 1,567 4.875% 76 - - 76
893 2050 Little Goose Historical 13 4.877% 1 - - 1
894 2050 Lower Granite Historical 24 4.875% 1 - - 1
895 2050 Lower Monument Historical 9 4.871% - -
896 2050 Lower Snake Fish and Wildlife Historical 74 4.874% 4 - - 4
897 2050 McNary Historical 215 4.875% 10 - - 10
898 2050 The Dalles Historical 1,651 4.875% 80 - - 80
899 2050 Yakima Chandler/Kenniwick Historical 15 4.377% 1 - - 1
900 2050 Replacements Historical 219,724 1.935 4,252 - - 4,252
901 2050 Replacements New 219,724 1.935% 4,252 - - 4,252
902 2050 Float Historical - - (1,160) - - (1,160)
903 FY 2050 Subtotal: 501,681 10,362 - - 10,362
904 2051 Albeni Falls Historical 57 4.375% 2 - - 2
905 2051 Boise Historical 64 4.875% 3 - - 3
906 2051 Bonneville Dam Historical 14,609 4.875% 712 - - 712
907 2051 Chief Joseph Historical 3,500 4.875% 171 - - 171
908 2051 Columbia Basin Historical 2,173 4.567% 99 - - 99
909 2051 Columbia River Fish Mitigation Historical 36,554 4.875% 1,782 - - 1,782
910 2051 Dworshak Historical 10 4.877% - -
911 2051 Hungry Horse Dam Historical 137 4.654% 6 - - 6
912 2051 Ice Harbor Historical 14 4.874% 1 - - 1
913 2051 John Day Historical 1,548 4.375% 68 - - 68
914 2051 Libby Historical 1,567 4.875% 76 - - 76
915 2051 Little Goose Historical 13 4.877% 1 - - 1
916 2051 Lower Granite Historical 24 4.875% 1 - - 1
917 2051 Lower Monument Historical 9 4.871% - -
918 2051 Lower Snake Fish and Wildlife Historical 74 4.874% 4 - - 4
BP-18-FS-BPA-02A Page 112

TABLE 11C:
Interest Calculation Summary
October 1, 2015 - September 30, 2018 Cost Evaluation Period($000s) (FY 2018)
A B D E F G H I J
Column1 Fiscal Year Project Type Current Principal Rate Interest Premium Net Interest Accrual Total
919 2051 McNary Historical 215 4.875% 10 - - 10
920 2051 The Dalles Historical 1,651 4.875% 80 - - 80
921 2051 Yakima Chandler/Kenniwick Historical 15 4.377% 1 - - 1
922 2051 Replacements Historical 219,724 1.935 4,252 - - 4,252
923 2051 Replacements New 219,724 1.935% 4,252 - - 4,252
924 2051 Float Historical - - (1,160) - - (1,160)
925 FY 2051 Subtotal: 501,681 10,362 - - 10,362
926 2052 Albeni Falls Historical 57 4.375% 2 - - 2
927 2052 Boise Historical 64 4.875% 3 - - 3
928 2052 Bonneville Dam Historical 14,609 4.875% 712 - - 712
929 2052 Chief Joseph Historical 3,500 4.875% 171 - - 171
930 2052 Columbia Basin Historical 2,173 4.567% 99 - - 99
931 2052 Columbia River Fish Mitigation Historical 36,554 4.875% 1,782 - - 1,782
932 2052 Dworshak Historical 10 4.877% - -
933 2052 Hungry Horse Dam Historical 137 4.654% 6 - - 6
934 2052 Ice Harbor Historical 14 4.874% 1 - - 1
935 2052 John Day Historical 1,548 4.375% 68 - - 68
936 2052 Libby Historical 1,567 4.875% 76 - - 76
937 2052 Little Goose Historical 13 4.877% 1 - - 1
938 2052 Lower Granite Historical 24 4.875% 1 - - 1
939 2052 Lower Monument Historical 9 4.871% - -
940 2052 Lower Snake Fish and Wildlife Historical 74 4.874% 4 - - 4
941 2052 McNary Historical 215 4.875% 10 - - 10
942 2052 The Dalles Historical 1,651 4.875% 80 - - 80
943 2052 Yakima Chandler/Kenniwick Historical 15 4.377% 1 - - 1
944 2052 Replacements Historical 219,724 1.935 4,252 - - 4,252
945 2052 Replacements New 219,724 1.935% 4,252 - - 4,252
946 2052 Float Historical - - (1,160) - - (1,160)
947 FY 2052 Subtotal: 501,681 10,362 - - 10,362
948 2053 Albeni Falls Historical 57 4.375% 2 - - 2
949 2053 Boise Historical 64 4.875% 3 - - 3
950 2053 Bonneville Dam Historical 14,609 4.875% 712 - - 712
951 2053 Chief Joseph Historical 3,500 4.875% 171 - - 171
952 2053 Columbia Basin Historical 2,173 4.567% 99 - - 99
953 2053 Columbia River Fish Mitigation Historical 36,554 4.875% 1,782 - - 1,782
954 2053 Dworshak Historical 10 4.877% - -
955 2053 Hungry Horse Dam Historical 137 4.654% 6 - - 6
956 2053 Ice Harbor Historical 14 4.874% 1 - - 1
957 2053 John Day Historical 1,548 4.375% 68 - - 68
958 2053 Libby Historical 1,567 4.875% 76 - - 76
959 2053 Little Goose Historical 13 4.877% 1 - - 1
960 2053 Lower Granite Historical 24 4.875% 1 - - 1
961 2053 Lower Monument Historical 9 4.871% - -
962 2053 Lower Snake Fish and Wildlife Historical 74 4.874% 4 - - 4
963 2053 McNary Historical 215 4.875% 10 - - 10
964 2053 The Dalles Historical 1,651 4.875% 80 - - 80
965 2053 Yakima Chandler/Kenniwick Historical 15 4.377% 1 - - 1
966 2053 Replacements Historical 219,724 1.935 4,252 - - 4,252
967 2053 Replacements New 219,724 1.935% 4,252 - - 4,252
968 2053 Float Historical - - (1,160) - - (1,160)
969 FY 2053 Subtotal: 501,681 10,362 - - 10,362
970 2054 Albeni Falls Historical 57 4.375% 2 - - 2
971 2054 Boise Historical 64 4.875% 3 - - 3
972 2054 Bonneville Dam Historical 14,609 4.875% 712 - - 712
973 2054 Chief Joseph Historical 3,500 4.875% 171 - - 171
974 2054 Columbia Basin Historical 2,173 4.567% 99 - - 99
975 2054 Columbia River Fish Mitigation Historical 36,554 4.875% 1,782 - - 1,782
976 2054 Dworshak Historical 10 4.877% - -
977 2054 Hungry Horse Dam Historical 137 4.654% 6 - - 6
978 2054 Ice Harbor Historical 14 4.874% 1 - - 1
979 2054 John Day Historical 1,548 4.375% 68 - - 68
980 2054 Libby Historical 1,567 4.875% 76 - - 76
981 2054 Little Goose Historical 13 4.877% 1 - - 1
982 2054 Lower Granite Historical 24 4.875% 1 - - 1
983 2054 Lower Monument Historical 9 4.871% - -
984 2054 Lower Snake Fish and Wildlife Historical 74 4.874% 4 - - 4
985 2054 McNary Historical 215 4.875% 10 - - 10
986 2054 The Dalles Historical 1,651 4.875% 80 - - 80
987 2054 Yakima Chandler/Kenniwick Historical 15 4.377% 1 - - 1
988 2054 Replacements Historical 219,724 1.935 4,252 - - 4,252
989 2054 Replacements New 219,724 1.935% 4,252 - - 4,252
990 2054 Float Historical - - (1,160) - - (1,160)
991 FY 2054 Subtotal: 501,681 10,362 - - 10,362
992 2055 Albeni Falls Historical 57 4.375% 2 - - 2
993 2055 Boise Historical 64 4.875% 3 - - 3
994 2055 Bonneville Dam Historical 14,609 4.875% 712 - - 712
995 2055 Chief Joseph Historical 3,500 4.875% 171 - - 171
BP-18-FS-BPA-02A Page 113
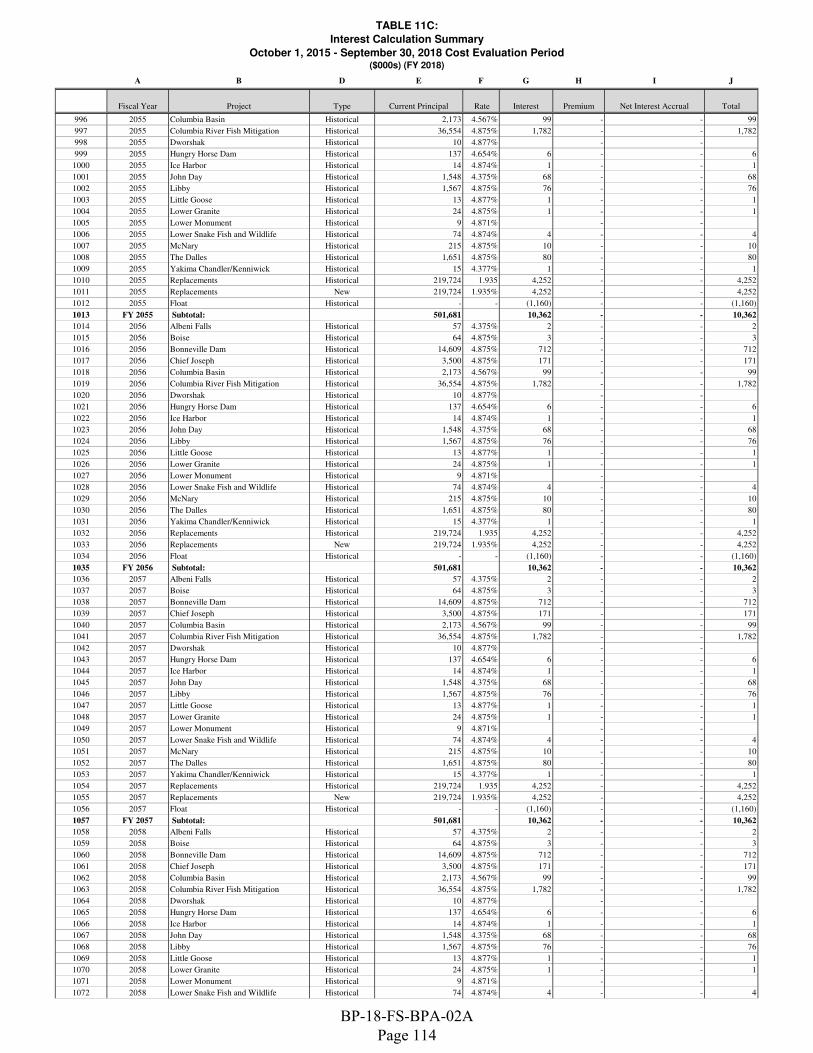
TABLE 11C:
Interest Calculation Summary
October 1, 2015 - September 30, 2018 Cost Evaluation Period($000s) (FY 2018)
A B D E F G H I J
Column1 Fiscal Year Project Type Current Principal Rate Interest Premium Net Interest Accrual Total
996 2055 Columbia Basin Historical 2,173 4.567% 99 - - 99
997 2055 Columbia River Fish Mitigation Historical 36,554 4.875% 1,782 - - 1,782
998 2055 Dworshak Historical 10 4.877% - -
999 2055 Hungry Horse Dam Historical 137 4.654% 6 - - 6
1000 2055 Ice Harbor Historical 14 4.874% 1 - - 1
1001 2055 John Day Historical 1,548 4.375% 68 - - 68
1002 2055 Libby Historical 1,567 4.875% 76 - - 76
1003 2055 Little Goose Historical 13 4.877% 1 - - 1
1004 2055 Lower Granite Historical 24 4.875% 1 - - 1
1005 2055 Lower Monument Historical 9 4.871% - -
1006 2055 Lower Snake Fish and Wildlife Historical 74 4.874% 4 - - 4
1007 2055 McNary Historical 215 4.875% 10 - - 10
1008 2055 The Dalles Historical 1,651 4.875% 80 - - 80
1009 2055 Yakima Chandler/Kenniwick Historical 15 4.377% 1 - - 1
1010 2055 Replacements Historical 219,724 1.935 4,252 - - 4,252
1011 2055 Replacements New 219,724 1.935% 4,252 - - 4,252
1012 2055 Float Historical - - (1,160) - - (1,160)
1013 FY 2055 Subtotal: 501,681 10,362 - - 10,362
1014 2056 Albeni Falls Historical 57 4.375% 2 - - 2
1015 2056 Boise Historical 64 4.875% 3 - - 3
1016 2056 Bonneville Dam Historical 14,609 4.875% 712 - - 712
1017 2056 Chief Joseph Historical 3,500 4.875% 171 - - 171
1018 2056 Columbia Basin Historical 2,173 4.567% 99 - - 99
1019 2056 Columbia River Fish Mitigation Historical 36,554 4.875% 1,782 - - 1,782
1020 2056 Dworshak Historical 10 4.877% - -
1021 2056 Hungry Horse Dam Historical 137 4.654% 6 - - 6
1022 2056 Ice Harbor Historical 14 4.874% 1 - - 1
1023 2056 John Day Historical 1,548 4.375% 68 - - 68
1024 2056 Libby Historical 1,567 4.875% 76 - - 76
1025 2056 Little Goose Historical 13 4.877% 1 - - 1
1026 2056 Lower Granite Historical 24 4.875% 1 - - 1
1027 2056 Lower Monument Historical 9 4.871% - -
1028 2056 Lower Snake Fish and Wildlife Historical 74 4.874% 4 - - 4
1029 2056 McNary Historical 215 4.875% 10 - - 10
1030 2056 The Dalles Historical 1,651 4.875% 80 - - 80
1031 2056 Yakima Chandler/Kenniwick Historical 15 4.377% 1 - - 1
1032 2056 Replacements Historical 219,724 1.935 4,252 - - 4,252
1033 2056 Replacements New 219,724 1.935% 4,252 - - 4,252
1034 2056 Float Historical - - (1,160) - - (1,160)
1035 FY 2056 Subtotal: 501,681 10,362 - - 10,362
1036 2057 Albeni Falls Historical 57 4.375% 2 - - 2
1037 2057 Boise Historical 64 4.875% 3 - - 3
1038 2057 Bonneville Dam Historical 14,609 4.875% 712 - - 712
1039 2057 Chief Joseph Historical 3,500 4.875% 171 - - 171
1040 2057 Columbia Basin Historical 2,173 4.567% 99 - - 99
1041 2057 Columbia River Fish Mitigation Historical 36,554 4.875% 1,782 - - 1,782
1042 2057 Dworshak Historical 10 4.877% - -
1043 2057 Hungry Horse Dam Historical 137 4.654% 6 - - 6
1044 2057 Ice Harbor Historical 14 4.874% 1 - - 1
1045 2057 John Day Historical 1,548 4.375% 68 - - 68
1046 2057 Libby Historical 1,567 4.875% 76 - - 76
1047 2057 Little Goose Historical 13 4.877% 1 - - 1
1048 2057 Lower Granite Historical 24 4.875% 1 - - 1
1049 2057 Lower Monument Historical 9 4.871% - -
1050 2057 Lower Snake Fish and Wildlife Historical 74 4.874% 4 - - 4
1051 2057 McNary Historical 215 4.875% 10 - - 10
1052 2057 The Dalles Historical 1,651 4.875% 80 - - 80
1053 2057 Yakima Chandler/Kenniwick Historical 15 4.377% 1 - - 1
1054 2057 Replacements Historical 219,724 1.935 4,252 - - 4,252
1055 2057 Replacements New 219,724 1.935% 4,252 - - 4,252
1056 2057 Float Historical - - (1,160) - - (1,160)
1057 FY 2057 Subtotal: 501,681 10,362 - - 10,362
1058 2058 Albeni Falls Historical 57 4.375% 2 - - 2
1059 2058 Boise Historical 64 4.875% 3 - - 3
1060 2058 Bonneville Dam Historical 14,609 4.875% 712 - - 712
1061 2058 Chief Joseph Historical 3,500 4.875% 171 - - 171
1062 2058 Columbia Basin Historical 2,173 4.567% 99 - - 99
1063 2058 Columbia River Fish Mitigation Historical 36,554 4.875% 1,782 - - 1,782
1064 2058 Dworshak Historical 10 4.877% - -
1065 2058 Hungry Horse Dam Historical 137 4.654% 6 - - 6
1066 2058 Ice Harbor Historical 14 4.874% 1 - - 1
1067 2058 John Day Historical 1,548 4.375% 68 - - 68
1068 2058 Libby Historical 1,567 4.875% 76 - - 76
1069 2058 Little Goose Historical 13 4.877% 1 - - 1
1070 2058 Lower Granite Historical 24 4.875% 1 - - 1
1071 2058 Lower Monument Historical 9 4.871% - -
1072 2058 Lower Snake Fish and Wildlife Historical 74 4.874% 4 - - 4
BP-18-FS-BPA-02A Page 114

TABLE 11C:
Interest Calculation Summary
October 1, 2015 - September 30, 2018 Cost Evaluation Period($000s) (FY 2018)
A B D E F G H I J
Column1 Fiscal Year Project Type Current Principal Rate Interest Premium Net Interest Accrual Total
1073 2058 McNary Historical 215 4.875% 10 - - 10
1074 2058 The Dalles Historical 1,651 4.875% 80 - - 80
1075 2058 Yakima Chandler/Kenniwick Historical 15 4.377% 1 - - 1
1076 2058 Replacements Historical 219,724 1.935 4,252 - - 4,252
1077 2058 Replacements New 219,724 1.935% 4,252 - - 4,252
1078 2058 Float Historical - - (1,160) - - (1,160)
1079 FY 2058 Subtotal: 501,681 10,362 - - 10,362
1080 2059 Albeni Falls Historical 57 4.375% 2 - - 2
1081 2059 Columbia Basin Historical 1,338 4.375% 59 - - 59
1082 2059 Hungry Horse Dam Historical 60 4.376% 3 - - 3
1083 2059 John Day Historical 1,548 4.375% 68 - - 68
1084 2059 Yakima Chandler/Kenniwick Historical 15 4.377% 1 - - 1
1085 2059 Replacements Historical 219,724 1.935% 4,252 - - 4,252
1086 2059 Replacements New 219,724 1.935% 4,252 - - 4,252
1087 2059 Float Historical - - (1,160) - - (1,160)
1088 FY 2059 Subtotal: 442,465 7,475 - - 7,475
1089 2060 Replacements Historical 219,724 1.935% 4,252 - - 4,252
1090 2060 Replacements New 219,724 1.935% 4,252 - - 4,252
1091 2060 Float Historical - - (1,160) - - (1,160)
1092 FY 2060 Subtotal: 439,447 7,343 - - 7,343
1093 2061 Replacements Historical 219,724 1.935% 4,252 - - 4,252
1094 2061 Replacements New 219,724 1.935% 4,252 - - 4,252
1095 2061 Float Historical - - (1,160) - - (1,160)
1096 FY 2061 Subtotal: 439,447 7,343 - - 7,343
1097 2062 Replacements Historical 219,724 1.935% 4,252 - - 4,252
1098 2062 Replacements New 219,724 1.935 4,252 - - 4,252
1099 2062 Float Historical - - (1,160) - - (1,160)
1100 FY 2062 Subtotal: 439,447 7,343 - - 7,343
1101 2063 Replacements Historical 219,724 1.935% 4,252 - - 4,252
1102 2063 Replacements New 219,724 1.935% 4,252 - - 4,252
1103 2063 Float Historical - - (1,160) - - (1,160)
1104 FY 2063 Subtotal: 439,447 7,343 - - 7,343
1105 2064 Replacements Historical 219,724 1.935% 4,252 - - 4,252
1106 2064 Replacements New 219,724 1.935% 4,252 - - 4,252
1107 2064 Float Historical - - (1,160) - - (1,160)
1108 FY 2064 Subtotal: 439,447 7,343 - - 7,343
1109 2065 Replacements Historical 219,724 1.935% 4,252 - - 4,252
1110 2065 Replacements New 219,724 1.935% 4,252 - - 4,252
1111 2065 Float Historical - - (1,160) - - (1,160)
1112 FY 2065 Subtotal: 439,447 7,343 - - 7,343
1113 2066 Replacements Historical 219,724 1.935% 4,252 - - 4,252
1114 2066 Replacements New 219,724 1.935% 4,252 - - 4,252
1115 2066 Float Historical - - (1,160) - - (1,160)
1116 FY 2066 Subtotal: 439,447 7,343 - - 7,343
1117 2067 Replacements Historical 219,724 1.935% 4,252 - - 4,252
1118 2067 Replacements New 219,724 1.935% 4,252 - - 4,252
1119 2067 Float Historical - - (1,160) - - (1,160)
1120 FY 2067 Subtotal: 439,447 7,343 - - 7,343
1121 2068 Replacements Historical 219,724 1.935% 4,252 - - 4,252
1122 2068 Replacements New 219,724 1.935% 4,252 - - 4,252
1123 2068 Float Historical - - (1,160) - - (1,160)
1124 FY 2068 Subtotal: 439,447 7,343 - - 7,343
1125 Grand Total: 70,421,439 2,013,710 - (10,729) 2,002,981
BP-18-FS-BPA-02A Page 115

TABLE 11D:
Application of Amortization
October 1, 2015 - September 30, 2018 Cost Evaluation Period
($000s) (FY 2018)
A B C D E F G H I J K L M N O P
Column1Fiscal Year Project Debt Type In Service Bond Due Date Initial Principal Current Principal
Original
Rate
Effective
Rate
Refinance
Type
Refinanced
Date
Rolled Maturity
DateRoll Rate Principal Paid Premium Discount
1 2017 Lower Snake Fish and Wildlife Lower Snake Fish & Wildlife 9/30/1983 9/30/2033 30,488 9,472 7.150% 7.150% 9,472
2 2017 Bonneville 2nd Powerhouse Corps of Engineers 9/30/1986 9/30/2033 30,578 21,534 7.150% 7.150% 21,534
3 2017 Bonneville 2nd Powerhouse Corps of Engineers 9/30/1987 9/30/2033 2,801 2,801 7.150% 7.150% 2,801
4 2017 Bonneville 2nd Powerhouse Corps of Engineers 9/30/1988 9/30/2033 1,271 1,271 7.150% 7.150% 1,271
5 2017 Bonneville 2nd Powerhouse Corps of Engineers 9/30/1989 9/30/2033 1,232 1,232 7.150% 7.150% 1,232
6 2017 Bonneville 2nd Powerhouse Corps of Engineers 9/30/1990 9/30/2033 1,588 1,588 7.150% 7.150% 1,588
7 2017 Lower Snake Fish and Wildlife Lower Snake Fish & Wildlife 9/30/1985 9/30/2035 47,921 47,921 7.150% 7.150% 47,921
8 2017 John Day Corps of Engineers 9/30/1995 9/30/2035 22 22 7.150% 7.150% 22
9 2017 John Day Corps of Engineers 9/30/1995 9/30/2035 52 52 7.150% 7.150% 52
10 2017 John Day Corps of Engineers 9/30/1995 9/30/2035 121 121 7.150% 7.150% 121
11 2017 Lower Monument Corps of Engineers 9/30/1996 9/30/2036 264 264 7.150% 7.150% 264
12 2017 Lower Snake Fish and Wildlife Lower Snake Fish & Wildlife 9/30/1987 9/30/2037 72,536 72,536 7.150% 7.150% 72,536
13 2017 Libby Corps of Engineers 9/30/1988 9/30/2038 18,043 14,781 7.150% 7.150% 14,781
14 2017 Lower Snake Fish and Wildlife Lower Snake Fish & Wildlife 9/30/1988 9/30/2038 805 805 7.150% 7.150% 805
15 2017 Lower Snake Fish and Wildlife Lower Snake Fish & Wildlife 9/30/1990 9/30/2040 1,557 1,557 7.150% 7.150% 1,557
16 2017 Little Goose Corps of Engineers 9/30/1995 9/30/2040 17 17 7.150% 7.150% 17
17 2017 Little Goose Corps of Engineers 9/30/1995 9/30/2040 450 450 7.150% 7.150% 450
18 2017 Little Goose Corps of Engineers 9/30/1995 9/30/2040 733 733 7.150% 7.150% 733
19 2017 Lower Snake Fish and Wildlife Lower Snake Fish & Wildlife 9/30/1991 9/30/2041 4,411 4,411 7.150% 7.150% 4,411
20 2017 Ice Harbor Corps of Engineers 9/30/1996 9/30/2041 371 371 7.150% 7.150% 371
21 2017 Lower Snake Fish and Wildlife Lower Snake Fish & Wildlife 9/30/1993 9/30/2043 71,632 71,632 7.150% 7.150% 71,632
22 2017 Bonneville 2nd Powerhouse Corps of Engineers 9/30/1994 9/30/2044 5,700 5,700 7.150% 7.150% 5,700
23 2017 Chief Joseph Corps of Engineers 9/30/1994 9/30/2044 4,280 4,017 7.150% 7.150% 4,017
24 2017 Lower Snake Fish and Wildlife Lower Snake Fish & Wildlife 9/30/1994 9/30/2044 4,722 4,722 7.150% 7.150% 4,722
25 2017 Columbia Basin 3rd Powerhouse Bureau of Reclamation 9/30/1994 9/30/2044 12,631 12,631 7.150% 7.150% 12,631
26 2017 Bonneville 2nd Powerhouse Corps of Engineers 9/30/1995 9/30/2045 3,791 3,791 7.150% 7.150% 3,791
27 2017 Columbia River Fish Mitigation Corps of Engineers 9/30/1995 9/30/2045 43,343 39,282 7.150% 7.150% 39,282
28 2017 Detroit Lake/Big Cliff Corps of Engineers 9/30/1995 9/30/2045 38 38 7.150% 7.150% 38
29 2017 Lookout Dam Corps of Engineers 34972 53235 80 39 7.15 7.15 39
30 2017 Lost Creek Corps of Engineers 9/30/1995 9/30/2045 94 94 7.150% 7.150% 94
31 2017 Lower Monument Corps of Engineers 9/30/1995 9/30/2045 41 41 7.150% 7.150% 41
32 2017 McNary Corps of Engineers 9/30/1995 9/30/2045 16 16 7.150% 7.150% 16
33 2017 Albeni Falls Corps of Engineers 9/30/1995 9/30/2045 443 443 7.150% 7.150% 443
34 2017 Chief Joseph Corps of Engineers 9/30/1995 9/30/2045 147 147 7.150% 7.150% 147
35 2017 Dworshak Corps of Engineers 9/30/1995 9/30/2045 1,162 1,162 7.150% 7.150% 1,162
36 2017 John Day Corps of Engineers 34972 53235 37 37 7.15 7.15 37
37 2017 Lookout Dam Corps of Engineers 9/30/1995 9/30/2045 33 33 7.150% 7.150% 33
38 2017 Lower Monument Corps of Engineers 9/30/1995 9/30/2045 99 99 7.150% 7.150% 99
39 2017 Albeni Falls Corps of Engineers 9/30/1995 9/30/2045 531 531 7.150% 7.150% 531
40 2017 Chief Joseph Corps of Engineers 9/30/1995 9/30/2045 562 562 7.150% 7.150% 562
41 2017 Lower Monument Corps of Engineers 9/30/1995 9/30/2045 624 624 7.150% 7.150% 624
42 2017 Albeni Falls Corps of Engineers 9/30/1995 9/30/2045 1,105 1,105 7.150% 7.150% 1,105
43 2017 Bonneville Dam Corps of Engineers 9/30/1995 9/30/2045 243 243 7.150% 7.150% 243
44 2017 Chief Joseph Corps of Engineers 9/30/1995 9/30/2045 712 712 7.150% 7.150% 712
45 2017 Columbia Basin Bureau of Reclamation 9/30/1995 9/30/2045 287 287 7.150% 7.150% 287
46 2017 Hungry Horse Dam Bureau of Reclamation 9/30/1995 9/30/2045 6,190 6,190 7.150% 7.150% 6,190
47 2017 Lower Monument Corps of Engineers 9/30/1995 9/30/2045 1,122 1,122 7.150% 7.150% 1,122
48 2017 Bonneville Dam Corps of Engineers 9/30/1995 9/30/2045 410 410 7.150% 7.150% 410
49 2017 Chief Joseph Corps of Engineers 9/30/1995 9/30/2045 784 784 7.150% 7.150% 784
50 2017 Columbia Basin Bureau of Reclamation 9/30/1995 9/30/2045 2,511 2,453 7.150% 7.150% 2,453
51 2017 Bonneville Dam Corps of Engineers 9/30/1995 9/30/2045 440 440 7.150% 7.150% 440
52 2017 John Day Corps of Engineers 9/30/1995 9/30/2045 608 608 7.150% 7.150% 608
53 2017 John Day Corps of Engineers 9/30/1995 9/30/2045 7,653 7,653 7.150% 7.150% 7,653
54 2017 Boise Bureau of Reclamation 35338 53600 442 442 7.15 7.15 442
55 2017 Bonneville 2nd Powerhouse Corps of Engineers 9/30/1996 9/30/2046 376 376 7.150% 7.150% 376
56 2017 Bonneville Dam Corps of Engineers 9/30/1996 9/30/2046 18 18 7.150% 7.150% 18
57 2017 Chief Joseph Corps of Engineers 9/30/1996 9/30/2046 3 3 7.150% 7.150% 3
58 2017 Columbia River Fish Mitigation Corps of Engineers 9/30/1996 9/30/2046 2,431 2,431 7.150% 7.150% 2,431
59 2017 Dworshak Corps of Engineers 9/30/1996 9/30/2046 3 3 7.150% 7.150% 3
60 2017 Green Peter/Foster Corps of Engineers 9/30/1996 9/30/2046 26 26 7.150% 7.150% 26
61 2017 Hills Creek Corps of Engineers 35338 53600 28 28 7.15 7.15 28
62 2017 Hungry Horse Dam Bureau of Reclamation 9/30/1996 9/30/2046 15 15 7.150% 7.150% 15
63 2017 Little Goose Corps of Engineers 9/30/1996 9/30/2046 10 10 7.150% 7.150% 10
64 2017 Lost Creek Corps of Engineers 9/30/1996 9/30/2046 24 24 7.150% 7.150% 24
65 2017 Lower Granite Corps of Engineers 9/30/1996 9/30/2046 9 9 7.150% 7.150% 9
66 2017 Lower Monument Corps of Engineers 9/30/1996 9/30/2046 10 10 7.150% 7.150% 10
67 2017 Lower Snake Fish and Wildlife Lower Snake Fish & Wildlife 9/30/1996 9/30/2046 12,085 12,085 7.150% 7.150% 12,085
68 2017 Bonneville Dam Corps of Engineers 9/30/1996 9/30/2046 18 18 7.150% 7.150% 18
69 2017 Chief Joseph Corps of Engineers 9/30/1996 9/30/2046 4 4 7.150% 7.150% 4
70 2017 Dworshak Corps of Engineers 9/30/1996 9/30/2046 4 4 7.150% 7.150% 4
71 2017 Hungry Horse Dam Bureau of Reclamation 9/30/1996 9/30/2046 2 2 7.150% 7.150% 2
72 2017 Little Goose Corps of Engineers 9/30/1996 9/30/2046 10 10 7.150% 7.150% 10
73 2017 Boise Bureau of Reclamation 9/30/1996 9/30/2046 656 656 7.150% 7.150% 656
74 2017 Little Goose Corps of Engineers 9/30/1996 9/30/2046 211 211 7.150% 7.150% 211
75 2017 The Dalles Corps of Engineers 9/30/1996 9/30/2046 1,991 1,991 7.150% 7.150% 1,991
76 2017 Bonneville Dam Corps of Engineers 35338 53600 80 80 7.15 7.15 80
77 2017 Chief Joseph Corps of Engineers 9/30/1996 9/30/2046 355 355 7.150% 7.150% 355
78 2017 Columbia Basin Bureau of Reclamation 9/30/1996 9/30/2046 426 426 7.150% 7.150% 426
79 2017 Little Goose Corps of Engineers 9/30/1996 9/30/2046 241 241 7.150% 7.150% 241
80 2017 Lower Granite Corps of Engineers 9/30/1996 9/30/2046 625 625 7.150% 7.150% 625
81 2017 McNary Corps of Engineers 9/30/1996 9/30/2046 619 619 7.150% 7.150% 619
82 2017 Bonneville Dam Corps of Engineers 9/30/1996 9/30/2046 109 109 7.150% 7.150% 109
83 2017 Chief Joseph Corps of Engineers 9/30/1996 9/30/2046 729 729 7.150% 7.150% 729
BP-18-FS-BPA-02A Page 116

TABLE 11D:
Application of Amortization
October 1, 2015 - September 30, 2018 Cost Evaluation Period
($000s) (FY 2018)
A B C D E F G H I J K L M N O P
Column1Fiscal Year Project Debt Type In Service Bond Due Date Initial Principal Current Principal
Original
Rate
Effective
Rate
Refinance
Type
Refinanced
Date
Rolled Maturity
DateRoll Rate Principal Paid Premium Discount
84 2017 Columbia Basin Bureau of Reclamation 9/30/1996 9/30/2046 368 368 7.150% 7.150% 368
85 2017 Dworshak Corps of Engineers 9/30/1996 9/30/2046 46 46 7.150% 7.150% 46
86 2017 Little Goose Corps of Engineers 9/30/1996 9/30/2046 520 520 7.150% 7.150% 520
87 2017 Bonneville Dam Corps of Engineers 9/30/1996 9/30/2046 142 142 7.150% 7.150% 142
88 2017 Little Goose Corps of Engineers 9/30/1996 9/30/2046 3,909 3,909 7.150% 7.150% 3,909
89 2017 Bonneville Dam Corps of Engineers 9/30/1996 9/30/2046 223 223 7.150% 7.150% 223
90 2017 Bonneville Dam Corps of Engineers 9/30/1996 9/30/2046 751 751 7.150% 7.150% 751
91 2017 Bonneville Dam Corps of Engineers 9/30/1996 9/30/2046 1,322 1,322 7.150% 7.150% 1,322
92 2017 Albeni Falls Corps of Engineers 9/30/1997 9/30/2047 431 431 7.150% 7.150% 431
93 2017 Columbia Basin Bureau of Reclamation 9/30/1997 9/30/2047 3,393 3,393 7.150% 7.150% 3,393
94 2017 Cougar Corps of Engineers 9/30/1997 9/30/2047 26 26 7.150% 7.150% 26
95 2017 Dworshak Corps of Engineers 9/30/1997 9/30/2047 7,588 7,588 7.150% 7.150% 7,588
96 2017 Little Goose Corps of Engineers 9/30/1997 9/30/2047 1 1 7.150% 7.150% 1
97 2017 Lower Granite Corps of Engineers 9/30/1997 9/30/2047 677 677 7.150% 7.150% 677
98 2017 Lower Snake Fish and Wildlife Lower Snake Fish & Wildlife 35703 53965 2,173 2,173 7.15 7.15 2,173
99 2017 Boise Bureau of Reclamation 9/30/1997 9/30/2047 2,266 2,266 7.150% 7.150% 2,266
100 2017 Chief Joseph Corps of Engineers 9/30/1997 9/30/2047 657 657 7.150% 7.150% 657
101 2017 Hungry Horse Dam Bureau of Reclamation 9/30/1997 9/30/2047 111 111 7.150% 7.150% 111
102 2017 Ice Harbor Corps of Engineers 9/30/1997 9/30/2047 67 67 7.150% 7.150% 67
103 2017 John Day Corps of Engineers 9/30/1997 9/30/2047 179 179 7.150% 7.150% 179
104 2017 Libby Corps of Engineers 9/30/1997 9/30/2047 660 660 7.150% 7.150% 660
105 2017 Minidoka/Palisades Bureau of Reclamation 9/30/1997 9/30/2047 50,911 50,911 7.150% 7.150% 50,911
106 2017 Bonneville Dam Corps of Engineers 9/30/1997 9/30/2047 161 161 7.150% 7.150% 161
107 2017 Columbia River Fish Mitigation Corps of Engineers 9/30/2000 9/30/2050 47,006 47,006 6.125% 6.125% 14,055
108 2017 Hills Creek Corps of Engineers 9/30/2000 9/30/2050 2,630 2,630 6.125% 6.125% 2,630
109 2017 Ice Harbor Corps of Engineers 9/30/2000 9/30/2050 548 548 6.125% 6.125% 548
110 2017 John Day Corps of Engineers 9/30/2000 9/30/2050 2,761 2,761 6.125% 6.125% 2,761
111 2017 Lookout Dam Corps of Engineers 9/30/2000 9/30/2050 5,098 5,098 6.125% 6.125% 5,098
112 2017 Lower Snake Fish and Wildlife Lower Snake Fish & Wildlife 9/30/2000 9/30/2050 1,529 1,529 6.125% 6.125% 1,529
113 2017 The Dalles Corps of Engineers 9/30/2000 9/30/2050 2,588 2,588 6.125% 6.125% 2,588
114 FY 2017 Subtotal: - - - 547,635 509,890 476,940
115 2018 Construction (AS) - 6/30/2013 6/30/2017 3,000 3,000 1.271% 0.750% Global 6/30/2017 6/30/2018 0.750% 3,000
116 2018 Construction (AS) - 8/31/2013 8/31/2017 2,000 2,000 1.494% 0.750% Global 8/31/2017 8/31/2018 0.750% 2,000
117 2018 Construction (AS) - 9/30/2015 9/30/2017 7,700 7,700 0.744% 0.750% Global 9/30/2017 9/30/2018 0.750% 7,700
118 2018 Construction (AS) - 4/30/2017 1/31/2018 2,450 2,450 1.051% 1.051% 2,450
119 2018 Conservation - 1/31/2013 1/31/2018 9,000 9,000 1.107% 1.107% 9,000
120 2018 Conservation - 4/30/2017 1/31/2018 20,000 20,000 1.051% 1.051% 20,000
121 2018 Bonneville Dam Corps of Engineers 9/30/2000 9/30/2050 24,446 24,446 6.125% 6.125% 24,446
122 2018 Columbia River Fish Mitigation Corps of Engineers 9/30/2000 9/30/2050 47,006 32,951 6.125% 6.125% 32,951
123 2018 Columbia River Fish Mitigation Corps of Engineers 9/30/2001 9/30/2051 6,168 6,168 5.875% 5.875% 3,315
124 2018 Green Peter/Foster Corps of Engineers 9/30/2001 9/30/2051 200 200 5.875% 5.875% 200
125 2018 Hills Creek Corps of Engineers 9/30/2001 9/30/2051 8 8 5.875% 5.875% 8
126 2018 Hungry Horse Dam Bureau of Reclamation 9/30/2001 9/30/2051 552 552 5.875% 5.875% 552
127 2018 Ice Harbor Corps of Engineers 9/30/2001 9/30/2051 764 764 5.875% 5.875% 764
128 2018 John Day Corps of Engineers 9/30/2001 9/30/2051 619 619 5.875% 5.875% 619
129 2018 Libby Corps of Engineers 9/30/2001 9/30/2051 5,562 5,562 5.875% 5.875% 5,562
130 2018 Little Goose Corps of Engineers 9/30/2001 9/30/2051 4,608 4,608 5.875% 5.875% 4,608
131 2018 Lost Creek Corps of Engineers 9/30/2001 9/30/2051 147 147 5.875% 5.875% 147
132 2018 Lower Granite Corps of Engineers 9/30/2001 9/30/2051 2,025 2,025 5.875% 5.875% 2,025
133 2018 Lower Monument Corps of Engineers 9/30/2001 9/30/2051 3,301 3,301 5.875% 5.875% 3,301
134 2018 Lower Snake Fish and Wildlife Lower Snake Fish & Wildlife 9/30/2001 9/30/2051 325 325 5.875% 5.875% 325
135 2018 McNary Corps of Engineers 37164 55426 1,046 1,046 5.875 5.875 1,046
136 2018 Minidoka/Palisades Bureau of Reclamation 9/30/2001 9/30/2051 42 42 5.875% 5.875% 42
137 2018 RRP - Green Springs Bureau of Reclamation 9/30/2001 9/30/2051 11,145 11,145 5.875% 5.875% 11,145
138 2018 Yakima Roza Bureau of Reclamation 9/30/2001 9/30/2051 15 14 5.875% 5.875% 14
139 FY 2018 Subtotal: - - - 152,129 138,073 135,220
140 2019 Bureau Direct - 10/31/2009 10/31/2018 24,000 24,000 3.719% 3.719% 24,000
141 2019 Construction (AS) - 11/30/2012 11/30/2018 5,250 5,250 1.109% 1.109% 5,250
142 2019 Fish and Wildlife - 12/31/2009 12/31/2018 26,000 26,000 4.069% 4.069% 26,000
143 2019 Bureau Direct - 1/16/2014 12/31/2018 43,000 43,000 1.943% 1.943% 43,000
144 2019 Bureau Direct - 1/16/2014 12/31/2018 38,000 38,000 1.943% 1.943% 38,000
145 2019 Fish and Wildlife - 8/31/2010 8/31/2019 20,000 20,000 2.646% 2.646% 20,000
146 2019 Bonneville Dam Corps of Engineers 9/30/1999 9/30/2049 19,368 19,368 5.375% 5.375% 19,368
147 2019 Columbia River Fish Mitigation Corps of Engineers 9/30/1999 9/30/2049 14,115 14,115 5.375% 5.375% 14,115
148 2019 Dworshak Corps of Engineers 9/30/1999 9/30/2049 630 630 5.375% 5.375% 630
149 2019 Ice Harbor Corps of Engineers 9/30/1999 9/30/2049 5,516 5,516 5.375% 5.375% 5,516
150 2019 John Day Corps of Engineers 9/30/1999 9/30/2049 3,510 3,510 5.375% 5.375% 3,510
151 2019 Lower Granite Corps of Engineers 9/30/1999 9/30/2049 856 856 5.375% 5.375% 856
152 2019 Lower Snake Fish and Wildlife Lower Snake Fish & Wildlife 9/30/1999 9/30/2049 7 7 5.375% 5.375% 7
153 2019 Bonneville Dam Corps of Engineers 9/30/2001 9/30/2051 2,530 2,530 5.875% 5.875% 2,530
154 2019 Chief Joseph Corps of Engineers 9/30/2001 9/30/2051 345 345 5.875% 5.875% 345
155 2019 Columbia Basin Bureau of Reclamation 9/30/2001 9/30/2051 69,226 69,226 5.875% 5.875% 69,226
156 2019 Columbia River Fish Mitigation Corps of Engineers 9/30/2001 9/30/2051 6,168 2,853 5.875% 5.875% 2,853
157 2019 Detroit Lake/Big Cliff Corps of Engineers 9/30/2001 9/30/2051 282 282 5.875% 5.875% 282
158 2019 Bonneville Dam Corps of Engineers 9/30/2002 9/30/2052 448 448 5.500% 5.500% 448
159 2019 Chief Joseph Corps of Engineers 9/30/2002 9/30/2052 2 2 5.500% 5.500% 2
160 2019 Columbia River Fish Mitigation Corps of Engineers 9/30/2002 9/30/2052 8,797 8,797 5.500% 5.500% 8,797
161 2019 Detroit Lake/Big Cliff Corps of Engineers 9/30/2002 9/30/2052 18 18 5.500% 5.500% 18
162 2019 Dworshak Corps of Engineers 9/30/2002 9/30/2052 199 199 5.500% 5.500% 199
163 2019 Hills Creek Corps of Engineers 9/30/2002 9/30/2052 2 2 5.500% 5.500% 2
164 2019 Ice Harbor Corps of Engineers 37529 55792 1,014 1,014 5.5 5.5 1,014
165 2019 Little Goose Corps of Engineers 9/30/2002 9/30/2052 27 27 5.500% 5.500% 27
166 2019 Lower Granite Corps of Engineers 9/30/2002 9/30/2052 1,275 1,275 5.500% 5.500% 1,275
BP-18-FS-BPA-02A Page 117

TABLE 11D:
Application of Amortization
October 1, 2015 - September 30, 2018 Cost Evaluation Period
($000s) (FY 2018)
A B C D E F G H I J K L M N O P
Column1Fiscal Year Project Debt Type In Service Bond Due Date Initial Principal Current Principal
Original
Rate
Effective
Rate
Refinance
Type
Refinanced
Date
Rolled Maturity
DateRoll Rate Principal Paid Premium Discount
167 2019 Lower Monument Corps of Engineers 9/30/2002 9/30/2052 29 29 5.500% 5.500% 29
168 2019 Lower Snake Fish and Wildlife Lower Snake Fish & Wildlife 9/30/2002 9/30/2052 890 890 5.500% 5.500% 890
169 2019 The Dalles Corps of Engineers 9/30/2002 9/30/2052 1,226 1,226 5.500% 5.500% 1,226
170 2019 Bonneville Dam Corps of Engineers 9/30/2004 9/30/2054 26,741 26,741 5.375% 5.375% 17,472
171 2019 Columbia River Fish Mitigation Corps of Engineers 9/30/2004 9/30/2054 60,581 60,581 5.375% 5.375% 60,581
172 2019 Cougar Corps of Engineers 9/30/2004 9/30/2054 3,622 3,622 5.375% 5.375% 3,622
173 2019 Ice Harbor Corps of Engineers 9/30/2004 9/30/2054 3,321 3,321 5.375% 5.375% 3,321
174 2019 John Day Corps of Engineers 9/30/2004 9/30/2054 2,830 2,830 5.375% 5.375% 2,830
175 2019 Little Goose Corps of Engineers 9/30/2004 9/30/2054 68 67 5.375% 5.375% 67
176 2019 Lower Monument Corps of Engineers 9/30/2004 9/30/2054 3,423 3,423 5.375% 5.375% 3,423
177 2019 Lower Snake Fish and Wildlife Lower Snake Fish & Wildlife 9/30/2004 9/30/2054 230 230 5.375% 5.375% 230
178 2019 McNary Corps of Engineers 9/30/2004 9/30/2054 6,138 6,138 5.375% 5.375% 6,138
179 2019 The Dalles Corps of Engineers 9/30/2004 9/30/2054 182 182 5.375% 5.375% 182
180 FY 2019 Subtotal: - - - 399,862 396,547 387,278
181 2020 Construction (AS) - 10/31/2013 10/31/2019 4,200 4,200 2.039% 2.039% 4,200
182 2020 Construction (AS) - 10/31/2013 10/31/2019 5,000 5,000 2.039% 2.039% 5,000
183 2020 Bureau Direct - 40117 43769 20,000 20,000 3.842 3.842 20,000
184 2020 Bureau Direct - 11/30/2009 11/30/2019 7,000 7,000 3.637% 3.637% 7,000
185 2020 Bureau Direct - 12/31/2009 12/31/2019 13,000 13,000 4.194% 4.194% 13,000
186 2020 Construction (AS) - 1/31/2014 1/31/2020 1,750 1,750 2.183% 2.183% 1,750
187 2020 Construction (AS) - 1/31/2014 1/31/2020 2,000 2,000 2.183% 2.183% 2,000
188 2020 Construction (AS) - 4/30/2014 3/31/2020 1,400 1,400 0.947% 0.947% 1,400
189 2020 Construction (AS) - 4/30/2014 3/31/2020 2,000 2,000 0.947% 0.947% 2,000
190 2020 Bureau Direct - 3/31/2010 3/31/2020 30,000 30,000 4.083% 4.083% 30,000
191 2020 Bureau Direct - 4/30/2010 4/30/2020 18,000 18,000 3.973% 3.973% 18,000
192 2020 Construction (AS) - 5/31/2014 4/30/2020 700 700 0.526% 0.526% 700
193 2020 Bureau Direct - 5/31/2010 5/31/2020 15,000 15,000 3.574% 3.574% 15,000
194 2020 Bureau Direct - 7/31/2010 7/31/2020 17,000 17,000 3.118% 3.118% 17,000
195 2020 Construction (AS) - 7/31/2014 7/31/2020 1,050 1,050 0.674% 0.674% 1,050
196 2020 Bureau Direct - 6/30/2009 6/30/2039 25,000 25,000 5.192% 5.192% 25,000 2,759
197 2020 Bonneville Dam Corps of Engineers 9/30/2003 9/30/2053 4,581 4,581 5.125% 5.125% 4,581
198 2020 Columbia River Fish Mitigation Corps of Engineers 9/30/2003 9/30/2053 68,440 68,440 5.125% 5.125% 68,440
199 2020 Detroit Lake/Big Cliff Corps of Engineers 9/30/2003 9/30/2053 223 223 5.125% 5.125% 223
200 2020 Dworshak Corps of Engineers 9/30/2003 9/30/2053 761 761 5.125% 5.125% 761
201 2020 Ice Harbor Corps of Engineers 9/30/2003 9/30/2053 50 50 5.125% 5.125% 50
202 2020 Little Goose Corps of Engineers 9/30/2003 9/30/2053 146 146 5.125% 5.125% 146
203 2020 Lookout Dam Corps of Engineers 9/30/2003 9/30/2053 135 135 5.125% 5.125% 135
204 2020 Lower Granite Corps of Engineers 9/30/2003 9/30/2053 42 42 5.125% 5.125% 42
205 2020 Lower Monument Corps of Engineers 9/30/2003 9/30/2053 22 22 5.125% 5.125% 22
206 2020 Lower Snake Fish and Wildlife Lower Snake Fish & Wildlife 9/30/2003 9/30/2053 98 98 5.125% 5.125% 98
207 2020 McNary Corps of Engineers 9/30/2003 9/30/2053 97 97 5.125% 5.125% 97
208 2020 Chief Joseph Corps of Engineers 9/30/2003 9/30/2053 992 992 5.125% 5.125% 992
209 2020 Bonneville Dam Corps of Engineers 9/30/2004 9/30/2054 26,741 9,269 5.375% 5.375% 9,269
210 2020 Bonneville Dam Corps of Engineers 9/30/2005 9/30/2055 19,725 19,725 5.125% 5.125% 7,974
211 2020 Columbia Basin Bureau of Reclamation 9/30/2005 9/30/2055 10,963 10,963 5.125% 5.125% 10,963
212 2020 Columbia River Fish Mitigation Corps of Engineers 9/30/2005 9/30/2055 52,039 52,039 5.125% 5.125% 52,039
213 2020 Cougar Corps of Engineers 9/30/2005 9/30/2055 8,130 8,130 5.125% 5.125% 8,130
214 2020 Detroit Lake/Big Cliff Corps of Engineers 9/30/2005 9/30/2055 1,031 1,031 5.125% 5.125% 1,031
215 2020 Dworshak Corps of Engineers 9/30/2005 9/30/2055 713 713 5.125% 5.125% 713
216 2020 Hills Creek Corps of Engineers 9/30/2005 9/30/2055 46 46 5.125% 5.125% 46
217 2020 Hungry Horse Dam Bureau of Reclamation 9/30/2005 9/30/2055 2,951 2,951 5.125% 5.125% 2,951
218 2020 John Day Corps of Engineers 9/30/2005 9/30/2055 2,828 2,827 5.125% 5.125% 2,827
219 2020 Lookout Dam Corps of Engineers 9/30/2005 9/30/2055 7,355 7,355 5.125% 5.125% 7,355
220 2020 Lower Granite Corps of Engineers 9/30/2005 9/30/2055 393 393 5.125% 5.125% 393
221 2020 Lower Monument Corps of Engineers 9/30/2005 9/30/2055 527 527 5.125% 5.125% 527
222 2020 Lower Snake Fish and Wildlife Lower Snake Fish & Wildlife 9/30/2005 9/30/2055 4 4 5.125% 5.125% 4
223 2020 McNary Corps of Engineers 9/30/2005 9/30/2055 550 550 5.125% 5.125% 550
224 2020 The Dalles Corps of Engineers 9/30/2005 9/30/2055 36,019 36,019 5.125% 5.125% 36,019
225 2020 Yakima Chandler/Kenniwick Bureau of Reclamation 9/30/2005 9/30/2055 833 833 5.125% 5.125% 833
226 FY 2020 Subtotal: - - - 409,533 392,060 380,309 2,759
227 2021 Construction (AS) - 11/30/2014 11/30/2020 2,100 2,100 1.809% 1.809% 2,100
228 2021 Construction (AS) - 12/31/2014 12/31/2020 1,050 1,050 1.922% 1.922% 1,050
229 2021 Technology (G) - 1/31/2015 1/31/2021 35,000 35,000 1.469% 1.469% 35,000
230 2021 Bureau Direct - 1/31/2009 1/31/2021 25,000 25,000 3.999% 3.999% 25,000
231 2021 Construction (AS) - 2/28/2015 2/28/2021 1,750 1,750 1.761% 1.761% 1,750
232 2021 Construction (AS) - 5/31/2015 5/31/2021 2,100 2,100 1.898% 1.898% 2,100
233 2021 Conservation - 42155 44347 5,000 5,000 1.898 1.898 5,000
234 2021 Conservation - 7/31/2015 7/31/2021 14,000 14,000 2.067% 2.067% 14,000
235 2021 Bureau Direct - 11/20/2013 9/30/2021 50,000 50,000 2.812% 2.812% 50,000
236 2021 Bureau Direct - 9/30/2010 9/30/2021 22,000 22,000 2.883% 2.883% 22,000
237 2021 Fish and Wildlife - 6/30/2009 6/30/2024 20,000 20,000 4.556% 4.556% 20,000 749
238 2021 Bureau Direct - 6/22/2011 6/30/2036 30,000 30,000 4.629% 4.629% 30,000 1,183
239 2021 Bureau Direct - 6/22/2011 6/30/2038 30,000 30,000 4.700% 4.700% 30,000 1,293
240 2021 Bureau Direct - 1/31/2011 1/31/2039 35,000 35,000 5.040% 5.040% 35,000 2,890
241 2021 Bureau Direct - 2/28/2011 2/28/2040 50,000 50,000 4.995% 4.995% 50,000 3,666
242 2021 Albeni Falls Corps of Engineers 9/30/2005 9/30/2055 481 481 5.125% 5.125% 481
243 2021 Boise Bureau of Reclamation 9/30/2005 9/30/2055 903 903 5.125% 5.125% 903
244 2021 Bonneville Dam Corps of Engineers 9/30/2005 9/30/2055 19,725 11,752 5.125% 5.125% 11,752
245 2021 Columbia River Fish Mitigation Corps of Engineers 9/30/2006 9/30/2056 366,395 366,395 4.500% 4.500% 5,939
246 2021 John Day Corps of Engineers 9/30/2006 9/30/2056 601 601 4.500% 4.500% 601
247 2021 Lower Monument Corps of Engineers 9/30/2006 9/30/2056 285 285 4.500% 4.500% 285
248 2021 Lower Snake Fish and Wildlife Lower Snake Fish & Wildlife 9/30/2006 9/30/2056 379 379 4.500% 4.500% 379
249 2021 The Dalles Corps of Engineers 9/30/2006 9/30/2056 2,030 2,030 4.500% 4.500% 2,030
BP-18-FS-BPA-02A Page 118
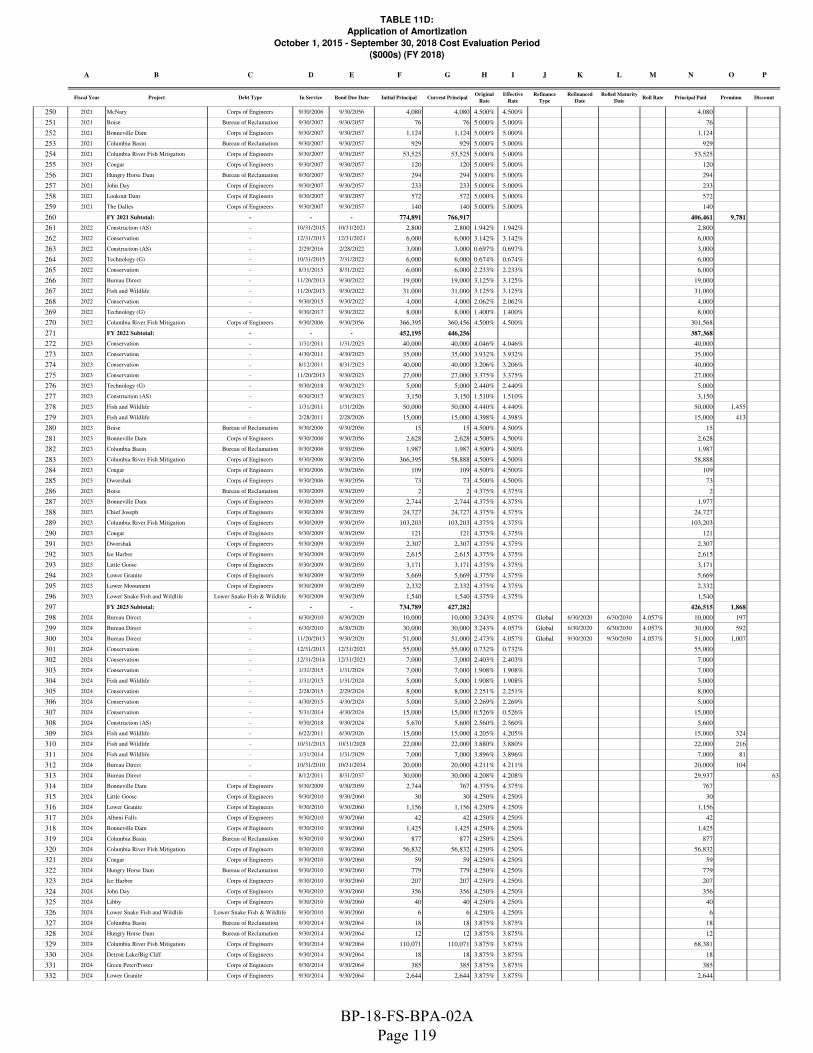
TABLE 11D:
Application of Amortization
October 1, 2015 - September 30, 2018 Cost Evaluation Period
($000s) (FY 2018)
A B C D E F G H I J K L M N O P
Column1Fiscal Year Project Debt Type In Service Bond Due Date Initial Principal Current Principal
Original
Rate
Effective
Rate
Refinance
Type
Refinanced
Date
Rolled Maturity
DateRoll Rate Principal Paid Premium Discount
250 2021 McNary Corps of Engineers 9/30/2006 9/30/2056 4,080 4,080 4.500% 4.500% 4,080
251 2021 Boise Bureau of Reclamation 9/30/2007 9/30/2057 76 76 5.000% 5.000% 76
252 2021 Bonneville Dam Corps of Engineers 9/30/2007 9/30/2057 1,124 1,124 5.000% 5.000% 1,124
253 2021 Columbia Basin Bureau of Reclamation 9/30/2007 9/30/2057 929 929 5.000% 5.000% 929
254 2021 Columbia River Fish Mitigation Corps of Engineers 9/30/2007 9/30/2057 53,525 53,525 5.000% 5.000% 53,525
255 2021 Cougar Corps of Engineers 9/30/2007 9/30/2057 120 120 5.000% 5.000% 120
256 2021 Hungry Horse Dam Bureau of Reclamation 9/30/2007 9/30/2057 294 294 5.000% 5.000% 294
257 2021 John Day Corps of Engineers 9/30/2007 9/30/2057 233 233 5.000% 5.000% 233
258 2021 Lookout Dam Corps of Engineers 9/30/2007 9/30/2057 572 572 5.000% 5.000% 572
259 2021 The Dalles Corps of Engineers 9/30/2007 9/30/2057 140 140 5.000% 5.000% 140
260 FY 2021 Subtotal: - - - 774,891 766,917 406,461 9,781
261 2022 Construction (AS) - 10/31/2015 10/31/2021 2,800 2,800 1.942% 1.942% 2,800
262 2022 Conservation - 12/31/2013 12/31/2021 6,000 6,000 3.142% 3.142% 6,000
263 2022 Construction (AS) - 2/29/2016 2/28/2022 3,000 3,000 0.697% 0.697% 3,000
264 2022 Technology (G) - 10/31/2015 7/31/2022 6,000 6,000 0.674% 0.674% 6,000
265 2022 Conservation - 8/31/2015 8/31/2022 6,000 6,000 2.233% 2.233% 6,000
266 2022 Bureau Direct - 11/20/2013 9/30/2022 19,000 19,000 3.125% 3.125% 19,000
267 2022 Fish and Wildlife - 11/20/2013 9/30/2022 31,000 31,000 3.125% 3.125% 31,000
268 2022 Conservation - 9/30/2015 9/30/2022 4,000 4,000 2.062% 2.062% 4,000
269 2022 Technology (G) - 9/30/2017 9/30/2022 8,000 8,000 1.400% 1.400% 8,000
270 2022 Columbia River Fish Mitigation Corps of Engineers 9/30/2006 9/30/2056 366,395 360,456 4.500% 4.500% 301,568
271 FY 2022 Subtotal: - - - 452,195 446,256 387,368
272 2023 Conservation - 1/31/2011 1/31/2023 40,000 40,000 4.046% 4.046% 40,000
273 2023 Conservation - 4/30/2011 4/30/2023 35,000 35,000 3.932% 3.932% 35,000
274 2023 Conservation - 8/12/2011 8/31/2023 40,000 40,000 3.206% 3.206% 40,000
275 2023 Conservation - 11/20/2013 9/30/2023 27,000 27,000 3.375% 3.375% 27,000
276 2023 Technology (G) - 9/30/2018 9/30/2023 5,000 5,000 2.440% 2.440% 5,000
277 2023 Construction (AS) - 9/30/2017 9/30/2023 3,150 3,150 1.510% 1.510% 3,150
278 2023 Fish and Wildlife - 1/31/2011 1/31/2026 50,000 50,000 4.440% 4.440% 50,000 1,455
279 2023 Fish and Wildlife - 2/28/2011 2/28/2026 15,000 15,000 4.398% 4.398% 15,000 413
280 2023 Boise Bureau of Reclamation 9/30/2006 9/30/2056 15 15 4.500% 4.500% 15
281 2023 Bonneville Dam Corps of Engineers 9/30/2006 9/30/2056 2,628 2,628 4.500% 4.500% 2,628
282 2023 Columbia Basin Bureau of Reclamation 9/30/2006 9/30/2056 1,987 1,987 4.500% 4.500% 1,987
283 2023 Columbia River Fish Mitigation Corps of Engineers 9/30/2006 9/30/2056 366,395 58,888 4.500% 4.500% 58,888
284 2023 Cougar Corps of Engineers 9/30/2006 9/30/2056 109 109 4.500% 4.500% 109
285 2023 Dworshak Corps of Engineers 9/30/2006 9/30/2056 73 73 4.500% 4.500% 73
286 2023 Boise Bureau of Reclamation 9/30/2009 9/30/2059 2 2 4.375% 4.375% 2
287 2023 Bonneville Dam Corps of Engineers 9/30/2009 9/30/2059 2,744 2,744 4.375% 4.375% 1,977
288 2023 Chief Joseph Corps of Engineers 9/30/2009 9/30/2059 24,727 24,727 4.375% 4.375% 24,727
289 2023 Columbia River Fish Mitigation Corps of Engineers 9/30/2009 9/30/2059 103,203 103,203 4.375% 4.375% 103,203
290 2023 Cougar Corps of Engineers 9/30/2009 9/30/2059 121 121 4.375% 4.375% 121
291 2023 Dworshak Corps of Engineers 9/30/2009 9/30/2059 2,307 2,307 4.375% 4.375% 2,307
292 2023 Ice Harbor Corps of Engineers 9/30/2009 9/30/2059 2,615 2,615 4.375% 4.375% 2,615
293 2023 Little Goose Corps of Engineers 9/30/2009 9/30/2059 3,171 3,171 4.375% 4.375% 3,171
294 2023 Lower Granite Corps of Engineers 9/30/2009 9/30/2059 5,669 5,669 4.375% 4.375% 5,669
295 2023 Lower Monument Corps of Engineers 9/30/2009 9/30/2059 2,332 2,332 4.375% 4.375% 2,332
296 2023 Lower Snake Fish and Wildlife Lower Snake Fish & Wildlife 9/30/2009 9/30/2059 1,540 1,540 4.375% 4.375% 1,540
297 FY 2023 Subtotal: - - - 734,789 427,282 426,515 1,868
298 2024 Bureau Direct - 6/30/2010 6/30/2020 10,000 10,000 3.243% 4.057% Global 6/30/2020 6/30/2030 4.057% 10,000 197
299 2024 Bureau Direct - 6/30/2010 6/30/2020 30,000 30,000 3.243% 4.057% Global 6/30/2020 6/30/2030 4.057% 30,000 592
300 2024 Bureau Direct - 11/20/2013 9/30/2020 51,000 51,000 2.473% 4.057% Global 9/30/2020 9/30/2030 4.057% 51,000 1,007
301 2024 Conservation - 12/31/2013 12/31/2023 55,000 55,000 0.732% 0.732% 55,000
302 2024 Conservation - 12/31/2014 12/31/2023 7,000 7,000 2.403% 2.403% 7,000
303 2024 Conservation - 1/31/2015 1/31/2024 7,000 7,000 1.908% 1.908% 7,000
304 2024 Fish and Wildlife - 1/31/2015 1/31/2024 5,000 5,000 1.908% 1.908% 5,000
305 2024 Conservation - 2/28/2015 2/29/2024 8,000 8,000 2.251% 2.251% 8,000
306 2024 Conservation - 4/30/2015 4/30/2024 5,000 5,000 2.269% 2.269% 5,000
307 2024 Conservation - 5/31/2014 4/30/2024 15,000 15,000 0.526% 0.526% 15,000
308 2024 Construction (AS) - 9/30/2018 9/30/2024 5,670 5,600 2.560% 2.560% 5,600
309 2024 Fish and Wildlife - 6/22/2011 6/30/2026 15,000 15,000 4.205% 4.205% 15,000 324
310 2024 Fish and Wildlife - 10/31/2013 10/31/2028 22,000 22,000 3.880% 3.880% 22,000 216
311 2024 Fish and Wildlife - 1/31/2014 1/31/2029 7,000 7,000 3.896% 3.896% 7,000 81
312 2024 Bureau Direct - 10/31/2010 10/31/2034 20,000 20,000 4.211% 4.211% 20,000 104
313 2024 Bureau Direct - 8/12/2011 8/31/2037 30,000 30,000 4.208% 4.208% 29,937 63
314 2024 Bonneville Dam Corps of Engineers 9/30/2009 9/30/2059 2,744 767 4.375% 4.375% 767
315 2024 Little Goose Corps of Engineers 9/30/2010 9/30/2060 30 30 4.250% 4.250% 30
316 2024 Lower Granite Corps of Engineers 9/30/2010 9/30/2060 1,156 1,156 4.250% 4.250% 1,156
317 2024 Albeni Falls Corps of Engineers 9/30/2010 9/30/2060 42 42 4.250% 4.250% 42
318 2024 Bonneville Dam Corps of Engineers 9/30/2010 9/30/2060 1,425 1,425 4.250% 4.250% 1,425
319 2024 Columbia Basin Bureau of Reclamation 9/30/2010 9/30/2060 877 877 4.250% 4.250% 877
320 2024 Columbia River Fish Mitigation Corps of Engineers 9/30/2010 9/30/2060 56,832 56,832 4.250% 4.250% 56,832
321 2024 Cougar Corps of Engineers 9/30/2010 9/30/2060 59 59 4.250% 4.250% 59
322 2024 Hungry Horse Dam Bureau of Reclamation 9/30/2010 9/30/2060 779 779 4.250% 4.250% 779
323 2024 Ice Harbor Corps of Engineers 9/30/2010 9/30/2060 207 207 4.250% 4.250% 207
324 2024 John Day Corps of Engineers 9/30/2010 9/30/2060 356 356 4.250% 4.250% 356
325 2024 Libby Corps of Engineers 9/30/2010 9/30/2060 40 40 4.250% 4.250% 40
326 2024 Lower Snake Fish and Wildlife Lower Snake Fish & Wildlife 9/30/2010 9/30/2060 6 6 4.250% 4.250% 6
327 2024 Columbia Basin Bureau of Reclamation 9/30/2014 9/30/2064 18 18 3.875% 3.875% 18
328 2024 Hungry Horse Dam Bureau of Reclamation 9/30/2014 9/30/2064 12 12 3.875% 3.875% 12
329 2024 Columbia River Fish Mitigation Corps of Engineers 9/30/2014 9/30/2064 110,071 110,071 3.875% 3.875% 68,381
330 2024 Detroit Lake/Big Cliff Corps of Engineers 9/30/2014 9/30/2064 18 18 3.875% 3.875% 18
331 2024 Green Peter/Foster Corps of Engineers 9/30/2014 9/30/2064 385 385 3.875% 3.875% 385
332 2024 Lower Granite Corps of Engineers 9/30/2014 9/30/2064 2,644 2,644 3.875% 3.875% 2,644
BP-18-FS-BPA-02A Page 119

TABLE 11D:
Application of Amortization
October 1, 2015 - September 30, 2018 Cost Evaluation Period
($000s) (FY 2018)
A B C D E F G H I J K L M N O P
Column1Fiscal Year Project Debt Type In Service Bond Due Date Initial Principal Current Principal
Original
Rate
Effective
Rate
Refinance
Type
Refinanced
Date
Rolled Maturity
DateRoll Rate Principal Paid Premium Discount
333 2024 Lower Monument Corps of Engineers 9/30/2014 9/30/2064 1,430 1,430 3.875% 3.875% 1,430
334 2024 McNary Corps of Engineers 9/30/2014 9/30/2064 759 759 3.875% 3.875% 759
335 FY 2024 Subtotal: - - - 472,560 470,512 428,759 2,523 63
336 2025 Bureau Direct - 1/16/2014 12/31/2018 26,000 26,000 1.943% 3.705% Global 12/31/2018 12/31/2028 3.705% 25,974 26
337 2025 Bureau Direct - 1/16/2014 12/31/2018 21,000 21,000 1.943% 3.705% Global 12/31/2018 12/31/2028 3.705% 20,979 21
338 2025 Bureau Direct - 1/16/2014 12/31/2018 14,000 14,000 1.943% 3.705% Global 12/31/2018 12/31/2028 3.705% 13,986 14
339 2025 Bureau Direct - 1/31/2010 1/31/2019 10,000 10,000 3.714% 3.705% Global 1/31/2019 1/31/2029 3.705% 9,960 40
340 2025 Bureau Direct - 9/30/2009 9/30/2019 25,000 25,000 3.699% 3.705% Global 9/30/2019 9/30/2029 3.705% 25,000 203
341 2025 Bureau Direct - 4/30/2009 4/30/2023 25,000 25,000 4.391% 3.642% Global 4/30/2023 4/30/2028 3.642% 25,000 138
342 2025 Fish and Wildlife - 11/20/2013 9/30/2023 23,000 23,000 3.375% 3.642% Global 9/30/2023 9/30/2028 3.642% 16,532 141
343 2025 Conservation - 6/30/2014 10/31/2024 5,000 5,000 0.526% 0.526% 5,000
344 2025 Conservation - 10/31/2014 12/31/2024 10,000 10,000 0.732% 0.732% 10,000
345 2025 Conservation - 3/31/2015 3/31/2025 5,000 5,000 2.295% 2.295% 5,000
346 2025 Conservation - 5/31/2014 4/30/2025 3,000 3,000 0.526% 0.526% 3,000
347 2025 Conservation - 4/30/2014 6/30/2025 30,000 30,000 0.732% 0.732% 30,000
348 2025 Conservation - 7/31/2014 7/31/2025 12,000 12,000 0.674% 0.674% 12,000
349 2025 Conservation - 8/31/2014 9/30/2025 4,000 4,000 0.947% 0.947% 4,000
350 2025 Fish and Wildlife - 10/31/2013 12/31/2026 28,000 28,000 3.717% 3.717% 28,000 225
351 2025 Fish and Wildlife - 10/31/2013 5/31/2027 11,000 11,000 3.762% 3.762% 11,000 98
352 2025 Hungry Horse Dam Bureau of Reclamation 9/30/2011 9/30/2061 503 503 3.750% 3.750% 503
353 2025 Bonneville Dam Corps of Engineers 9/30/2011 9/30/2061 10,962 10,962 3.750% 3.750% 10,962
354 2025 Chief Joseph Corps of Engineers 9/30/2011 9/30/2061 4 4 3.750% 3.750% 4
355 2025 Columbia Basin Bureau of Reclamation 9/30/2011 9/30/2061 1,723 1,723 3.750% 3.750% 1,723
356 2025 Columbia River Fish Mitigation Corps of Engineers 9/30/2011 9/30/2061 106,014 106,014 3.750% 3.750% 106,014
357 2025 Cougar Corps of Engineers 9/30/2011 9/30/2061 282 282 3.750% 3.750% 282
358 2025 Green Peter/Foster Corps of Engineers 9/30/2011 9/30/2061 87 87 3.750% 3.750% 87
359 2025 Hills Creek Corps of Engineers 9/30/2011 9/30/2061 12 12 3.750% 3.750% 12
360 2025 Ice Harbor Corps of Engineers 9/30/2011 9/30/2061 819 819 3.750% 3.750% 819
361 2025 John Day Corps of Engineers 9/30/2011 9/30/2061 175 175 3.750% 3.750% 175
362 2025 Libby Corps of Engineers 9/30/2011 9/30/2061 152 152 3.750% 3.750% 152
363 2025 Lookout Dam Corps of Engineers 9/30/2011 9/30/2061 17 17 3.750% 3.750% 17
364 2025 Lost Creek Corps of Engineers 9/30/2011 9/30/2061 7 7 3.750% 3.750% 7
365 2025 Lower Granite Corps of Engineers 9/30/2011 9/30/2061 8 8 3.750% 3.750% 8
366 2025 Lower Snake Fish and Wildlife Lower Snake Fish & Wildlife 9/30/2011 9/30/2061 122 122 3.750% 3.750% 122
367 2025 McNary Corps of Engineers 9/30/2011 9/30/2061 565 565 3.750% 3.750% 565
368 2025 Cougar Corps of Engineers 9/30/2014 9/30/2064 12 12 3.875% 3.875% 12
369 2025 Bonneville Dam Corps of Engineers 41912 60175 0 0 3.875 3.875 0
370 2025 Columbia River Fish Mitigation Corps of Engineers 9/30/2014 9/30/2064 110,071 41,690 3.875% 3.875% 41,690
371 2025 Lower Snake Fish and Wildlife Lower Snake Fish & Wildlife 9/30/2014 9/30/2064 222 222 3.875% 3.875% 222
372 FY 2025 Subtotal: - - - 483,755 415,374 408,805 804 101
373 2026 Fish and Wildlife - 11/20/2013 9/30/2023 23,000 6,468 3.375% 3.642% Global 9/30/2023 9/30/2028 3.642% 6,468 63
374 2026 Conservation - 10/31/2013 10/31/2025 34,000 34,000 3.568% 3.568% 34,000
375 2026 Conservation - 1/31/2014 1/31/2026 5,000 5,000 3.621% 3.621% 5,000
376 2026 Corps - 8/31/2018 8/31/2034 53,000 53,000 3.290% 3.290% 51,837
377 2026 Bureau Direct - 9/30/2018 9/30/2035 29,000 29,000 3.330% 3.330% 29,000
378 2026 Corps - 9/30/2018 9/30/2035 53,000 53,000 3.330% 3.330% 53,000
379 2026 Cougar Corps of Engineers 9/30/2012 9/30/2062 139 139 3.375% 3.375% 139
380 2026 Hungry Horse Dam Bureau of Reclamation 9/30/2012 9/30/2062 3 3 3.375% 3.375% 3
381 2026 Minidoka/Palisades Bureau of Reclamation 9/30/2012 9/30/2062 7 7 3.375% 3.375% 7
382 2026 Green Peter/Foster Corps of Engineers 9/30/2012 9/30/2062 28 28 3.375% 3.375% 28
383 2026 Chief Joseph Corps of Engineers 9/30/2012 9/30/2062 28 28 3.375% 3.375% 28
384 2026 Columbia Basin Bureau of Reclamation 9/30/2012 9/30/2062 11 11 3.375% 3.375% 11
385 2026 Columbia River Fish Mitigation Corps of Engineers 9/30/2012 9/30/2062 101,616 101,616 3.375% 3.375% 101,616
386 2026 Hills Creek Corps of Engineers 9/30/2012 9/30/2062 142 142 3.375% 3.375% 142
387 2026 Ice Harbor Corps of Engineers 9/30/2012 9/30/2062 115 115 3.375% 3.375% 115
388 2026 John Day Corps of Engineers 9/30/2012 9/30/2062 6,161 6,161 3.375% 3.375% 6,161
389 2026 Libby Corps of Engineers 9/30/2012 9/30/2062 16 16 3.375% 3.375% 16
390 2026 Lookout Dam Corps of Engineers 9/30/2012 9/30/2062 294 294 3.375% 3.375% 294
391 2026 Lower Monument Corps of Engineers 9/30/2012 9/30/2062 89 89 3.375% 3.375% 89
392 2026 McNary Corps of Engineers 9/30/2012 9/30/2062 12 11 3.375% 3.375% 11
393 2026 RRP - Green Springs Bureau of Reclamation 9/30/2012 9/30/2062 2 2 3.375% 3.375% 2
394 2026 Columbia River Fish Mitigation Corps of Engineers 9/30/2018 9/30/2068 147,186 147,186 3.320% 3.320% 147,186
395 FY 2026 Subtotal: - - - 452,847 436,316 435,153 63
396 2027 Conservation - 11/30/2014 3/31/2027 6,000 6,000 0.947% 0.947% 6,000
397 2027 Fish and Wildlife - 5/31/2014 4/30/2027 11,000 11,000 0.526% 0.526% 11,000
398 2027 Fish and Wildlife - 11/30/2013 5/31/2027 5,000 5,000 0.713% 0.713% 5,000
399 2027 Corps - 4/30/2016 4/30/2031 53,000 53,000 2.661% 2.661% 22,837 733
400 2027 Bureau Direct - 7/31/2018 7/31/2033 28,000 28,000 3.250% 3.250% 28,000
401 2027 Corps - 7/31/2018 7/31/2033 53,000 53,000 3.250% 3.250% 53,000
402 2027 Bureau Direct - 9/30/2015 9/30/2033 10,000 10,000 3.134% 3.134% 9,665 335
403 2027 Corps - 9/30/2015 9/30/2033 4,000 4,000 3.134% 3.134% 3,866 134
404 2027 Fish and Wildlife - 9/30/2018 9/30/2033 51,000 51,000 3.250% 3.250% 51,000
405 2027 Bureau Direct - 8/31/2018 8/31/2034 28,000 28,000 3.290% 3.290% 28,000
406 2027 Corps - 8/31/2018 8/31/2034 53,000 1,163 3.290% 3.290% 1,163
407 2027 Bonneville Dam Corps of Engineers 9/30/2013 9/30/2063 268 268 2.875% 2.875% 268
408 2027 Chief Joseph Corps of Engineers 9/30/2013 9/30/2063 10 10 2.875% 2.875% 10
409 2027 Columbia Basin Bureau of Reclamation 9/30/2013 9/30/2063 3,083 3,083 2.875% 2.875% 3,083
410 2027 Columbia River Fish Mitigation Corps of Engineers 9/30/2013 9/30/2063 95,274 95,274 2.875% 2.875% 95,274
411 2027 Cougar Corps of Engineers 9/30/2013 9/30/2063 4,088 4,088 2.875% 2.875% 4,088
412 2027 Detroit Lake/Big Cliff Corps of Engineers 9/30/2013 9/30/2063 528 528 2.875% 2.875% 528
413 2027 John Day Corps of Engineers 9/30/2013 9/30/2063 17 17 2.875% 2.875% 17
414 2027 Little Goose Corps of Engineers 9/30/2013 9/30/2063 66 66 2.875% 2.875% 66
415 2027 McNary Corps of Engineers 9/30/2013 9/30/2063 1,000 1,000 2.875% 2.875% 1,000
BP-18-FS-BPA-02A Page 120
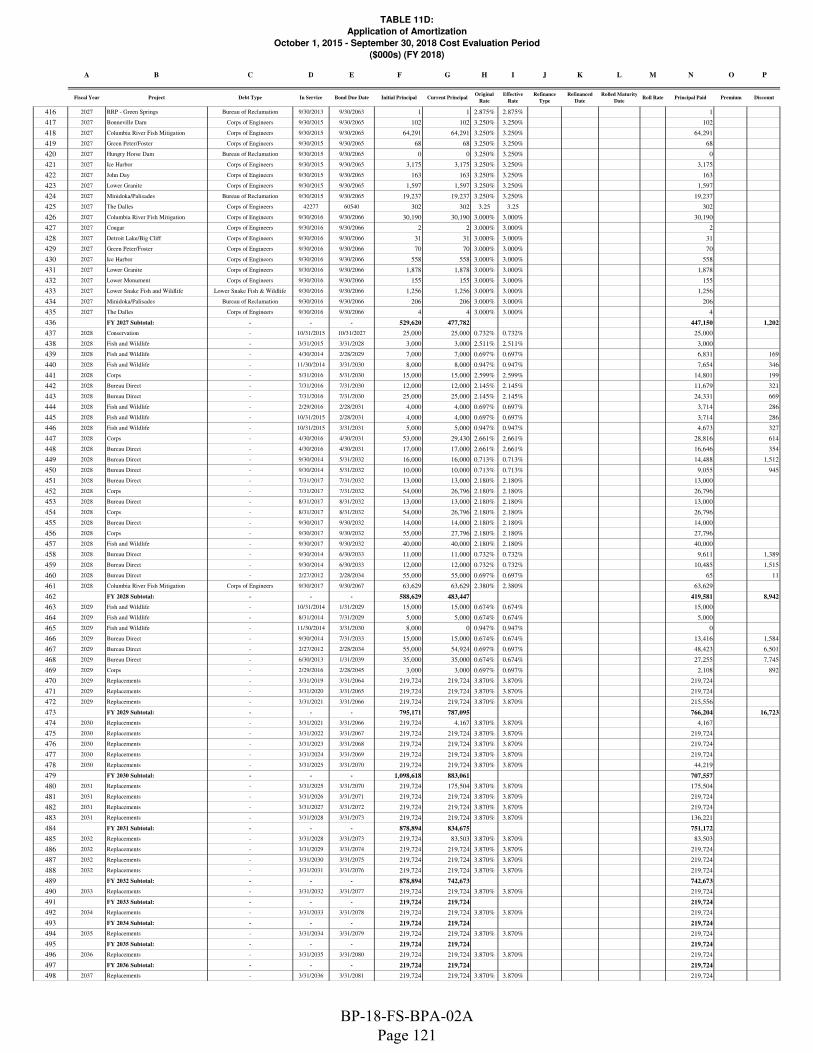
TABLE 11D:
Application of Amortization
October 1, 2015 - September 30, 2018 Cost Evaluation Period
($000s) (FY 2018)
A B C D E F G H I J K L M N O P
Column1Fiscal Year Project Debt Type In Service Bond Due Date Initial Principal Current Principal
Original
Rate
Effective
Rate
Refinance
Type
Refinanced
Date
Rolled Maturity
DateRoll Rate Principal Paid Premium Discount
416 2027 RRP - Green Springs Bureau of Reclamation 9/30/2013 9/30/2063 1 1 2.875% 2.875% 1
417 2027 Bonneville Dam Corps of Engineers 9/30/2015 9/30/2065 102 102 3.250% 3.250% 102
418 2027 Columbia River Fish Mitigation Corps of Engineers 9/30/2015 9/30/2065 64,291 64,291 3.250% 3.250% 64,291
419 2027 Green Peter/Foster Corps of Engineers 9/30/2015 9/30/2065 68 68 3.250% 3.250% 68
420 2027 Hungry Horse Dam Bureau of Reclamation 9/30/2015 9/30/2065 0 0 3.250% 3.250% 0
421 2027 Ice Harbor Corps of Engineers 9/30/2015 9/30/2065 3,175 3,175 3.250% 3.250% 3,175
422 2027 John Day Corps of Engineers 9/30/2015 9/30/2065 163 163 3.250% 3.250% 163
423 2027 Lower Granite Corps of Engineers 9/30/2015 9/30/2065 1,597 1,597 3.250% 3.250% 1,597
424 2027 Minidoka/Palisades Bureau of Reclamation 9/30/2015 9/30/2065 19,237 19,237 3.250% 3.250% 19,237
425 2027 The Dalles Corps of Engineers 42277 60540 302 302 3.25 3.25 302
426 2027 Columbia River Fish Mitigation Corps of Engineers 9/30/2016 9/30/2066 30,190 30,190 3.000% 3.000% 30,190
427 2027 Cougar Corps of Engineers 9/30/2016 9/30/2066 2 2 3.000% 3.000% 2
428 2027 Detroit Lake/Big Cliff Corps of Engineers 9/30/2016 9/30/2066 31 31 3.000% 3.000% 31
429 2027 Green Peter/Foster Corps of Engineers 9/30/2016 9/30/2066 70 70 3.000% 3.000% 70
430 2027 Ice Harbor Corps of Engineers 9/30/2016 9/30/2066 558 558 3.000% 3.000% 558
431 2027 Lower Granite Corps of Engineers 9/30/2016 9/30/2066 1,878 1,878 3.000% 3.000% 1,878
432 2027 Lower Monument Corps of Engineers 9/30/2016 9/30/2066 155 155 3.000% 3.000% 155
433 2027 Lower Snake Fish and Wildlife Lower Snake Fish & Wildlife 9/30/2016 9/30/2066 1,256 1,256 3.000% 3.000% 1,256
434 2027 Minidoka/Palisades Bureau of Reclamation 9/30/2016 9/30/2066 206 206 3.000% 3.000% 206
435 2027 The Dalles Corps of Engineers 9/30/2016 9/30/2066 4 4 3.000% 3.000% 4
436 FY 2027 Subtotal: - - - 529,620 477,782 447,150 1,202
437 2028 Conservation - 10/31/2015 10/31/2027 25,000 25,000 0.732% 0.732% 25,000
438 2028 Fish and Wildlife - 3/31/2015 3/31/2028 3,000 3,000 2.511% 2.511% 3,000
439 2028 Fish and Wildlife - 4/30/2014 2/28/2029 7,000 7,000 0.697% 0.697% 6,831 169
440 2028 Fish and Wildlife - 11/30/2014 3/31/2030 8,000 8,000 0.947% 0.947% 7,654 346
441 2028 Corps - 5/31/2016 5/31/2030 15,000 15,000 2.599% 2.599% 14,801 199
442 2028 Bureau Direct - 7/31/2016 7/31/2030 12,000 12,000 2.145% 2.145% 11,679 321
443 2028 Bureau Direct - 7/31/2016 7/31/2030 25,000 25,000 2.145% 2.145% 24,331 669
444 2028 Fish and Wildlife - 2/29/2016 2/28/2031 4,000 4,000 0.697% 0.697% 3,714 286
445 2028 Fish and Wildlife - 10/31/2015 2/28/2031 4,000 4,000 0.697% 0.697% 3,714 286
446 2028 Fish and Wildlife - 10/31/2015 3/31/2031 5,000 5,000 0.947% 0.947% 4,673 327
447 2028 Corps - 4/30/2016 4/30/2031 53,000 29,430 2.661% 2.661% 28,816 614
448 2028 Bureau Direct - 4/30/2016 4/30/2031 17,000 17,000 2.661% 2.661% 16,646 354
449 2028 Bureau Direct - 9/30/2014 5/31/2032 16,000 16,000 0.713% 0.713% 14,488 1,512
450 2028 Bureau Direct - 9/30/2014 5/31/2032 10,000 10,000 0.713% 0.713% 9,055 945
451 2028 Bureau Direct - 7/31/2017 7/31/2032 13,000 13,000 2.180% 2.180% 13,000
452 2028 Corps - 7/31/2017 7/31/2032 54,000 26,796 2.180% 2.180% 26,796
453 2028 Bureau Direct - 8/31/2017 8/31/2032 13,000 13,000 2.180% 2.180% 13,000
454 2028 Corps - 8/31/2017 8/31/2032 54,000 26,796 2.180% 2.180% 26,796
455 2028 Bureau Direct - 9/30/2017 9/30/2032 14,000 14,000 2.180% 2.180% 14,000
456 2028 Corps - 9/30/2017 9/30/2032 55,000 27,796 2.180% 2.180% 27,796
457 2028 Fish and Wildlife - 9/30/2017 9/30/2032 40,000 40,000 2.180% 2.180% 40,000
458 2028 Bureau Direct - 9/30/2014 6/30/2033 11,000 11,000 0.732% 0.732% 9,611 1,389
459 2028 Bureau Direct - 9/30/2014 6/30/2033 12,000 12,000 0.732% 0.732% 10,485 1,515
460 2028 Bureau Direct - 2/27/2012 2/28/2034 55,000 55,000 0.697% 0.697% 65 11
461 2028 Columbia River Fish Mitigation Corps of Engineers 9/30/2017 9/30/2067 63,629 63,629 2.380% 2.380% 63,629
462 FY 2028 Subtotal: - - - 588,629 483,447 419,581 8,942
463 2029 Fish and Wildlife - 10/31/2014 1/31/2029 15,000 15,000 0.674% 0.674% 15,000
464 2029 Fish and Wildlife - 8/31/2014 7/31/2029 5,000 5,000 0.674% 0.674% 5,000
465 2029 Fish and Wildlife - 11/30/2014 3/31/2030 8,000 0 0.947% 0.947% 0
466 2029 Bureau Direct - 9/30/2014 7/31/2033 15,000 15,000 0.674% 0.674% 13,416 1,584
467 2029 Bureau Direct - 2/27/2012 2/28/2034 55,000 54,924 0.697% 0.697% 48,423 6,501
468 2029 Bureau Direct - 6/30/2013 1/31/2039 35,000 35,000 0.674% 0.674% 27,255 7,745
469 2029 Corps - 2/29/2016 2/28/2045 3,000 3,000 0.697% 0.697% 2,108 892
470 2029 Replacements - 3/31/2019 3/31/2064 219,724 219,724 3.870% 3.870% 219,724
471 2029 Replacements - 3/31/2020 3/31/2065 219,724 219,724 3.870% 3.870% 219,724
472 2029 Replacements - 3/31/2021 3/31/2066 219,724 219,724 3.870% 3.870% 215,556
473 FY 2029 Subtotal: - - - 795,171 787,095 766,204 16,723
474 2030 Replacements - 3/31/2021 3/31/2066 219,724 4,167 3.870% 3.870% 4,167
475 2030 Replacements - 3/31/2022 3/31/2067 219,724 219,724 3.870% 3.870% 219,724
476 2030 Replacements - 3/31/2023 3/31/2068 219,724 219,724 3.870% 3.870% 219,724
477 2030 Replacements - 3/31/2024 3/31/2069 219,724 219,724 3.870% 3.870% 219,724
478 2030 Replacements - 3/31/2025 3/31/2070 219,724 219,724 3.870% 3.870% 44,219
479 FY 2030 Subtotal: - - - 1,098,618 883,061 707,557
480 2031 Replacements - 3/31/2025 3/31/2070 219,724 175,504 3.870% 3.870% 175,504
481 2031 Replacements - 3/31/2026 3/31/2071 219,724 219,724 3.870% 3.870% 219,724
482 2031 Replacements - 3/31/2027 3/31/2072 219,724 219,724 3.870% 3.870% 219,724
483 2031 Replacements - 3/31/2028 3/31/2073 219,724 219,724 3.870% 3.870% 136,221
484 FY 2031 Subtotal: - - - 878,894 834,675 751,172
485 2032 Replacements - 3/31/2028 3/31/2073 219,724 83,503 3.870% 3.870% 83,503
486 2032 Replacements - 3/31/2029 3/31/2074 219,724 219,724 3.870% 3.870% 219,724
487 2032 Replacements - 3/31/2030 3/31/2075 219,724 219,724 3.870% 3.870% 219,724
488 2032 Replacements - 3/31/2031 3/31/2076 219,724 219,724 3.870% 3.870% 219,724
489 FY 2032 Subtotal: - - - 878,894 742,673 742,673
490 2033 Replacements - 3/31/2032 3/31/2077 219,724 219,724 3.870% 3.870% 219,724
491 FY 2033 Subtotal: - - - 219,724 219,724 219,724
492 2034 Replacements - 3/31/2033 3/31/2078 219,724 219,724 3.870% 3.870% 219,724
493 FY 2034 Subtotal: - - - 219,724 219,724 219,724
494 2035 Replacements - 3/31/2034 3/31/2079 219,724 219,724 3.870% 3.870% 219,724
495 FY 2035 Subtotal: - - - 219,724 219,724 219,724
496 2036 Replacements - 3/31/2035 3/31/2080 219,724 219,724 3.870% 3.870% 219,724
497 FY 2036 Subtotal: - - - 219,724 219,724 219,724
498 2037 Replacements - 3/31/2036 3/31/2081 219,724 219,724 3.870% 3.870% 219,724
BP-18-FS-BPA-02A Page 121

TABLE 11D:
Application of Amortization
October 1, 2015 - September 30, 2018 Cost Evaluation Period
($000s) (FY 2018)
A B C D E F G H I J K L M N O P
Column1Fiscal Year Project Debt Type In Service Bond Due Date Initial Principal Current Principal
Original
Rate
Effective
Rate
Refinance
Type
Refinanced
Date
Rolled Maturity
DateRoll Rate Principal Paid Premium Discount
499 FY 2037 Subtotal: - - - 219,724 219,724 219,724
500 2038 Replacements - 3/31/2037 3/31/2082 219,724 219,724 3.870% 3.870% 219,724
501 FY 2038 Subtotal: - - - 219,724 219,724 219,724
502 2039 Replacements - 50495 66931 219,724 219,724 3.87 3.87 219,724
503 FY 2039 Subtotal: - - - 219,724 219,724 219,724
504 2040 Replacements - 3/31/2039 3/31/2084 219,724 219,724 3.870% 3.870% 219,724
505 FY 2040 Subtotal: - - - 219,724 219,724 219,724
506 2041 Replacements - 3/31/2040 3/31/2085 219,724 219,724 3.870% 3.870% 219,724
507 FY 2041 Subtotal: - - - 219,724 219,724 219,724
508 2042 Replacements - 3/31/2041 3/31/2086 219,724 219,724 3.870% 3.870% 219,724
509 FY 2042 Subtotal: - - - 219,724 219,724 219,724
510 2043 Replacements - 3/31/2042 3/31/2087 219,724 219,724 3.870% 3.870% 219,724
511 FY 2043 Subtotal: - - - 219,724 219,724 219,724
512 2044 Replacements - 3/31/2043 3/31/2088 219,724 219,724 3.870% 3.870% 219,724
513 FY 2044 Subtotal: - - - 219,724 219,724 219,724
514 2045 Replacements - 3/31/2044 3/31/2089 219,724 219,724 3.870% 3.870% 219,724
515 FY 2045 Subtotal: - - - 219,724 219,724 219,724
516 2046 Replacements - 3/31/2045 3/31/2090 219,724 219,724 3.870% 3.870% 219,724
517 FY 2046 Subtotal: - - - 219,724 219,724 219,724
518 2047 Replacements - 3/31/2046 3/31/2091 219,724 219,724 3.870% 3.870% 219,724
519 FY 2047 Subtotal: - - - 219,724 219,724 219,724
520 2048 Replacements - 3/31/2047 3/31/2092 219,724 219,724 3.870% 3.870% 219,724
521 FY 2048 Subtotal: - - - 219,724 219,724 219,724
522 2049 Replacements - 3/31/2048 3/31/2093 219,724 219,724 3.870% 3.870% 219,724
523 FY 2049 Subtotal: - - - 219,724 219,724 219,724
524 2050 Replacements - 3/31/2049 3/31/2094 219,724 219,724 3.870% 3.870% 219,724
525 FY 2050 Subtotal: - - - 219,724 219,724 219,724
526 2051 Replacements - 3/31/2050 3/31/2095 219,724 219,724 3.870% 3.870% 219,724
527 FY 2051 Subtotal: - - - 219,724 219,724 219,724
528 2052 Replacements - 3/31/2051 3/31/2096 219,724 219,724 3.870% 3.870% 219,724
529 FY 2052 Subtotal: - - - 219,724 219,724 219,724
530 2053 Replacements - 3/31/2052 3/31/2097 219,724 219,724 3.870% 3.870% 219,724
531 FY 2053 Subtotal: - - - 219,724 219,724 219,724
532 2054 Replacements - 3/31/2053 3/31/2098 219,724 219,724 3.870% 3.870% 219,724
533 FY 2054 Subtotal: - - - 219,724 219,724 219,724
534 2055 Replacements - 3/31/2054 3/31/2099 219,724 219,724 3.870% 3.870% 219,724
535 FY 2055 Subtotal: - - - 219,724 219,724 219,724
536 2056 Replacements - 3/31/2055 3/31/2100 219,724 219,724 3.870% 3.870% 219,724
537 FY 2056 Subtotal: - - - 219,724 219,724 219,724
538 2057 Replacements - 3/31/2056 3/31/2101 219,724 219,724 3.870% 3.870% 219,724
539 FY 2057 Subtotal: - - - 219,724 219,724 219,724
540 2058 Boise Bureau of Reclamation 9/30/2008 9/30/2058 64 64 4.875% 4.875% 64
541 2058 Bonneville Dam Corps of Engineers 9/30/2008 9/30/2058 14,609 14,609 4.875% 4.875% 14,609
542 2058 Columbia River Fish Mitigation Corps of Engineers 9/30/2008 9/30/2058 36,554 36,554 4.875% 4.875% 36,554
543 2058 Dworshak Corps of Engineers 9/30/2008 9/30/2058 10 10 4.875% 4.875% 10
544 2058 Hungry Horse Dam Bureau of Reclamation 9/30/2008 9/30/2058 76 76 4.875% 4.875% 76
545 2058 Ice Harbor Corps of Engineers 9/30/2008 9/30/2058 14 14 4.875% 4.875% 14
546 2058 Libby Corps of Engineers 9/30/2008 9/30/2058 1,567 1,567 4.875% 4.875% 1,567
547 2058 Little Goose Corps of Engineers 9/30/2008 9/30/2058 13 13 4.875% 4.875% 13
548 2058 Lower Granite Corps of Engineers 9/30/2008 9/30/2058 24 24 4.875% 4.875% 24
549 2058 Lower Monument Corps of Engineers 9/30/2008 9/30/2058 9 9 4.875% 4.875% 9
550 2058 Lower Snake Fish and Wildlife Lower Snake Fish & Wildlife 9/30/2008 9/30/2058 74 74 4.875% 4.875% 74
551 2058 McNary Corps of Engineers 9/30/2008 9/30/2058 215 215 4.875% 4.875% 215
552 2058 The Dalles Corps of Engineers 9/30/2008 9/30/2058 1,651 1,651 4.875% 4.875% 1,651
553 2058 Chief Joseph Corps of Engineers 9/30/2008 9/30/2058 3,500 3,500 4.875% 4.875% 3,500
554 2058 Columbia Basin Bureau of Reclamation 9/30/2008 9/30/2058 835 835 4.875% 4.875% 835
555 2058 Replacements - 3/31/2057 3/31/2102 219,724 219,724 3.870% 3.870% 219,724
556 FY 2058 Subtotal: - - - 278,939 278,939 278,939
557 2059 Albeni Falls Corps of Engineers 9/30/2009 9/30/2059 57 57 4.375% 4.375% 57
558 2059 Columbia Basin Bureau of Reclamation 9/30/2009 9/30/2059 1,338 1,338 4.375% 4.375% 1,338
559 2059 Hungry Horse Dam Bureau of Reclamation 9/30/2009 9/30/2059 60 60 4.375% 4.375% 60
560 2059 John Day Corps of Engineers 9/30/2009 9/30/2059 1,548 1,548 4.375% 4.375% 1,548
561 2059 Yakima Chandler/Kenniwick Bureau of Reclamation 9/30/2009 9/30/2059 15 15 4.375% 4.375% 15
562 2059 Replacements - 3/31/2058 3/31/2103 219,724 219,724 3.870% 3.870% 219,724
563 FY 2059 Subtotal: - - - 222,742 222,742 222,742
564 2060 Replacements - 3/31/2059 3/31/2104 219,724 219,724 3.870% 3.870% 219,724
565 FY 2060 Subtotal: - - - 219,724 219,724 - 219,724
566 2061 Replacements - 3/31/2060 3/31/2105 219,724 219,724 3.870% 3.870% 219,724
567 FY 2061 Subtotal: - - - 219,724 219,724 219,724
568 2062 Replacements - 3/31/2061 3/31/2106 219,724 219,724 3.870% 3.870% 219,724
569 FY 2062 Subtotal: - - - 219,724 219,724 219,724
570 2063 Replacements - 3/31/2062 3/31/2107 219,724 219,724 3.870% 3.870% 219,724
571 FY 2063 Subtotal: - - - 219,724 219,724 219,724
572 2064 Replacements - 3/31/2063 3/31/2108 219,724 219,724 3.870% 3.870% 219,724
573 FY 2064 Subtotal: - - - 219,724 219,724 219,724
574 2065 Replacements - 3/31/2064 3/31/2109 219,724 219,724 3.870% 3.870% 219,724
575 FY 2065 Subtotal: - - - 219,724 219,724 219,724
576 2066 Replacements - 60357 76792 219,724 219,724 3.87 3.87 219,724
577 FY 2066 Subtotal: - - - 219,724 219,724 219,724
578 2067 Replacements - 3/31/2066 3/31/2111 219,724 219,724 3.870% 3.870% 219,724
579 FY 2067 Subtotal: - - - 219,724 219,724 219,724
580 2068 Replacements - 3/31/2067 3/31/2112 219,724 219,724 3.870% 3.870% 219,724
581 FY 2068 Subtotal: - - - 219,724 219,724 - 219,724
582 Grand Total 17,622,300 16,580,241 - 15,679,427 17,798 27,031
BP-18-FS-BPA-02A Page 122
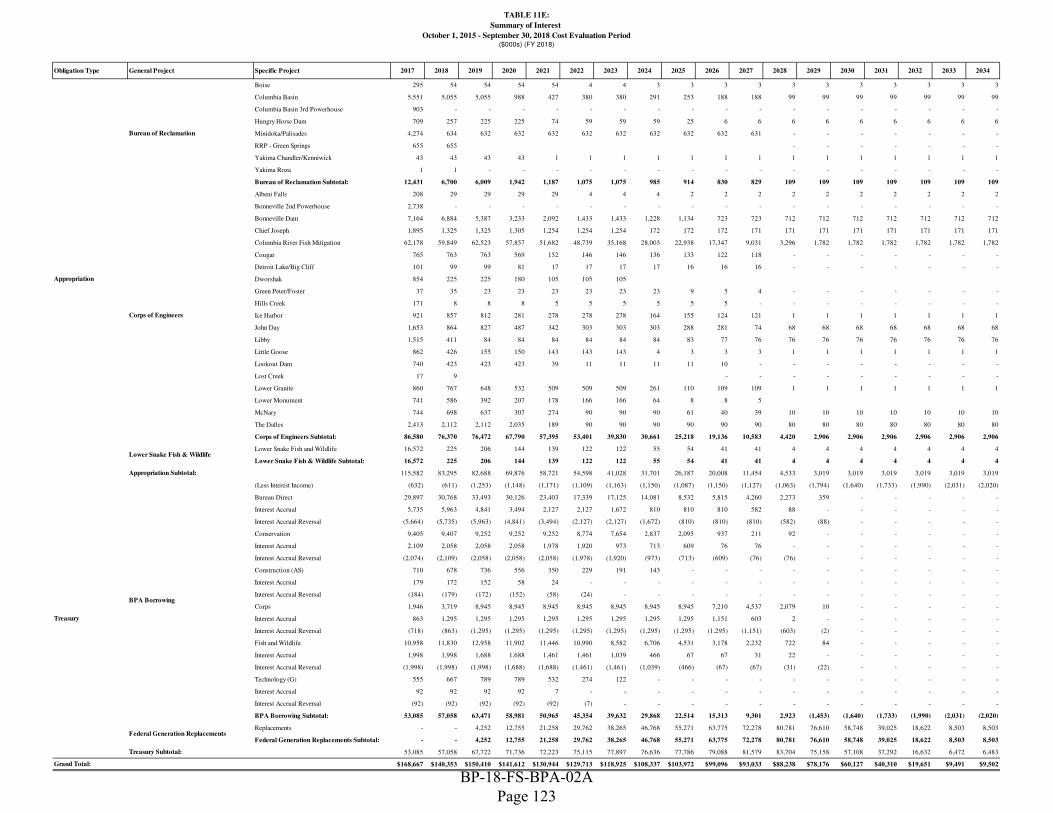
TABLE 11E:
Summary of Interest
October 1, 2015 - September 30, 2018 Cost Evaluation Period($000s) (FY 2018)
Obligation Type General Project Specific Project 2017 2018 2019 2020 2021 2022 2023 2024 2025 2026 2027 2028 2029 2030 2031 2032 2033 2034
Boise 295 54 54 54 54 4 4 3 3 3 3 3 3 3 3 3 3 3
Columbia Basin 5,551 5,055 5,055 988 427 380 380 291 253 188 188 99 99 99 99 99 99 99
Columbia Basin 3rd Powerhouse 903 - - - - - - - - - - - - - - - - -
Hungry Horse Dam 709 257 225 225 74 59 59 59 25 6 6 6 6 6 6 6 6 6
Minidoka/Palisades 4,274 634 632 632 632 632 632 632 632 632 631 - - - - - - -
RRP - Green Springs 655 655 - - - - - - -
Yakima Chandler/Kenniwick 43 43 43 43 1 1 1 1 1 1 1 1 1 1 1 1 1 1
Yakima Roza 1 1 - - - - - - - - - - - - - - - -
Bureau of Reclamation Subtotal: 12,431 6,700 6,009 1,942 1,187 1,075 1,075 985 914 830 829 109 109 109 109 109 109 109
Albeni Falls 208 29 29 29 29 4 4 4 2 2 2 2 2 2 2 2 2 2
Bonneville 2nd Powerhouse 2,738 - - - - - - - - - - - - - - - - -
Bonneville Dam 7,164 6,884 5,387 3,233 2,092 1,433 1,433 1,228 1,134 723 723 712 712 712 712 712 712 712
Chief Joseph 1,895 1,325 1,325 1,305 1,254 1,254 1,254 172 172 172 171 171 171 171 171 171 171 171
Columbia River Fish Mitigation 62,178 59,849 62,523 57,857 51,682 48,739 35,168 28,003 22,938 17,347 9,031 3,296 1,782 1,782 1,782 1,782 1,782 1,782
Cougar 765 763 763 569 152 146 146 136 133 122 118 - - - - - - -
Detroit Lake/Big Cliff 101 99 99 81 17 17 17 17 16 16 16 - - - - - - -
Dworshak 854 225 225 180 105 105 105
Green Peter/Foster 37 35 23 23 23 23 23 23 9 5 4 - - - - - - -
Hills Creek 171 8 8 8 5 5 5 5 5 5 - - - - - - - -
Ice Harbor 921 857 812 281 278 278 278 164 155 124 121 1 1 1 1 1 1 1
John Day 1,653 864 827 487 342 303 303 303 288 281 74 68 68 68 68 68 68 68
Libby 1,515 411 84 84 84 84 84 84 83 77 76 76 76 76 76 76 76 76
Little Goose 862 426 155 150 143 143 143 4 3 3 3 1 1 1 1 1 1 1
Lookout Dam 740 423 423 423 39 11 11 11 11 10 - - - - - - - -
Lost Creek 17 9 - - - - - - - - -
Lower Granite 860 767 648 532 509 509 509 261 110 109 109 1 1 1 1 1 1 1
Lower Monument 741 586 392 207 178 166 166 64 8 8 5
McNary 744 698 637 307 274 90 90 90 61 40 39 10 10 10 10 10 10 10
The Dalles 2,413 2,112 2,112 2,035 189 90 90 90 90 90 90 80 80 80 80 80 80 80
Corps of Engineers Subtotal: 86,580 76,370 76,472 67,790 57,395 53,401 39,830 30,661 25,218 19,136 10,583 4,420 2,906 2,906 2,906 2,906 2,906 2,906
Lower Snake Fish and Wildlife 16,572 225 206 144 139 122 122 55 54 41 41 4 4 4 4 4 4 4
Lower Snake Fish & Wildlife Subtotal: 16,572 225 206 144 139 122 122 55 54 41 41 4 4 4 4 4 4 4
115,582 83,295 82,688 69,876 58,721 54,598 41,028 31,701 26,187 20,008 11,454 4,533 3,019 3,019 3,019 3,019 3,019 3,019
(Less Interest Income) (632) (611) (1,253) (1,148) (1,171) (1,109) (1,163) (1,150) (1,087) (1,150) (1,127) (1,063) (1,794) (1,640) (1,733) (1,990) (2,031) (2,020)
Bureau Direct 29,897 30,768 33,493 30,126 23,403 17,339 17,125 14,081 8,532 5,815 4,260 2,273 359 - - - - -
Interest Accrual 5,735 5,963 4,841 3,494 2,127 2,127 1,672 810 810 810 582 88 - - - - - -
Interest Accrual Reversal (5,664) (5,735) (5,963) (4,841) (3,494) (2,127) (2,127) (1,672) (810) (810) (810) (582) (88) - - - - -
Conservation 9,405 9,407 9,252 9,252 9,252 8,774 7,654 2,837 2,095 937 211 92 - - - - - -
Interest Accrual 2,109 2,058 2,058 2,058 1,978 1,920 973 713 609 76 76 - - - - - - -
Interest Accrual Reversal (2,074) (2,109) (2,058) (2,058) (2,058) (1,978) (1,920) (973) (713) (609) (76) (76) - - - - - -
Construction (AS) 710 678 736 556 350 229 191 143 - - - - - - - - - -
Interest Accrual 179 172 152 58 24 - - - - - - - - - - - - -
Interest Accrual Reversal (184) (179) (172) (152) (58) (24) - - - - - - - - - - - -
Corps 1,946 3,719 8,945 8,945 8,945 8,945 8,945 8,945 8,945 7,210 4,537 2,079 10 - - - - -
Interest Accrual 863 1,295 1,295 1,295 1,295 1,295 1,295 1,295 1,295 1,151 603 2 - - - - - -
Interest Accrual Reversal (718) (863) (1,295) (1,295) (1,295) (1,295) (1,295) (1,295) (1,295) (1,295) (1,151) (603) (2) - - - - -
Fish and Wildlife 10,958 11,830 12,958 11,902 11,446 10,990 8,582 6,706 4,531 3,178 2,232 722 84 - - - - -
Interest Accrual 1,998 1,998 1,688 1,688 1,461 1,461 1,039 466 67 67 31 22 - - - - - -
Interest Accrual Reversal (1,998) (1,998) (1,998) (1,688) (1,688) (1,461) (1,461) (1,039) (466) (67) (67) (31) (22) - - - - -
Technology (G) 555 667 789 789 532 274 122 - - - - - - - - - - -
Interest Accrual 92 92 92 92 7 - - - - - - - - - - - - -
Interest Accrual Reversal (92) (92) (92) (92) (92) (7) - - - - - - - - - - - -
BPA Borrowing Subtotal: 53,085 57,058 63,471 58,981 50,965 45,354 39,632 29,868 22,514 15,313 9,301 2,923 (1,453) (1,640) (1,733) (1,990) (2,031) (2,020)
Replacements - - 4,252 12,755 21,258 29,762 38,265 46,768 55,271 63,775 72,278 80,781 76,610 58,748 39,025 18,622 8,503 8,503
Federal Generation Replacements Subtotal: - - 4,252 12,755 21,258 29,762 38,265 46,768 55,271 63,775 72,278 80,781 76,610 58,748 39,025 18,622 8,503 8,503
53,085 57,058 67,722 71,736 72,223 75,115 77,897 76,636 77,786 79,088 81,579 83,704 75,158 57,108 37,292 16,632 6,472 6,483
$168,667 $140,353 $150,410 $141,612 $130,944 $129,713 $118,925 $108,337 $103,972 $99,096 $93,033 $88,238 $78,176 $60,127 $40,310 $19,651 $9,491 $9,502
Treasury
BPA Borrowing
Federal Generation Replacements
Treasury Subtotal:
Grand Total:
Appropriation
Bureau of Reclamation
Corps of Engineers
Lower Snake Fish & Wildlife
Appropriation Subtotal:
BP-18-FS-BPA-02A Page 123
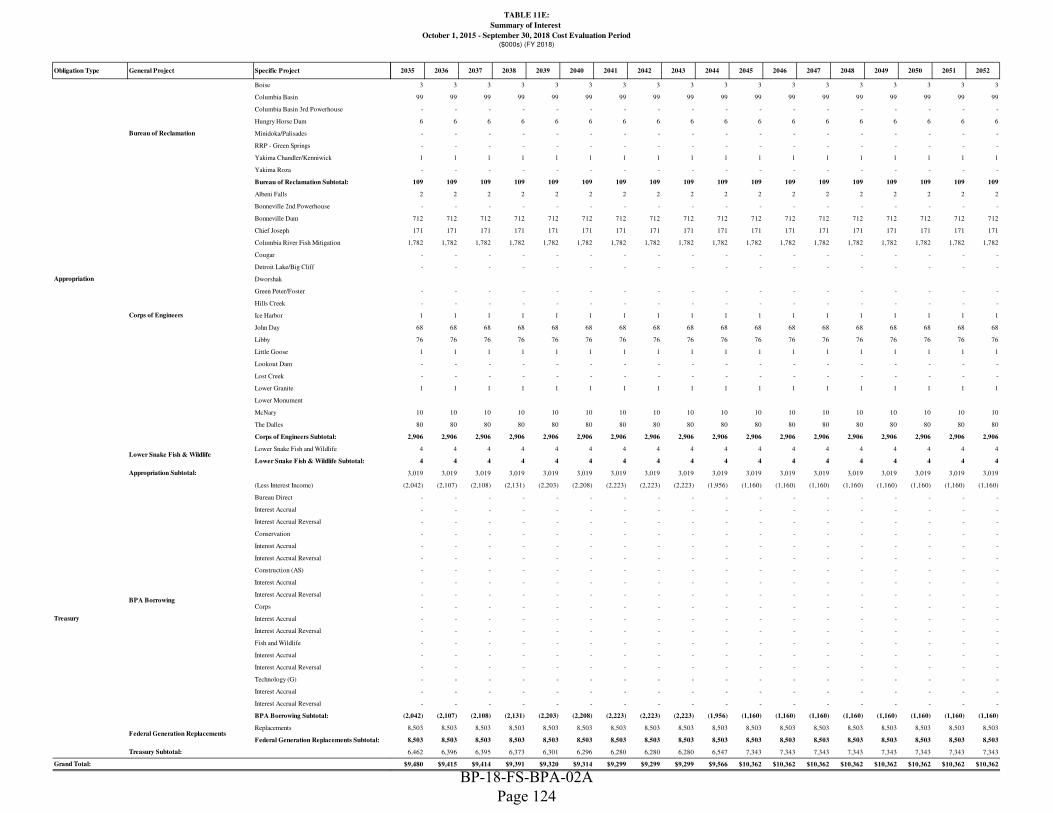
TABLE 11E:
Summary of Interest
October 1, 2015 - September 30, 2018 Cost Evaluation Period($000s) (FY 2018)
Obligation Type General Project Specific Project
Boise
Columbia Basin
Columbia Basin 3rd Powerhouse
Hungry Horse Dam
Minidoka/Palisades
RRP - Green Springs
Yakima Chandler/Kenniwick
Yakima Roza
Bureau of Reclamation Subtotal:
Albeni Falls
Bonneville 2nd Powerhouse
Bonneville Dam
Chief Joseph
Columbia River Fish Mitigation
Cougar
Detroit Lake/Big Cliff
Dworshak
Green Peter/Foster
Hills Creek
Ice Harbor
John Day
Libby
Little Goose
Lookout Dam
Lost Creek
Lower Granite
Lower Monument
McNary
The Dalles
Corps of Engineers Subtotal:
Lower Snake Fish and Wildlife
Lower Snake Fish & Wildlife Subtotal:
(Less Interest Income)
Bureau Direct
Interest Accrual
Interest Accrual Reversal
Conservation
Interest Accrual
Interest Accrual Reversal
Construction (AS)
Interest Accrual
Interest Accrual Reversal
Corps
Interest Accrual
Interest Accrual Reversal
Fish and Wildlife
Interest Accrual
Interest Accrual Reversal
Technology (G)
Interest Accrual
Interest Accrual Reversal
BPA Borrowing Subtotal:
Replacements
Federal Generation Replacements Subtotal:
Treasury
BPA Borrowing
Federal Generation Replacements
Treasury Subtotal:
Grand Total:
Appropriation
Bureau of Reclamation
Corps of Engineers
Lower Snake Fish & Wildlife
Appropriation Subtotal:
2035 2036 2037 2038 2039 2040 2041 2042 2043 2044 2045 2046 2047 2048 2049 2050 2051 2052
3 3 3 3 3 3 3 3 3 3 3 3 3 3 3 3 3 3
99 99 99 99 99 99 99 99 99 99 99 99 99 99 99 99 99 99
- - - - - - - - - - - - - - - - - -
6 6 6 6 6 6 6 6 6 6 6 6 6 6 6 6 6 6
- - - - - - - - - - - - - - - - - -
- - - - - - - - - - - - - - - - - -
1 1 1 1 1 1 1 1 1 1 1 1 1 1 1 1 1 1
- - - - - - - - - - - - - - - - - -
109 109 109 109 109 109 109 109 109 109 109 109 109 109 109 109 109 109
2 2 2 2 2 2 2 2 2 2 2 2 2 2 2 2 2 2
- - - - - - - - - - - - - - - - - -
712 712 712 712 712 712 712 712 712 712 712 712 712 712 712 712 712 712
171 171 171 171 171 171 171 171 171 171 171 171 171 171 171 171 171 171
1,782 1,782 1,782 1,782 1,782 1,782 1,782 1,782 1,782 1,782 1,782 1,782 1,782 1,782 1,782 1,782 1,782 1,782
- - - - - - - - - - - - - - - - - -
- - - - - - - - - - - - - - - - - -
- - - - - - - - - - - - - - - - - -
- - - - - - - - - - - - - - - - - -
1 1 1 1 1 1 1 1 1 1 1 1 1 1 1 1 1 1
68 68 68 68 68 68 68 68 68 68 68 68 68 68 68 68 68 68
76 76 76 76 76 76 76 76 76 76 76 76 76 76 76 76 76 76
1 1 1 1 1 1 1 1 1 1 1 1 1 1 1 1 1 1
- - - - - - - - - - - - - - - - - -
- - - - - - - - - - - - - - - - - -
1 1 1 1 1 1 1 1 1 1 1 1 1 1 1 1 1 1
10 10 10 10 10 10 10 10 10 10 10 10 10 10 10 10 10 10
80 80 80 80 80 80 80 80 80 80 80 80 80 80 80 80 80 80
2,906 2,906 2,906 2,906 2,906 2,906 2,906 2,906 2,906 2,906 2,906 2,906 2,906 2,906 2,906 2,906 2,906 2,906
4 4 4 4 4 4 4 4 4 4 4 4 4 4 4 4 4 4
4 4 4 4 4 4 4 4 4 4 4 4 4 4 4 4 4 4
3,019 3,019 3,019 3,019 3,019 3,019 3,019 3,019 3,019 3,019 3,019 3,019 3,019 3,019 3,019 3,019 3,019 3,019
(2,042) (2,107) (2,108) (2,131) (2,203) (2,208) (2,223) (2,223) (2,223) (1,956) (1,160) (1,160) (1,160) (1,160) (1,160) (1,160) (1,160) (1,160)
- - - - - - - - - - - - - - - - - -
- - - - - - - - - - - - - - - - - -
- - - - - - - - - - - - - - - - - -
- - - - - - - - - - - - - - - - - -
- - - - - - - - - - - - - - - - - -
- - - - - - - - - - - - - - - - - -
- - - - - - - - - - - - - - - - - -
- - - - - - - - - - - - - - - - - -
- - - - - - - - - - - - - - - - - -
- - - - - - - - - - - - - - - - - -
- - - - - - - - - - - - - - - - - -
- - - - - - - - - - - - - - - - - -
- - - - - - - - - - - - - - - - - -
- - - - - - - - - - - - - - - - - -
- - - - - - - - - - - - - - - - - -
- - - - - - - - - - - - - - - - - -
- - - - - - - - - - - - - - - - - -
- - - - - - - - - - - - - - - - - -
(2,042) (2,107) (2,108) (2,131) (2,203) (2,208) (2,223) (2,223) (2,223) (1,956) (1,160) (1,160) (1,160) (1,160) (1,160) (1,160) (1,160) (1,160)
8,503 8,503 8,503 8,503 8,503 8,503 8,503 8,503 8,503 8,503 8,503 8,503 8,503 8,503 8,503 8,503 8,503 8,503
8,503 8,503 8,503 8,503 8,503 8,503 8,503 8,503 8,503 8,503 8,503 8,503 8,503 8,503 8,503 8,503 8,503 8,503
6,462 6,396 6,395 6,373 6,301 6,296 6,280 6,280 6,280 6,547 7,343 7,343 7,343 7,343 7,343 7,343 7,343 7,343
$9,480 $9,415 $9,414 $9,391 $9,320 $9,314 $9,299 $9,299 $9,299 $9,566 $10,362 $10,362 $10,362 $10,362 $10,362 $10,362 $10,362 $10,362
BP-18-FS-BPA-02A Page 124

TABLE 11E:
Summary of Interest
October 1, 2015 - September 30, 2018 Cost Evaluation Period($000s) (FY 2018)
Obligation Type General Project Specific Project
Boise
Columbia Basin
Columbia Basin 3rd Powerhouse
Hungry Horse Dam
Minidoka/Palisades
RRP - Green Springs
Yakima Chandler/Kenniwick
Yakima Roza
Bureau of Reclamation Subtotal:
Albeni Falls
Bonneville 2nd Powerhouse
Bonneville Dam
Chief Joseph
Columbia River Fish Mitigation
Cougar
Detroit Lake/Big Cliff
Dworshak
Green Peter/Foster
Hills Creek
Ice Harbor
John Day
Libby
Little Goose
Lookout Dam
Lost Creek
Lower Granite
Lower Monument
McNary
The Dalles
Corps of Engineers Subtotal:
Lower Snake Fish and Wildlife
Lower Snake Fish & Wildlife Subtotal:
(Less Interest Income)
Bureau Direct
Interest Accrual
Interest Accrual Reversal
Conservation
Interest Accrual
Interest Accrual Reversal
Construction (AS)
Interest Accrual
Interest Accrual Reversal
Corps
Interest Accrual
Interest Accrual Reversal
Fish and Wildlife
Interest Accrual
Interest Accrual Reversal
Technology (G)
Interest Accrual
Interest Accrual Reversal
BPA Borrowing Subtotal:
Replacements
Federal Generation Replacements Subtotal:
Treasury
BPA Borrowing
Federal Generation Replacements
Treasury Subtotal:
Grand Total:
Appropriation
Bureau of Reclamation
Corps of Engineers
Lower Snake Fish & Wildlife
Appropriation Subtotal:
2053 2054 2055 2056 2057 2058 2059 2060 2061 2062 2063 2064 2065 2066 2067 2068 Total
3 3 3 3 3 3 - - - - - - - - - - 627
99 99 99 99 99 99 59 - - - - - - - - - 21,892
- - - - - - - - - - - - - - - - 903
6 6 6 6 6 6 3 - - - - - - - - - 1,904
- - - - - - - - - - - - - - - - 10,593
- - - - - - - - - - - - - - - - 1,311
1 1 1 1 1 1 1 - - - - - - - - - 200
- - - - - - - - - - - - - - - - 2
109 109 109 109 109 109 62 - - - - - - - - - 37,430
2 2 2 2 2 2 2 - - - - - - - - - 424
- - - - - - - - - - - - - - - - 2,738
712 712 712 712 712 712 - - - - - - - - - - 53,513
171 171 171 171 171 171 - - - - - - - - - - 15,587
1,782 1,782 1,782 1,782 1,782 1,782 - - - - - - - - - - 512,071
- - - - - - - - - - - - - - - - 3,814
- - - - - - - - - - - - - - - - 495
- - - - - - - - - - 1,816
- - - - - - - - - - - - - - - - 231
- - - - - - - - - - - - - - - - 226
1 1 1 1 1 1 - - - - - - - - - - 4,291
68 68 68 68 68 68 68 - - - - - - - - - 7,892
76 76 76 76 76 76 - - - - - - - - - - 5,036
1 1 1 1 1 1 - - - - - - - - - - 2,052
- - - - - - - - - - - - - - - - 2,101
- - - - - - - - - - - - - - - - 28
1 1 1 1 1 1 - - - - - - - - - - 4,961
- - - - - - - - - - 2,534
10 10 10 10 10 10 - - - - - - - - - - 3,395
80 80 80 80 80 80 - - - - - - - - - - 11,898
2,906 2,906 2,906 2,906 2,906 2,906 70 - - - - - - - - - 635,101
4 4 4 4 4 4 - - - - - - - - - - 17,834
4 4 4 4 4 4 - - - - - - - - - - 17,834
3,019 3,019 3,019 3,019 3,019 3,019 132 - - - - - - - - - 690,366
(1,160) (1,160) (1,160) (1,160) (1,160) (1,160) (1,160) (1,160) (1,160) (1,160) (1,160) (1,160) (1,160) (1,160) (1,160) (1,160) (73,143)
- - - - - - - - - - - - - - - - 217,470
- - - - - - - - - - - - - - - - 29,057
- - - - - - - - - - - - - - - - (34,721)
- - - - - - - - - - - - - - - - 69,169
- - - - - - - - - - - - - - - - 14,627
- - - - - - - - - - - - - - - - (16,701)
- - - - - - - - - - - - - - - - 3,594
- - - - - - - - - - - - - - - - 585
- - - - - - - - - - - - - - - - (769)
- - - - - - - - - - - - - - - - 82,119
- - - - - - - - - - - - - - - - 12,979
- - - - - - - - - - - - - - - - (13,697)
- - - - - - - - - - - - - - - - 96,119
- - - - - - - - - - - - - - - - 11,985
- - - - - - - - - - - - - - - - (13,983)
- - - - - - - - - - - - - - - - 3,726
- - - - - - - - - - - - - - - - 373
- - - - - - - - - - - - - - - - (464)
(1,160) (1,160) (1,160) (1,160) (1,160) (1,160) (1,160) (1,160) (1,160) (1,160) (1,160) (1,160) (1,160) (1,160) (1,160) (1,160) 388,326
8,503 8,503 8,503 8,503 8,503 8,503 8,503 8,503 8,503 8,503 8,503 8,503 8,503 8,503 8,503 8,503 924,290
8,503 8,503 8,503 8,503 8,503 8,503 8,503 8,503 8,503 8,503 8,503 8,503 8,503 8,503 8,503 8,503 924,290
7,343 7,343 7,343 7,343 7,343 7,343 7,343 7,343 7,343 7,343 7,343 7,343 7,343 7,343 7,343 7,343 1,312,615
$10,362 $10,362 $10,362 $10,362 $10,362 $10,362 $7,475 $7,343 $7,343 $7,343 $7,343 $7,343 $7,343 $7,343 $7,343 $7,343 $2,002,981
BP-18-FS-BPA-02A Page 125

TABLE 11F:
Summary of Amortization
October 1, 2015 - September 30, 2018 Cost Evaluation Period($000s) (FY 2018)
Obligation Type General Project Specific Project 2017 2018 2019 2020 2021 2022 2023 2024 2025 2026 2027 2028 2029 2030 2031 2032 2033
Boise 3,365 - - - 979 - 17 - - - - - - - - - -
Columbia Basin 6,927 - 69,226 10,963 929 - 1,987 895 1,723 11 3,083 - - - - - -
Columbia Basin 3rd Powerhouse 12,631 - - - - - - - - - - - - - - - -
Hungry Horse Dam 6,318 552 - 2,951 294 - - 792 503 3 - - - - - -
Minidoka/Palisades 50,911 42 - - - - - - - 7 19,443 - - - - - -
RRP - Green Springs - 11,145 - - - - - - - 2 1 - - - - - -
Yakima Chandler/Kenniwick - - - 833 - - - - - - - - - - - - -
Yakima Roza - 14 - - - - - - - - - - - - - - -
Bureau of Reclamation Subtotal: 80,151 11,754 69,226 14,746 2,202 - 2,004 1,687 2,226 22 22,526 - - - - - -
Albeni Falls 2,510 - - - 481 - - 42 - - - - - - - - -
Bonneville 2nd Powerhouse 38,293 - - - - - - - - - - - - - - - -
Bonneville Dam 3,917 24,446 39,818 21,824 12,875 - 4,606 2,192 10,963 - 370 - - - - - -
Chief Joseph 7,970 - 347 992 - - 24,727 - 4 28 10 - - - - - -
Columbia River Fish Mitigation 55,768 36,266 86,345 120,479 59,464 301,568 162,091 125,213 147,704 248,802 189,756 63,629 - - - - -
Cougar 26 - 3,622 8,130 120 - 230 59 293 139 4,090 - - - - - -
Detroit Lake/Big Cliff 38 - 301 1,254 - - - 18 - - 558 - - - - - -
Dworshak 8,803 - 828 1,474 - - 2,380 - - - - - - - - - -
Green Peter/Foster 26 200 - - - - - 385 87 28 138 - - - - - -
Hills Creek 2,658 8 2 46 - - - - 12 142 - - - - - - -
Ice Harbor 986 764 9,851 50 - - 2,615 207 819 115 3,732 - - - - - -
John Day 11,433 619 6,339 2,827 834 - - 356 175 6,161 181 - - - - - -
Libby 15,441 5,562 - - - - - 40 152 16 - - - - - - -
Little Goose 6,102 4,608 94 146 - - 3,171 30 - - 66 - - - - - -
Lookout Dam 5,170 - - 7,490 572 - - - 17 294 - - - - - - -
Lost Creek 118 147 - - - - - - 7 - - - - - - - -
Lower Granite 1,311 2,025 2,131 434 - - 5,669 3,801 8 - 3,475 - - - - - -
Lower Monument 2,160 3,301 3,452 549 285 - 2,332 1,430 - 89 155 - - - - - -
McNary 635 1,046 6,138 646 4,080 - - 759 565 11 1,000 - - - - - -
The Dalles 4,579 - 1,408 36,019 2,170 - - - - - 305 - - - - - -
Corps of Engineers Subtotal: 167,945 78,991 160,675 202,360 80,881 301,568 207,821 134,530 160,805 255,825 203,837 63,629 - - - - -
Lower Snake Fish and Wildlife 228,843 325 1,127 102 379 - 1,540 6 343 - 1,256 - - - - - -
Lower Snake Fish & Wildlife Subtotal: 228,843 325 1,127 102 379 - 1,540 6 343 - 1,256 - - - - - -
476,940 91,070 231,028 217,209 83,461 301,568 211,365 136,222 163,374 255,847 227,620 63,629 - - - - -
Bureau Direct - - 105,000 145,000 242,000 19,000 - 140,937 120,899 29,000 65,665 136,360 89,093 - - - -
Principal Accrual - - - - - - - - - - - - - - - - -
Principal Accrual Reversal - - - - - - - - - - - - - - - - -
Conservation - 29,000 - - 19,000 16,000 142,000 97,000 69,000 39,000 6,000 25,000 - - - - -
Principal Accrual - - - - - - - - - - - - - - - - -
Principal Accrual Reversal - - - - - - - - - - - - - - - - -
Construction (AS) - 15,150 5,250 18,100 7,000 5,800 3,150 5,600 - - - - - - - - -
Principal Accrual - - - - - - - - - - - - - - - - -
Principal Accrual Reversal - - - - - - - - - - - - - - - - -
Corps - - - - - - - - - 104,837 80,866 125,006 2,108 - - - -
Principal Accrual - - - - - - - - - - - - - - - - -
Principal Accrual Reversal - - - - - - - - - - - - - - - - -
Fish and Wildlife - - 46,000 - 20,000 31,000 65,000 49,000 55,532 6,468 67,000 69,586 20,000 - - - -
Principal Accrual - - - - - - - - - - - - - - - - -
Principal Accrual Reversal - - - - - - - - - - - - - - - - -
Technology (G) - - - - 35,000 14,000 5,000 - - - - - - - - - -
Principal Accrual - - - - - - - - - - - - - - - - -
Principal Accrual Reversal - - - - - - - - - - - - - - - - -
BPA Borrowing Subtotal: - 44,150 156,250 163,100 323,000 85,800 215,150 292,537 245,431 179,306 219,531 355,952 111,201 - - - -
Replacements - - - - - - - - - - - - 655,003 707,557 751,172 742,673 219,724
Principal Accrual - - - - - - - - - - - - - - - - -
Principal Accrual Reversal - - - - - - - - - - - - - - - - -
Federal Generation Replacements Subtotal: - - - - - - - - - - - - 655,003 707,557 751,172 742,673 219,724
Discounts - - - - - - - (63) (101) - (1,202) (8,942) (16,723) - - - -
Premiums - - - 2,759 9,781 - 1,868 2,523 804 63 - - - - - - -
Make Whole Call Subtotal: - - - 2,759 9,781 - 1,868 2,460 704 63 (1,202) (8,942) (16,723) - - - -
- 44,150 156,250 163,100 323,000 85,800 215,150 292,600 245,532 179,306 220,733 364,894 782,927 707,557 751,172 742,673 219,724
Irrigation Assistance 50,769 27,234 56,573 24,317 14,747 16,060 12,846 15,117 13,543 20,755 6,118 11,186 4,065 1,996 10,524 - 4,347
Irrigation Assistance Subtotal: 50,769 27,234 56,573 24,317 14,747 16,060 12,846 15,117 13,543 20,755 6,118 11,186 4,065 1,996 10,524 - 4,347
50,769 27,234 56,573 24,317 14,747 16,060 12,846 15,117 13,543 20,755 6,118 11,186 4,065 1,996 10,524 - 4,347
$527,709 $162,454 $443,851 $404,626 $421,208 $403,428 $439,361 $443,939 $422,448 $455,908 $454,471 $439,710 $786,992 $709,553 $761,696 $742,673 $224,070Grand Total:
Bond
BPA Borrowing
Federal Generation Replacements
Make Whole Call
Bond Subtotal:
IrrigationIrrigation Assistance
Irrigation Subtotal:
Appropriation
Bureau of Reclamation
Corps of Engineers
Lower Snake Fish & Wildlife
Appropriation Subtotal:
BP-18-FS-BPA-02A Page 126

TABLE 11F:
Summary of Amortization
October 1, 2015 - September 30, 2018 Cost Evaluation Period($000s) (FY 2018)
Obligation Type General Project Specific Project
Boise
Columbia Basin
Columbia Basin 3rd Powerhouse
Hungry Horse Dam
Minidoka/Palisades
RRP - Green Springs
Yakima Chandler/Kenniwick
Yakima Roza
Bureau of Reclamation Subtotal:
Albeni Falls
Bonneville 2nd Powerhouse
Bonneville Dam
Chief Joseph
Columbia River Fish Mitigation
Cougar
Detroit Lake/Big Cliff
Dworshak
Green Peter/Foster
Hills Creek
Ice Harbor
John Day
Libby
Little Goose
Lookout Dam
Lost Creek
Lower Granite
Lower Monument
McNary
The Dalles
Corps of Engineers Subtotal:
Lower Snake Fish and Wildlife
Lower Snake Fish & Wildlife Subtotal:
Bureau Direct
Principal Accrual
Principal Accrual Reversal
Conservation
Principal Accrual
Principal Accrual Reversal
Construction (AS)
Principal Accrual
Principal Accrual Reversal
Corps
Principal Accrual
Principal Accrual Reversal
Fish and Wildlife
Principal Accrual
Principal Accrual Reversal
Technology (G)
Principal Accrual
Principal Accrual Reversal
BPA Borrowing Subtotal:
Replacements
Principal Accrual
Principal Accrual Reversal
Federal Generation Replacements Subtotal:
Discounts
Premiums
Make Whole Call Subtotal:
Irrigation Assistance
Irrigation Assistance Subtotal:
Grand Total:
Bond
BPA Borrowing
Federal Generation Replacements
Make Whole Call
Bond Subtotal:
IrrigationIrrigation Assistance
Irrigation Subtotal:
Appropriation
Bureau of Reclamation
Corps of Engineers
Lower Snake Fish & Wildlife
Appropriation Subtotal:
2034 2035 2036 2037 2038 2039 2040 2041 2042 2043 2044 2045 2046 2047 2048 2049 2050 2051 2052
- - - - - - - - - - - - - - - - - - -
- - - - - - - - - - - - - - - - - - -
- - - - - - - - - - - - - - - - - - -
- - - - - - - - - - - - - - - - - - -
- - - - - - - - - - - - - - - - - - -
- - - - - - - - - - - - - - - - - - -
- - - - - - - - - - - - - - - - - - -
- - - - - - - - - - - - - - - - - - -
- - - - - - - - - - - - - - - - - - -
- - - - - - - - - - - - - - - - - - -
- - - - - - - - - - - - - - - - - - -
- - - - - - - - - - - - - - - - - - -
- - - - - - - - - - - - - - - - - - -
- - - - - - - - - - - - - - - - - - -
- - - - - - - - - - - - - - - - - - -
- - - - - - - - - - - - - - - - - - -
- - - - - - - - - - - - - - - - - - -
- - - - - - - - - - - - - - - - - - -
- - - - - - - - - - - - - - - - - - -
- - - - - - - - - - - - - - - - - - -
- - - - - - - - - - - - - - - - - - -
- - - - - - - - - - - - - - - - - - -
- - - - - - - - - - - - - - - - - - -
- - - - - - - - - - - - - - - - - - -
- - - - - - - - - - - - - - - - - - -
- - - - - - - - - - - - - - - - - - -
- - - - - - - - - - - - - - - - - - -
- - - - - - - - - - - - - - - - - - -
- - - - - - - - - - - - - - - - - - -
- - - - - - - - - - - - - - - - - - -
- - - - - - - - - - - - - - - - - - -
- - - - - - - - - - - - - - - - - - -
- - - - - - - - - - - - - - - - - - -
- - - - - - - - - - - - - - - - - - -
- - - - - - - - - - - - - - - - - - -
- - - - - - - - - - - - - - - - - - -
- - - - - - - - - - - - - - - - - - -
- - - - - - - - - - - - - - - - - - -
- - - - - - - - - - - - - - - - - - -
- - - - - - - - - - - - - - - - - - -
- - - - - - - - - - - - - - - - - - -
- - - - - - - - - - - - - - - - - - -
- - - - - - - - - - - - - - - - - - -
- - - - - - - - - - - - - - - - - - -
- - - - - - - - - - - - - - - - - - -
- - - - - - - - - - - - - - - - - - -
- - - - - - - - - - - - - - - - - - -
- - - - - - - - - - - - - - - - - - -
- - - - - - - - - - - - - - - - - - -
- - - - - - - - - - - - - - - - - - -
- - - - - - - - - - - - - - - - - - -
- - - - - - - - - - - - - - - - - - -
219,724 219,724 219,724 219,724 219,724 219,724 219,724 219,724 219,724 219,724 219,724 219,724 219,724 219,724 219,724 219,724 219,724 219,724 219,724
- - - - - - - - - - - - - - - - - - -
- - - - - - - - - - - - - - - - - - -
219,724 219,724 219,724 219,724 219,724 219,724 219,724 219,724 219,724 219,724 219,724 219,724 219,724 219,724 219,724 219,724 219,724 219,724 219,724
- - - - - - - - - - - - - - - - - - -
- - - - - - - - - - - - - - - - - - -
- - - - - - - - - - - - - - - - - - -
219,724 219,724 219,724 219,724 219,724 219,724 219,724 219,724 219,724 219,724 219,724 219,724 219,724 219,724 219,724 219,724 219,724 219,724 219,724
- 7,761 28,920 15,778 - 14,181 - - 73,659 - - 11,579 - - - - - - -
- 7,761 28,920 15,778 - 14,181 - - 73,659 - - 11,579 - - - - - - -
- 7,761 28,920 15,778 - 14,181 - - 73,659 - - 11,579 - - - - - - -
$219,724 $227,485 $248,644 $235,501 $219,724 $233,905 $219,724 $219,724 $293,383 $219,724 $219,724 $231,303 $219,724 $219,724 $219,724 $219,724 $219,724 $219,724 $219,724
BP-18-FS-BPA-02A Page 127

TABLE 11F:
Summary of Amortization
October 1, 2015 - September 30, 2018 Cost Evaluation Period($000s) (FY 2018)
Obligation Type General Project Specific Project
Boise
Columbia Basin
Columbia Basin 3rd Powerhouse
Hungry Horse Dam
Minidoka/Palisades
RRP - Green Springs
Yakima Chandler/Kenniwick
Yakima Roza
Bureau of Reclamation Subtotal:
Albeni Falls
Bonneville 2nd Powerhouse
Bonneville Dam
Chief Joseph
Columbia River Fish Mitigation
Cougar
Detroit Lake/Big Cliff
Dworshak
Green Peter/Foster
Hills Creek
Ice Harbor
John Day
Libby
Little Goose
Lookout Dam
Lost Creek
Lower Granite
Lower Monument
McNary
The Dalles
Corps of Engineers Subtotal:
Lower Snake Fish and Wildlife
Lower Snake Fish & Wildlife Subtotal:
Bureau Direct
Principal Accrual
Principal Accrual Reversal
Conservation
Principal Accrual
Principal Accrual Reversal
Construction (AS)
Principal Accrual
Principal Accrual Reversal
Corps
Principal Accrual
Principal Accrual Reversal
Fish and Wildlife
Principal Accrual
Principal Accrual Reversal
Technology (G)
Principal Accrual
Principal Accrual Reversal
BPA Borrowing Subtotal:
Replacements
Principal Accrual
Principal Accrual Reversal
Federal Generation Replacements Subtotal:
Discounts
Premiums
Make Whole Call Subtotal:
Irrigation Assistance
Irrigation Assistance Subtotal:
Grand Total:
Bond
BPA Borrowing
Federal Generation Replacements
Make Whole Call
Bond Subtotal:
IrrigationIrrigation Assistance
Irrigation Subtotal:
Appropriation
Bureau of Reclamation
Corps of Engineers
Lower Snake Fish & Wildlife
Appropriation Subtotal:
2053 2054 2055 2056 2057 2058 2059 2060 2061 2062 2063 2064 2065 2066 2067 2068 Total
- - - - - 64 - - - - - - - - - - 4,425
- - - - - 835 1,338 - - - - - - - - - 97,915
- - - - - - - - - - - - - - - - 12,631
- - - - - 76 60 - - - - - - - - - 11,549
- - - - - - - - - - - - - - - - 70,403
- - - - - - - - - - - - - - - - 11,148
- - - - - - 15 - - - - - - - - - 848
- - - - - - - - - - - - - - - - 14
- - - - - 975 1,414 - - - - - - - - - 208,933
- - - - - - 57 - - - - - - - - - 3,090
- - - - - - - - - - - - - - - - 38,293
- - - - - 14,609 - - - - - - - - - - 135,618
- - - - - 3,500 - - - - - - - - - - 37,578
- - - - - 36,554 - - - - - - - - - - 1,633,638
- - - - - - - - - - - - - - - - 16,710
- - - - - - - - - - - - - - - - 2,168
- - - - - 10 - - - - - - - - - - 13,495
- - - - - - - - - - - - - - - - 863
- - - - - - - - - - - - - - - - 2,867
- - - - - 14 - - - - - - - - - - 19,152
- - - - - - 1,548 - - - - - - - - - 30,473
- - - - - 1,567 - - - - - - - - - - 22,777
- - - - - 13 - - - - - - - - - - 14,231
- - - - - - - - - - - - - - - - 13,543
- - - - - - - - - - - - - - - - 272
- - - - - 24 - - - - - - - - - - 18,878
- - - - - 9 - - - - - - - - - - 13,764
- - - - - 215 - - - - - - - - - - 15,096
- - - - - 1,651 - - - - - - - - - - 46,132
- - - - - 58,167 1,605 - - - - - - - - - 2,078,639
- - - - - 74 - - - - - - - - - - 233,996
- - - - - 74 - - - - - - - - - - 233,996
- - - - - 59,216 3,018 - - - - - - - - - 2,521,567
- - - - - - - - - - - - - - - - 1,092,955
- - - - - - - - - - - - - - - - -
- - - - - - - - - - - - - - - - -
- - - - - - - - - - - - - - - - 442,000
- - - - - - - - - - - - - - - - -
- - - - - - - - - - - - - - - - -
- - - - - - - - - - - - - - - - 60,050
- - - - - - - - - - - - - - - - -
- - - - - - - - - - - - - - - - -
- - - - - - - - - - - - - - - - 312,817
- - - - - - - - - - - - - - - - -
- - - - - - - - - - - - - - - - -
- - - - - - - - - - - - - - - - 429,586
- - - - - - - - - - - - - - - - -
- - - - - - - - - - - - - - - - -
- - - - - - - - - - - - - - - - 54,000
- - - - - - - - - - - - - - - - -
- - - - - - - - - - - - - - - - -
- - - - - - - - - - - - - - - - 2,391,408
219,724 219,724 219,724 219,724 219,724 219,724 219,724 219,724 219,724 219,724 219,724 219,724 219,724 219,724 219,724 219,724 10,766,452
- - - - - - - - - - - - - - - - -
- - - - - - - - - - - - - - - - -
219,724 219,724 219,724 219,724 219,724 219,724 219,724 219,724 219,724 219,724 219,724 219,724 219,724 219,724 219,724 219,724 10,766,452
- - - - - - - - - - - - - - - - (27,031)
- - - - - - - - - - - - - - - - 17,798
- - - - - - - - - - - - - - - - (9,233)
219,724 219,724 219,724 219,724 219,724 219,724 219,724 219,724 219,724 219,724 219,724 219,724 219,724 219,724 219,724 219,724 13,184,891
- - - - - - - - - - - - - - - - 442,075
- - - - - - - - - - - - - - - - 442,075
- - - - - - - - - - - - - - - - 442,075
$219,724 $219,724 $219,724 $219,724 $219,724 $278,939 $222,742 $219,724 $219,724 $219,724 $219,724 $219,724 $219,724 $219,724 $219,724 $219,724 $16,148,532
BP-18-FS-BPA-02A Page 128

12. REPAYMENT STUDY DATA, FY 2019 STUDY
BP-18-FS-BPA-02A Page 129
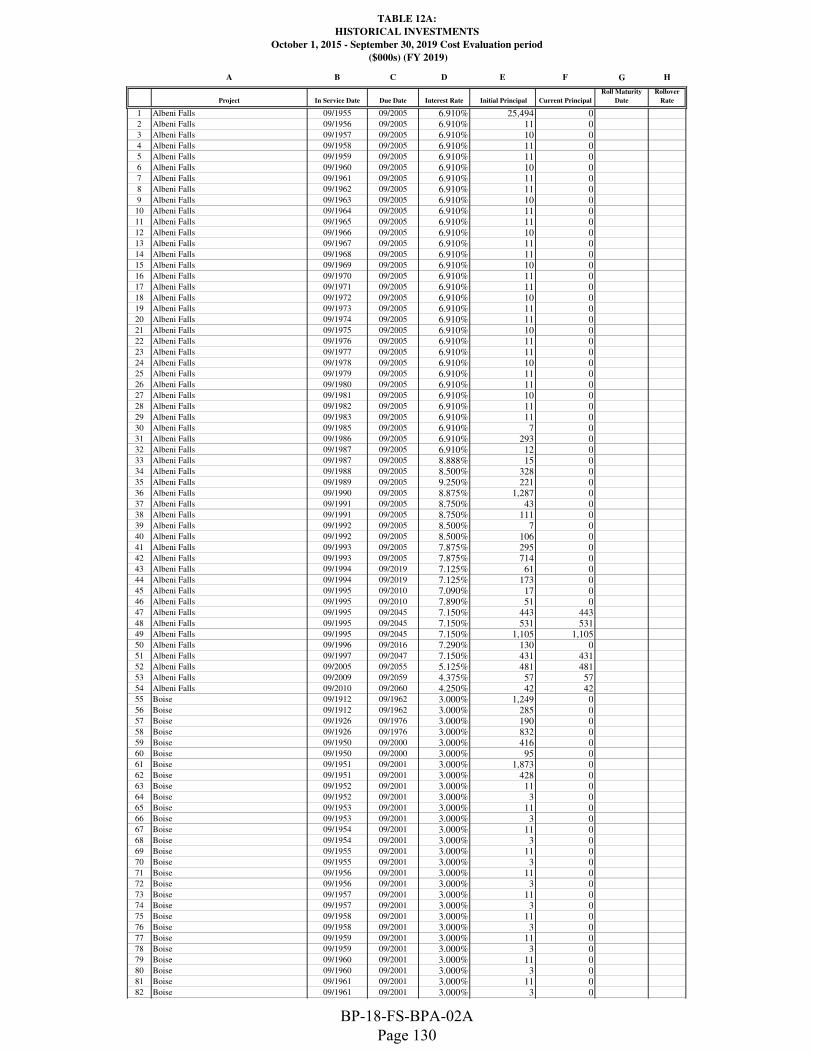
TABLE 12A:
HISTORICAL INVESTMENTS
October 1, 2015 - September 30, 2019 Cost Evaluation period
($000s) (FY 2019)
A B C D E F G H
Project In Service Date Due Date Interest Rate Initial Principal Current Principal
Roll Maturity
Date
Rollover
Rate
1 Albeni Falls 09/1955 09/2005 6.910% 25,494 02 Albeni Falls 09/1956 09/2005 6.910% 11 03 Albeni Falls 09/1957 09/2005 6.910% 10 04 Albeni Falls 09/1958 09/2005 6.910% 11 05 Albeni Falls 09/1959 09/2005 6.910% 11 06 Albeni Falls 09/1960 09/2005 6.910% 10 07 Albeni Falls 09/1961 09/2005 6.910% 11 08 Albeni Falls 09/1962 09/2005 6.910% 11 09 Albeni Falls 09/1963 09/2005 6.910% 10 010 Albeni Falls 09/1964 09/2005 6.910% 11 011 Albeni Falls 09/1965 09/2005 6.910% 11 012 Albeni Falls 09/1966 09/2005 6.910% 10 013 Albeni Falls 09/1967 09/2005 6.910% 11 014 Albeni Falls 09/1968 09/2005 6.910% 11 015 Albeni Falls 09/1969 09/2005 6.910% 10 016 Albeni Falls 09/1970 09/2005 6.910% 11 017 Albeni Falls 09/1971 09/2005 6.910% 11 018 Albeni Falls 09/1972 09/2005 6.910% 10 019 Albeni Falls 09/1973 09/2005 6.910% 11 020 Albeni Falls 09/1974 09/2005 6.910% 11 021 Albeni Falls 09/1975 09/2005 6.910% 10 022 Albeni Falls 09/1976 09/2005 6.910% 11 023 Albeni Falls 09/1977 09/2005 6.910% 11 024 Albeni Falls 09/1978 09/2005 6.910% 10 025 Albeni Falls 09/1979 09/2005 6.910% 11 026 Albeni Falls 09/1980 09/2005 6.910% 11 027 Albeni Falls 09/1981 09/2005 6.910% 10 028 Albeni Falls 09/1982 09/2005 6.910% 11 029 Albeni Falls 09/1983 09/2005 6.910% 11 030 Albeni Falls 09/1985 09/2005 6.910% 7 031 Albeni Falls 09/1986 09/2005 6.910% 293 032 Albeni Falls 09/1987 09/2005 6.910% 12 033 Albeni Falls 09/1987 09/2005 8.888% 15 034 Albeni Falls 09/1988 09/2005 8.500% 328 035 Albeni Falls 09/1989 09/2005 9.250% 221 036 Albeni Falls 09/1990 09/2005 8.875% 1,287 037 Albeni Falls 09/1991 09/2005 8.750% 43 038 Albeni Falls 09/1991 09/2005 8.750% 111 039 Albeni Falls 09/1992 09/2005 8.500% 7 040 Albeni Falls 09/1992 09/2005 8.500% 106 041 Albeni Falls 09/1993 09/2005 7.875% 295 042 Albeni Falls 09/1993 09/2005 7.875% 714 043 Albeni Falls 09/1994 09/2019 7.125% 61 044 Albeni Falls 09/1994 09/2019 7.125% 173 045 Albeni Falls 09/1995 09/2010 7.090% 17 046 Albeni Falls 09/1995 09/2010 7.890% 51 047 Albeni Falls 09/1995 09/2045 7.150% 443 44348 Albeni Falls 09/1995 09/2045 7.150% 531 53149 Albeni Falls 09/1995 09/2045 7.150% 1,105 1,10550 Albeni Falls 09/1996 09/2016 7.290% 130 051 Albeni Falls 09/1997 09/2047 7.150% 431 43152 Albeni Falls 09/2005 09/2055 5.125% 481 48153 Albeni Falls 09/2009 09/2059 4.375% 57 5754 Albeni Falls 09/2010 09/2060 4.250% 42 4255 Boise 09/1912 09/1962 3.000% 1,249 056 Boise 09/1912 09/1962 3.000% 285 057 Boise 09/1926 09/1976 3.000% 190 058 Boise 09/1926 09/1976 3.000% 832 059 Boise 09/1950 09/2000 3.000% 416 060 Boise 09/1950 09/2000 3.000% 95 061 Boise 09/1951 09/2001 3.000% 1,873 062 Boise 09/1951 09/2001 3.000% 428 063 Boise 09/1952 09/2001 3.000% 11 064 Boise 09/1952 09/2001 3.000% 3 065 Boise 09/1953 09/2001 3.000% 11 066 Boise 09/1953 09/2001 3.000% 3 067 Boise 09/1954 09/2001 3.000% 11 068 Boise 09/1954 09/2001 3.000% 3 069 Boise 09/1955 09/2001 3.000% 11 070 Boise 09/1955 09/2001 3.000% 3 071 Boise 09/1956 09/2001 3.000% 11 072 Boise 09/1956 09/2001 3.000% 3 073 Boise 09/1957 09/2001 3.000% 11 074 Boise 09/1957 09/2001 3.000% 3 075 Boise 09/1958 09/2001 3.000% 11 076 Boise 09/1958 09/2001 3.000% 3 077 Boise 09/1959 09/2001 3.000% 11 078 Boise 09/1959 09/2001 3.000% 3 079 Boise 09/1960 09/2001 3.000% 11 080 Boise 09/1960 09/2001 3.000% 3 081 Boise 09/1961 09/2001 3.000% 11 082 Boise 09/1961 09/2001 3.000% 3 0
BP-18-FS-BPA-02A Page 130
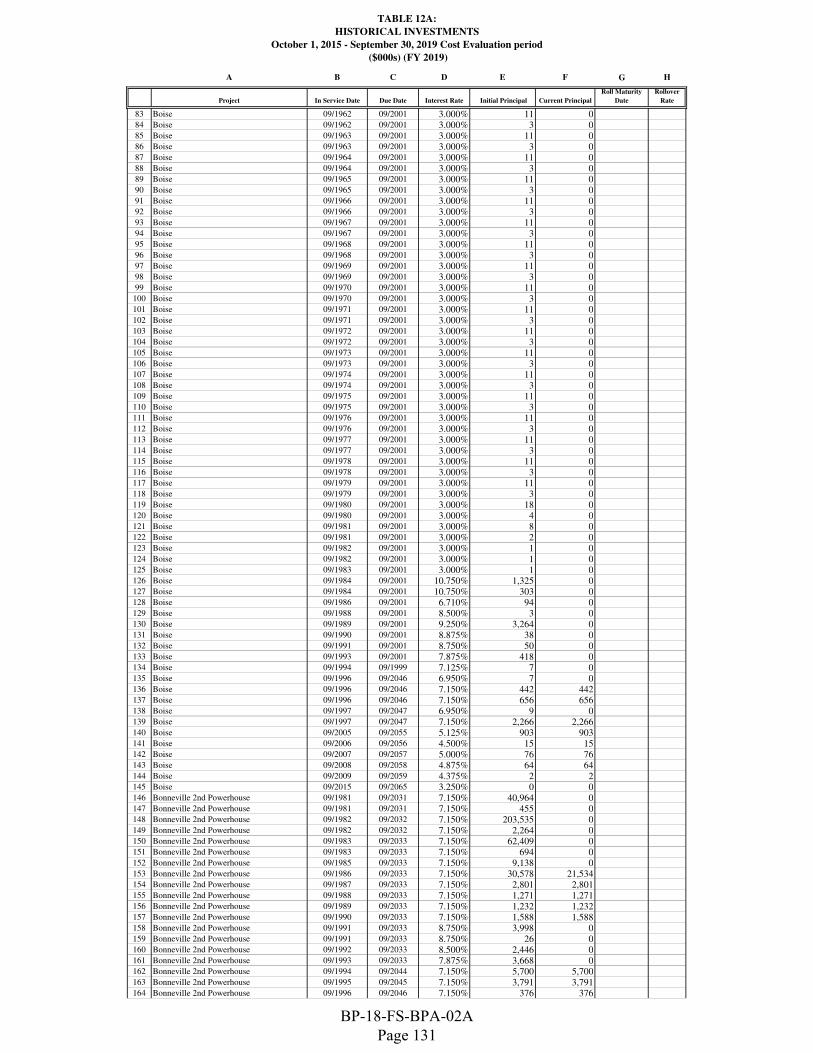
TABLE 12A:
HISTORICAL INVESTMENTS
October 1, 2015 - September 30, 2019 Cost Evaluation period
($000s) (FY 2019)
A B C D E F G H
Project In Service Date Due Date Interest Rate Initial Principal Current Principal
Roll Maturity
Date
Rollover
Rate
83 Boise 09/1962 09/2001 3.000% 11 084 Boise 09/1962 09/2001 3.000% 3 085 Boise 09/1963 09/2001 3.000% 11 086 Boise 09/1963 09/2001 3.000% 3 087 Boise 09/1964 09/2001 3.000% 11 088 Boise 09/1964 09/2001 3.000% 3 089 Boise 09/1965 09/2001 3.000% 11 090 Boise 09/1965 09/2001 3.000% 3 091 Boise 09/1966 09/2001 3.000% 11 092 Boise 09/1966 09/2001 3.000% 3 093 Boise 09/1967 09/2001 3.000% 11 094 Boise 09/1967 09/2001 3.000% 3 095 Boise 09/1968 09/2001 3.000% 11 096 Boise 09/1968 09/2001 3.000% 3 097 Boise 09/1969 09/2001 3.000% 11 098 Boise 09/1969 09/2001 3.000% 3 099 Boise 09/1970 09/2001 3.000% 11 0
100 Boise 09/1970 09/2001 3.000% 3 0101 Boise 09/1971 09/2001 3.000% 11 0102 Boise 09/1971 09/2001 3.000% 3 0103 Boise 09/1972 09/2001 3.000% 11 0104 Boise 09/1972 09/2001 3.000% 3 0105 Boise 09/1973 09/2001 3.000% 11 0106 Boise 09/1973 09/2001 3.000% 3 0107 Boise 09/1974 09/2001 3.000% 11 0108 Boise 09/1974 09/2001 3.000% 3 0109 Boise 09/1975 09/2001 3.000% 11 0110 Boise 09/1975 09/2001 3.000% 3 0111 Boise 09/1976 09/2001 3.000% 11 0112 Boise 09/1976 09/2001 3.000% 3 0113 Boise 09/1977 09/2001 3.000% 11 0114 Boise 09/1977 09/2001 3.000% 3 0115 Boise 09/1978 09/2001 3.000% 11 0116 Boise 09/1978 09/2001 3.000% 3 0117 Boise 09/1979 09/2001 3.000% 11 0118 Boise 09/1979 09/2001 3.000% 3 0119 Boise 09/1980 09/2001 3.000% 18 0120 Boise 09/1980 09/2001 3.000% 4 0121 Boise 09/1981 09/2001 3.000% 8 0122 Boise 09/1981 09/2001 3.000% 2 0123 Boise 09/1982 09/2001 3.000% 1 0124 Boise 09/1982 09/2001 3.000% 1 0125 Boise 09/1983 09/2001 3.000% 1 0126 Boise 09/1984 09/2001 10.750% 1,325 0127 Boise 09/1984 09/2001 10.750% 303 0128 Boise 09/1986 09/2001 6.710% 94 0129 Boise 09/1988 09/2001 8.500% 3 0130 Boise 09/1989 09/2001 9.250% 3,264 0131 Boise 09/1990 09/2001 8.875% 38 0132 Boise 09/1991 09/2001 8.750% 50 0133 Boise 09/1993 09/2001 7.875% 418 0134 Boise 09/1994 09/1999 7.125% 7 0135 Boise 09/1996 09/2046 6.950% 7 0136 Boise 09/1996 09/2046 7.150% 442 442137 Boise 09/1996 09/2046 7.150% 656 656138 Boise 09/1997 09/2047 6.950% 9 0139 Boise 09/1997 09/2047 7.150% 2,266 2,266140 Boise 09/2005 09/2055 5.125% 903 903141 Boise 09/2006 09/2056 4.500% 15 15142 Boise 09/2007 09/2057 5.000% 76 76143 Boise 09/2008 09/2058 4.875% 64 64144 Boise 09/2009 09/2059 4.375% 2 2145 Boise 09/2015 09/2065 3.250% 0 0146 Bonneville 2nd Powerhouse 09/1981 09/2031 7.150% 40,964 0147 Bonneville 2nd Powerhouse 09/1981 09/2031 7.150% 455 0148 Bonneville 2nd Powerhouse 09/1982 09/2032 7.150% 203,535 0149 Bonneville 2nd Powerhouse 09/1982 09/2032 7.150% 2,264 0150 Bonneville 2nd Powerhouse 09/1983 09/2033 7.150% 62,409 0151 Bonneville 2nd Powerhouse 09/1983 09/2033 7.150% 694 0152 Bonneville 2nd Powerhouse 09/1985 09/2033 7.150% 9,138 0153 Bonneville 2nd Powerhouse 09/1986 09/2033 7.150% 30,578 21,534154 Bonneville 2nd Powerhouse 09/1987 09/2033 7.150% 2,801 2,801155 Bonneville 2nd Powerhouse 09/1988 09/2033 7.150% 1,271 1,271156 Bonneville 2nd Powerhouse 09/1989 09/2033 7.150% 1,232 1,232157 Bonneville 2nd Powerhouse 09/1990 09/2033 7.150% 1,588 1,588158 Bonneville 2nd Powerhouse 09/1991 09/2033 8.750% 3,998 0159 Bonneville 2nd Powerhouse 09/1991 09/2033 8.750% 26 0160 Bonneville 2nd Powerhouse 09/1992 09/2033 8.500% 2,446 0161 Bonneville 2nd Powerhouse 09/1993 09/2033 7.875% 3,668 0162 Bonneville 2nd Powerhouse 09/1994 09/2044 7.150% 5,700 5,700163 Bonneville 2nd Powerhouse 09/1995 09/2045 7.150% 3,791 3,791164 Bonneville 2nd Powerhouse 09/1996 09/2046 7.150% 376 376
BP-18-FS-BPA-02A Page 131

TABLE 12A:
HISTORICAL INVESTMENTS
October 1, 2015 - September 30, 2019 Cost Evaluation period
($000s) (FY 2019)
A B C D E F G H
Project In Service Date Due Date Interest Rate Initial Principal Current Principal
Roll Maturity
Date
Rollover
Rate
165 Bonneville Dam 09/1938 09/1988 2.500% 11,726 0166 Bonneville Dam 09/1938 09/1988 2.500% 130 0167 Bonneville Dam 09/1941 09/1991 2.500% 17,589 0168 Bonneville Dam 09/1941 09/1991 2.500% 196 0169 Bonneville Dam 09/1942 09/1992 2.500% 5,863 0170 Bonneville Dam 09/1942 09/1992 2.500% 65 0171 Bonneville Dam 09/1943 09/1993 2.500% 17,589 0172 Bonneville Dam 09/1943 09/1993 2.500% 196 0173 Bonneville Dam 09/1944 09/1994 2.500% 5,860 0174 Bonneville Dam 09/1944 09/1994 2.500% 65 0175 Bonneville Dam 09/1945 09/1994 2.500% 82 0176 Bonneville Dam 09/1945 09/1994 2.500% 1 0177 Bonneville Dam 09/1946 09/1994 2.500% 81 0178 Bonneville Dam 09/1946 09/1994 2.500% 1 0179 Bonneville Dam 09/1947 09/1994 2.500% 82 0180 Bonneville Dam 09/1947 09/1994 2.500% 1 0181 Bonneville Dam 09/1948 09/1994 2.500% 81 0182 Bonneville Dam 09/1948 09/1994 2.500% 1 0183 Bonneville Dam 09/1949 09/1994 2.500% 82 0184 Bonneville Dam 09/1949 09/1994 2.500% 1 0185 Bonneville Dam 09/1950 09/1994 2.500% 81 0186 Bonneville Dam 09/1950 09/1994 2.500% 11 0187 Bonneville Dam 09/1951 09/1994 2.500% 81 0188 Bonneville Dam 09/1951 09/1994 2.500% 11 0189 Bonneville Dam 09/1952 09/1994 2.500% 82 0190 Bonneville Dam 09/1952 09/1994 2.500% 1 0191 Bonneville Dam 09/1953 09/1994 2.500% 81 0192 Bonneville Dam 09/1953 09/1994 2.500% 1 0193 Bonneville Dam 09/1954 09/1994 2.500% 82 0194 Bonneville Dam 09/1954 09/1994 2.500% 1 0195 Bonneville Dam 09/1955 09/1994 2.500% 81 0196 Bonneville Dam 09/1955 09/1994 2.500% 1 0197 Bonneville Dam 09/1956 09/1994 2.500% 81 0198 Bonneville Dam 09/1956 09/1994 2.500% 1 0199 Bonneville Dam 09/1957 09/1994 2.500% 82 0200 Bonneville Dam 09/1957 09/1994 2.500% 1 0201 Bonneville Dam 09/1958 09/1994 2.500% 81 0202 Bonneville Dam 09/1958 09/1994 2.500% 1 0203 Bonneville Dam 09/1959 09/1994 2.500% 82 0204 Bonneville Dam 09/1959 09/1994 2.500% 1 0205 Bonneville Dam 09/1960 09/1994 2.500% 81 0206 Bonneville Dam 09/1960 09/1994 2.500% 1 0207 Bonneville Dam 09/1961 09/1994 2.500% 81 0208 Bonneville Dam 09/1961 09/1994 2.500% 1 0209 Bonneville Dam 09/1962 09/1994 2.500% 82 0210 Bonneville Dam 09/1962 09/1994 2.500% 1 0211 Bonneville Dam 09/1963 09/1994 2.500% 81 0212 Bonneville Dam 09/1963 09/1994 2.500% 1 0213 Bonneville Dam 09/1964 09/1994 2.500% 82 0214 Bonneville Dam 09/1964 09/1994 2.500% 1 0215 Bonneville Dam 09/1965 09/1994 2.500% 81 0216 Bonneville Dam 09/1965 09/1994 2.500% 1 0217 Bonneville Dam 09/1966 09/1994 2.500% 81 0218 Bonneville Dam 09/1966 09/1994 2.500% 1 0219 Bonneville Dam 09/1967 09/1994 2.500% 82 0220 Bonneville Dam 09/1967 09/1994 2.500% 1 0221 Bonneville Dam 09/1968 09/1994 2.500% 81 0222 Bonneville Dam 09/1968 09/1994 2.500% 1 0223 Bonneville Dam 09/1969 09/1994 2.500% 82 0224 Bonneville Dam 09/1969 09/1994 2.500% 1 0225 Bonneville Dam 09/1970 09/1994 2.500% 81 0226 Bonneville Dam 09/1970 09/1994 2.500% 1 0227 Bonneville Dam 09/1971 09/1994 2.500% 81 0228 Bonneville Dam 09/1971 09/1994 2.500% 1 0229 Bonneville Dam 09/1972 09/1994 2.500% 82 0230 Bonneville Dam 09/1972 09/1994 2.500% 1 0231 Bonneville Dam 09/1973 09/1994 2.500% 81 0232 Bonneville Dam 09/1973 09/1994 2.500% 1 0233 Bonneville Dam 09/1974 09/1994 2.500% 82 0234 Bonneville Dam 09/1974 09/1994 2.500% 1 0235 Bonneville Dam 09/1975 09/1994 2.500% 81 0236 Bonneville Dam 09/1975 09/1994 2.500% 1 0237 Bonneville Dam 09/1976 09/1994 2.500% 81 0238 Bonneville Dam 09/1976 09/1994 2.500% 1 0239 Bonneville Dam 09/1977 09/1994 2.500% 82 0240 Bonneville Dam 09/1977 09/1994 2.500% 1 0241 Bonneville Dam 09/1977 09/2027 7.150% 15,670 0242 Bonneville Dam 09/1978 09/1994 2.500% 81 0243 Bonneville Dam 09/1978 09/1994 2.500% 1 0244 Bonneville Dam 09/1979 09/1994 2.500% 82 0245 Bonneville Dam 09/1979 09/1994 2.500% 1 0246 Bonneville Dam 09/1980 09/1994 2.500% 81 0
BP-18-FS-BPA-02A Page 132

TABLE 12A:
HISTORICAL INVESTMENTS
October 1, 2015 - September 30, 2019 Cost Evaluation period
($000s) (FY 2019)
A B C D E F G H
Project In Service Date Due Date Interest Rate Initial Principal Current Principal
Roll Maturity
Date
Rollover
Rate
247 Bonneville Dam 09/1980 09/1994 2.500% 1 0248 Bonneville Dam 09/1981 09/1994 2.500% 81 0249 Bonneville Dam 09/1981 09/1994 2.500% 1 0250 Bonneville Dam 09/1982 09/1994 2.500% 82 0251 Bonneville Dam 09/1982 09/1994 2.500% 2 0252 Bonneville Dam 09/1983 09/1994 2.500% 81 0253 Bonneville Dam 09/1983 09/1994 2.500% 1 0254 Bonneville Dam 09/1984 09/1994 10.750% 873 0255 Bonneville Dam 09/1984 09/1994 10.750% 10 0256 Bonneville Dam 09/1985 09/1994 2.500% 119 0257 Bonneville Dam 09/1986 09/1994 2.500% 555 0258 Bonneville Dam 09/1986 09/1994 11.375% 454 0259 Bonneville Dam 09/1987 09/1994 2.500% 260 0260 Bonneville Dam 09/1987 09/1994 8.875% 26 0261 Bonneville Dam 09/1988 09/1994 8.500% 4,199 0262 Bonneville Dam 09/1988 09/1994 8.500% 10 0263 Bonneville Dam 09/1989 09/1994 9.250% 877 0264 Bonneville Dam 09/1990 09/1994 8.875% 519 0265 Bonneville Dam 09/1990 09/1994 8.875% 651 0266 Bonneville Dam 09/1991 09/1994 8.750% 35 0267 Bonneville Dam 09/1991 09/1994 8.750% 3,193 0268 Bonneville Dam 09/1992 09/1994 8.500% 99 0269 Bonneville Dam 09/1992 09/1994 8.500% 25 0270 Bonneville Dam 09/1993 09/2018 7.880% 5,011 0271 Bonneville Dam 09/1994 09/2029 7.125% 536 0272 Bonneville Dam 09/1995 09/2000 7.330% 8 0273 Bonneville Dam 09/1995 09/2010 7.090% 25 0274 Bonneville Dam 09/1995 09/2020 7.250% 20 0275 Bonneville Dam 09/1995 09/2020 7.250% 22 0276 Bonneville Dam 09/1995 09/2030 7.860% 53 0277 Bonneville Dam 09/1995 09/2035 7.860% 98 0278 Bonneville Dam 09/1995 09/2045 7.150% 243 243279 Bonneville Dam 09/1995 09/2045 7.150% 410 410280 Bonneville Dam 09/1995 09/2045 7.150% 440 440281 Bonneville Dam 09/1995 09/2045 7.860% 374 0282 Bonneville Dam 09/1996 09/2016 7.290% 834 0283 Bonneville Dam 09/1996 09/2031 7.150% 22 0284 Bonneville Dam 09/1996 09/2046 7.150% 18 18285 Bonneville Dam 09/1996 09/2046 7.150% 18 18286 Bonneville Dam 09/1996 09/2046 7.150% 80 80287 Bonneville Dam 09/1996 09/2046 7.150% 109 109288 Bonneville Dam 09/1996 09/2046 7.150% 142 142289 Bonneville Dam 09/1996 09/2046 7.150% 223 223290 Bonneville Dam 09/1996 09/2046 7.150% 751 751291 Bonneville Dam 09/1996 09/2046 7.150% 1,322 1,322292 Bonneville Dam 09/1997 09/2022 7.230% 122 0293 Bonneville Dam 09/1997 09/2032 7.150% 518 0294 Bonneville Dam 09/1997 09/2047 7.150% 161 161295 Bonneville Dam 09/1999 09/2049 5.375% 19,368 19,368296 Bonneville Dam 09/2000 09/2050 6.125% 24,446 24,446297 Bonneville Dam 09/2001 09/2051 5.875% 2,530 2,530298 Bonneville Dam 09/2002 09/2052 5.500% 448 448299 Bonneville Dam 09/2003 09/2053 5.125% 4,581 4,581300 Bonneville Dam 09/2004 09/2054 5.375% 26,741 26,741301 Bonneville Dam 09/2005 09/2055 5.125% 19,725 19,725302 Bonneville Dam 09/2006 09/2056 4.500% 2,628 2,628303 Bonneville Dam 09/2007 09/2057 5.000% 1,124 1,124304 Bonneville Dam 09/2008 09/2058 4.875% 14,609 14,609305 Bonneville Dam 09/2009 09/2059 4.375% 2,744 2,744306 Bonneville Dam 09/2010 09/2060 4.250% 1,425 1,425307 Bonneville Dam 09/2011 09/2061 3.750% 10,962 10,962308 Bonneville Dam 09/2013 09/2063 2.875% 268 268309 Bonneville Dam 09/2014 09/2064 3.875%310 Bonneville Dam 09/2015 09/2065 3.250% 102 102311 Chief Joseph 09/1955 09/2005 6.910% 29,164 0312 Chief Joseph 09/1956 09/2006 6.950% 13,643 0313 Chief Joseph 09/1957 09/2007 6.980% 39,586 0314 Chief Joseph 09/1958 09/2008 7.020% 31,901 0315 Chief Joseph 09/1959 09/2008 7.020% 223 0316 Chief Joseph 09/1960 09/2008 7.020% 223 0317 Chief Joseph 09/1961 09/2008 7.020% 223 0318 Chief Joseph 09/1962 09/2008 7.020% 223 0319 Chief Joseph 09/1963 09/2008 7.020% 224 0320 Chief Joseph 09/1964 09/2008 7.020% 223 0321 Chief Joseph 09/1965 09/2008 7.020% 223 0322 Chief Joseph 09/1966 09/2008 7.020% 223 0323 Chief Joseph 09/1967 09/2008 7.020% 223 0324 Chief Joseph 09/1968 09/2008 7.020% 224 0325 Chief Joseph 09/1969 09/2008 7.020% 223 0326 Chief Joseph 09/1970 09/2008 7.020% 223 0327 Chief Joseph 09/1971 09/2008 7.020% 223 0328 Chief Joseph 09/1972 09/2008 7.020% 223 0
BP-18-FS-BPA-02A Page 133

TABLE 12A:
HISTORICAL INVESTMENTS
October 1, 2015 - September 30, 2019 Cost Evaluation period
($000s) (FY 2019)
A B C D E F G H
Project In Service Date Due Date Interest Rate Initial Principal Current Principal
Roll Maturity
Date
Rollover
Rate
329 Chief Joseph 09/1973 09/2008 7.020% 224 0330 Chief Joseph 09/1974 09/2008 7.020% 223 0331 Chief Joseph 09/1975 09/2008 7.020% 223 0332 Chief Joseph 09/1976 09/2008 7.020% 223 0333 Chief Joseph 09/1977 09/2008 7.020% 223 0334 Chief Joseph 09/1977 09/2027 7.150% 30,512 0335 Chief Joseph 09/1978 09/2008 7.020% 224 0336 Chief Joseph 09/1978 09/2028 7.150% 75,669 0337 Chief Joseph 09/1979 09/2008 7.020% 223 0338 Chief Joseph 09/1979 09/2029 7.150% 60,079 0339 Chief Joseph 09/1980 09/2008 7.020% 223 0340 Chief Joseph 09/1981 09/2008 7.020% 223 0341 Chief Joseph 09/1982 09/2008 7.020% 223 0342 Chief Joseph 09/1983 09/2008 7.020% 224 0343 Chief Joseph 09/1984 09/2008 10.750% 909 0344 Chief Joseph 09/1985 09/2008 7.020% 46 0345 Chief Joseph 09/1985 09/2029 7.150% 16,372 0346 Chief Joseph 09/1986 09/2029 7.150% 5,363 0347 Chief Joseph 09/1987 09/2008 8.875% 104 0348 Chief Joseph 09/1987 09/2029 7.150% 3,036 0349 Chief Joseph 09/1988 09/2029 7.150% 2,722 0350 Chief Joseph 09/1989 09/2008 9.250% 327 0351 Chief Joseph 09/1989 09/2029 7.150% 2,227 0352 Chief Joseph 09/1990 09/2008 8.875% 1,024 0353 Chief Joseph 09/1990 09/2029 7.150% 4,505 0354 Chief Joseph 09/1991 09/2008 8.750% 34 0355 Chief Joseph 09/1991 09/2008 8.750% 293 0356 Chief Joseph 09/1991 09/2029 8.750% 3,840 0357 Chief Joseph 09/1992 09/2008 8.500% 142 0358 Chief Joseph 09/1992 09/2008 8.500% 717 0359 Chief Joseph 09/1992 09/2029 8.500% 2,032 0360 Chief Joseph 09/1993 09/2008 7.875% 42 0361 Chief Joseph 09/1993 09/2008 7.875% 794 0362 Chief Joseph 09/1993 09/2029 7.875% 1,360 0363 Chief Joseph 09/1994 09/2029 7.125% 129 0364 Chief Joseph 09/1994 09/2029 7.125% 65 0365 Chief Joseph 09/1994 09/2044 7.150% 4,280 4,017366 Chief Joseph 09/1995 09/2010 7.090% 15 0367 Chief Joseph 09/1995 09/2045 7.150% 147 147368 Chief Joseph 09/1995 09/2045 7.150% 562 562369 Chief Joseph 09/1995 09/2045 7.150% 712 712370 Chief Joseph 09/1995 09/2045 7.150% 784 784371 Chief Joseph 09/1996 09/2031 7.150% 27 0372 Chief Joseph 09/1996 09/2046 7.150% 3 3373 Chief Joseph 09/1996 09/2046 7.150% 4 4374 Chief Joseph 09/1996 09/2046 7.150% 355 355375 Chief Joseph 09/1996 09/2046 7.150% 729 729376 Chief Joseph 09/1997 09/2032 7.150% 166 0377 Chief Joseph 09/1997 09/2047 7.150% 657 657378 Chief Joseph 09/2001 09/2051 5.875% 345 345379 Chief Joseph 09/2002 09/2052 5.500% 2 2380 Chief Joseph 09/2003 09/2053 5.125% 992 992381 Chief Joseph 09/2008 09/2058 4.875% 3,500 3,500382 Chief Joseph 09/2009 09/2059 4.375% 24,727 24,727383 Chief Joseph 09/2011 09/2061 3.750% 4 4384 Chief Joseph 09/2012 09/2062 3.375% 28 28385 Chief Joseph 09/2013 09/2063 2.875% 10 10386 Columbia Basin 09/1941 09/1991 3.000% 10,919 0387 Columbia Basin 09/1941 09/1991 3.000% 1,505 0388 Columbia Basin 09/1942 09/1992 3.000% 16,165 0389 Columbia Basin 09/1942 09/1992 3.000% 3,011 0390 Columbia Basin 09/1943 09/1993 3.000% 8,083 0391 Columbia Basin 09/1943 09/1993 3.000% 1,505 0392 Columbia Basin 09/1944 09/1994 3.000% 16,165 0393 Columbia Basin 09/1944 09/1994 3.000% 3,011 0394 Columbia Basin 09/1948 09/1998 3.000% 24,247 0395 Columbia Basin 09/1948 09/1998 3.000% 4,516 0396 Columbia Basin 09/1949 09/1999 3.000% 24,247 0397 Columbia Basin 09/1949 09/1999 3.000% 4,516 0398 Columbia Basin 09/1950 09/2000 3.000% 16,165 0399 Columbia Basin 09/1950 09/2000 3.000% 3,011 0400 Columbia Basin 09/1951 09/2001 6.710% 28,255 0401 Columbia Basin 09/1951 09/2001 6.710% 5,790 0402 Columbia Basin 09/1952 09/2001 6.710% 258 0403 Columbia Basin 09/1952 09/2001 6.710% 48 0404 Columbia Basin 09/1953 09/2001 6.710% 258 0405 Columbia Basin 09/1953 09/2001 6.710% 48 0406 Columbia Basin 09/1954 09/2001 6.710% 258 0407 Columbia Basin 09/1954 09/2001 6.710% 48 0408 Columbia Basin 09/1955 09/2001 6.710% 258 0409 Columbia Basin 09/1955 09/2001 6.710% 48 0410 Columbia Basin 09/1956 09/2001 6.710% 259 0
BP-18-FS-BPA-02A Page 134
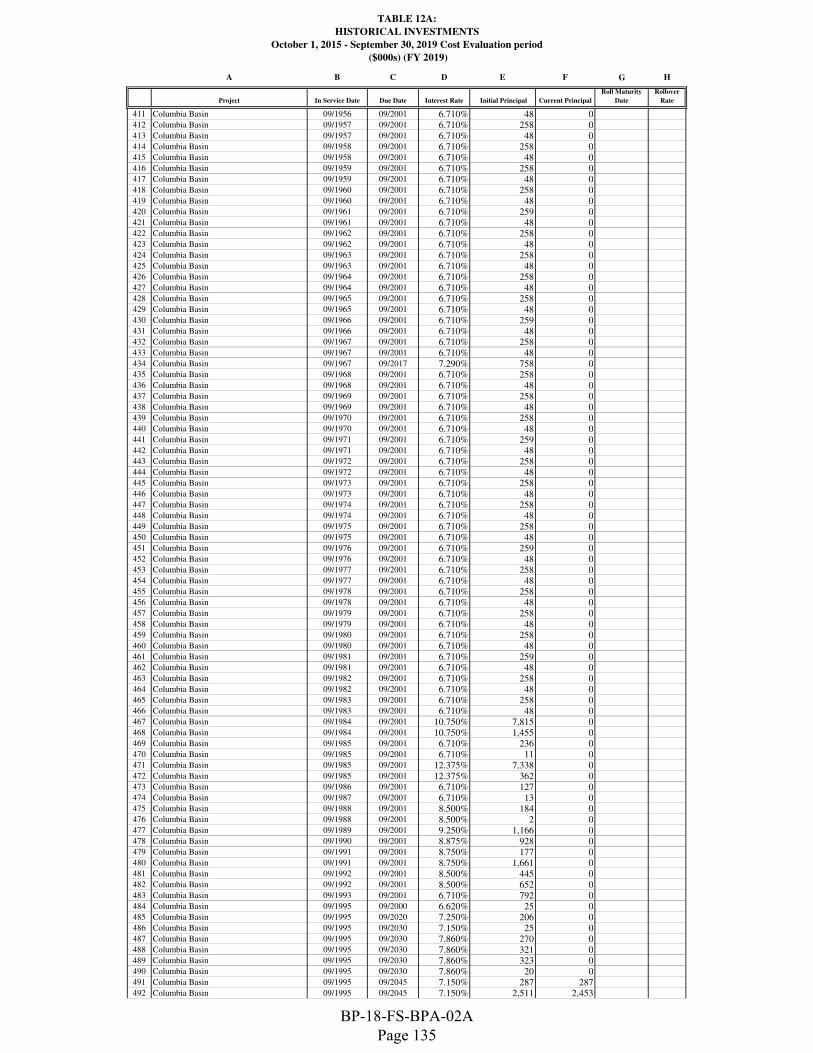
TABLE 12A:
HISTORICAL INVESTMENTS
October 1, 2015 - September 30, 2019 Cost Evaluation period
($000s) (FY 2019)
A B C D E F G H
Project In Service Date Due Date Interest Rate Initial Principal Current Principal
Roll Maturity
Date
Rollover
Rate
411 Columbia Basin 09/1956 09/2001 6.710% 48 0412 Columbia Basin 09/1957 09/2001 6.710% 258 0413 Columbia Basin 09/1957 09/2001 6.710% 48 0414 Columbia Basin 09/1958 09/2001 6.710% 258 0415 Columbia Basin 09/1958 09/2001 6.710% 48 0416 Columbia Basin 09/1959 09/2001 6.710% 258 0417 Columbia Basin 09/1959 09/2001 6.710% 48 0418 Columbia Basin 09/1960 09/2001 6.710% 258 0419 Columbia Basin 09/1960 09/2001 6.710% 48 0420 Columbia Basin 09/1961 09/2001 6.710% 259 0421 Columbia Basin 09/1961 09/2001 6.710% 48 0422 Columbia Basin 09/1962 09/2001 6.710% 258 0423 Columbia Basin 09/1962 09/2001 6.710% 48 0424 Columbia Basin 09/1963 09/2001 6.710% 258 0425 Columbia Basin 09/1963 09/2001 6.710% 48 0426 Columbia Basin 09/1964 09/2001 6.710% 258 0427 Columbia Basin 09/1964 09/2001 6.710% 48 0428 Columbia Basin 09/1965 09/2001 6.710% 258 0429 Columbia Basin 09/1965 09/2001 6.710% 48 0430 Columbia Basin 09/1966 09/2001 6.710% 259 0431 Columbia Basin 09/1966 09/2001 6.710% 48 0432 Columbia Basin 09/1967 09/2001 6.710% 258 0433 Columbia Basin 09/1967 09/2001 6.710% 48 0434 Columbia Basin 09/1967 09/2017 7.290% 758 0435 Columbia Basin 09/1968 09/2001 6.710% 258 0436 Columbia Basin 09/1968 09/2001 6.710% 48 0437 Columbia Basin 09/1969 09/2001 6.710% 258 0438 Columbia Basin 09/1969 09/2001 6.710% 48 0439 Columbia Basin 09/1970 09/2001 6.710% 258 0440 Columbia Basin 09/1970 09/2001 6.710% 48 0441 Columbia Basin 09/1971 09/2001 6.710% 259 0442 Columbia Basin 09/1971 09/2001 6.710% 48 0443 Columbia Basin 09/1972 09/2001 6.710% 258 0444 Columbia Basin 09/1972 09/2001 6.710% 48 0445 Columbia Basin 09/1973 09/2001 6.710% 258 0446 Columbia Basin 09/1973 09/2001 6.710% 48 0447 Columbia Basin 09/1974 09/2001 6.710% 258 0448 Columbia Basin 09/1974 09/2001 6.710% 48 0449 Columbia Basin 09/1975 09/2001 6.710% 258 0450 Columbia Basin 09/1975 09/2001 6.710% 48 0451 Columbia Basin 09/1976 09/2001 6.710% 259 0452 Columbia Basin 09/1976 09/2001 6.710% 48 0453 Columbia Basin 09/1977 09/2001 6.710% 258 0454 Columbia Basin 09/1977 09/2001 6.710% 48 0455 Columbia Basin 09/1978 09/2001 6.710% 258 0456 Columbia Basin 09/1978 09/2001 6.710% 48 0457 Columbia Basin 09/1979 09/2001 6.710% 258 0458 Columbia Basin 09/1979 09/2001 6.710% 48 0459 Columbia Basin 09/1980 09/2001 6.710% 258 0460 Columbia Basin 09/1980 09/2001 6.710% 48 0461 Columbia Basin 09/1981 09/2001 6.710% 259 0462 Columbia Basin 09/1981 09/2001 6.710% 48 0463 Columbia Basin 09/1982 09/2001 6.710% 258 0464 Columbia Basin 09/1982 09/2001 6.710% 48 0465 Columbia Basin 09/1983 09/2001 6.710% 258 0466 Columbia Basin 09/1983 09/2001 6.710% 48 0467 Columbia Basin 09/1984 09/2001 10.750% 7,815 0468 Columbia Basin 09/1984 09/2001 10.750% 1,455 0469 Columbia Basin 09/1985 09/2001 6.710% 236 0470 Columbia Basin 09/1985 09/2001 6.710% 11 0471 Columbia Basin 09/1985 09/2001 12.375% 7,338 0472 Columbia Basin 09/1985 09/2001 12.375% 362 0473 Columbia Basin 09/1986 09/2001 6.710% 127 0474 Columbia Basin 09/1987 09/2001 6.710% 13 0475 Columbia Basin 09/1988 09/2001 8.500% 184 0476 Columbia Basin 09/1988 09/2001 8.500% 2 0477 Columbia Basin 09/1989 09/2001 9.250% 1,166 0478 Columbia Basin 09/1990 09/2001 8.875% 928 0479 Columbia Basin 09/1991 09/2001 8.750% 177 0480 Columbia Basin 09/1991 09/2001 8.750% 1,661 0481 Columbia Basin 09/1992 09/2001 8.500% 445 0482 Columbia Basin 09/1992 09/2001 8.500% 652 0483 Columbia Basin 09/1993 09/2001 6.710% 792 0484 Columbia Basin 09/1995 09/2000 6.620% 25 0485 Columbia Basin 09/1995 09/2020 7.250% 206 0486 Columbia Basin 09/1995 09/2030 7.150% 25 0487 Columbia Basin 09/1995 09/2030 7.860% 270 0488 Columbia Basin 09/1995 09/2030 7.860% 321 0489 Columbia Basin 09/1995 09/2030 7.860% 323 0490 Columbia Basin 09/1995 09/2030 7.860% 20 0491 Columbia Basin 09/1995 09/2045 7.150% 287 287492 Columbia Basin 09/1995 09/2045 7.150% 2,511 2,453
BP-18-FS-BPA-02A Page 135

TABLE 12A:
HISTORICAL INVESTMENTS
October 1, 2015 - September 30, 2019 Cost Evaluation period
($000s) (FY 2019)
A B C D E F G H
Project In Service Date Due Date Interest Rate Initial Principal Current Principal
Roll Maturity
Date
Rollover
Rate
493 Columbia Basin 09/1995 09/2045 7.860% 450 0494 Columbia Basin 09/1995 09/2045 7.860% 450 0495 Columbia Basin 09/1996 09/2026 7.150% 72 0496 Columbia Basin 09/1996 09/2031 7.150% 109 0497 Columbia Basin 09/1996 09/2031 7.150% 251 0498 Columbia Basin 09/1996 09/2046 7.150% 426 426499 Columbia Basin 09/1996 09/2046 7.150% 368 368500 Columbia Basin 09/1997 09/2047 7.150% 3,393 3,393501 Columbia Basin 09/2001 09/2051 5.875% 69,226 69,226502 Columbia Basin 09/2005 09/2055 5.125% 10,963 10,963503 Columbia Basin 09/2006 09/2056 4.500% 1,987 1,987504 Columbia Basin 09/2007 09/2057 5.000% 929 929505 Columbia Basin 09/2008 09/2058 4.875% 835 835506 Columbia Basin 09/2009 09/2059 4.375% 1,338 1,338507 Columbia Basin 09/2010 09/2060 4.250% 877 877508 Columbia Basin 09/2011 09/2061 3.750% 1,723 1,723509 Columbia Basin 09/2012 09/2062 3.375% 11 11510 Columbia Basin 09/2013 09/2063 2.875% 3,083 3,083511 Columbia Basin 09/2014 09/2064 3.875% 18 18512 Columbia Basin 09/2015 09/2065 3.250% 0 0513 Columbia Basin 3rd Powerhouse 09/1975 09/2025 7.160% 47,328 0514 Columbia Basin 3rd Powerhouse 09/1975 09/2025 7.160% 8,702 0515 Columbia Basin 3rd Powerhouse 09/1976 09/2026 7.150% 41,330 0516 Columbia Basin 3rd Powerhouse 09/1976 09/2026 7.150% 8,037 0517 Columbia Basin 3rd Powerhouse 09/1977 09/2027 7.150% 42,764 0518 Columbia Basin 3rd Powerhouse 09/1977 09/2027 7.150% 7,964 0519 Columbia Basin 3rd Powerhouse 09/1978 09/2028 7.150% 42,399 0520 Columbia Basin 3rd Powerhouse 09/1978 09/2028 7.150% 7,896 0521 Columbia Basin 3rd Powerhouse 09/1979 09/2029 7.150% 84,118 0522 Columbia Basin 3rd Powerhouse 09/1979 09/2029 7.150% 15,666 0523 Columbia Basin 3rd Powerhouse 09/1983 09/2033 7.150% 712 0524 Columbia Basin 3rd Powerhouse 09/1983 09/2033 7.150% 13,003 0525 Columbia Basin 3rd Powerhouse 09/1984 09/2033 7.150% 16,965 0526 Columbia Basin 3rd Powerhouse 09/1984 09/2033 7.150% 13,192 0527 Columbia Basin 3rd Powerhouse 09/1984 09/2033 7.150% 3,160 0528 Columbia Basin 3rd Powerhouse 09/1985 09/2033 7.150% 2,060 0529 Columbia Basin 3rd Powerhouse 09/1985 09/2033 7.150% 41,772 0530 Columbia Basin 3rd Powerhouse 09/1985 09/2033 7.150% 107 0531 Columbia Basin 3rd Powerhouse 09/1986 09/2033 7.150% 1,851 0532 Columbia Basin 3rd Powerhouse 09/1986 09/2033 7.150% 15,538 0533 Columbia Basin 3rd Powerhouse 09/1987 09/2033 7.150% 1,730 0534 Columbia Basin 3rd Powerhouse 09/1987 09/2033 7.150% 14,439 0535 Columbia Basin 3rd Powerhouse 09/1988 09/2033 7.150% 2,294 0536 Columbia Basin 3rd Powerhouse 09/1988 09/2033 7.150% 4,351 0537 Columbia Basin 3rd Powerhouse 09/1989 09/2033 7.150% 10,902 0538 Columbia Basin 3rd Powerhouse 09/1990 09/2033 7.150% 6,383 0539 Columbia Basin 3rd Powerhouse 09/1994 09/2044 7.150% 12,631 12,631540 Columbia River Fish Mitigation 09/1991 09/2041 8.500% 3,969 0541 Columbia River Fish Mitigation 09/1992 09/2042 8.500% 874 0542 Columbia River Fish Mitigation 09/1993 09/2043 8.500% 85,846 0543 Columbia River Fish Mitigation 09/1994 09/2044 8.500% 39,454 0544 Columbia River Fish Mitigation 09/1995 09/2045 7.150% 43,343 39,282545 Columbia River Fish Mitigation 09/1996 09/2046 7.150% 2,431 2,431546 Columbia River Fish Mitigation 09/1999 09/2049 5.375% 14,115 14,115547 Columbia River Fish Mitigation 09/2000 09/2050 6.125% 47,006 47,006548 Columbia River Fish Mitigation 09/2001 09/2051 5.875% 6,168 6,168549 Columbia River Fish Mitigation 09/2002 09/2052 5.500% 8,797 8,797550 Columbia River Fish Mitigation 09/2003 09/2053 5.125% 68,440 68,440551 Columbia River Fish Mitigation 09/2004 09/2054 5.375% 60,581 60,581552 Columbia River Fish Mitigation 09/2005 09/2055 5.125% 52,039 52,039553 Columbia River Fish Mitigation 09/2006 09/2056 4.500% 366,395 366,395554 Columbia River Fish Mitigation 09/2007 09/2057 5.000% 53,525 53,525555 Columbia River Fish Mitigation 09/2008 09/2058 4.875% 36,554 36,554556 Columbia River Fish Mitigation 09/2009 09/2059 4.375% 103,203 103,203557 Columbia River Fish Mitigation 09/2010 09/2060 4.250% 56,832 56,832558 Columbia River Fish Mitigation 09/2011 09/2061 3.750% 106,014 106,014559 Columbia River Fish Mitigation 09/2012 09/2062 3.375% 101,616 101,616560 Columbia River Fish Mitigation 09/2013 09/2063 2.875% 95,274 95,274561 Columbia River Fish Mitigation 09/2014 09/2064 3.875% 110,071 110,071562 Columbia River Fish Mitigation 09/2015 09/2065 3.250% 64,291 64,291563 Columbia River Fish Mitigation 09/2016 09/2066 3.000% 30,190 30,190564 Cougar 09/1964 09/2014 7.230% 10,414 0565 Cougar 09/1965 09/2014 7.230% 20 0566 Cougar 09/1966 09/2014 7.230% 20 0567 Cougar 09/1967 09/2014 7.230% 20 0568 Cougar 09/1968 09/2014 7.230% 20 0569 Cougar 09/1969 09/2014 7.230% 20 0570 Cougar 09/1970 09/2014 7.230% 20 0571 Cougar 09/1971 09/2014 7.230% 20 0572 Cougar 09/1972 09/2014 7.230% 20 0573 Cougar 09/1973 09/2014 7.230% 20 0574 Cougar 09/1974 09/2014 7.230% 19 0
BP-18-FS-BPA-02A Page 136

TABLE 12A:
HISTORICAL INVESTMENTS
October 1, 2015 - September 30, 2019 Cost Evaluation period
($000s) (FY 2019)
A B C D E F G H
Project In Service Date Due Date Interest Rate Initial Principal Current Principal
Roll Maturity
Date
Rollover
Rate
575 Cougar 09/1975 09/2014 7.230% 20 0576 Cougar 09/1976 09/2014 7.230% 20 0577 Cougar 09/1977 09/2014 7.230% 20 0578 Cougar 09/1978 09/2014 7.230% 20 0579 Cougar 09/1979 09/2014 7.230% 20 0580 Cougar 09/1980 09/2014 7.230% 20 0581 Cougar 09/1981 09/2014 7.230% 20 0582 Cougar 09/1982 09/2014 7.230% 20 0583 Cougar 09/1983 09/2014 7.230% 20 0584 Cougar 09/1984 09/2014 10.750% 1 0585 Cougar 09/1985 09/2014 7.230% 1 0586 Cougar 09/1986 09/2014 7.230% 104 0587 Cougar 09/1986 09/2014 11.375% 55 0588 Cougar 09/1987 09/2014 7.230% 45 0589 Cougar 09/1988 09/2014 8.500% 2 0590 Cougar 09/1989 09/2014 9.250% 6 0591 Cougar 09/1990 09/2014 8.875% 10 0592 Cougar 09/1991 09/2014 8.750% 1,015 0593 Cougar 09/1991 09/2014 8.750% 1 0594 Cougar 09/1992 09/2014 8.500% 2 0595 Cougar 09/1993 09/2014 7.875% 539 0596 Cougar 09/1994 09/2019 7.125% 31 0597 Cougar 09/1995 09/2000 7.330% 3 0598 Cougar 09/1997 09/2047 7.150% 26 26599 Cougar 09/2004 09/2054 5.375% 3,622 3,622600 Cougar 09/2005 09/2055 5.125% 8,130 8,130601 Cougar 09/2006 09/2056 4.500% 109 109602 Cougar 09/2007 09/2057 5.000% 120 120603 Cougar 09/2009 09/2059 4.375% 121 121604 Cougar 09/2010 09/2060 4.250% 59 59605 Cougar 09/2011 09/2061 3.750% 282 282606 Cougar 09/2012 09/2062 3.375% 139 139607 Cougar 09/2013 09/2063 2.875% 4,088 4,088608 Cougar 09/2014 09/2064 3.875% 12 12609 Cougar 09/2016 09/2066 3.000% 2 2610 Detroit Lake/Big Cliff 09/1953 09/2003 6.840% 12,533 0611 Detroit Lake/Big Cliff 09/1954 09/2004 6.880% 20,162 0612 Detroit Lake/Big Cliff 09/1955 09/2004 6.880% 18 0613 Detroit Lake/Big Cliff 09/1956 09/2004 6.880% 19 0614 Detroit Lake/Big Cliff 09/1957 09/2004 6.880% 18 0615 Detroit Lake/Big Cliff 09/1958 09/2004 6.880% 19 0616 Detroit Lake/Big Cliff 09/1959 09/2004 6.880% 18 0617 Detroit Lake/Big Cliff 09/1960 09/2004 6.880% 19 0618 Detroit Lake/Big Cliff 09/1961 09/2004 6.880% 18 0619 Detroit Lake/Big Cliff 09/1962 09/2004 6.880% 19 0620 Detroit Lake/Big Cliff 09/1963 09/2004 6.880% 18 0621 Detroit Lake/Big Cliff 09/1964 09/2004 6.880% 19 0622 Detroit Lake/Big Cliff 09/1965 09/2004 6.880% 18 0623 Detroit Lake/Big Cliff 09/1966 09/2004 6.880% 19 0624 Detroit Lake/Big Cliff 09/1967 09/2004 6.880% 18 0625 Detroit Lake/Big Cliff 09/1968 09/2004 6.880% 19 0626 Detroit Lake/Big Cliff 09/1969 09/2004 6.880% 18 0627 Detroit Lake/Big Cliff 09/1970 09/2004 6.880% 19 0628 Detroit Lake/Big Cliff 09/1971 09/2004 6.880% 18 0629 Detroit Lake/Big Cliff 09/1972 09/2004 6.880% 19 0630 Detroit Lake/Big Cliff 09/1973 09/2004 6.880% 18 0631 Detroit Lake/Big Cliff 09/1974 09/2004 6.880% 19 0632 Detroit Lake/Big Cliff 09/1975 09/2004 6.880% 18 0633 Detroit Lake/Big Cliff 09/1976 09/2004 6.880% 19 0634 Detroit Lake/Big Cliff 09/1977 09/2004 6.880% 18 0635 Detroit Lake/Big Cliff 09/1978 09/2004 6.880% 19 0636 Detroit Lake/Big Cliff 09/1979 09/2004 6.880% 18 0637 Detroit Lake/Big Cliff 09/1980 09/2004 6.880% 19 0638 Detroit Lake/Big Cliff 09/1981 09/2004 6.880% 18 0639 Detroit Lake/Big Cliff 09/1982 09/2004 6.880% 19 0640 Detroit Lake/Big Cliff 09/1983 09/2004 6.880% 18 0641 Detroit Lake/Big Cliff 09/1984 09/2004 10.750% 21 0642 Detroit Lake/Big Cliff 09/1985 09/2004 6.880% 6 0643 Detroit Lake/Big Cliff 09/1986 09/2004 11.375% 38 0644 Detroit Lake/Big Cliff 09/1987 09/2004 6.880% 3 0645 Detroit Lake/Big Cliff 09/1987 09/2004 8.875% 233 0646 Detroit Lake/Big Cliff 09/1988 09/2004 8.500% 68 0647 Detroit Lake/Big Cliff 09/1989 09/2004 9.250% 26 0648 Detroit Lake/Big Cliff 09/1990 09/2004 8.875% 115 0649 Detroit Lake/Big Cliff 09/1991 09/2004 8.750% 9 0650 Detroit Lake/Big Cliff 09/1991 09/2004 8.750% 20 0651 Detroit Lake/Big Cliff 09/1992 09/2004 8.500% 8 0652 Detroit Lake/Big Cliff 09/1993 09/2004 7.875% 211 0653 Detroit Lake/Big Cliff 09/1994 09/1999 7.125% 7 0654 Detroit Lake/Big Cliff 09/1995 09/2000 7.330% 13 0655 Detroit Lake/Big Cliff 09/1995 09/2045 7.150% 38 38656 Detroit Lake/Big Cliff 09/1996 09/2006 6.950% 24 0
BP-18-FS-BPA-02A Page 137
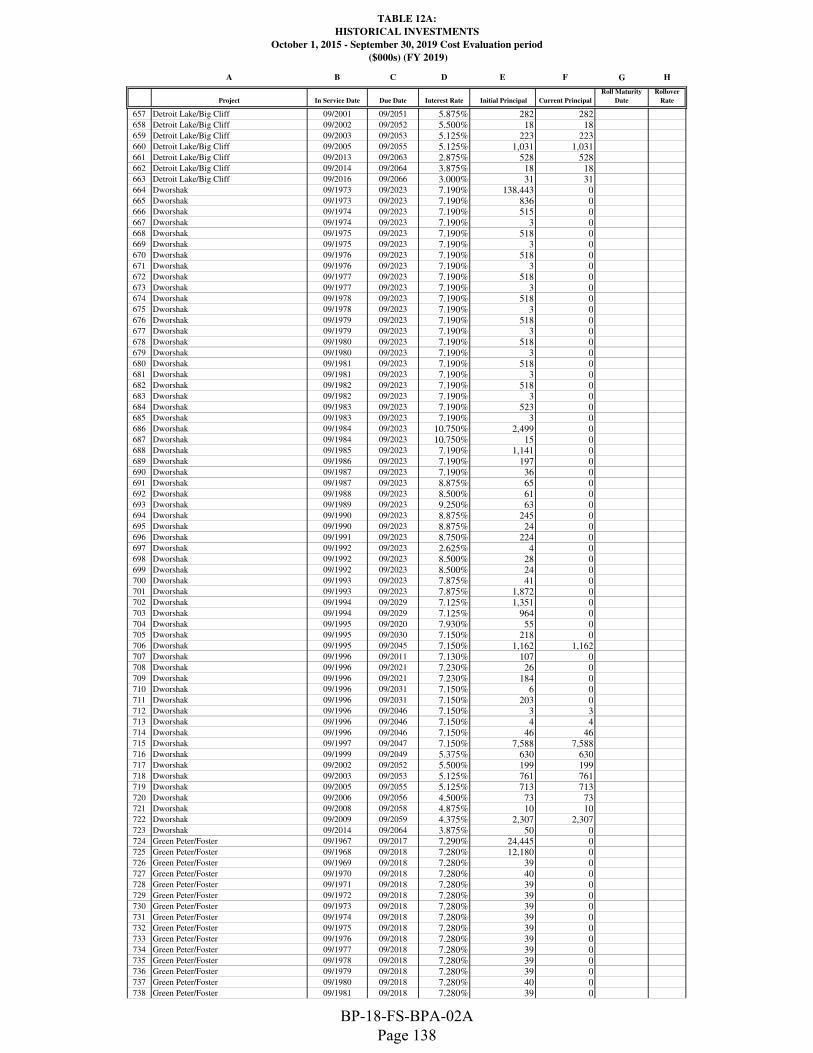
TABLE 12A:
HISTORICAL INVESTMENTS
October 1, 2015 - September 30, 2019 Cost Evaluation period
($000s) (FY 2019)
A B C D E F G H
Project In Service Date Due Date Interest Rate Initial Principal Current Principal
Roll Maturity
Date
Rollover
Rate
657 Detroit Lake/Big Cliff 09/2001 09/2051 5.875% 282 282658 Detroit Lake/Big Cliff 09/2002 09/2052 5.500% 18 18659 Detroit Lake/Big Cliff 09/2003 09/2053 5.125% 223 223660 Detroit Lake/Big Cliff 09/2005 09/2055 5.125% 1,031 1,031661 Detroit Lake/Big Cliff 09/2013 09/2063 2.875% 528 528662 Detroit Lake/Big Cliff 09/2014 09/2064 3.875% 18 18663 Detroit Lake/Big Cliff 09/2016 09/2066 3.000% 31 31664 Dworshak 09/1973 09/2023 7.190% 138,443 0665 Dworshak 09/1973 09/2023 7.190% 836 0666 Dworshak 09/1974 09/2023 7.190% 515 0667 Dworshak 09/1974 09/2023 7.190% 3 0668 Dworshak 09/1975 09/2023 7.190% 518 0669 Dworshak 09/1975 09/2023 7.190% 3 0670 Dworshak 09/1976 09/2023 7.190% 518 0671 Dworshak 09/1976 09/2023 7.190% 3 0672 Dworshak 09/1977 09/2023 7.190% 518 0673 Dworshak 09/1977 09/2023 7.190% 3 0674 Dworshak 09/1978 09/2023 7.190% 518 0675 Dworshak 09/1978 09/2023 7.190% 3 0676 Dworshak 09/1979 09/2023 7.190% 518 0677 Dworshak 09/1979 09/2023 7.190% 3 0678 Dworshak 09/1980 09/2023 7.190% 518 0679 Dworshak 09/1980 09/2023 7.190% 3 0680 Dworshak 09/1981 09/2023 7.190% 518 0681 Dworshak 09/1981 09/2023 7.190% 3 0682 Dworshak 09/1982 09/2023 7.190% 518 0683 Dworshak 09/1982 09/2023 7.190% 3 0684 Dworshak 09/1983 09/2023 7.190% 523 0685 Dworshak 09/1983 09/2023 7.190% 3 0686 Dworshak 09/1984 09/2023 10.750% 2,499 0687 Dworshak 09/1984 09/2023 10.750% 15 0688 Dworshak 09/1985 09/2023 7.190% 1,141 0689 Dworshak 09/1986 09/2023 7.190% 197 0690 Dworshak 09/1987 09/2023 7.190% 36 0691 Dworshak 09/1987 09/2023 8.875% 65 0692 Dworshak 09/1988 09/2023 8.500% 61 0693 Dworshak 09/1989 09/2023 9.250% 63 0694 Dworshak 09/1990 09/2023 8.875% 245 0695 Dworshak 09/1990 09/2023 8.875% 24 0696 Dworshak 09/1991 09/2023 8.750% 224 0697 Dworshak 09/1992 09/2023 2.625% 4 0698 Dworshak 09/1992 09/2023 8.500% 28 0699 Dworshak 09/1992 09/2023 8.500% 24 0700 Dworshak 09/1993 09/2023 7.875% 41 0701 Dworshak 09/1993 09/2023 7.875% 1,872 0702 Dworshak 09/1994 09/2029 7.125% 1,351 0703 Dworshak 09/1994 09/2029 7.125% 964 0704 Dworshak 09/1995 09/2020 7.930% 55 0705 Dworshak 09/1995 09/2030 7.150% 218 0706 Dworshak 09/1995 09/2045 7.150% 1,162 1,162707 Dworshak 09/1996 09/2011 7.130% 107 0708 Dworshak 09/1996 09/2021 7.230% 26 0709 Dworshak 09/1996 09/2021 7.230% 184 0710 Dworshak 09/1996 09/2031 7.150% 6 0711 Dworshak 09/1996 09/2031 7.150% 203 0712 Dworshak 09/1996 09/2046 7.150% 3 3713 Dworshak 09/1996 09/2046 7.150% 4 4714 Dworshak 09/1996 09/2046 7.150% 46 46715 Dworshak 09/1997 09/2047 7.150% 7,588 7,588716 Dworshak 09/1999 09/2049 5.375% 630 630717 Dworshak 09/2002 09/2052 5.500% 199 199718 Dworshak 09/2003 09/2053 5.125% 761 761719 Dworshak 09/2005 09/2055 5.125% 713 713720 Dworshak 09/2006 09/2056 4.500% 73 73721 Dworshak 09/2008 09/2058 4.875% 10 10722 Dworshak 09/2009 09/2059 4.375% 2,307 2,307723 Dworshak 09/2014 09/2064 3.875% 50 0724 Green Peter/Foster 09/1967 09/2017 7.290% 24,445 0725 Green Peter/Foster 09/1968 09/2018 7.280% 12,180 0726 Green Peter/Foster 09/1969 09/2018 7.280% 39 0727 Green Peter/Foster 09/1970 09/2018 7.280% 40 0728 Green Peter/Foster 09/1971 09/2018 7.280% 39 0729 Green Peter/Foster 09/1972 09/2018 7.280% 39 0730 Green Peter/Foster 09/1973 09/2018 7.280% 39 0731 Green Peter/Foster 09/1974 09/2018 7.280% 39 0732 Green Peter/Foster 09/1975 09/2018 7.280% 39 0733 Green Peter/Foster 09/1976 09/2018 7.280% 39 0734 Green Peter/Foster 09/1977 09/2018 7.280% 39 0735 Green Peter/Foster 09/1978 09/2018 7.280% 39 0736 Green Peter/Foster 09/1979 09/2018 7.280% 39 0737 Green Peter/Foster 09/1980 09/2018 7.280% 40 0738 Green Peter/Foster 09/1981 09/2018 7.280% 39 0
BP-18-FS-BPA-02A Page 138

TABLE 12A:
HISTORICAL INVESTMENTS
October 1, 2015 - September 30, 2019 Cost Evaluation period
($000s) (FY 2019)
A B C D E F G H
Project In Service Date Due Date Interest Rate Initial Principal Current Principal
Roll Maturity
Date
Rollover
Rate
739 Green Peter/Foster 09/1982 09/2018 7.280% 39 0740 Green Peter/Foster 09/1983 09/2018 7.280% 39 0741 Green Peter/Foster 09/1984 09/2018 10.750% 15 0742 Green Peter/Foster 09/1985 09/2018 7.280% 16 0743 Green Peter/Foster 09/1986 09/2018 7.280% 3 0744 Green Peter/Foster 09/1986 09/2018 11.375% 3 0745 Green Peter/Foster 09/1987 09/2018 7.280% 1 0746 Green Peter/Foster 09/1987 09/2018 8.875% 2 0747 Green Peter/Foster 09/1988 09/2018 8.500% 13 0748 Green Peter/Foster 09/1989 09/2018 9.250% 24 0749 Green Peter/Foster 09/1990 09/2018 8.875% 5 0750 Green Peter/Foster 09/1991 09/2018 8.750% 48 0751 Green Peter/Foster 09/1992 09/2018 8.500% 2 0752 Green Peter/Foster 09/1993 09/2018 7.875% 41 0753 Green Peter/Foster 09/1994 09/1999 7.125% 6 0754 Green Peter/Foster 09/1995 09/2000 7.330% 4 0755 Green Peter/Foster 09/1995 09/2020 7.250% 11 0756 Green Peter/Foster 09/1995 09/2020 7.250% 24 0757 Green Peter/Foster 09/1996 09/2046 7.150% 26 26758 Green Peter/Foster 09/2001 09/2051 5.875% 200 200759 Green Peter/Foster 09/2011 09/2061 3.750% 87 87760 Green Peter/Foster 09/2012 09/2062 3.375% 28 28761 Green Peter/Foster 09/2014 09/2064 3.875% 385 385762 Green Peter/Foster 09/2015 09/2065 3.250% 68 68763 Green Peter/Foster 09/2016 09/2066 3.000% 70 70764 Hills Creek 09/1962 09/2012 7.160% 10,353 0765 Hills Creek 09/1963 09/2012 7.160% 12 0766 Hills Creek 09/1964 09/2012 7.160% 13 0767 Hills Creek 09/1965 09/2012 7.160% 13 0768 Hills Creek 09/1966 09/2012 7.160% 13 0769 Hills Creek 09/1967 09/2012 7.160% 13 0770 Hills Creek 09/1968 09/2012 7.160% 13 0771 Hills Creek 09/1969 09/2012 7.160% 13 0772 Hills Creek 09/1970 09/2012 7.160% 13 0773 Hills Creek 09/1971 09/2012 7.160% 13 0774 Hills Creek 09/1972 09/2012 7.160% 13 0775 Hills Creek 09/1973 09/2012 7.160% 13 0776 Hills Creek 09/1974 09/2012 7.160% 13 0777 Hills Creek 09/1975 09/2012 7.160% 13 0778 Hills Creek 09/1976 09/2012 7.160% 13 0779 Hills Creek 09/1977 09/2012 7.160% 13 0780 Hills Creek 09/1978 09/2012 7.160% 13 0781 Hills Creek 09/1979 09/2012 7.160% 13 0782 Hills Creek 09/1980 09/2012 7.160% 13 0783 Hills Creek 09/1981 09/2012 7.160% 13 0784 Hills Creek 09/1982 09/2012 7.160% 13 0785 Hills Creek 09/1983 09/2012 7.160% 13 0786 Hills Creek 09/1984 09/2012 10.750% 52 0787 Hills Creek 09/1985 09/2012 7.160% 6 0788 Hills Creek 09/1987 09/2012 8.875% 3 0789 Hills Creek 09/1988 09/2012 8.500% 3 0790 Hills Creek 09/1990 09/2012 8.875% 3 0791 Hills Creek 09/1991 09/2012 8.750% 17 0792 Hills Creek 09/1992 09/2012 8.500% 1 0793 Hills Creek 09/1993 09/2012 7.875% 13 0794 Hills Creek 09/1996 09/2046 7.150% 28 28795 Hills Creek 09/2000 09/2050 6.125% 2,630 2,630796 Hills Creek 09/2001 09/2051 5.875% 8 8797 Hills Creek 09/2002 09/2052 5.500% 2 2798 Hills Creek 09/2005 09/2055 5.125% 46 46799 Hills Creek 09/2011 09/2061 3.750% 12 12800 Hills Creek 09/2012 09/2062 3.375% 142 142801 Hungry Horse Dam 09/1953 09/2003 6.840% 75,076 0802 Hungry Horse Dam 09/1953 09/2003 6.840% 2,126 0803 Hungry Horse Dam 09/1954 09/2003 6.840% 17 0804 Hungry Horse Dam 09/1954 09/2003 6.840% 1 0805 Hungry Horse Dam 09/1955 09/2003 6.840% 17 0806 Hungry Horse Dam 09/1955 09/2003 6.840% 1 0807 Hungry Horse Dam 09/1956 09/2003 6.840% 17 0808 Hungry Horse Dam 09/1956 09/2003 6.840% 1 0809 Hungry Horse Dam 09/1957 09/2003 6.840% 18 0810 Hungry Horse Dam 09/1957 09/2003 6.840% 1 0811 Hungry Horse Dam 09/1958 09/2003 6.840% 18 0812 Hungry Horse Dam 09/1958 09/2003 6.840% 1 0813 Hungry Horse Dam 09/1959 09/2003 6.840% 18 0814 Hungry Horse Dam 09/1959 09/2003 6.840% 1 0815 Hungry Horse Dam 09/1960 09/2003 6.840% 18 0816 Hungry Horse Dam 09/1960 09/2003 6.840% 1 0817 Hungry Horse Dam 09/1961 09/2003 6.840% 18 0818 Hungry Horse Dam 09/1961 09/2003 6.840% 1 0819 Hungry Horse Dam 09/1962 09/2003 6.840% 18 0820 Hungry Horse Dam 09/1962 09/2003 6.840% 1 0
BP-18-FS-BPA-02A Page 139
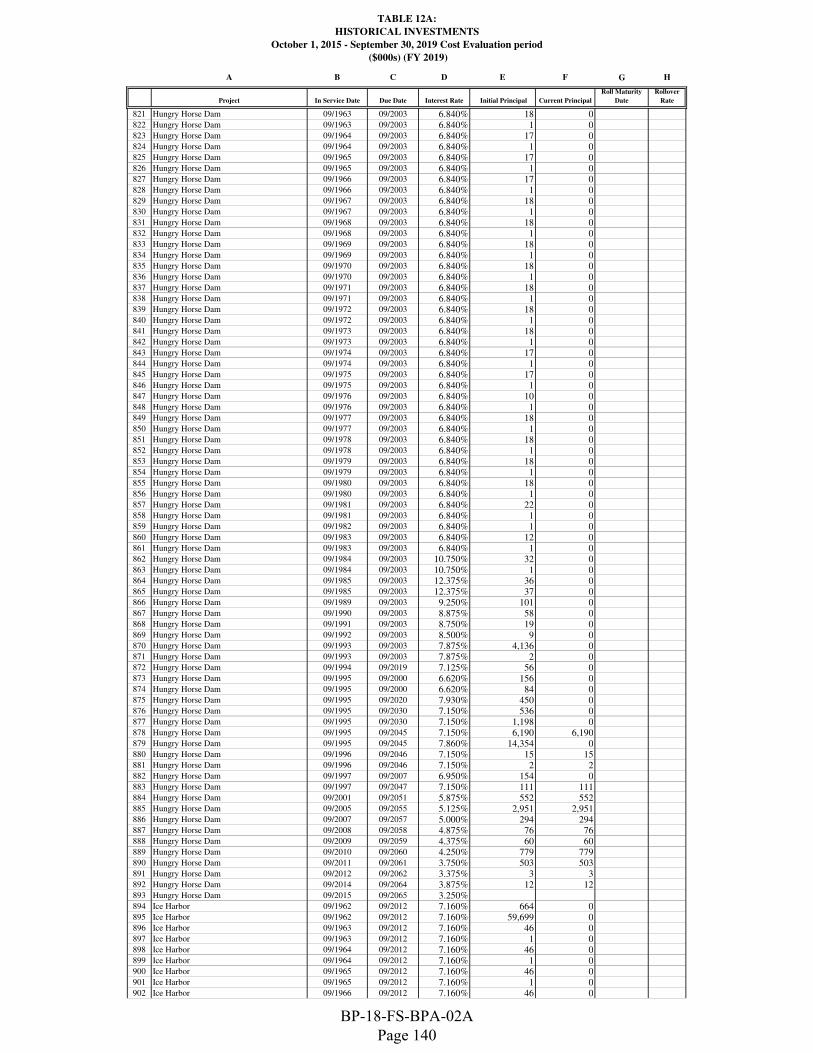
TABLE 12A:
HISTORICAL INVESTMENTS
October 1, 2015 - September 30, 2019 Cost Evaluation period
($000s) (FY 2019)
A B C D E F G H
Project In Service Date Due Date Interest Rate Initial Principal Current Principal
Roll Maturity
Date
Rollover
Rate
821 Hungry Horse Dam 09/1963 09/2003 6.840% 18 0822 Hungry Horse Dam 09/1963 09/2003 6.840% 1 0823 Hungry Horse Dam 09/1964 09/2003 6.840% 17 0824 Hungry Horse Dam 09/1964 09/2003 6.840% 1 0825 Hungry Horse Dam 09/1965 09/2003 6.840% 17 0826 Hungry Horse Dam 09/1965 09/2003 6.840% 1 0827 Hungry Horse Dam 09/1966 09/2003 6.840% 17 0828 Hungry Horse Dam 09/1966 09/2003 6.840% 1 0829 Hungry Horse Dam 09/1967 09/2003 6.840% 18 0830 Hungry Horse Dam 09/1967 09/2003 6.840% 1 0831 Hungry Horse Dam 09/1968 09/2003 6.840% 18 0832 Hungry Horse Dam 09/1968 09/2003 6.840% 1 0833 Hungry Horse Dam 09/1969 09/2003 6.840% 18 0834 Hungry Horse Dam 09/1969 09/2003 6.840% 1 0835 Hungry Horse Dam 09/1970 09/2003 6.840% 18 0836 Hungry Horse Dam 09/1970 09/2003 6.840% 1 0837 Hungry Horse Dam 09/1971 09/2003 6.840% 18 0838 Hungry Horse Dam 09/1971 09/2003 6.840% 1 0839 Hungry Horse Dam 09/1972 09/2003 6.840% 18 0840 Hungry Horse Dam 09/1972 09/2003 6.840% 1 0841 Hungry Horse Dam 09/1973 09/2003 6.840% 18 0842 Hungry Horse Dam 09/1973 09/2003 6.840% 1 0843 Hungry Horse Dam 09/1974 09/2003 6.840% 17 0844 Hungry Horse Dam 09/1974 09/2003 6.840% 1 0845 Hungry Horse Dam 09/1975 09/2003 6.840% 17 0846 Hungry Horse Dam 09/1975 09/2003 6.840% 1 0847 Hungry Horse Dam 09/1976 09/2003 6.840% 10 0848 Hungry Horse Dam 09/1976 09/2003 6.840% 1 0849 Hungry Horse Dam 09/1977 09/2003 6.840% 18 0850 Hungry Horse Dam 09/1977 09/2003 6.840% 1 0851 Hungry Horse Dam 09/1978 09/2003 6.840% 18 0852 Hungry Horse Dam 09/1978 09/2003 6.840% 1 0853 Hungry Horse Dam 09/1979 09/2003 6.840% 18 0854 Hungry Horse Dam 09/1979 09/2003 6.840% 1 0855 Hungry Horse Dam 09/1980 09/2003 6.840% 18 0856 Hungry Horse Dam 09/1980 09/2003 6.840% 1 0857 Hungry Horse Dam 09/1981 09/2003 6.840% 22 0858 Hungry Horse Dam 09/1981 09/2003 6.840% 1 0859 Hungry Horse Dam 09/1982 09/2003 6.840% 1 0860 Hungry Horse Dam 09/1983 09/2003 6.840% 12 0861 Hungry Horse Dam 09/1983 09/2003 6.840% 1 0862 Hungry Horse Dam 09/1984 09/2003 10.750% 32 0863 Hungry Horse Dam 09/1984 09/2003 10.750% 1 0864 Hungry Horse Dam 09/1985 09/2003 12.375% 36 0865 Hungry Horse Dam 09/1985 09/2003 12.375% 37 0866 Hungry Horse Dam 09/1989 09/2003 9.250% 101 0867 Hungry Horse Dam 09/1990 09/2003 8.875% 58 0868 Hungry Horse Dam 09/1991 09/2003 8.750% 19 0869 Hungry Horse Dam 09/1992 09/2003 8.500% 9 0870 Hungry Horse Dam 09/1993 09/2003 7.875% 4,136 0871 Hungry Horse Dam 09/1993 09/2003 7.875% 2 0872 Hungry Horse Dam 09/1994 09/2019 7.125% 56 0873 Hungry Horse Dam 09/1995 09/2000 6.620% 156 0874 Hungry Horse Dam 09/1995 09/2000 6.620% 84 0875 Hungry Horse Dam 09/1995 09/2020 7.930% 450 0876 Hungry Horse Dam 09/1995 09/2030 7.150% 536 0877 Hungry Horse Dam 09/1995 09/2030 7.150% 1,198 0878 Hungry Horse Dam 09/1995 09/2045 7.150% 6,190 6,190879 Hungry Horse Dam 09/1995 09/2045 7.860% 14,354 0880 Hungry Horse Dam 09/1996 09/2046 7.150% 15 15881 Hungry Horse Dam 09/1996 09/2046 7.150% 2 2882 Hungry Horse Dam 09/1997 09/2007 6.950% 154 0883 Hungry Horse Dam 09/1997 09/2047 7.150% 111 111884 Hungry Horse Dam 09/2001 09/2051 5.875% 552 552885 Hungry Horse Dam 09/2005 09/2055 5.125% 2,951 2,951886 Hungry Horse Dam 09/2007 09/2057 5.000% 294 294887 Hungry Horse Dam 09/2008 09/2058 4.875% 76 76888 Hungry Horse Dam 09/2009 09/2059 4.375% 60 60889 Hungry Horse Dam 09/2010 09/2060 4.250% 779 779890 Hungry Horse Dam 09/2011 09/2061 3.750% 503 503891 Hungry Horse Dam 09/2012 09/2062 3.375% 3 3892 Hungry Horse Dam 09/2014 09/2064 3.875% 12 12893 Hungry Horse Dam 09/2015 09/2065 3.250%894 Ice Harbor 09/1962 09/2012 7.160% 664 0895 Ice Harbor 09/1962 09/2012 7.160% 59,699 0896 Ice Harbor 09/1963 09/2012 7.160% 46 0897 Ice Harbor 09/1963 09/2012 7.160% 1 0898 Ice Harbor 09/1964 09/2012 7.160% 46 0899 Ice Harbor 09/1964 09/2012 7.160% 1 0900 Ice Harbor 09/1965 09/2012 7.160% 46 0901 Ice Harbor 09/1965 09/2012 7.160% 1 0902 Ice Harbor 09/1966 09/2012 7.160% 46 0
BP-18-FS-BPA-02A Page 140

TABLE 12A:
HISTORICAL INVESTMENTS
October 1, 2015 - September 30, 2019 Cost Evaluation period
($000s) (FY 2019)
A B C D E F G H
Project In Service Date Due Date Interest Rate Initial Principal Current Principal
Roll Maturity
Date
Rollover
Rate
903 Ice Harbor 09/1966 09/2012 7.160% 1 0904 Ice Harbor 09/1967 09/2012 7.160% 46 0905 Ice Harbor 09/1967 09/2012 7.160% 1 0906 Ice Harbor 09/1968 09/2012 7.160% 46 0907 Ice Harbor 09/1968 09/2012 7.160% 1 0908 Ice Harbor 09/1969 09/2012 7.160% 46 0909 Ice Harbor 09/1969 09/2012 7.160% 1 0910 Ice Harbor 09/1970 09/2012 7.160% 46 0911 Ice Harbor 09/1970 09/2012 7.160% 1 0912 Ice Harbor 09/1971 09/2012 7.160% 46 0913 Ice Harbor 09/1971 09/2012 7.160% 1 0914 Ice Harbor 09/1972 09/2012 7.160% 46 0915 Ice Harbor 09/1972 09/2012 7.160% 1 0916 Ice Harbor 09/1973 09/2012 7.160% 46 0917 Ice Harbor 09/1973 09/2012 7.160% 1 0918 Ice Harbor 09/1974 09/2012 7.160% 46 0919 Ice Harbor 09/1974 09/2012 7.160% 1 0920 Ice Harbor 09/1975 09/2012 7.160% 46 0921 Ice Harbor 09/1975 09/2012 7.160% 1 0922 Ice Harbor 09/1976 09/2012 7.160% 46 0923 Ice Harbor 09/1976 09/2012 7.160% 1 0924 Ice Harbor 09/1976 09/2026 7.150% 20,472 0925 Ice Harbor 09/1976 09/2026 7.150% 228 0926 Ice Harbor 09/1977 09/2012 7.160% 46 0927 Ice Harbor 09/1977 09/2012 7.160% 1 0928 Ice Harbor 09/1978 09/2012 7.160% 46 0929 Ice Harbor 09/1978 09/2012 7.160% 1 0930 Ice Harbor 09/1979 09/2012 7.160% 46 0931 Ice Harbor 09/1979 09/2012 7.160% 1 0932 Ice Harbor 09/1980 09/2012 7.160% 46 0933 Ice Harbor 09/1980 09/2012 7.160% 1 0934 Ice Harbor 09/1981 09/2012 7.160% 46 0935 Ice Harbor 09/1981 09/2012 7.160% 1 0936 Ice Harbor 09/1982 09/2012 7.160% 46 0937 Ice Harbor 09/1982 09/2012 7.160% 1 0938 Ice Harbor 09/1983 09/2012 7.160% 46 0939 Ice Harbor 09/1983 09/2012 7.160% 1 0940 Ice Harbor 09/1985 09/2012 7.160% 41 0941 Ice Harbor 09/1985 09/2026 7.150% 21 0942 Ice Harbor 09/1986 09/2012 7.160% 137 0943 Ice Harbor 09/1987 09/2012 7.160% 3 0944 Ice Harbor 09/1987 09/2012 8.875% 71 0945 Ice Harbor 09/1987 09/2012 8.875% 1 0946 Ice Harbor 09/1988 09/2012 8.500% 8 0947 Ice Harbor 09/1988 09/2012 8.500% 57 0948 Ice Harbor 09/1989 09/2012 9.250% 51 0949 Ice Harbor 09/1990 09/2012 8.875% 427 0950 Ice Harbor 09/1991 09/2012 8.750% 348 0951 Ice Harbor 09/1992 09/2012 8.500% 177 0952 Ice Harbor 09/1993 09/2012 7.875% 3,192 0953 Ice Harbor 09/1993 09/2012 7.875% 1,645 0954 Ice Harbor 09/1994 09/2029 7.125% 328 0955 Ice Harbor 09/1994 09/2029 7.125% 520 0956 Ice Harbor 09/1995 09/2000 7.330% 2 0957 Ice Harbor 09/1995 09/2019 7.270% 84 0958 Ice Harbor 09/1995 09/2019 7.270% 171 0959 Ice Harbor 09/1995 09/2019 7.270% 849 0960 Ice Harbor 09/1996 09/2031 7.150% 78 0961 Ice Harbor 09/1996 09/2041 7.150% 371 371962 Ice Harbor 09/1997 09/2022 7.230% 66 0963 Ice Harbor 09/1997 09/2047 7.150% 67 67964 Ice Harbor 09/1999 09/2049 5.375% 5,516 5,516965 Ice Harbor 09/2000 09/2050 6.125% 548 548966 Ice Harbor 09/2001 09/2051 5.875% 764 764967 Ice Harbor 09/2002 09/2052 5.500% 1,014 1,014968 Ice Harbor 09/2003 09/2053 5.125% 50 50969 Ice Harbor 09/2004 09/2054 5.375% 3,321 3,321970 Ice Harbor 09/2008 09/2058 4.875% 14 14971 Ice Harbor 09/2009 09/2059 4.375% 2,615 2,615972 Ice Harbor 09/2010 09/2060 4.250% 207 207973 Ice Harbor 09/2011 09/2061 3.750% 819 819974 Ice Harbor 09/2012 09/2062 3.375% 115 115975 Ice Harbor 09/2015 09/2065 3.250% 3,175 3,175976 Ice Harbor 09/2016 09/2066 3.000% 558 558977 John Day 09/1968 09/2018 7.280% 27,254 0978 John Day 09/1969 09/2019 7.270% 96,104 0979 John Day 09/1970 09/2020 7.250% 23,656 0980 John Day 09/1971 09/2021 7.230% 34,974 0981 John Day 09/1972 09/2022 7.210% 11,502 0982 John Day 09/1984 09/2022 10.750% 3,677 0983 John Day 09/1985 09/2022 7.210% 6,490 0984 John Day 09/1985 09/2022 12.375% 1,209 0
BP-18-FS-BPA-02A Page 141

TABLE 12A:
HISTORICAL INVESTMENTS
October 1, 2015 - September 30, 2019 Cost Evaluation period
($000s) (FY 2019)
A B C D E F G H
Project In Service Date Due Date Interest Rate Initial Principal Current Principal
Roll Maturity
Date
Rollover
Rate
985 John Day 09/1986 09/2022 7.210% 3,227 0986 John Day 09/1986 09/2022 11.375% 713 0987 John Day 09/1987 09/2022 7.210% 706 0988 John Day 09/1987 09/2022 8.875% 4,353 0989 John Day 09/1988 09/2022 8.500% 332 0990 John Day 09/1988 09/2022 8.500% 199 0991 John Day 09/1989 09/2022 7.210% 30 0992 John Day 09/1989 09/2022 9.250% 377 0993 John Day 09/1990 09/2022 7.210% 37 0994 John Day 09/1990 09/2022 8.875% 543 0995 John Day 09/1991 09/2022 8.750% 13,218 0996 John Day 09/1991 09/2022 8.750% 144 0997 John Day 09/1992 09/2022 7.210% 19 0998 John Day 09/1992 09/2022 8.500% 95 0999 John Day 09/1993 09/2022 7.875% 7,810 01000 John Day 09/1993 09/2022 7.875% 9,585 01001 John Day 09/1994 09/2019 7.125% 14 01002 John Day 09/1994 09/2029 7.125% 1,252 01003 John Day 09/1995 09/2000 7.330% 2 01004 John Day 09/1995 09/2000 7.330% 9 01005 John Day 09/1995 09/2020 7.250% 79 01006 John Day 09/1995 09/2035 7.150% 22 221007 John Day 09/1995 09/2035 7.150% 52 521008 John Day 09/1995 09/2035 7.150% 121 1211009 John Day 09/1995 09/2045 7.150% 37 371010 John Day 09/1995 09/2045 7.150% 608 6081011 John Day 09/1995 09/2045 7.150% 7,653 7,6531012 John Day 09/1996 09/2011 7.130% 237 01013 John Day 09/1996 09/2016 7.290% 1,072 01014 John Day 09/1997 09/2022 7.230% 133 01015 John Day 09/1997 09/2047 7.150% 179 1791016 John Day 09/1999 09/2049 5.375% 3,510 3,5101017 John Day 09/2000 09/2050 6.125% 2,761 2,7611018 John Day 09/2001 09/2051 5.875% 619 6191019 John Day 09/2004 09/2054 5.375% 2,830 2,8301020 John Day 09/2005 09/2055 5.125% 2,827 2,8271021 John Day 09/2006 09/2056 4.500% 601 6011022 John Day 09/2007 09/2057 5.000% 233 2331023 John Day 09/2009 09/2059 4.375% 1,548 1,5481024 John Day 09/2010 09/2060 4.250% 356 3561025 John Day 09/2011 09/2061 3.750% 175 1751026 John Day 09/2012 09/2062 3.375% 6,161 6,1611027 John Day 09/2013 09/2063 2.875% 17 171028 John Day 09/2015 09/2065 3.250% 163 1631029 Libby 09/1975 09/2025 7.160% 54,644 01030 Libby 09/1976 09/2026 7.150% 153,432 01031 Libby 09/1977 09/2026 7.150% 1,465 01032 Libby 09/1978 09/2026 7.150% 1,465 01033 Libby 09/1979 09/2026 7.150% 1,465 01034 Libby 09/1980 09/2026 7.150% 1,465 01035 Libby 09/1981 09/2026 7.150% 1,465 01036 Libby 09/1982 09/2026 7.150% 1,465 01037 Libby 09/1983 09/2026 7.150% 1,465 01038 Libby 09/1984 09/2026 10.750% 104 01039 Libby 09/1985 09/2026 7.150% 518 01040 Libby 09/1986 09/2026 7.150% 283 01041 Libby 09/1987 09/2026 7.150% 2 01042 Libby 09/1988 09/2026 8.505% 35 01043 Libby 09/1988 09/2038 7.150% 18,043 14,7811044 Libby 09/1989 09/2026 7.150% 1 01045 Libby 09/1989 09/2026 9.250% 131 01046 Libby 09/1990 09/2026 8.875% 11 01047 Libby 09/1991 09/2026 8.750% 134 01048 Libby 09/1992 09/2026 8.500% 100 01049 Libby 09/1992 09/2026 8.500% 70 01050 Libby 09/1993 09/2026 7.875% 600 01051 Libby 09/1994 09/2029 7.125% 215 01052 Libby 09/1994 09/2029 7.150% 286 01053 Libby 09/1995 09/2030 7.150% 15 01054 Libby 09/1995 09/2030 7.150% 41 01055 Libby 09/1995 09/2030 7.150% 94 01056 Libby 09/1997 09/2022 7.230% 432 01057 Libby 09/1997 09/2047 7.150% 660 6601058 Libby 09/2001 09/2051 5.875% 5,562 5,5621059 Libby 09/2008 09/2058 4.875% 1,567 1,5671060 Libby 09/2010 09/2060 4.250% 40 401061 Libby 09/2011 09/2061 3.750% 152 1521062 Libby 09/2012 09/2062 3.375% 16 161063 Little Goose 09/1970 09/2020 7.250% 22,326 01064 Little Goose 09/1971 09/2021 7.230% 42,962 01065 Little Goose 09/1972 09/2021 7.230% 28 01066 Little Goose 09/1973 09/2021 7.230% 29 0
BP-18-FS-BPA-02A Page 142

TABLE 12A:
HISTORICAL INVESTMENTS
October 1, 2015 - September 30, 2019 Cost Evaluation period
($000s) (FY 2019)
A B C D E F G H
Project In Service Date Due Date Interest Rate Initial Principal Current Principal
Roll Maturity
Date
Rollover
Rate
1067 Little Goose 09/1974 09/2021 7.230% 28 01068 Little Goose 09/1975 09/2021 7.230% 29 01069 Little Goose 09/1976 09/2021 7.230% 28 01070 Little Goose 09/1977 09/2021 7.230% 29 01071 Little Goose 09/1978 09/2021 7.230% 28 01072 Little Goose 09/1978 09/2028 7.150% 49,578 01073 Little Goose 09/1979 09/2021 7.230% 29 01074 Little Goose 09/1980 09/2021 7.230% 28 01075 Little Goose 09/1981 09/2021 7.230% 29 01076 Little Goose 09/1982 09/2021 7.230% 28 01077 Little Goose 09/1983 09/2021 7.230% 29 01078 Little Goose 09/1984 09/2021 10.750% 201 01079 Little Goose 09/1985 09/2021 7.230% 174 01080 Little Goose 09/1985 09/2028 7.150% 47 01081 Little Goose 09/1986 09/2021 7.230% 239 01082 Little Goose 09/1987 09/2021 7.230% 6 01083 Little Goose 09/1987 09/2021 8.875% 72 01084 Little Goose 09/1988 09/2021 8.500% 12 01085 Little Goose 09/1988 09/2021 8.500% 68 01086 Little Goose 09/1989 09/2021 9.250% 77 01087 Little Goose 09/1990 09/2021 8.875% 408 01088 Little Goose 09/1990 09/2021 8.875% 21 01089 Little Goose 09/1991 09/2021 8.750% 266 01090 Little Goose 09/1992 09/2021 8.500% 66 01091 Little Goose 09/1992 09/2021 8.500% 27 01092 Little Goose 09/1993 09/2021 7.875% 276 01093 Little Goose 09/1993 09/2021 7.875% 3,359 01094 Little Goose 09/1994 09/2019 7.125% 37 01095 Little Goose 09/1994 09/2029 7.125% 2,044 01096 Little Goose 09/1995 09/2040 7.150% 17 171097 Little Goose 09/1995 09/2040 7.150% 450 4501098 Little Goose 09/1995 09/2040 7.150% 733 7331099 Little Goose 09/1996 09/2046 7.150% 10 101100 Little Goose 09/1996 09/2046 7.150% 10 101101 Little Goose 09/1996 09/2046 7.150% 211 2111102 Little Goose 09/1996 09/2046 7.150% 241 2411103 Little Goose 09/1996 09/2046 7.150% 520 5201104 Little Goose 09/1996 09/2046 7.150% 3,909 3,9091105 Little Goose 09/1997 09/2047 7.150% 1 11106 Little Goose 09/2001 09/2051 5.875% 4,608 4,6081107 Little Goose 09/2002 09/2052 5.500% 27 271108 Little Goose 09/2003 09/2053 5.125% 146 1461109 Little Goose 09/2004 09/2054 5.375% 67 671110 Little Goose 09/2008 09/2058 4.875% 13 131111 Little Goose 09/2009 09/2059 4.375% 3,171 3,1711112 Little Goose 09/2010 09/2060 4.250% 30 301113 Little Goose 09/2013 09/2063 2.875% 66 661114 Lookout Dam 09/1955 09/2005 6.910% 34,290 01115 Lookout Dam 09/1956 09/2005 6.910% 52 01116 Lookout Dam 09/1957 09/2005 6.910% 51 01117 Lookout Dam 09/1958 09/2005 6.910% 51 01118 Lookout Dam 09/1959 09/2005 6.910% 51 01119 Lookout Dam 09/1960 09/2005 6.910% 51 01120 Lookout Dam 09/1961 09/2005 6.910% 52 01121 Lookout Dam 09/1962 09/2005 6.910% 51 01122 Lookout Dam 09/1963 09/2005 6.910% 51 01123 Lookout Dam 09/1964 09/2005 6.910% 51 01124 Lookout Dam 09/1965 09/2005 6.910% 51 01125 Lookout Dam 09/1966 09/2005 6.910% 51 01126 Lookout Dam 09/1967 09/2005 6.910% 52 01127 Lookout Dam 09/1968 09/2005 6.910% 51 01128 Lookout Dam 09/1969 09/2005 6.910% 51 01129 Lookout Dam 09/1970 09/2005 6.910% 51 01130 Lookout Dam 09/1971 09/2005 6.910% 51 01131 Lookout Dam 09/1972 09/2005 6.910% 51 01132 Lookout Dam 09/1973 09/2005 6.910% 52 01133 Lookout Dam 09/1974 09/2005 6.910% 51 01134 Lookout Dam 09/1975 09/2005 6.910% 51 01135 Lookout Dam 09/1976 09/2005 6.910% 51 01136 Lookout Dam 09/1977 09/2005 6.910% 51 01137 Lookout Dam 09/1978 09/2005 6.910% 51 01138 Lookout Dam 09/1979 09/2005 6.910% 52 01139 Lookout Dam 09/1980 09/2005 6.910% 51 01140 Lookout Dam 09/1981 09/2005 6.910% 51 01141 Lookout Dam 09/1982 09/2005 6.910% 51 01142 Lookout Dam 09/1983 09/2005 6.910% 51 01143 Lookout Dam 09/1984 09/2005 10.750% 185 01144 Lookout Dam 09/1985 09/2005 6.910% 52 01145 Lookout Dam 09/1986 09/2005 6.910% 42 01146 Lookout Dam 09/1987 09/2005 6.910% 9 01147 Lookout Dam 09/1987 09/2005 8.875% 12 01148 Lookout Dam 09/1988 09/2005 8.500% 46 0
BP-18-FS-BPA-02A Page 143
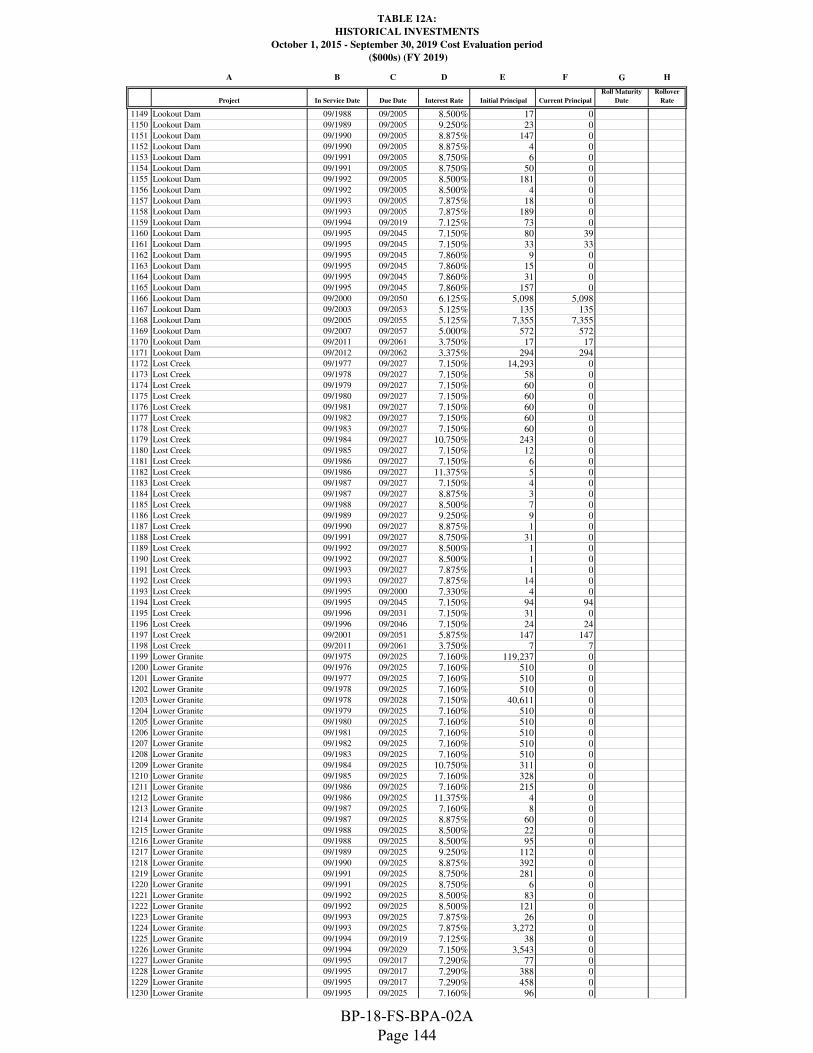
TABLE 12A:
HISTORICAL INVESTMENTS
October 1, 2015 - September 30, 2019 Cost Evaluation period
($000s) (FY 2019)
A B C D E F G H
Project In Service Date Due Date Interest Rate Initial Principal Current Principal
Roll Maturity
Date
Rollover
Rate
1149 Lookout Dam 09/1988 09/2005 8.500% 17 01150 Lookout Dam 09/1989 09/2005 9.250% 23 01151 Lookout Dam 09/1990 09/2005 8.875% 147 01152 Lookout Dam 09/1990 09/2005 8.875% 4 01153 Lookout Dam 09/1991 09/2005 8.750% 6 01154 Lookout Dam 09/1991 09/2005 8.750% 50 01155 Lookout Dam 09/1992 09/2005 8.500% 181 01156 Lookout Dam 09/1992 09/2005 8.500% 4 01157 Lookout Dam 09/1993 09/2005 7.875% 18 01158 Lookout Dam 09/1993 09/2005 7.875% 189 01159 Lookout Dam 09/1994 09/2019 7.125% 73 01160 Lookout Dam 09/1995 09/2045 7.150% 80 391161 Lookout Dam 09/1995 09/2045 7.150% 33 331162 Lookout Dam 09/1995 09/2045 7.860% 9 01163 Lookout Dam 09/1995 09/2045 7.860% 15 01164 Lookout Dam 09/1995 09/2045 7.860% 31 01165 Lookout Dam 09/1995 09/2045 7.860% 157 01166 Lookout Dam 09/2000 09/2050 6.125% 5,098 5,0981167 Lookout Dam 09/2003 09/2053 5.125% 135 1351168 Lookout Dam 09/2005 09/2055 5.125% 7,355 7,3551169 Lookout Dam 09/2007 09/2057 5.000% 572 5721170 Lookout Dam 09/2011 09/2061 3.750% 17 171171 Lookout Dam 09/2012 09/2062 3.375% 294 2941172 Lost Creek 09/1977 09/2027 7.150% 14,293 01173 Lost Creek 09/1978 09/2027 7.150% 58 01174 Lost Creek 09/1979 09/2027 7.150% 60 01175 Lost Creek 09/1980 09/2027 7.150% 60 01176 Lost Creek 09/1981 09/2027 7.150% 60 01177 Lost Creek 09/1982 09/2027 7.150% 60 01178 Lost Creek 09/1983 09/2027 7.150% 60 01179 Lost Creek 09/1984 09/2027 10.750% 243 01180 Lost Creek 09/1985 09/2027 7.150% 12 01181 Lost Creek 09/1986 09/2027 7.150% 6 01182 Lost Creek 09/1986 09/2027 11.375% 5 01183 Lost Creek 09/1987 09/2027 7.150% 4 01184 Lost Creek 09/1987 09/2027 8.875% 3 01185 Lost Creek 09/1988 09/2027 8.500% 7 01186 Lost Creek 09/1989 09/2027 9.250% 9 01187 Lost Creek 09/1990 09/2027 8.875% 1 01188 Lost Creek 09/1991 09/2027 8.750% 31 01189 Lost Creek 09/1992 09/2027 8.500% 1 01190 Lost Creek 09/1992 09/2027 8.500% 1 01191 Lost Creek 09/1993 09/2027 7.875% 1 01192 Lost Creek 09/1993 09/2027 7.875% 14 01193 Lost Creek 09/1995 09/2000 7.330% 4 01194 Lost Creek 09/1995 09/2045 7.150% 94 941195 Lost Creek 09/1996 09/2031 7.150% 31 01196 Lost Creek 09/1996 09/2046 7.150% 24 241197 Lost Creek 09/2001 09/2051 5.875% 147 1471198 Lost Creek 09/2011 09/2061 3.750% 7 71199 Lower Granite 09/1975 09/2025 7.160% 119,237 01200 Lower Granite 09/1976 09/2025 7.160% 510 01201 Lower Granite 09/1977 09/2025 7.160% 510 01202 Lower Granite 09/1978 09/2025 7.160% 510 01203 Lower Granite 09/1978 09/2028 7.150% 40,611 01204 Lower Granite 09/1979 09/2025 7.160% 510 01205 Lower Granite 09/1980 09/2025 7.160% 510 01206 Lower Granite 09/1981 09/2025 7.160% 510 01207 Lower Granite 09/1982 09/2025 7.160% 510 01208 Lower Granite 09/1983 09/2025 7.160% 510 01209 Lower Granite 09/1984 09/2025 10.750% 311 01210 Lower Granite 09/1985 09/2025 7.160% 328 01211 Lower Granite 09/1986 09/2025 7.160% 215 01212 Lower Granite 09/1986 09/2025 11.375% 4 01213 Lower Granite 09/1987 09/2025 7.160% 8 01214 Lower Granite 09/1987 09/2025 8.875% 60 01215 Lower Granite 09/1988 09/2025 8.500% 22 01216 Lower Granite 09/1988 09/2025 8.500% 95 01217 Lower Granite 09/1989 09/2025 9.250% 112 01218 Lower Granite 09/1990 09/2025 8.875% 392 01219 Lower Granite 09/1991 09/2025 8.750% 281 01220 Lower Granite 09/1991 09/2025 8.750% 6 01221 Lower Granite 09/1992 09/2025 8.500% 83 01222 Lower Granite 09/1992 09/2025 8.500% 121 01223 Lower Granite 09/1993 09/2025 7.875% 26 01224 Lower Granite 09/1993 09/2025 7.875% 3,272 01225 Lower Granite 09/1994 09/2019 7.125% 38 01226 Lower Granite 09/1994 09/2029 7.150% 3,543 01227 Lower Granite 09/1995 09/2017 7.290% 77 01228 Lower Granite 09/1995 09/2017 7.290% 388 01229 Lower Granite 09/1995 09/2017 7.290% 458 01230 Lower Granite 09/1995 09/2025 7.160% 96 0
BP-18-FS-BPA-02A Page 144

TABLE 12A:
HISTORICAL INVESTMENTS
October 1, 2015 - September 30, 2019 Cost Evaluation period
($000s) (FY 2019)
A B C D E F G H
Project In Service Date Due Date Interest Rate Initial Principal Current Principal
Roll Maturity
Date
Rollover
Rate
1231 Lower Granite 09/1996 09/2011 7.130% 255 01232 Lower Granite 09/1996 09/2031 7.150% 206 01233 Lower Granite 09/1996 09/2046 7.150% 9 91234 Lower Granite 09/1996 09/2046 7.150% 625 6251235 Lower Granite 09/1997 09/2047 7.150% 677 6771236 Lower Granite 09/1999 09/2049 5.375% 856 8561237 Lower Granite 09/2001 09/2051 5.875% 2,025 2,0251238 Lower Granite 09/2002 09/2052 5.500% 1,275 1,2751239 Lower Granite 09/2003 09/2053 5.125% 42 421240 Lower Granite 09/2005 09/2055 5.125% 393 3931241 Lower Granite 09/2008 09/2058 4.875% 24 241242 Lower Granite 09/2009 09/2059 4.375% 5,669 5,6691243 Lower Granite 09/2010 09/2060 4.250% 1,156 1,1561244 Lower Granite 09/2011 09/2061 3.750% 8 81245 Lower Granite 09/2014 09/2064 3.875% 2,644 2,6441246 Lower Granite 09/2015 09/2065 3.250% 1,597 1,5971247 Lower Granite 09/2016 09/2066 3.000% 1,878 1,8781248 Lower Monument 09/1969 09/2019 7.270% 26,974 01249 Lower Monument 09/1970 09/2020 7.250% 51,218 01250 Lower Monument 09/1971 09/2020 7.250% 214 01251 Lower Monument 09/1972 09/2020 7.250% 214 01252 Lower Monument 09/1973 09/2020 7.250% 214 01253 Lower Monument 09/1974 09/2020 7.250% 214 01254 Lower Monument 09/1975 09/2020 7.250% 214 01255 Lower Monument 09/1976 09/2020 7.250% 214 01256 Lower Monument 09/1977 09/2020 7.250% 214 01257 Lower Monument 09/1978 09/2020 7.250% 214 01258 Lower Monument 09/1979 09/2020 7.250% 214 01259 Lower Monument 09/1979 09/2029 7.150% 40,669 01260 Lower Monument 09/1980 09/2020 7.250% 214 01261 Lower Monument 09/1981 09/2020 7.250% 214 01262 Lower Monument 09/1982 09/2020 7.250% 214 01263 Lower Monument 09/1983 09/2020 7.250% 214 01264 Lower Monument 09/1985 09/2020 7.250% 8 01265 Lower Monument 09/1985 09/2029 7.150% 256 01266 Lower Monument 09/1986 09/2020 7.250% 132 01267 Lower Monument 09/1987 09/2020 7.250% 3 01268 Lower Monument 09/1987 09/2020 8.875% 50 01269 Lower Monument 09/1988 09/2020 8.500% 1 01270 Lower Monument 09/1988 09/2020 8.500% 58 01271 Lower Monument 09/1989 09/2020 9.250% 93 01272 Lower Monument 09/1990 09/2020 8.875% 358 01273 Lower Monument 09/1991 09/2020 8.750% 594 01274 Lower Monument 09/1992 09/2020 8.500% 4,484 01275 Lower Monument 09/1993 09/2020 7.875% 24 01276 Lower Monument 09/1993 09/2020 7.875% 2,175 01277 Lower Monument 09/1994 09/2019 7.125% 107 01278 Lower Monument 09/1994 09/2029 7.125% 2,167 01279 Lower Monument 09/1995 09/2000 7.330% 6 01280 Lower Monument 09/1995 09/2045 7.150% 41 411281 Lower Monument 09/1995 09/2045 7.150% 99 991282 Lower Monument 09/1995 09/2045 7.150% 624 6241283 Lower Monument 09/1995 09/2045 7.150% 1,122 1,1221284 Lower Monument 09/1996 09/2016 7.290% 668 01285 Lower Monument 09/1996 09/2021 7.230% 37 01286 Lower Monument 09/1996 09/2021 7.230% 51 01287 Lower Monument 09/1996 09/2036 7.150% 264 2641288 Lower Monument 09/1996 09/2046 7.150% 10 101289 Lower Monument 09/2001 09/2051 5.875% 3,301 3,3011290 Lower Monument 09/2002 09/2052 5.500% 29 291291 Lower Monument 09/2003 09/2053 5.125% 22 221292 Lower Monument 09/2004 09/2054 5.375% 3,423 3,4231293 Lower Monument 09/2005 09/2055 5.125% 527 5271294 Lower Monument 09/2006 09/2056 4.500% 285 2851295 Lower Monument 09/2008 09/2058 4.875% 9 91296 Lower Monument 09/2009 09/2059 4.375% 2,332 2,3321297 Lower Monument 09/2012 09/2062 3.375% 89 891298 Lower Monument 09/2014 09/2064 3.875% 1,430 1,4301299 Lower Monument 09/2016 09/2066 3.000% 155 1551300 Lower Snake Fish and Wildlife 09/1983 09/2033 7.150% 30,488 9,4721301 Lower Snake Fish and Wildlife 09/1985 09/2035 7.150% 47,921 47,9211302 Lower Snake Fish and Wildlife 09/1987 09/2037 7.150% 72,536 72,5361303 Lower Snake Fish and Wildlife 09/1988 09/2038 7.150% 805 8051304 Lower Snake Fish and Wildlife 09/1990 09/2040 7.150% 1,557 1,5571305 Lower Snake Fish and Wildlife 09/1991 09/2041 7.150% 4,411 4,4111306 Lower Snake Fish and Wildlife 09/1993 09/2043 7.150% 71,632 71,6321307 Lower Snake Fish and Wildlife 09/1994 09/2044 7.150% 4,722 4,7221308 Lower Snake Fish and Wildlife 09/1996 09/2046 7.150% 12,085 12,0851309 Lower Snake Fish and Wildlife 09/1997 09/2047 7.150% 2,173 2,1731310 Lower Snake Fish and Wildlife 09/1999 09/2049 5.375% 7 71311 Lower Snake Fish and Wildlife 09/2000 09/2050 6.125% 1,529 1,5291312 Lower Snake Fish and Wildlife 09/2001 09/2051 5.875% 325 325
BP-18-FS-BPA-02A Page 145

TABLE 12A:
HISTORICAL INVESTMENTS
October 1, 2015 - September 30, 2019 Cost Evaluation period
($000s) (FY 2019)
A B C D E F G H
Project In Service Date Due Date Interest Rate Initial Principal Current Principal
Roll Maturity
Date
Rollover
Rate
1313 Lower Snake Fish and Wildlife 09/2002 09/2052 5.500% 890 8901314 Lower Snake Fish and Wildlife 09/2003 09/2053 5.125% 98 981315 Lower Snake Fish and Wildlife 09/2004 09/2054 5.375% 230 2301316 Lower Snake Fish and Wildlife 09/2005 09/2055 5.125% 4 41317 Lower Snake Fish and Wildlife 09/2006 09/2056 4.500% 379 3791318 Lower Snake Fish and Wildlife 09/2008 09/2058 4.875% 74 741319 Lower Snake Fish and Wildlife 09/2009 09/2059 4.375% 1,540 1,5401320 Lower Snake Fish and Wildlife 09/2010 09/2060 4.250% 6 61321 Lower Snake Fish and Wildlife 09/2011 09/2061 3.750% 122 1221322 Lower Snake Fish and Wildlife 09/2014 09/2064 3.875% 222 2221323 Lower Snake Fish and Wildlife 09/2016 09/2066 3.000% 1,256 1,2561324 McNary 09/1954 09/2004 6.880% 80,256 01325 McNary 09/1955 09/2005 6.910% 53,493 01326 McNary 09/1956 09/2006 6.950% 38,748 01327 McNary 09/1957 09/2007 6.980% 24,985 01328 McNary 09/1958 09/2007 6.980% 468 01329 McNary 09/1959 09/2007 6.980% 468 01330 McNary 09/1960 09/2007 6.980% 468 01331 McNary 09/1961 09/2007 6.980% 468 01332 McNary 09/1962 09/2007 6.980% 467 01333 McNary 09/1963 09/2007 6.980% 468 01334 McNary 09/1964 09/2007 6.980% 468 01335 McNary 09/1965 09/2007 6.980% 468 01336 McNary 09/1966 09/2007 6.980% 468 01337 McNary 09/1967 09/2007 6.980% 467 01338 McNary 09/1968 09/2007 6.980% 468 01339 McNary 09/1969 09/2007 6.980% 468 01340 McNary 09/1970 09/2007 6.980% 468 01341 McNary 09/1971 09/2007 6.980% 468 01342 McNary 09/1972 09/2007 6.980% 468 01343 McNary 09/1973 09/2007 6.980% 467 01344 McNary 09/1974 09/2007 6.980% 468 01345 McNary 09/1975 09/2007 6.980% 468 01346 McNary 09/1976 09/2007 6.980% 468 01347 McNary 09/1977 09/2007 6.980% 467 01348 McNary 09/1978 09/2007 6.980% 468 01349 McNary 09/1979 09/2007 6.980% 468 01350 McNary 09/1980 09/2007 6.980% 468 01351 McNary 09/1981 09/2007 6.980% 468 01352 McNary 09/1982 09/2007 6.980% 467 01353 McNary 09/1983 09/2007 6.980% 468 01354 McNary 09/1985 09/2007 6.980% 557 01355 McNary 09/1986 09/2007 6.980% 454 01356 McNary 09/1987 09/2007 6.980% 24 01357 McNary 09/1995 09/2010 7.090% 509 01358 McNary 09/1995 09/2045 7.150% 16 161359 McNary 09/1996 09/2006 6.950% 778 01360 McNary 09/1996 09/2011 7.130% 3 01361 McNary 09/1996 09/2026 7.150% 74 01362 McNary 09/1996 09/2026 7.150% 277 01363 McNary 09/1996 09/2046 7.150% 619 6191364 McNary 09/1997 09/2032 7.150% 30 01365 McNary 09/2001 09/2051 5.875% 1,046 1,0461366 McNary 09/2003 09/2053 5.125% 97 971367 McNary 09/2004 09/2054 5.375% 6,138 6,1381368 McNary 09/2005 09/2055 5.125% 550 5501369 McNary 09/2006 09/2056 4.500% 4,080 4,0801370 McNary 09/2008 09/2058 4.875% 215 2151371 McNary 09/2011 09/2061 3.750% 565 5651372 McNary 09/2012 09/2062 3.375% 11 111373 McNary 09/2013 09/2063 2.875% 1,000 1,0001374 McNary 09/2014 09/2064 3.875% 759 7591375 Minidoka/Palisades 09/1909 09/1959 3.000% 854 01376 Minidoka/Palisades 09/1909 09/1959 3.000% 226 01377 Minidoka/Palisades 09/1910 09/1960 3.000% 1,709 01378 Minidoka/Palisades 09/1910 09/1960 3.000% 451 01379 Minidoka/Palisades 09/1911 09/1961 3.000% 1,709 01380 Minidoka/Palisades 09/1911 09/1961 3.000% 451 01381 Minidoka/Palisades 09/1927 09/1977 3.000% 854 01382 Minidoka/Palisades 09/1927 09/1977 3.000% 226 01383 Minidoka/Palisades 09/1942 09/1992 3.000% 854 01384 Minidoka/Palisades 09/1942 09/1992 3.000% 226 01385 Minidoka/Palisades 09/1957 09/2007 3.000% 2,561 01386 Minidoka/Palisades 09/1957 09/2007 3.000% 677 01387 Minidoka/Palisades 09/1958 09/2008 3.000% 854 01388 Minidoka/Palisades 09/1958 09/2008 3.000% 226 01389 Minidoka/Palisades 09/1959 09/2008 3.000% 108 01390 Minidoka/Palisades 09/1959 09/2008 3.000% 28 01391 Minidoka/Palisades 09/1960 09/2008 3.000% 108 01392 Minidoka/Palisades 09/1960 09/2008 3.000% 29 01393 Minidoka/Palisades 09/1961 09/2008 3.000% 108 01394 Minidoka/Palisades 09/1961 09/2008 3.000% 29 0
BP-18-FS-BPA-02A Page 146

TABLE 12A:
HISTORICAL INVESTMENTS
October 1, 2015 - September 30, 2019 Cost Evaluation period
($000s) (FY 2019)
A B C D E F G H
Project In Service Date Due Date Interest Rate Initial Principal Current Principal
Roll Maturity
Date
Rollover
Rate
1395 Minidoka/Palisades 09/1962 09/2008 3.000% 108 01396 Minidoka/Palisades 09/1962 09/2008 3.000% 28 01397 Minidoka/Palisades 09/1963 09/2008 3.000% 108 01398 Minidoka/Palisades 09/1963 09/2008 3.000% 29 01399 Minidoka/Palisades 09/1964 09/2008 3.000% 108 01400 Minidoka/Palisades 09/1964 09/2008 3.000% 28 01401 Minidoka/Palisades 09/1965 09/2008 3.000% 108 01402 Minidoka/Palisades 09/1965 09/2008 3.000% 29 01403 Minidoka/Palisades 09/1966 09/2008 3.000% 108 01404 Minidoka/Palisades 09/1966 09/2008 3.000% 29 01405 Minidoka/Palisades 09/1967 09/2008 3.000% 108 01406 Minidoka/Palisades 09/1967 09/2008 3.000% 28 01407 Minidoka/Palisades 09/1968 09/2008 3.000% 108 01408 Minidoka/Palisades 09/1968 09/2008 3.000% 29 01409 Minidoka/Palisades 09/1969 09/2008 3.000% 3 01410 Minidoka/Palisades 09/1969 09/2008 3.000% 28 01411 Minidoka/Palisades 09/1970 09/2008 3.000% 108 01412 Minidoka/Palisades 09/1970 09/2008 3.000% 29 01413 Minidoka/Palisades 09/1971 09/2008 3.000% 108 01414 Minidoka/Palisades 09/1971 09/2008 3.000% 29 01415 Minidoka/Palisades 09/1972 09/2008 3.000% 108 01416 Minidoka/Palisades 09/1972 09/2008 3.000% 28 01417 Minidoka/Palisades 09/1973 09/2008 3.000% 108 01418 Minidoka/Palisades 09/1973 09/2008 3.000% 29 01419 Minidoka/Palisades 09/1974 09/2008 3.000% 108 01420 Minidoka/Palisades 09/1974 09/2008 3.000% 28 01421 Minidoka/Palisades 09/1975 09/2008 3.000% 108 01422 Minidoka/Palisades 09/1975 09/2008 3.000% 29 01423 Minidoka/Palisades 09/1976 09/2008 3.000% 108 01424 Minidoka/Palisades 09/1976 09/2008 3.000% 29 01425 Minidoka/Palisades 09/1977 09/2008 7.020% 83 01426 Minidoka/Palisades 09/1977 09/2008 7.020% 28 01427 Minidoka/Palisades 09/1978 09/2008 7.020% 75 01428 Minidoka/Palisades 09/1978 09/2008 7.020% 20 01429 Minidoka/Palisades 09/1979 09/2008 7.020% 75 01430 Minidoka/Palisades 09/1979 09/2008 7.020% 19 01431 Minidoka/Palisades 09/1980 09/2008 7.020% 75 01432 Minidoka/Palisades 09/1980 09/2008 7.020% 20 01433 Minidoka/Palisades 09/1981 09/2008 7.020% 75 01434 Minidoka/Palisades 09/1981 09/2008 7.020% 20 01435 Minidoka/Palisades 09/1982 09/2008 7.020% 75 01436 Minidoka/Palisades 09/1982 09/2008 7.020% 19 01437 Minidoka/Palisades 09/1983 09/2008 7.020% 65 01438 Minidoka/Palisades 09/1983 09/2008 7.020% 20 01439 Minidoka/Palisades 09/1984 09/2008 10.075% 44 01440 Minidoka/Palisades 09/1984 09/2008 10.075% 11 01441 Minidoka/Palisades 09/1985 09/2008 7.020% 21 01442 Minidoka/Palisades 09/1986 09/2008 7.020% 21 01443 Minidoka/Palisades 09/1986 09/2008 11.375% 48 01444 Minidoka/Palisades 09/1987 09/2008 7.020% 16 01445 Minidoka/Palisades 09/1988 09/2008 8.500% 31 01446 Minidoka/Palisades 09/1989 09/2008 9.250% 20 01447 Minidoka/Palisades 09/1990 09/2008 8.875% 33 01448 Minidoka/Palisades 09/1991 09/2008 8.750% 62 01449 Minidoka/Palisades 09/1991 09/2008 8.750% 11 01450 Minidoka/Palisades 09/1991 09/2008 8.750% 32 01451 Minidoka/Palisades 09/1992 09/2008 8.500% 6 01452 Minidoka/Palisades 09/1994 09/2029 7.125% 351 01453 Minidoka/Palisades 09/1995 09/2000 7.330% 6 01454 Minidoka/Palisades 09/1995 09/2010 7.890% 40 01455 Minidoka/Palisades 09/1996 09/2011 7.130% 54 01456 Minidoka/Palisades 09/1997 09/2007 6.950% 66 01457 Minidoka/Palisades 09/1997 09/2047 7.150% 50,911 50,9111458 Minidoka/Palisades 09/2001 09/2051 5.875% 42 421459 Minidoka/Palisades 09/2012 09/2062 3.375% 7 71460 Minidoka/Palisades 09/2015 09/2065 3.250% 19,237 19,2371461 Minidoka/Palisades 09/2016 09/2066 3.000% 206 2061462 RRP - Green Springs 09/2001 09/2051 5.875% 11,145 11,1451463 RRP - Green Springs 09/2012 09/2062 3.375% 2 21464 RRP - Green Springs 09/2013 09/2063 2.875% 1 11465 The Dalles 09/1957 09/2007 2.500% 15,908 01466 The Dalles 09/1958 09/2008 7.020% 45,837 01467 The Dalles 09/1959 09/2009 7.060% 40,415 01468 The Dalles 09/1960 09/2010 7.090% 39,179 01469 The Dalles 09/1961 09/2011 7.130% 9,492 01470 The Dalles 09/1962 09/2011 7.130% 56 01471 The Dalles 09/1963 09/2011 7.130% 57 01472 The Dalles 09/1964 09/2011 7.130% 57 01473 The Dalles 09/1965 09/2011 7.130% 56 01474 The Dalles 09/1966 09/2011 7.130% 57 01475 The Dalles 09/1967 09/2011 7.130% 57 01476 The Dalles 09/1968 09/2011 7.130% 56 0
BP-18-FS-BPA-02A Page 147
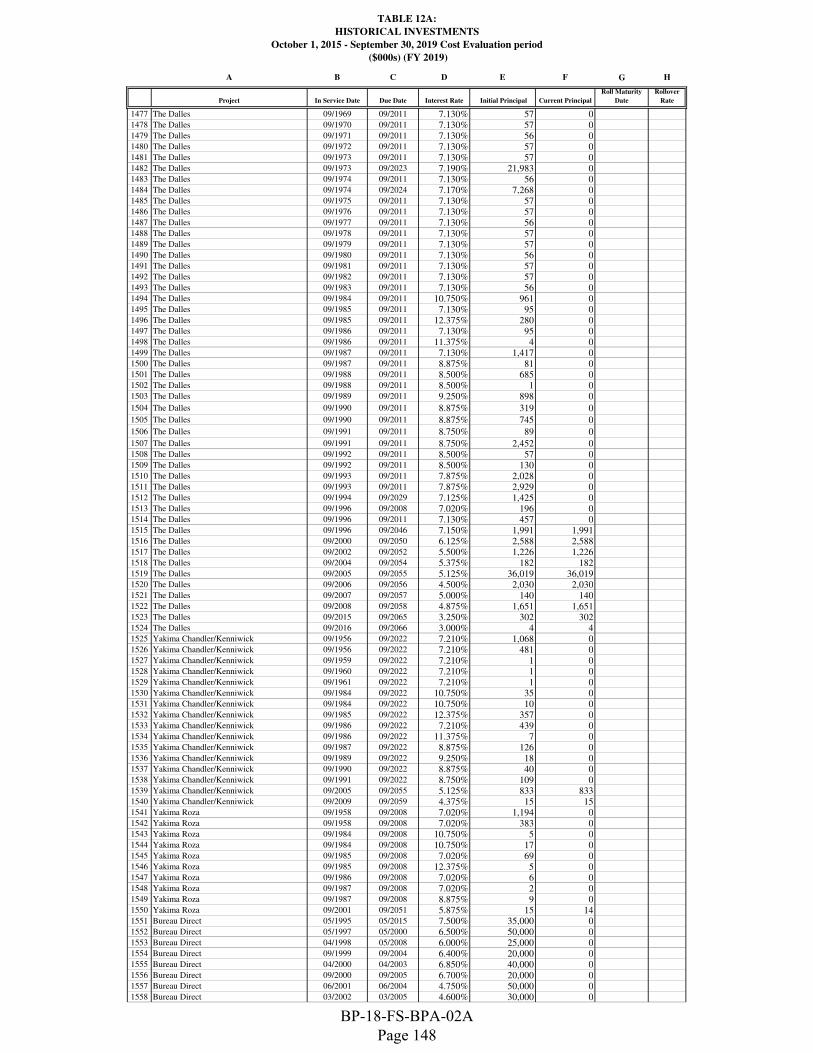
TABLE 12A:
HISTORICAL INVESTMENTS
October 1, 2015 - September 30, 2019 Cost Evaluation period
($000s) (FY 2019)
A B C D E F G H
Project In Service Date Due Date Interest Rate Initial Principal Current Principal
Roll Maturity
Date
Rollover
Rate
1477 The Dalles 09/1969 09/2011 7.130% 57 01478 The Dalles 09/1970 09/2011 7.130% 57 01479 The Dalles 09/1971 09/2011 7.130% 56 01480 The Dalles 09/1972 09/2011 7.130% 57 01481 The Dalles 09/1973 09/2011 7.130% 57 01482 The Dalles 09/1973 09/2023 7.190% 21,983 01483 The Dalles 09/1974 09/2011 7.130% 56 01484 The Dalles 09/1974 09/2024 7.170% 7,268 01485 The Dalles 09/1975 09/2011 7.130% 57 01486 The Dalles 09/1976 09/2011 7.130% 57 01487 The Dalles 09/1977 09/2011 7.130% 56 01488 The Dalles 09/1978 09/2011 7.130% 57 01489 The Dalles 09/1979 09/2011 7.130% 57 01490 The Dalles 09/1980 09/2011 7.130% 56 01491 The Dalles 09/1981 09/2011 7.130% 57 01492 The Dalles 09/1982 09/2011 7.130% 57 01493 The Dalles 09/1983 09/2011 7.130% 56 01494 The Dalles 09/1984 09/2011 10.750% 961 01495 The Dalles 09/1985 09/2011 7.130% 95 01496 The Dalles 09/1985 09/2011 12.375% 280 01497 The Dalles 09/1986 09/2011 7.130% 95 01498 The Dalles 09/1986 09/2011 11.375% 4 01499 The Dalles 09/1987 09/2011 7.130% 1,417 01500 The Dalles 09/1987 09/2011 8.875% 81 01501 The Dalles 09/1988 09/2011 8.500% 685 01502 The Dalles 09/1988 09/2011 8.500% 1 01503 The Dalles 09/1989 09/2011 9.250% 898 0
1504 The Dalles 09/1990 09/2011 8.875% 319 0
1505 The Dalles 09/1990 09/2011 8.875% 745 0
1506 The Dalles 09/1991 09/2011 8.750% 89 0
1507 The Dalles 09/1991 09/2011 8.750% 2,452 01508 The Dalles 09/1992 09/2011 8.500% 57 01509 The Dalles 09/1992 09/2011 8.500% 130 01510 The Dalles 09/1993 09/2011 7.875% 2,028 01511 The Dalles 09/1993 09/2011 7.875% 2,929 01512 The Dalles 09/1994 09/2029 7.125% 1,425 01513 The Dalles 09/1996 09/2008 7.020% 196 01514 The Dalles 09/1996 09/2011 7.130% 457 01515 The Dalles 09/1996 09/2046 7.150% 1,991 1,9911516 The Dalles 09/2000 09/2050 6.125% 2,588 2,5881517 The Dalles 09/2002 09/2052 5.500% 1,226 1,2261518 The Dalles 09/2004 09/2054 5.375% 182 1821519 The Dalles 09/2005 09/2055 5.125% 36,019 36,0191520 The Dalles 09/2006 09/2056 4.500% 2,030 2,0301521 The Dalles 09/2007 09/2057 5.000% 140 1401522 The Dalles 09/2008 09/2058 4.875% 1,651 1,6511523 The Dalles 09/2015 09/2065 3.250% 302 3021524 The Dalles 09/2016 09/2066 3.000% 4 41525 Yakima Chandler/Kenniwick 09/1956 09/2022 7.210% 1,068 01526 Yakima Chandler/Kenniwick 09/1956 09/2022 7.210% 481 01527 Yakima Chandler/Kenniwick 09/1959 09/2022 7.210% 1 01528 Yakima Chandler/Kenniwick 09/1960 09/2022 7.210% 1 01529 Yakima Chandler/Kenniwick 09/1961 09/2022 7.210% 1 01530 Yakima Chandler/Kenniwick 09/1984 09/2022 10.750% 35 01531 Yakima Chandler/Kenniwick 09/1984 09/2022 10.750% 10 01532 Yakima Chandler/Kenniwick 09/1985 09/2022 12.375% 357 01533 Yakima Chandler/Kenniwick 09/1986 09/2022 7.210% 439 01534 Yakima Chandler/Kenniwick 09/1986 09/2022 11.375% 7 01535 Yakima Chandler/Kenniwick 09/1987 09/2022 8.875% 126 01536 Yakima Chandler/Kenniwick 09/1989 09/2022 9.250% 18 01537 Yakima Chandler/Kenniwick 09/1990 09/2022 8.875% 40 01538 Yakima Chandler/Kenniwick 09/1991 09/2022 8.750% 109 01539 Yakima Chandler/Kenniwick 09/2005 09/2055 5.125% 833 8331540 Yakima Chandler/Kenniwick 09/2009 09/2059 4.375% 15 151541 Yakima Roza 09/1958 09/2008 7.020% 1,194 01542 Yakima Roza 09/1958 09/2008 7.020% 383 01543 Yakima Roza 09/1984 09/2008 10.750% 5 01544 Yakima Roza 09/1984 09/2008 10.750% 17 01545 Yakima Roza 09/1985 09/2008 7.020% 69 01546 Yakima Roza 09/1985 09/2008 12.375% 5 01547 Yakima Roza 09/1986 09/2008 7.020% 6 01548 Yakima Roza 09/1987 09/2008 7.020% 2 01549 Yakima Roza 09/1987 09/2008 8.875% 9 01550 Yakima Roza 09/2001 09/2051 5.875% 15 141551 Bureau Direct 05/1995 05/2015 7.500% 35,000 01552 Bureau Direct 05/1997 05/2000 6.500% 50,000 01553 Bureau Direct 04/1998 05/2008 6.000% 25,000 01554 Bureau Direct 09/1999 09/2004 6.400% 20,000 01555 Bureau Direct 04/2000 04/2003 6.850% 40,000 01556 Bureau Direct 09/2000 09/2005 6.700% 20,000 01557 Bureau Direct 06/2001 06/2004 4.750% 50,000 01558 Bureau Direct 03/2002 03/2005 4.600% 30,000 0
BP-18-FS-BPA-02A Page 148
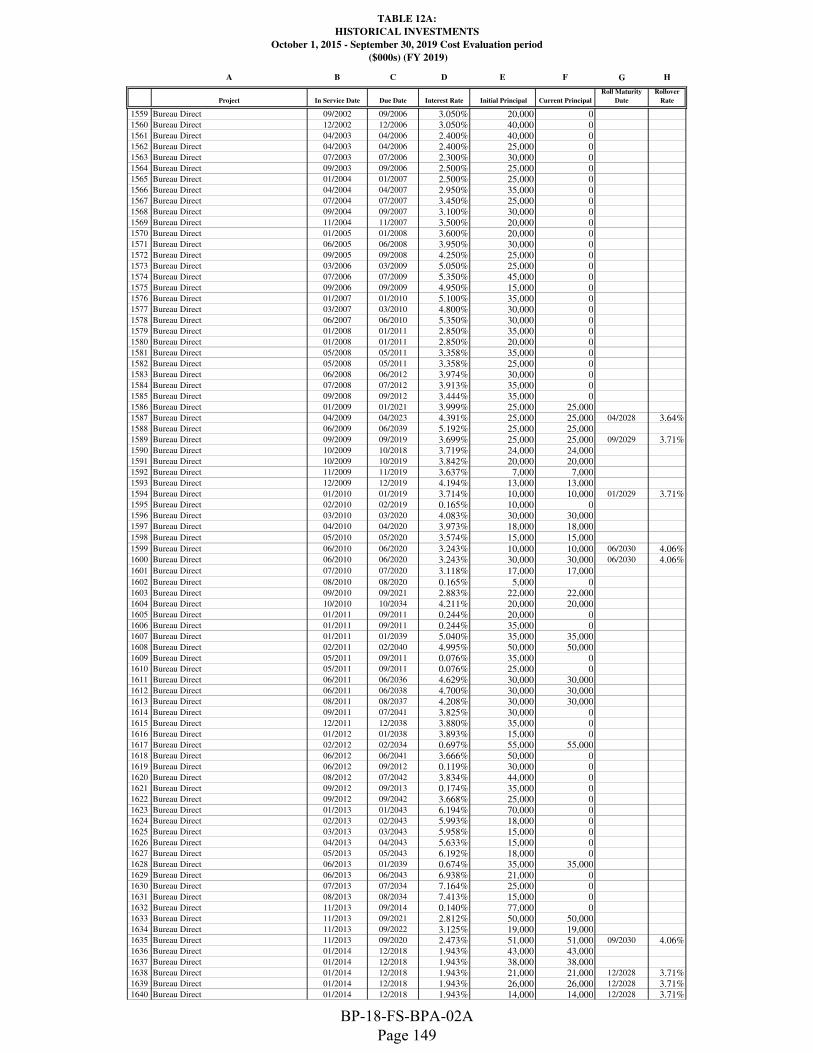
TABLE 12A:
HISTORICAL INVESTMENTS
October 1, 2015 - September 30, 2019 Cost Evaluation period
($000s) (FY 2019)
A B C D E F G H
Project In Service Date Due Date Interest Rate Initial Principal Current Principal
Roll Maturity
Date
Rollover
Rate
1559 Bureau Direct 09/2002 09/2006 3.050% 20,000 01560 Bureau Direct 12/2002 12/2006 3.050% 40,000 01561 Bureau Direct 04/2003 04/2006 2.400% 40,000 01562 Bureau Direct 04/2003 04/2006 2.400% 25,000 01563 Bureau Direct 07/2003 07/2006 2.300% 30,000 01564 Bureau Direct 09/2003 09/2006 2.500% 25,000 01565 Bureau Direct 01/2004 01/2007 2.500% 25,000 01566 Bureau Direct 04/2004 04/2007 2.950% 35,000 01567 Bureau Direct 07/2004 07/2007 3.450% 25,000 01568 Bureau Direct 09/2004 09/2007 3.100% 30,000 01569 Bureau Direct 11/2004 11/2007 3.500% 20,000 01570 Bureau Direct 01/2005 01/2008 3.600% 20,000 01571 Bureau Direct 06/2005 06/2008 3.950% 30,000 01572 Bureau Direct 09/2005 09/2008 4.250% 25,000 01573 Bureau Direct 03/2006 03/2009 5.050% 25,000 01574 Bureau Direct 07/2006 07/2009 5.350% 45,000 01575 Bureau Direct 09/2006 09/2009 4.950% 15,000 01576 Bureau Direct 01/2007 01/2010 5.100% 35,000 01577 Bureau Direct 03/2007 03/2010 4.800% 30,000 01578 Bureau Direct 06/2007 06/2010 5.350% 30,000 01579 Bureau Direct 01/2008 01/2011 2.850% 35,000 01580 Bureau Direct 01/2008 01/2011 2.850% 20,000 01581 Bureau Direct 05/2008 05/2011 3.358% 35,000 01582 Bureau Direct 05/2008 05/2011 3.358% 25,000 01583 Bureau Direct 06/2008 06/2012 3.974% 30,000 01584 Bureau Direct 07/2008 07/2012 3.913% 35,000 01585 Bureau Direct 09/2008 09/2012 3.444% 35,000 01586 Bureau Direct 01/2009 01/2021 3.999% 25,000 25,0001587 Bureau Direct 04/2009 04/2023 4.391% 25,000 25,000 04/2028 3.64%1588 Bureau Direct 06/2009 06/2039 5.192% 25,000 25,0001589 Bureau Direct 09/2009 09/2019 3.699% 25,000 25,000 09/2029 3.71%1590 Bureau Direct 10/2009 10/2018 3.719% 24,000 24,0001591 Bureau Direct 10/2009 10/2019 3.842% 20,000 20,0001592 Bureau Direct 11/2009 11/2019 3.637% 7,000 7,0001593 Bureau Direct 12/2009 12/2019 4.194% 13,000 13,0001594 Bureau Direct 01/2010 01/2019 3.714% 10,000 10,000 01/2029 3.71%1595 Bureau Direct 02/2010 02/2019 0.165% 10,000 01596 Bureau Direct 03/2010 03/2020 4.083% 30,000 30,0001597 Bureau Direct 04/2010 04/2020 3.973% 18,000 18,0001598 Bureau Direct 05/2010 05/2020 3.574% 15,000 15,0001599 Bureau Direct 06/2010 06/2020 3.243% 10,000 10,000 06/2030 4.06%1600 Bureau Direct 06/2010 06/2020 3.243% 30,000 30,000 06/2030 4.06%1601 Bureau Direct 07/2010 07/2020 3.118% 17,000 17,0001602 Bureau Direct 08/2010 08/2020 0.165% 5,000 01603 Bureau Direct 09/2010 09/2021 2.883% 22,000 22,0001604 Bureau Direct 10/2010 10/2034 4.211% 20,000 20,0001605 Bureau Direct 01/2011 09/2011 0.244% 20,000 01606 Bureau Direct 01/2011 09/2011 0.244% 35,000 01607 Bureau Direct 01/2011 01/2039 5.040% 35,000 35,0001608 Bureau Direct 02/2011 02/2040 4.995% 50,000 50,0001609 Bureau Direct 05/2011 09/2011 0.076% 35,000 01610 Bureau Direct 05/2011 09/2011 0.076% 25,000 01611 Bureau Direct 06/2011 06/2036 4.629% 30,000 30,0001612 Bureau Direct 06/2011 06/2038 4.700% 30,000 30,0001613 Bureau Direct 08/2011 08/2037 4.208% 30,000 30,0001614 Bureau Direct 09/2011 07/2041 3.825% 30,000 01615 Bureau Direct 12/2011 12/2038 3.880% 35,000 01616 Bureau Direct 01/2012 01/2038 3.893% 15,000 01617 Bureau Direct 02/2012 02/2034 0.697% 55,000 55,0001618 Bureau Direct 06/2012 06/2041 3.666% 50,000 01619 Bureau Direct 06/2012 09/2012 0.119% 30,000 01620 Bureau Direct 08/2012 07/2042 3.834% 44,000 01621 Bureau Direct 09/2012 09/2013 0.174% 35,000 01622 Bureau Direct 09/2012 09/2042 3.668% 25,000 01623 Bureau Direct 01/2013 01/2043 6.194% 70,000 01624 Bureau Direct 02/2013 02/2043 5.993% 18,000 01625 Bureau Direct 03/2013 03/2043 5.958% 15,000 01626 Bureau Direct 04/2013 04/2043 5.633% 15,000 01627 Bureau Direct 05/2013 05/2043 6.192% 18,000 01628 Bureau Direct 06/2013 01/2039 0.674% 35,000 35,0001629 Bureau Direct 06/2013 06/2043 6.938% 21,000 01630 Bureau Direct 07/2013 07/2034 7.164% 25,000 01631 Bureau Direct 08/2013 08/2034 7.413% 15,000 01632 Bureau Direct 11/2013 09/2014 0.140% 77,000 01633 Bureau Direct 11/2013 09/2021 2.812% 50,000 50,0001634 Bureau Direct 11/2013 09/2022 3.125% 19,000 19,0001635 Bureau Direct 11/2013 09/2020 2.473% 51,000 51,000 09/2030 4.06%1636 Bureau Direct 01/2014 12/2018 1.943% 43,000 43,0001637 Bureau Direct 01/2014 12/2018 1.943% 38,000 38,0001638 Bureau Direct 01/2014 12/2018 1.943% 21,000 21,000 12/2028 3.71%1639 Bureau Direct 01/2014 12/2018 1.943% 26,000 26,000 12/2028 3.71%1640 Bureau Direct 01/2014 12/2018 1.943% 14,000 14,000 12/2028 3.71%
BP-18-FS-BPA-02A Page 149

TABLE 12A:
HISTORICAL INVESTMENTS
October 1, 2015 - September 30, 2019 Cost Evaluation period
($000s) (FY 2019)
A B C D E F G H
Project In Service Date Due Date Interest Rate Initial Principal Current Principal
Roll Maturity
Date
Rollover
Rate
1641 Bureau Direct 09/2014 05/2032 0.713% 16,000 16,0001642 Bureau Direct 09/2014 05/2032 0.713% 10,000 10,0001643 Bureau Direct 09/2014 06/2033 0.732% 11,000 11,0001644 Bureau Direct 09/2014 06/2033 0.732% 12,000 12,0001645 Bureau Direct 09/2014 07/2033 0.674% 15,000 15,0001646 Bureau Direct 09/2015 09/2033 3.134% 10,000 10,0001647 Bureau Direct 04/2016 04/2031 2.661% 17,000 17,0001648 Bureau Direct 07/2016 07/2030 2.145% 12,000 12,0001649 Bureau Direct 07/2016 07/2030 2.145% 25,000 25,0001650 Conservation 09/1983 09/2003 12.200% 140,000 01651 Conservation 09/1984 09/2004 13.050% 150,000 01652 Conservation 09/1985 09/1990 10.150% 50,000 01653 Conservation 03/1986 03/1991 7.800% 50,000 01654 Conservation 03/1986 03/1996 8.150% 50,000 01655 Conservation 04/1987 04/2007 9.300% 75,000 01656 Conservation 06/1987 06/1992 8.350% 50,000 01657 Conservation 04/1988 04/2008 9.900% 90,000 01658 Conservation 07/1989 07/2009 8.550% 40,000 01659 Conservation 09/1989 09/1995 8.600% 66,000 01660 Conservation 09/1989 09/2002 8.650% 66,000 01661 Conservation 07/1992 07/1997 5.800% 80,200 01662 Conservation 07/1992 07/2007 7.140% 100,000 01663 Conservation 10/1992 10/2012 8.050% 50,000 01664 Conservation 02/1993 02/2013 7.400% 50,000 01665 Conservation 08/1993 08/2013 6.750% 40,000 01666 Conservation 01/1994 01/2014 6.750% 50,000 01667 Conservation 05/1994 05/1998 7.100% 50,000 01668 Conservation 05/1995 05/2015 7.500% 85,000 01669 Conservation 01/1996 01/2011 6.700% 30,000 01670 Conservation 11/1996 11/2016 7.200% 40,000 01671 Conservation 05/1998 05/2009 6.000% 37,700 01672 Conservation 09/1998 09/2008 5.300% 104,300 01673 Conservation 09/1998 09/2013 5.600% 52,800 01674 Conservation 07/2000 07/2003 6.950% 32,000 01675 Conservation 06/2002 06/2005 3.750% 40,000 01676 Conservation 01/2004 01/2008 2.950% 30,000 01677 Conservation 03/2006 03/2009 5.050% 20,000 01678 Conservation 06/2007 06/2010 5.350% 20,000 01679 Conservation 09/2008 09/2013 3.701% 10,000 01680 Conservation 09/2009 09/2014 2.746% 15,000 01681 Conservation 01/2010 01/2015 2.609% 15,000 01682 Conservation 04/2010 04/2015 2.677% 20,000 01683 Conservation 08/2010 08/2015 1.619% 15,000 01684 Conservation 09/2010 09/2015 1.534% 10,000 01685 Conservation 01/2011 01/2023 4.046% 40,000 40,0001686 Conservation 04/2011 04/2023 3.932% 35,000 35,0001687 Conservation 08/2011 08/2023 3.206% 40,000 40,0001688 Conservation 10/2011 08/2012 0.204% 55,000 01689 Conservation 12/2011 12/2037 0.189% 55,000 01690 Conservation 05/2012 09/2015 0.676% 30,000 01691 Conservation 06/2012 09/2015 0.671% 15,000 01692 Conservation 08/2012 08/2024 2.788% 15,000 01693 Conservation 11/2012 11/2016 0.630% 20,000 01694 Conservation 01/2013 01/2018 1.107% 9,000 9,0001695 Conservation 03/2013 03/2025 4.992% 10,000 01696 Conservation 04/2013 04/2025 4.553% 12,000 01697 Conservation 08/2013 08/2025 6.973% 5,000 01698 Conservation 10/2013 10/2025 3.568% 34,000 34,0001699 Conservation 11/2013 09/2023 3.375% 27,000 27,0001700 Conservation 12/2013 12/2021 3.142% 6,000 6,0001701 Conservation 12/2013 12/2023 0.732% 55,000 55,0001702 Conservation 01/2014 01/2026 3.621% 5,000 5,0001703 Conservation 04/2014 06/2025 0.732% 30,000 30,0001704 Conservation 05/2014 04/2024 0.526% 15,000 15,0001705 Conservation 05/2014 04/2025 0.526% 3,000 3,0001706 Conservation 06/2014 10/2024 0.526% 5,000 5,0001707 Conservation 07/2014 07/2025 0.674% 12,000 12,0001708 Conservation 08/2014 09/2025 0.947% 4,000 4,0001709 Conservation 10/2014 12/2024 0.732% 10,000 10,0001710 Conservation 11/2014 03/2027 0.947% 6,000 6,0001711 Conservation 12/2014 12/2023 2.403% 7,000 7,0001712 Conservation 01/2015 09/2015 0.204% 15,000 01713 Conservation 01/2015 01/2024 1.908% 7,000 7,0001714 Conservation 02/2015 02/2024 2.251% 8,000 8,0001715 Conservation 03/2015 03/2025 2.295% 5,000 5,0001716 Conservation 04/2015 04/2024 2.269% 5,000 5,0001717 Conservation 05/2015 05/2021 1.898% 5,000 5,0001718 Conservation 07/2015 07/2021 2.067% 14,000 14,0001719 Conservation 08/2015 08/2022 2.233% 6,000 6,0001720 Conservation 09/2015 09/2022 2.062% 4,000 4,0001721 Conservation 10/2015 10/2027 0.732% 25,000 25,0001722 Conservation 11/2016 04/2017 0.684% 20,000 0
BP-18-FS-BPA-02A Page 150
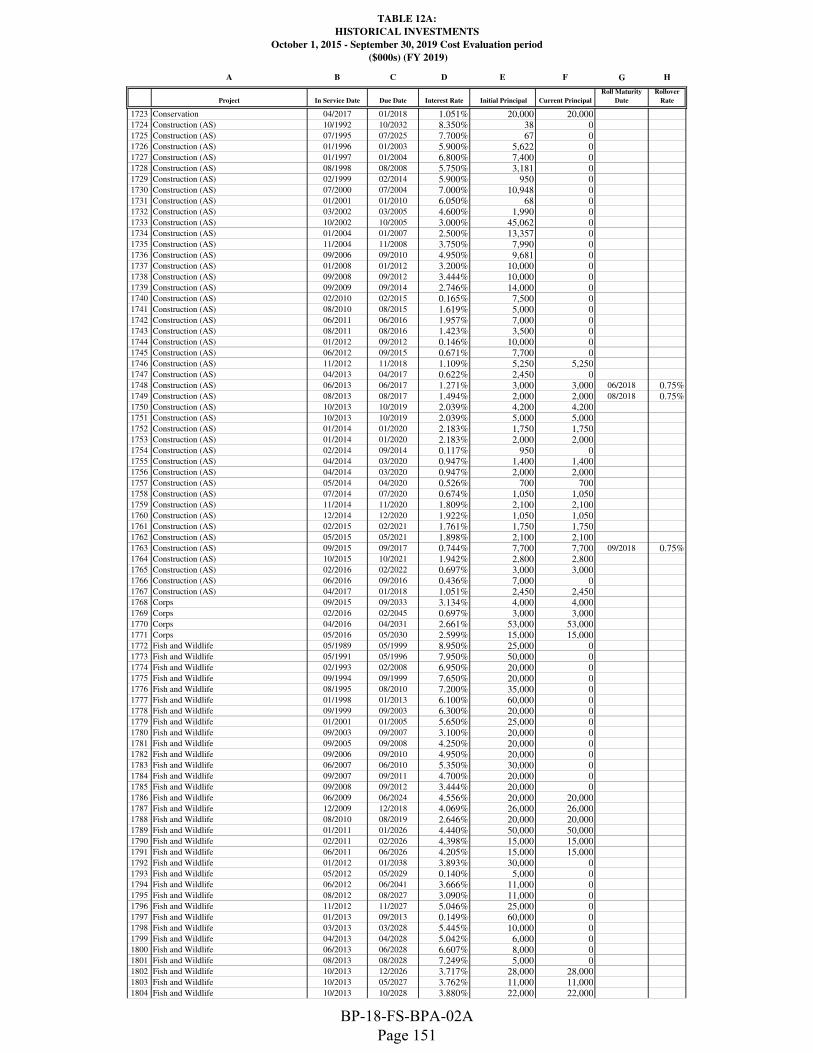
TABLE 12A:
HISTORICAL INVESTMENTS
October 1, 2015 - September 30, 2019 Cost Evaluation period
($000s) (FY 2019)
A B C D E F G H
Project In Service Date Due Date Interest Rate Initial Principal Current Principal
Roll Maturity
Date
Rollover
Rate
1723 Conservation 04/2017 01/2018 1.051% 20,000 20,0001724 Construction (AS) 10/1992 10/2032 8.350% 38 01725 Construction (AS) 07/1995 07/2025 7.700% 67 01726 Construction (AS) 01/1996 01/2003 5.900% 5,622 01727 Construction (AS) 01/1997 01/2004 6.800% 7,400 01728 Construction (AS) 08/1998 08/2008 5.750% 3,181 01729 Construction (AS) 02/1999 02/2014 5.900% 950 01730 Construction (AS) 07/2000 07/2004 7.000% 10,948 01731 Construction (AS) 01/2001 01/2010 6.050% 68 01732 Construction (AS) 03/2002 03/2005 4.600% 1,990 01733 Construction (AS) 10/2002 10/2005 3.000% 45,062 01734 Construction (AS) 01/2004 01/2007 2.500% 13,357 01735 Construction (AS) 11/2004 11/2008 3.750% 7,990 01736 Construction (AS) 09/2006 09/2010 4.950% 9,681 01737 Construction (AS) 01/2008 01/2012 3.200% 10,000 01738 Construction (AS) 09/2008 09/2012 3.444% 10,000 01739 Construction (AS) 09/2009 09/2014 2.746% 14,000 01740 Construction (AS) 02/2010 02/2015 0.165% 7,500 01741 Construction (AS) 08/2010 08/2015 1.619% 5,000 01742 Construction (AS) 06/2011 06/2016 1.957% 7,000 01743 Construction (AS) 08/2011 08/2016 1.423% 3,500 01744 Construction (AS) 01/2012 09/2012 0.146% 10,000 01745 Construction (AS) 06/2012 09/2015 0.671% 7,700 01746 Construction (AS) 11/2012 11/2018 1.109% 5,250 5,2501747 Construction (AS) 04/2013 04/2017 0.622% 2,450 01748 Construction (AS) 06/2013 06/2017 1.271% 3,000 3,000 06/2018 0.75%1749 Construction (AS) 08/2013 08/2017 1.494% 2,000 2,000 08/2018 0.75%1750 Construction (AS) 10/2013 10/2019 2.039% 4,200 4,2001751 Construction (AS) 10/2013 10/2019 2.039% 5,000 5,0001752 Construction (AS) 01/2014 01/2020 2.183% 1,750 1,7501753 Construction (AS) 01/2014 01/2020 2.183% 2,000 2,0001754 Construction (AS) 02/2014 09/2014 0.117% 950 01755 Construction (AS) 04/2014 03/2020 0.947% 1,400 1,4001756 Construction (AS) 04/2014 03/2020 0.947% 2,000 2,0001757 Construction (AS) 05/2014 04/2020 0.526% 700 7001758 Construction (AS) 07/2014 07/2020 0.674% 1,050 1,0501759 Construction (AS) 11/2014 11/2020 1.809% 2,100 2,1001760 Construction (AS) 12/2014 12/2020 1.922% 1,050 1,0501761 Construction (AS) 02/2015 02/2021 1.761% 1,750 1,7501762 Construction (AS) 05/2015 05/2021 1.898% 2,100 2,1001763 Construction (AS) 09/2015 09/2017 0.744% 7,700 7,700 09/2018 0.75%1764 Construction (AS) 10/2015 10/2021 1.942% 2,800 2,8001765 Construction (AS) 02/2016 02/2022 0.697% 3,000 3,0001766 Construction (AS) 06/2016 09/2016 0.436% 7,000 01767 Construction (AS) 04/2017 01/2018 1.051% 2,450 2,4501768 Corps 09/2015 09/2033 3.134% 4,000 4,0001769 Corps 02/2016 02/2045 0.697% 3,000 3,0001770 Corps 04/2016 04/2031 2.661% 53,000 53,0001771 Corps 05/2016 05/2030 2.599% 15,000 15,0001772 Fish and Wildlife 05/1989 05/1999 8.950% 25,000 01773 Fish and Wildlife 05/1991 05/1996 7.950% 50,000 01774 Fish and Wildlife 02/1993 02/2008 6.950% 20,000 01775 Fish and Wildlife 09/1994 09/1999 7.650% 20,000 01776 Fish and Wildlife 08/1995 08/2010 7.200% 35,000 01777 Fish and Wildlife 01/1998 01/2013 6.100% 60,000 01778 Fish and Wildlife 09/1999 09/2003 6.300% 20,000 01779 Fish and Wildlife 01/2001 01/2005 5.650% 25,000 01780 Fish and Wildlife 09/2003 09/2007 3.100% 20,000 01781 Fish and Wildlife 09/2005 09/2008 4.250% 20,000 01782 Fish and Wildlife 09/2006 09/2010 4.950% 20,000 01783 Fish and Wildlife 06/2007 06/2010 5.350% 30,000 01784 Fish and Wildlife 09/2007 09/2011 4.700% 20,000 01785 Fish and Wildlife 09/2008 09/2012 3.444% 20,000 01786 Fish and Wildlife 06/2009 06/2024 4.556% 20,000 20,0001787 Fish and Wildlife 12/2009 12/2018 4.069% 26,000 26,0001788 Fish and Wildlife 08/2010 08/2019 2.646% 20,000 20,0001789 Fish and Wildlife 01/2011 01/2026 4.440% 50,000 50,0001790 Fish and Wildlife 02/2011 02/2026 4.398% 15,000 15,0001791 Fish and Wildlife 06/2011 06/2026 4.205% 15,000 15,0001792 Fish and Wildlife 01/2012 01/2038 3.893% 30,000 01793 Fish and Wildlife 05/2012 05/2029 0.140% 5,000 01794 Fish and Wildlife 06/2012 06/2041 3.666% 11,000 01795 Fish and Wildlife 08/2012 08/2027 3.090% 11,000 01796 Fish and Wildlife 11/2012 11/2027 5.046% 25,000 01797 Fish and Wildlife 01/2013 09/2013 0.149% 60,000 01798 Fish and Wildlife 03/2013 03/2028 5.445% 10,000 01799 Fish and Wildlife 04/2013 04/2028 5.042% 6,000 01800 Fish and Wildlife 06/2013 06/2028 6.607% 8,000 01801 Fish and Wildlife 08/2013 08/2028 7.249% 5,000 01802 Fish and Wildlife 10/2013 12/2026 3.717% 28,000 28,0001803 Fish and Wildlife 10/2013 05/2027 3.762% 11,000 11,0001804 Fish and Wildlife 10/2013 10/2028 3.880% 22,000 22,000
BP-18-FS-BPA-02A Page 151

TABLE 12A:
HISTORICAL INVESTMENTS
October 1, 2015 - September 30, 2019 Cost Evaluation period
($000s) (FY 2019)
A B C D E F G H
Project In Service Date Due Date Interest Rate Initial Principal Current Principal
Roll Maturity
Date
Rollover
Rate
1805 Fish and Wildlife 11/2013 09/2022 3.125% 31,000 31,0001806 Fish and Wildlife 11/2013 09/2023 3.375% 23,000 23,000 09/2028 3.64%1807 Fish and Wildlife 11/2013 05/2027 0.713% 5,000 5,0001808 Fish and Wildlife 01/2014 01/2029 3.896% 7,000 7,000
BP-18-FS-BPA-02A Page 152

TABLE 12B:
PROJECTED INVESTMENTS
October 1, 2015 - September 30, 2019 Cost Evaluation period
($000s) (FY 2019)
A B C D E F G
Project
In Service
Date
Due
Date Interest Rate
Current
Principal
Roll Maturity
Date
Rollover
Rate
1 Bureau Direct 07/2017 07/2032 2.180% 13,000
2 Bureau Direct 08/2017 08/2032 2.180% 13,000
3 Bureau Direct 09/2017 09/2032 2.180% 14,000
4 Bureau Direct 07/2018 07/2033 3.250% 28,000
5 Bureau Direct 08/2018 08/2034 3.290% 28,000
6 Bureau Direct 09/2018 09/2035 3.330% 29,000
7 Bureau Direct 07/2019 07/2036 3.960% 47,000
8 Bureau Direct 08/2019 08/2037 3.990% 48,000
9 Bureau Direct 09/2019 09/2038 4.030% 48,000
11 Columbia River Fish Mitigation 09/2017 09/2067 2.380% 63,629
12 Columbia River Fish Mitigation 09/2018 09/2068 3.320% 147,186
13 Columbia River Fish Mitigation 09/2019 09/2069 3.870% 63,746
14 Construction (AS) 09/2017 09/2023 1.510% 3,150
15 Construction (AS) 09/2018 09/2024 2.560% 5,600
16 Construction (AS) 09/2019 09/2025 3.270% 5,950
17 Corps 07/2017 07/2032 2.180% 26,796
18 Corps 08/2017 08/2032 2.180% 26,796
19 Corps 09/2017 09/2032 2.180% 27,796
20 Corps 07/2018 07/2033 3.250% 53,000
21 Corps 08/2018 08/2034 3.290% 53,000
22 Corps 09/2018 09/2035 3.330% 53,000
23 Corps 07/2019 07/2036 3.960% 40,000
24 Corps 08/2019 08/2037 3.990% 41,000
25 Corps 09/2019 09/2038 4.030% 41,000
26 Fish and Wildlife 09/2017 09/2032 2.180% 40,000
27 Fish and Wildlife 09/2018 09/2033 3.250% 51,000
28 Fish and Wildlife 09/2019 09/2034 3.890% 44,000
29 Technology (G) 09/2017 09/2022 1.400% 8,000
30 Technology (G) 09/2018 09/2023 2.440% 5,000
31 Technology (G) 09/2019 03/2024 3.160% 5,000
32 Totals: 1,072,650
BP-18-FS-BPA-02A Page 153

TABLE 12C:
Interest Calculation Summary
October 1, 2015 - September 30, 2019 Cost Evaluation Period
($000s) (FY 2019)
A B D E F G H I J
Column 1 Fiscal Year Project Type
Current
Principal Rate Interest Premium
Net Interest
Accrual Total
1 2017 Albeni Falls Historical 3,090 6.744% 208 - - 208
2 2017 Boise Historical 4,425 6.657% 295 - - 295
3 2017 Bonneville 2nd Powerhouse Historical 38,293 7.150% 2,738 - - 2,738
4 2017 Bonneville Dam Historical 135,618 5.283% 7,164 - - 7,164
5 2017 Chief Joseph Historical 37,578 5.043% 1,895 - - 1,895
6 2017 Columbia Basin Historical 97,915 5.669% 5,551 - - 5,551
7 2017 Columbia Basin 3rd Powerhouse Historical 12,631 7.150% 903 - - 903
8 2017 Columbia River Fish Mitigation Historical 1,422,823 4.370% 62,178 - - 62,178
9 2017 Cougar Historical 16,710 4.580% 765 - - 765
10 2017 Detroit Lake/Big Cliff Historical 2,168 4.673% 101 - - 101
11 2017 Dworshak Historical 13,495 6.331% 854 - - 854
12 2017 Green Peter/Foster Historical 863 4.287% 37 - - 37
13 2017 Hills Creek Historical 2,867 5.972% 171 - - 171
14 2017 Hungry Horse Dam Historical 11,549 6.139% 709 - - 709
15 2017 Ice Harbor Historical 19,152 4.811% 921 - - 921
16 2017 John Day Historical 30,473 5.425% 1,653 - - 1,653
17 2017 Libby Historical 22,777 6.652% 1,515 - - 1,515
18 2017 Little Goose Historical 14,231 6.058% 862 - - 862
19 2017 Lookout Dam Historical 13,543 5.467% 740 - - 740
20 2017 Lost Creek Historical 272 6.370% 17 - - 17
21 2017 Lower Granite Historical 18,878 4.558% 860 - - 860
22 2017 Lower Monument Historical 13,764 5.380% 741 - - 741
23 2017 Lower Snake Fish and Wildlife Historical 233,996 7.082% 16,572 - - 16,572
24 2017 McNary Historical 15,096 4.927% 744 - - 744
25 2017 Minidoka/Palisades Historical 70,403 6.071% 4,274 - - 4,274
26 2017 RRP - Green Springs Historical 11,148 5.874% 655 - - 655
27 2017 The Dalles Historical 46,132 5.230% 2,413 - - 2,413
28 2017 Yakima Chandler/Kenniwick Historical 848 5.111% 43 - - 43
29 2017 Yakima Roza Historical 14 5.878% 1 - - 1
30 2017 Bureau Direct Historical 991,000 3.017% 29,897 - - 29,897
31 2017 Bureau Direct New 26,000 - - - 71 71
32 2017 Conservation Historical 422,000 2.216% 9,352 - - 9,352
33 2017 Conservation New 20,000 0.263% 53 - 35 87
34 2017 Construction (AS) Historical 48,850 1.440% 704 - (9) 695
35 2017 Construction (AS) New 2,450 0.263% 6 - 4 11
36 2017 Corps Historical 75,000 2.595% 1,946 - - 1,946
37 2017 Corps New 53,592 - - - 146 146
38 2017 Fish and Wildlife Historical 340,000 3.223% 10,958 - - 10,958
39 2017 Technology (G) Historical 41,000 1.353% 555 - - 555
40 2017 Float Historical - - (632) - - (632)
41 FY 2017 Subtotal: 4,330,645 168,420 - 247 168,667
42 2018 Albeni Falls Historical 580 4.988% 29 - - 29
43 2018 Boise Historical 1,060 5.091% 54 - - 54
44 2018 Bonneville Dam Historical 131,701 5.227% 6,884 - - 6,884
45 2018 Chief Joseph Historical 29,608 4.475% 1,325 - - 1,325
46 2018 Columbia Basin Historical 90,988 5.556% 5,055 - - 5,055
47 2018 Columbia River Fish Mitigation Historical 1,430,683 4.183% 59,849 - - 59,849
48 2018 Cougar Historical 16,684 4.576% 763 - - 763
49 2018 Detroit Lake/Big Cliff Historical 2,130 4.629% 99 - - 99
50 2018 Dworshak Historical 4,692 4.795% 225 - - 225
51 2018 Green Peter/Foster Historical 837 4.198% 35 - - 35
52 2018 Hills Creek Historical 209 3.888% 8 - - 8
53 2018 Hungry Horse Dam Historical 5,231 4.918% 257 - - 257
54 2018 Ice Harbor Historical 18,167 4.715% 857 - - 857
55 2018 John Day Historical 19,039 4.537% 864 - - 864
56 2018 Libby Historical 7,336 5.603% 411 - - 411
57 2018 Little Goose Historical 8,129 5.239% 426 - - 426
58 2018 Lookout Dam Historical 8,373 5.052% 423 - - 423
59 2018 Lost Creek Historical 154 5.774% 9 - - 9
60 2018 Lower Granite Historical 17,567 4.364% 767 - - 767
61 2018 Lower Monument Historical 11,604 5.051% 586 - - 586
62 2018 Lower Snake Fish and Wildlife Historical 5,152 4.370% 225 - - 225
63 2018 McNary Historical 14,461 4.829% 698 - - 698
64 2018 Minidoka/Palisades Historical 19,492 3.253% 634 - - 634
65 2018 RRP - Green Springs Historical 11,148 5.874% 655 - - 655
66 2018 The Dalles Historical 41,553 5.082% 2,112 - - 2,112
67 2018 Yakima Chandler/Kenniwick Historical 848 5.111% 43 - - 43
68 2018 Yakima Roza Historical 14 5.878% 1 - - 1
69 2018 Bureau Direct Historical 1,031,000 2.984% 30,768 - - 30,768
70 2018 Bureau Direct New 56,000 - - - 228 228
71 2018 Conservation Historical 442,000 2.128% 9,407 - (51) 9,356
72 2018 Construction (AS) Historical 54,450 1.245% 678 - (7) 670
73 2018 Corps Historical 156,389 2.378% 3,719 - - 3,719
74 2018 Corps New 106,000 - - - 432 432
75 2018 Fish and Wildlife Historical 380,000 3.113% 11,830 - - 11,830
76 2018 Technology (G) Historical 49,000 1.360% 667 - - 667
77 2018 Float Historical - - (611) - - (611)
78 FY 2018 Subtotal: 4,172,280 139,752 - 601 140,353
79 2019 Albeni Falls Historical 580 4.988% 29 - - 29
80 2019 Boise Historical 1,060 5.091% 54 - - 54
81 2019 Bonneville Dam Historical 107,256 5.022% 5,387 - - 5,387
BP-18-FS-BPA-02A Page 154

TABLE 12C:
Interest Calculation Summary
October 1, 2015 - September 30, 2019 Cost Evaluation Period
($000s) (FY 2019)
A B D E F G H I J
Column 1 Fiscal Year Project Type
Current
Principal Rate Interest Premium
Net Interest
Accrual Total
82 2019 Chief Joseph Historical 29,608 4.475% 1,325 - - 1,325
83 2019 Columbia Basin Historical 90,988 5.556% 5,055 - - 5,055
84 2019 Columbia River Fish Mitigation Historical 1,541,604 4.056% 62,523 - - 62,523
85 2019 Cougar Historical 16,684 4.576% 763 - - 763
86 2019 Detroit Lake/Big Cliff Historical 2,130 4.629% 99 - - 99
87 2019 Dworshak Historical 4,692 4.795% 225 - - 225
88 2019 Green Peter/Foster Historical 638 3.673% 23 - - 23
89 2019 Hills Creek Historical 202 3.813% 8 - - 8
90 2019 Hungry Horse Dam Historical 4,679 4.806% 225 - - 225
91 2019 Ice Harbor Historical 17,402 4.664% 812 - - 812
92 2019 John Day Historical 18,421 4.492% 827 - - 827
93 2019 Libby Historical 1,774 4.751% 84 - - 84
94 2019 Little Goose Historical 3,521 4.406% 155 - - 155
95 2019 Lookout Dam Historical 8,373 5.052% 423 - - 423
96 2019 Lost Creek Historical 7 3.748% - -
97 2019 Lower Granite Historical 15,542 4.168% 648 - - 648
98 2019 Lower Monument Historical 8,303 4.723% 392 - - 392
99 2019 Lower Snake Fish and Wildlife Historical 4,827 4.268% 206 - - 206
100 2019 McNary Historical 13,414 4.747% 637 - - 637
101 2019 Minidoka/Palisades Historical 19,450 3.247% 632 - - 632
102 2019 RRP - Green Springs Historical 3 3.244% - -
103 2019 The Dalles Historical 41,553 5.082% 2,112 - - 2,112
104 2019 Yakima Chandler/Kenniwick Historical 848 5.111% 43 - - 43
105 2019 Bureau Direct Historical 1,116,000 3.001% 33,493 - (1,121) 32,372
106 2019 Bureau Direct New 95,000 - - - 469 469
107 2019 Conservation Historical 413,000 2.240% 9,252 - - 9,252
108 2019 Construction (AS) Historical 44,900 1.640% 736 - (20) 717
109 2019 Corps Historical 315,389 2.836% 8,945 - - 8,945
110 2019 Corps New 81,000 - - - 400 400
111 2019 Fish and Wildlife Historical 431,000 3.007% 12,958 - (309) 12,649
112 2019 Technology (G) Historical 54,000 1.460% 789 - - 789
113 2019 Float Historical - - (1,144) - - (1,144)
114 FY 2019 Subtotal: 4,503,846 147,718 - (582) 147,136
115 2020 Albeni Falls Historical 580 4.988% 29 - - 29
116 2020 Boise Historical 1,060 5.091% 54 - - 54
117 2020 Bonneville Dam Historical 107,256 5.022% 5,387 - - 5,387
118 2020 Chief Joseph Historical 29,608 4.475% 1,325 - - 1,325
119 2020 Columbia Basin Historical 76,752 5.497% 4,219 - - 4,219
120 2020 Columbia River Fish Mitigation Historical 1,602,497 4.045% 64,822 - - 64,822
121 2020 Cougar Historical 16,684 4.576% 763 - - 763
122 2020 Detroit Lake/Big Cliff Historical 1,848 4.439% 82 - - 82
123 2020 Dworshak Historical 4,692 4.795% 225 - - 225
124 2020 Green Peter/Foster Historical 638 3.673% 23 - - 23
125 2020 Hills Creek Historical 202 3.813% 8 - - 8
126 2020 Hungry Horse Dam Historical 4,679 4.806% 225 - - 225
127 2020 Ice Harbor Historical 17,402 4.664% 812 - - 812
128 2020 John Day Historical 18,421 4.492% 827 - - 827
129 2020 Libby Historical 1,774 4.751% 84 - - 84
130 2020 Little Goose Historical 3,521 4.406% 155 - - 155
131 2020 Lookout Dam Historical 8,373 5.052% 423 - - 423
132 2020 Lost Creek Historical 7 3.748% - -
133 2020 Lower Granite Historical 15,542 4.168% 648 - - 648
134 2020 Lower Monument Historical 8,303 4.723% 392 - - 392
135 2020 Lower Snake Fish and Wildlife Historical 4,827 4.268% 206 - - 206
136 2020 McNary Historical 13,414 4.747% 637 - - 637
137 2020 Minidoka/Palisades Historical 19,450 3.247% 632 - - 632
138 2020 RRP - Green Springs Historical 3 3.244% - -
139 2020 The Dalles Historical 41,553 5.082% 2,112 - - 2,112
140 2020 Yakima Chandler/Kenniwick Historical 848 5.111% 43 - - 43
141 2020 Bureau Direct Historical 1,154,000 3.161% 36,480 - (1,023) 35,458
142 2020 Conservation Historical 413,000 2.240% 9,252 - - 9,252
143 2020 Construction (AS) Historical 45,600 1.647% 751 - (94) 657
144 2020 Corps Historical 437,389 3.158% 13,813 - - 13,813
145 2020 Fish and Wildlife Historical 429,000 3.173% 13,613 - - 13,613
146 2020 Replacements New 218,435 2.215% 4,838 - - 4,838
147 2020 Technology (G) Historical 59,000 1.604% 947 - - 947
148 2020 Float Historical - - (975) - - (975)
149 FY 2020 Subtotal: 4,756,356 162,853 - (1,117) 161,736
BP-18-FS-BPA-02A Page 155

TABLE 12C:
Interest Calculation Summary
October 1, 2015 - September 30, 2019 Cost Evaluation Period
($000s) (FY 2019)
A B D E F G H I J
Column 1 Fiscal Year Project Type
Current
Principal Rate Interest Premium
Net Interest
Accrual Total
150 2021 Albeni Falls Historical 580 4.988% 29 - - 29
151 2021 Boise Historical 1,060 5.091% 54 - - 54
152 2021 Bonneville Dam Historical 107,256 5.022% 5,387 - - 5,387
153 2021 Chief Joseph Historical 29,608 4.475% 1,325 - - 1,325
154 2021 Columbia Basin Historical 70,209 5.462% 3,835 - - 3,835
155 2021 Columbia River Fish Mitigation Historical 1,602,497 4.045% 64,822 - - 64,822
156 2021 Cougar Historical 16,684 4.576% 763 - - 763
157 2021 Detroit Lake/Big Cliff Historical 1,848 4.439% 82 - - 82
158 2021 Dworshak Historical 4,692 4.795% 225 - - 225
159 2021 Green Peter/Foster Historical 638 3.673% 23 - - 23
160 2021 Hills Creek Historical 202 3.813% 8 - - 8
161 2021 Hungry Horse Dam Historical 4,679 4.806% 225 - - 225
162 2021 Ice Harbor Historical 17,402 4.664% 812 - - 812
163 2021 John Day Historical 18,421 4.492% 827 - - 827
164 2021 Libby Historical 1,774 4.751% 84 - - 84
165 2021 Little Goose Historical 3,521 4.406% 155 - - 155
166 2021 Lookout Dam Historical 8,373 5.052% 423 - - 423
167 2021 Lost Creek Historical 7 3.748% - -
168 2021 Lower Granite Historical 15,542 4.168% 648 - - 648
169 2021 Lower Monument Historical 8,303 4.723% 392 - - 392
170 2021 Lower Snake Fish and Wildlife Historical 4,827 4.268% 206 - - 206
171 2021 McNary Historical 13,414 4.747% 637 - - 637
172 2021 Minidoka/Palisades Historical 19,450 3.247% 632 - - 632
173 2021 RRP - Green Springs Historical 3 3.244% - -
174 2021 The Dalles Historical 41,553 5.082% 2,112 - - 2,112
175 2021 Yakima Chandler/Kenniwick Historical 848 5.111% 43 - - 43
176 2021 Bureau Direct Historical 1,034,000 3.282% 33,936 - (165) 33,771
177 2021 Conservation Historical 413,000 2.240% 9,252 - (80) 9,173
178 2021 Construction (AS) Historical 27,500 1.982% 545 - (34) 511
179 2021 Corps Historical 437,389 3.158% 13,813 - - 13,813
180 2021 Fish and Wildlife Historical 429,000 3.173% 13,613 - - 13,613
181 2021 Replacements Historical 218,435 4.430% 9,677 - - 9,677
182 2021 Replacements New 218,435 2.215% 4,838 - - 4,838
183 2021 Technology (G) Historical 59,000 1.169% 690 - (85) 605
184 2021 Float Historical - - (1,006) - - (1,006)
185 FY 2021 Subtotal: 4,830,148 169,108 - (363) 168,745
186 2022 Albeni Falls Historical 580 4.988% 29 - - 29
187 2022 Boise Historical 1,060 5.091% 54 - - 54
188 2022 Bonneville Dam Historical 107,256 5.022% 5,387 - - 5,387
189 2022 Chief Joseph Historical 29,608 4.475% 1,325 - - 1,325
190 2022 Columbia Basin Historical 68,069 5.449% 3,709 - - 3,709
191 2022 Columbia River Fish Mitigation Historical 1,602,497 4.045% 64,822 - - 64,822
192 2022 Cougar Historical 16,684 4.576% 763 - - 763
193 2022 Detroit Lake/Big Cliff Historical 1,848 4.439% 82 - - 82
194 2022 Dworshak Historical 4,692 4.795% 225 - - 225
195 2022 Green Peter/Foster Historical 638 3.673% 23 - - 23
196 2022 Hills Creek Historical 202 3.813% 8 - - 8
197 2022 Hungry Horse Dam Historical 4,679 4.806% 225 - - 225
198 2022 Ice Harbor Historical 17,402 4.664% 812 - - 812
199 2022 John Day Historical 18,421 4.492% 827 - - 827
200 2022 Libby Historical 1,774 4.751% 84 - - 84
201 2022 Little Goose Historical 3,521 4.406% 155 - - 155
202 2022 Lookout Dam Historical 8,373 5.052% 423 - - 423
203 2022 Lost Creek Historical 7 3.748% - -
204 2022 Lower Granite Historical 15,542 4.168% 648 - - 648
205 2022 Lower Monument Historical 8,303 4.723% 392 - - 392
206 2022 Lower Snake Fish and Wildlife Historical 4,827 4.268% 206 - - 206
207 2022 McNary Historical 13,414 4.747% 637 - - 637
208 2022 Minidoka/Palisades Historical 19,450 3.247% 632 - - 632
209 2022 RRP - Green Springs Historical 3 3.244% - -
210 2022 The Dalles Historical 41,553 5.082% 2,112 - - 2,112
211 2022 Yakima Chandler/Kenniwick Historical 848 5.111% 43 - - 43
212 2022 Bureau Direct Historical 937,000 3.351% 31,396 - - 31,396
213 2022 Conservation Historical 394,000 2.227% 8,774 - (58) 8,715
214 2022 Construction (AS) Historical 20,500 2.064% 423 - (24) 399
215 2022 Corps Historical 437,389 3.158% 13,813 - - 13,813
216 2022 Fish and Wildlife Historical 429,000 3.173% 13,613 - - 13,613
217 2022 Replacements Historical 436,871 4.430% 19,353 - - 19,353
218 2022 Replacements New 218,435 2.215% 4,838 - - 4,838
219 2022 Technology (G) Historical 24,000 1.802% 432 - (7) 426
220 2022 Float Historical - - (898) - - (898)
221 FY 2022 Subtotal: 4,888,444 175,369 - (89) 175,279
222 2023 Albeni Falls Historical 580 4.988% 29 - - 29
223 2023 Boise Historical 1,060 5.091% 54 - - 54
224 2023 Bonneville Dam Historical 107,256 5.022% 5,387 - - 5,387
225 2023 Chief Joseph Historical 29,608 4.475% 1,325 - - 1,325
226 2023 Columbia Basin Historical 30,368 4.920% 1,494 - - 1,494
227 2023 Columbia River Fish Mitigation Historical 1,602,497 4.045% 64,822 - - 64,822
228 2023 Cougar Historical 16,684 4.576% 763 - - 763
229 2023 Detroit Lake/Big Cliff Historical 1,848 4.439% 82 - - 82
230 2023 Dworshak Historical 4,692 4.795% 225 - - 225
BP-18-FS-BPA-02A Page 156
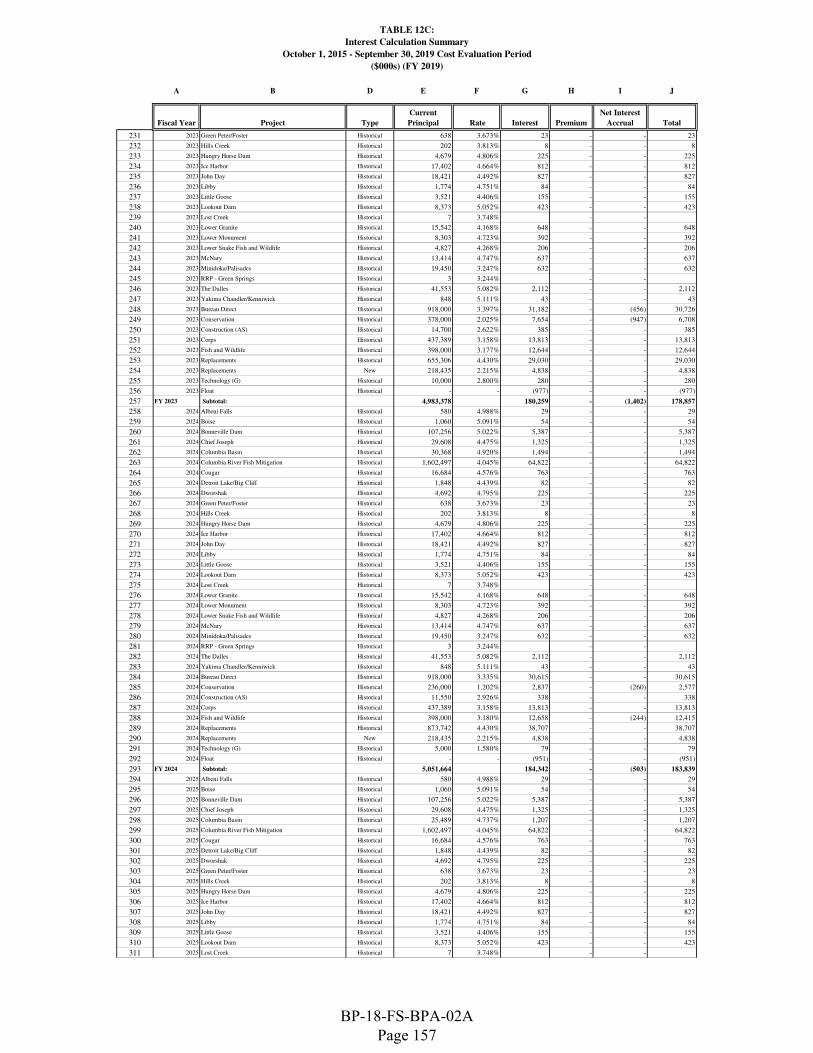
TABLE 12C:
Interest Calculation Summary
October 1, 2015 - September 30, 2019 Cost Evaluation Period
($000s) (FY 2019)
A B D E F G H I J
Column 1 Fiscal Year Project Type
Current
Principal Rate Interest Premium
Net Interest
Accrual Total
231 2023 Green Peter/Foster Historical 638 3.673% 23 - - 23
232 2023 Hills Creek Historical 202 3.813% 8 - - 8
233 2023 Hungry Horse Dam Historical 4,679 4.806% 225 - - 225
234 2023 Ice Harbor Historical 17,402 4.664% 812 - - 812
235 2023 John Day Historical 18,421 4.492% 827 - - 827
236 2023 Libby Historical 1,774 4.751% 84 - - 84
237 2023 Little Goose Historical 3,521 4.406% 155 - - 155
238 2023 Lookout Dam Historical 8,373 5.052% 423 - - 423
239 2023 Lost Creek Historical 7 3.748% - -
240 2023 Lower Granite Historical 15,542 4.168% 648 - - 648
241 2023 Lower Monument Historical 8,303 4.723% 392 - - 392
242 2023 Lower Snake Fish and Wildlife Historical 4,827 4.268% 206 - - 206
243 2023 McNary Historical 13,414 4.747% 637 - - 637
244 2023 Minidoka/Palisades Historical 19,450 3.247% 632 - - 632
245 2023 RRP - Green Springs Historical 3 3.244% - -
246 2023 The Dalles Historical 41,553 5.082% 2,112 - - 2,112
247 2023 Yakima Chandler/Kenniwick Historical 848 5.111% 43 - - 43
248 2023 Bureau Direct Historical 918,000 3.397% 31,182 - (456) 30,726
249 2023 Conservation Historical 378,000 2.025% 7,654 - (947) 6,708
250 2023 Construction (AS) Historical 14,700 2.622% 385 - - 385
251 2023 Corps Historical 437,389 3.158% 13,813 - - 13,813
252 2023 Fish and Wildlife Historical 398,000 3.177% 12,644 - - 12,644
253 2023 Replacements Historical 655,306 4.430% 29,030 - - 29,030
254 2023 Replacements New 218,435 2.215% 4,838 - - 4,838
255 2023 Technology (G) Historical 10,000 2.800% 280 - - 280
256 2023 Float Historical - - (977) - - (977)
257 FY 2023 Subtotal: 4,983,378 180,259 - (1,402) 178,857
258 2024 Albeni Falls Historical 580 4.988% 29 - - 29
259 2024 Boise Historical 1,060 5.091% 54 - - 54
260 2024 Bonneville Dam Historical 107,256 5.022% 5,387 - - 5,387
261 2024 Chief Joseph Historical 29,608 4.475% 1,325 - - 1,325
262 2024 Columbia Basin Historical 30,368 4.920% 1,494 - - 1,494
263 2024 Columbia River Fish Mitigation Historical 1,602,497 4.045% 64,822 - - 64,822
264 2024 Cougar Historical 16,684 4.576% 763 - - 763
265 2024 Detroit Lake/Big Cliff Historical 1,848 4.439% 82 - - 82
266 2024 Dworshak Historical 4,692 4.795% 225 - - 225
267 2024 Green Peter/Foster Historical 638 3.673% 23 - - 23
268 2024 Hills Creek Historical 202 3.813% 8 - - 8
269 2024 Hungry Horse Dam Historical 4,679 4.806% 225 - - 225
270 2024 Ice Harbor Historical 17,402 4.664% 812 - - 812
271 2024 John Day Historical 18,421 4.492% 827 - - 827
272 2024 Libby Historical 1,774 4.751% 84 - - 84
273 2024 Little Goose Historical 3,521 4.406% 155 - - 155
274 2024 Lookout Dam Historical 8,373 5.052% 423 - - 423
275 2024 Lost Creek Historical 7 3.748% - -
276 2024 Lower Granite Historical 15,542 4.168% 648 - - 648
277 2024 Lower Monument Historical 8,303 4.723% 392 - - 392
278 2024 Lower Snake Fish and Wildlife Historical 4,827 4.268% 206 - - 206
279 2024 McNary Historical 13,414 4.747% 637 - - 637
280 2024 Minidoka/Palisades Historical 19,450 3.247% 632 - - 632
281 2024 RRP - Green Springs Historical 3 3.244% - -
282 2024 The Dalles Historical 41,553 5.082% 2,112 - - 2,112
283 2024 Yakima Chandler/Kenniwick Historical 848 5.111% 43 - - 43
284 2024 Bureau Direct Historical 918,000 3.335% 30,615 - - 30,615
285 2024 Conservation Historical 236,000 1.202% 2,837 - (260) 2,577
286 2024 Construction (AS) Historical 11,550 2.926% 338 - - 338
287 2024 Corps Historical 437,389 3.158% 13,813 - - 13,813
288 2024 Fish and Wildlife Historical 398,000 3.180% 12,658 - (244) 12,415
289 2024 Replacements Historical 873,742 4.430% 38,707 - - 38,707
290 2024 Replacements New 218,435 2.215% 4,838 - - 4,838
291 2024 Technology (G) Historical 5,000 1.580% 79 - - 79
292 2024 Float Historical - - (951) - - (951)
293 FY 2024 Subtotal: 5,051,664 184,342 - (503) 183,839
294 2025 Albeni Falls Historical 580 4.988% 29 - - 29
295 2025 Boise Historical 1,060 5.091% 54 - - 54
296 2025 Bonneville Dam Historical 107,256 5.022% 5,387 - - 5,387
297 2025 Chief Joseph Historical 29,608 4.475% 1,325 - - 1,325
298 2025 Columbia Basin Historical 25,489 4.737% 1,207 - - 1,207
299 2025 Columbia River Fish Mitigation Historical 1,602,497 4.045% 64,822 - - 64,822
300 2025 Cougar Historical 16,684 4.576% 763 - - 763
301 2025 Detroit Lake/Big Cliff Historical 1,848 4.439% 82 - - 82
302 2025 Dworshak Historical 4,692 4.795% 225 - - 225
303 2025 Green Peter/Foster Historical 638 3.673% 23 - - 23
304 2025 Hills Creek Historical 202 3.813% 8 - - 8
305 2025 Hungry Horse Dam Historical 4,679 4.806% 225 - - 225
306 2025 Ice Harbor Historical 17,402 4.664% 812 - - 812
307 2025 John Day Historical 18,421 4.492% 827 - - 827
308 2025 Libby Historical 1,774 4.751% 84 - - 84
309 2025 Little Goose Historical 3,521 4.406% 155 - - 155
310 2025 Lookout Dam Historical 8,373 5.052% 423 - - 423
311 2025 Lost Creek Historical 7 3.748% - -
BP-18-FS-BPA-02A Page 157

TABLE 12C:
Interest Calculation Summary
October 1, 2015 - September 30, 2019 Cost Evaluation Period
($000s) (FY 2019)
A B D E F G H I J
Column 1 Fiscal Year Project Type
Current
Principal Rate Interest Premium
Net Interest
Accrual Total
312 2025 Lower Granite Historical 15,542 4.168% 648 - - 648
313 2025 Lower Monument Historical 8,303 4.723% 392 - - 392
314 2025 Lower Snake Fish and Wildlife Historical 4,827 4.268% 206 - - 206
315 2025 McNary Historical 13,414 4.747% 637 - - 637
316 2025 Minidoka/Palisades Historical 19,450 3.247% 632 - - 632
317 2025 RRP - Green Springs Historical 3 3.244% - -
318 2025 The Dalles Historical 41,553 5.082% 2,112 - - 2,112
319 2025 Yakima Chandler/Kenniwick Historical 848 5.111% 43 - - 43
320 2025 Bureau Direct Historical 918,000 3.335% 30,615 - - 30,615
321 2025 Conservation Historical 139,000 1.507% 2,095 - (104) 1,991
322 2025 Construction (AS) Historical 5,950 3.270% 195 - - 195
323 2025 Corps Historical 437,389 3.158% 13,813 - - 13,813
324 2025 Fish and Wildlife Historical 373,000 3.137% 11,699 - - 11,699
325 2025 Replacements Historical 1,092,177 4.430% 48,383 - - 48,383
326 2025 Replacements New 218,435 2.215% 4,838 - - 4,838
327 2025 Float Historical - - (847) - - (847)
328 FY 2025 Subtotal: 5,132,620 191,914 - (104) 191,810
329 2026 Albeni Falls Historical 580 4.988% 29 - - 29
330 2026 Boise Historical 1,060 5.091% 54 - - 54
331 2026 Bonneville Dam Historical 104,278 5.000% 5,213 - - 5,213
332 2026 Chief Joseph Historical 29,261 4.459% 1,305 - - 1,305
333 2026 Columbia Basin Historical 21,762 4.542% 988 - - 988
334 2026 Columbia River Fish Mitigation Historical 1,593,700 4.037% 64,338 - - 64,338
335 2026 Cougar Historical 16,684 4.576% 763 - - 763
336 2026 Detroit Lake/Big Cliff Historical 1,830 4.428% 81 - - 81
337 2026 Dworshak Historical 4,493 4.764% 214 - - 214
338 2026 Green Peter/Foster Historical 638 3.673% 23 - - 23
339 2026 Hills Creek Historical 200 3.800% 8 - - 8
340 2026 Hungry Horse Dam Historical 4,679 4.806% 225 - - 225
341 2026 Ice Harbor Historical 12,768 4.396% 561 - - 561
342 2026 John Day Historical 14,911 4.284% 639 - - 639
343 2026 Libby Historical 1,774 4.751% 84 - - 84
344 2026 Little Goose Historical 3,494 4.398% 154 - - 154
345 2026 Lookout Dam Historical 8,373 5.052% 423 - - 423
346 2026 Lost Creek Historical 7 3.748% - -
347 2026 Lower Granite Historical 13,411 3.964% 532 - - 532
348 2026 Lower Monument Historical 8,273 4.720% 391 - - 391
349 2026 Lower Snake Fish and Wildlife Historical 3,930 3.987% 157 - - 157
350 2026 McNary Historical 13,414 4.747% 637 - - 637
351 2026 Minidoka/Palisades Historical 19,450 3.247% 632 - - 632
352 2026 RRP - Green Springs Historical 3 3.244% - -
353 2026 The Dalles Historical 40,327 5.070% 2,044 - - 2,044
354 2026 Yakima Chandler/Kenniwick Historical 848 5.111% 43 - - 43
355 2026 Bureau Direct Historical 918,000 3.335% 30,615 - - 30,615
356 2026 Conservation Historical 70,000 1.338% 937 - (533) 404
357 2026 Corps Historical 437,389 3.158% 13,813 - - 13,813
358 2026 Fish and Wildlife Historical 373,000 2.751% 10,259 - (580) 9,680
359 2026 Replacements Historical 1,310,612 4.430% 58,060 - - 58,060
360 2026 Replacements New 218,435 2.215% 4,838 - - 4,838
361 2026 Float Historical - - (928) - - (928)
362 FY 2026 Subtotal: 5,247,585 197,134 - (1,113) 196,021
363 2027 Albeni Falls Historical 580 4.988% 29 - - 29
364 2027 Boise Historical 1,060 5.091% 54 - - 54
365 2027 Bonneville Dam Historical 104,278 5.000% 5,213 - - 5,213
366 2027 Chief Joseph Historical 29,261 4.459% 1,305 - - 1,305
367 2027 Columbia Basin Historical 21,762 4.542% 988 - - 988
368 2027 Columbia River Fish Mitigation Historical 1,593,700 4.037% 64,338 - - 64,338
369 2027 Cougar Historical 16,684 4.576% 763 - - 763
370 2027 Detroit Lake/Big Cliff Historical 1,830 4.428% 81 - - 81
371 2027 Dworshak Historical 4,493 4.764% 214 - - 214
372 2027 Green Peter/Foster Historical 638 3.673% 23 - - 23
373 2027 Hills Creek Historical 200 3.800% 8 - - 8
374 2027 Hungry Horse Dam Historical 4,679 4.806% 225 - - 225
375 2027 Ice Harbor Historical 11,778 4.314% 508 - - 508
376 2027 John Day Historical 14,911 4.284% 639 - - 639
377 2027 Libby Historical 1,774 4.751% 84 - - 84
378 2027 Little Goose Historical 3,494 4.398% 154 - - 154
379 2027 Lookout Dam Historical 8,373 5.052% 423 - - 423
380 2027 Lost Creek Historical 7 3.748% - -
381 2027 Lower Granite Historical 13,411 3.964% 532 - - 532
382 2027 Lower Monument Historical 8,273 4.720% 391 - - 391
383 2027 Lower Snake Fish and Wildlife Historical 3,930 3.987% 157 - - 157
384 2027 McNary Historical 13,414 4.747% 637 - - 637
385 2027 Minidoka/Palisades Historical 19,450 3.247% 632 - - 632
386 2027 RRP - Green Springs Historical 3 3.244% - -
387 2027 The Dalles Historical 40,327 5.070% 2,044 - - 2,044
388 2027 Yakima Chandler/Kenniwick Historical 848 5.111% 43 - - 43
389 2027 Bureau Direct Historical 918,000 3.335% 30,615 - - 30,615
390 2027 Conservation Historical 31,000 0.682% 211 - - 211
BP-18-FS-BPA-02A Page 158

TABLE 12C:
Interest Calculation Summary
October 1, 2015 - September 30, 2019 Cost Evaluation Period
($000s) (FY 2019)
A B D E F G H I J
Column 1 Fiscal Year Project Type
Current
Principal Rate Interest Premium
Net Interest
Accrual Total
391 2027 Corps Historical 437,389 3.158% 13,813 - - 13,813
392 2027 Fish and Wildlife Historical 293,000 2.618% 7,670 - (435) 7,236
393 2027 Replacements Historical 1,529,048 4.430% 67,737 - - 67,737
394 2027 Replacements New 218,435 2.215% 4,838 - - 4,838
395 2027 Float Historical - - (889) - - (889)
396 FY 2027 Subtotal: 5,346,031 203,482 - (435) 203,047
397 2028 Albeni Falls Historical 580 4.988% 29 - - 29
398 2028 Boise Historical 1,060 5.091% 54 - - 54
399 2028 Bonneville Dam Historical 84,910 4.914% 4,172 - - 4,172
400 2028 Chief Joseph Historical 29,261 4.459% 1,305 - - 1,305
401 2028 Columbia Basin Historical 21,762 4.542% 988 - - 988
402 2028 Columbia River Fish Mitigation Historical 1,572,958 4.019% 63,224 - - 63,224
403 2028 Cougar Historical 16,684 4.576% 763 - - 763
404 2028 Detroit Lake/Big Cliff Historical 1,830 4.428% 81 - - 81
405 2028 Dworshak Historical 3,864 4.665% 180 - - 180
406 2028 Green Peter/Foster Historical 638 3.673% 23 - - 23
407 2028 Hills Creek Historical 200 3.800% 8 - - 8
408 2028 Hungry Horse Dam Historical 4,679 4.806% 225 - - 225
409 2028 Ice Harbor Historical 7,552 3.720% 281 - - 281
410 2028 John Day Historical 12,081 4.029% 487 - - 487
411 2028 Libby Historical 1,774 4.751% 84 - - 84
412 2028 Little Goose Historical 3,426 4.379% 150 - - 150
413 2028 Lookout Dam Historical 8,373 5.052% 423 - - 423
414 2028 Lost Creek Historical 7 3.748% - -
415 2028 Lower Granite Historical 13,411 3.964% 532 - - 532
416 2028 Lower Monument Historical 4,850 4.258% 207 - - 207
417 2028 Lower Snake Fish and Wildlife Historical 3,700 3.901% 144 - - 144
418 2028 McNary Historical 7,276 4.218% 307 - - 307
419 2028 Minidoka/Palisades Historical 19,450 3.247% 632 - - 632
420 2028 RRP - Green Springs Historical 3 3.244% - -
421 2028 The Dalles Historical 40,145 5.068% 2,035 - - 2,035
422 2028 Yakima Chandler/Kenniwick Historical 848 5.111% 43 - - 43
423 2028 Bureau Direct Historical 918,000 3.335% 30,615 - - 30,615
424 2028 Conservation Historical 25,000 0.366% 92 - (76) 16
425 2028 Corps Historical 437,389 3.158% 13,813 - - 13,813
426 2028 Fish and Wildlife Historical 238,000 2.775% 6,605 - - 6,605
427 2028 Replacements Historical 1,747,483 4.430% 77,414 - - 77,414
428 2028 Replacements New 218,435 2.215% 4,838 - - 4,838
429 2028 Float Historical - - (784) - - (784)
430 FY 2028 Subtotal: 5,445,630 208,969 - (76) 208,893
431 2029 Albeni Falls Historical 580 4.988% 29 - - 29
432 2029 Boise Historical 1,060 5.091% 54 - - 54
433 2029 Bonneville Dam Historical 84,910 4.914% 4,172 - - 4,172
434 2029 Chief Joseph Historical 29,261 4.459% 1,305 - - 1,305
435 2029 Columbia Basin Historical 21,762 4.542% 988 - - 988
436 2029 Columbia River Fish Mitigation Historical 1,568,334 4.015% 62,975 - - 62,975
437 2029 Cougar Historical 16,684 4.576% 763 - - 763
438 2029 Detroit Lake/Big Cliff Historical 1,830 4.428% 81 - - 81
439 2029 Dworshak Historical 3,864 4.665% 180 - - 180
440 2029 Green Peter/Foster Historical 638 3.673% 23 - - 23
441 2029 Hills Creek Historical 200 3.800% 8 - - 8
442 2029 Hungry Horse Dam Historical 4,679 4.806% 225 - - 225
443 2029 Ice Harbor Historical 7,552 3.720% 281 - - 281
444 2029 John Day Historical 12,081 4.029% 487 - - 487
445 2029 Libby Historical 1,774 4.751% 84 - - 84
446 2029 Little Goose Historical 3,426 4.379% 150 - - 150
447 2029 Lookout Dam Historical 8,373 5.052% 423 - - 423
448 2029 Lost Creek Historical 7 3.748% - -
449 2029 Lower Granite Historical 13,411 3.964% 532 - - 532
450 2029 Lower Monument Historical 4,850 4.258% 207 - - 207
451 2029 Lower Snake Fish and Wildlife Historical 3,700 3.901% 144 - - 144
452 2029 McNary Historical 7,276 4.218% 307 - - 307
453 2029 Minidoka/Palisades Historical 19,450 3.247% 632 - - 632
454 2029 RRP - Green Springs Historical 3 3.244% - -
455 2029 The Dalles Historical 40,145 5.068% 2,035 - - 2,035
456 2029 Yakima Chandler/Kenniwick Historical 848 5.111% 43 - - 43
457 2029 Bureau Direct Historical 893,000 3.254% 29,056 - (325) 28,731
458 2029 Corps Historical 437,389 3.158% 13,813 - - 13,813
459 2029 Fish and Wildlife Historical 212,000 2.402% 5,091 - (426) 4,666
460 2029 Replacements Historical 1,965,919 4.430% 87,090 - - 87,090
461 2029 Replacements New 218,435 2.215% 4,838 - - 4,838
462 2029 Float Historical - - (1,861) - - (1,861)
463 FY 2029 Subtotal: 5,583,441 214,156 - (750) 213,405
BP-18-FS-BPA-02A Page 159
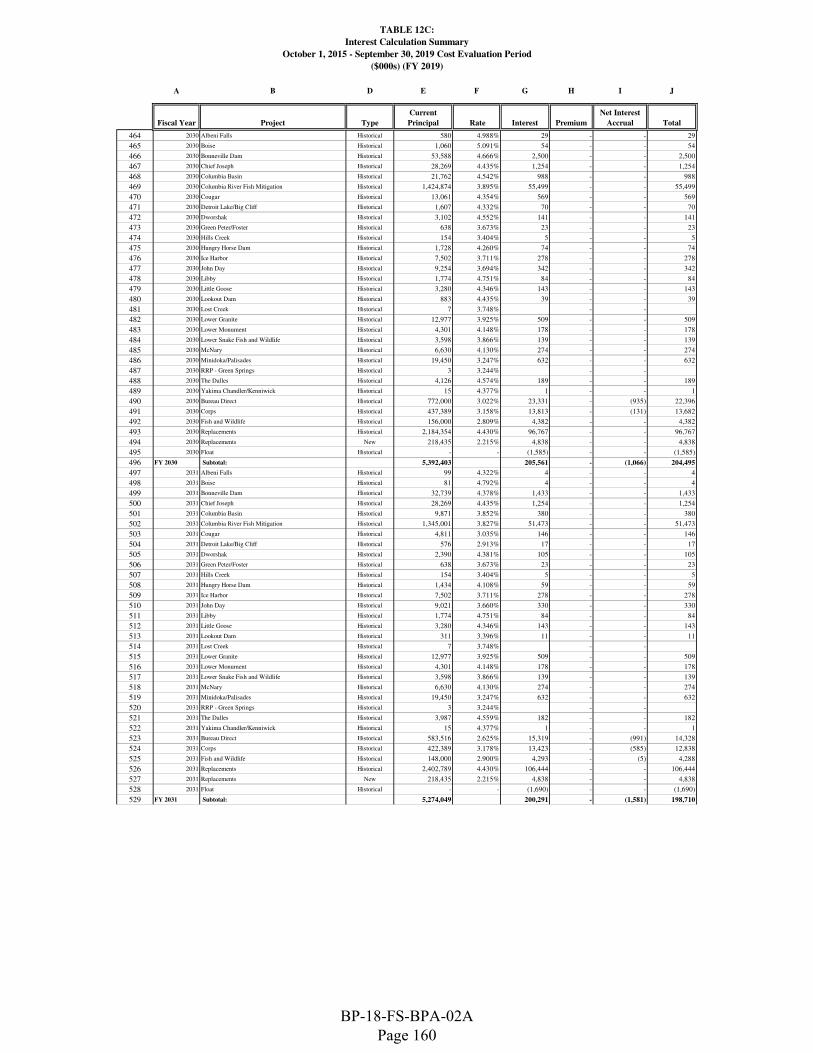
TABLE 12C:
Interest Calculation Summary
October 1, 2015 - September 30, 2019 Cost Evaluation Period
($000s) (FY 2019)
A B D E F G H I J
Column 1 Fiscal Year Project Type
Current
Principal Rate Interest Premium
Net Interest
Accrual Total
464 2030 Albeni Falls Historical 580 4.988% 29 - - 29
465 2030 Boise Historical 1,060 5.091% 54 - - 54
466 2030 Bonneville Dam Historical 53,588 4.666% 2,500 - - 2,500
467 2030 Chief Joseph Historical 28,269 4.435% 1,254 - - 1,254
468 2030 Columbia Basin Historical 21,762 4.542% 988 - - 988
469 2030 Columbia River Fish Mitigation Historical 1,424,874 3.895% 55,499 - - 55,499
470 2030 Cougar Historical 13,061 4.354% 569 - - 569
471 2030 Detroit Lake/Big Cliff Historical 1,607 4.332% 70 - - 70
472 2030 Dworshak Historical 3,102 4.552% 141 - - 141
473 2030 Green Peter/Foster Historical 638 3.673% 23 - - 23
474 2030 Hills Creek Historical 154 3.404% 5 - - 5
475 2030 Hungry Horse Dam Historical 1,728 4.260% 74 - - 74
476 2030 Ice Harbor Historical 7,502 3.711% 278 - - 278
477 2030 John Day Historical 9,254 3.694% 342 - - 342
478 2030 Libby Historical 1,774 4.751% 84 - - 84
479 2030 Little Goose Historical 3,280 4.346% 143 - - 143
480 2030 Lookout Dam Historical 883 4.435% 39 - - 39
481 2030 Lost Creek Historical 7 3.748% - -
482 2030 Lower Granite Historical 12,977 3.925% 509 - - 509
483 2030 Lower Monument Historical 4,301 4.148% 178 - - 178
484 2030 Lower Snake Fish and Wildlife Historical 3,598 3.866% 139 - - 139
485 2030 McNary Historical 6,630 4.130% 274 - - 274
486 2030 Minidoka/Palisades Historical 19,450 3.247% 632 - - 632
487 2030 RRP - Green Springs Historical 3 3.244% - -
488 2030 The Dalles Historical 4,126 4.574% 189 - - 189
489 2030 Yakima Chandler/Kenniwick Historical 15 4.377% 1 - - 1
490 2030 Bureau Direct Historical 772,000 3.022% 23,331 - (935) 22,396
491 2030 Corps Historical 437,389 3.158% 13,813 - (131) 13,682
492 2030 Fish and Wildlife Historical 156,000 2.809% 4,382 - - 4,382
493 2030 Replacements Historical 2,184,354 4.430% 96,767 - - 96,767
494 2030 Replacements New 218,435 2.215% 4,838 - - 4,838
495 2030 Float Historical - - (1,585) - - (1,585)
496 FY 2030 Subtotal: 5,392,403 205,561 - (1,066) 204,495
497 2031 Albeni Falls Historical 99 4.322% 4 - - 4
498 2031 Boise Historical 81 4.792% 4 - - 4
499 2031 Bonneville Dam Historical 32,739 4.378% 1,433 - - 1,433
500 2031 Chief Joseph Historical 28,269 4.435% 1,254 - - 1,254
501 2031 Columbia Basin Historical 9,871 3.852% 380 - - 380
502 2031 Columbia River Fish Mitigation Historical 1,345,001 3.827% 51,473 - - 51,473
503 2031 Cougar Historical 4,811 3.035% 146 - - 146
504 2031 Detroit Lake/Big Cliff Historical 576 2.913% 17 - - 17
505 2031 Dworshak Historical 2,390 4.381% 105 - - 105
506 2031 Green Peter/Foster Historical 638 3.673% 23 - - 23
507 2031 Hills Creek Historical 154 3.404% 5 - - 5
508 2031 Hungry Horse Dam Historical 1,434 4.108% 59 - - 59
509 2031 Ice Harbor Historical 7,502 3.711% 278 - - 278
510 2031 John Day Historical 9,021 3.660% 330 - - 330
511 2031 Libby Historical 1,774 4.751% 84 - - 84
512 2031 Little Goose Historical 3,280 4.346% 143 - - 143
513 2031 Lookout Dam Historical 311 3.396% 11 - - 11
514 2031 Lost Creek Historical 7 3.748% - -
515 2031 Lower Granite Historical 12,977 3.925% 509 - - 509
516 2031 Lower Monument Historical 4,301 4.148% 178 - - 178
517 2031 Lower Snake Fish and Wildlife Historical 3,598 3.866% 139 - - 139
518 2031 McNary Historical 6,630 4.130% 274 - - 274
519 2031 Minidoka/Palisades Historical 19,450 3.247% 632 - - 632
520 2031 RRP - Green Springs Historical 3 3.244% - -
521 2031 The Dalles Historical 3,987 4.559% 182 - - 182
522 2031 Yakima Chandler/Kenniwick Historical 15 4.377% 1 - - 1
523 2031 Bureau Direct Historical 583,516 2.625% 15,319 - (991) 14,328
524 2031 Corps Historical 422,389 3.178% 13,423 - (585) 12,838
525 2031 Fish and Wildlife Historical 148,000 2.900% 4,293 - (5) 4,288
526 2031 Replacements Historical 2,402,789 4.430% 106,444 - - 106,444
527 2031 Replacements New 218,435 2.215% 4,838 - - 4,838
528 2031 Float Historical - - (1,690) - - (1,690)
529 FY 2031 Subtotal: 5,274,049 200,291 - (1,581) 198,710
BP-18-FS-BPA-02A Page 160

TABLE 12C:
Interest Calculation Summary
October 1, 2015 - September 30, 2019 Cost Evaluation Period
($000s) (FY 2019)
A B D E F G H I J
Column 1 Fiscal Year Project Type
Current
Principal Rate Interest Premium
Net Interest
Accrual Total
530 2032 Albeni Falls Historical 99 4.322% 4 - - 4
531 2032 Boise Historical 81 4.792% 4 - - 4
532 2032 Bonneville Dam Historical 32,739 4.378% 1,433 - - 1,433
533 2032 Chief Joseph Historical 28,269 4.435% 1,254 - - 1,254
534 2032 Columbia Basin Historical 9,871 3.852% 380 - - 380
535 2032 Columbia River Fish Mitigation Historical 1,153,947 3.716% 42,875 - - 42,875
536 2032 Cougar Historical 4,811 3.035% 146 - - 146
537 2032 Detroit Lake/Big Cliff Historical 576 2.913% 17 - - 17
538 2032 Dworshak Historical 2,390 4.381% 105 - - 105
539 2032 Green Peter/Foster Historical 638 3.673% 23 - - 23
540 2032 Hills Creek Historical 154 3.404% 5 - - 5
541 2032 Hungry Horse Dam Historical 1,434 4.108% 59 - - 59
542 2032 Ice Harbor Historical 7,502 3.711% 278 - - 278
543 2032 John Day Historical 8,420 3.600% 303 - - 303
544 2032 Libby Historical 1,774 4.751% 84 - - 84
545 2032 Little Goose Historical 3,280 4.346% 143 - - 143
546 2032 Lookout Dam Historical 311 3.396% 11 - - 11
547 2032 Lost Creek Historical 7 3.748% - -
548 2032 Lower Granite Historical 12,977 3.925% 509 - - 509
549 2032 Lower Monument Historical 4,016 4.123% 166 - - 166
550 2032 Lower Snake Fish and Wildlife Historical 3,219 3.792% 122 - - 122
551 2032 McNary Historical 2,550 3.537% 90 - - 90
552 2032 Minidoka/Palisades Historical 19,450 3.247% 632 - - 632
553 2032 RRP - Green Springs Historical 3 3.244% - -
554 2032 The Dalles Historical 1,957 4.621% 90 - - 90
555 2032 Yakima Chandler/Kenniwick Historical 15 4.377% 1 - - 1
556 2032 Bureau Direct Historical 482,000 2.668% 12,859 - (133) 12,726
557 2032 Corps Historical 369,389 3.252% 12,013 - (146) 11,867
558 2032 Fish and Wildlife Historical 135,000 3.142% 4,241 - - 4,241
559 2032 Replacements Historical 2,621,225 4.430% 116,120 - - 116,120
560 2032 Replacements New 218,435 2.215% 4,838 - - 4,838
561 2032 Float Historical - - (2,030) - - (2,030)
562 FY 2032 Subtotal: 5,126,539 196,776 - (279) 196,497
563 2033 Albeni Falls Historical 99 4.322% 4 - - 4
564 2033 Boise Historical 64 4.875% 3 - - 3
565 2033 Bonneville Dam Historical 30,111 4.367% 1,315 - - 1,315
566 2033 Chief Joseph Historical 28,269 4.435% 1,254 - - 1,254
567 2033 Columbia Basin Historical 7,884 3.688% 291 - - 291
568 2033 Columbia River Fish Mitigation Historical 875,403 3.481% 30,470 - - 30,470
569 2033 Cougar Historical 4,581 2.964% 136 - - 136
570 2033 Detroit Lake/Big Cliff Historical 576 2.913% 17 - - 17
571 2033 Dworshak Historical 10 4.877% - -
572 2033 Green Peter/Foster Historical 638 3.673% 23 - - 23
573 2033 Hills Creek Historical 154 3.404% 5 - - 5
574 2033 Hungry Horse Dam Historical 1,434 4.108% 59 - - 59
575 2033 Ice Harbor Historical 4,887 3.355% 164 - - 164
576 2033 John Day Historical 8,420 3.600% 303 - - 303
577 2033 Libby Historical 1,774 4.751% 84 - - 84
578 2033 Little Goose Historical 109 3.493% 4 - - 4
579 2033 Lookout Dam Historical 311 3.396% 11 - - 11
580 2033 Lost Creek Historical 7 3.748% - -
581 2033 Lower Granite Historical 7,308 3.576% 261 - - 261
582 2033 Lower Monument Historical 1,684 3.773% 64 - - 64
583 2033 Lower Snake Fish and Wildlife Historical 1,685 3.261% 55 - - 55
584 2033 McNary Historical 2,550 3.537% 90 - - 90
585 2033 Minidoka/Palisades Historical 19,450 3.247% 632 - - 632
586 2033 RRP - Green Springs Historical 3 3.244% - -
587 2033 The Dalles Historical 1,957 4.621% 90 - - 90
588 2033 Yakima Chandler/Kenniwick Historical 15 4.377% 1 - - 1
589 2033 Bureau Direct Historical 416,000 2.223% 9,246 - (827) 8,419
590 2033 Corps Historical 288,000 2.967% 8,545 - (439) 8,105
591 2033 Fish and Wildlife Historical 95,000 3.546% 3,369 - - 3,369
592 2033 Replacements Historical 2,839,660 4.430% 125,797 - - 125,797
593 2033 Replacements New 218,435 2.215% 4,838 - - 4,838
594 2033 Float Historical - - (2,048) - - (2,048)
595 FY 2033 Subtotal: 4,856,478 185,083 - (1,266) 183,817
596 2034 Albeni Falls Historical 57 4.375% 2 - - 2
597 2034 Boise Historical 64 4.875% 3 - - 3
598 2034 Bonneville Dam Historical 25,942 4.373% 1,134 - - 1,134
599 2034 Chief Joseph Historical 3,542 4.856% 172 - - 172
600 2034 Columbia Basin Historical 7,007 3.618% 254 - - 254
601 2034 Columbia River Fish Mitigation Historical 818,572 3.427% 28,055 - - 28,055
602 2034 Cougar Historical 4,522 2.947% 133 - - 133
603 2034 Detroit Lake/Big Cliff Historical 576 2.913% 17 - - 17
604 2034 Dworshak Historical 10 4.877% - -
605 2034 Green Peter/Foster Historical 638 3.673% 23 - - 23
606 2034 Hills Creek Historical 154 3.404% 5 - - 5
607 2034 Hungry Horse Dam Historical 654 3.939% 26 - - 26
608 2034 Ice Harbor Historical 4,680 3.316% 155 - - 155
BP-18-FS-BPA-02A Page 161

TABLE 12C:
Interest Calculation Summary
October 1, 2015 - September 30, 2019 Cost Evaluation Period
($000s) (FY 2019)
A B D E F G H I J
Column 1 Fiscal Year Project Type
Current
Principal Rate Interest Premium
Net Interest
Accrual Total
609 2034 John Day Historical 8,064 3.571% 288 - - 288
610 2034 Libby Historical 1,734 4.763% 83 - - 83
611 2034 Little Goose Historical 79 3.203% 3 - - 3
612 2034 Lookout Dam Historical 311 3.396% 11 - - 11
613 2034 Lost Creek Historical 7 3.748% - -
614 2034 Lower Granite Historical 6,152 3.449% 212 - - 212
615 2034 Lower Monument Historical 1,684 3.773% 64 - - 64
616 2034 Lower Snake Fish and Wildlife Historical 1,674 3.254% 54 - - 54
617 2034 McNary Historical 2,550 3.537% 90 - - 90
618 2034 Minidoka/Palisades Historical 19,450 3.247% 632 - - 632
619 2034 RRP - Green Springs Historical 3 3.244% - -
620 2034 The Dalles Historical 1,957 4.621% 90 - - 90
621 2034 Yakima Chandler/Kenniwick Historical 15 4.377% 1 - - 1
622 2034 Bureau Direct Historical 194,000 1.671% 3,241 - (417) 2,824
623 2034 Corps Historical 146,409 2.913% 4,265 - (392) 3,873
624 2034 Fish and Wildlife Historical 44,000 3.890% 1,712 - - 1,712
625 2034 Replacements Historical 3,058,096 4.430% 135,474 - - 135,474
626 2034 Replacements New 218,435 2.215% 4,838 - - 4,838
627 2034 Float Historical - - (2,038) - - (2,038)
628 FY 2034 Subtotal: 4,571,037 179,000 - (809) 178,191
629 2035 Albeni Falls Historical 57 4.375% 2 - - 2
630 2035 Boise Historical 64 4.875% 3 - - 3
631 2035 Bonneville Dam Historical 25,941 4.373% 1,134 - - 1,134
632 2035 Chief Joseph Historical 3,542 4.856% 172 - - 172
633 2035 Columbia Basin Historical 5,266 3.574% 188 - - 188
634 2035 Columbia River Fish Mitigation Historical 582,535 3.260% 18,989 - - 18,989
635 2035 Cougar Historical 4,511 2.945% 133 - - 133
636 2035 Detroit Lake/Big Cliff Historical 558 2.882% 16 - - 16
637 2035 Dworshak Historical 10 4.877% - -
638 2035 Green Peter/Foster Historical 166 3.166% 5 - - 5
639 2035 Hills Creek Historical 142 3.375% 5 - - 5
640 2035 Hungry Horse Dam Historical 139 4.628% 6 - - 6
641 2035 Ice Harbor Historical 3,862 3.224% 124 - - 124
642 2035 John Day Historical 7,890 3.567% 281 - - 281
643 2035 Libby Historical 1,582 4.860% 77 - - 77
644 2035 Little Goose Historical 79 3.203% 3 - - 3
645 2035 Lookout Dam Historical 294 3.375% 10 - - 10
646 2035 Lower Granite Historical 3,499 3.127% 109 - - 109
647 2035 Lower Monument Historical 254 3.199% 8 - - 8
648 2035 Lower Snake Fish and Wildlife Historical 1,452 3.159% 46 - - 46
649 2035 McNary Historical 1,226 3.230% 40 - - 40
650 2035 Minidoka/Palisades Historical 19,450 3.247% 632 - - 632
651 2035 RRP - Green Springs Historical 3 3.244% - -
652 2035 The Dalles Historical 1,957 4.621% 90 - - 90
653 2035 Yakima Chandler/Kenniwick Historical 15 4.377% 1 - - 1
654 2035 Bureau Direct Historical 64,000 1.878% 1,202 - - 1,202
655 2035 Corps Historical 56,000 3.189% 1,786 - - 1,786
656 2035 Replacements Historical 3,276,531 4.430% 145,150 - - 145,150
657 2035 Replacements New 218,435 2.215% 4,838 - - 4,838
658 2035 Float Historical - - (2,068) - - (2,068)
659 FY 2035 Subtotal: 4,279,461 172,984 - - 172,984
660 2036 Albeni Falls Historical 57 4.375% 2 - - 2
661 2036 Boise Historical 64 4.875% 3 - - 3
662 2036 Bonneville Dam Historical 14,877 4.839% 720 - - 720
663 2036 Chief Joseph Historical 3,510 4.869% 171 - - 171
664 2036 Columbia Basin Historical 4,344 3.721% 162 - - 162
665 2036 Columbia River Fish Mitigation Historical 195,458 3.088% 6,036 - - 6,036
666 2036 Cougar Historical 4,088 2.875% 118 - - 118
667 2036 Detroit Lake/Big Cliff Historical 528 2.875% 15 - - 15
668 2036 Dworshak Historical 10 4.877% - -
669 2036 Hungry Horse Dam Historical 137 4.654% 6 - - 6
670 2036 Ice Harbor Historical 14 4.874% 1 - - 1
671 2036 John Day Historical 1,565 4.358% 68 - - 68
672 2036 Libby Historical 1,567 4.875% 76 - - 76
673 2036 Little Goose Historical 79 3.203% 3 - - 3
674 2036 Lower Granite Historical 24 4.875% 1 - - 1
675 2036 Lower Monument Historical 9 4.871% - -
676 2036 Lower Snake Fish and Wildlife Historical 74 4.874% 4 - - 4
677 2036 McNary Historical 1,215 3.229% 39 - - 39
678 2036 The Dalles Historical 1,651 4.875% 80 - - 80
679 2036 Yakima Chandler/Kenniwick Historical 15 4.377% 1 - - 1
680 2036 Bureau Direct Historical 32,479 0.363% 118 - (39) 79
681 2036 Corps Historical 2,396 0.434% 10 - (2) 9
682 2036 Replacements Historical 3,494,966 4.215% 147,324 - - 147,324
683 2036 Replacements New 218,435 2.215% 4,838 - - 4,838
684 2036 Float Historical - - (2,154) - - (2,154)
685 FY 2036 Subtotal: 3,977,563 157,643 - (41) 157,603
BP-18-FS-BPA-02A Page 162

TABLE 12C:
Interest Calculation Summary
October 1, 2015 - September 30, 2019 Cost Evaluation Period
($000s) (FY 2019)
A B D E F G H I J
Column 1 Fiscal Year Project Type
Current
Principal Rate Interest Premium
Net Interest
Accrual Total
686 2037 Albeni Falls Historical 57 4.375% 2 - - 2
687 2037 Boise Historical 64 4.875% 3 - - 3
688 2037 Bonneville Dam Historical 14,609 4.875% 712 - - 712
689 2037 Chief Joseph Historical 3,500 4.875% 171 - - 171
690 2037 Columbia Basin Historical 2,173 4.567% 99 - - 99
691 2037 Columbia River Fish Mitigation Historical 36,554 4.875% 1,782 - - 1,782
692 2037 Dworshak Historical 10 4.877% - -
693 2037 Hungry Horse Dam Historical 137 4.654% 6 - - 6
694 2037 Ice Harbor Historical 14 4.874% 1 - - 1
695 2037 John Day Historical 1,548 4.375% 68 - - 68
696 2037 Libby Historical 1,567 4.875% 76 - - 76
697 2037 Little Goose Historical 13 4.877% 1 - - 1
698 2037 Lower Granite Historical 24 4.875% 1 - - 1
699 2037 Lower Monument Historical 9 4.871% - -
700 2037 Lower Snake Fish and Wildlife Historical 74 4.874% 4 - - 4
701 2037 McNary Historical 215 4.875% 10 - - 10
702 2037 The Dalles Historical 1,651 4.875% 80 - - 80
703 2037 Yakima Chandler/Kenniwick Historical 15 4.377% 1 - - 1
704 2037 Replacements Historical 3,374,651 4.056% 136,883 - - 136,883
705 2037 Replacements New 218,435 2.215% 4,838 - - 4,838
706 2037 Float Historical - - (2,165) - - (2,165)
707 FY 2037 Subtotal: 3,655,320 142,575 - - 142,575
708 2038 Albeni Falls Historical 57 4.375% 2 - - 2
709 2038 Boise Historical 64 4.875% 3 - - 3
710 2038 Bonneville Dam Historical 14,609 4.875% 712 - - 712
711 2038 Chief Joseph Historical 3,500 4.875% 171 - - 171
712 2038 Columbia Basin Historical 2,173 4.567% 99 - - 99
713 2038 Columbia River Fish Mitigation Historical 36,554 4.875% 1,782 - - 1,782
714 2038 Dworshak Historical 10 4.877% - -
715 2038 Hungry Horse Dam Historical 137 4.654% 6 - - 6
716 2038 Ice Harbor Historical 14 4.874% 1 - - 1
717 2038 John Day Historical 1,548 4.375% 68 - - 68
718 2038 Libby Historical 1,567 4.875% 76 - - 76
719 2038 Little Goose Historical 13 4.877% 1 - - 1
720 2038 Lower Granite Historical 24 4.875% 1 - - 1
721 2038 Lower Monument Historical 9 4.871% - -
722 2038 Lower Snake Fish and Wildlife Historical 74 4.874% 4 - - 4
723 2038 McNary Historical 215 4.875% 10 - - 10
724 2038 The Dalles Historical 1,651 4.875% 80 - - 80
725 2038 Yakima Chandler/Kenniwick Historical 15 4.377% 1 - - 1
726 2038 Replacements Historical 3,023,595 3.982% 120,393 - - 120,393
727 2038 Replacements New 218,435 2.215% 4,838 - - 4,838
728 2038 Float Historical - - (2,224) - - (2,224)
729 FY 2038 Subtotal: 3,304,265 126,026 - - 126,026
730 2039 Albeni Falls Historical 57 4.375% 2 - - 2
731 2039 Boise Historical 64 4.875% 3 - - 3
732 2039 Bonneville Dam Historical 14,609 4.875% 712 - - 712
733 2039 Chief Joseph Historical 3,500 4.875% 171 - - 171
734 2039 Columbia Basin Historical 2,173 4.567% 99 - - 99
735 2039 Columbia River Fish Mitigation Historical 36,554 4.875% 1,782 - - 1,782
736 2039 Dworshak Historical 10 4.877% - -
737 2039 Hungry Horse Dam Historical 137 4.654% 6 - - 6
738 2039 Ice Harbor Historical 14 4.874% 1 - - 1
739 2039 John Day Historical 1,548 4.375% 68 - - 68
740 2039 Libby Historical 1,567 4.875% 76 - - 76
741 2039 Little Goose Historical 13 4.877% 1 - - 1
742 2039 Lower Granite Historical 24 4.875% 1 - - 1
743 2039 Lower Monument Historical 9 4.871% - -
744 2039 Lower Snake Fish and Wildlife Historical 74 4.874% 4 - - 4
745 2039 McNary Historical 215 4.875% 10 - - 10
746 2039 The Dalles Historical 1,651 4.875% 80 - - 80
747 2039 Yakima Chandler/Kenniwick Historical 15 4.377% 1 - - 1
748 2039 Replacements Historical 2,630,190 3.884% 102,158 - - 102,158
749 2039 Replacements New 218,435 2.215% 4,838 - - 4,838
750 2039 Float Historical - - (2,360) - - (2,360)
751 FY 2039 Subtotal: 2,910,860 107,656 - - 107,656
BP-18-FS-BPA-02A Page 163

TABLE 12C:
Interest Calculation Summary
October 1, 2015 - September 30, 2019 Cost Evaluation Period
($000s) (FY 2019)
A B D E F G H I J
Column 1 Fiscal Year Project Type
Current
Principal Rate Interest Premium
Net Interest
Accrual Total
752 2040 Albeni Falls Historical 57 4.375% 2 - - 2
753 2040 Boise Historical 64 4.875% 3 - - 3
754 2040 Bonneville Dam Historical 14,609 4.875% 712 - - 712
755 2040 Chief Joseph Historical 3,500 4.875% 171 - - 171
756 2040 Columbia Basin Historical 2,173 4.567% 99 - - 99
757 2040 Columbia River Fish Mitigation Historical 36,554 4.875% 1,782 - - 1,782
758 2040 Dworshak Historical 10 4.877% - -
759 2040 Hungry Horse Dam Historical 137 4.654% 6 - - 6
760 2040 Ice Harbor Historical 14 4.874% 1 - - 1
761 2040 John Day Historical 1,548 4.375% 68 - - 68
762 2040 Libby Historical 1,567 4.875% 76 - - 76
763 2040 Little Goose Historical 13 4.877% 1 - - 1
764 2040 Lower Granite Historical 24 4.875% 1 - - 1
765 2040 Lower Monument Historical 9 4.871% - -
766 2040 Lower Snake Fish and Wildlife Historical 74 4.874% 4 - - 4
767 2040 McNary Historical 215 4.875% 10 - - 10
768 2040 The Dalles Historical 1,651 4.875% 80 - - 80
769 2040 Yakima Chandler/Kenniwick Historical 15 4.377% 1 - - 1
770 2040 Replacements Historical 2,200,364 3.741% 82,311 - - 82,311
771 2040 Replacements New 218,435 2.215% 4,838 - - 4,838
772 2040 Float Historical - - (2,399) - - (2,399)
773 FY 2040 Subtotal: 2,481,033 87,770 - - 87,770
774 2041 Albeni Falls Historical 57 4.375% 2 - - 2
775 2041 Boise Historical 64 4.875% 3 - - 3
776 2041 Bonneville Dam Historical 14,609 4.875% 712 - - 712
777 2041 Chief Joseph Historical 3,500 4.875% 171 - - 171
778 2041 Columbia Basin Historical 2,173 4.567% 99 - - 99
779 2041 Columbia River Fish Mitigation Historical 36,554 4.875% 1,782 - - 1,782
780 2041 Dworshak Historical 10 4.877% - -
781 2041 Hungry Horse Dam Historical 137 4.654% 6 - - 6
782 2041 Ice Harbor Historical 14 4.874% 1 - - 1
783 2041 John Day Historical 1,548 4.375% 68 - - 68
784 2041 Libby Historical 1,567 4.875% 76 - - 76
785 2041 Little Goose Historical 13 4.877% 1 - - 1
786 2041 Lower Granite Historical 24 4.875% 1 - - 1
787 2041 Lower Monument Historical 9 4.871% - -
788 2041 Lower Snake Fish and Wildlife Historical 74 4.874% 4 - - 4
789 2041 McNary Historical 215 4.875% 10 - - 10
790 2041 The Dalles Historical 1,651 4.875% 80 - - 80
791 2041 Yakima Chandler/Kenniwick Historical 15 4.377% 1 - - 1
792 2041 Replacements Historical 1,734,160 3.519% 61,032 - - 61,032
793 2041 Replacements New 218,435 2.215% 4,838 - - 4,838
794 2041 Float Historical - - (2,456) - - (2,456)
795 FY 2041 Subtotal: 2,014,830 66,433 - - 66,433
796 2042 Albeni Falls Historical 57 4.375% 2 - - 2
797 2042 Boise Historical 64 4.875% 3 - - 3
798 2042 Bonneville Dam Historical 14,609 4.875% 712 - - 712
799 2042 Chief Joseph Historical 3,500 4.875% 171 - - 171
800 2042 Columbia Basin Historical 2,173 4.567% 99 - - 99
801 2042 Columbia River Fish Mitigation Historical 36,554 4.875% 1,782 - - 1,782
802 2042 Dworshak Historical 10 4.877% - -
803 2042 Hungry Horse Dam Historical 137 4.654% 6 - - 6
804 2042 Ice Harbor Historical 14 4.874% 1 - - 1
805 2042 John Day Historical 1,548 4.375% 68 - - 68
806 2042 Libby Historical 1,567 4.875% 76 - - 76
807 2042 Little Goose Historical 13 4.877% 1 - - 1
808 2042 Lower Granite Historical 24 4.875% 1 - - 1
809 2042 Lower Monument Historical 9 4.871% - -
810 2042 Lower Snake Fish and Wildlife Historical 74 4.874% 4 - - 4
811 2042 McNary Historical 215 4.875% 10 - - 10
812 2042 The Dalles Historical 1,651 4.875% 80 - - 80
813 2042 Yakima Chandler/Kenniwick Historical 15 4.377% 1 - - 1
814 2042 Replacements Historical 1,239,687 3.251% 40,299 - - 40,299
815 2042 Replacements New 218,435 2.215% 4,838 - - 4,838
816 2042 Float Historical - - (2,492) - - (2,492)
817 FY 2042 Subtotal: 1,520,357 45,663 - - 45,663
BP-18-FS-BPA-02A Page 164

TABLE 12C:
Interest Calculation Summary
October 1, 2015 - September 30, 2019 Cost Evaluation Period
($000s) (FY 2019)
A B D E F G H I J
Column 1 Fiscal Year Project Type
Current
Principal Rate Interest Premium
Net Interest
Accrual Total
818 2043 Albeni Falls Historical 57 4.375% 2 - - 2
819 2043 Boise Historical 64 4.875% 3 - - 3
820 2043 Bonneville Dam Historical 14,609 4.875% 712 - - 712
821 2043 Chief Joseph Historical 3,500 4.875% 171 - - 171
822 2043 Columbia Basin Historical 2,173 4.567% 99 - - 99
823 2043 Columbia River Fish Mitigation Historical 36,554 4.875% 1,782 - - 1,782
824 2043 Dworshak Historical 10 4.877% - -
825 2043 Hungry Horse Dam Historical 137 4.654% 6 - - 6
826 2043 Ice Harbor Historical 14 4.874% 1 - - 1
827 2043 John Day Historical 1,548 4.375% 68 - - 68
828 2043 Libby Historical 1,567 4.875% 76 - - 76
829 2043 Little Goose Historical 13 4.877% 1 - - 1
830 2043 Lower Granite Historical 24 4.875% 1 - - 1
831 2043 Lower Monument Historical 9 4.871% - -
832 2043 Lower Snake Fish and Wildlife Historical 74 4.874% 4 - - 4
833 2043 McNary Historical 215 4.875% 10 - - 10
834 2043 The Dalles Historical 1,651 4.875% 80 - - 80
835 2043 Yakima Chandler/Kenniwick Historical 15 4.377% 1 - - 1
836 2043 Replacements Historical 798,102 2.334% 18,624 - - 18,624
837 2043 Replacements New 218,435 2.215% 4,838 - - 4,838
838 2043 Float Historical - - (2,525) - - (2,525)
839 FY 2043 Subtotal: 1,078,772 23,956 - - 23,956
840 2044 Albeni Falls Historical 57 4.375% 2 - - 2
841 2044 Boise Historical 64 4.875% 3 - - 3
842 2044 Bonneville Dam Historical 14,609 4.875% 712 - - 712
843 2044 Chief Joseph Historical 3,500 4.875% 171 - - 171
844 2044 Columbia Basin Historical 2,173 4.567% 99 - - 99
845 2044 Columbia River Fish Mitigation Historical 36,554 4.875% 1,782 - - 1,782
846 2044 Dworshak Historical 10 4.877% - -
847 2044 Hungry Horse Dam Historical 137 4.654% 6 - - 6
848 2044 Ice Harbor Historical 14 4.874% 1 - - 1
849 2044 John Day Historical 1,548 4.375% 68 - - 68
850 2044 Libby Historical 1,567 4.875% 76 - - 76
851 2044 Little Goose Historical 13 4.877% 1 - - 1
852 2044 Lower Granite Historical 24 4.875% 1 - - 1
853 2044 Lower Monument Historical 9 4.871% - -
854 2044 Lower Snake Fish and Wildlife Historical 74 4.874% 4 - - 4
855 2044 McNary Historical 215 4.875% 10 - - 10
856 2044 The Dalles Historical 1,651 4.875% 80 - - 80
857 2044 Yakima Chandler/Kenniwick Historical 15 4.377% 1 - - 1
858 2044 Replacements Historical 261,149 2.215% 5,784 - - 5,784
859 2044 Replacements New 218,435 2.215% 4,838 - - 4,838
860 2044 Float Historical - - (2,172) - - (2,172)
861 FY 2044 Subtotal: 541,818 11,469 - - 11,469
862 2045 Albeni Falls Historical 57 4.375% 2 - - 2
863 2045 Boise Historical 64 4.875% 3 - - 3
864 2045 Bonneville Dam Historical 14,609 4.875% 712 - - 712
865 2045 Chief Joseph Historical 3,500 4.875% 171 - - 171
866 2045 Columbia Basin Historical 2,173 4.567% 99 - - 99
867 2045 Columbia River Fish Mitigation Historical 36,554 4.875% 1,782 - - 1,782
868 2045 Dworshak Historical 10 4.877% - -
869 2045 Hungry Horse Dam Historical 137 4.654% 6 - - 6
870 2045 Ice Harbor Historical 14 4.874% 1 - - 1
871 2045 John Day Historical 1,548 4.375% 68 - - 68
872 2045 Libby Historical 1,567 4.875% 76 - - 76
873 2045 Little Goose Historical 13 4.877% 1 - - 1
874 2045 Lower Granite Historical 24 4.875% 1 - - 1
875 2045 Lower Monument Historical 9 4.871% - -
876 2045 Lower Snake Fish and Wildlife Historical 74 4.874% 4 - - 4
877 2045 McNary Historical 215 4.875% 10 - - 10
878 2045 The Dalles Historical 1,651 4.875% 80 - - 80
879 2045 Yakima Chandler/Kenniwick Historical 15 4.377% 1 - - 1
880 2045 Replacements Historical 218,435 2.215% 4,838 - - 4,838
881 2045 Replacements New 218,435 2.215% 4,838 - - 4,838
882 2045 Float Historical - - (1,008) - - (1,008)
883 FY 2045 Subtotal: 499,105 11,687 - - 11,687
BP-18-FS-BPA-02A Page 165
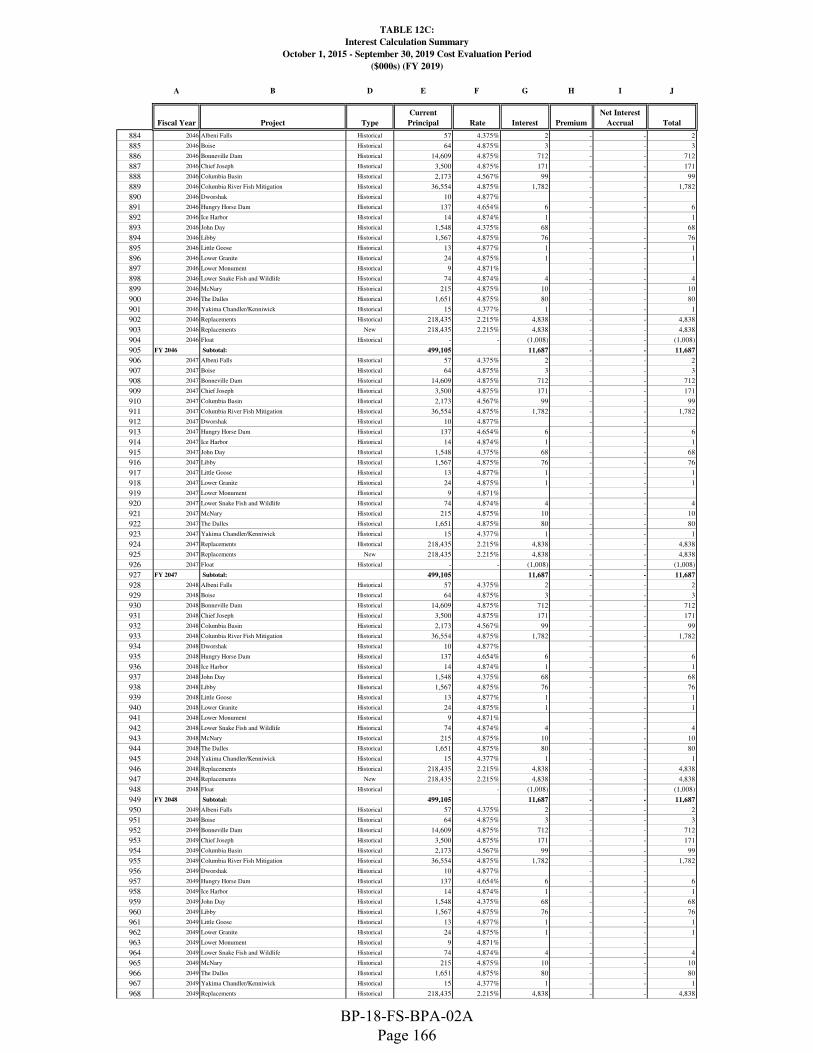
TABLE 12C:
Interest Calculation Summary
October 1, 2015 - September 30, 2019 Cost Evaluation Period
($000s) (FY 2019)
A B D E F G H I J
Column 1 Fiscal Year Project Type
Current
Principal Rate Interest Premium
Net Interest
Accrual Total
884 2046 Albeni Falls Historical 57 4.375% 2 - - 2
885 2046 Boise Historical 64 4.875% 3 - - 3
886 2046 Bonneville Dam Historical 14,609 4.875% 712 - - 712
887 2046 Chief Joseph Historical 3,500 4.875% 171 - - 171
888 2046 Columbia Basin Historical 2,173 4.567% 99 - - 99
889 2046 Columbia River Fish Mitigation Historical 36,554 4.875% 1,782 - - 1,782
890 2046 Dworshak Historical 10 4.877% - -
891 2046 Hungry Horse Dam Historical 137 4.654% 6 - - 6
892 2046 Ice Harbor Historical 14 4.874% 1 - - 1
893 2046 John Day Historical 1,548 4.375% 68 - - 68
894 2046 Libby Historical 1,567 4.875% 76 - - 76
895 2046 Little Goose Historical 13 4.877% 1 - - 1
896 2046 Lower Granite Historical 24 4.875% 1 - - 1
897 2046 Lower Monument Historical 9 4.871% - -
898 2046 Lower Snake Fish and Wildlife Historical 74 4.874% 4 - - 4
899 2046 McNary Historical 215 4.875% 10 - - 10
900 2046 The Dalles Historical 1,651 4.875% 80 - - 80
901 2046 Yakima Chandler/Kenniwick Historical 15 4.377% 1 - - 1
902 2046 Replacements Historical 218,435 2.215% 4,838 - - 4,838
903 2046 Replacements New 218,435 2.215% 4,838 - - 4,838
904 2046 Float Historical - - (1,008) - - (1,008)
905 FY 2046 Subtotal: 499,105 11,687 - - 11,687
906 2047 Albeni Falls Historical 57 4.375% 2 - - 2
907 2047 Boise Historical 64 4.875% 3 - - 3
908 2047 Bonneville Dam Historical 14,609 4.875% 712 - - 712
909 2047 Chief Joseph Historical 3,500 4.875% 171 - - 171
910 2047 Columbia Basin Historical 2,173 4.567% 99 - - 99
911 2047 Columbia River Fish Mitigation Historical 36,554 4.875% 1,782 - - 1,782
912 2047 Dworshak Historical 10 4.877% - -
913 2047 Hungry Horse Dam Historical 137 4.654% 6 - - 6
914 2047 Ice Harbor Historical 14 4.874% 1 - - 1
915 2047 John Day Historical 1,548 4.375% 68 - - 68
916 2047 Libby Historical 1,567 4.875% 76 - - 76
917 2047 Little Goose Historical 13 4.877% 1 - - 1
918 2047 Lower Granite Historical 24 4.875% 1 - - 1
919 2047 Lower Monument Historical 9 4.871% - -
920 2047 Lower Snake Fish and Wildlife Historical 74 4.874% 4 - - 4
921 2047 McNary Historical 215 4.875% 10 - - 10
922 2047 The Dalles Historical 1,651 4.875% 80 - - 80
923 2047 Yakima Chandler/Kenniwick Historical 15 4.377% 1 - - 1
924 2047 Replacements Historical 218,435 2.215% 4,838 - - 4,838
925 2047 Replacements New 218,435 2.215% 4,838 - - 4,838
926 2047 Float Historical - - (1,008) - - (1,008)
927 FY 2047 Subtotal: 499,105 11,687 - - 11,687
928 2048 Albeni Falls Historical 57 4.375% 2 - - 2
929 2048 Boise Historical 64 4.875% 3 - - 3
930 2048 Bonneville Dam Historical 14,609 4.875% 712 - - 712
931 2048 Chief Joseph Historical 3,500 4.875% 171 - - 171
932 2048 Columbia Basin Historical 2,173 4.567% 99 - - 99
933 2048 Columbia River Fish Mitigation Historical 36,554 4.875% 1,782 - - 1,782
934 2048 Dworshak Historical 10 4.877% - -
935 2048 Hungry Horse Dam Historical 137 4.654% 6 - - 6
936 2048 Ice Harbor Historical 14 4.874% 1 - - 1
937 2048 John Day Historical 1,548 4.375% 68 - - 68
938 2048 Libby Historical 1,567 4.875% 76 - - 76
939 2048 Little Goose Historical 13 4.877% 1 - - 1
940 2048 Lower Granite Historical 24 4.875% 1 - - 1
941 2048 Lower Monument Historical 9 4.871% - -
942 2048 Lower Snake Fish and Wildlife Historical 74 4.874% 4 - - 4
943 2048 McNary Historical 215 4.875% 10 - - 10
944 2048 The Dalles Historical 1,651 4.875% 80 - - 80
945 2048 Yakima Chandler/Kenniwick Historical 15 4.377% 1 - - 1
946 2048 Replacements Historical 218,435 2.215% 4,838 - - 4,838
947 2048 Replacements New 218,435 2.215% 4,838 - - 4,838
948 2048 Float Historical - - (1,008) - - (1,008)
949 FY 2048 Subtotal: 499,105 11,687 - - 11,687
950 2049 Albeni Falls Historical 57 4.375% 2 - - 2
951 2049 Boise Historical 64 4.875% 3 - - 3
952 2049 Bonneville Dam Historical 14,609 4.875% 712 - - 712
953 2049 Chief Joseph Historical 3,500 4.875% 171 - - 171
954 2049 Columbia Basin Historical 2,173 4.567% 99 - - 99
955 2049 Columbia River Fish Mitigation Historical 36,554 4.875% 1,782 - - 1,782
956 2049 Dworshak Historical 10 4.877% - -
957 2049 Hungry Horse Dam Historical 137 4.654% 6 - - 6
958 2049 Ice Harbor Historical 14 4.874% 1 - - 1
959 2049 John Day Historical 1,548 4.375% 68 - - 68
960 2049 Libby Historical 1,567 4.875% 76 - - 76
961 2049 Little Goose Historical 13 4.877% 1 - - 1
962 2049 Lower Granite Historical 24 4.875% 1 - - 1
963 2049 Lower Monument Historical 9 4.871% - -
964 2049 Lower Snake Fish and Wildlife Historical 74 4.874% 4 - - 4
965 2049 McNary Historical 215 4.875% 10 - - 10
966 2049 The Dalles Historical 1,651 4.875% 80 - - 80
967 2049 Yakima Chandler/Kenniwick Historical 15 4.377% 1 - - 1
968 2049 Replacements Historical 218,435 2.215% 4,838 - - 4,838
BP-18-FS-BPA-02A Page 166
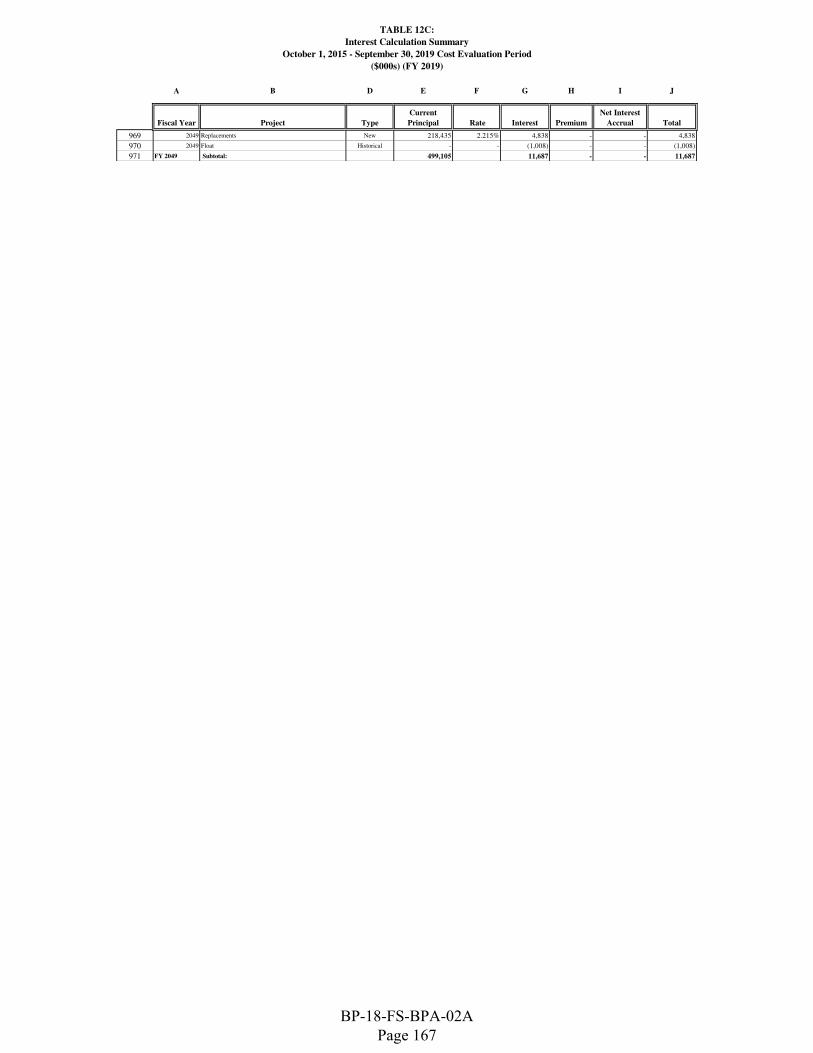
TABLE 12C:
Interest Calculation Summary
October 1, 2015 - September 30, 2019 Cost Evaluation Period
($000s) (FY 2019)
A B D E F G H I J
Column 1 Fiscal Year Project Type
Current
Principal Rate Interest Premium
Net Interest
Accrual Total
969 2049 Replacements New 218,435 2.215% 4,838 - - 4,838
970 2049 Float Historical - - (1,008) - - (1,008)
971 FY 2049 Subtotal: 499,105 11,687 - - 11,687
BP-18-FS-BPA-02A Page 167

TABLE 12C:
Interest Calculation Summary
October 1, 2015 - September 30, 2019 Cost Evaluation Period
($000s) (FY 2019)
A B D E F G H I J
Column 1 Fiscal Year Project Type
Current
Principal Rate Interest Premium
Net Interest
Accrual Total
972 2050 Albeni Falls Historical 57 4.375% 2 - - 2
973 2050 Boise Historical 64 4.875% 3 - - 3
974 2050 Bonneville Dam Historical 14,609 4.875% 712 - - 712
975 2050 Chief Joseph Historical 3,500 4.875% 171 - - 171
976 2050 Columbia Basin Historical 2,173 4.567% 99 - - 99
977 2050 Columbia River Fish Mitigation Historical 36,554 4.875% 1,782 - - 1,782
978 2050 Dworshak Historical 10 4.877% - -
979 2050 Hungry Horse Dam Historical 137 4.654% 6 - - 6
980 2050 Ice Harbor Historical 14 4.874% 1 - - 1
981 2050 John Day Historical 1,548 4.375% 68 - - 68
982 2050 Libby Historical 1,567 4.875% 76 - - 76
983 2050 Little Goose Historical 13 4.877% 1 - - 1
984 2050 Lower Granite Historical 24 4.875% 1 - - 1
985 2050 Lower Monument Historical 9 4.871% - -
986 2050 Lower Snake Fish and Wildlife Historical 74 4.874% 4 - - 4
987 2050 McNary Historical 215 4.875% 10 - - 10
988 2050 The Dalles Historical 1,651 4.875% 80 - - 80
989 2050 Yakima Chandler/Kenniwick Historical 15 4.377% 1 - - 1
990 2050 Replacements Historical 218,435 2.215% 4,838 - - 4,838
991 2050 Replacements New 218,435 2.215% 4,838 - - 4,838
992 2050 Float Historical - - (1,008) - - (1,008)
993 FY 2050 Subtotal: 499,105 11,687 - - 11,687
994 2051 Albeni Falls Historical 57 4.375% 2 - - 2
995 2051 Boise Historical 64 4.875% 3 - - 3
996 2051 Bonneville Dam Historical 14,609 4.875% 712 - - 712
997 2051 Chief Joseph Historical 3,500 4.875% 171 - - 171
998 2051 Columbia Basin Historical 2,173 4.567% 99 - - 99
999 2051 Columbia River Fish Mitigation Historical 36,554 4.875% 1,782 - - 1,782
1000 2051 Dworshak Historical 10 4.877% - -
1001 2051 Hungry Horse Dam Historical 137 4.654% 6 - - 6
1002 2051 Ice Harbor Historical 14 4.874% 1 - - 1
1003 2051 John Day Historical 1,548 4.375% 68 - - 68
1004 2051 Libby Historical 1,567 4.875% 76 - - 76
1005 2051 Little Goose Historical 13 4.877% 1 - - 1
1006 2051 Lower Granite Historical 24 4.875% 1 - - 1
1007 2051 Lower Monument Historical 9 4.871% - -
1008 2051 Lower Snake Fish and Wildlife Historical 74 4.874% 4 - - 4
1009 2051 McNary Historical 215 4.875% 10 - - 10
1010 2051 The Dalles Historical 1,651 4.875% 80 - - 80
1011 2051 Yakima Chandler/Kenniwick Historical 15 4.377% 1 - - 1
1012 2051 Replacements Historical 218,435 2.215% 4,838 - - 4,838
1013 2051 Replacements New 218,435 2.215% 4,838 - - 4,838
1014 2051 Float Historical - - (1,008) - - (1,008)
1015 FY 2051 Subtotal: 499,105 11,687 - - 11,687
1016 2052 Albeni Falls Historical 57 4.375% 2 - - 2
1017 2052 Boise Historical 64 4.875% 3 - - 3
1018 2052 Bonneville Dam Historical 14,609 4.875% 712 - - 712
1019 2052 Chief Joseph Historical 3,500 4.875% 171 - - 171
1020 2052 Columbia Basin Historical 2,173 4.567% 99 - - 99
1021 2052 Columbia River Fish Mitigation Historical 36,554 4.875% 1,782 - - 1,782
1022 2052 Dworshak Historical 10 4.877% - -
1023 2052 Hungry Horse Dam Historical 137 4.654% 6 - - 6
1024 2052 Ice Harbor Historical 14 4.874% 1 - - 1
1025 2052 John Day Historical 1,548 4.375% 68 - - 68
1026 2052 Libby Historical 1,567 4.875% 76 - - 76
1027 2052 Little Goose Historical 13 4.877% 1 - - 1
1028 2052 Lower Granite Historical 24 4.875% 1 - - 1
1029 2052 Lower Monument Historical 9 4.871% - -
1030 2052 Lower Snake Fish and Wildlife Historical 74 4.874% 4 - - 4
1031 2052 McNary Historical 215 4.875% 10 - - 10
1032 2052 The Dalles Historical 1,651 4.875% 80 - - 80
1033 2052 Yakima Chandler/Kenniwick Historical 15 4.377% 1 - - 1
1034 2052 Replacements Historical 218,435 2.215% 4,838 - - 4,838
1035 2052 Replacements New 218,435 2.215% 4,838 - - 4,838
1036 2052 Float Historical - - (1,008) - - (1,008)
1037 FY 2052 Subtotal: 499,105 11,687 - - 11,687
1038 2053 Albeni Falls Historical 57 4.375% 2 - - 2
1039 2053 Boise Historical 64 4.875% 3 - - 3
1040 2053 Bonneville Dam Historical 14,609 4.875% 712 - - 712
1041 2053 Chief Joseph Historical 3,500 4.875% 171 - - 171
1042 2053 Columbia Basin Historical 2,173 4.567% 99 - - 99
1043 2053 Columbia River Fish Mitigation Historical 36,554 4.875% 1,782 - - 1,782
1044 2053 Dworshak Historical 10 4.877% - -
1045 2053 Hungry Horse Dam Historical 137 4.654% 6 - - 6
1046 2053 Ice Harbor Historical 14 4.874% 1 - - 1
1047 2053 John Day Historical 1,548 4.375% 68 - - 68
1048 2053 Libby Historical 1,567 4.875% 76 - - 76
1049 2053 Little Goose Historical 13 4.877% 1 - - 1
BP-18-FS-BPA-02A Page 168

TABLE 12C:
Interest Calculation Summary
October 1, 2015 - September 30, 2019 Cost Evaluation Period
($000s) (FY 2019)
A B D E F G H I J
Column 1 Fiscal Year Project Type
Current
Principal Rate Interest Premium
Net Interest
Accrual Total
1050 2053 Lower Granite Historical 24 4.875% 1 - - 1
1051 2053 Lower Monument Historical 9 4.871% - -
1052 2053 Lower Snake Fish and Wildlife Historical 74 4.874% 4 - - 4
1053 2053 McNary Historical 215 4.875% 10 - - 10
1054 2053 The Dalles Historical 1,651 4.875% 80 - - 80
1055 2053 Yakima Chandler/Kenniwick Historical 15 4.377% 1 - - 1
1056 2053 Replacements Historical 218,435 2.215% 4,838 - - 4,838
1057 2053 Replacements New 218,435 2.215% 4,838 - - 4,838
1058 2053 Float Historical - - (1,008) - - (1,008)
1059 FY 2053 Subtotal: 499,105 11,687 - - 11,687
1060 2054 Albeni Falls Historical 57 4.375% 2 - - 2
1061 2054 Boise Historical 64 4.875% 3 - - 3
1062 2054 Bonneville Dam Historical 14,609 4.875% 712 - - 712
1063 2054 Chief Joseph Historical 3,500 4.875% 171 - - 171
1064 2054 Columbia Basin Historical 2,173 4.567% 99 - - 99
1065 2054 Columbia River Fish Mitigation Historical 36,554 4.875% 1,782 - - 1,782
1066 2054 Dworshak Historical 10 4.877% - -
1067 2054 Hungry Horse Dam Historical 137 4.654% 6 - - 6
1068 2054 Ice Harbor Historical 14 4.874% 1 - - 1
1069 2054 John Day Historical 1,548 4.375% 68 - - 68
1070 2054 Libby Historical 1,567 4.875% 76 - - 76
1071 2054 Little Goose Historical 13 4.877% 1 - - 1
1072 2054 Lower Granite Historical 24 4.875% 1 - - 1
1073 2054 Lower Monument Historical 9 4.871% - -
1074 2054 Lower Snake Fish and Wildlife Historical 74 4.874% 4 - - 4
1075 2054 McNary Historical 215 4.875% 10 - - 10
1076 2054 The Dalles Historical 1,651 4.875% 80 - - 80
1077 2054 Yakima Chandler/Kenniwick Historical 15 4.377% 1 - - 1
1078 2054 Replacements Historical 218,435 2.215% 4,838 - - 4,838
1079 2054 Replacements New 218,435 2.215% 4,838 - - 4,838
1080 2054 Float Historical - - (1,008) - - (1,008)
1081 FY 2054 Subtotal: 499,105 11,687 - - 11,687
1082 2055 Albeni Falls Historical 57 4.375% 2 - - 2
1083 2055 Boise Historical 64 4.875% 3 - - 3
1084 2055 Bonneville Dam Historical 14,609 4.875% 712 - - 712
1085 2055 Chief Joseph Historical 3,500 4.875% 171 - - 171
1086 2055 Columbia Basin Historical 2,173 4.567% 99 - - 99
1087 2055 Columbia River Fish Mitigation Historical 36,554 4.875% 1,782 - - 1,782
1088 2055 Dworshak Historical 10 4.877% - -
1089 2055 Hungry Horse Dam Historical 137 4.654% 6 - - 6
1090 2055 Ice Harbor Historical 14 4.874% 1 - - 1
1091 2055 John Day Historical 1,548 4.375% 68 - - 68
1092 2055 Libby Historical 1,567 4.875% 76 - - 76
1093 2055 Little Goose Historical 13 4.877% 1 - - 1
1094 2055 Lower Granite Historical 24 4.875% 1 - - 1
1095 2055 Lower Monument Historical 9 4.871% - -
1096 2055 Lower Snake Fish and Wildlife Historical 74 4.874% 4 - - 4
1097 2055 McNary Historical 215 4.875% 10 - - 10
1098 2055 The Dalles Historical 1,651 4.875% 80 - - 80
1099 2055 Yakima Chandler/Kenniwick Historical 15 4.377% 1 - - 1
1100 2055 Replacements Historical 218,435 2.215% 4,838 - - 4,838
1101 2055 Replacements New 218,435 2.215% 4,838 - - 4,838
1102 2055 Float Historical - - (1,008) - - (1,008)
1103 FY 2055 Subtotal: 499,105 11,687 - - 11,687
1104 2056 Albeni Falls Historical 57 4.375% 2 - - 2
1105 2056 Boise Historical 64 4.875% 3 - - 3
1106 2056 Bonneville Dam Historical 14,609 4.875% 712 - - 712
1107 2056 Chief Joseph Historical 3,500 4.875% 171 - - 171
1108 2056 Columbia Basin Historical 2,173 4.567% 99 - - 99
1109 2056 Columbia River Fish Mitigation Historical 36,554 4.875% 1,782 - - 1,782
1110 2056 Dworshak Historical 10 4.877% - -
1111 2056 Hungry Horse Dam Historical 137 4.654% 6 - - 6
1112 2056 Ice Harbor Historical 14 4.874% 1 - - 1
1113 2056 John Day Historical 1,548 4.375% 68 - - 68
1114 2056 Libby Historical 1,567 4.875% 76 - - 76
1115 2056 Little Goose Historical 13 4.877% 1 - - 1
1116 2056 Lower Granite Historical 24 4.875% 1 - - 1
1117 2056 Lower Monument Historical 9 4.871% - -
1118 2056 Lower Snake Fish and Wildlife Historical 74 4.874% 4 - - 4
1119 2056 McNary Historical 215 4.875% 10 - - 10
1120 2056 The Dalles Historical 1,651 4.875% 80 - - 80
1121 2056 Yakima Chandler/Kenniwick Historical 15 4.377% 1 - - 1
1122 2056 Replacements Historical 218,435 2.215% 4,838 - - 4,838
1123 2056 Replacements New 218,435 2.215% 4,838 - - 4,838
1124 2056 Float Historical - - (1,008) - - (1,008)
1125 FY 2056 Subtotal: 499,105 11,687 - - 11,687
1126 2057 Albeni Falls Historical 57 4.375% 2 - - 2
1127 2057 Boise Historical 64 4.875% 3 - - 3
1128 2057 Bonneville Dam Historical 14,609 4.875% 712 - - 712
1129 2057 Chief Joseph Historical 3,500 4.875% 171 - - 171
1130 2057 Columbia Basin Historical 2,173 4.567% 99 - - 99
1131 2057 Columbia River Fish Mitigation Historical 36,554 4.875% 1,782 - - 1,782
1132 2057 Dworshak Historical 10 4.877% - -
1133 2057 Hungry Horse Dam Historical 137 4.654% 6 - - 6
1134 2057 Ice Harbor Historical 14 4.874% 1 - - 1
BP-18-FS-BPA-02A Page 169
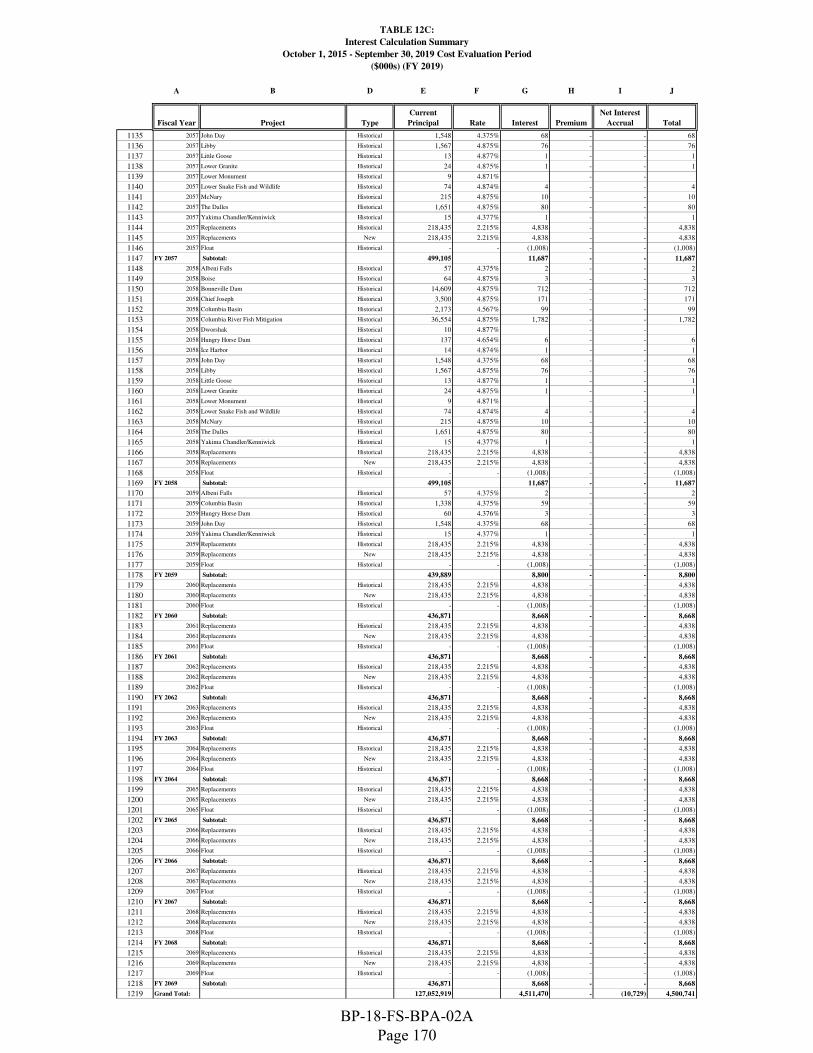
TABLE 12C:
Interest Calculation Summary
October 1, 2015 - September 30, 2019 Cost Evaluation Period
($000s) (FY 2019)
A B D E F G H I J
Column 1 Fiscal Year Project Type
Current
Principal Rate Interest Premium
Net Interest
Accrual Total
1135 2057 John Day Historical 1,548 4.375% 68 - - 68
1136 2057 Libby Historical 1,567 4.875% 76 - - 76
1137 2057 Little Goose Historical 13 4.877% 1 - - 1
1138 2057 Lower Granite Historical 24 4.875% 1 - - 1
1139 2057 Lower Monument Historical 9 4.871% - -
1140 2057 Lower Snake Fish and Wildlife Historical 74 4.874% 4 - - 4
1141 2057 McNary Historical 215 4.875% 10 - - 10
1142 2057 The Dalles Historical 1,651 4.875% 80 - - 80
1143 2057 Yakima Chandler/Kenniwick Historical 15 4.377% 1 - - 1
1144 2057 Replacements Historical 218,435 2.215% 4,838 - - 4,838
1145 2057 Replacements New 218,435 2.215% 4,838 - - 4,838
1146 2057 Float Historical - - (1,008) - - (1,008)
1147 FY 2057 Subtotal: 499,105 11,687 - - 11,687
1148 2058 Albeni Falls Historical 57 4.375% 2 - - 2
1149 2058 Boise Historical 64 4.875% 3 - - 3
1150 2058 Bonneville Dam Historical 14,609 4.875% 712 - - 712
1151 2058 Chief Joseph Historical 3,500 4.875% 171 - - 171
1152 2058 Columbia Basin Historical 2,173 4.567% 99 - - 99
1153 2058 Columbia River Fish Mitigation Historical 36,554 4.875% 1,782 - - 1,782
1154 2058 Dworshak Historical 10 4.877% - -
1155 2058 Hungry Horse Dam Historical 137 4.654% 6 - - 6
1156 2058 Ice Harbor Historical 14 4.874% 1 - - 1
1157 2058 John Day Historical 1,548 4.375% 68 - - 68
1158 2058 Libby Historical 1,567 4.875% 76 - - 76
1159 2058 Little Goose Historical 13 4.877% 1 - - 1
1160 2058 Lower Granite Historical 24 4.875% 1 - - 1
1161 2058 Lower Monument Historical 9 4.871% - -
1162 2058 Lower Snake Fish and Wildlife Historical 74 4.874% 4 - - 4
1163 2058 McNary Historical 215 4.875% 10 - - 10
1164 2058 The Dalles Historical 1,651 4.875% 80 - - 80
1165 2058 Yakima Chandler/Kenniwick Historical 15 4.377% 1 - - 1
1166 2058 Replacements Historical 218,435 2.215% 4,838 - - 4,838
1167 2058 Replacements New 218,435 2.215% 4,838 - - 4,838
1168 2058 Float Historical - - (1,008) - - (1,008)
1169 FY 2058 Subtotal: 499,105 11,687 - - 11,687
1170 2059 Albeni Falls Historical 57 4.375% 2 - - 2
1171 2059 Columbia Basin Historical 1,338 4.375% 59 - - 59
1172 2059 Hungry Horse Dam Historical 60 4.376% 3 - - 3
1173 2059 John Day Historical 1,548 4.375% 68 - - 68
1174 2059 Yakima Chandler/Kenniwick Historical 15 4.377% 1 - - 1
1175 2059 Replacements Historical 218,435 2.215% 4,838 - - 4,838
1176 2059 Replacements New 218,435 2.215% 4,838 - - 4,838
1177 2059 Float Historical - - (1,008) - - (1,008)
1178 FY 2059 Subtotal: 439,889 8,800 - - 8,800
1179 2060 Replacements Historical 218,435 2.215% 4,838 - - 4,838
1180 2060 Replacements New 218,435 2.215% 4,838 - - 4,838
1181 2060 Float Historical - - (1,008) - - (1,008)
1182 FY 2060 Subtotal: 436,871 8,668 - - 8,668
1183 2061 Replacements Historical 218,435 2.215% 4,838 - - 4,838
1184 2061 Replacements New 218,435 2.215% 4,838 - - 4,838
1185 2061 Float Historical - - (1,008) - - (1,008)
1186 FY 2061 Subtotal: 436,871 8,668 - - 8,668
1187 2062 Replacements Historical 218,435 2.215% 4,838 - - 4,838
1188 2062 Replacements New 218,435 2.215% 4,838 - - 4,838
1189 2062 Float Historical - - (1,008) - - (1,008)
1190 FY 2062 Subtotal: 436,871 8,668 - - 8,668
1191 2063 Replacements Historical 218,435 2.215% 4,838 - - 4,838
1192 2063 Replacements New 218,435 2.215% 4,838 - - 4,838
1193 2063 Float Historical - - (1,008) - - (1,008)
1194 FY 2063 Subtotal: 436,871 8,668 - - 8,668
1195 2064 Replacements Historical 218,435 2.215% 4,838 - - 4,838
1196 2064 Replacements New 218,435 2.215% 4,838 - - 4,838
1197 2064 Float Historical - - (1,008) - - (1,008)
1198 FY 2064 Subtotal: 436,871 8,668 - - 8,668
1199 2065 Replacements Historical 218,435 2.215% 4,838 - - 4,838
1200 2065 Replacements New 218,435 2.215% 4,838 - - 4,838
1201 2065 Float Historical - - (1,008) - - (1,008)
1202 FY 2065 Subtotal: 436,871 8,668 - - 8,668
1203 2066 Replacements Historical 218,435 2.215% 4,838 - - 4,838
1204 2066 Replacements New 218,435 2.215% 4,838 - - 4,838
1205 2066 Float Historical - - (1,008) - - (1,008)
1206 FY 2066 Subtotal: 436,871 8,668 - - 8,668
1207 2067 Replacements Historical 218,435 2.215% 4,838 - - 4,838
1208 2067 Replacements New 218,435 2.215% 4,838 - - 4,838
1209 2067 Float Historical - - (1,008) - - (1,008)
1210 FY 2067 Subtotal: 436,871 8,668 - - 8,668
1211 2068 Replacements Historical 218,435 2.215% 4,838 - - 4,838
1212 2068 Replacements New 218,435 2.215% 4,838 - - 4,838
1213 2068 Float Historical - - (1,008) - - (1,008)
1214 FY 2068 Subtotal: 436,871 8,668 - - 8,668
1215 2069 Replacements Historical 218,435 2.215% 4,838 - - 4,838
1216 2069 Replacements New 218,435 2.215% 4,838 - - 4,838
1217 2069 Float Historical - - (1,008) - - (1,008)
1218 FY 2069 Subtotal: 436,871 8,668 - - 8,668
1219 Grand Total: 127,052,919 4,511,470 - (10,729) 4,500,741
BP-18-FS-BPA-02A Page 170

TABLE 12D
Application of Amortization
October 1, 2015 - September 30, 2019 Cost Evaluation Period
($000s) (FY 2019)
A B C D E F G H I J K L M N O P
Fiscal Year Project Debt Type In Service
Bond Due
Date Initial Principal Current Principal Original Rate Effective Rate
Refinance
Type
Refinanced
Date
Rolled Maturity
Date Roll Rate Principal Paid Premium Discount
1 2017 Lower Snake Fish and Wildlife Lower Snake Fish & Wildlife 9/30/1983 9/30/2033 30,488 9,472 7.150% 7.150% 9,472
2 2017 Bonneville 2nd Powerhouse Corps of Engineers 9/30/1986 9/30/2033 30,578 21,534 7.150% 7.150% 21,534
3 2017 Bonneville 2nd Powerhouse Corps of Engineers 9/30/1987 9/30/2033 2,801 2,801 7.150% 7.150% 2,801
4 2017 Bonneville 2nd Powerhouse Corps of Engineers 9/30/1988 9/30/2033 1,271 1,271 7.150% 7.150% 1,271
5 2017 Bonneville 2nd Powerhouse Corps of Engineers 9/30/1989 9/30/2033 1,232 1,232 7.150% 7.150% 1,232
6 2017 Bonneville 2nd Powerhouse Corps of Engineers 9/30/1990 9/30/2033 1,588 1,588 7.150% 7.150% 1,588
7 2017 Lower Snake Fish and Wildlife Lower Snake Fish & Wildlife 9/30/1985 9/30/2035 47,921 47,921 7.150% 7.150% 47,921
8 2017 John Day Corps of Engineers 9/30/1995 9/30/2035 22 22 7.150% 7.150% 22
9 2017 John Day Corps of Engineers 9/30/1995 9/30/2035 52 52 7.150% 7.150% 52
10 2017 John Day Corps of Engineers 9/30/1995 9/30/2035 121 121 7.150% 7.150% 121
11 2017 Lower Monument Corps of Engineers 9/30/1996 9/30/2036 264 264 7.150% 7.150% 264
12 2017 Lower Snake Fish and Wildlife Lower Snake Fish & Wildlife 9/30/1987 9/30/2037 72,536 72,536 7.150% 7.150% 72,536
13 2017 Libby Corps of Engineers 9/30/1988 9/30/2038 18,043 14,781 7.150% 7.150% 14,781
14 2017 Lower Snake Fish and Wildlife Lower Snake Fish & Wildlife 9/30/1988 9/30/2038 805 805 7.150% 7.150% 805
15 2017 Lower Snake Fish and Wildlife Lower Snake Fish & Wildlife 9/30/1990 9/30/2040 1,557 1,557 7.150% 7.150% 1,557
16 2017 Little Goose Corps of Engineers 9/30/1995 9/30/2040 17 17 7.150% 7.150% 17
17 2017 Little Goose Corps of Engineers 9/30/1995 9/30/2040 450 450 7.150% 7.150% 450
18 2017 Little Goose Corps of Engineers 9/30/1995 9/30/2040 733 733 7.150% 7.150% 733
19 2017 Lower Snake Fish and Wildlife Lower Snake Fish & Wildlife 9/30/1991 9/30/2041 4,411 4,411 7.150% 7.150% 4,411
20 2017 Ice Harbor Corps of Engineers 9/30/1996 9/30/2041 371 371 7.150% 7.150% 371
21 2017 Lower Snake Fish and Wildlife Lower Snake Fish & Wildlife 9/30/1993 9/30/2043 71,632 71,632 7.150% 7.150% 71,632
22 2017 Bonneville 2nd Powerhouse Corps of Engineers 9/30/1994 9/30/2044 5,700 5,700 7.150% 7.150% 5,700
23 2017 Chief Joseph Corps of Engineers 9/30/1994 9/30/2044 4,280 4,017 7.150% 7.150% 4,017
24 2017 Lower Snake Fish and Wildlife Lower Snake Fish & Wildlife 9/30/1994 9/30/2044 4,722 4,722 7.150% 7.150% 4,722
25 2017 Columbia Basin 3rd Powerhouse Bureau of Reclamation 9/30/1994 9/30/2044 12,631 12,631 7.150% 7.150% 12,631
26 2017 Bonneville 2nd Powerhouse Corps of Engineers 9/30/1995 9/30/2045 3,791 3,791 7.150% 7.150% 3,791
27 2017 Columbia River Fish Mitigation Corps of Engineers 9/30/1995 9/30/2045 43,343 39,282 7.150% 7.150% 39,282
28 2017 Detroit Lake/Big Cliff Corps of Engineers 9/30/1995 9/30/2045 38 38 7.150% 7.150% 38
29 2017 Lookout Dam Corps of Engineers 9/30/1995 9/30/2045 80 39 7.150% 7.150% 39
30 2017 Lost Creek Corps of Engineers 9/30/1995 9/30/2045 94 94 7.150% 7.150% 94
31 2017 Lower Monument Corps of Engineers 9/30/1995 9/30/2045 41 41 7.150% 7.150% 41
32 2017 McNary Corps of Engineers 9/30/1995 9/30/2045 16 16 7.150% 7.150% 16
33 2017 Albeni Falls Corps of Engineers 9/30/1995 9/30/2045 443 443 7.150% 7.150% 443
34 2017 Chief Joseph Corps of Engineers 9/30/1995 9/30/2045 147 147 7.150% 7.150% 147
35 2017 Dworshak Corps of Engineers 9/30/1995 9/30/2045 1,162 1,162 7.150% 7.150% 1,162
36 2017 John Day Corps of Engineers 9/30/1995 9/30/2045 37 37 7.150% 7.150% 37
37 2017 Lookout Dam Corps of Engineers 9/30/1995 9/30/2045 33 33 7.150% 7.150% 33
38 2017 Lower Monument Corps of Engineers 9/30/1995 9/30/2045 99 99 7.150% 7.150% 99
39 2017 Albeni Falls Corps of Engineers 9/30/1995 9/30/2045 531 531 7.150% 7.150% 531
40 2017 Chief Joseph Corps of Engineers 9/30/1995 9/30/2045 562 562 7.150% 7.150% 562
41 2017 Lower Monument Corps of Engineers 9/30/1995 9/30/2045 624 624 7.150% 7.150% 624
42 2017 Albeni Falls Corps of Engineers 9/30/1995 9/30/2045 1,105 1,105 7.150% 7.150% 1,105
43 2017 Bonneville Dam Corps of Engineers 9/30/1995 9/30/2045 243 243 7.150% 7.150% 243
44 2017 Chief Joseph Corps of Engineers 9/30/1995 9/30/2045 712 712 7.150% 7.150% 712
45 2017 Columbia Basin Bureau of Reclamation 9/30/1995 9/30/2045 287 287 7.150% 7.150% 287
46 2017 Hungry Horse Dam Bureau of Reclamation 9/30/1995 9/30/2045 6,190 6,190 7.150% 7.150% 6,190
47 2017 Lower Monument Corps of Engineers 9/30/1995 9/30/2045 1,122 1,122 7.150% 7.150% 1,122
48 2017 Bonneville Dam Corps of Engineers 9/30/1995 9/30/2045 410 410 7.150% 7.150% 410
49 2017 Chief Joseph Corps of Engineers 9/30/1995 9/30/2045 784 784 7.150% 7.150% 784
50 2017 Columbia Basin Bureau of Reclamation 9/30/1995 9/30/2045 2,511 2,453 7.150% 7.150% 2,453
51 2017 Bonneville Dam Corps of Engineers 9/30/1995 9/30/2045 440 440 7.150% 7.150% 440
52 2017 John Day Corps of Engineers 9/30/1995 9/30/2045 608 608 7.150% 7.150% 608
53 2017 John Day Corps of Engineers 9/30/1995 9/30/2045 7,653 7,653 7.150% 7.150% 7,653
54 2017 Boise Bureau of Reclamation 9/30/1996 9/30/2046 442 442 7.150% 7.150% 442
55 2017 Bonneville 2nd Powerhouse Corps of Engineers 9/30/1996 9/30/2046 376 376 7.150% 7.150% 376
56 2017 Bonneville Dam Corps of Engineers 9/30/1996 9/30/2046 18 18 7.150% 7.150% 18
57 2017 Chief Joseph Corps of Engineers 9/30/1996 9/30/2046 3 3 7.150% 7.150% 3
58 2017 Columbia River Fish Mitigation Corps of Engineers 9/30/1996 9/30/2046 2,431 2,431 7.150% 7.150% 2,431
59 2017 Dworshak Corps of Engineers 9/30/1996 9/30/2046 3 3 7.150% 7.150% 3
60 2017 Green Peter/Foster Corps of Engineers 9/30/1996 9/30/2046 26 26 7.150% 7.150% 26
BP-18-FS-BPA-02A Page 171

TABLE 12D
Application of Amortization
October 1, 2015 - September 30, 2019 Cost Evaluation Period
($000s) (FY 2019)
A B C D E F G H I J K L M N O P
Fiscal Year Project Debt Type In Service
Bond Due
Date Initial Principal Current Principal Original Rate Effective Rate
Refinance
Type
Refinanced
Date
Rolled Maturity
Date Roll Rate Principal Paid Premium Discount
61 2017 Hills Creek Corps of Engineers 9/30/1996 9/30/2046 28 28 7.150% 7.150% 28
62 2017 Hungry Horse Dam Bureau of Reclamation 9/30/1996 9/30/2046 15 15 7.150% 7.150% 15
63 2017 Little Goose Corps of Engineers 9/30/1996 9/30/2046 10 10 7.150% 7.150% 10
64 2017 Lost Creek Corps of Engineers 9/30/1996 9/30/2046 24 24 7.150% 7.150% 24
65 2017 Lower Granite Corps of Engineers 9/30/1996 9/30/2046 9 9 7.150% 7.150% 9
66 2017 Lower Monument Corps of Engineers 9/30/1996 9/30/2046 10 10 7.150% 7.150% 10
67 2017 Lower Snake Fish and Wildlife Lower Snake Fish & Wildlife 9/30/1996 9/30/2046 12,085 12,085 7.150% 7.150% 12,085
68 2017 Bonneville Dam Corps of Engineers 9/30/1996 9/30/2046 18 18 7.150% 7.150% 18
69 2017 Chief Joseph Corps of Engineers 9/30/1996 9/30/2046 4 4 7.150% 7.150% 4
70 2017 Dworshak Corps of Engineers 9/30/1996 9/30/2046 4 4 7.150% 7.150% 4
71 2017 Hungry Horse Dam Bureau of Reclamation 9/30/1996 9/30/2046 2 2 7.150% 7.150% 2
72 2017 Little Goose Corps of Engineers 9/30/1996 9/30/2046 10 10 7.150% 7.150% 10
73 2017 Boise Bureau of Reclamation 9/30/1996 9/30/2046 656 656 7.150% 7.150% 656
74 2017 Little Goose Corps of Engineers 9/30/1996 9/30/2046 211 211 7.150% 7.150% 211
75 2017 The Dalles Corps of Engineers 9/30/1996 9/30/2046 1,991 1,991 7.150% 7.150% 1,991
76 2017 Bonneville Dam Corps of Engineers 9/30/1996 9/30/2046 80 80 7.150% 7.150% 80
77 2017 Chief Joseph Corps of Engineers 9/30/1996 9/30/2046 355 355 7.150% 7.150% 355
78 2017 Columbia Basin Bureau of Reclamation 9/30/1996 9/30/2046 426 426 7.150% 7.150% 426
79 2017 Little Goose Corps of Engineers 9/30/1996 9/30/2046 241 241 7.150% 7.150% 241
80 2017 Lower Granite Corps of Engineers 9/30/1996 9/30/2046 625 625 7.150% 7.150% 625
81 2017 McNary Corps of Engineers 9/30/1996 9/30/2046 619 619 7.150% 7.150% 619
82 2017 Bonneville Dam Corps of Engineers 9/30/1996 9/30/2046 109 109 7.150% 7.150% 109
83 2017 Chief Joseph Corps of Engineers 9/30/1996 9/30/2046 729 729 7.150% 7.150% 729
84 2017 Columbia Basin Bureau of Reclamation 9/30/1996 9/30/2046 368 368 7.150% 7.150% 368
85 2017 Dworshak Corps of Engineers 9/30/1996 9/30/2046 46 46 7.150% 7.150% 46
86 2017 Little Goose Corps of Engineers 9/30/1996 9/30/2046 520 520 7.150% 7.150% 520
87 2017 Bonneville Dam Corps of Engineers 9/30/1996 9/30/2046 142 142 7.150% 7.150% 142
88 2017 Little Goose Corps of Engineers 9/30/1996 9/30/2046 3,909 3,909 7.150% 7.150% 3,909
89 2017 Bonneville Dam Corps of Engineers 9/30/1996 9/30/2046 223 223 7.150% 7.150% 223
90 2017 Bonneville Dam Corps of Engineers 9/30/1996 9/30/2046 751 751 7.150% 7.150% 751
91 2017 Bonneville Dam Corps of Engineers 9/30/1996 9/30/2046 1,322 1,322 7.150% 7.150% 1,322
92 2017 Albeni Falls Corps of Engineers 9/30/1997 9/30/2047 431 431 7.150% 7.150% 431
93 2017 Columbia Basin Bureau of Reclamation 9/30/1997 9/30/2047 3,393 3,393 7.150% 7.150% 3,393
94 2017 Cougar Corps of Engineers 9/30/1997 9/30/2047 26 26 7.150% 7.150% 26
95 2017 Dworshak Corps of Engineers 9/30/1997 9/30/2047 7,588 7,588 7.150% 7.150% 7,588
96 2017 Little Goose Corps of Engineers 9/30/1997 9/30/2047 1 1 7.150% 7.150% 1
97 2017 Lower Granite Corps of Engineers 9/30/1997 9/30/2047 677 677 7.150% 7.150% 677
98 2017 Lower Snake Fish and Wildlife Lower Snake Fish & Wildlife 9/30/1997 9/30/2047 2,173 2,173 7.150% 7.150% 2,173
99 2017 Boise Bureau of Reclamation 9/30/1997 9/30/2047 2,266 2,266 7.150% 7.150% 2,266
100 2017 Chief Joseph Corps of Engineers 9/30/1997 9/30/2047 657 657 7.150% 7.150% 657
101 2017 Hungry Horse Dam Bureau of Reclamation 9/30/1997 9/30/2047 111 111 7.150% 7.150% 111
102 2017 Ice Harbor Corps of Engineers 9/30/1997 9/30/2047 67 67 7.150% 7.150% 67
103 2017 John Day Corps of Engineers 9/30/1997 9/30/2047 179 179 7.150% 7.150% 179
104 2017 Libby Corps of Engineers 9/30/1997 9/30/2047 660 660 7.150% 7.150% 660
105 2017 Minidoka/Palisades Bureau of Reclamation 9/30/1997 9/30/2047 50,911 50,911 7.150% 7.150% 50,911
106 2017 Bonneville Dam Corps of Engineers 9/30/1997 9/30/2047 161 161 7.150% 7.150% 161
107 2017 Columbia River Fish Mitigation Corps of Engineers 9/30/2000 9/30/2050 47,006 47,006 6.125% 6.125% 14,055
108 2017 Hills Creek Corps of Engineers 9/30/2000 9/30/2050 2,630 2,630 6.125% 6.125% 2,630
109 2017 Ice Harbor Corps of Engineers 9/30/2000 9/30/2050 548 548 6.125% 6.125% 548
110 2017 John Day Corps of Engineers 9/30/2000 9/30/2050 2,761 2,761 6.125% 6.125% 2,761
111 2017 Lookout Dam Corps of Engineers 9/30/2000 9/30/2050 5,098 5,098 6.125% 6.125% 5,098
112 2017 Lower Snake Fish and Wildlife Lower Snake Fish & Wildlife 9/30/2000 9/30/2050 1,529 1,529 6.125% 6.125% 1,529
113 2017 The Dalles Corps of Engineers 9/30/2000 9/30/2050 2,588 2,588 6.125% 6.125% 2,588
114 FY 2017 Subtotal: - - - 547,635 509,890 476,940
115 2018 Construction (AS) - 6/30/2013 6/30/2017 3,000 3,000 1.271% 0.750% Global 6/30/2017 6/30/2018 0.750% 3,000
116 2018 Construction (AS) - 8/31/2013 8/31/2017 2,000 2,000 1.494% 0.750% Global 8/31/2017 8/31/2018 0.750% 2,000
117 2018 Construction (AS) - 9/30/2015 9/30/2017 7,700 7,700 0.744% 0.750% Global 9/30/2017 9/30/2018 0.750% 7,700
118 2018 Construction (AS) - 4/30/2017 1/31/2018 2,450 2,450 1.051% 1.051% 2,450
119 2018 Conservation - 1/31/2013 1/31/2018 9,000 9,000 1.107% 1.107% 9,000
120 2018 Conservation - 4/30/2017 1/31/2018 20,000 20,000 1.051% 1.051% 20,000
BP-18-FS-BPA-02A Page 172

TABLE 12D
Application of Amortization
October 1, 2015 - September 30, 2019 Cost Evaluation Period
($000s) (FY 2019)
A B C D E F G H I J K L M N O P
Fiscal Year Project Debt Type In Service
Bond Due
Date Initial Principal Current Principal Original Rate Effective Rate
Refinance
Type
Refinanced
Date
Rolled Maturity
Date Roll Rate Principal Paid Premium Discount
121 2018 Bonneville Dam Corps of Engineers 9/30/2000 9/30/2050 24,446 24,446 6.125% 6.125% 24,446
122 2018 Columbia River Fish Mitigation Corps of Engineers 9/30/2000 9/30/2050 47,006 32,951 6.125% 6.125% 32,951
123 2018 Columbia River Fish Mitigation Corps of Engineers 9/30/2001 9/30/2051 6,168 6,168 5.875% 5.875% 3,315
124 2018 Green Peter/Foster Corps of Engineers 9/30/2001 9/30/2051 200 200 5.875% 5.875% 200
125 2018 Hills Creek Corps of Engineers 9/30/2001 9/30/2051 8 8 5.875% 5.875% 8
126 2018 Hungry Horse Dam Bureau of Reclamation 9/30/2001 9/30/2051 552 552 5.875% 5.875% 552
127 2018 Ice Harbor Corps of Engineers 9/30/2001 9/30/2051 764 764 5.875% 5.875% 764
128 2018 John Day Corps of Engineers 9/30/2001 9/30/2051 619 619 5.875% 5.875% 619
129 2018 Libby Corps of Engineers 9/30/2001 9/30/2051 5,562 5,562 5.875% 5.875% 5,562
130 2018 Little Goose Corps of Engineers 9/30/2001 9/30/2051 4,608 4,608 5.875% 5.875% 4,608
131 2018 Lost Creek Corps of Engineers 9/30/2001 9/30/2051 147 147 5.875% 5.875% 147
132 2018 Lower Granite Corps of Engineers 9/30/2001 9/30/2051 2,025 2,025 5.875% 5.875% 2,025
133 2018 Lower Monument Corps of Engineers 9/30/2001 9/30/2051 3,301 3,301 5.875% 5.875% 3,301
134 2018 Lower Snake Fish and Wildlife Lower Snake Fish & Wildlife 9/30/2001 9/30/2051 325 325 5.875% 5.875% 325
135 2018 McNary Corps of Engineers 9/30/2001 9/30/2051 1,046 1,046 5.875% 5.875% 1,046
136 2018 Minidoka/Palisades Bureau of Reclamation 9/30/2001 9/30/2051 42 42 5.875% 5.875% 42
137 2018 RRP - Green Springs Bureau of Reclamation 9/30/2001 9/30/2051 11,145 11,145 5.875% 5.875% 11,145
138 2018 Yakima Roza Bureau of Reclamation 9/30/2001 9/30/2051 15 14 5.875% 5.875% 14
139 FY 2018 Subtotal: - - - 152,129 138,073 135,220
140 2019 Bureau Direct - 10/31/2009 10/31/2018 24,000 24,000 3.719% 3.719% 24,000
141 2019 Construction (AS) - 11/30/2012 11/30/2018 5,250 5,250 1.109% 1.109% 5,250
142 2019 Fish and Wildlife - 12/31/2009 12/31/2018 26,000 26,000 4.069% 4.069% 26,000
143 2019 Bureau Direct - 1/16/2014 12/31/2018 43,000 43,000 1.943% 1.943% 43,000
144 2019 Bureau Direct - 1/16/2014 12/31/2018 38,000 38,000 1.943% 1.943% 38,000
145 2019 Fish and Wildlife - 8/31/2010 8/31/2019 20,000 20,000 2.646% 2.646% 20,000
146 2019 Columbia Basin Bureau of Reclamation 9/30/2001 9/30/2051 69,226 69,226 5.875% 5.875% 14,236
147 2019 Columbia River Fish Mitigation Corps of Engineers 9/30/2001 9/30/2051 6,168 2,853 5.875% 5.875% 2,853
148 2019 Detroit Lake/Big Cliff Corps of Engineers 9/30/2001 9/30/2051 282 282 5.875% 5.875% 282
149 FY 2019 Subtotal: - - - 231,926 228,611 173,622
150 2020 Construction (AS) - 10/31/2013 10/31/2019 4,200 4,200 2.039% 2.039% 4,200
151 2020 Construction (AS) - 10/31/2013 10/31/2019 5,000 5,000 2.039% 2.039% 5,000
152 2020 Bureau Direct - 10/31/2009 10/31/2019 20,000 20,000 3.842% 3.842% 20,000
153 2020 Bureau Direct - 11/30/2009 11/30/2019 7,000 7,000 3.637% 3.637% 7,000
154 2020 Bureau Direct - 12/31/2009 12/31/2019 13,000 13,000 4.194% 4.194% 13,000
155 2020 Construction (AS) - 1/31/2014 1/31/2020 1,750 1,750 2.183% 2.183% 1,750
156 2020 Construction (AS) - 1/31/2014 1/31/2020 2,000 2,000 2.183% 2.183% 2,000
157 2020 Construction (AS) - 4/30/2014 3/31/2020 1,400 1,400 0.947% 0.947% 1,400
158 2020 Construction (AS) - 4/30/2014 3/31/2020 2,000 2,000 0.947% 0.947% 2,000
159 2020 Bureau Direct - 3/31/2010 3/31/2020 30,000 30,000 4.083% 4.083% 30,000
160 2020 Bureau Direct - 4/30/2010 4/30/2020 18,000 18,000 3.973% 3.973% 18,000
161 2020 Construction (AS) - 5/31/2014 4/30/2020 700 700 0.526% 0.526% 700
162 2020 Bureau Direct - 5/31/2010 5/31/2020 15,000 15,000 3.574% 3.574% 15,000
163 2020 Bureau Direct - 7/31/2010 7/31/2020 17,000 17,000 3.118% 3.118% 17,000
164 2020 Construction (AS) - 7/31/2014 7/31/2020 1,050 1,050 0.674% 0.674% 1,050
165 2020 Columbia Basin Bureau of Reclamation 9/30/2001 9/30/2051 69,226 54,989 5.875% 5.875% 6,543
166 FY 2020 Subtotal: - - - 207,326 193,089 144,643
167 2021 Construction (AS) - 11/30/2014 11/30/2020 2,100 2,100 1.809% 1.809% 2,100
168 2021 Construction (AS) - 12/31/2014 12/31/2020 1,050 1,050 1.922% 1.922% 1,050
169 2021 Technology (G) - 1/31/2015 1/31/2021 35,000 35,000 1.469% 1.469% 35,000
170 2021 Bureau Direct - 1/31/2009 1/31/2021 25,000 25,000 3.999% 3.999% 25,000
171 2021 Construction (AS) - 2/28/2015 2/28/2021 1,750 1,750 1.761% 1.761% 1,750
172 2021 Construction (AS) - 5/31/2015 5/31/2021 2,100 2,100 1.898% 1.898% 2,100
173 2021 Conservation - 5/31/2015 5/31/2021 5,000 5,000 1.898% 1.898% 5,000
174 2021 Conservation - 7/31/2015 7/31/2021 14,000 14,000 2.067% 2.067% 14,000
175 2021 Bureau Direct - 11/20/2013 9/30/2021 50,000 50,000 2.812% 2.812% 50,000
176 2021 Bureau Direct - 9/30/2010 9/30/2021 22,000 22,000 2.883% 2.883% 22,000
177 2021 Columbia Basin Bureau of Reclamation 9/30/2001 9/30/2051 69,226 48,446 5.875% 5.875% 2,140
178 FY 2021 Subtotal: - - - 227,226 206,446 160,140
179 2022 Construction (AS) - 10/31/2015 10/31/2021 2,800 2,800 1.942% 1.942% 2,800
180 2022 Conservation - 12/31/2013 12/31/2021 6,000 6,000 3.142% 3.142% 6,000
BP-18-FS-BPA-02A Page 173

TABLE 12D
Application of Amortization
October 1, 2015 - September 30, 2019 Cost Evaluation Period
($000s) (FY 2019)
A B C D E F G H I J K L M N O P
Fiscal Year Project Debt Type In Service
Bond Due
Date Initial Principal Current Principal Original Rate Effective Rate
Refinance
Type
Refinanced
Date
Rolled Maturity
Date Roll Rate Principal Paid Premium Discount
181 2022 Construction (AS) - 2/29/2016 2/28/2022 3,000 3,000 0.697% 0.697% 3,000
182 2022 Technology (G) - 10/31/2015 7/31/2022 6,000 6,000 0.674% 0.674% 6,000
183 2022 Conservation - 8/31/2015 8/31/2022 6,000 6,000 2.233% 2.233% 6,000
184 2022 Bureau Direct - 11/20/2013 9/30/2022 19,000 19,000 3.125% 3.125% 19,000
185 2022 Fish and Wildlife - 11/20/2013 9/30/2022 31,000 31,000 3.125% 3.125% 31,000
186 2022 Conservation - 9/30/2015 9/30/2022 4,000 4,000 2.062% 2.062% 4,000
187 2022 Technology (G) - 9/30/2017 9/30/2022 8,000 8,000 1.400% 1.400% 8,000
188 2022 Columbia Basin Bureau of Reclamation 9/30/2001 9/30/2051 69,226 46,306 5.875% 5.875% 37,701
189 FY 2022 Subtotal: - - - 155,026 132,106 123,501
190 2023 Conservation - 1/31/2011 1/31/2023 40,000 40,000 4.046% 4.046% 40,000
191 2023 Conservation - 4/30/2011 4/30/2023 35,000 35,000 3.932% 3.932% 35,000
192 2023 Conservation - 8/12/2011 8/31/2023 40,000 40,000 3.206% 3.206% 40,000
193 2023 Conservation - 11/20/2013 9/30/2023 27,000 27,000 3.375% 3.375% 27,000
194 2023 Technology (G) - 9/30/2018 9/30/2023 5,000 5,000 2.440% 2.440% 5,000
195 2023 Construction (AS) - 9/30/2017 9/30/2023 3,150 3,150 1.510% 1.510% 3,150
196 FY 2023 Subtotal: - - - 150,150 150,150 150,150
197 2024 Conservation - 12/31/2013 12/31/2023 55,000 55,000 0.732% 0.732% 55,000
198 2024 Conservation - 12/31/2014 12/31/2023 7,000 7,000 2.403% 2.403% 7,000
199 2024 Conservation - 1/31/2015 1/31/2024 7,000 7,000 1.908% 1.908% 7,000
200 2024 Fish and Wildlife - 1/31/2015 1/31/2024 5,000 5,000 1.908% 1.908% 5,000
201 2024 Conservation - 2/28/2015 2/29/2024 8,000 8,000 2.251% 2.251% 8,000
202 2024 Technology (G) - 9/30/2019 3/31/2024 5,000 5,000 3.160% 3.160% 5,000
203 2024 Conservation - 4/30/2015 4/30/2024 5,000 5,000 2.269% 2.269% 5,000
204 2024 Conservation - 5/31/2014 4/30/2024 15,000 15,000 0.526% 0.526% 15,000
205 2024 Fish and Wildlife - 6/30/2009 6/30/2024 20,000 20,000 4.556% 4.556% 20,000
206 2024 Construction (AS) - 9/30/2018 9/30/2024 5,670 5,600 2.560% 2.560% 5,600
207 2024 Columbia Basin Bureau of Reclamation 9/30/2001 9/30/2051 69,226 8,605 5.875% 5.875% 4,879
208 FY 2024 Subtotal: - - - 201,896 141,205 137,479
209 2025 Conservation - 6/30/2014 10/31/2024 5,000 5,000 0.526% 0.526% 5,000
210 2025 Conservation - 10/31/2014 12/31/2024 10,000 10,000 0.732% 0.732% 10,000
211 2025 Conservation - 3/31/2015 3/31/2025 5,000 5,000 2.295% 2.295% 5,000
212 2025 Conservation - 5/31/2014 4/30/2025 3,000 3,000 0.526% 0.526% 3,000
213 2025 Conservation - 4/30/2014 6/30/2025 30,000 30,000 0.732% 0.732% 30,000
214 2025 Conservation - 7/31/2014 7/31/2025 12,000 12,000 0.674% 0.674% 12,000
215 2025 Conservation - 8/31/2014 9/30/2025 4,000 4,000 0.947% 0.947% 4,000
216 2025 Construction (AS) - 9/30/2019 9/30/2025 5,670 5,950 3.270% 3.270% 5,950
217 2025 Ice Harbor Corps of Engineers 9/30/1999 9/30/2049 5,516 5,516 5.375% 5.375% 3,620
218 2025 John Day Corps of Engineers 9/30/1999 9/30/2049 3,510 3,510 5.375% 5.375% 3,510
219 2025 Lower Granite Corps of Engineers 9/30/1999 9/30/2049 856 856 5.375% 5.375% 856
220 2025 Lower Snake Fish and Wildlife Lower Snake Fish & Wildlife 9/30/1999 9/30/2049 7 7 5.375% 5.375% 7
221 2025 Bonneville Dam Corps of Engineers 9/30/2001 9/30/2051 2,530 2,530 5.875% 5.875% 2,530
222 2025 Chief Joseph Corps of Engineers 9/30/2001 9/30/2051 345 345 5.875% 5.875% 345
223 2025 Columbia Basin Bureau of Reclamation 9/30/2001 9/30/2051 69,226 3,727 5.875% 5.875% 3,727
224 2025 Bonneville Dam Corps of Engineers 9/30/2002 9/30/2052 448 448 5.500% 5.500% 448
225 2025 Chief Joseph Corps of Engineers 9/30/2002 9/30/2052 2 2 5.500% 5.500% 2
226 2025 Columbia River Fish Mitigation Corps of Engineers 9/30/2002 9/30/2052 8,797 8,797 5.500% 5.500% 8,797
227 2025 Detroit Lake/Big Cliff Corps of Engineers 9/30/2002 9/30/2052 18 18 5.500% 5.500% 18
228 2025 Dworshak Corps of Engineers 9/30/2002 9/30/2052 199 199 5.500% 5.500% 199
229 2025 Hills Creek Corps of Engineers 9/30/2002 9/30/2052 2 2 5.500% 5.500% 2
230 2025 Ice Harbor Corps of Engineers 9/30/2002 9/30/2052 1,014 1,014 5.500% 5.500% 1,014
231 2025 Little Goose Corps of Engineers 9/30/2002 9/30/2052 27 27 5.500% 5.500% 27
232 2025 Lower Granite Corps of Engineers 9/30/2002 9/30/2052 1,275 1,275 5.500% 5.500% 1,275
233 2025 Lower Monument Corps of Engineers 9/30/2002 9/30/2052 29 29 5.500% 5.500% 29
234 2025 Lower Snake Fish and Wildlife Lower Snake Fish & Wildlife 9/30/2002 9/30/2052 890 890 5.500% 5.500% 890
235 2025 The Dalles Corps of Engineers 9/30/2002 9/30/2052 1,226 1,226 5.500% 5.500% 1,226
236 FY 2025 Subtotal: - - - 170,585 105,366 103,470
237 2026 Conservation - 10/31/2013 10/31/2025 34,000 34,000 3.568% 3.568% 34,000
238 2026 Conservation - 1/31/2014 1/31/2026 5,000 5,000 3.621% 3.621% 5,000
239 2026 Fish and Wildlife - 1/31/2011 1/31/2026 50,000 50,000 4.440% 4.440% 50,000
240 2026 Fish and Wildlife - 2/28/2011 2/28/2026 15,000 15,000 4.398% 4.398% 15,000
BP-18-FS-BPA-02A Page 174

TABLE 12D
Application of Amortization
October 1, 2015 - September 30, 2019 Cost Evaluation Period
($000s) (FY 2019)
A B C D E F G H I J K L M N O P
Fiscal Year Project Debt Type In Service
Bond Due
Date Initial Principal Current Principal Original Rate Effective Rate
Refinance
Type
Refinanced
Date
Rolled Maturity
Date Roll Rate Principal Paid Premium Discount
241 2026 Fish and Wildlife - 6/22/2011 6/30/2026 15,000 15,000 4.205% 4.205% 15,000
242 2026 Ice Harbor Corps of Engineers 9/30/1999 9/30/2049 5,516 1,896 5.375% 5.375% 990
243 FY 2026 Subtotal: - - - 124,516 120,896 119,990
244 2027 Fish and Wildlife - 10/31/2013 12/31/2026 28,000 28,000 3.717% 3.717% 28,000
245 2027 Conservation - 11/30/2014 3/31/2027 6,000 6,000 0.947% 0.947% 6,000
246 2027 Fish and Wildlife - 5/31/2014 4/30/2027 11,000 11,000 0.526% 0.526% 11,000
247 2027 Fish and Wildlife - 11/30/2013 5/31/2027 5,000 5,000 0.713% 0.713% 5,000
248 2027 Fish and Wildlife - 10/31/2013 5/31/2027 11,000 11,000 3.762% 3.762% 11,000
249 2027 Bonneville Dam Corps of Engineers 9/30/1999 9/30/2049 19,368 19,368 5.375% 5.375% 19,368
250 2027 Columbia River Fish Mitigation Corps of Engineers 9/30/1999 9/30/2049 14,115 14,115 5.375% 5.375% 14,115
251 2027 Dworshak Corps of Engineers 9/30/1999 9/30/2049 630 630 5.375% 5.375% 630
252 2027 Ice Harbor Corps of Engineers 9/30/1999 9/30/2049 5,516 906 5.375% 5.375% 906
253 2027 Columbia River Fish Mitigation Corps of Engineers 9/30/2004 9/30/2054 60,581 60,581 5.375% 5.375% 6,627
254 2027 Ice Harbor Corps of Engineers 9/30/2004 9/30/2054 3,321 3,321 5.375% 5.375% 3,321
255 2027 John Day Corps of Engineers 9/30/2004 9/30/2054 2,830 2,830 5.375% 5.375% 2,830
256 2027 Little Goose Corps of Engineers 9/30/2004 9/30/2054 68 67 5.375% 5.375% 67
257 2027 Lower Monument Corps of Engineers 9/30/2004 9/30/2054 3,423 3,423 5.375% 5.375% 3,423
258 2027 Lower Snake Fish and Wildlife Lower Snake Fish & Wildlife 9/30/2004 9/30/2054 230 230 5.375% 5.375% 230
259 2027 McNary Corps of Engineers 9/30/2004 9/30/2054 6,138 6,138 5.375% 5.375% 6,138
260 2027 The Dalles Corps of Engineers 9/30/2004 9/30/2054 182 182 5.375% 5.375% 182
261 FY 2027 Subtotal: - - - 177,399 172,789 118,835
262 2028 Bureau Direct - 4/30/2009 4/30/2023 25,000 25,000 4.391% 3.642% Global 4/30/2023 4/30/2028 3.642% 25,000
263 2028 Fish and Wildlife - 11/20/2013 9/30/2023 23,000 23,000 3.375% 3.642% Global 9/30/2023 9/30/2028 3.642% 23,000
264 2028 Conservation - 10/31/2015 10/31/2027 25,000 25,000 0.732% 0.732% 25,000
265 2028 Fish and Wildlife - 3/31/2015 3/31/2028 3,000 3,000 2.511% 2.511% 3,000
266 2028 Columbia River Fish Mitigation Corps of Engineers 9/30/2004 9/30/2054 60,581 53,953 5.375% 5.375% 4,624
267 FY 2028 Subtotal: - - - 136,581 129,953 80,624
268 2029 Bureau Direct - 1/16/2014 12/31/2018 26,000 26,000 1.943% 3.705% Global 12/31/2018 12/31/2028 3.705% 26,000
269 2029 Bureau Direct - 1/16/2014 12/31/2018 21,000 21,000 1.943% 3.705% Global 12/31/2018 12/31/2028 3.705% 21,000
270 2029 Bureau Direct - 1/16/2014 12/31/2018 14,000 14,000 1.943% 3.705% Global 12/31/2018 12/31/2028 3.705% 14,000
271 2029 Bureau Direct - 1/31/2010 1/31/2019 10,000 10,000 3.714% 3.705% Global 1/31/2019 1/31/2029 3.705% 10,000
272 2029 Bureau Direct - 9/30/2009 9/30/2019 25,000 25,000 3.699% 3.705% Global 9/30/2019 9/30/2029 3.705% 25,000
273 2029 Fish and Wildlife - 10/31/2013 10/31/2028 22,000 22,000 3.880% 3.880% 22,000
274 2029 Fish and Wildlife - 1/31/2014 1/31/2029 7,000 7,000 3.896% 3.896% 7,000
275 2029 Fish and Wildlife - 10/31/2014 1/31/2029 15,000 15,000 0.674% 0.674% 15,000
276 2029 Fish and Wildlife - 4/30/2014 2/28/2029 7,000 7,000 0.697% 0.697% 7,000
277 2029 Fish and Wildlife - 8/31/2014 7/31/2029 5,000 5,000 0.674% 0.674% 5,000
278 2029 Bureau Direct - 6/30/2009 6/30/2039 25,000 25,000 5.192% 5.192% 25,000 2,308
279 2029 Bonneville Dam Corps of Engineers 9/30/2003 9/30/2053 4,581 4,581 5.125% 5.125% 4,581
280 2029 Columbia River Fish Mitigation Corps of Engineers 9/30/2003 9/30/2053 68,440 68,440 5.125% 5.125% 68,440
281 2029 Detroit Lake/Big Cliff Corps of Engineers 9/30/2003 9/30/2053 223 223 5.125% 5.125% 223
282 2029 Dworshak Corps of Engineers 9/30/2003 9/30/2053 761 761 5.125% 5.125% 761
283 2029 Ice Harbor Corps of Engineers 9/30/2003 9/30/2053 50 50 5.125% 5.125% 50
284 2029 Little Goose Corps of Engineers 9/30/2003 9/30/2053 146 146 5.125% 5.125% 146
285 2029 Lookout Dam Corps of Engineers 9/30/2003 9/30/2053 135 135 5.125% 5.125% 135
286 2029 Lower Granite Corps of Engineers 9/30/2003 9/30/2053 42 42 5.125% 5.125% 42
287 2029 Lower Monument Corps of Engineers 9/30/2003 9/30/2053 22 22 5.125% 5.125% 22
288 2029 Lower Snake Fish and Wildlife Lower Snake Fish & Wildlife 9/30/2003 9/30/2053 98 98 5.125% 5.125% 98
289 2029 McNary Corps of Engineers 9/30/2003 9/30/2053 97 97 5.125% 5.125% 97
290 2029 Chief Joseph Corps of Engineers 9/30/2003 9/30/2053 992 992 5.125% 5.125% 992
291 2029 Bonneville Dam Corps of Engineers 9/30/2004 9/30/2054 26,741 26,741 5.375% 5.375% 26,741
292 2029 Columbia River Fish Mitigation Corps of Engineers 9/30/2004 9/30/2054 60,581 49,329 5.375% 5.375% 49,329
293 2029 Cougar Corps of Engineers 9/30/2004 9/30/2054 3,622 3,622 5.375% 5.375% 3,622
294 2029 Columbia River Fish Mitigation Corps of Engineers 9/30/2005 9/30/2055 52,039 52,039 5.125% 5.125% 25,691
295 2029 Hills Creek Corps of Engineers 9/30/2005 9/30/2055 46 46 5.125% 5.125% 46
296 2029 Hungry Horse Dam Bureau of Reclamation 9/30/2005 9/30/2055 2,951 2,951 5.125% 5.125% 2,951
297 2029 John Day Corps of Engineers 9/30/2005 9/30/2055 2,828 2,827 5.125% 5.125% 2,827
298 2029 Lookout Dam Corps of Engineers 9/30/2005 9/30/2055 7,355 7,355 5.125% 5.125% 7,355
299 2029 Lower Granite Corps of Engineers 9/30/2005 9/30/2055 393 393 5.125% 5.125% 393
300 2029 Lower Monument Corps of Engineers 9/30/2005 9/30/2055 527 527 5.125% 5.125% 527
301 2029 Lower Snake Fish and Wildlife Lower Snake Fish & Wildlife 9/30/2005 9/30/2055 4 4 5.125% 5.125% 4
BP-18-FS-BPA-02A Page 175

TABLE 12D
Application of Amortization
October 1, 2015 - September 30, 2019 Cost Evaluation Period
($000s) (FY 2019)
A B C D E F G H I J K L M N O P
Fiscal Year Project Debt Type In Service
Bond Due
Date Initial Principal Current Principal Original Rate Effective Rate
Refinance
Type
Refinanced
Date
Rolled Maturity
Date Roll Rate Principal Paid Premium Discount
302 2029 McNary Corps of Engineers 9/30/2005 9/30/2055 550 550 5.125% 5.125% 550
303 2029 The Dalles Corps of Engineers 9/30/2005 9/30/2055 36,019 36,019 5.125% 5.125% 36,019
304 2029 Yakima Chandler/Kenniwick Bureau of Reclamation 9/30/2005 9/30/2055 833 833 5.125% 5.125% 833
305 FY 2029 Subtotal: - - - 447,073 435,822 409,474 2,308
306 2030 Bureau Direct - 6/30/2010 6/30/2020 10,000 10,000 3.243% 4.057% Global 6/30/2020 6/30/2030 4.057% 10,000
307 2030 Bureau Direct - 6/30/2010 6/30/2020 30,000 30,000 3.243% 4.057% Global 6/30/2020 6/30/2030 4.057% 30,000
308 2030 Bureau Direct - 11/20/2013 9/30/2020 51,000 51,000 2.473% 4.057% Global 9/30/2020 9/30/2030 4.057% 51,000
309 2030 Fish and Wildlife - 11/30/2014 3/31/2030 8,000 8,000 0.947% 0.947% 8,000
310 2030 Corps - 5/31/2016 5/31/2030 15,000 15,000 2.599% 2.599% 15,000
311 2030 Bureau Direct - 7/31/2016 7/31/2030 12,000 12,000 2.145% 2.145% 12,000
312 2030 Bureau Direct - 7/31/2016 7/31/2030 25,000 25,000 2.145% 2.145% 25,000
313 2030 Bureau Direct - 1/31/2011 1/31/2039 35,000 35,000 5.040% 5.040% 35,000 2,705
314 2030 Bureau Direct - 2/28/2011 2/28/2040 50,000 50,000 4.995% 4.995% 25,484 1,821
315 2030 Albeni Falls Corps of Engineers 9/30/2005 9/30/2055 481 481 5.125% 5.125% 481
316 2030 Boise Bureau of Reclamation 9/30/2005 9/30/2055 903 903 5.125% 5.125% 903
317 2030 Bonneville Dam Corps of Engineers 9/30/2005 9/30/2055 19,725 19,725 5.125% 5.125% 19,725
318 2030 Columbia Basin Bureau of Reclamation 9/30/2005 9/30/2055 10,963 10,963 5.125% 5.125% 10,963
319 2030 Columbia River Fish Mitigation Corps of Engineers 9/30/2005 9/30/2055 52,039 26,348 5.125% 5.125% 26,348
320 2030 Cougar Corps of Engineers 9/30/2005 9/30/2055 8,130 8,130 5.125% 5.125% 8,130
321 2030 Detroit Lake/Big Cliff Corps of Engineers 9/30/2005 9/30/2055 1,031 1,031 5.125% 5.125% 1,031
322 2030 Dworshak Corps of Engineers 9/30/2005 9/30/2055 713 713 5.125% 5.125% 713
323 2030 Boise Bureau of Reclamation 9/30/2007 9/30/2057 76 76 5.000% 5.000% 76
324 2030 Bonneville Dam Corps of Engineers 9/30/2007 9/30/2057 1,124 1,124 5.000% 5.000% 1,124
325 2030 Columbia Basin Bureau of Reclamation 9/30/2007 9/30/2057 929 929 5.000% 5.000% 929
326 2030 Columbia River Fish Mitigation Corps of Engineers 9/30/2007 9/30/2057 53,525 53,525 5.000% 5.000% 53,525
327 2030 Cougar Corps of Engineers 9/30/2007 9/30/2057 120 120 5.000% 5.000% 120
328 2030 Hungry Horse Dam Bureau of Reclamation 9/30/2007 9/30/2057 294 294 5.000% 5.000% 294
329 2030 John Day Corps of Engineers 9/30/2007 9/30/2057 233 233 5.000% 5.000% 233
330 2030 Lookout Dam Corps of Engineers 9/30/2007 9/30/2057 572 572 5.000% 5.000% 572
331 2030 The Dalles Corps of Engineers 9/30/2007 9/30/2057 140 140 5.000% 5.000% 140
332 FY 2030 Subtotal: - - - 386,997 361,306 336,790 4,526
333 2031 Fish and Wildlife - 2/29/2016 2/28/2031 4,000 4,000 0.697% 0.697% 4,000
334 2031 Fish and Wildlife - 10/31/2015 2/28/2031 4,000 4,000 0.697% 0.697% 4,000
335 2031 Fish and Wildlife - 10/31/2015 3/31/2031 5,000 5,000 0.947% 0.947% 5,000
336 2031 Corps - 4/30/2016 4/30/2031 53,000 53,000 2.661% 2.661% 53,000
337 2031 Bureau Direct - 4/30/2016 4/30/2031 17,000 17,000 2.661% 2.661% 17,000
338 2031 Bureau Direct - 6/22/2011 6/30/2036 30,000 30,000 4.629% 4.629% 30,000 1,470
339 2031 Bureau Direct - 6/22/2011 6/30/2038 30,000 30,000 4.700% 4.700% 30,000 1,699
340 2031 Bureau Direct - 2/28/2011 2/28/2040 50,000 24,516 4.995% 4.995% 24,516 1,786
341 2031 Columbia River Fish Mitigation Corps of Engineers 9/30/2006 9/30/2056 366,395 366,395 4.500% 4.500% 191,054
342 2031 John Day Corps of Engineers 9/30/2006 9/30/2056 601 601 4.500% 4.500% 601
343 2031 Lower Monument Corps of Engineers 9/30/2006 9/30/2056 285 285 4.500% 4.500% 285
344 2031 Lower Snake Fish and Wildlife Lower Snake Fish & Wildlife 9/30/2006 9/30/2056 379 379 4.500% 4.500% 379
345 2031 The Dalles Corps of Engineers 9/30/2006 9/30/2056 2,030 2,030 4.500% 4.500% 2,030
346 2031 McNary Corps of Engineers 9/30/2006 9/30/2056 4,080 4,080 4.500% 4.500% 4,080
347 FY 2031 Subtotal: - - - 566,769 541,285 365,945 4,955
348 2032 Bureau Direct - 9/30/2014 5/31/2032 16,000 16,000 0.713% 0.713% 16,000
349 2032 Bureau Direct - 9/30/2014 5/31/2032 10,000 10,000 0.713% 0.713% 10,000
350 2032 Bureau Direct - 7/31/2017 7/31/2032 13,000 13,000 2.180% 2.180% 13,000
351 2032 Corps - 7/31/2017 7/31/2032 54,000 26,796 2.180% 2.180% 26,796
352 2032 Bureau Direct - 8/31/2017 8/31/2032 13,000 13,000 2.180% 2.180% 13,000
353 2032 Corps - 8/31/2017 8/31/2032 54,000 26,796 2.180% 2.180% 26,796
354 2032 Bureau Direct - 9/30/2017 9/30/2032 14,000 14,000 2.180% 2.180% 14,000
355 2032 Corps - 9/30/2017 9/30/2032 55,000 27,796 2.180% 2.180% 27,796
356 2032 Fish and Wildlife - 9/30/2017 9/30/2032 40,000 40,000 2.180% 2.180% 40,000
357 2032 Boise Bureau of Reclamation 9/30/2006 9/30/2056 15 15 4.500% 4.500% 15
358 2032 Bonneville Dam Corps of Engineers 9/30/2006 9/30/2056 2,628 2,628 4.500% 4.500% 2,628
359 2032 Columbia Basin Bureau of Reclamation 9/30/2006 9/30/2056 1,987 1,987 4.500% 4.500% 1,987
360 2032 Columbia River Fish Mitigation Corps of Engineers 9/30/2006 9/30/2056 366,395 175,340 4.500% 4.500% 175,340
BP-18-FS-BPA-02A Page 176
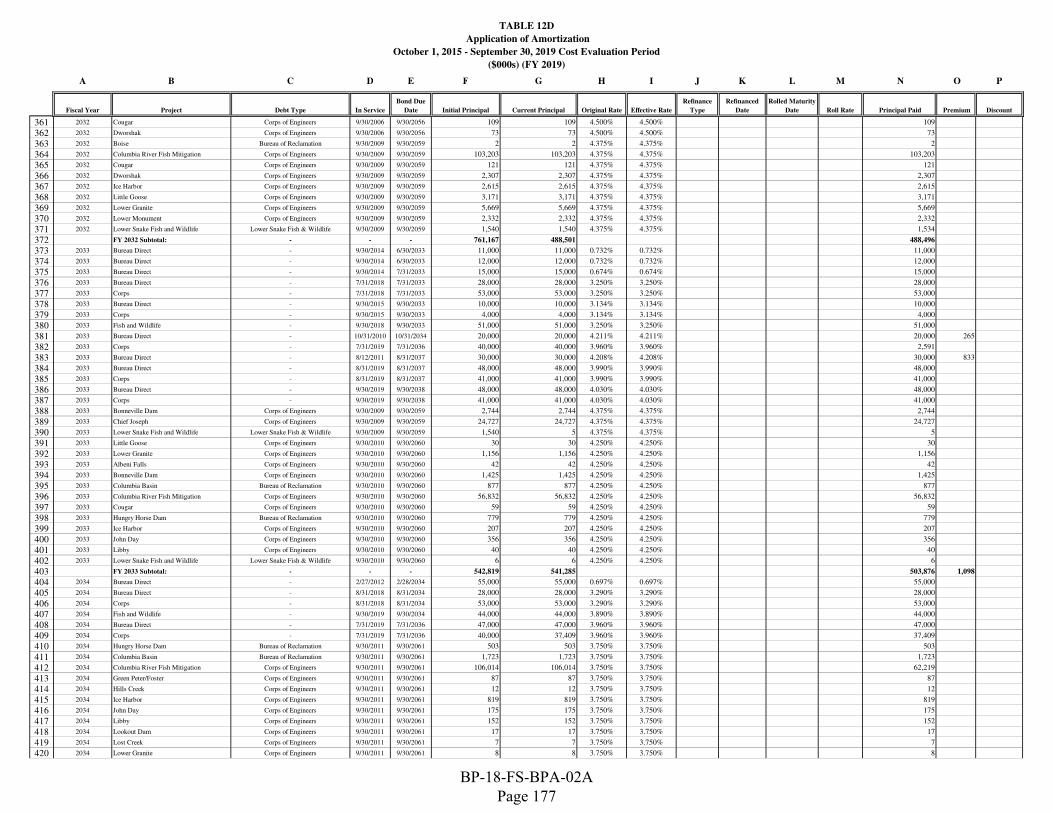
TABLE 12D
Application of Amortization
October 1, 2015 - September 30, 2019 Cost Evaluation Period
($000s) (FY 2019)
A B C D E F G H I J K L M N O P
Fiscal Year Project Debt Type In Service
Bond Due
Date Initial Principal Current Principal Original Rate Effective Rate
Refinance
Type
Refinanced
Date
Rolled Maturity
Date Roll Rate Principal Paid Premium Discount
361 2032 Cougar Corps of Engineers 9/30/2006 9/30/2056 109 109 4.500% 4.500% 109
362 2032 Dworshak Corps of Engineers 9/30/2006 9/30/2056 73 73 4.500% 4.500% 73
363 2032 Boise Bureau of Reclamation 9/30/2009 9/30/2059 2 2 4.375% 4.375% 2
364 2032 Columbia River Fish Mitigation Corps of Engineers 9/30/2009 9/30/2059 103,203 103,203 4.375% 4.375% 103,203
365 2032 Cougar Corps of Engineers 9/30/2009 9/30/2059 121 121 4.375% 4.375% 121
366 2032 Dworshak Corps of Engineers 9/30/2009 9/30/2059 2,307 2,307 4.375% 4.375% 2,307
367 2032 Ice Harbor Corps of Engineers 9/30/2009 9/30/2059 2,615 2,615 4.375% 4.375% 2,615
368 2032 Little Goose Corps of Engineers 9/30/2009 9/30/2059 3,171 3,171 4.375% 4.375% 3,171
369 2032 Lower Granite Corps of Engineers 9/30/2009 9/30/2059 5,669 5,669 4.375% 4.375% 5,669
370 2032 Lower Monument Corps of Engineers 9/30/2009 9/30/2059 2,332 2,332 4.375% 4.375% 2,332
371 2032 Lower Snake Fish and Wildlife Lower Snake Fish & Wildlife 9/30/2009 9/30/2059 1,540 1,540 4.375% 4.375% 1,534
372 FY 2032 Subtotal: - - - 761,167 488,501 488,496
373 2033 Bureau Direct - 9/30/2014 6/30/2033 11,000 11,000 0.732% 0.732% 11,000
374 2033 Bureau Direct - 9/30/2014 6/30/2033 12,000 12,000 0.732% 0.732% 12,000
375 2033 Bureau Direct - 9/30/2014 7/31/2033 15,000 15,000 0.674% 0.674% 15,000
376 2033 Bureau Direct - 7/31/2018 7/31/2033 28,000 28,000 3.250% 3.250% 28,000
377 2033 Corps - 7/31/2018 7/31/2033 53,000 53,000 3.250% 3.250% 53,000
378 2033 Bureau Direct - 9/30/2015 9/30/2033 10,000 10,000 3.134% 3.134% 10,000
379 2033 Corps - 9/30/2015 9/30/2033 4,000 4,000 3.134% 3.134% 4,000
380 2033 Fish and Wildlife - 9/30/2018 9/30/2033 51,000 51,000 3.250% 3.250% 51,000
381 2033 Bureau Direct - 10/31/2010 10/31/2034 20,000 20,000 4.211% 4.211% 20,000 265
382 2033 Corps - 7/31/2019 7/31/2036 40,000 40,000 3.960% 3.960% 2,591
383 2033 Bureau Direct - 8/12/2011 8/31/2037 30,000 30,000 4.208% 4.208% 30,000 833
384 2033 Bureau Direct - 8/31/2019 8/31/2037 48,000 48,000 3.990% 3.990% 48,000
385 2033 Corps - 8/31/2019 8/31/2037 41,000 41,000 3.990% 3.990% 41,000
386 2033 Bureau Direct - 9/30/2019 9/30/2038 48,000 48,000 4.030% 4.030% 48,000
387 2033 Corps - 9/30/2019 9/30/2038 41,000 41,000 4.030% 4.030% 41,000
388 2033 Bonneville Dam Corps of Engineers 9/30/2009 9/30/2059 2,744 2,744 4.375% 4.375% 2,744
389 2033 Chief Joseph Corps of Engineers 9/30/2009 9/30/2059 24,727 24,727 4.375% 4.375% 24,727
390 2033 Lower Snake Fish and Wildlife Lower Snake Fish & Wildlife 9/30/2009 9/30/2059 1,540 5 4.375% 4.375% 5
391 2033 Little Goose Corps of Engineers 9/30/2010 9/30/2060 30 30 4.250% 4.250% 30
392 2033 Lower Granite Corps of Engineers 9/30/2010 9/30/2060 1,156 1,156 4.250% 4.250% 1,156
393 2033 Albeni Falls Corps of Engineers 9/30/2010 9/30/2060 42 42 4.250% 4.250% 42
394 2033 Bonneville Dam Corps of Engineers 9/30/2010 9/30/2060 1,425 1,425 4.250% 4.250% 1,425
395 2033 Columbia Basin Bureau of Reclamation 9/30/2010 9/30/2060 877 877 4.250% 4.250% 877
396 2033 Columbia River Fish Mitigation Corps of Engineers 9/30/2010 9/30/2060 56,832 56,832 4.250% 4.250% 56,832
397 2033 Cougar Corps of Engineers 9/30/2010 9/30/2060 59 59 4.250% 4.250% 59
398 2033 Hungry Horse Dam Bureau of Reclamation 9/30/2010 9/30/2060 779 779 4.250% 4.250% 779
399 2033 Ice Harbor Corps of Engineers 9/30/2010 9/30/2060 207 207 4.250% 4.250% 207
400 2033 John Day Corps of Engineers 9/30/2010 9/30/2060 356 356 4.250% 4.250% 356
401 2033 Libby Corps of Engineers 9/30/2010 9/30/2060 40 40 4.250% 4.250% 40
402 2033 Lower Snake Fish and Wildlife Lower Snake Fish & Wildlife 9/30/2010 9/30/2060 6 6 4.250% 4.250% 6
403 FY 2033 Subtotal: - - - 542,819 541,285 503,876 1,098
404 2034 Bureau Direct - 2/27/2012 2/28/2034 55,000 55,000 0.697% 0.697% 55,000
405 2034 Bureau Direct - 8/31/2018 8/31/2034 28,000 28,000 3.290% 3.290% 28,000
406 2034 Corps - 8/31/2018 8/31/2034 53,000 53,000 3.290% 3.290% 53,000
407 2034 Fish and Wildlife - 9/30/2019 9/30/2034 44,000 44,000 3.890% 3.890% 44,000
408 2034 Bureau Direct - 7/31/2019 7/31/2036 47,000 47,000 3.960% 3.960% 47,000
409 2034 Corps - 7/31/2019 7/31/2036 40,000 37,409 3.960% 3.960% 37,409
410 2034 Hungry Horse Dam Bureau of Reclamation 9/30/2011 9/30/2061 503 503 3.750% 3.750% 503
411 2034 Columbia Basin Bureau of Reclamation 9/30/2011 9/30/2061 1,723 1,723 3.750% 3.750% 1,723
412 2034 Columbia River Fish Mitigation Corps of Engineers 9/30/2011 9/30/2061 106,014 106,014 3.750% 3.750% 62,219
413 2034 Green Peter/Foster Corps of Engineers 9/30/2011 9/30/2061 87 87 3.750% 3.750% 87
414 2034 Hills Creek Corps of Engineers 9/30/2011 9/30/2061 12 12 3.750% 3.750% 12
415 2034 Ice Harbor Corps of Engineers 9/30/2011 9/30/2061 819 819 3.750% 3.750% 819
416 2034 John Day Corps of Engineers 9/30/2011 9/30/2061 175 175 3.750% 3.750% 175
417 2034 Libby Corps of Engineers 9/30/2011 9/30/2061 152 152 3.750% 3.750% 152
418 2034 Lookout Dam Corps of Engineers 9/30/2011 9/30/2061 17 17 3.750% 3.750% 17
419 2034 Lost Creek Corps of Engineers 9/30/2011 9/30/2061 7 7 3.750% 3.750% 7
420 2034 Lower Granite Corps of Engineers 9/30/2011 9/30/2061 8 8 3.750% 3.750% 8
BP-18-FS-BPA-02A Page 177

TABLE 12D
Application of Amortization
October 1, 2015 - September 30, 2019 Cost Evaluation Period
($000s) (FY 2019)
A B C D E F G H I J K L M N O P
Fiscal Year Project Debt Type In Service
Bond Due
Date Initial Principal Current Principal Original Rate Effective Rate
Refinance
Type
Refinanced
Date
Rolled Maturity
Date Roll Rate Principal Paid Premium Discount
421 2034 McNary Corps of Engineers 9/30/2011 9/30/2061 565 565 3.750% 3.750% 565
422 2034 Columbia Basin Bureau of Reclamation 9/30/2014 9/30/2064 18 18 3.875% 3.875% 18
423 2034 Cougar Corps of Engineers 9/30/2014 9/30/2064 12 12 3.875% 3.875% 12
424 2034 Hungry Horse Dam Bureau of Reclamation 9/30/2014 9/30/2064 12 12 3.875% 3.875% 12
425 2034 Bonneville Dam Corps of Engineers 9/30/2014 9/30/2064 3.875% 3.875% 0
426 2034 Columbia River Fish Mitigation Corps of Engineers 9/30/2014 9/30/2064 110,071 110,071 3.875% 3.875% 110,071
427 2034 Detroit Lake/Big Cliff Corps of Engineers 9/30/2014 9/30/2064 18 18 3.875% 3.875% 18
428 2034 Green Peter/Foster Corps of Engineers 9/30/2014 9/30/2064 385 385 3.875% 3.875% 385
429 2034 Lower Granite Corps of Engineers 9/30/2014 9/30/2064 2,644 2,644 3.875% 3.875% 2,644
430 2034 Lower Monument Corps of Engineers 9/30/2014 9/30/2064 1,430 1,430 3.875% 3.875% 1,430
431 2034 Lower Snake Fish and Wildlife Lower Snake Fish & Wildlife 9/30/2014 9/30/2064 222 222 3.875% 3.875% 222
432 2034 McNary Corps of Engineers 9/30/2014 9/30/2064 759 759 3.875% 3.875% 759
433 2034 Columbia River Fish Mitigation Corps of Engineers 9/30/2019 9/30/2069 63,746 63,746 3.870% 3.870% 63,746
434 FY 2034 Subtotal: - - - 556,399 553,807 510,012
435 2035 Bureau Direct - 9/30/2018 9/30/2035 29,000 29,000 3.330% 3.330% 29,000
436 2035 Corps - 9/30/2018 9/30/2035 53,000 53,000 3.330% 3.330% 53,000
437 2035 Bonneville Dam Corps of Engineers 9/30/2011 9/30/2061 10,962 10,962 3.750% 3.750% 10,962
438 2035 Chief Joseph Corps of Engineers 9/30/2011 9/30/2061 4 4 3.750% 3.750% 4
439 2035 Columbia River Fish Mitigation Corps of Engineers 9/30/2011 9/30/2061 106,014 43,795 3.750% 3.750% 43,795
440 2035 Cougar Corps of Engineers 9/30/2011 9/30/2061 282 282 3.750% 3.750% 282
441 2035 Lower Snake Fish and Wildlife Lower Snake Fish & Wildlife 9/30/2011 9/30/2061 122 122 3.750% 3.750% 122
442 2035 Cougar Corps of Engineers 9/30/2012 9/30/2062 139 139 3.375% 3.375% 139
443 2035 Hungry Horse Dam Bureau of Reclamation 9/30/2012 9/30/2062 3 3 3.375% 3.375% 3
444 2035 Minidoka/Palisades Bureau of Reclamation 9/30/2012 9/30/2062 7 7 3.375% 3.375% 7
445 2035 Green Peter/Foster Corps of Engineers 9/30/2012 9/30/2062 28 28 3.375% 3.375% 28
446 2035 Chief Joseph Corps of Engineers 9/30/2012 9/30/2062 28 28 3.375% 3.375% 28
447 2035 Columbia Basin Bureau of Reclamation 9/30/2012 9/30/2062 11 11 3.375% 3.375% 11
448 2035 Columbia River Fish Mitigation Corps of Engineers 9/30/2012 9/30/2062 101,616 101,616 3.375% 3.375% 101,616
449 2035 Hills Creek Corps of Engineers 9/30/2012 9/30/2062 142 142 3.375% 3.375% 142
450 2035 Ice Harbor Corps of Engineers 9/30/2012 9/30/2062 115 115 3.375% 3.375% 115
451 2035 John Day Corps of Engineers 9/30/2012 9/30/2062 6,161 6,161 3.375% 3.375% 6,161
452 2035 Libby Corps of Engineers 9/30/2012 9/30/2062 16 16 3.375% 3.375% 16
453 2035 Lookout Dam Corps of Engineers 9/30/2012 9/30/2062 294 294 3.375% 3.375% 294
454 2035 Lower Monument Corps of Engineers 9/30/2012 9/30/2062 89 89 3.375% 3.375% 89
455 2035 McNary Corps of Engineers 9/30/2012 9/30/2062 12 11 3.375% 3.375% 11
456 2035 RRP - Green Springs Bureau of Reclamation 9/30/2012 9/30/2062 2 2 3.375% 3.375% 2
457 2035 Columbia Basin Bureau of Reclamation 9/30/2013 9/30/2063 3,083 3,083 2.875% 2.875% 911
458 2035 RRP - Green Springs Bureau of Reclamation 9/30/2013 9/30/2063 1 1 2.875% 2.875% 1
459 2035 Bonneville Dam Corps of Engineers 9/30/2015 9/30/2065 102 102 3.250% 3.250% 102
460 2035 Columbia River Fish Mitigation Corps of Engineers 9/30/2015 9/30/2065 64,291 64,291 3.250% 3.250% 64,291
461 2035 Green Peter/Foster Corps of Engineers 9/30/2015 9/30/2065 68 68 3.250% 3.250% 68
462 2035 Hungry Horse Dam Bureau of Reclamation 9/30/2015 9/30/2065 3.250% 3.250% 0
463 2035 Ice Harbor Corps of Engineers 9/30/2015 9/30/2065 3,175 3,175 3.250% 3.250% 3,175
464 2035 John Day Corps of Engineers 9/30/2015 9/30/2065 163 163 3.250% 3.250% 163
465 2035 Lower Granite Corps of Engineers 9/30/2015 9/30/2065 1,597 1,597 3.250% 3.250% 1,597
466 2035 Minidoka/Palisades Bureau of Reclamation 9/30/2015 9/30/2065 19,237 19,237 3.250% 3.250% 19,237
467 2035 The Dalles Corps of Engineers 9/30/2015 9/30/2065 302 302 3.250% 3.250% 302
468 2035 Columbia River Fish Mitigation Corps of Engineers 9/30/2016 9/30/2066 30,190 30,190 3.000% 3.000% 30,190
469 2035 Cougar Corps of Engineers 9/30/2016 9/30/2066 2 2 3.000% 3.000% 2
470 2035 Detroit Lake/Big Cliff Corps of Engineers 9/30/2016 9/30/2066 31 31 3.000% 3.000% 31
471 2035 Green Peter/Foster Corps of Engineers 9/30/2016 9/30/2066 70 70 3.000% 3.000% 70
472 2035 Ice Harbor Corps of Engineers 9/30/2016 9/30/2066 558 558 3.000% 3.000% 558
473 2035 Lower Granite Corps of Engineers 9/30/2016 9/30/2066 1,878 1,878 3.000% 3.000% 1,878
474 2035 Lower Monument Corps of Engineers 9/30/2016 9/30/2066 155 155 3.000% 3.000% 155
475 2035 Lower Snake Fish and Wildlife Lower Snake Fish & Wildlife 9/30/2016 9/30/2066 1,256 1,256 3.000% 3.000% 1,256
476 2035 Minidoka/Palisades Bureau of Reclamation 9/30/2016 9/30/2066 206 206 3.000% 3.000% 206
477 2035 The Dalles Corps of Engineers 9/30/2016 9/30/2066 4 4 3.000% 3.000% 4
478 2035 Columbia River Fish Mitigation Corps of Engineers 9/30/2018 9/30/2068 147,186 147,186 3.320% 3.320% 147,186
479 FY 2035 Subtotal: - - - 581,598 519,379 517,208
BP-18-FS-BPA-02A Page 178

TABLE 12D
Application of Amortization
October 1, 2015 - September 30, 2019 Cost Evaluation Period
($000s) (FY 2019)
A B C D E F G H I J K L M N O P
Fiscal Year Project Debt Type In Service
Bond Due
Date Initial Principal Current Principal Original Rate Effective Rate
Refinance
Type
Refinanced
Date
Rolled Maturity
Date Roll Rate Principal Paid Premium Discount
480 2036 Bureau Direct - 6/30/2013 1/31/2039 35,000 35,000 0.674% 0.674% 32,479 2,521
481 2036 Corps - 2/29/2016 2/28/2045 3,000 3,000 0.697% 0.697% 2,396 604
482 2036 Bonneville Dam Corps of Engineers 9/30/2013 9/30/2063 268 268 2.875% 2.875% 268
483 2036 Chief Joseph Corps of Engineers 9/30/2013 9/30/2063 10 10 2.875% 2.875% 10
484 2036 Columbia Basin Bureau of Reclamation 9/30/2013 9/30/2063 3,083 2,171 2.875% 2.875% 2,171
485 2036 Columbia River Fish Mitigation Corps of Engineers 9/30/2013 9/30/2063 95,274 95,274 2.875% 2.875% 95,274
486 2036 Cougar Corps of Engineers 9/30/2013 9/30/2063 4,088 4,088 2.875% 2.875% 4,088
487 2036 Detroit Lake/Big Cliff Corps of Engineers 9/30/2013 9/30/2063 528 528 2.875% 2.875% 528
488 2036 John Day Corps of Engineers 9/30/2013 9/30/2063 17 17 2.875% 2.875% 17
489 2036 Little Goose Corps of Engineers 9/30/2013 9/30/2063 66 66 2.875% 2.875% 66
490 2036 McNary Corps of Engineers 9/30/2013 9/30/2063 1,000 1,000 2.875% 2.875% 1,000
491 2036 Replacements - 3/31/2020 3/31/2065 218,435 218,435 4.430% 4.430% 218,435
492 2036 Replacements - 3/31/2021 3/31/2066 218,435 218,435 4.430% 4.430% 120,316
493 2036 Columbia River Fish Mitigation Corps of Engineers 9/30/2017 9/30/2067 63,629 63,629 2.380% 2.380% 63,629
494 FY 2036 Subtotal: - - - 642,834 641,923 540,678 3,125
495 2037 Replacements - 3/31/2021 3/31/2066 218,435 98,120 4.430% 4.430% 98,120
496 2037 Replacements - 3/31/2022 3/31/2067 218,435 218,435 4.430% 4.430% 218,435
497 2037 Replacements - 3/31/2023 3/31/2068 218,435 218,435 4.430% 4.430% 218,435
498 2037 Replacements - 3/31/2024 3/31/2069 218,435 218,435 4.430% 4.430% 34,501
499 FY 2037 Subtotal: - - - 873,742 753,426 569,491
500 2038 Replacements - 3/31/2024 3/31/2069 218,435 183,935 4.430% 4.430% 183,935
501 2038 Replacements - 3/31/2025 3/31/2070 218,435 218,435 4.430% 4.430% 218,435
502 2038 Replacements - 3/31/2026 3/31/2071 218,435 218,435 4.430% 4.430% 209,470
503 FY 2038 Subtotal: - - - 655,306 620,806 611,840
504 2039 Replacements - 3/31/2026 3/31/2071 218,435 8,966 4.430% 4.430% 8,966
505 2039 Replacements - 3/31/2027 3/31/2072 218,435 218,435 4.430% 4.430% 218,435
506 2039 Replacements - 3/31/2028 3/31/2073 218,435 218,435 4.430% 4.430% 218,435
507 2039 Replacements - 3/31/2029 3/31/2074 218,435 218,435 4.430% 4.430% 202,426
508 FY 2039 Subtotal: - - - 873,742 664,272 648,262
509 2040 Replacements - 3/31/2029 3/31/2074 218,435 16,010 4.430% 4.430% 16,010
510 2040 Replacements - 3/31/2030 3/31/2075 218,435 218,435 4.430% 4.430% 218,435
511 2040 Replacements - 3/31/2031 3/31/2076 218,435 218,435 4.430% 4.430% 218,435
512 2040 Replacements - 3/31/2032 3/31/2077 218,435 218,435 4.430% 4.430% 218,435
513 2040 Replacements - 3/31/2033 3/31/2078 218,435 218,435 4.430% 4.430% 13,323
514 FY 2040 Subtotal: - - - 1,092,177 889,751 684,639
515 2041 Replacements - 3/31/2033 3/31/2078 218,435 205,112 4.430% 4.430% 205,112
516 2041 Replacements - 3/31/2034 3/31/2079 218,435 218,435 4.430% 4.430% 218,435
517 2041 Replacements - 3/31/2035 3/31/2080 218,435 218,435 4.430% 4.430% 218,435
518 2041 Replacements - 3/31/2036 3/31/2081 218,435 218,435 4.430% 4.430% 70,925
519 FY 2041 Subtotal: - - - 873,742 860,418 712,908
520 2042 Replacements - 3/31/2036 3/31/2081 218,435 147,510 4.430% 4.430% 147,510
521 2042 Replacements - 3/31/2037 3/31/2082 218,435 218,435 4.430% 4.430% 218,435
522 2042 Replacements - 3/31/2038 3/31/2083 218,435 218,435 4.430% 4.430% 218,435
523 2042 Replacements - 3/31/2039 3/31/2084 218,435 218,435 4.430% 4.430% 75,640
524 FY 2042 Subtotal: - - - 873,742 802,816 660,020
525 2043 Replacements - 3/31/2039 3/31/2084 218,435 142,796 4.430% 4.430% 142,796
526 2043 Replacements - 3/31/2040 3/31/2085 218,435 218,435 4.430% 4.430% 218,435
527 2043 Replacements - 3/31/2041 3/31/2086 218,435 218,435 4.430% 4.430% 218,435
528 2043 Replacements - 3/31/2042 3/31/2087 218,435 218,435 4.430% 4.430% 175,722
529 FY 2043 Subtotal: - - - 873,742 798,102 755,389
530 2044 Replacements - 3/31/2042 3/31/2087 218,435 42,713 4.430% 4.430% 42,713
531 2044 Replacements - 3/31/2043 3/31/2088 218,435 218,435 4.430% 4.430% 218,435
532 FY 2044 Subtotal: - - - 436,871 261,149 261,149
533 2045 Replacements - 3/31/2044 3/31/2089 218,435 218,435 4.430% 4.430% 218,435
534 FY 2045 Subtotal: - - - 218,435 218,435 218,435
535 2046 Replacements - 3/31/2045 3/31/2090 218,435 218,435 4.430% 4.430% 218,435
536 FY 2046 Subtotal: - - - 218,435 218,435 218,435
537 2047 Replacements - 3/31/2046 3/31/2091 218,435 218,435 4.430% 4.430% 218,435
538 FY 2047 Subtotal: - - - 218,435 218,435 218,435
539 2048 Replacements - 3/31/2047 3/31/2092 218,435 218,435 4.430% 4.430% 218,435
540 FY 2048 Subtotal: - - - 218,435 218,435 218,435
BP-18-FS-BPA-02A Page 179

TABLE 12D
Application of Amortization
October 1, 2015 - September 30, 2019 Cost Evaluation Period
($000s) (FY 2019)
A B C D E F G H I J K L M N O P
Fiscal Year Project Debt Type In Service
Bond Due
Date Initial Principal Current Principal Original Rate Effective Rate
Refinance
Type
Refinanced
Date
Rolled Maturity
Date Roll Rate Principal Paid Premium Discount
541 2049 Replacements - 3/31/2048 3/31/2093 218,435 218,435 4.430% 4.430% 218,435
542 FY 2049 Subtotal: - - - 218,435 218,435 218,435
543 2050 Replacements - 3/31/2049 3/31/2094 218,435 218,435 4.430% 4.430% 218,435
544 FY 2050 Subtotal: - - - 218,435 218,435 218,435
545 2051 Replacements - 3/31/2050 3/31/2095 218,435 218,435 4.430% 4.430% 218,435
546 FY 2051 Subtotal: - - - 218,435 218,435 218,435
547 2052 Replacements - 3/31/2051 3/31/2096 218,435 218,435 4.430% 4.430% 218,435
548 FY 2052 Subtotal: - - - 218,435 218,435 218,435
549 2053 Replacements - 3/31/2052 3/31/2097 218,435 218,435 4.430% 4.430% 218,435
550 FY 2053 Subtotal: - - - 218,435 218,435 218,435
551 2054 Replacements - 3/31/2053 3/31/2098 218,435 218,435 4.430% 4.430% 218,435
552 FY 2054 Subtotal: - - - 218,435 218,435 218,435
553 2055 Replacements - 3/31/2054 3/31/2099 218,435 218,435 4.430% 4.430% 218,435
554 FY 2055 Subtotal: - - - 218,435 218,435 218,435
555 2056 Replacements - 3/31/2055 3/31/2100 218,435 218,435 4.430% 4.430% 218,435
556 FY 2056 Subtotal: - - - 218,435 218,435 218,435
557 2057 Replacements - 3/31/2056 3/31/2101 218,435 218,435 4.430% 4.430% 218,435
558 FY 2057 Subtotal: - - - 218,435 218,435 218,435
559 2058 Boise Bureau of Reclamation 9/30/2008 9/30/2058 64 64 4.875% 4.875% 64
560 2058 Bonneville Dam Corps of Engineers 9/30/2008 9/30/2058 14,609 14,609 4.875% 4.875% 14,609
561 2058 Columbia River Fish Mitigation Corps of Engineers 9/30/2008 9/30/2058 36,554 36,554 4.875% 4.875% 36,554
562 2058 Dworshak Corps of Engineers 9/30/2008 9/30/2058 10 10 4.875% 4.875% 10
563 2058 Hungry Horse Dam Bureau of Reclamation 9/30/2008 9/30/2058 76 76 4.875% 4.875% 76
564 2058 Ice Harbor Corps of Engineers 9/30/2008 9/30/2058 14 14 4.875% 4.875% 14
565 2058 Libby Corps of Engineers 9/30/2008 9/30/2058 1,567 1,567 4.875% 4.875% 1,567
566 2058 Little Goose Corps of Engineers 9/30/2008 9/30/2058 13 13 4.875% 4.875% 13
567 2058 Lower Granite Corps of Engineers 9/30/2008 9/30/2058 24 24 4.875% 4.875% 24
568 2058 Lower Monument Corps of Engineers 9/30/2008 9/30/2058 9 9 4.875% 4.875% 9
569 2058 Lower Snake Fish and Wildlife Lower Snake Fish & Wildlife 9/30/2008 9/30/2058 74 74 4.875% 4.875% 74
570 2058 McNary Corps of Engineers 9/30/2008 9/30/2058 215 215 4.875% 4.875% 215
571 2058 The Dalles Corps of Engineers 9/30/2008 9/30/2058 1,651 1,651 4.875% 4.875% 1,651
572 2058 Chief Joseph Corps of Engineers 9/30/2008 9/30/2058 3,500 3,500 4.875% 4.875% 3,500
573 2058 Columbia Basin Bureau of Reclamation 9/30/2008 9/30/2058 835 835 4.875% 4.875% 835
574 2058 Replacements - 3/31/2057 3/31/2102 218,435 218,435 4.430% 4.430% 218,435
575 FY 2058 Subtotal: - - - 277,651 277,651 277,651
576 2059 Albeni Falls Corps of Engineers 9/30/2009 9/30/2059 57 57 4.375% 4.375% 57
577 2059 Columbia Basin Bureau of Reclamation 9/30/2009 9/30/2059 1,338 1,338 4.375% 4.375% 1,338
578 2059 Hungry Horse Dam Bureau of Reclamation 9/30/2009 9/30/2059 60 60 4.375% 4.375% 60
579 2059 John Day Corps of Engineers 9/30/2009 9/30/2059 1,548 1,548 4.375% 4.375% 1,548
580 2059 Yakima Chandler/Kenniwick Bureau of Reclamation 9/30/2009 9/30/2059 15 15 4.375% 4.375% 15
581 2059 Replacements - 3/31/2058 3/31/2103 218,435 218,435 4.430% 4.430% 218,435
582 FY 2059 Subtotal: - - - 221,454 221,454 221,454
583 2060 Replacements - 3/31/2059 3/31/2104 218,435 218,435 4.430% 4.430% 218,435
584 FY 2060 Subtotal: - - - 218,435 218,435 218,435
585 2061 Replacements - 3/31/2060 3/31/2105 218,435 218,435 4.430% 4.430% 218,435
586 FY 2061 Subtotal: - - - 218,435 218,435 218,435
587 2062 Replacements - 3/31/2061 3/31/2106 218,435 218,435 4.430% 4.430% 218,435
588 FY 2062 Subtotal: - - - 218,435 218,435 218,435
589 2063 Replacements - 3/31/2062 3/31/2107 218,435 218,435 4.430% 4.430% 218,435
590 FY 2063 Subtotal: - - - 218,435 218,435 218,435
591 2064 Replacements - 3/31/2063 3/31/2108 218,435 218,435 4.430% 4.430% 218,435
592 FY 2064 Subtotal: - - - 218,435 218,435 218,435
593 2065 Replacements - 3/31/2064 3/31/2109 218,435 218,435 4.430% 4.430% 218,435
594 FY 2065 Subtotal: - - - 218,435 218,435 218,435
595 2066 Replacements - 3/31/2065 3/31/2110 218,435 218,435 4.430% 4.430% 218,435
596 FY 2066 Subtotal: - - - 218,435 218,435 218,435
597 2067 Replacements - 3/31/2066 3/31/2111 218,435 218,435 4.430% 4.430% 218,435
598 FY 2067 Subtotal: - - - 218,435 218,435 218,435
599 2068 Replacements - 3/31/2067 3/31/2112 218,435 218,435 4.430% 4.430% 218,435
600 FY 2068 Subtotal: - - - 218,435 218,435 218,435
601 2069 Replacements - 3/31/2068 3/31/2113 218,435 218,435 4.430% 4.430% 218,435
602 FY 2069 Subtotal: - - - 218,435 218,435 218,435 BP-18-FS-BPA-02A Page 180

TABLE 12D
Application of Amortization
October 1, 2015 - September 30, 2019 Cost Evaluation Period
($000s) (FY 2019)
A B C D E F G H I J K L M N O P
Fiscal Year Project Debt Type In Service
Bond Due
Date Initial Principal Current Principal Original Rate Effective Rate
Refinance
Type
Refinanced
Date
Rolled Maturity
Date Roll Rate Principal Paid Premium Discount
603 Grand Total 19,044,233 17,485,744 16,023,912 12,887 3,125
BP-18-FS-BPA-02A Page 181
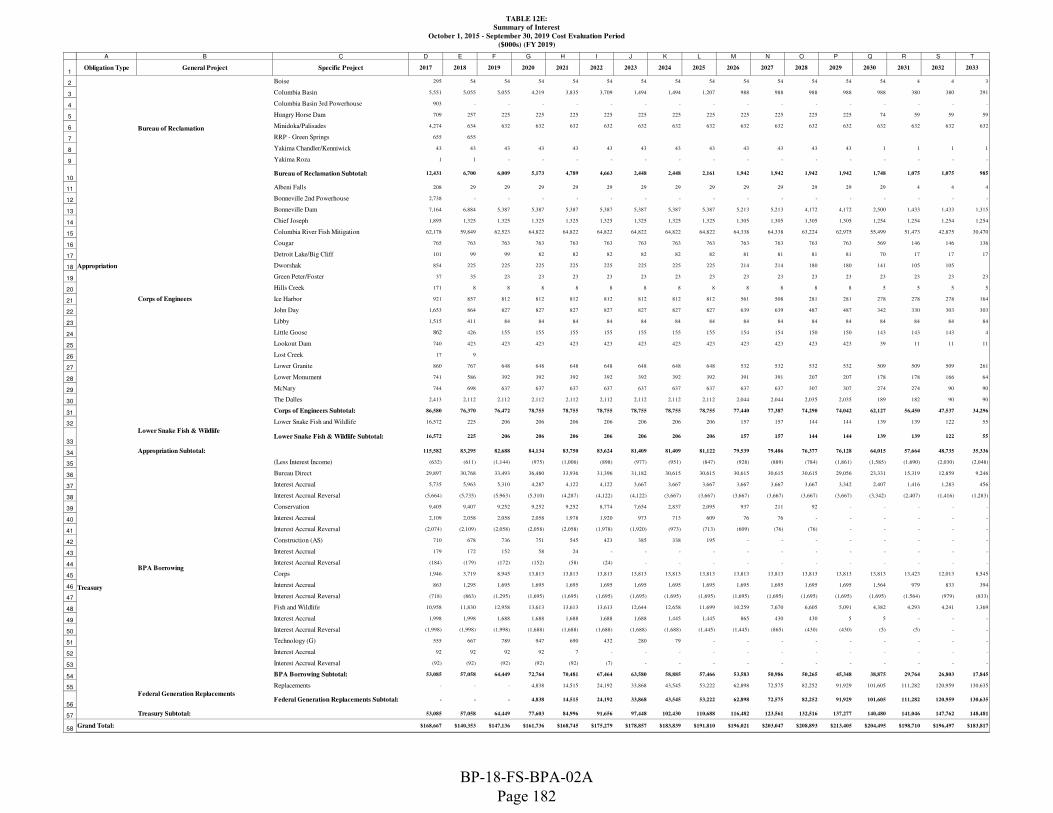
TABLE 12E:
Summary of Interest
October 1, 2015 - September 30, 2019 Cost Evaluation Period
($000s) (FY 2019)
1
2
3
4
5
6
7
8
9
10
11
12
13
14
15
16
17
18
19
20
21
22
23
24
25
26
27
28
29
30
31
32
33
34
35
36
37
38
39
40
41
42
43
44
45
46
47
48
49
50
51
52
53
54
55
56
57
58
A B C D E F G H I J K L M N O P Q R S T
Obligation Type General Project Specific Project 2017 2018 2019 2020 2021 2022 2023 2024 2025 2026 2027 2028 2029 2030 2031 2032 2033
Boise 295 54 54 54 54 54 54 54 54 54 54 54 54 54 4 4 3
Columbia Basin 5,551 5,055 5,055 4,219 3,835 3,709 1,494 1,494 1,207 988 988 988 988 988 380 380 291
Columbia Basin 3rd Powerhouse 903 - - - - - - - - - - - - - - - -
Hungry Horse Dam 709 257 225 225 225 225 225 225 225 225 225 225 225 74 59 59 59
Minidoka/Palisades 4,274 634 632 632 632 632 632 632 632 632 632 632 632 632 632 632 632
RRP - Green Springs 655 655
Yakima Chandler/Kenniwick 43 43 43 43 43 43 43 43 43 43 43 43 43 1 1 1 1
Yakima Roza 1 1 - - - - - - - - - - - - - - -
Bureau of Reclamation Subtotal: 12,431 6,700 6,009 5,173 4,789 4,663 2,448 2,448 2,161 1,942 1,942 1,942 1,942 1,748 1,075 1,075 985
Albeni Falls 208 29 29 29 29 29 29 29 29 29 29 29 29 29 4 4 4
Bonneville 2nd Powerhouse 2,738 - - - - - - - - - - - - - - - -
Bonneville Dam 7,164 6,884 5,387 5,387 5,387 5,387 5,387 5,387 5,387 5,213 5,213 4,172 4,172 2,500 1,433 1,433 1,315
Chief Joseph 1,895 1,325 1,325 1,325 1,325 1,325 1,325 1,325 1,325 1,305 1,305 1,305 1,305 1,254 1,254 1,254 1,254
Columbia River Fish Mitigation 62,178 59,849 62,523 64,822 64,822 64,822 64,822 64,822 64,822 64,338 64,338 63,224 62,975 55,499 51,473 42,875 30,470
Cougar 765 763 763 763 763 763 763 763 763 763 763 763 763 569 146 146 136
Detroit Lake/Big Cliff 101 99 99 82 82 82 82 82 82 81 81 81 81 70 17 17 17
Dworshak 854 225 225 225 225 225 225 225 225 214 214 180 180 141 105 105
Green Peter/Foster 37 35 23 23 23 23 23 23 23 23 23 23 23 23 23 23 23
Hills Creek 171 8 8 8 8 8 8 8 8 8 8 8 8 5 5 5 5
Ice Harbor 921 857 812 812 812 812 812 812 812 561 508 281 281 278 278 278 164
John Day 1,653 864 827 827 827 827 827 827 827 639 639 487 487 342 330 303 303
Libby 1,515 411 84 84 84 84 84 84 84 84 84 84 84 84 84 84 84
Little Goose 862 426 155 155 155 155 155 155 155 154 154 150 150 143 143 143 4
Lookout Dam 740 423 423 423 423 423 423 423 423 423 423 423 423 39 11 11 11
Lost Creek 17 9
Lower Granite 860 767 648 648 648 648 648 648 648 532 532 532 532 509 509 509 261
Lower Monument 741 586 392 392 392 392 392 392 392 391 391 207 207 178 178 166 64
McNary 744 698 637 637 637 637 637 637 637 637 637 307 307 274 274 90 90
The Dalles 2,413 2,112 2,112 2,112 2,112 2,112 2,112 2,112 2,112 2,044 2,044 2,035 2,035 189 182 90 90
Corps of Engineers Subtotal: 86,580 76,370 76,472 78,755 78,755 78,755 78,755 78,755 78,755 77,440 77,387 74,290 74,042 62,127 56,450 47,537 34,296
Lower Snake Fish and Wildlife 16,572 225 206 206 206 206 206 206 206 157 157 144 144 139 139 122 55
Lower Snake Fish & Wildlife Subtotal: 16,572 225 206 206 206 206 206 206 206 157 157 144 144 139 139 122 55
115,582 83,295 82,688 84,134 83,750 83,624 81,409 81,409 81,122 79,539 79,486 76,377 76,128 64,015 57,664 48,735 35,336
(Less Interest Income) (632) (611) (1,144) (975) (1,006) (898) (977) (951) (847) (928) (889) (784) (1,861) (1,585) (1,690) (2,030) (2,048)
Bureau Direct 29,897 30,768 33,493 36,480 33,936 31,396 31,182 30,615 30,615 30,615 30,615 30,615 29,056 23,331 15,319 12,859 9,246
Interest Accrual 5,735 5,963 5,310 4,287 4,122 4,122 3,667 3,667 3,667 3,667 3,667 3,667 3,342 2,407 1,416 1,283 456
Interest Accrual Reversal (5,664) (5,735) (5,963) (5,310) (4,287) (4,122) (4,122) (3,667) (3,667) (3,667) (3,667) (3,667) (3,667) (3,342) (2,407) (1,416) (1,283)
Conservation 9,405 9,407 9,252 9,252 9,252 8,774 7,654 2,837 2,095 937 211 92 - - - - -
Interest Accrual 2,109 2,058 2,058 2,058 1,978 1,920 973 713 609 76 76 - - - - - -
Interest Accrual Reversal (2,074) (2,109) (2,058) (2,058) (2,058) (1,978) (1,920) (973) (713) (609) (76) (76) - - - - -
Construction (AS) 710 678 736 751 545 423 385 338 195 - - - - - - - -
Interest Accrual 179 172 152 58 24 - - - - - - - - - - - -
Interest Accrual Reversal (184) (179) (172) (152) (58) (24) - - - - - - - - - - -
Corps 1,946 3,719 8,945 13,813 13,813 13,813 13,813 13,813 13,813 13,813 13,813 13,813 13,813 13,813 13,423 12,013 8,545
Interest Accrual 863 1,295 1,695 1,695 1,695 1,695 1,695 1,695 1,695 1,695 1,695 1,695 1,695 1,564 979 833 394
Interest Accrual Reversal (718) (863) (1,295) (1,695) (1,695) (1,695) (1,695) (1,695) (1,695) (1,695) (1,695) (1,695) (1,695) (1,695) (1,564) (979) (833)
Fish and Wildlife 10,958 11,830 12,958 13,613 13,613 13,613 12,644 12,658 11,699 10,259 7,670 6,605 5,091 4,382 4,293 4,241 3,369
Interest Accrual 1,998 1,998 1,688 1,688 1,688 1,688 1,688 1,445 1,445 865 430 430 5 5 - - -
Interest Accrual Reversal (1,998) (1,998) (1,998) (1,688) (1,688) (1,688) (1,688) (1,688) (1,445) (1,445) (865) (430) (430) (5) (5) - -
Technology (G) 555 667 789 947 690 432 280 79 - - - - - - - - -
Interest Accrual 92 92 92 92 7 - - - - - - - - - - - -
Interest Accrual Reversal (92) (92) (92) (92) (92) (7) - - - - - - - - - - -
BPA Borrowing Subtotal: 53,085 57,058 64,449 72,764 70,481 67,464 63,580 58,885 57,466 53,583 50,986 50,265 45,348 38,875 29,764 26,803 17,845
Replacements - - - 4,838 14,515 24,192 33,868 43,545 53,222 62,898 72,575 82,252 91,929 101,605 111,282 120,959 130,635
Federal Generation Replacements Subtotal: - - - 4,838 14,515 24,192 33,868 43,545 53,222 62,898 72,575 82,252 91,929 101,605 111,282 120,959 130,635
53,085 57,058 64,449 77,603 84,996 91,656 97,448 102,430 110,688 116,482 123,561 132,516 137,277 140,480 141,046 147,762 148,481
$168,667 $140,353 $147,136 $161,736 $168,745 $175,279 $178,857 $183,839 $191,810 $196,021 $203,047 $208,893 $213,405 $204,495 $198,710 $196,497 $183,817
Treasury
BPA Borrowing
Federal Generation Replacements
Treasury Subtotal:
Grand Total:
Appropriation
Bureau of Reclamation
Corps of Engineers
Lower Snake Fish & Wildlife
Appropriation Subtotal:
BP-18-FS-BPA-02A Page 182

TABLE 12E:
Summary of Interest
October 1, 2015 - September 30, 2019 Cost Evaluation Period
($000s) (FY 2019)
1
2
3
4
5
6
7
8
9
10
11
12
13
14
15
16
17
18
19
20
21
22
23
24
25
26
27
28
29
30
31
32
33
34
35
36
37
38
39
40
41
42
43
44
45
46
47
48
49
50
51
52
53
54
55
56
57
58
A B C
Obligation Type General Project Specific Project
Boise
Columbia Basin
Columbia Basin 3rd Powerhouse
Hungry Horse Dam
Minidoka/Palisades
RRP - Green Springs
Yakima Chandler/Kenniwick
Yakima Roza
Bureau of Reclamation Subtotal:
Albeni Falls
Bonneville 2nd Powerhouse
Bonneville Dam
Chief Joseph
Columbia River Fish Mitigation
Cougar
Detroit Lake/Big Cliff
Dworshak
Green Peter/Foster
Hills Creek
Ice Harbor
John Day
Libby
Little Goose
Lookout Dam
Lost Creek
Lower Granite
Lower Monument
McNary
The Dalles
Corps of Engineers Subtotal:
Lower Snake Fish and Wildlife
Lower Snake Fish & Wildlife Subtotal:
(Less Interest Income)
Bureau Direct
Interest Accrual
Interest Accrual Reversal
Conservation
Interest Accrual
Interest Accrual Reversal
Construction (AS)
Interest Accrual
Interest Accrual Reversal
Corps
Interest Accrual
Interest Accrual Reversal
Fish and Wildlife
Interest Accrual
Interest Accrual Reversal
Technology (G)
Interest Accrual
Interest Accrual Reversal
BPA Borrowing Subtotal:
Replacements
Federal Generation Replacements Subtotal:
Treasury
BPA Borrowing
Federal Generation Replacements
Treasury Subtotal:
Grand Total:
Appropriation
Bureau of Reclamation
Corps of Engineers
Lower Snake Fish & Wildlife
Appropriation Subtotal:
U V W X Y Z AA AB AC AD AE AF AG AH AI AJ AK AL AM
2034 2035 2036 2037 2038 2039 2040 2041 2042 2043 2044 2045 2046 2047 2048 2049 2050 2051 2052
3 3 3 3 3 3 3 3 3 3 3 3 3 3 3 3 3 3 3
254 188 162 99 99 99 99 99 99 99 99 99 99 99 99 99 99 99 99
- - - - - - - - - - - - - - - - - - -
26 6 6 6 6 6 6 6 6 6 6 6 6 6 6 6 6 6 6
632 632 - - - - - - - - - - - - - - - - -
- - - - - - - - - - - - - - - - -
1 1 1 1 1 1 1 1 1 1 1 1 1 1 1 1 1 1 1
- - - - - - - - - - - - - - - - - - -
915 830 172 109 109 109 109 109 109 109 109 109 109 109 109 109 109 109 109
2 2 2 2 2 2 2 2 2 2 2 2 2 2 2 2 2 2 2
- - - - - - - - - - - - - - - - - - -
1,134 1,134 720 712 712 712 712 712 712 712 712 712 712 712 712 712 712 712 712
172 172 171 171 171 171 171 171 171 171 171 171 171 171 171 171 171 171 171
28,055 18,989 6,036 1,782 1,782 1,782 1,782 1,782 1,782 1,782 1,782 1,782 1,782 1,782 1,782 1,782 1,782 1,782 1,782
133 133 118 - - - - - - - - - - - - - - - -
17 16 15 - - - - - - - - - - - - - - - -
23 5 - - - - - - - - - - - - - - - - -
5 5 - - - - - - - - - - - - - - - - -
155 124 1 1 1 1 1 1 1 1 1 1 1 1 1 1 1 1 1
288 281 68 68 68 68 68 68 68 68 68 68 68 68 68 68 68 68 68
83 77 76 76 76 76 76 76 76 76 76 76 76 76 76 76 76 76 76
3 3 3 1 1 1 1 1 1 1 1 1 1 1 1 1 1 1 1
11 10 - - - - - - - - - - - - - - - - -
- - - - - - - - - - - - - - - - - -
212 109 1 1 1 1 1 1 1 1 1 1 1 1 1 1 1 1 1
64 8
90 40 39 10 10 10 10 10 10 10 10 10 10 10 10 10 10 10 10
90 90 80 80 80 80 80 80 80 80 80 80 80 80 80 80 80 80 80
30,538 21,200 7,331 2,906 2,906 2,906 2,906 2,906 2,906 2,906 2,906 2,906 2,906 2,906 2,906 2,906 2,906 2,906 2,906
54 46 4 4 4 4 4 4 4 4 4 4 4 4 4 4 4 4 4
54 46 4 4 4 4 4 4 4 4 4 4 4 4 4 4 4 4 4
31,507 22,076 7,507 3,019 3,019 3,019 3,019 3,019 3,019 3,019 3,019 3,019 3,019 3,019 3,019 3,019 3,019 3,019 3,019
(2,038) (2,068) (2,154) (2,165) (2,224) (2,360) (2,399) (2,456) (2,492) (2,525) (2,172) (1,008) (1,008) (1,008) (1,008) (1,008) (1,008) (1,008) (1,008)
3,241 1,202 118 - - - - - - - - - - - - - - - -
39 39 - - - - - - - - - - - - - - - - -
(456) (39) (39) - - - - - - - - - - - - - - - -
- - - - - - - - - - - - - - - - - - -
- - - - - - - - - - - - - - - - - - -
- - - - - - - - - - - - - - - - - - -
- - - - - - - - - - - - - - - - - - -
- - - - - - - - - - - - - - - - - - -
- - - - - - - - - - - - - - - - - - -
4,265 1,786 10 - - - - - - - - - - - - - - - -
2 2 - - - - - - - - - - - - - - - - -
(394) (2) (2) - - - - - - - - - - - - - - - -
1,712 - - - - - - - - - - - - - - - - - -
- - - - - - - - - - - - - - - - - - -
- - - - - - - - - - - - - - - - - - -
- - - - - - - - - - - - - - - - - - -
- - - - - - - - - - - - - - - - - - -
- - - - - - - - - - - - - - - - - - -
6,372 919 (2,066) (2,165) (2,224) (2,360) (2,399) (2,456) (2,492) (2,525) (2,172) (1,008) (1,008) (1,008) (1,008) (1,008) (1,008) (1,008) (1,008)
140,312 149,989 152,162 141,721 125,231 106,997 87,150 65,871 45,137 23,462 10,623 9,677 9,677 9,677 9,677 9,677 9,677 9,677 9,677
140,312 149,989 152,162 141,721 125,231 106,997 87,150 65,871 45,137 23,462 10,623 9,677 9,677 9,677 9,677 9,677 9,677 9,677 9,677
146,684 150,908 150,096 139,556 123,007 104,637 84,751 63,415 42,645 20,937 8,451 8,668 8,668 8,668 8,668 8,668 8,668 8,668 8,668
$178,191 $172,984 $157,603 $142,575 $126,026 $107,656 $87,770 $66,433 $45,663 $23,956 $11,469 $11,687 $11,687 $11,687 $11,687 $11,687 $11,687 $11,687 $11,687
BP-18-FS-BPA-02A Page 183

TABLE 12E:
Summary of Interest
October 1, 2015 - September 30, 2019 Cost Evaluation Period
($000s) (FY 2019)
1
2
3
4
5
6
7
8
9
10
11
12
13
14
15
16
17
18
19
20
21
22
23
24
25
26
27
28
29
30
31
32
33
34
35
36
37
38
39
40
41
42
43
44
45
46
47
48
49
50
51
52
53
54
55
56
57
58
A B C
Obligation Type General Project Specific Project
Boise
Columbia Basin
Columbia Basin 3rd Powerhouse
Hungry Horse Dam
Minidoka/Palisades
RRP - Green Springs
Yakima Chandler/Kenniwick
Yakima Roza
Bureau of Reclamation Subtotal:
Albeni Falls
Bonneville 2nd Powerhouse
Bonneville Dam
Chief Joseph
Columbia River Fish Mitigation
Cougar
Detroit Lake/Big Cliff
Dworshak
Green Peter/Foster
Hills Creek
Ice Harbor
John Day
Libby
Little Goose
Lookout Dam
Lost Creek
Lower Granite
Lower Monument
McNary
The Dalles
Corps of Engineers Subtotal:
Lower Snake Fish and Wildlife
Lower Snake Fish & Wildlife Subtotal:
(Less Interest Income)
Bureau Direct
Interest Accrual
Interest Accrual Reversal
Conservation
Interest Accrual
Interest Accrual Reversal
Construction (AS)
Interest Accrual
Interest Accrual Reversal
Corps
Interest Accrual
Interest Accrual Reversal
Fish and Wildlife
Interest Accrual
Interest Accrual Reversal
Technology (G)
Interest Accrual
Interest Accrual Reversal
BPA Borrowing Subtotal:
Replacements
Federal Generation Replacements Subtotal:
Treasury
BPA Borrowing
Federal Generation Replacements
Treasury Subtotal:
Grand Total:
Appropriation
Bureau of Reclamation
Corps of Engineers
Lower Snake Fish & Wildlife
Appropriation Subtotal:
AN AO AP AQ AR AS AT AU AV AW AX AY AZ BA BB BC BD BE
2053 2054 2055 2056 2057 2058 2059 2060 2061 2062 2063 2064 2065 2066 2067 2068 2069 Total
3 3 3 3 3 3 - - - - - - - - - - - 1,084
99 99 99 99 99 99 59 - - - - - - - - - - 40,459
- - - - - - - - - - - - - - - - - 903
6 6 6 6 6 6 3 - - - - - - - - - - 3,871
- - - - - - - - - - - - - - - - - 15,646
- - - - - - - - - - - - - - - - - 1,311
1 1 1 1 1 1 1 - - - - - - - - - - 584
- - - - - - - - - - - - - - - - - 2
109 109 109 109 109 109 62 - - - - - - - - - - 63,860
2 2 2 2 2 2 2 - - - - - - - - - - 662
- - - - - - - - - - - - - - - - - 2,738
712 712 712 712 712 712 - - - - - - - - - - - 95,865
171 171 171 171 171 171 - - - - - - - - - - - 26,998
1,782 1,782 1,782 1,782 1,782 1,782 - - - - - - - - - - - 1,100,961
- - - - - - - - - - - - - - - - - 11,306
- - - - - - - - - - - - - - - - - 1,283
- - - - - - - - - - - 3,806
- - - - - - - - - - - - - - - - - 452
- - - - - - - - - - - - - - - - - 295
1 1 1 1 1 1 - - - - - - - - - - - 10,385
68 68 68 68 68 68 68 - - - - - - - - - - 14,033
76 76 76 76 76 76 - - - - - - - - - - - 5,107
1 1 1 1 1 1 - - - - - - - - - - - 3,434
- - - - - - - - - - - - - - - - - 5,908
- - - - - - - - - - - - - - - - - 31
1 1 1 1 1 1 - - - - - - - - - - - 10,426
- - - - - - - - - - - 5,934
10 10 10 10 10 10 - - - - - - - - - - - 8,915
80 80 80 80 80 80 - - - - - - - - - - - 30,050
2,906 2,906 2,906 2,906 2,906 2,906 70 - - - - - - - - - - 1,338,589
4 4 4 4 4 4 - - - - - - - - - - - 19,480
4 4 4 4 4 4 - - - - - - - - - - - 19,480
3,019 3,019 3,019 3,019 3,019 3,019 132 - - - - - - - - - - 1,421,928
(1,008) (1,008) (1,008) (1,008) (1,008) (1,008) (1,008) (1,008) (1,008) (1,008) (1,008) (1,008) (1,008) (1,008) (1,008) (1,008) (1,008) (70,117)
- - - - - - - - - - - - - - - - - 474,599
- - - - - - - - - - - - - - - - - 60,524
- - - - - - - - - - - - - - - - - (66,188)
- - - - - - - - - - - - - - - - - 69,169
- - - - - - - - - - - - - - - - - 14,627
- - - - - - - - - - - - - - - - - (16,701)
- - - - - - - - - - - - - - - - - 4,761
- - - - - - - - - - - - - - - - - 585
- - - - - - - - - - - - - - - - - (769)
- - - - - - - - - - - - - - - - - 206,595
- - - - - - - - - - - - - - - - - 24,573
- - - - - - - - - - - - - - - - - (25,290)
- - - - - - - - - - - - - - - - - 161,210
- - - - - - - - - - - - - - - - - 17,062
- - - - - - - - - - - - - - - - - (19,060)
- - - - - - - - - - - - - - - - - 4,437
- - - - - - - - - - - - - - - - - 373
- - - - - - - - - - - - - - - - - (464)
(1,008) (1,008) (1,008) (1,008) (1,008) (1,008) (1,008) (1,008) (1,008) (1,008) (1,008) (1,008) (1,008) (1,008) (1,008) (1,008) (1,008) 839,926
9,677 9,677 9,677 9,677 9,677 9,677 9,677 9,677 9,677 9,677 9,677 9,677 9,677 9,677 9,677 9,677 9,677 2,238,887
9,677 9,677 9,677 9,677 9,677 9,677 9,677 9,677 9,677 9,677 9,677 9,677 9,677 9,677 9,677 9,677 9,677 2,238,887
8,668 8,668 8,668 8,668 8,668 8,668 8,668 8,668 8,668 8,668 8,668 8,668 8,668 8,668 8,668 8,668 8,668 3,078,813
$11,687 $11,687 $11,687 $11,687 $11,687 $11,687 $8,800 $8,668 $8,668 $8,668 $8,668 $8,668 $8,668 $8,668 $8,668 $8,668 $8,668 $4,500,741
BP-18-FS-BPA-02A Page 184

TABLE 12F:
Summary of Amortization
October 1, 2015 - September 30, 2019 Cost Evaluation Period
($000s) (FY 2019)
1
2
3
4
5
6
7
8
9
10
11
12
13
14
15
16
17
18
19
20
21
22
23
24
25
26
27
28
29
30
31
32
33
34
35
36
37
38
39
40
41
42
43
44
45
46
47
48
49
50
51
52
53
54
55
56
57
58
59
60
61
62
63
64
65
A B C D E F G H I J K L M N O P Q R S T
Obligation Type General Project Specific Project 2017 2018 2019 2020 2021 2022 2023 2024 2025 2026 2027 2028 2029 2030 2031 2032 2033
Boise 3,365 - - - - - - - - - - - - 979 - 17 -
Columbia Basin 6,927 - 14,236 6,543 2,140 37,701 - 4,879 3,727 - - - - 11,891 - 1,987 877
Columbia Basin 3rd Powerhouse 12,631 - - - - - - - - - - - - - - - -
Hungry Horse Dam 6,318 552 - - - - - - - - - - 2,951 294 - - 779
Minidoka/Palisades 50,911 42 - - - - - - - - - - - - - - -
RRP - Green Springs - 11,145 - - - - - - - - - - - - - - -
Yakima Chandler/Kenniwick - - - - - - - - - - - - 833 - - - -
Yakima Roza - 14 - - - - - - - - - - - - - - -
Bureau of Reclamation Subtotal: 80,151 11,754 14,236 6,543 2,140 37,701 - 4,879 3,727 - - - 3,784 13,164 - 2,004 1,656
Albeni Falls 2,510 - - - - - - - - - - - - 481 - - 42
Bonneville 2nd Powerhouse 38,293 - - - - - - - - - - - - - - - -
Bonneville Dam 3,917 24,446 - - - - - - 2,978 - 19,368 - 31,322 20,849 - 2,628 4,169
Chief Joseph 7,970 - - - - - - - 347 - - - 992 - - - 24,727
Columbia River Fish Mitigation 55,768 36,266 2,853 - - - - - 8,797 - 20,742 4,624 143,460 79,873 191,054 278,543 56,832
Cougar 26 - - - - - - - - - - - 3,622 8,250 - 230 59
Detroit Lake/Big Cliff 38 - 282 - - - - - 18 - - - 223 1,031 - - -
Dworshak 8,803 - - - - - - - 199 - 630 - 761 713 - 2,380 -
Green Peter/Foster 26 200 - - - - - - - - - - - - - - -
Hills Creek 2,658 8 - - - - - - 2 - - - 46 - - - -
Ice Harbor 986 764 - - - - - - 4,634 990 4,227 - 50 - - 2,615 207
John Day 11,433 619 - - - - - - 3,510 - 2,830 - 2,827 233 601 - 356
Libby 15,441 5,562 - - - - - - - - - - - - - - 40
Little Goose 6,102 4,608 - - - - - - 27 - 67 - 146 - - 3,171 30
Lookout Dam 5,170 - - - - - - - - - - - 7,490 572 - - -
Lost Creek 118 147 - - - - - - - - - - - - - - -
Lower Granite 1,311 2,025 - - - - - - 2,131 - - - 434 - - 5,669 1,156
Lower Monument 2,160 3,301 - - - - - - 29 - 3,423 - 549 - 285 2,332 -
McNary 635 1,046 - - - - - - - - 6,138 - 646 - 4,080 - -
The Dalles 4,579 - - - - - - - 1,226 - 182 - 36,019 140 2,030 - -
Corps of Engineers Subtotal: 167,945 78,991 3,135 - - - - - 23,897 990 57,605 4,624 228,588 112,142 198,050 297,569 87,618
Lower Snake Fish and Wildlife 228,843 325 - - - - - - 897 - 230 - 102 - 379 1,534 11
Lower Snake Fish & Wildlife Subtotal: 228,843 325 - - - - - - 897 - 230 - 102 - 379 1,534 11
476,940 91,070 17,372 6,543 2,140 37,701 - 4,879 28,520 990 57,835 4,624 232,474 125,306 198,429 301,107 89,285
Bureau Direct - - 105,000 120,000 97,000 19,000 - - - - - 25,000 121,000 188,484 101,516 66,000 222,000
Principal Accrual - - - - - - - - - - - - - - - - -
Principal Accrual Reversal - - - - - - - - - - - - - - - - -
Conservation - 29,000 - - 19,000 16,000 142,000 97,000 69,000 39,000 6,000 25,000 - - - - -
Principal Accrual - - - - - - - - - - - - - - - - -
Principal Accrual Reversal - - - - - - - - - - - - - - - - -
Construction (AS) - 15,150 5,250 18,100 7,000 5,800 3,150 5,600 5,950 - - - - - - - -
Principal Accrual - - - - - - - - - - - - - - - - -
Principal Accrual Reversal - - - - - - - - - - - - - - - - -
Corps - - - - - - - - - - - - - 15,000 53,000 81,389 141,591
Principal Accrual - - - - - - - - - - - - - - - - -
Principal Accrual Reversal - - - - - - - - - - - - - - - - -
Fish and Wildlife - - 46,000 - - 31,000 - 25,000 - 80,000 55,000 26,000 56,000 8,000 13,000 40,000 51,000
Principal Accrual - - - - - - - - - - - - - - - - -
Principal Accrual Reversal - - - - - - - - - - - - - - - - -
Technology (G) - - - - 35,000 14,000 5,000 5,000 - - - - - - - - -
Principal Accrual - - - - - - - - - - - - - - - - -
Principal Accrual Reversal - - - - - - - - - - - - - - - - -
BPA Borrowing Subtotal: - 44,150 156,250 138,100 158,000 85,800 150,150 132,600 74,950 119,000 61,000 76,000 177,000 211,484 167,516 187,389 414,591
Replacements - - - - - - - - - - - - - - - - -
Principal Accrual - - - - - - - - - - - - - - - - -
Principal Accrual Reversal - - - - - - - - - - - - - - - - -
Federal Generation Replacements Subtotal: - - - - - - - - - - - - - - - - -
Discounts - - - - - - - - - - - - - - - - -
Premiums - - - - - - - - - - - - 2,308 4,526 4,955 - 1,098
Make Whole Call Subtotal: - - - - - - - - - - - - 2,308 4,526 4,955 - 1,098
- 44,150 156,250 138,100 158,000 85,800 150,150 132,600 74,950 119,000 61,000 76,000 177,000 211,484 167,516 187,389 414,591
Irrigation Assistance 50,769 27,234 56,573 24,317 14,747 16,060 12,846 15,117 13,543 20,755 6,118 11,186 4,065 1,996 10,524 - 4,347
Irrigation Assistance Subtotal: 50,769 27,234 56,573 24,317 14,747 16,060 12,846 15,117 13,543 20,755 6,118 11,186 4,065 1,996 10,524 - 4,347
50,769 27,234 56,573 24,317 14,747 16,060 12,846 15,117 13,543 20,755 6,118 11,186 4,065 1,996 10,524 - 4,347
$527,709 $162,454 $230,194 $168,960 $174,887 $139,561 $162,996 $152,596 $117,013 $140,745 $124,954 $91,811 $413,538 $338,786 $376,469 $488,496 $508,223Grand Total:
Bond
BPA Borrowing
Federal Generation Replacements
Make Whole Call
Bond Subtotal:
IrrigationIrrigation Assistance
Irrigation Subtotal:
Appropriation
Bureau of Reclamation
Corps of Engineers
Lower Snake Fish & Wildlife
Appropriation Subtotal:
BP-18-FS-BPA-02A Page 185

TABLE 12F:
Summary of Amortization
October 1, 2015 - September 30, 2019 Cost Evaluation Period
($000s) (FY 2019)
1
2
3
4
5
6
7
8
9
10
11
12
13
14
15
16
17
18
19
20
21
22
23
24
25
26
27
28
29
30
31
32
33
34
35
36
37
38
39
40
41
42
43
44
45
46
47
48
49
50
51
52
53
54
55
56
57
58
59
60
61
62
63
64
65
A B C
Obligation Type General Project Specific Project
Boise
Columbia Basin
Columbia Basin 3rd Powerhouse
Hungry Horse Dam
Minidoka/Palisades
RRP - Green Springs
Yakima Chandler/Kenniwick
Yakima Roza
Bureau of Reclamation Subtotal:
Albeni Falls
Bonneville 2nd Powerhouse
Bonneville Dam
Chief Joseph
Columbia River Fish Mitigation
Cougar
Detroit Lake/Big Cliff
Dworshak
Green Peter/Foster
Hills Creek
Ice Harbor
John Day
Libby
Little Goose
Lookout Dam
Lost Creek
Lower Granite
Lower Monument
McNary
The Dalles
Corps of Engineers Subtotal:
Lower Snake Fish and Wildlife
Lower Snake Fish & Wildlife Subtotal:
Bureau Direct
Principal Accrual
Principal Accrual Reversal
Conservation
Principal Accrual
Principal Accrual Reversal
Construction (AS)
Principal Accrual
Principal Accrual Reversal
Corps
Principal Accrual
Principal Accrual Reversal
Fish and Wildlife
Principal Accrual
Principal Accrual Reversal
Technology (G)
Principal Accrual
Principal Accrual Reversal
BPA Borrowing Subtotal:
Replacements
Principal Accrual
Principal Accrual Reversal
Federal Generation Replacements Subtotal:
Discounts
Premiums
Make Whole Call Subtotal:
Irrigation Assistance
Irrigation Assistance Subtotal:
Grand Total:
Bond
BPA Borrowing
Federal Generation Replacements
Make Whole Call
Bond Subtotal:
IrrigationIrrigation Assistance
Irrigation Subtotal:
Appropriation
Bureau of Reclamation
Corps of Engineers
Lower Snake Fish & Wildlife
Appropriation Subtotal:
U V W X Y Z AA AB AC AD AE AF AG AH AI AJ AK AL
2034 2035 2036 2037 2038 2039 2040 2041 2042 2043 2044 2045 2046 2047 2048 2049 2050 2051
- - - - - - - - - - - - - - - - - -
1,742 922 2,171 - - - - - - - - - - - - - - -
- - - - - - - - - - - - - - - - - -
515 3 - - - - - - - - - - - - - - - -
- 19,450 - - - - - - - - - - - - - - - -
- 3 - - - - - - - - - - - - - - - -
- - - - - - - - - - - - - - - - - -
- - - - - - - - - - - - - - - - - -
2,257 20,377 2,171 - - - - - - - - - - - - - - -
- - - - - - - - - - - - - - - - - -
- - - - - - - - - - - - - - - - - -
11,064 268 - - - - - - - - - - - - - - -
- 31 10 - - - - - - - - - - - - - - -
236,036 387,078 158,903 - - - - - - - - - - - - - - -
12 423 4,088 - - - - - - - - - - - - - - -
18 31 528 - - - - - - - - - - - - - - -
- - - - - - - - - - - - - - - - - -
472 166 - - - - - - - - - - - - - - - -
12 142 - - - - - - - - - - - - - - - -
819 3,847 - - - - - - - - - - - - - - - -
175 6,325 17 - - - - - - - - - - - - - - -
152 16 - - - - - - - - - - - - - - - -
- - 66 - - - - - - - - - - - - - - -
17 294 - - - - - - - - - - - - - - - -
7 - - - - - - - - - - - - - - - - -
2,653 3,475 - - - - - - - - - - - - - - - -
1,430 245 - - - - - - - - - - - - - - - -
1,324 11 1,000 - - - - - - - - - - - - - - -
- 305 - - - - - - - - - - - - - - - -
243,125 413,453 164,881 - - - - - - - - - - - - - - -
222 1,378 - - - - - - - - - - - - - - - -
222 1,378 - - - - - - - - - - - - - - - -
245,604 435,208 167,052 - - - - - - - - - - - - - - -
130,000 29,000 32,479 - - - - - - - - - - - - - - -
- - - - - - - - - - - - - - - - - -
- - - - - - - - - - - - - - - - - -
- - - - - - - - - - - - - - - - - -
- - - - - - - - - - - - - - - - - -
- - - - - - - - - - - - - - - - - -
- - - - - - - - - - - - - - - - - -
- - - - - - - - - - - - - - - - - -
- - - - - - - - - - - - - - - - - -
90,409 53,000 2,396 - - - - - - - - - - - - - - -
- - - - - - - - - - - - - - - - - -
- - - - - - - - - - - - - - - - - -
44,000 - - - - - - - - - - - - - - - - -
- - - - - - - - - - - - - - - - - -
- - - - - - - - - - - - - - - - - -
- - - - - - - - - - - - - - - - - -
- - - - - - - - - - - - - - - - - -
- - - - - - - - - - - - - - - - - -
264,409 82,000 34,875 - - - - - - - - - - - - - - -
- - 338,751 569,491 611,840 648,262 684,639 712,908 660,020 755,389 261,149 218,435 218,435 218,435 218,435 218,435 218,435 218,435
- - - - - - - - - - - - - - - - - -
- - - - - - - - - - - - - - - - - -
- - 338,751 569,491 611,840 648,262 684,639 712,908 660,020 755,389 261,149 218,435 218,435 218,435 218,435 218,435 218,435 218,435
- - (3,125) - - - - - - - - - - - - - - -
- - - - - - - - - - - - - - - - - -
- - (3,125) - - - - - - - - - - - - - - -
264,409 82,000 376,751 569,491 611,840 648,262 684,639 712,908 660,020 755,389 261,149 218,435 218,435 218,435 218,435 218,435 218,435 218,435
- 7,761 28,920 15,778 - 14,181 - - 73,659 - - 11,579 - - - - - -
- 7,761 28,920 15,778 - 14,181 - - 73,659 - - 11,579 - - - - - -
- 7,761 28,920 15,778 - 14,181 - - 73,659 - - 11,579 - - - - - -
$510,012 $524,969 $572,724 $585,269 $611,840 $662,444 $684,639 $712,908 $733,679 $755,389 $261,149 $230,014 $218,435 $218,435 $218,435 $218,435 $218,435 $218,435
BP-18-FS-BPA-02A Page 186
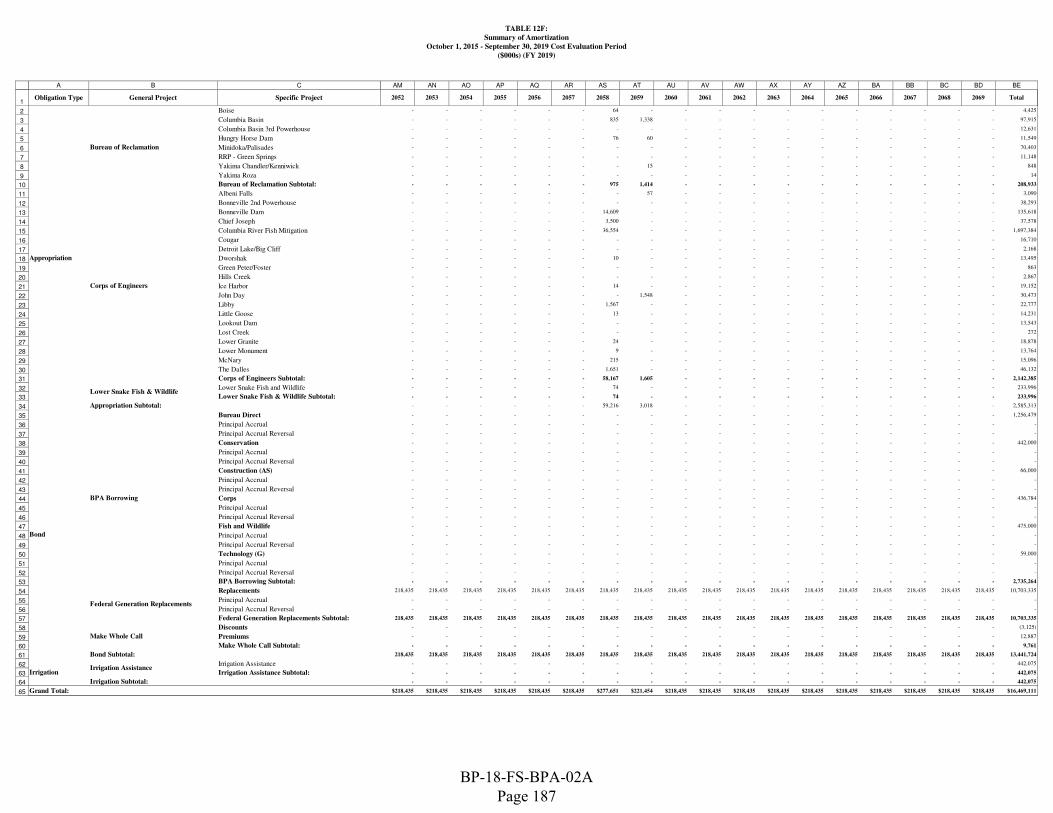
TABLE 12F:
Summary of Amortization
October 1, 2015 - September 30, 2019 Cost Evaluation Period
($000s) (FY 2019)
1
2
3
4
5
6
7
8
9
10
11
12
13
14
15
16
17
18
19
20
21
22
23
24
25
26
27
28
29
30
31
32
33
34
35
36
37
38
39
40
41
42
43
44
45
46
47
48
49
50
51
52
53
54
55
56
57
58
59
60
61
62
63
64
65
A B C
Obligation Type General Project Specific Project
Boise
Columbia Basin
Columbia Basin 3rd Powerhouse
Hungry Horse Dam
Minidoka/Palisades
RRP - Green Springs
Yakima Chandler/Kenniwick
Yakima Roza
Bureau of Reclamation Subtotal:
Albeni Falls
Bonneville 2nd Powerhouse
Bonneville Dam
Chief Joseph
Columbia River Fish Mitigation
Cougar
Detroit Lake/Big Cliff
Dworshak
Green Peter/Foster
Hills Creek
Ice Harbor
John Day
Libby
Little Goose
Lookout Dam
Lost Creek
Lower Granite
Lower Monument
McNary
The Dalles
Corps of Engineers Subtotal:
Lower Snake Fish and Wildlife
Lower Snake Fish & Wildlife Subtotal:
Bureau Direct
Principal Accrual
Principal Accrual Reversal
Conservation
Principal Accrual
Principal Accrual Reversal
Construction (AS)
Principal Accrual
Principal Accrual Reversal
Corps
Principal Accrual
Principal Accrual Reversal
Fish and Wildlife
Principal Accrual
Principal Accrual Reversal
Technology (G)
Principal Accrual
Principal Accrual Reversal
BPA Borrowing Subtotal:
Replacements
Principal Accrual
Principal Accrual Reversal
Federal Generation Replacements Subtotal:
Discounts
Premiums
Make Whole Call Subtotal:
Irrigation Assistance
Irrigation Assistance Subtotal:
Grand Total:
Bond
BPA Borrowing
Federal Generation Replacements
Make Whole Call
Bond Subtotal:
IrrigationIrrigation Assistance
Irrigation Subtotal:
Appropriation
Bureau of Reclamation
Corps of Engineers
Lower Snake Fish & Wildlife
Appropriation Subtotal:
AM AN AO AP AQ AR AS AT AU AV AW AX AY AZ BA BB BC BD BE
2052 2053 2054 2055 2056 2057 2058 2059 2060 2061 2062 2063 2064 2065 2066 2067 2068 2069 Total
- - - - - - 64 - - - - - - - - - - - 4,425
- - - - - - 835 1,338 - - - - - - - - - - 97,915
- - - - - - - - - - - - - - - - - - 12,631
- - - - - - 76 60 - - - - - - - - - - 11,549
- - - - - - - - - - - - - - - - - - 70,403
- - - - - - - - - - - - - - - - - - 11,148
- - - - - - - 15 - - - - - - - - - - 848
- - - - - - - - - - - - - - - - - - 14
- - - - - - 975 1,414 - - - - - - - - - - 208,933
- - - - - - - 57 - - - - - - - - - - 3,090
- - - - - - - - - - - - - - - - - - 38,293
- - - - - - 14,609 - - - - - - - - - - - 135,618
- - - - - - 3,500 - - - - - - - - - - - 37,578
- - - - - - 36,554 - - - - - - - - - - - 1,697,384
- - - - - - - - - - - - - - - - - - 16,710
- - - - - - - - - - - - - - - - - - 2,168
- - - - - - 10 - - - - - - - - - - - 13,495
- - - - - - - - - - - - - - - - - - 863
- - - - - - - - - - - - - - - - - - 2,867
- - - - - - 14 - - - - - - - - - - - 19,152
- - - - - - - 1,548 - - - - - - - - - - 30,473
- - - - - - 1,567 - - - - - - - - - - - 22,777
- - - - - - 13 - - - - - - - - - - - 14,231
- - - - - - - - - - - - - - - - - - 13,543
- - - - - - - - - - - - - - - - - - 272
- - - - - - 24 - - - - - - - - - - - 18,878
- - - - - - 9 - - - - - - - - - - - 13,764
- - - - - - 215 - - - - - - - - - - - 15,096
- - - - - - 1,651 - - - - - - - - - - - 46,132
- - - - - - 58,167 1,605 - - - - - - - - - - 2,142,385
- - - - - - 74 - - - - - - - - - - - 233,996
- - - - - - 74 - - - - - - - - - - - 233,996
- - - - - - 59,216 3,018 - - - - - - - - - - 2,585,313
- - - - - - - - - - - - - - - - - - 1,256,479
- - - - - - - - - - - - - - - - - - -
- - - - - - - - - - - - - - - - - - -
- - - - - - - - - - - - - - - - - - 442,000
- - - - - - - - - - - - - - - - - - -
- - - - - - - - - - - - - - - - - - -
- - - - - - - - - - - - - - - - - - 66,000
- - - - - - - - - - - - - - - - - - -
- - - - - - - - - - - - - - - - - - -
- - - - - - - - - - - - - - - - - - 436,784
- - - - - - - - - - - - - - - - - - -
- - - - - - - - - - - - - - - - - - -
- - - - - - - - - - - - - - - - - - 475,000
- - - - - - - - - - - - - - - - - - -
- - - - - - - - - - - - - - - - - - -
- - - - - - - - - - - - - - - - - - 59,000
- - - - - - - - - - - - - - - - - - -
- - - - - - - - - - - - - - - - - - -
- - - - - - - - - - - - - - - - - - 2,735,264
218,435 218,435 218,435 218,435 218,435 218,435 218,435 218,435 218,435 218,435 218,435 218,435 218,435 218,435 218,435 218,435 218,435 218,435 10,703,335
- - - - - - - - - - - - - - - - - - -
- - - - - - - - - - - - - - - - - - -
218,435 218,435 218,435 218,435 218,435 218,435 218,435 218,435 218,435 218,435 218,435 218,435 218,435 218,435 218,435 218,435 218,435 218,435 10,703,335
- - - - - - - - - - - - - - - - - - (3,125)
- - - - - - - - - - - - - - - - - - 12,887
- - - - - - - - - - - - - - - - - - 9,761
218,435 218,435 218,435 218,435 218,435 218,435 218,435 218,435 218,435 218,435 218,435 218,435 218,435 218,435 218,435 218,435 218,435 218,435 13,441,724
- - - - - - - - - - - - - - - - - - 442,075
- - - - - - - - - - - - - - - - - - 442,075
- - - - - - - - - - - - - - - - - - 442,075
$218,435 $218,435 $218,435 $218,435 $218,435 $218,435 $277,651 $221,454 $218,435 $218,435 $218,435 $218,435 $218,435 $218,435 $218,435 $218,435 $218,435 $218,435 $16,469,111
BP-18-FS-BPA-02A Page 187

13. REPAYMENT STUDY DATA, FY 2019 STUDY, POST-SHIFT
BP-18-FS-BPA-02A Page 188

TABLE 13A:
HISTORICAL INVESTMENTS, SHIFT STUDY
October 1, 2015 - September 30, 2019 Cost Evaluation period
($000s) (FY 2019)
A B C D E F G H
Project
In Service
Date
Due
Date
Interest
Rate
Initial
Principal Current Principal
Roll Maturity
Date
Rollover
Rate
1 Albeni Falls 09/1955 09/2005 6.910% 25,494 02 Albeni Falls 09/1956 09/2005 6.910% 11 03 Albeni Falls 09/1957 09/2005 6.910% 10 04 Albeni Falls 09/1958 09/2005 6.910% 11 05 Albeni Falls 09/1959 09/2005 6.910% 11 06 Albeni Falls 09/1960 09/2005 6.910% 10 07 Albeni Falls 09/1961 09/2005 6.910% 11 08 Albeni Falls 09/1962 09/2005 6.910% 11 09 Albeni Falls 09/1963 09/2005 6.910% 10 010 Albeni Falls 09/1964 09/2005 6.910% 11 011 Albeni Falls 09/1965 09/2005 6.910% 11 012 Albeni Falls 09/1966 09/2005 6.910% 10 013 Albeni Falls 09/1967 09/2005 6.910% 11 014 Albeni Falls 09/1968 09/2005 6.910% 11 015 Albeni Falls 09/1969 09/2005 6.910% 10 016 Albeni Falls 09/1970 09/2005 6.910% 11 017 Albeni Falls 09/1971 09/2005 6.910% 11 018 Albeni Falls 09/1972 09/2005 6.910% 10 019 Albeni Falls 09/1973 09/2005 6.910% 11 020 Albeni Falls 09/1974 09/2005 6.910% 11 021 Albeni Falls 09/1975 09/2005 6.910% 10 022 Albeni Falls 09/1976 09/2005 6.910% 11 023 Albeni Falls 09/1977 09/2005 6.910% 11 024 Albeni Falls 09/1978 09/2005 6.910% 10 025 Albeni Falls 09/1979 09/2005 6.910% 11 026 Albeni Falls 09/1980 09/2005 6.910% 11 027 Albeni Falls 09/1981 09/2005 6.910% 10 028 Albeni Falls 09/1982 09/2005 6.910% 11 029 Albeni Falls 09/1983 09/2005 6.910% 11 030 Albeni Falls 09/1985 09/2005 6.910% 7 031 Albeni Falls 09/1986 09/2005 6.910% 293 032 Albeni Falls 09/1987 09/2005 6.910% 12 033 Albeni Falls 09/1987 09/2005 8.888% 15 034 Albeni Falls 09/1988 09/2005 8.500% 328 035 Albeni Falls 09/1989 09/2005 9.250% 221 036 Albeni Falls 09/1990 09/2005 8.875% 1,287 037 Albeni Falls 09/1991 09/2005 8.750% 43 038 Albeni Falls 09/1991 09/2005 8.750% 111 039 Albeni Falls 09/1992 09/2005 8.500% 7 040 Albeni Falls 09/1992 09/2005 8.500% 106 041 Albeni Falls 09/1993 09/2005 7.875% 295 042 Albeni Falls 09/1993 09/2005 7.875% 714 043 Albeni Falls 09/1994 09/2019 7.125% 61 044 Albeni Falls 09/1994 09/2019 7.125% 173 045 Albeni Falls 09/1995 09/2010 7.090% 17 046 Albeni Falls 09/1995 09/2010 7.890% 51 047 Albeni Falls 09/1995 09/2045 7.150% 443 44348 Albeni Falls 09/1995 09/2045 7.150% 531 53149 Albeni Falls 09/1995 09/2045 7.150% 1,105 1,10550 Albeni Falls 09/1996 09/2016 7.290% 130 051 Albeni Falls 09/1997 09/2047 7.150% 431 43152 Albeni Falls 09/2005 09/2055 5.125% 481 48153 Albeni Falls 09/2009 09/2059 4.375% 57 5754 Albeni Falls 09/2010 09/2060 4.250% 42 4255 Boise 09/1912 09/1962 3.000% 1,249 056 Boise 09/1912 09/1962 3.000% 285 057 Boise 09/1926 09/1976 3.000% 190 058 Boise 09/1926 09/1976 3.000% 832 059 Boise 09/1950 09/2000 3.000% 416 060 Boise 09/1950 09/2000 3.000% 95 061 Boise 09/1951 09/2001 3.000% 1,873 062 Boise 09/1951 09/2001 3.000% 428 063 Boise 09/1952 09/2001 3.000% 11 064 Boise 09/1952 09/2001 3.000% 3 065 Boise 09/1953 09/2001 3.000% 11 066 Boise 09/1953 09/2001 3.000% 3 067 Boise 09/1954 09/2001 3.000% 11 068 Boise 09/1954 09/2001 3.000% 3 069 Boise 09/1955 09/2001 3.000% 11 070 Boise 09/1955 09/2001 3.000% 3 071 Boise 09/1956 09/2001 3.000% 11 072 Boise 09/1956 09/2001 3.000% 3 073 Boise 09/1957 09/2001 3.000% 11 074 Boise 09/1957 09/2001 3.000% 3 075 Boise 09/1958 09/2001 3.000% 11 076 Boise 09/1958 09/2001 3.000% 3 077 Boise 09/1959 09/2001 3.000% 11 078 Boise 09/1959 09/2001 3.000% 3 079 Boise 09/1960 09/2001 3.000% 11 080 Boise 09/1960 09/2001 3.000% 3 081 Boise 09/1961 09/2001 3.000% 11 082 Boise 09/1961 09/2001 3.000% 3 083 Boise 09/1962 09/2001 3.000% 11 0
BP-18-FS-BPA-02A Page 189

TABLE 13A:
HISTORICAL INVESTMENTS, SHIFT STUDY
October 1, 2015 - September 30, 2019 Cost Evaluation period
($000s) (FY 2019)
A B C D E F G H
Project
In Service
Date
Due
Date
Interest
Rate
Initial
Principal Current Principal
Roll Maturity
Date
Rollover
Rate
84 Boise 09/1962 09/2001 3.000% 3 085 Boise 09/1963 09/2001 3.000% 11 086 Boise 09/1963 09/2001 3.000% 3 087 Boise 09/1964 09/2001 3.000% 11 088 Boise 09/1964 09/2001 3.000% 3 089 Boise 09/1965 09/2001 3.000% 11 090 Boise 09/1965 09/2001 3.000% 3 091 Boise 09/1966 09/2001 3.000% 11 092 Boise 09/1966 09/2001 3.000% 3 093 Boise 09/1967 09/2001 3.000% 11 094 Boise 09/1967 09/2001 3.000% 3 095 Boise 09/1968 09/2001 3.000% 11 096 Boise 09/1968 09/2001 3.000% 3 097 Boise 09/1969 09/2001 3.000% 11 098 Boise 09/1969 09/2001 3.000% 3 099 Boise 09/1970 09/2001 3.000% 11 0
100 Boise 09/1970 09/2001 3.000% 3 0101 Boise 09/1971 09/2001 3.000% 11 0102 Boise 09/1971 09/2001 3.000% 3 0103 Boise 09/1972 09/2001 3.000% 11 0104 Boise 09/1972 09/2001 3.000% 3 0105 Boise 09/1973 09/2001 3.000% 11 0106 Boise 09/1973 09/2001 3.000% 3 0107 Boise 09/1974 09/2001 3.000% 11 0108 Boise 09/1974 09/2001 3.000% 3 0109 Boise 09/1975 09/2001 3.000% 11 0110 Boise 09/1975 09/2001 3.000% 3 0111 Boise 09/1976 09/2001 3.000% 11 0112 Boise 09/1976 09/2001 3.000% 3 0113 Boise 09/1977 09/2001 3.000% 11 0114 Boise 09/1977 09/2001 3.000% 3 0115 Boise 09/1978 09/2001 3.000% 11 0116 Boise 09/1978 09/2001 3.000% 3 0117 Boise 09/1979 09/2001 3.000% 11 0118 Boise 09/1979 09/2001 3.000% 3 0119 Boise 09/1980 09/2001 3.000% 18 0120 Boise 09/1980 09/2001 3.000% 4 0121 Boise 09/1981 09/2001 3.000% 8 0122 Boise 09/1981 09/2001 3.000% 2 0123 Boise 09/1982 09/2001 3.000% 1 0124 Boise 09/1982 09/2001 3.000% 1 0125 Boise 09/1983 09/2001 3.000% 1 0126 Boise 09/1984 09/2001 10.750% 1,325 0127 Boise 09/1984 09/2001 10.750% 303 0128 Boise 09/1986 09/2001 6.710% 94 0129 Boise 09/1988 09/2001 8.500% 3 0130 Boise 09/1989 09/2001 9.250% 3,264 0131 Boise 09/1990 09/2001 8.875% 38 0132 Boise 09/1991 09/2001 8.750% 50 0133 Boise 09/1993 09/2001 7.875% 418 0134 Boise 09/1994 09/1999 7.125% 7 0135 Boise 09/1996 09/2046 6.950% 7 0136 Boise 09/1996 09/2046 7.150% 442 442137 Boise 09/1996 09/2046 7.150% 656 656138 Boise 09/1997 09/2047 6.950% 9 0139 Boise 09/1997 09/2047 7.150% 2,266 2,266140 Boise 09/2005 09/2055 5.125% 903 903141 Boise 09/2006 09/2056 4.500% 15 15142 Boise 09/2007 09/2057 5.000% 76 76143 Boise 09/2008 09/2058 4.875% 64 64144 Boise 09/2009 09/2059 4.375% 2 2145 Boise 09/2015 09/2065 3.250% 0 0146 Bonneville 2nd Powerhouse 09/1981 09/2031 7.150% 40,964 0147 Bonneville 2nd Powerhouse 09/1981 09/2031 7.150% 455 0148 Bonneville 2nd Powerhouse 09/1982 09/2032 7.150% 203,535 0149 Bonneville 2nd Powerhouse 09/1982 09/2032 7.150% 2,264 0150 Bonneville 2nd Powerhouse 09/1983 09/2033 7.150% 62,409 0151 Bonneville 2nd Powerhouse 09/1983 09/2033 7.150% 694 0152 Bonneville 2nd Powerhouse 09/1985 09/2033 7.150% 9,138 0153 Bonneville 2nd Powerhouse 09/1986 09/2033 7.150% 30,578 21,534154 Bonneville 2nd Powerhouse 09/1987 09/2033 7.150% 2,801 2,801155 Bonneville 2nd Powerhouse 09/1988 09/2033 7.150% 1,271 1,271156 Bonneville 2nd Powerhouse 09/1989 09/2033 7.150% 1,232 1,232157 Bonneville 2nd Powerhouse 09/1990 09/2033 7.150% 1,588 1,588158 Bonneville 2nd Powerhouse 09/1991 09/2033 8.750% 3,998 0159 Bonneville 2nd Powerhouse 09/1991 09/2033 8.750% 26 0160 Bonneville 2nd Powerhouse 09/1992 09/2033 8.500% 2,446 0161 Bonneville 2nd Powerhouse 09/1993 09/2033 7.875% 3,668 0162 Bonneville 2nd Powerhouse 09/1994 09/2044 7.150% 5,700 5,700163 Bonneville 2nd Powerhouse 09/1995 09/2045 7.150% 3,791 3,791164 Bonneville 2nd Powerhouse 09/1996 09/2046 7.150% 376 376165 Bonneville Dam 09/1938 09/1988 2.500% 11,726 0166 Bonneville Dam 09/1938 09/1988 2.500% 130 0
BP-18-FS-BPA-02A Page 190

TABLE 13A:
HISTORICAL INVESTMENTS, SHIFT STUDY
October 1, 2015 - September 30, 2019 Cost Evaluation period
($000s) (FY 2019)
A B C D E F G H
Project
In Service
Date
Due
Date
Interest
Rate
Initial
Principal Current Principal
Roll Maturity
Date
Rollover
Rate
167 Bonneville Dam 09/1941 09/1991 2.500% 17,589 0168 Bonneville Dam 09/1941 09/1991 2.500% 196 0169 Bonneville Dam 09/1942 09/1992 2.500% 5,863 0170 Bonneville Dam 09/1942 09/1992 2.500% 65 0171 Bonneville Dam 09/1943 09/1993 2.500% 17,589 0172 Bonneville Dam 09/1943 09/1993 2.500% 196 0173 Bonneville Dam 09/1944 09/1994 2.500% 5,860 0174 Bonneville Dam 09/1944 09/1994 2.500% 65 0175 Bonneville Dam 09/1945 09/1994 2.500% 82 0176 Bonneville Dam 09/1945 09/1994 2.500% 1 0177 Bonneville Dam 09/1946 09/1994 2.500% 81 0178 Bonneville Dam 09/1946 09/1994 2.500% 1 0179 Bonneville Dam 09/1947 09/1994 2.500% 82 0180 Bonneville Dam 09/1947 09/1994 2.500% 1 0181 Bonneville Dam 09/1948 09/1994 2.500% 81 0182 Bonneville Dam 09/1948 09/1994 2.500% 1 0183 Bonneville Dam 09/1949 09/1994 2.500% 82 0184 Bonneville Dam 09/1949 09/1994 2.500% 1 0185 Bonneville Dam 09/1950 09/1994 2.500% 81 0186 Bonneville Dam 09/1950 09/1994 2.500% 11 0187 Bonneville Dam 09/1951 09/1994 2.500% 81 0188 Bonneville Dam 09/1951 09/1994 2.500% 11 0189 Bonneville Dam 09/1952 09/1994 2.500% 82 0190 Bonneville Dam 09/1952 09/1994 2.500% 1 0191 Bonneville Dam 09/1953 09/1994 2.500% 81 0192 Bonneville Dam 09/1953 09/1994 2.500% 1 0193 Bonneville Dam 09/1954 09/1994 2.500% 82 0194 Bonneville Dam 09/1954 09/1994 2.500% 1 0195 Bonneville Dam 09/1955 09/1994 2.500% 81 0196 Bonneville Dam 09/1955 09/1994 2.500% 1 0197 Bonneville Dam 09/1956 09/1994 2.500% 81 0198 Bonneville Dam 09/1956 09/1994 2.500% 1 0199 Bonneville Dam 09/1957 09/1994 2.500% 82 0200 Bonneville Dam 09/1957 09/1994 2.500% 1 0201 Bonneville Dam 09/1958 09/1994 2.500% 81 0202 Bonneville Dam 09/1958 09/1994 2.500% 1 0203 Bonneville Dam 09/1959 09/1994 2.500% 82 0204 Bonneville Dam 09/1959 09/1994 2.500% 1 0205 Bonneville Dam 09/1960 09/1994 2.500% 81 0206 Bonneville Dam 09/1960 09/1994 2.500% 1 0207 Bonneville Dam 09/1961 09/1994 2.500% 81 0208 Bonneville Dam 09/1961 09/1994 2.500% 1 0209 Bonneville Dam 09/1962 09/1994 2.500% 82 0210 Bonneville Dam 09/1962 09/1994 2.500% 1 0211 Bonneville Dam 09/1963 09/1994 2.500% 81 0212 Bonneville Dam 09/1963 09/1994 2.500% 1 0213 Bonneville Dam 09/1964 09/1994 2.500% 82 0214 Bonneville Dam 09/1964 09/1994 2.500% 1 0215 Bonneville Dam 09/1965 09/1994 2.500% 81 0216 Bonneville Dam 09/1965 09/1994 2.500% 1 0217 Bonneville Dam 09/1966 09/1994 2.500% 81 0218 Bonneville Dam 09/1966 09/1994 2.500% 1 0219 Bonneville Dam 09/1967 09/1994 2.500% 82 0220 Bonneville Dam 09/1967 09/1994 2.500% 1 0221 Bonneville Dam 09/1968 09/1994 2.500% 81 0222 Bonneville Dam 09/1968 09/1994 2.500% 1 0223 Bonneville Dam 09/1969 09/1994 2.500% 82 0224 Bonneville Dam 09/1969 09/1994 2.500% 1 0225 Bonneville Dam 09/1970 09/1994 2.500% 81 0226 Bonneville Dam 09/1970 09/1994 2.500% 1 0227 Bonneville Dam 09/1971 09/1994 2.500% 81 0228 Bonneville Dam 09/1971 09/1994 2.500% 1 0229 Bonneville Dam 09/1972 09/1994 2.500% 82 0230 Bonneville Dam 09/1972 09/1994 2.500% 1 0231 Bonneville Dam 09/1973 09/1994 2.500% 81 0232 Bonneville Dam 09/1973 09/1994 2.500% 1 0233 Bonneville Dam 09/1974 09/1994 2.500% 82 0234 Bonneville Dam 09/1974 09/1994 2.500% 1 0235 Bonneville Dam 09/1975 09/1994 2.500% 81 0236 Bonneville Dam 09/1975 09/1994 2.500% 1 0237 Bonneville Dam 09/1976 09/1994 2.500% 81 0238 Bonneville Dam 09/1976 09/1994 2.500% 1 0239 Bonneville Dam 09/1977 09/1994 2.500% 82 0240 Bonneville Dam 09/1977 09/1994 2.500% 1 0241 Bonneville Dam 09/1977 09/2027 7.150% 15,670 0242 Bonneville Dam 09/1978 09/1994 2.500% 81 0243 Bonneville Dam 09/1978 09/1994 2.500% 1 0244 Bonneville Dam 09/1979 09/1994 2.500% 82 0245 Bonneville Dam 09/1979 09/1994 2.500% 1 0246 Bonneville Dam 09/1980 09/1994 2.500% 81 0247 Bonneville Dam 09/1980 09/1994 2.500% 1 0248 Bonneville Dam 09/1981 09/1994 2.500% 81 0249 Bonneville Dam 09/1981 09/1994 2.500% 1 0
BP-18-FS-BPA-02A Page 191

TABLE 13A:
HISTORICAL INVESTMENTS, SHIFT STUDY
October 1, 2015 - September 30, 2019 Cost Evaluation period
($000s) (FY 2019)
A B C D E F G H
Project
In Service
Date
Due
Date
Interest
Rate
Initial
Principal Current Principal
Roll Maturity
Date
Rollover
Rate
250 Bonneville Dam 09/1982 09/1994 2.500% 82 0251 Bonneville Dam 09/1982 09/1994 2.500% 2 0252 Bonneville Dam 09/1983 09/1994 2.500% 81 0253 Bonneville Dam 09/1983 09/1994 2.500% 1 0254 Bonneville Dam 09/1984 09/1994 10.750% 873 0255 Bonneville Dam 09/1984 09/1994 10.750% 10 0256 Bonneville Dam 09/1985 09/1994 2.500% 119 0257 Bonneville Dam 09/1986 09/1994 2.500% 555 0258 Bonneville Dam 09/1986 09/1994 11.375% 454 0259 Bonneville Dam 09/1987 09/1994 2.500% 260 0260 Bonneville Dam 09/1987 09/1994 8.875% 26 0261 Bonneville Dam 09/1988 09/1994 8.500% 4,199 0262 Bonneville Dam 09/1988 09/1994 8.500% 10 0263 Bonneville Dam 09/1989 09/1994 9.250% 877 0264 Bonneville Dam 09/1990 09/1994 8.875% 519 0265 Bonneville Dam 09/1990 09/1994 8.875% 651 0266 Bonneville Dam 09/1991 09/1994 8.750% 35 0267 Bonneville Dam 09/1991 09/1994 8.750% 3,193 0268 Bonneville Dam 09/1992 09/1994 8.500% 99 0269 Bonneville Dam 09/1992 09/1994 8.500% 25 0270 Bonneville Dam 09/1993 09/2018 7.880% 5,011 0271 Bonneville Dam 09/1994 09/2029 7.125% 536 0272 Bonneville Dam 09/1995 09/2000 7.330% 8 0273 Bonneville Dam 09/1995 09/2010 7.090% 25 0274 Bonneville Dam 09/1995 09/2020 7.250% 20 0275 Bonneville Dam 09/1995 09/2020 7.250% 22 0276 Bonneville Dam 09/1995 09/2030 7.860% 53 0277 Bonneville Dam 09/1995 09/2035 7.860% 98 0278 Bonneville Dam 09/1995 09/2045 7.150% 243 243279 Bonneville Dam 09/1995 09/2045 7.150% 410 410280 Bonneville Dam 09/1995 09/2045 7.150% 440 440281 Bonneville Dam 09/1995 09/2045 7.860% 374 0282 Bonneville Dam 09/1996 09/2016 7.290% 834 0283 Bonneville Dam 09/1996 09/2031 7.150% 22 0284 Bonneville Dam 09/1996 09/2046 7.150% 18 18285 Bonneville Dam 09/1996 09/2046 7.150% 18 18286 Bonneville Dam 09/1996 09/2046 7.150% 80 80287 Bonneville Dam 09/1996 09/2046 7.150% 109 109288 Bonneville Dam 09/1996 09/2046 7.150% 142 142289 Bonneville Dam 09/1996 09/2046 7.150% 223 223290 Bonneville Dam 09/1996 09/2046 7.150% 751 751291 Bonneville Dam 09/1996 09/2046 7.150% 1,322 1,322292 Bonneville Dam 09/1997 09/2022 7.230% 122 0293 Bonneville Dam 09/1997 09/2032 7.150% 518 0294 Bonneville Dam 09/1997 09/2047 7.150% 161 161295 Bonneville Dam 09/1999 09/2049 5.375% 19,368 19,368296 Bonneville Dam 09/2000 09/2050 6.125% 24,446 24,446297 Bonneville Dam 09/2001 09/2051 5.875% 2,530 2,530298 Bonneville Dam 09/2002 09/2052 5.500% 448 448299 Bonneville Dam 09/2003 09/2053 5.125% 4,581 4,581300 Bonneville Dam 09/2004 09/2054 5.375% 26,741 26,741301 Bonneville Dam 09/2005 09/2055 5.125% 19,725 19,725302 Bonneville Dam 09/2006 09/2056 4.500% 2,628 2,628303 Bonneville Dam 09/2007 09/2057 5.000% 1,124 1,124304 Bonneville Dam 09/2008 09/2058 4.875% 14,609 14,609305 Bonneville Dam 09/2009 09/2059 4.375% 2,744 2,744306 Bonneville Dam 09/2010 09/2060 4.250% 1,425 1,425307 Bonneville Dam 09/2011 09/2061 3.750% 10,962 10,962308 Bonneville Dam 09/2013 09/2063 2.875% 268 268309 Bonneville Dam 09/2014 09/2064 3.875%310 Bonneville Dam 09/2015 09/2065 3.250% 102 102311 Chief Joseph 09/1955 09/2005 6.910% 29,164 0312 Chief Joseph 09/1956 09/2006 6.950% 13,643 0313 Chief Joseph 09/1957 09/2007 6.980% 39,586 0314 Chief Joseph 09/1958 09/2008 7.020% 31,901 0315 Chief Joseph 09/1959 09/2008 7.020% 223 0316 Chief Joseph 09/1960 09/2008 7.020% 223 0317 Chief Joseph 09/1961 09/2008 7.020% 223 0318 Chief Joseph 09/1962 09/2008 7.020% 223 0319 Chief Joseph 09/1963 09/2008 7.020% 224 0320 Chief Joseph 09/1964 09/2008 7.020% 223 0321 Chief Joseph 09/1965 09/2008 7.020% 223 0322 Chief Joseph 09/1966 09/2008 7.020% 223 0323 Chief Joseph 09/1967 09/2008 7.020% 223 0324 Chief Joseph 09/1968 09/2008 7.020% 224 0325 Chief Joseph 09/1969 09/2008 7.020% 223 0326 Chief Joseph 09/1970 09/2008 7.020% 223 0327 Chief Joseph 09/1971 09/2008 7.020% 223 0328 Chief Joseph 09/1972 09/2008 7.020% 223 0329 Chief Joseph 09/1973 09/2008 7.020% 224 0330 Chief Joseph 09/1974 09/2008 7.020% 223 0331 Chief Joseph 09/1975 09/2008 7.020% 223 0332 Chief Joseph 09/1976 09/2008 7.020% 223 0
BP-18-FS-BPA-02A Page 192

TABLE 13A:
HISTORICAL INVESTMENTS, SHIFT STUDY
October 1, 2015 - September 30, 2019 Cost Evaluation period
($000s) (FY 2019)
A B C D E F G H
Project
In Service
Date
Due
Date
Interest
Rate
Initial
Principal Current Principal
Roll Maturity
Date
Rollover
Rate
333 Chief Joseph 09/1977 09/2008 7.020% 223 0334 Chief Joseph 09/1977 09/2027 7.150% 30,512 0335 Chief Joseph 09/1978 09/2008 7.020% 224 0336 Chief Joseph 09/1978 09/2028 7.150% 75,669 0337 Chief Joseph 09/1979 09/2008 7.020% 223 0338 Chief Joseph 09/1979 09/2029 7.150% 60,079 0339 Chief Joseph 09/1980 09/2008 7.020% 223 0340 Chief Joseph 09/1981 09/2008 7.020% 223 0341 Chief Joseph 09/1982 09/2008 7.020% 223 0342 Chief Joseph 09/1983 09/2008 7.020% 224 0343 Chief Joseph 09/1984 09/2008 10.750% 909 0344 Chief Joseph 09/1985 09/2008 7.020% 46 0345 Chief Joseph 09/1985 09/2029 7.150% 16,372 0346 Chief Joseph 09/1986 09/2029 7.150% 5,363 0347 Chief Joseph 09/1987 09/2008 8.875% 104 0348 Chief Joseph 09/1987 09/2029 7.150% 3,036 0349 Chief Joseph 09/1988 09/2029 7.150% 2,722 0350 Chief Joseph 09/1989 09/2008 9.250% 327 0351 Chief Joseph 09/1989 09/2029 7.150% 2,227 0352 Chief Joseph 09/1990 09/2008 8.875% 1,024 0353 Chief Joseph 09/1990 09/2029 7.150% 4,505 0354 Chief Joseph 09/1991 09/2008 8.750% 34 0355 Chief Joseph 09/1991 09/2008 8.750% 293 0356 Chief Joseph 09/1991 09/2029 8.750% 3,840 0357 Chief Joseph 09/1992 09/2008 8.500% 142 0358 Chief Joseph 09/1992 09/2008 8.500% 717 0359 Chief Joseph 09/1992 09/2029 8.500% 2,032 0360 Chief Joseph 09/1993 09/2008 7.875% 42 0361 Chief Joseph 09/1993 09/2008 7.875% 794 0362 Chief Joseph 09/1993 09/2029 7.875% 1,360 0363 Chief Joseph 09/1994 09/2029 7.125% 129 0364 Chief Joseph 09/1994 09/2029 7.125% 65 0365 Chief Joseph 09/1994 09/2044 7.150% 4,280 4,017366 Chief Joseph 09/1995 09/2010 7.090% 15 0367 Chief Joseph 09/1995 09/2045 7.150% 147 147368 Chief Joseph 09/1995 09/2045 7.150% 562 562369 Chief Joseph 09/1995 09/2045 7.150% 712 712370 Chief Joseph 09/1995 09/2045 7.150% 784 784371 Chief Joseph 09/1996 09/2031 7.150% 27 0372 Chief Joseph 09/1996 09/2046 7.150% 3 3373 Chief Joseph 09/1996 09/2046 7.150% 4 4374 Chief Joseph 09/1996 09/2046 7.150% 355 355375 Chief Joseph 09/1996 09/2046 7.150% 729 729376 Chief Joseph 09/1997 09/2032 7.150% 166 0377 Chief Joseph 09/1997 09/2047 7.150% 657 657378 Chief Joseph 09/2001 09/2051 5.875% 345 345379 Chief Joseph 09/2002 09/2052 5.500% 2 2380 Chief Joseph 09/2003 09/2053 5.125% 992 992381 Chief Joseph 09/2008 09/2058 4.875% 3,500 3,500382 Chief Joseph 09/2009 09/2059 4.375% 24,727 24,727383 Chief Joseph 09/2011 09/2061 3.750% 4 4384 Chief Joseph 09/2012 09/2062 3.375% 28 28385 Chief Joseph 09/2013 09/2063 2.875% 10 10386 Columbia Basin 09/1941 09/1991 3.000% 10,919 0387 Columbia Basin 09/1941 09/1991 3.000% 1,505 0388 Columbia Basin 09/1942 09/1992 3.000% 16,165 0389 Columbia Basin 09/1942 09/1992 3.000% 3,011 0390 Columbia Basin 09/1943 09/1993 3.000% 8,083 0391 Columbia Basin 09/1943 09/1993 3.000% 1,505 0392 Columbia Basin 09/1944 09/1994 3.000% 16,165 0393 Columbia Basin 09/1944 09/1994 3.000% 3,011 0394 Columbia Basin 09/1948 09/1998 3.000% 24,247 0395 Columbia Basin 09/1948 09/1998 3.000% 4,516 0396 Columbia Basin 09/1949 09/1999 3.000% 24,247 0397 Columbia Basin 09/1949 09/1999 3.000% 4,516 0398 Columbia Basin 09/1950 09/2000 3.000% 16,165 0399 Columbia Basin 09/1950 09/2000 3.000% 3,011 0400 Columbia Basin 09/1951 09/2001 6.710% 28,255 0401 Columbia Basin 09/1951 09/2001 6.710% 5,790 0402 Columbia Basin 09/1952 09/2001 6.710% 258 0403 Columbia Basin 09/1952 09/2001 6.710% 48 0404 Columbia Basin 09/1953 09/2001 6.710% 258 0405 Columbia Basin 09/1953 09/2001 6.710% 48 0406 Columbia Basin 09/1954 09/2001 6.710% 258 0407 Columbia Basin 09/1954 09/2001 6.710% 48 0408 Columbia Basin 09/1955 09/2001 6.710% 258 0409 Columbia Basin 09/1955 09/2001 6.710% 48 0410 Columbia Basin 09/1956 09/2001 6.710% 259 0411 Columbia Basin 09/1956 09/2001 6.710% 48 0412 Columbia Basin 09/1957 09/2001 6.710% 258 0413 Columbia Basin 09/1957 09/2001 6.710% 48 0414 Columbia Basin 09/1958 09/2001 6.710% 258 0415 Columbia Basin 09/1958 09/2001 6.710% 48 0
BP-18-FS-BPA-02A Page 193

TABLE 13A:
HISTORICAL INVESTMENTS, SHIFT STUDY
October 1, 2015 - September 30, 2019 Cost Evaluation period
($000s) (FY 2019)
A B C D E F G H
Project
In Service
Date
Due
Date
Interest
Rate
Initial
Principal Current Principal
Roll Maturity
Date
Rollover
Rate
416 Columbia Basin 09/1959 09/2001 6.710% 258 0417 Columbia Basin 09/1959 09/2001 6.710% 48 0418 Columbia Basin 09/1960 09/2001 6.710% 258 0419 Columbia Basin 09/1960 09/2001 6.710% 48 0420 Columbia Basin 09/1961 09/2001 6.710% 259 0421 Columbia Basin 09/1961 09/2001 6.710% 48 0422 Columbia Basin 09/1962 09/2001 6.710% 258 0423 Columbia Basin 09/1962 09/2001 6.710% 48 0424 Columbia Basin 09/1963 09/2001 6.710% 258 0425 Columbia Basin 09/1963 09/2001 6.710% 48 0426 Columbia Basin 09/1964 09/2001 6.710% 258 0427 Columbia Basin 09/1964 09/2001 6.710% 48 0428 Columbia Basin 09/1965 09/2001 6.710% 258 0429 Columbia Basin 09/1965 09/2001 6.710% 48 0430 Columbia Basin 09/1966 09/2001 6.710% 259 0431 Columbia Basin 09/1966 09/2001 6.710% 48 0432 Columbia Basin 09/1967 09/2001 6.710% 258 0433 Columbia Basin 09/1967 09/2001 6.710% 48 0434 Columbia Basin 09/1967 09/2017 7.290% 758 0435 Columbia Basin 09/1968 09/2001 6.710% 258 0436 Columbia Basin 09/1968 09/2001 6.710% 48 0437 Columbia Basin 09/1969 09/2001 6.710% 258 0438 Columbia Basin 09/1969 09/2001 6.710% 48 0439 Columbia Basin 09/1970 09/2001 6.710% 258 0440 Columbia Basin 09/1970 09/2001 6.710% 48 0441 Columbia Basin 09/1971 09/2001 6.710% 259 0442 Columbia Basin 09/1971 09/2001 6.710% 48 0443 Columbia Basin 09/1972 09/2001 6.710% 258 0444 Columbia Basin 09/1972 09/2001 6.710% 48 0445 Columbia Basin 09/1973 09/2001 6.710% 258 0446 Columbia Basin 09/1973 09/2001 6.710% 48 0447 Columbia Basin 09/1974 09/2001 6.710% 258 0448 Columbia Basin 09/1974 09/2001 6.710% 48 0449 Columbia Basin 09/1975 09/2001 6.710% 258 0450 Columbia Basin 09/1975 09/2001 6.710% 48 0451 Columbia Basin 09/1976 09/2001 6.710% 259 0452 Columbia Basin 09/1976 09/2001 6.710% 48 0453 Columbia Basin 09/1977 09/2001 6.710% 258 0454 Columbia Basin 09/1977 09/2001 6.710% 48 0455 Columbia Basin 09/1978 09/2001 6.710% 258 0456 Columbia Basin 09/1978 09/2001 6.710% 48 0457 Columbia Basin 09/1979 09/2001 6.710% 258 0458 Columbia Basin 09/1979 09/2001 6.710% 48 0459 Columbia Basin 09/1980 09/2001 6.710% 258 0460 Columbia Basin 09/1980 09/2001 6.710% 48 0461 Columbia Basin 09/1981 09/2001 6.710% 259 0462 Columbia Basin 09/1981 09/2001 6.710% 48 0463 Columbia Basin 09/1982 09/2001 6.710% 258 0464 Columbia Basin 09/1982 09/2001 6.710% 48 0465 Columbia Basin 09/1983 09/2001 6.710% 258 0466 Columbia Basin 09/1983 09/2001 6.710% 48 0467 Columbia Basin 09/1984 09/2001 10.750% 7,815 0468 Columbia Basin 09/1984 09/2001 10.750% 1,455 0469 Columbia Basin 09/1985 09/2001 6.710% 236 0470 Columbia Basin 09/1985 09/2001 6.710% 11 0471 Columbia Basin 09/1985 09/2001 12.375% 7,338 0472 Columbia Basin 09/1985 09/2001 12.375% 362 0473 Columbia Basin 09/1986 09/2001 6.710% 127 0474 Columbia Basin 09/1987 09/2001 6.710% 13 0475 Columbia Basin 09/1988 09/2001 8.500% 184 0476 Columbia Basin 09/1988 09/2001 8.500% 2 0477 Columbia Basin 09/1989 09/2001 9.250% 1,166 0478 Columbia Basin 09/1990 09/2001 8.875% 928 0479 Columbia Basin 09/1991 09/2001 8.750% 177 0480 Columbia Basin 09/1991 09/2001 8.750% 1,661 0481 Columbia Basin 09/1992 09/2001 8.500% 445 0482 Columbia Basin 09/1992 09/2001 8.500% 652 0483 Columbia Basin 09/1993 09/2001 6.710% 792 0484 Columbia Basin 09/1995 09/2000 6.620% 25 0485 Columbia Basin 09/1995 09/2020 7.250% 206 0486 Columbia Basin 09/1995 09/2030 7.150% 25 0487 Columbia Basin 09/1995 09/2030 7.860% 270 0488 Columbia Basin 09/1995 09/2030 7.860% 321 0489 Columbia Basin 09/1995 09/2030 7.860% 323 0490 Columbia Basin 09/1995 09/2030 7.860% 20 0491 Columbia Basin 09/1995 09/2045 7.150% 287 287492 Columbia Basin 09/1995 09/2045 7.150% 2,511 2,453493 Columbia Basin 09/1995 09/2045 7.860% 450 0494 Columbia Basin 09/1995 09/2045 7.860% 450 0495 Columbia Basin 09/1996 09/2026 7.150% 72 0496 Columbia Basin 09/1996 09/2031 7.150% 109 0497 Columbia Basin 09/1996 09/2031 7.150% 251 0498 Columbia Basin 09/1996 09/2046 7.150% 426 426
BP-18-FS-BPA-02A Page 194

TABLE 13A:
HISTORICAL INVESTMENTS, SHIFT STUDY
October 1, 2015 - September 30, 2019 Cost Evaluation period
($000s) (FY 2019)
A B C D E F G H
Project
In Service
Date
Due
Date
Interest
Rate
Initial
Principal Current Principal
Roll Maturity
Date
Rollover
Rate
499 Columbia Basin 09/1996 09/2046 7.150% 368 368500 Columbia Basin 09/1997 09/2047 7.150% 3,393 3,393501 Columbia Basin 09/2001 09/2051 5.875% 69,226 69,226502 Columbia Basin 09/2005 09/2055 5.125% 10,963 10,963503 Columbia Basin 09/2006 09/2056 4.500% 1,987 1,987504 Columbia Basin 09/2007 09/2057 5.000% 929 929505 Columbia Basin 09/2008 09/2058 4.875% 835 835506 Columbia Basin 09/2009 09/2059 4.375% 1,338 1,338507 Columbia Basin 09/2010 09/2060 4.250% 877 877508 Columbia Basin 09/2011 09/2061 3.750% 1,723 1,723509 Columbia Basin 09/2012 09/2062 3.375% 11 11510 Columbia Basin 09/2013 09/2063 2.875% 3,083 3,083511 Columbia Basin 09/2014 09/2064 3.875% 18 18512 Columbia Basin 09/2015 09/2065 3.250% 0 0513 Columbia Basin 3rd Powerhouse 09/1975 09/2025 7.160% 47,328 0514 Columbia Basin 3rd Powerhouse 09/1975 09/2025 7.160% 8,702 0515 Columbia Basin 3rd Powerhouse 09/1976 09/2026 7.150% 41,330 0516 Columbia Basin 3rd Powerhouse 09/1976 09/2026 7.150% 8,037 0517 Columbia Basin 3rd Powerhouse 09/1977 09/2027 7.150% 42,764 0518 Columbia Basin 3rd Powerhouse 09/1977 09/2027 7.150% 7,964 0519 Columbia Basin 3rd Powerhouse 09/1978 09/2028 7.150% 42,399 0520 Columbia Basin 3rd Powerhouse 09/1978 09/2028 7.150% 7,896 0521 Columbia Basin 3rd Powerhouse 09/1979 09/2029 7.150% 84,118 0522 Columbia Basin 3rd Powerhouse 09/1979 09/2029 7.150% 15,666 0523 Columbia Basin 3rd Powerhouse 09/1983 09/2033 7.150% 712 0524 Columbia Basin 3rd Powerhouse 09/1983 09/2033 7.150% 13,003 0525 Columbia Basin 3rd Powerhouse 09/1984 09/2033 7.150% 16,965 0526 Columbia Basin 3rd Powerhouse 09/1984 09/2033 7.150% 13,192 0527 Columbia Basin 3rd Powerhouse 09/1984 09/2033 7.150% 3,160 0528 Columbia Basin 3rd Powerhouse 09/1985 09/2033 7.150% 2,060 0529 Columbia Basin 3rd Powerhouse 09/1985 09/2033 7.150% 41,772 0530 Columbia Basin 3rd Powerhouse 09/1985 09/2033 7.150% 107 0531 Columbia Basin 3rd Powerhouse 09/1986 09/2033 7.150% 1,851 0532 Columbia Basin 3rd Powerhouse 09/1986 09/2033 7.150% 15,538 0533 Columbia Basin 3rd Powerhouse 09/1987 09/2033 7.150% 1,730 0534 Columbia Basin 3rd Powerhouse 09/1987 09/2033 7.150% 14,439 0535 Columbia Basin 3rd Powerhouse 09/1988 09/2033 7.150% 2,294 0536 Columbia Basin 3rd Powerhouse 09/1988 09/2033 7.150% 4,351 0537 Columbia Basin 3rd Powerhouse 09/1989 09/2033 7.150% 10,902 0538 Columbia Basin 3rd Powerhouse 09/1990 09/2033 7.150% 6,383 0539 Columbia Basin 3rd Powerhouse 09/1994 09/2044 7.150% 12,631 12,631540 Columbia River Fish Mitigation 09/1991 09/2041 8.500% 3,969 0541 Columbia River Fish Mitigation 09/1992 09/2042 8.500% 874 0542 Columbia River Fish Mitigation 09/1993 09/2043 8.500% 85,846 0543 Columbia River Fish Mitigation 09/1994 09/2044 8.500% 39,454 0544 Columbia River Fish Mitigation 09/1995 09/2045 7.150% 43,343 39,282545 Columbia River Fish Mitigation 09/1996 09/2046 7.150% 2,431 2,431546 Columbia River Fish Mitigation 09/1999 09/2049 5.375% 14,115 14,115547 Columbia River Fish Mitigation 09/2000 09/2050 6.125% 47,006 47,006548 Columbia River Fish Mitigation 09/2001 09/2051 5.875% 6,168 6,168549 Columbia River Fish Mitigation 09/2002 09/2052 5.500% 8,797 8,797550 Columbia River Fish Mitigation 09/2003 09/2053 5.125% 68,440 68,440551 Columbia River Fish Mitigation 09/2004 09/2054 5.375% 60,581 60,581552 Columbia River Fish Mitigation 09/2005 09/2055 5.125% 52,039 52,039553 Columbia River Fish Mitigation 09/2006 09/2056 4.500% 366,395 366,395554 Columbia River Fish Mitigation 09/2007 09/2057 5.000% 53,525 53,525555 Columbia River Fish Mitigation 09/2008 09/2058 4.875% 36,554 36,554556 Columbia River Fish Mitigation 09/2009 09/2059 4.375% 103,203 103,203557 Columbia River Fish Mitigation 09/2010 09/2060 4.250% 56,832 56,832558 Columbia River Fish Mitigation 09/2011 09/2061 3.750% 106,014 106,014559 Columbia River Fish Mitigation 09/2012 09/2062 3.375% 101,616 101,616560 Columbia River Fish Mitigation 09/2013 09/2063 2.875% 95,274 95,274561 Columbia River Fish Mitigation 09/2014 09/2064 3.875% 110,071 110,071562 Columbia River Fish Mitigation 09/2015 09/2065 3.250% 64,291 64,291563 Columbia River Fish Mitigation 09/2016 09/2066 3.000% 30,190 30,190564 Cougar 09/1964 09/2014 7.230% 10,414 0565 Cougar 09/1965 09/2014 7.230% 20 0566 Cougar 09/1966 09/2014 7.230% 20 0567 Cougar 09/1967 09/2014 7.230% 20 0568 Cougar 09/1968 09/2014 7.230% 20 0569 Cougar 09/1969 09/2014 7.230% 20 0570 Cougar 09/1970 09/2014 7.230% 20 0571 Cougar 09/1971 09/2014 7.230% 20 0572 Cougar 09/1972 09/2014 7.230% 20 0573 Cougar 09/1973 09/2014 7.230% 20 0574 Cougar 09/1974 09/2014 7.230% 19 0575 Cougar 09/1975 09/2014 7.230% 20 0576 Cougar 09/1976 09/2014 7.230% 20 0577 Cougar 09/1977 09/2014 7.230% 20 0578 Cougar 09/1978 09/2014 7.230% 20 0579 Cougar 09/1979 09/2014 7.230% 20 0580 Cougar 09/1980 09/2014 7.230% 20 0581 Cougar 09/1981 09/2014 7.230% 20 0
BP-18-FS-BPA-02A Page 195
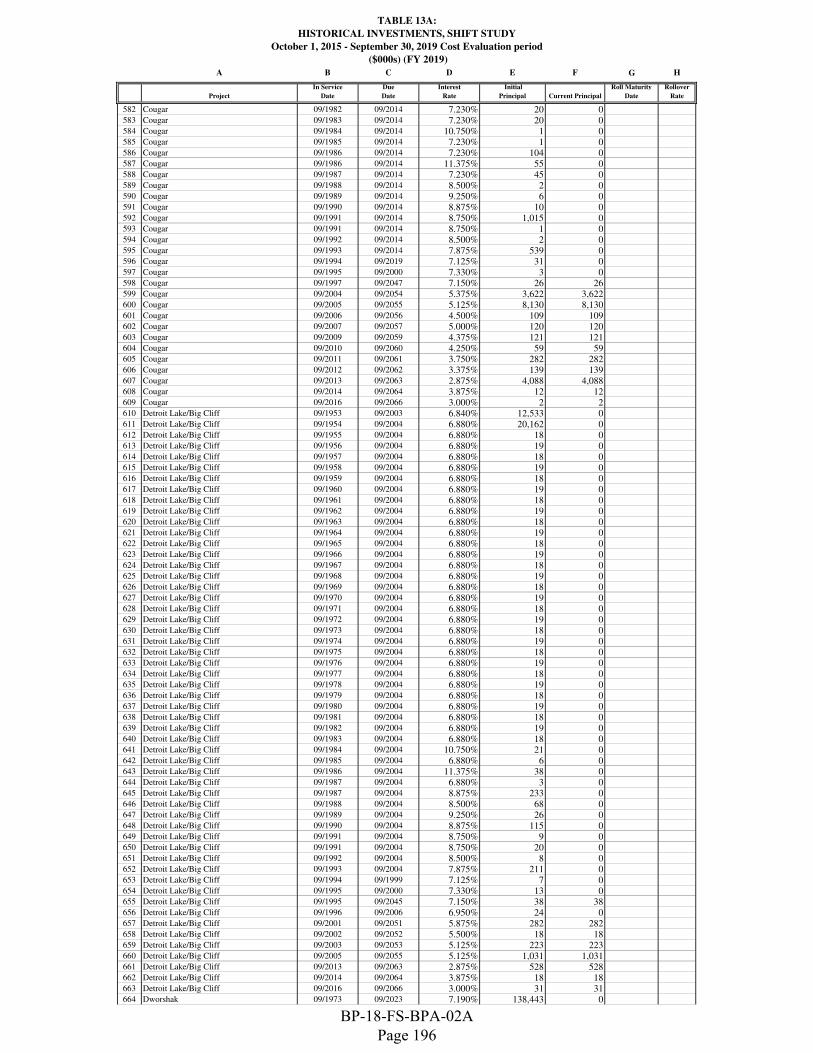
TABLE 13A:
HISTORICAL INVESTMENTS, SHIFT STUDY
October 1, 2015 - September 30, 2019 Cost Evaluation period
($000s) (FY 2019)
A B C D E F G H
Project
In Service
Date
Due
Date
Interest
Rate
Initial
Principal Current Principal
Roll Maturity
Date
Rollover
Rate
582 Cougar 09/1982 09/2014 7.230% 20 0583 Cougar 09/1983 09/2014 7.230% 20 0584 Cougar 09/1984 09/2014 10.750% 1 0585 Cougar 09/1985 09/2014 7.230% 1 0586 Cougar 09/1986 09/2014 7.230% 104 0587 Cougar 09/1986 09/2014 11.375% 55 0588 Cougar 09/1987 09/2014 7.230% 45 0589 Cougar 09/1988 09/2014 8.500% 2 0590 Cougar 09/1989 09/2014 9.250% 6 0591 Cougar 09/1990 09/2014 8.875% 10 0592 Cougar 09/1991 09/2014 8.750% 1,015 0593 Cougar 09/1991 09/2014 8.750% 1 0594 Cougar 09/1992 09/2014 8.500% 2 0595 Cougar 09/1993 09/2014 7.875% 539 0596 Cougar 09/1994 09/2019 7.125% 31 0597 Cougar 09/1995 09/2000 7.330% 3 0598 Cougar 09/1997 09/2047 7.150% 26 26599 Cougar 09/2004 09/2054 5.375% 3,622 3,622600 Cougar 09/2005 09/2055 5.125% 8,130 8,130601 Cougar 09/2006 09/2056 4.500% 109 109602 Cougar 09/2007 09/2057 5.000% 120 120603 Cougar 09/2009 09/2059 4.375% 121 121604 Cougar 09/2010 09/2060 4.250% 59 59605 Cougar 09/2011 09/2061 3.750% 282 282606 Cougar 09/2012 09/2062 3.375% 139 139607 Cougar 09/2013 09/2063 2.875% 4,088 4,088608 Cougar 09/2014 09/2064 3.875% 12 12609 Cougar 09/2016 09/2066 3.000% 2 2610 Detroit Lake/Big Cliff 09/1953 09/2003 6.840% 12,533 0611 Detroit Lake/Big Cliff 09/1954 09/2004 6.880% 20,162 0612 Detroit Lake/Big Cliff 09/1955 09/2004 6.880% 18 0613 Detroit Lake/Big Cliff 09/1956 09/2004 6.880% 19 0614 Detroit Lake/Big Cliff 09/1957 09/2004 6.880% 18 0615 Detroit Lake/Big Cliff 09/1958 09/2004 6.880% 19 0616 Detroit Lake/Big Cliff 09/1959 09/2004 6.880% 18 0617 Detroit Lake/Big Cliff 09/1960 09/2004 6.880% 19 0618 Detroit Lake/Big Cliff 09/1961 09/2004 6.880% 18 0619 Detroit Lake/Big Cliff 09/1962 09/2004 6.880% 19 0620 Detroit Lake/Big Cliff 09/1963 09/2004 6.880% 18 0621 Detroit Lake/Big Cliff 09/1964 09/2004 6.880% 19 0622 Detroit Lake/Big Cliff 09/1965 09/2004 6.880% 18 0623 Detroit Lake/Big Cliff 09/1966 09/2004 6.880% 19 0624 Detroit Lake/Big Cliff 09/1967 09/2004 6.880% 18 0625 Detroit Lake/Big Cliff 09/1968 09/2004 6.880% 19 0626 Detroit Lake/Big Cliff 09/1969 09/2004 6.880% 18 0627 Detroit Lake/Big Cliff 09/1970 09/2004 6.880% 19 0628 Detroit Lake/Big Cliff 09/1971 09/2004 6.880% 18 0629 Detroit Lake/Big Cliff 09/1972 09/2004 6.880% 19 0630 Detroit Lake/Big Cliff 09/1973 09/2004 6.880% 18 0631 Detroit Lake/Big Cliff 09/1974 09/2004 6.880% 19 0632 Detroit Lake/Big Cliff 09/1975 09/2004 6.880% 18 0633 Detroit Lake/Big Cliff 09/1976 09/2004 6.880% 19 0634 Detroit Lake/Big Cliff 09/1977 09/2004 6.880% 18 0635 Detroit Lake/Big Cliff 09/1978 09/2004 6.880% 19 0636 Detroit Lake/Big Cliff 09/1979 09/2004 6.880% 18 0637 Detroit Lake/Big Cliff 09/1980 09/2004 6.880% 19 0638 Detroit Lake/Big Cliff 09/1981 09/2004 6.880% 18 0639 Detroit Lake/Big Cliff 09/1982 09/2004 6.880% 19 0640 Detroit Lake/Big Cliff 09/1983 09/2004 6.880% 18 0641 Detroit Lake/Big Cliff 09/1984 09/2004 10.750% 21 0642 Detroit Lake/Big Cliff 09/1985 09/2004 6.880% 6 0643 Detroit Lake/Big Cliff 09/1986 09/2004 11.375% 38 0644 Detroit Lake/Big Cliff 09/1987 09/2004 6.880% 3 0645 Detroit Lake/Big Cliff 09/1987 09/2004 8.875% 233 0646 Detroit Lake/Big Cliff 09/1988 09/2004 8.500% 68 0647 Detroit Lake/Big Cliff 09/1989 09/2004 9.250% 26 0648 Detroit Lake/Big Cliff 09/1990 09/2004 8.875% 115 0649 Detroit Lake/Big Cliff 09/1991 09/2004 8.750% 9 0650 Detroit Lake/Big Cliff 09/1991 09/2004 8.750% 20 0651 Detroit Lake/Big Cliff 09/1992 09/2004 8.500% 8 0652 Detroit Lake/Big Cliff 09/1993 09/2004 7.875% 211 0653 Detroit Lake/Big Cliff 09/1994 09/1999 7.125% 7 0654 Detroit Lake/Big Cliff 09/1995 09/2000 7.330% 13 0655 Detroit Lake/Big Cliff 09/1995 09/2045 7.150% 38 38656 Detroit Lake/Big Cliff 09/1996 09/2006 6.950% 24 0657 Detroit Lake/Big Cliff 09/2001 09/2051 5.875% 282 282658 Detroit Lake/Big Cliff 09/2002 09/2052 5.500% 18 18659 Detroit Lake/Big Cliff 09/2003 09/2053 5.125% 223 223660 Detroit Lake/Big Cliff 09/2005 09/2055 5.125% 1,031 1,031661 Detroit Lake/Big Cliff 09/2013 09/2063 2.875% 528 528662 Detroit Lake/Big Cliff 09/2014 09/2064 3.875% 18 18663 Detroit Lake/Big Cliff 09/2016 09/2066 3.000% 31 31664 Dworshak 09/1973 09/2023 7.190% 138,443 0
BP-18-FS-BPA-02A Page 196

TABLE 13A:
HISTORICAL INVESTMENTS, SHIFT STUDY
October 1, 2015 - September 30, 2019 Cost Evaluation period
($000s) (FY 2019)
A B C D E F G H
Project
In Service
Date
Due
Date
Interest
Rate
Initial
Principal Current Principal
Roll Maturity
Date
Rollover
Rate
665 Dworshak 09/1973 09/2023 7.190% 836 0666 Dworshak 09/1974 09/2023 7.190% 515 0667 Dworshak 09/1974 09/2023 7.190% 3 0668 Dworshak 09/1975 09/2023 7.190% 518 0669 Dworshak 09/1975 09/2023 7.190% 3 0670 Dworshak 09/1976 09/2023 7.190% 518 0671 Dworshak 09/1976 09/2023 7.190% 3 0672 Dworshak 09/1977 09/2023 7.190% 518 0673 Dworshak 09/1977 09/2023 7.190% 3 0674 Dworshak 09/1978 09/2023 7.190% 518 0675 Dworshak 09/1978 09/2023 7.190% 3 0676 Dworshak 09/1979 09/2023 7.190% 518 0677 Dworshak 09/1979 09/2023 7.190% 3 0678 Dworshak 09/1980 09/2023 7.190% 518 0679 Dworshak 09/1980 09/2023 7.190% 3 0680 Dworshak 09/1981 09/2023 7.190% 518 0681 Dworshak 09/1981 09/2023 7.190% 3 0682 Dworshak 09/1982 09/2023 7.190% 518 0683 Dworshak 09/1982 09/2023 7.190% 3 0684 Dworshak 09/1983 09/2023 7.190% 523 0685 Dworshak 09/1983 09/2023 7.190% 3 0686 Dworshak 09/1984 09/2023 10.750% 2,499 0687 Dworshak 09/1984 09/2023 10.750% 15 0688 Dworshak 09/1985 09/2023 7.190% 1,141 0689 Dworshak 09/1986 09/2023 7.190% 197 0690 Dworshak 09/1987 09/2023 7.190% 36 0691 Dworshak 09/1987 09/2023 8.875% 65 0692 Dworshak 09/1988 09/2023 8.500% 61 0693 Dworshak 09/1989 09/2023 9.250% 63 0694 Dworshak 09/1990 09/2023 8.875% 245 0695 Dworshak 09/1990 09/2023 8.875% 24 0696 Dworshak 09/1991 09/2023 8.750% 224 0697 Dworshak 09/1992 09/2023 2.625% 4 0698 Dworshak 09/1992 09/2023 8.500% 28 0699 Dworshak 09/1992 09/2023 8.500% 24 0700 Dworshak 09/1993 09/2023 7.875% 41 0701 Dworshak 09/1993 09/2023 7.875% 1,872 0702 Dworshak 09/1994 09/2029 7.125% 1,351 0703 Dworshak 09/1994 09/2029 7.125% 964 0704 Dworshak 09/1995 09/2020 7.930% 55 0705 Dworshak 09/1995 09/2030 7.150% 218 0706 Dworshak 09/1995 09/2045 7.150% 1,162 1,162707 Dworshak 09/1996 09/2011 7.130% 107 0708 Dworshak 09/1996 09/2021 7.230% 26 0709 Dworshak 09/1996 09/2021 7.230% 184 0710 Dworshak 09/1996 09/2031 7.150% 6 0711 Dworshak 09/1996 09/2031 7.150% 203 0712 Dworshak 09/1996 09/2046 7.150% 3 3713 Dworshak 09/1996 09/2046 7.150% 4 4714 Dworshak 09/1996 09/2046 7.150% 46 46715 Dworshak 09/1997 09/2047 7.150% 7,588 7,588716 Dworshak 09/1999 09/2049 5.375% 630 630717 Dworshak 09/2002 09/2052 5.500% 199 199718 Dworshak 09/2003 09/2053 5.125% 761 761719 Dworshak 09/2005 09/2055 5.125% 713 713720 Dworshak 09/2006 09/2056 4.500% 73 73721 Dworshak 09/2008 09/2058 4.875% 10 10722 Dworshak 09/2009 09/2059 4.375% 2,307 2,307723 Dworshak 09/2014 09/2064 3.875% 50 0724 Green Peter/Foster 09/1967 09/2017 7.290% 24,445 0725 Green Peter/Foster 09/1968 09/2018 7.280% 12,180 0726 Green Peter/Foster 09/1969 09/2018 7.280% 39 0727 Green Peter/Foster 09/1970 09/2018 7.280% 40 0728 Green Peter/Foster 09/1971 09/2018 7.280% 39 0729 Green Peter/Foster 09/1972 09/2018 7.280% 39 0730 Green Peter/Foster 09/1973 09/2018 7.280% 39 0731 Green Peter/Foster 09/1974 09/2018 7.280% 39 0732 Green Peter/Foster 09/1975 09/2018 7.280% 39 0733 Green Peter/Foster 09/1976 09/2018 7.280% 39 0734 Green Peter/Foster 09/1977 09/2018 7.280% 39 0735 Green Peter/Foster 09/1978 09/2018 7.280% 39 0736 Green Peter/Foster 09/1979 09/2018 7.280% 39 0737 Green Peter/Foster 09/1980 09/2018 7.280% 40 0738 Green Peter/Foster 09/1981 09/2018 7.280% 39 0739 Green Peter/Foster 09/1982 09/2018 7.280% 39 0740 Green Peter/Foster 09/1983 09/2018 7.280% 39 0741 Green Peter/Foster 09/1984 09/2018 10.750% 15 0742 Green Peter/Foster 09/1985 09/2018 7.280% 16 0743 Green Peter/Foster 09/1986 09/2018 7.280% 3 0744 Green Peter/Foster 09/1986 09/2018 11.375% 3 0745 Green Peter/Foster 09/1987 09/2018 7.280% 1 0746 Green Peter/Foster 09/1987 09/2018 8.875% 2 0747 Green Peter/Foster 09/1988 09/2018 8.500% 13 0
BP-18-FS-BPA-02A Page 197
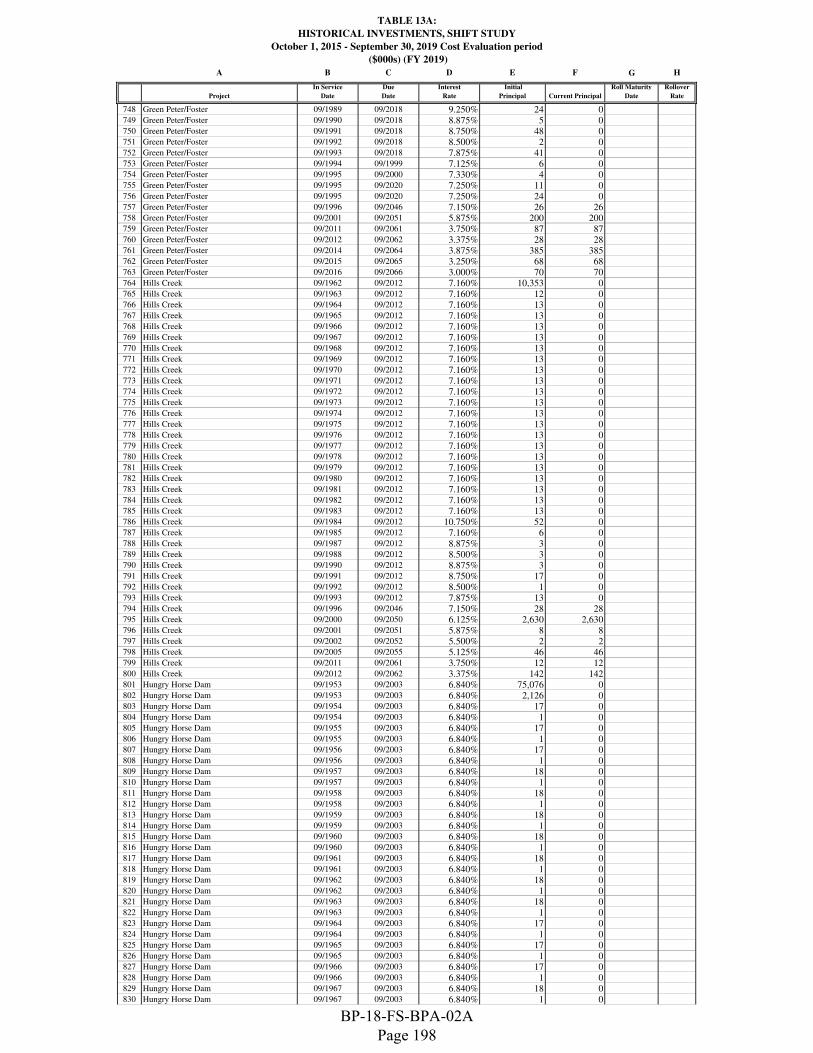
TABLE 13A:
HISTORICAL INVESTMENTS, SHIFT STUDY
October 1, 2015 - September 30, 2019 Cost Evaluation period
($000s) (FY 2019)
A B C D E F G H
Project
In Service
Date
Due
Date
Interest
Rate
Initial
Principal Current Principal
Roll Maturity
Date
Rollover
Rate
748 Green Peter/Foster 09/1989 09/2018 9.250% 24 0749 Green Peter/Foster 09/1990 09/2018 8.875% 5 0750 Green Peter/Foster 09/1991 09/2018 8.750% 48 0751 Green Peter/Foster 09/1992 09/2018 8.500% 2 0752 Green Peter/Foster 09/1993 09/2018 7.875% 41 0753 Green Peter/Foster 09/1994 09/1999 7.125% 6 0754 Green Peter/Foster 09/1995 09/2000 7.330% 4 0755 Green Peter/Foster 09/1995 09/2020 7.250% 11 0756 Green Peter/Foster 09/1995 09/2020 7.250% 24 0757 Green Peter/Foster 09/1996 09/2046 7.150% 26 26758 Green Peter/Foster 09/2001 09/2051 5.875% 200 200759 Green Peter/Foster 09/2011 09/2061 3.750% 87 87760 Green Peter/Foster 09/2012 09/2062 3.375% 28 28761 Green Peter/Foster 09/2014 09/2064 3.875% 385 385762 Green Peter/Foster 09/2015 09/2065 3.250% 68 68763 Green Peter/Foster 09/2016 09/2066 3.000% 70 70764 Hills Creek 09/1962 09/2012 7.160% 10,353 0765 Hills Creek 09/1963 09/2012 7.160% 12 0766 Hills Creek 09/1964 09/2012 7.160% 13 0767 Hills Creek 09/1965 09/2012 7.160% 13 0768 Hills Creek 09/1966 09/2012 7.160% 13 0769 Hills Creek 09/1967 09/2012 7.160% 13 0770 Hills Creek 09/1968 09/2012 7.160% 13 0771 Hills Creek 09/1969 09/2012 7.160% 13 0772 Hills Creek 09/1970 09/2012 7.160% 13 0773 Hills Creek 09/1971 09/2012 7.160% 13 0774 Hills Creek 09/1972 09/2012 7.160% 13 0775 Hills Creek 09/1973 09/2012 7.160% 13 0776 Hills Creek 09/1974 09/2012 7.160% 13 0777 Hills Creek 09/1975 09/2012 7.160% 13 0778 Hills Creek 09/1976 09/2012 7.160% 13 0779 Hills Creek 09/1977 09/2012 7.160% 13 0780 Hills Creek 09/1978 09/2012 7.160% 13 0781 Hills Creek 09/1979 09/2012 7.160% 13 0782 Hills Creek 09/1980 09/2012 7.160% 13 0783 Hills Creek 09/1981 09/2012 7.160% 13 0784 Hills Creek 09/1982 09/2012 7.160% 13 0785 Hills Creek 09/1983 09/2012 7.160% 13 0786 Hills Creek 09/1984 09/2012 10.750% 52 0787 Hills Creek 09/1985 09/2012 7.160% 6 0788 Hills Creek 09/1987 09/2012 8.875% 3 0789 Hills Creek 09/1988 09/2012 8.500% 3 0790 Hills Creek 09/1990 09/2012 8.875% 3 0791 Hills Creek 09/1991 09/2012 8.750% 17 0792 Hills Creek 09/1992 09/2012 8.500% 1 0793 Hills Creek 09/1993 09/2012 7.875% 13 0794 Hills Creek 09/1996 09/2046 7.150% 28 28795 Hills Creek 09/2000 09/2050 6.125% 2,630 2,630796 Hills Creek 09/2001 09/2051 5.875% 8 8797 Hills Creek 09/2002 09/2052 5.500% 2 2798 Hills Creek 09/2005 09/2055 5.125% 46 46799 Hills Creek 09/2011 09/2061 3.750% 12 12800 Hills Creek 09/2012 09/2062 3.375% 142 142801 Hungry Horse Dam 09/1953 09/2003 6.840% 75,076 0802 Hungry Horse Dam 09/1953 09/2003 6.840% 2,126 0803 Hungry Horse Dam 09/1954 09/2003 6.840% 17 0804 Hungry Horse Dam 09/1954 09/2003 6.840% 1 0805 Hungry Horse Dam 09/1955 09/2003 6.840% 17 0806 Hungry Horse Dam 09/1955 09/2003 6.840% 1 0807 Hungry Horse Dam 09/1956 09/2003 6.840% 17 0808 Hungry Horse Dam 09/1956 09/2003 6.840% 1 0809 Hungry Horse Dam 09/1957 09/2003 6.840% 18 0810 Hungry Horse Dam 09/1957 09/2003 6.840% 1 0811 Hungry Horse Dam 09/1958 09/2003 6.840% 18 0812 Hungry Horse Dam 09/1958 09/2003 6.840% 1 0813 Hungry Horse Dam 09/1959 09/2003 6.840% 18 0814 Hungry Horse Dam 09/1959 09/2003 6.840% 1 0815 Hungry Horse Dam 09/1960 09/2003 6.840% 18 0816 Hungry Horse Dam 09/1960 09/2003 6.840% 1 0817 Hungry Horse Dam 09/1961 09/2003 6.840% 18 0818 Hungry Horse Dam 09/1961 09/2003 6.840% 1 0819 Hungry Horse Dam 09/1962 09/2003 6.840% 18 0820 Hungry Horse Dam 09/1962 09/2003 6.840% 1 0821 Hungry Horse Dam 09/1963 09/2003 6.840% 18 0822 Hungry Horse Dam 09/1963 09/2003 6.840% 1 0823 Hungry Horse Dam 09/1964 09/2003 6.840% 17 0824 Hungry Horse Dam 09/1964 09/2003 6.840% 1 0825 Hungry Horse Dam 09/1965 09/2003 6.840% 17 0826 Hungry Horse Dam 09/1965 09/2003 6.840% 1 0827 Hungry Horse Dam 09/1966 09/2003 6.840% 17 0828 Hungry Horse Dam 09/1966 09/2003 6.840% 1 0829 Hungry Horse Dam 09/1967 09/2003 6.840% 18 0830 Hungry Horse Dam 09/1967 09/2003 6.840% 1 0
BP-18-FS-BPA-02A Page 198

TABLE 13A:
HISTORICAL INVESTMENTS, SHIFT STUDY
October 1, 2015 - September 30, 2019 Cost Evaluation period
($000s) (FY 2019)
A B C D E F G H
Project
In Service
Date
Due
Date
Interest
Rate
Initial
Principal Current Principal
Roll Maturity
Date
Rollover
Rate
831 Hungry Horse Dam 09/1968 09/2003 6.840% 18 0832 Hungry Horse Dam 09/1968 09/2003 6.840% 1 0833 Hungry Horse Dam 09/1969 09/2003 6.840% 18 0834 Hungry Horse Dam 09/1969 09/2003 6.840% 1 0835 Hungry Horse Dam 09/1970 09/2003 6.840% 18 0836 Hungry Horse Dam 09/1970 09/2003 6.840% 1 0837 Hungry Horse Dam 09/1971 09/2003 6.840% 18 0838 Hungry Horse Dam 09/1971 09/2003 6.840% 1 0839 Hungry Horse Dam 09/1972 09/2003 6.840% 18 0840 Hungry Horse Dam 09/1972 09/2003 6.840% 1 0841 Hungry Horse Dam 09/1973 09/2003 6.840% 18 0842 Hungry Horse Dam 09/1973 09/2003 6.840% 1 0843 Hungry Horse Dam 09/1974 09/2003 6.840% 17 0844 Hungry Horse Dam 09/1974 09/2003 6.840% 1 0845 Hungry Horse Dam 09/1975 09/2003 6.840% 17 0846 Hungry Horse Dam 09/1975 09/2003 6.840% 1 0847 Hungry Horse Dam 09/1976 09/2003 6.840% 10 0848 Hungry Horse Dam 09/1976 09/2003 6.840% 1 0849 Hungry Horse Dam 09/1977 09/2003 6.840% 18 0850 Hungry Horse Dam 09/1977 09/2003 6.840% 1 0851 Hungry Horse Dam 09/1978 09/2003 6.840% 18 0852 Hungry Horse Dam 09/1978 09/2003 6.840% 1 0853 Hungry Horse Dam 09/1979 09/2003 6.840% 18 0854 Hungry Horse Dam 09/1979 09/2003 6.840% 1 0855 Hungry Horse Dam 09/1980 09/2003 6.840% 18 0856 Hungry Horse Dam 09/1980 09/2003 6.840% 1 0857 Hungry Horse Dam 09/1981 09/2003 6.840% 22 0858 Hungry Horse Dam 09/1981 09/2003 6.840% 1 0859 Hungry Horse Dam 09/1982 09/2003 6.840% 1 0860 Hungry Horse Dam 09/1983 09/2003 6.840% 12 0861 Hungry Horse Dam 09/1983 09/2003 6.840% 1 0862 Hungry Horse Dam 09/1984 09/2003 10.750% 32 0863 Hungry Horse Dam 09/1984 09/2003 10.750% 1 0864 Hungry Horse Dam 09/1985 09/2003 12.375% 36 0865 Hungry Horse Dam 09/1985 09/2003 12.375% 37 0866 Hungry Horse Dam 09/1989 09/2003 9.250% 101 0867 Hungry Horse Dam 09/1990 09/2003 8.875% 58 0868 Hungry Horse Dam 09/1991 09/2003 8.750% 19 0869 Hungry Horse Dam 09/1992 09/2003 8.500% 9 0870 Hungry Horse Dam 09/1993 09/2003 7.875% 4,136 0871 Hungry Horse Dam 09/1993 09/2003 7.875% 2 0872 Hungry Horse Dam 09/1994 09/2019 7.125% 56 0873 Hungry Horse Dam 09/1995 09/2000 6.620% 156 0874 Hungry Horse Dam 09/1995 09/2000 6.620% 84 0875 Hungry Horse Dam 09/1995 09/2020 7.930% 450 0876 Hungry Horse Dam 09/1995 09/2030 7.150% 536 0877 Hungry Horse Dam 09/1995 09/2030 7.150% 1,198 0878 Hungry Horse Dam 09/1995 09/2045 7.150% 6,190 6,190879 Hungry Horse Dam 09/1995 09/2045 7.860% 14,354 0880 Hungry Horse Dam 09/1996 09/2046 7.150% 15 15881 Hungry Horse Dam 09/1996 09/2046 7.150% 2 2882 Hungry Horse Dam 09/1997 09/2007 6.950% 154 0883 Hungry Horse Dam 09/1997 09/2047 7.150% 111 111884 Hungry Horse Dam 09/2001 09/2051 5.875% 552 552885 Hungry Horse Dam 09/2005 09/2055 5.125% 2,951 2,951886 Hungry Horse Dam 09/2007 09/2057 5.000% 294 294887 Hungry Horse Dam 09/2008 09/2058 4.875% 76 76888 Hungry Horse Dam 09/2009 09/2059 4.375% 60 60889 Hungry Horse Dam 09/2010 09/2060 4.250% 779 779890 Hungry Horse Dam 09/2011 09/2061 3.750% 503 503891 Hungry Horse Dam 09/2012 09/2062 3.375% 3 3892 Hungry Horse Dam 09/2014 09/2064 3.875% 12 12893 Hungry Horse Dam 09/2015 09/2065 3.250%894 Ice Harbor 09/1962 09/2012 7.160% 664 0895 Ice Harbor 09/1962 09/2012 7.160% 59,699 0896 Ice Harbor 09/1963 09/2012 7.160% 46 0897 Ice Harbor 09/1963 09/2012 7.160% 1 0898 Ice Harbor 09/1964 09/2012 7.160% 46 0899 Ice Harbor 09/1964 09/2012 7.160% 1 0900 Ice Harbor 09/1965 09/2012 7.160% 46 0901 Ice Harbor 09/1965 09/2012 7.160% 1 0902 Ice Harbor 09/1966 09/2012 7.160% 46 0903 Ice Harbor 09/1966 09/2012 7.160% 1 0904 Ice Harbor 09/1967 09/2012 7.160% 46 0905 Ice Harbor 09/1967 09/2012 7.160% 1 0906 Ice Harbor 09/1968 09/2012 7.160% 46 0907 Ice Harbor 09/1968 09/2012 7.160% 1 0908 Ice Harbor 09/1969 09/2012 7.160% 46 0909 Ice Harbor 09/1969 09/2012 7.160% 1 0910 Ice Harbor 09/1970 09/2012 7.160% 46 0911 Ice Harbor 09/1970 09/2012 7.160% 1 0912 Ice Harbor 09/1971 09/2012 7.160% 46 0913 Ice Harbor 09/1971 09/2012 7.160% 1 0
BP-18-FS-BPA-02A Page 199

TABLE 13A:
HISTORICAL INVESTMENTS, SHIFT STUDY
October 1, 2015 - September 30, 2019 Cost Evaluation period
($000s) (FY 2019)
A B C D E F G H
Project
In Service
Date
Due
Date
Interest
Rate
Initial
Principal Current Principal
Roll Maturity
Date
Rollover
Rate
914 Ice Harbor 09/1972 09/2012 7.160% 46 0915 Ice Harbor 09/1972 09/2012 7.160% 1 0916 Ice Harbor 09/1973 09/2012 7.160% 46 0917 Ice Harbor 09/1973 09/2012 7.160% 1 0918 Ice Harbor 09/1974 09/2012 7.160% 46 0919 Ice Harbor 09/1974 09/2012 7.160% 1 0920 Ice Harbor 09/1975 09/2012 7.160% 46 0921 Ice Harbor 09/1975 09/2012 7.160% 1 0922 Ice Harbor 09/1976 09/2012 7.160% 46 0923 Ice Harbor 09/1976 09/2012 7.160% 1 0924 Ice Harbor 09/1976 09/2026 7.150% 20,472 0925 Ice Harbor 09/1976 09/2026 7.150% 228 0926 Ice Harbor 09/1977 09/2012 7.160% 46 0927 Ice Harbor 09/1977 09/2012 7.160% 1 0928 Ice Harbor 09/1978 09/2012 7.160% 46 0929 Ice Harbor 09/1978 09/2012 7.160% 1 0930 Ice Harbor 09/1979 09/2012 7.160% 46 0931 Ice Harbor 09/1979 09/2012 7.160% 1 0932 Ice Harbor 09/1980 09/2012 7.160% 46 0933 Ice Harbor 09/1980 09/2012 7.160% 1 0934 Ice Harbor 09/1981 09/2012 7.160% 46 0935 Ice Harbor 09/1981 09/2012 7.160% 1 0936 Ice Harbor 09/1982 09/2012 7.160% 46 0937 Ice Harbor 09/1982 09/2012 7.160% 1 0938 Ice Harbor 09/1983 09/2012 7.160% 46 0939 Ice Harbor 09/1983 09/2012 7.160% 1 0940 Ice Harbor 09/1985 09/2012 7.160% 41 0941 Ice Harbor 09/1985 09/2026 7.150% 21 0942 Ice Harbor 09/1986 09/2012 7.160% 137 0943 Ice Harbor 09/1987 09/2012 7.160% 3 0944 Ice Harbor 09/1987 09/2012 8.875% 71 0945 Ice Harbor 09/1987 09/2012 8.875% 1 0946 Ice Harbor 09/1988 09/2012 8.500% 8 0947 Ice Harbor 09/1988 09/2012 8.500% 57 0948 Ice Harbor 09/1989 09/2012 9.250% 51 0949 Ice Harbor 09/1990 09/2012 8.875% 427 0950 Ice Harbor 09/1991 09/2012 8.750% 348 0951 Ice Harbor 09/1992 09/2012 8.500% 177 0952 Ice Harbor 09/1993 09/2012 7.875% 3,192 0953 Ice Harbor 09/1993 09/2012 7.875% 1,645 0954 Ice Harbor 09/1994 09/2029 7.125% 328 0955 Ice Harbor 09/1994 09/2029 7.125% 520 0956 Ice Harbor 09/1995 09/2000 7.330% 2 0957 Ice Harbor 09/1995 09/2019 7.270% 84 0958 Ice Harbor 09/1995 09/2019 7.270% 171 0959 Ice Harbor 09/1995 09/2019 7.270% 849 0960 Ice Harbor 09/1996 09/2031 7.150% 78 0961 Ice Harbor 09/1996 09/2041 7.150% 371 371962 Ice Harbor 09/1997 09/2022 7.230% 66 0963 Ice Harbor 09/1997 09/2047 7.150% 67 67964 Ice Harbor 09/1999 09/2049 5.375% 5,516 5,516965 Ice Harbor 09/2000 09/2050 6.125% 548 548966 Ice Harbor 09/2001 09/2051 5.875% 764 764967 Ice Harbor 09/2002 09/2052 5.500% 1,014 1,014968 Ice Harbor 09/2003 09/2053 5.125% 50 50969 Ice Harbor 09/2004 09/2054 5.375% 3,321 3,321970 Ice Harbor 09/2008 09/2058 4.875% 14 14971 Ice Harbor 09/2009 09/2059 4.375% 2,615 2,615972 Ice Harbor 09/2010 09/2060 4.250% 207 207973 Ice Harbor 09/2011 09/2061 3.750% 819 819974 Ice Harbor 09/2012 09/2062 3.375% 115 115975 Ice Harbor 09/2015 09/2065 3.250% 3,175 3,175976 Ice Harbor 09/2016 09/2066 3.000% 558 558977 John Day 09/1968 09/2018 7.280% 27,254 0978 John Day 09/1969 09/2019 7.270% 96,104 0979 John Day 09/1970 09/2020 7.250% 23,656 0980 John Day 09/1971 09/2021 7.230% 34,974 0981 John Day 09/1972 09/2022 7.210% 11,502 0982 John Day 09/1984 09/2022 10.750% 3,677 0983 John Day 09/1985 09/2022 7.210% 6,490 0984 John Day 09/1985 09/2022 12.375% 1,209 0985 John Day 09/1986 09/2022 7.210% 3,227 0986 John Day 09/1986 09/2022 11.375% 713 0987 John Day 09/1987 09/2022 7.210% 706 0988 John Day 09/1987 09/2022 8.875% 4,353 0989 John Day 09/1988 09/2022 8.500% 332 0990 John Day 09/1988 09/2022 8.500% 199 0991 John Day 09/1989 09/2022 7.210% 30 0992 John Day 09/1989 09/2022 9.250% 377 0993 John Day 09/1990 09/2022 7.210% 37 0994 John Day 09/1990 09/2022 8.875% 543 0995 John Day 09/1991 09/2022 8.750% 13,218 0996 John Day 09/1991 09/2022 8.750% 144 0
BP-18-FS-BPA-02A Page 200

TABLE 13A:
HISTORICAL INVESTMENTS, SHIFT STUDY
October 1, 2015 - September 30, 2019 Cost Evaluation period
($000s) (FY 2019)
A B C D E F G H
Project
In Service
Date
Due
Date
Interest
Rate
Initial
Principal Current Principal
Roll Maturity
Date
Rollover
Rate
997 John Day 09/1992 09/2022 7.210% 19 0998 John Day 09/1992 09/2022 8.500% 95 0999 John Day 09/1993 09/2022 7.875% 7,810 01000 John Day 09/1993 09/2022 7.875% 9,585 01001 John Day 09/1994 09/2019 7.125% 14 01002 John Day 09/1994 09/2029 7.125% 1,252 01003 John Day 09/1995 09/2000 7.330% 2 01004 John Day 09/1995 09/2000 7.330% 9 01005 John Day 09/1995 09/2020 7.250% 79 01006 John Day 09/1995 09/2035 7.150% 22 221007 John Day 09/1995 09/2035 7.150% 52 521008 John Day 09/1995 09/2035 7.150% 121 1211009 John Day 09/1995 09/2045 7.150% 37 371010 John Day 09/1995 09/2045 7.150% 608 6081011 John Day 09/1995 09/2045 7.150% 7,653 7,6531012 John Day 09/1996 09/2011 7.130% 237 01013 John Day 09/1996 09/2016 7.290% 1,072 01014 John Day 09/1997 09/2022 7.230% 133 01015 John Day 09/1997 09/2047 7.150% 179 1791016 John Day 09/1999 09/2049 5.375% 3,510 3,5101017 John Day 09/2000 09/2050 6.125% 2,761 2,7611018 John Day 09/2001 09/2051 5.875% 619 6191019 John Day 09/2004 09/2054 5.375% 2,830 2,8301020 John Day 09/2005 09/2055 5.125% 2,827 2,8271021 John Day 09/2006 09/2056 4.500% 601 6011022 John Day 09/2007 09/2057 5.000% 233 2331023 John Day 09/2009 09/2059 4.375% 1,548 1,5481024 John Day 09/2010 09/2060 4.250% 356 3561025 John Day 09/2011 09/2061 3.750% 175 1751026 John Day 09/2012 09/2062 3.375% 6,161 6,1611027 John Day 09/2013 09/2063 2.875% 17 171028 John Day 09/2015 09/2065 3.250% 163 1631029 Libby 09/1975 09/2025 7.160% 54,644 01030 Libby 09/1976 09/2026 7.150% 153,432 01031 Libby 09/1977 09/2026 7.150% 1,465 01032 Libby 09/1978 09/2026 7.150% 1,465 01033 Libby 09/1979 09/2026 7.150% 1,465 01034 Libby 09/1980 09/2026 7.150% 1,465 01035 Libby 09/1981 09/2026 7.150% 1,465 01036 Libby 09/1982 09/2026 7.150% 1,465 01037 Libby 09/1983 09/2026 7.150% 1,465 01038 Libby 09/1984 09/2026 10.750% 104 01039 Libby 09/1985 09/2026 7.150% 518 01040 Libby 09/1986 09/2026 7.150% 283 01041 Libby 09/1987 09/2026 7.150% 2 01042 Libby 09/1988 09/2026 8.505% 35 01043 Libby 09/1988 09/2038 7.150% 18,043 14,7811044 Libby 09/1989 09/2026 7.150% 1 01045 Libby 09/1989 09/2026 9.250% 131 01046 Libby 09/1990 09/2026 8.875% 11 01047 Libby 09/1991 09/2026 8.750% 134 01048 Libby 09/1992 09/2026 8.500% 100 01049 Libby 09/1992 09/2026 8.500% 70 01050 Libby 09/1993 09/2026 7.875% 600 01051 Libby 09/1994 09/2029 7.125% 215 01052 Libby 09/1994 09/2029 7.150% 286 01053 Libby 09/1995 09/2030 7.150% 15 01054 Libby 09/1995 09/2030 7.150% 41 01055 Libby 09/1995 09/2030 7.150% 94 01056 Libby 09/1997 09/2022 7.230% 432 01057 Libby 09/1997 09/2047 7.150% 660 6601058 Libby 09/2001 09/2051 5.875% 5,562 5,5621059 Libby 09/2008 09/2058 4.875% 1,567 1,5671060 Libby 09/2010 09/2060 4.250% 40 401061 Libby 09/2011 09/2061 3.750% 152 1521062 Libby 09/2012 09/2062 3.375% 16 161063 Little Goose 09/1970 09/2020 7.250% 22,326 01064 Little Goose 09/1971 09/2021 7.230% 42,962 01065 Little Goose 09/1972 09/2021 7.230% 28 01066 Little Goose 09/1973 09/2021 7.230% 29 01067 Little Goose 09/1974 09/2021 7.230% 28 01068 Little Goose 09/1975 09/2021 7.230% 29 01069 Little Goose 09/1976 09/2021 7.230% 28 01070 Little Goose 09/1977 09/2021 7.230% 29 01071 Little Goose 09/1978 09/2021 7.230% 28 01072 Little Goose 09/1978 09/2028 7.150% 49,578 01073 Little Goose 09/1979 09/2021 7.230% 29 01074 Little Goose 09/1980 09/2021 7.230% 28 01075 Little Goose 09/1981 09/2021 7.230% 29 01076 Little Goose 09/1982 09/2021 7.230% 28 01077 Little Goose 09/1983 09/2021 7.230% 29 01078 Little Goose 09/1984 09/2021 10.750% 201 01079 Little Goose 09/1985 09/2021 7.230% 174 0
BP-18-FS-BPA-02A Page 201

TABLE 13A:
HISTORICAL INVESTMENTS, SHIFT STUDY
October 1, 2015 - September 30, 2019 Cost Evaluation period
($000s) (FY 2019)
A B C D E F G H
Project
In Service
Date
Due
Date
Interest
Rate
Initial
Principal Current Principal
Roll Maturity
Date
Rollover
Rate
1080 Little Goose 09/1985 09/2028 7.150% 47 01081 Little Goose 09/1986 09/2021 7.230% 239 01082 Little Goose 09/1987 09/2021 7.230% 6 01083 Little Goose 09/1987 09/2021 8.875% 72 01084 Little Goose 09/1988 09/2021 8.500% 12 01085 Little Goose 09/1988 09/2021 8.500% 68 01086 Little Goose 09/1989 09/2021 9.250% 77 01087 Little Goose 09/1990 09/2021 8.875% 408 01088 Little Goose 09/1990 09/2021 8.875% 21 01089 Little Goose 09/1991 09/2021 8.750% 266 01090 Little Goose 09/1992 09/2021 8.500% 66 01091 Little Goose 09/1992 09/2021 8.500% 27 01092 Little Goose 09/1993 09/2021 7.875% 276 01093 Little Goose 09/1993 09/2021 7.875% 3,359 01094 Little Goose 09/1994 09/2019 7.125% 37 01095 Little Goose 09/1994 09/2029 7.125% 2,044 01096 Little Goose 09/1995 09/2040 7.150% 17 171097 Little Goose 09/1995 09/2040 7.150% 450 4501098 Little Goose 09/1995 09/2040 7.150% 733 7331099 Little Goose 09/1996 09/2046 7.150% 10 101100 Little Goose 09/1996 09/2046 7.150% 10 101101 Little Goose 09/1996 09/2046 7.150% 211 2111102 Little Goose 09/1996 09/2046 7.150% 241 2411103 Little Goose 09/1996 09/2046 7.150% 520 5201104 Little Goose 09/1996 09/2046 7.150% 3,909 3,9091105 Little Goose 09/1997 09/2047 7.150% 1 11106 Little Goose 09/2001 09/2051 5.875% 4,608 4,6081107 Little Goose 09/2002 09/2052 5.500% 27 271108 Little Goose 09/2003 09/2053 5.125% 146 1461109 Little Goose 09/2004 09/2054 5.375% 67 671110 Little Goose 09/2008 09/2058 4.875% 13 131111 Little Goose 09/2009 09/2059 4.375% 3,171 3,1711112 Little Goose 09/2010 09/2060 4.250% 30 301113 Little Goose 09/2013 09/2063 2.875% 66 661114 Lookout Dam 09/1955 09/2005 6.910% 34,290 01115 Lookout Dam 09/1956 09/2005 6.910% 52 01116 Lookout Dam 09/1957 09/2005 6.910% 51 01117 Lookout Dam 09/1958 09/2005 6.910% 51 01118 Lookout Dam 09/1959 09/2005 6.910% 51 01119 Lookout Dam 09/1960 09/2005 6.910% 51 01120 Lookout Dam 09/1961 09/2005 6.910% 52 01121 Lookout Dam 09/1962 09/2005 6.910% 51 01122 Lookout Dam 09/1963 09/2005 6.910% 51 01123 Lookout Dam 09/1964 09/2005 6.910% 51 01124 Lookout Dam 09/1965 09/2005 6.910% 51 01125 Lookout Dam 09/1966 09/2005 6.910% 51 01126 Lookout Dam 09/1967 09/2005 6.910% 52 01127 Lookout Dam 09/1968 09/2005 6.910% 51 01128 Lookout Dam 09/1969 09/2005 6.910% 51 01129 Lookout Dam 09/1970 09/2005 6.910% 51 01130 Lookout Dam 09/1971 09/2005 6.910% 51 01131 Lookout Dam 09/1972 09/2005 6.910% 51 01132 Lookout Dam 09/1973 09/2005 6.910% 52 01133 Lookout Dam 09/1974 09/2005 6.910% 51 01134 Lookout Dam 09/1975 09/2005 6.910% 51 01135 Lookout Dam 09/1976 09/2005 6.910% 51 01136 Lookout Dam 09/1977 09/2005 6.910% 51 01137 Lookout Dam 09/1978 09/2005 6.910% 51 01138 Lookout Dam 09/1979 09/2005 6.910% 52 01139 Lookout Dam 09/1980 09/2005 6.910% 51 01140 Lookout Dam 09/1981 09/2005 6.910% 51 01141 Lookout Dam 09/1982 09/2005 6.910% 51 01142 Lookout Dam 09/1983 09/2005 6.910% 51 01143 Lookout Dam 09/1984 09/2005 10.750% 185 01144 Lookout Dam 09/1985 09/2005 6.910% 52 01145 Lookout Dam 09/1986 09/2005 6.910% 42 01146 Lookout Dam 09/1987 09/2005 6.910% 9 01147 Lookout Dam 09/1987 09/2005 8.875% 12 01148 Lookout Dam 09/1988 09/2005 8.500% 46 01149 Lookout Dam 09/1988 09/2005 8.500% 17 01150 Lookout Dam 09/1989 09/2005 9.250% 23 01151 Lookout Dam 09/1990 09/2005 8.875% 147 01152 Lookout Dam 09/1990 09/2005 8.875% 4 01153 Lookout Dam 09/1991 09/2005 8.750% 6 01154 Lookout Dam 09/1991 09/2005 8.750% 50 01155 Lookout Dam 09/1992 09/2005 8.500% 181 01156 Lookout Dam 09/1992 09/2005 8.500% 4 01157 Lookout Dam 09/1993 09/2005 7.875% 18 01158 Lookout Dam 09/1993 09/2005 7.875% 189 01159 Lookout Dam 09/1994 09/2019 7.125% 73 01160 Lookout Dam 09/1995 09/2045 7.150% 80 391161 Lookout Dam 09/1995 09/2045 7.150% 33 331162 Lookout Dam 09/1995 09/2045 7.860% 9 0
BP-18-FS-BPA-02A Page 202

TABLE 13A:
HISTORICAL INVESTMENTS, SHIFT STUDY
October 1, 2015 - September 30, 2019 Cost Evaluation period
($000s) (FY 2019)
A B C D E F G H
Project
In Service
Date
Due
Date
Interest
Rate
Initial
Principal Current Principal
Roll Maturity
Date
Rollover
Rate
1163 Lookout Dam 09/1995 09/2045 7.860% 15 01164 Lookout Dam 09/1995 09/2045 7.860% 31 01165 Lookout Dam 09/1995 09/2045 7.860% 157 01166 Lookout Dam 09/2000 09/2050 6.125% 5,098 5,0981167 Lookout Dam 09/2003 09/2053 5.125% 135 1351168 Lookout Dam 09/2005 09/2055 5.125% 7,355 7,3551169 Lookout Dam 09/2007 09/2057 5.000% 572 5721170 Lookout Dam 09/2011 09/2061 3.750% 17 171171 Lookout Dam 09/2012 09/2062 3.375% 294 2941172 Lost Creek 09/1977 09/2027 7.150% 14,293 01173 Lost Creek 09/1978 09/2027 7.150% 58 01174 Lost Creek 09/1979 09/2027 7.150% 60 01175 Lost Creek 09/1980 09/2027 7.150% 60 01176 Lost Creek 09/1981 09/2027 7.150% 60 01177 Lost Creek 09/1982 09/2027 7.150% 60 01178 Lost Creek 09/1983 09/2027 7.150% 60 01179 Lost Creek 09/1984 09/2027 10.750% 243 01180 Lost Creek 09/1985 09/2027 7.150% 12 01181 Lost Creek 09/1986 09/2027 7.150% 6 01182 Lost Creek 09/1986 09/2027 11.375% 5 01183 Lost Creek 09/1987 09/2027 7.150% 4 01184 Lost Creek 09/1987 09/2027 8.875% 3 01185 Lost Creek 09/1988 09/2027 8.500% 7 01186 Lost Creek 09/1989 09/2027 9.250% 9 01187 Lost Creek 09/1990 09/2027 8.875% 1 01188 Lost Creek 09/1991 09/2027 8.750% 31 01189 Lost Creek 09/1992 09/2027 8.500% 1 01190 Lost Creek 09/1992 09/2027 8.500% 1 01191 Lost Creek 09/1993 09/2027 7.875% 1 01192 Lost Creek 09/1993 09/2027 7.875% 14 01193 Lost Creek 09/1995 09/2000 7.330% 4 01194 Lost Creek 09/1995 09/2045 7.150% 94 941195 Lost Creek 09/1996 09/2031 7.150% 31 01196 Lost Creek 09/1996 09/2046 7.150% 24 241197 Lost Creek 09/2001 09/2051 5.875% 147 1471198 Lost Creek 09/2011 09/2061 3.750% 7 71199 Lower Granite 09/1975 09/2025 7.160% 119,237 01200 Lower Granite 09/1976 09/2025 7.160% 510 01201 Lower Granite 09/1977 09/2025 7.160% 510 01202 Lower Granite 09/1978 09/2025 7.160% 510 01203 Lower Granite 09/1978 09/2028 7.150% 40,611 01204 Lower Granite 09/1979 09/2025 7.160% 510 01205 Lower Granite 09/1980 09/2025 7.160% 510 01206 Lower Granite 09/1981 09/2025 7.160% 510 01207 Lower Granite 09/1982 09/2025 7.160% 510 01208 Lower Granite 09/1983 09/2025 7.160% 510 01209 Lower Granite 09/1984 09/2025 10.750% 311 01210 Lower Granite 09/1985 09/2025 7.160% 328 01211 Lower Granite 09/1986 09/2025 7.160% 215 01212 Lower Granite 09/1986 09/2025 11.375% 4 01213 Lower Granite 09/1987 09/2025 7.160% 8 01214 Lower Granite 09/1987 09/2025 8.875% 60 01215 Lower Granite 09/1988 09/2025 8.500% 22 01216 Lower Granite 09/1988 09/2025 8.500% 95 01217 Lower Granite 09/1989 09/2025 9.250% 112 01218 Lower Granite 09/1990 09/2025 8.875% 392 01219 Lower Granite 09/1991 09/2025 8.750% 281 01220 Lower Granite 09/1991 09/2025 8.750% 6 01221 Lower Granite 09/1992 09/2025 8.500% 83 01222 Lower Granite 09/1992 09/2025 8.500% 121 01223 Lower Granite 09/1993 09/2025 7.875% 26 01224 Lower Granite 09/1993 09/2025 7.875% 3,272 01225 Lower Granite 09/1994 09/2019 7.125% 38 01226 Lower Granite 09/1994 09/2029 7.150% 3,543 01227 Lower Granite 09/1995 09/2017 7.290% 77 01228 Lower Granite 09/1995 09/2017 7.290% 388 01229 Lower Granite 09/1995 09/2017 7.290% 458 01230 Lower Granite 09/1995 09/2025 7.160% 96 01231 Lower Granite 09/1996 09/2011 7.130% 255 01232 Lower Granite 09/1996 09/2031 7.150% 206 01233 Lower Granite 09/1996 09/2046 7.150% 9 91234 Lower Granite 09/1996 09/2046 7.150% 625 6251235 Lower Granite 09/1997 09/2047 7.150% 677 6771236 Lower Granite 09/1999 09/2049 5.375% 856 8561237 Lower Granite 09/2001 09/2051 5.875% 2,025 2,0251238 Lower Granite 09/2002 09/2052 5.500% 1,275 1,2751239 Lower Granite 09/2003 09/2053 5.125% 42 421240 Lower Granite 09/2005 09/2055 5.125% 393 3931241 Lower Granite 09/2008 09/2058 4.875% 24 241242 Lower Granite 09/2009 09/2059 4.375% 5,669 5,6691243 Lower Granite 09/2010 09/2060 4.250% 1,156 1,1561244 Lower Granite 09/2011 09/2061 3.750% 8 81245 Lower Granite 09/2014 09/2064 3.875% 2,644 2,644
BP-18-FS-BPA-02A Page 203

TABLE 13A:
HISTORICAL INVESTMENTS, SHIFT STUDY
October 1, 2015 - September 30, 2019 Cost Evaluation period
($000s) (FY 2019)
A B C D E F G H
Project
In Service
Date
Due
Date
Interest
Rate
Initial
Principal Current Principal
Roll Maturity
Date
Rollover
Rate
1246 Lower Granite 09/2015 09/2065 3.250% 1,597 1,5971247 Lower Granite 09/2016 09/2066 3.000% 1,878 1,8781248 Lower Monument 09/1969 09/2019 7.270% 26,974 01249 Lower Monument 09/1970 09/2020 7.250% 51,218 01250 Lower Monument 09/1971 09/2020 7.250% 214 01251 Lower Monument 09/1972 09/2020 7.250% 214 01252 Lower Monument 09/1973 09/2020 7.250% 214 01253 Lower Monument 09/1974 09/2020 7.250% 214 01254 Lower Monument 09/1975 09/2020 7.250% 214 01255 Lower Monument 09/1976 09/2020 7.250% 214 01256 Lower Monument 09/1977 09/2020 7.250% 214 01257 Lower Monument 09/1978 09/2020 7.250% 214 01258 Lower Monument 09/1979 09/2020 7.250% 214 01259 Lower Monument 09/1979 09/2029 7.150% 40,669 01260 Lower Monument 09/1980 09/2020 7.250% 214 01261 Lower Monument 09/1981 09/2020 7.250% 214 01262 Lower Monument 09/1982 09/2020 7.250% 214 01263 Lower Monument 09/1983 09/2020 7.250% 214 01264 Lower Monument 09/1985 09/2020 7.250% 8 01265 Lower Monument 09/1985 09/2029 7.150% 256 01266 Lower Monument 09/1986 09/2020 7.250% 132 01267 Lower Monument 09/1987 09/2020 7.250% 3 01268 Lower Monument 09/1987 09/2020 8.875% 50 01269 Lower Monument 09/1988 09/2020 8.500% 1 01270 Lower Monument 09/1988 09/2020 8.500% 58 01271 Lower Monument 09/1989 09/2020 9.250% 93 01272 Lower Monument 09/1990 09/2020 8.875% 358 01273 Lower Monument 09/1991 09/2020 8.750% 594 01274 Lower Monument 09/1992 09/2020 8.500% 4,484 01275 Lower Monument 09/1993 09/2020 7.875% 24 01276 Lower Monument 09/1993 09/2020 7.875% 2,175 01277 Lower Monument 09/1994 09/2019 7.125% 107 01278 Lower Monument 09/1994 09/2029 7.125% 2,167 01279 Lower Monument 09/1995 09/2000 7.330% 6 01280 Lower Monument 09/1995 09/2045 7.150% 41 411281 Lower Monument 09/1995 09/2045 7.150% 99 991282 Lower Monument 09/1995 09/2045 7.150% 624 6241283 Lower Monument 09/1995 09/2045 7.150% 1,122 1,1221284 Lower Monument 09/1996 09/2016 7.290% 668 01285 Lower Monument 09/1996 09/2021 7.230% 37 01286 Lower Monument 09/1996 09/2021 7.230% 51 01287 Lower Monument 09/1996 09/2036 7.150% 264 2641288 Lower Monument 09/1996 09/2046 7.150% 10 101289 Lower Monument 09/2001 09/2051 5.875% 3,301 3,3011290 Lower Monument 09/2002 09/2052 5.500% 29 291291 Lower Monument 09/2003 09/2053 5.125% 22 221292 Lower Monument 09/2004 09/2054 5.375% 3,423 3,4231293 Lower Monument 09/2005 09/2055 5.125% 527 5271294 Lower Monument 09/2006 09/2056 4.500% 285 2851295 Lower Monument 09/2008 09/2058 4.875% 9 91296 Lower Monument 09/2009 09/2059 4.375% 2,332 2,3321297 Lower Monument 09/2012 09/2062 3.375% 89 891298 Lower Monument 09/2014 09/2064 3.875% 1,430 1,4301299 Lower Monument 09/2016 09/2066 3.000% 155 1551300 Lower Snake Fish and Wildlife 09/1983 09/2033 7.150% 30,488 9,4721301 Lower Snake Fish and Wildlife 09/1985 09/2035 7.150% 47,921 47,9211302 Lower Snake Fish and Wildlife 09/1987 09/2037 7.150% 72,536 72,5361303 Lower Snake Fish and Wildlife 09/1988 09/2038 7.150% 805 8051304 Lower Snake Fish and Wildlife 09/1990 09/2040 7.150% 1,557 1,5571305 Lower Snake Fish and Wildlife 09/1991 09/2041 7.150% 4,411 4,4111306 Lower Snake Fish and Wildlife 09/1993 09/2043 7.150% 71,632 71,6321307 Lower Snake Fish and Wildlife 09/1994 09/2044 7.150% 4,722 4,7221308 Lower Snake Fish and Wildlife 09/1996 09/2046 7.150% 12,085 12,0851309 Lower Snake Fish and Wildlife 09/1997 09/2047 7.150% 2,173 2,1731310 Lower Snake Fish and Wildlife 09/1999 09/2049 5.375% 7 71311 Lower Snake Fish and Wildlife 09/2000 09/2050 6.125% 1,529 1,5291312 Lower Snake Fish and Wildlife 09/2001 09/2051 5.875% 325 3251313 Lower Snake Fish and Wildlife 09/2002 09/2052 5.500% 890 8901314 Lower Snake Fish and Wildlife 09/2003 09/2053 5.125% 98 981315 Lower Snake Fish and Wildlife 09/2004 09/2054 5.375% 230 2301316 Lower Snake Fish and Wildlife 09/2005 09/2055 5.125% 4 41317 Lower Snake Fish and Wildlife 09/2006 09/2056 4.500% 379 3791318 Lower Snake Fish and Wildlife 09/2008 09/2058 4.875% 74 741319 Lower Snake Fish and Wildlife 09/2009 09/2059 4.375% 1,540 1,5401320 Lower Snake Fish and Wildlife 09/2010 09/2060 4.250% 6 61321 Lower Snake Fish and Wildlife 09/2011 09/2061 3.750% 122 1221322 Lower Snake Fish and Wildlife 09/2014 09/2064 3.875% 222 2221323 Lower Snake Fish and Wildlife 09/2016 09/2066 3.000% 1,256 1,2561324 McNary 09/1954 09/2004 6.880% 80,256 01325 McNary 09/1955 09/2005 6.910% 53,493 01326 McNary 09/1956 09/2006 6.950% 38,748 01327 McNary 09/1957 09/2007 6.980% 24,985 01328 McNary 09/1958 09/2007 6.980% 468 0
BP-18-FS-BPA-02A Page 204

TABLE 13A:
HISTORICAL INVESTMENTS, SHIFT STUDY
October 1, 2015 - September 30, 2019 Cost Evaluation period
($000s) (FY 2019)
A B C D E F G H
Project
In Service
Date
Due
Date
Interest
Rate
Initial
Principal Current Principal
Roll Maturity
Date
Rollover
Rate
1329 McNary 09/1959 09/2007 6.980% 468 01330 McNary 09/1960 09/2007 6.980% 468 01331 McNary 09/1961 09/2007 6.980% 468 01332 McNary 09/1962 09/2007 6.980% 467 01333 McNary 09/1963 09/2007 6.980% 468 01334 McNary 09/1964 09/2007 6.980% 468 01335 McNary 09/1965 09/2007 6.980% 468 01336 McNary 09/1966 09/2007 6.980% 468 01337 McNary 09/1967 09/2007 6.980% 467 01338 McNary 09/1968 09/2007 6.980% 468 01339 McNary 09/1969 09/2007 6.980% 468 01340 McNary 09/1970 09/2007 6.980% 468 01341 McNary 09/1971 09/2007 6.980% 468 01342 McNary 09/1972 09/2007 6.980% 468 01343 McNary 09/1973 09/2007 6.980% 467 01344 McNary 09/1974 09/2007 6.980% 468 01345 McNary 09/1975 09/2007 6.980% 468 01346 McNary 09/1976 09/2007 6.980% 468 01347 McNary 09/1977 09/2007 6.980% 467 01348 McNary 09/1978 09/2007 6.980% 468 01349 McNary 09/1979 09/2007 6.980% 468 01350 McNary 09/1980 09/2007 6.980% 468 01351 McNary 09/1981 09/2007 6.980% 468 01352 McNary 09/1982 09/2007 6.980% 467 01353 McNary 09/1983 09/2007 6.980% 468 01354 McNary 09/1985 09/2007 6.980% 557 01355 McNary 09/1986 09/2007 6.980% 454 01356 McNary 09/1987 09/2007 6.980% 24 01357 McNary 09/1995 09/2010 7.090% 509 01358 McNary 09/1995 09/2045 7.150% 16 161359 McNary 09/1996 09/2006 6.950% 778 01360 McNary 09/1996 09/2011 7.130% 3 01361 McNary 09/1996 09/2026 7.150% 74 01362 McNary 09/1996 09/2026 7.150% 277 01363 McNary 09/1996 09/2046 7.150% 619 6191364 McNary 09/1997 09/2032 7.150% 30 01365 McNary 09/2001 09/2051 5.875% 1,046 1,0461366 McNary 09/2003 09/2053 5.125% 97 971367 McNary 09/2004 09/2054 5.375% 6,138 6,1381368 McNary 09/2005 09/2055 5.125% 550 5501369 McNary 09/2006 09/2056 4.500% 4,080 4,0801370 McNary 09/2008 09/2058 4.875% 215 2151371 McNary 09/2011 09/2061 3.750% 565 5651372 McNary 09/2012 09/2062 3.375% 11 111373 McNary 09/2013 09/2063 2.875% 1,000 1,0001374 McNary 09/2014 09/2064 3.875% 759 7591375 Minidoka/Palisades 09/1909 09/1959 3.000% 854 01376 Minidoka/Palisades 09/1909 09/1959 3.000% 226 01377 Minidoka/Palisades 09/1910 09/1960 3.000% 1,709 01378 Minidoka/Palisades 09/1910 09/1960 3.000% 451 01379 Minidoka/Palisades 09/1911 09/1961 3.000% 1,709 01380 Minidoka/Palisades 09/1911 09/1961 3.000% 451 01381 Minidoka/Palisades 09/1927 09/1977 3.000% 854 01382 Minidoka/Palisades 09/1927 09/1977 3.000% 226 01383 Minidoka/Palisades 09/1942 09/1992 3.000% 854 01384 Minidoka/Palisades 09/1942 09/1992 3.000% 226 01385 Minidoka/Palisades 09/1957 09/2007 3.000% 2,561 01386 Minidoka/Palisades 09/1957 09/2007 3.000% 677 01387 Minidoka/Palisades 09/1958 09/2008 3.000% 854 01388 Minidoka/Palisades 09/1958 09/2008 3.000% 226 01389 Minidoka/Palisades 09/1959 09/2008 3.000% 108 01390 Minidoka/Palisades 09/1959 09/2008 3.000% 28 01391 Minidoka/Palisades 09/1960 09/2008 3.000% 108 01392 Minidoka/Palisades 09/1960 09/2008 3.000% 29 01393 Minidoka/Palisades 09/1961 09/2008 3.000% 108 01394 Minidoka/Palisades 09/1961 09/2008 3.000% 29 01395 Minidoka/Palisades 09/1962 09/2008 3.000% 108 01396 Minidoka/Palisades 09/1962 09/2008 3.000% 28 01397 Minidoka/Palisades 09/1963 09/2008 3.000% 108 01398 Minidoka/Palisades 09/1963 09/2008 3.000% 29 01399 Minidoka/Palisades 09/1964 09/2008 3.000% 108 01400 Minidoka/Palisades 09/1964 09/2008 3.000% 28 01401 Minidoka/Palisades 09/1965 09/2008 3.000% 108 01402 Minidoka/Palisades 09/1965 09/2008 3.000% 29 01403 Minidoka/Palisades 09/1966 09/2008 3.000% 108 01404 Minidoka/Palisades 09/1966 09/2008 3.000% 29 01405 Minidoka/Palisades 09/1967 09/2008 3.000% 108 01406 Minidoka/Palisades 09/1967 09/2008 3.000% 28 01407 Minidoka/Palisades 09/1968 09/2008 3.000% 108 01408 Minidoka/Palisades 09/1968 09/2008 3.000% 29 01409 Minidoka/Palisades 09/1969 09/2008 3.000% 3 01410 Minidoka/Palisades 09/1969 09/2008 3.000% 28 01411 Minidoka/Palisades 09/1970 09/2008 3.000% 108 0
BP-18-FS-BPA-02A Page 205

TABLE 13A:
HISTORICAL INVESTMENTS, SHIFT STUDY
October 1, 2015 - September 30, 2019 Cost Evaluation period
($000s) (FY 2019)
A B C D E F G H
Project
In Service
Date
Due
Date
Interest
Rate
Initial
Principal Current Principal
Roll Maturity
Date
Rollover
Rate
1412 Minidoka/Palisades 09/1970 09/2008 3.000% 29 01413 Minidoka/Palisades 09/1971 09/2008 3.000% 108 01414 Minidoka/Palisades 09/1971 09/2008 3.000% 29 01415 Minidoka/Palisades 09/1972 09/2008 3.000% 108 01416 Minidoka/Palisades 09/1972 09/2008 3.000% 28 01417 Minidoka/Palisades 09/1973 09/2008 3.000% 108 01418 Minidoka/Palisades 09/1973 09/2008 3.000% 29 01419 Minidoka/Palisades 09/1974 09/2008 3.000% 108 01420 Minidoka/Palisades 09/1974 09/2008 3.000% 28 01421 Minidoka/Palisades 09/1975 09/2008 3.000% 108 01422 Minidoka/Palisades 09/1975 09/2008 3.000% 29 01423 Minidoka/Palisades 09/1976 09/2008 3.000% 108 01424 Minidoka/Palisades 09/1976 09/2008 3.000% 29 01425 Minidoka/Palisades 09/1977 09/2008 7.020% 83 01426 Minidoka/Palisades 09/1977 09/2008 7.020% 28 01427 Minidoka/Palisades 09/1978 09/2008 7.020% 75 01428 Minidoka/Palisades 09/1978 09/2008 7.020% 20 01429 Minidoka/Palisades 09/1979 09/2008 7.020% 75 01430 Minidoka/Palisades 09/1979 09/2008 7.020% 19 01431 Minidoka/Palisades 09/1980 09/2008 7.020% 75 01432 Minidoka/Palisades 09/1980 09/2008 7.020% 20 01433 Minidoka/Palisades 09/1981 09/2008 7.020% 75 01434 Minidoka/Palisades 09/1981 09/2008 7.020% 20 01435 Minidoka/Palisades 09/1982 09/2008 7.020% 75 01436 Minidoka/Palisades 09/1982 09/2008 7.020% 19 01437 Minidoka/Palisades 09/1983 09/2008 7.020% 65 01438 Minidoka/Palisades 09/1983 09/2008 7.020% 20 01439 Minidoka/Palisades 09/1984 09/2008 10.075% 44 01440 Minidoka/Palisades 09/1984 09/2008 10.075% 11 01441 Minidoka/Palisades 09/1985 09/2008 7.020% 21 01442 Minidoka/Palisades 09/1986 09/2008 7.020% 21 01443 Minidoka/Palisades 09/1986 09/2008 11.375% 48 01444 Minidoka/Palisades 09/1987 09/2008 7.020% 16 01445 Minidoka/Palisades 09/1988 09/2008 8.500% 31 01446 Minidoka/Palisades 09/1989 09/2008 9.250% 20 01447 Minidoka/Palisades 09/1990 09/2008 8.875% 33 01448 Minidoka/Palisades 09/1991 09/2008 8.750% 62 01449 Minidoka/Palisades 09/1991 09/2008 8.750% 11 01450 Minidoka/Palisades 09/1991 09/2008 8.750% 32 01451 Minidoka/Palisades 09/1992 09/2008 8.500% 6 01452 Minidoka/Palisades 09/1994 09/2029 7.125% 351 01453 Minidoka/Palisades 09/1995 09/2000 7.330% 6 01454 Minidoka/Palisades 09/1995 09/2010 7.890% 40 01455 Minidoka/Palisades 09/1996 09/2011 7.130% 54 01456 Minidoka/Palisades 09/1997 09/2007 6.950% 66 01457 Minidoka/Palisades 09/1997 09/2047 7.150% 50,911 50,9111458 Minidoka/Palisades 09/2001 09/2051 5.875% 42 421459 Minidoka/Palisades 09/2012 09/2062 3.375% 7 71460 Minidoka/Palisades 09/2015 09/2065 3.250% 19,237 19,2371461 Minidoka/Palisades 09/2016 09/2066 3.000% 206 2061462 RRP - Green Springs 09/2001 09/2051 5.875% 11,145 11,1451463 RRP - Green Springs 09/2012 09/2062 3.375% 2 21464 RRP - Green Springs 09/2013 09/2063 2.875% 1 11465 The Dalles 09/1957 09/2007 2.500% 15,908 01466 The Dalles 09/1958 09/2008 7.020% 45,837 01467 The Dalles 09/1959 09/2009 7.060% 40,415 01468 The Dalles 09/1960 09/2010 7.090% 39,179 01469 The Dalles 09/1961 09/2011 7.130% 9,492 01470 The Dalles 09/1962 09/2011 7.130% 56 01471 The Dalles 09/1963 09/2011 7.130% 57 01472 The Dalles 09/1964 09/2011 7.130% 57 01473 The Dalles 09/1965 09/2011 7.130% 56 01474 The Dalles 09/1966 09/2011 7.130% 57 01475 The Dalles 09/1967 09/2011 7.130% 57 01476 The Dalles 09/1968 09/2011 7.130% 56 01477 The Dalles 09/1969 09/2011 7.130% 57 01478 The Dalles 09/1970 09/2011 7.130% 57 01479 The Dalles 09/1971 09/2011 7.130% 56 01480 The Dalles 09/1972 09/2011 7.130% 57 01481 The Dalles 09/1973 09/2011 7.130% 57 01482 The Dalles 09/1973 09/2023 7.190% 21,983 01483 The Dalles 09/1974 09/2011 7.130% 56 01484 The Dalles 09/1974 09/2024 7.170% 7,268 01485 The Dalles 09/1975 09/2011 7.130% 57 01486 The Dalles 09/1976 09/2011 7.130% 57 01487 The Dalles 09/1977 09/2011 7.130% 56 01488 The Dalles 09/1978 09/2011 7.130% 57 01489 The Dalles 09/1979 09/2011 7.130% 57 01490 The Dalles 09/1980 09/2011 7.130% 56 01491 The Dalles 09/1981 09/2011 7.130% 57 01492 The Dalles 09/1982 09/2011 7.130% 57 01493 The Dalles 09/1983 09/2011 7.130% 56 01494 The Dalles 09/1984 09/2011 10.750% 961 0
BP-18-FS-BPA-02A Page 206

TABLE 13A:
HISTORICAL INVESTMENTS, SHIFT STUDY
October 1, 2015 - September 30, 2019 Cost Evaluation period
($000s) (FY 2019)
A B C D E F G H
Project
In Service
Date
Due
Date
Interest
Rate
Initial
Principal Current Principal
Roll Maturity
Date
Rollover
Rate
1495 The Dalles 09/1985 09/2011 7.130% 95 01496 The Dalles 09/1985 09/2011 12.375% 280 01497 The Dalles 09/1986 09/2011 7.130% 95 01498 The Dalles 09/1986 09/2011 11.375% 4 01499 The Dalles 09/1987 09/2011 7.130% 1,417 01500 The Dalles 09/1987 09/2011 8.875% 81 01501 The Dalles 09/1988 09/2011 8.500% 685 01502 The Dalles 09/1988 09/2011 8.500% 1 01503 The Dalles 09/1989 09/2011 9.250% 898 0
1504 The Dalles 09/1990 09/2011 8.875% 319 0
1505 The Dalles 09/1990 09/2011 8.875% 745 0
1506 The Dalles 09/1991 09/2011 8.750% 89 0
1507 The Dalles 09/1991 09/2011 8.750% 2,452 01508 The Dalles 09/1992 09/2011 8.500% 57 01509 The Dalles 09/1992 09/2011 8.500% 130 01510 The Dalles 09/1993 09/2011 7.875% 2,028 01511 The Dalles 09/1993 09/2011 7.875% 2,929 01512 The Dalles 09/1994 09/2029 7.125% 1,425 01513 The Dalles 09/1996 09/2008 7.020% 196 01514 The Dalles 09/1996 09/2011 7.130% 457 01515 The Dalles 09/1996 09/2046 7.150% 1,991 1,9911516 The Dalles 09/2000 09/2050 6.125% 2,588 2,5881517 The Dalles 09/2002 09/2052 5.500% 1,226 1,2261518 The Dalles 09/2004 09/2054 5.375% 182 1821519 The Dalles 09/2005 09/2055 5.125% 36,019 36,0191520 The Dalles 09/2006 09/2056 4.500% 2,030 2,0301521 The Dalles 09/2007 09/2057 5.000% 140 1401522 The Dalles 09/2008 09/2058 4.875% 1,651 1,6511523 The Dalles 09/2015 09/2065 3.250% 302 3021524 The Dalles 09/2016 09/2066 3.000% 4 41525 Yakima Chandler/Kenniwick 09/1956 09/2022 7.210% 1,068 01526 Yakima Chandler/Kenniwick 09/1956 09/2022 7.210% 481 01527 Yakima Chandler/Kenniwick 09/1959 09/2022 7.210% 1 01528 Yakima Chandler/Kenniwick 09/1960 09/2022 7.210% 1 01529 Yakima Chandler/Kenniwick 09/1961 09/2022 7.210% 1 01530 Yakima Chandler/Kenniwick 09/1984 09/2022 10.750% 35 01531 Yakima Chandler/Kenniwick 09/1984 09/2022 10.750% 10 01532 Yakima Chandler/Kenniwick 09/1985 09/2022 12.375% 357 01533 Yakima Chandler/Kenniwick 09/1986 09/2022 7.210% 439 01534 Yakima Chandler/Kenniwick 09/1986 09/2022 11.375% 7 01535 Yakima Chandler/Kenniwick 09/1987 09/2022 8.875% 126 01536 Yakima Chandler/Kenniwick 09/1989 09/2022 9.250% 18 01537 Yakima Chandler/Kenniwick 09/1990 09/2022 8.875% 40 01538 Yakima Chandler/Kenniwick 09/1991 09/2022 8.750% 109 01539 Yakima Chandler/Kenniwick 09/2005 09/2055 5.125% 833 8331540 Yakima Chandler/Kenniwick 09/2009 09/2059 4.375% 15 151541 Yakima Roza 09/1958 09/2008 7.020% 1,194 01542 Yakima Roza 09/1958 09/2008 7.020% 383 01543 Yakima Roza 09/1984 09/2008 10.750% 5 01544 Yakima Roza 09/1984 09/2008 10.750% 17 01545 Yakima Roza 09/1985 09/2008 7.020% 69 01546 Yakima Roza 09/1985 09/2008 12.375% 5 01547 Yakima Roza 09/1986 09/2008 7.020% 6 01548 Yakima Roza 09/1987 09/2008 7.020% 2 01549 Yakima Roza 09/1987 09/2008 8.875% 9 01550 Yakima Roza 09/2001 09/2051 5.875% 15 141551 Bureau Direct 05/1995 05/2015 7.500% 35,000 01552 Bureau Direct 05/1997 05/2000 6.500% 50,000 01553 Bureau Direct 04/1998 05/2008 6.000% 25,000 01554 Bureau Direct 09/1999 09/2004 6.400% 20,000 01555 Bureau Direct 04/2000 04/2003 6.850% 40,000 01556 Bureau Direct 09/2000 09/2005 6.700% 20,000 01557 Bureau Direct 06/2001 06/2004 4.750% 50,000 01558 Bureau Direct 03/2002 03/2005 4.600% 30,000 01559 Bureau Direct 09/2002 09/2006 3.050% 20,000 01560 Bureau Direct 12/2002 12/2006 3.050% 40,000 01561 Bureau Direct 04/2003 04/2006 2.400% 40,000 01562 Bureau Direct 04/2003 04/2006 2.400% 25,000 01563 Bureau Direct 07/2003 07/2006 2.300% 30,000 01564 Bureau Direct 09/2003 09/2006 2.500% 25,000 01565 Bureau Direct 01/2004 01/2007 2.500% 25,000 01566 Bureau Direct 04/2004 04/2007 2.950% 35,000 01567 Bureau Direct 07/2004 07/2007 3.450% 25,000 01568 Bureau Direct 09/2004 09/2007 3.100% 30,000 01569 Bureau Direct 11/2004 11/2007 3.500% 20,000 01570 Bureau Direct 01/2005 01/2008 3.600% 20,000 01571 Bureau Direct 06/2005 06/2008 3.950% 30,000 01572 Bureau Direct 09/2005 09/2008 4.250% 25,000 01573 Bureau Direct 03/2006 03/2009 5.050% 25,000 01574 Bureau Direct 07/2006 07/2009 5.350% 45,000 01575 Bureau Direct 09/2006 09/2009 4.950% 15,000 01576 Bureau Direct 01/2007 01/2010 5.100% 35,000 0
BP-18-FS-BPA-02A Page 207

TABLE 13A:
HISTORICAL INVESTMENTS, SHIFT STUDY
October 1, 2015 - September 30, 2019 Cost Evaluation period
($000s) (FY 2019)
A B C D E F G H
Project
In Service
Date
Due
Date
Interest
Rate
Initial
Principal Current Principal
Roll Maturity
Date
Rollover
Rate
1577 Bureau Direct 03/2007 03/2010 4.800% 30,000 01578 Bureau Direct 06/2007 06/2010 5.350% 30,000 01579 Bureau Direct 01/2008 01/2011 2.850% 35,000 01580 Bureau Direct 01/2008 01/2011 2.850% 20,000 01581 Bureau Direct 05/2008 05/2011 3.358% 35,000 01582 Bureau Direct 05/2008 05/2011 3.358% 25,000 01583 Bureau Direct 06/2008 06/2012 3.974% 30,000 01584 Bureau Direct 07/2008 07/2012 3.913% 35,000 01585 Bureau Direct 09/2008 09/2012 3.444% 35,000 01586 Bureau Direct 01/2009 01/2021 3.999% 25,000 25,0001587 Bureau Direct 04/2009 04/2023 4.391% 25,000 25,000 04/2028 3.64%1588 Bureau Direct 06/2009 06/2039 5.192% 25,000 25,0001589 Bureau Direct 09/2009 09/2019 3.699% 25,000 25,000 09/2029 3.71%1590 Bureau Direct 10/2009 10/2018 3.719% 24,000 24,0001591 Bureau Direct 10/2009 10/2019 3.842% 20,000 20,0001592 Bureau Direct 11/2009 11/2019 3.637% 7,000 7,0001593 Bureau Direct 12/2009 12/2019 4.194% 13,000 13,0001594 Bureau Direct 01/2010 01/2019 3.714% 10,000 10,000 01/2029 3.71%1595 Bureau Direct 02/2010 02/2019 0.165% 10,000 01596 Bureau Direct 03/2010 03/2020 4.083% 30,000 30,0001597 Bureau Direct 04/2010 04/2020 3.973% 18,000 18,0001598 Bureau Direct 05/2010 05/2020 3.574% 15,000 15,0001599 Bureau Direct 06/2010 06/2020 3.243% 10,000 10,000 06/2030 4.06%1600 Bureau Direct 06/2010 06/2020 3.243% 30,000 30,000 06/2030 4.06%1601 Bureau Direct 07/2010 07/2020 3.118% 17,000 17,0001602 Bureau Direct 08/2010 08/2020 0.165% 5,000 01603 Bureau Direct 09/2010 09/2021 2.883% 22,000 22,0001604 Bureau Direct 10/2010 10/2034 4.211% 20,000 20,0001605 Bureau Direct 01/2011 09/2011 0.244% 20,000 01606 Bureau Direct 01/2011 09/2011 0.244% 35,000 01607 Bureau Direct 01/2011 01/2039 5.040% 35,000 35,0001608 Bureau Direct 02/2011 02/2040 4.995% 50,000 50,0001609 Bureau Direct 05/2011 09/2011 0.076% 35,000 01610 Bureau Direct 05/2011 09/2011 0.076% 25,000 01611 Bureau Direct 06/2011 06/2036 4.629% 30,000 30,0001612 Bureau Direct 06/2011 06/2038 4.700% 30,000 30,0001613 Bureau Direct 08/2011 08/2037 4.208% 30,000 30,0001614 Bureau Direct 09/2011 07/2041 3.825% 30,000 01615 Bureau Direct 12/2011 12/2038 3.880% 35,000 01616 Bureau Direct 01/2012 01/2038 3.893% 15,000 01617 Bureau Direct 02/2012 02/2034 0.697% 55,000 55,0001618 Bureau Direct 06/2012 06/2041 3.666% 50,000 01619 Bureau Direct 06/2012 09/2012 0.119% 30,000 01620 Bureau Direct 08/2012 07/2042 3.834% 44,000 01621 Bureau Direct 09/2012 09/2013 0.174% 35,000 01622 Bureau Direct 09/2012 09/2042 3.668% 25,000 01623 Bureau Direct 01/2013 01/2043 6.194% 70,000 01624 Bureau Direct 02/2013 02/2043 5.993% 18,000 01625 Bureau Direct 03/2013 03/2043 5.958% 15,000 01626 Bureau Direct 04/2013 04/2043 5.633% 15,000 01627 Bureau Direct 05/2013 05/2043 6.192% 18,000 01628 Bureau Direct 06/2013 01/2039 0.674% 35,000 35,0001629 Bureau Direct 06/2013 06/2043 6.938% 21,000 01630 Bureau Direct 07/2013 07/2034 7.164% 25,000 01631 Bureau Direct 08/2013 08/2034 7.413% 15,000 01632 Bureau Direct 11/2013 09/2014 0.140% 77,000 01633 Bureau Direct 11/2013 09/2021 2.812% 50,000 50,0001634 Bureau Direct 11/2013 09/2022 3.125% 19,000 19,0001635 Bureau Direct 11/2013 09/2020 2.473% 51,000 51,000 09/2030 4.06%1636 Bureau Direct 01/2014 12/2018 1.943% 43,000 43,0001637 Bureau Direct 01/2014 12/2018 1.943% 38,000 38,0001638 Bureau Direct 01/2014 12/2018 1.943% 21,000 21,000 12/2028 3.71%1639 Bureau Direct 01/2014 12/2018 1.943% 26,000 26,000 12/2028 3.71%1640 Bureau Direct 01/2014 12/2018 1.943% 14,000 14,000 12/2028 3.71%1641 Bureau Direct 09/2014 05/2032 0.713% 16,000 16,0001642 Bureau Direct 09/2014 05/2032 0.713% 10,000 10,0001643 Bureau Direct 09/2014 06/2033 0.732% 11,000 11,0001644 Bureau Direct 09/2014 06/2033 0.732% 12,000 12,0001645 Bureau Direct 09/2014 07/2033 0.674% 15,000 15,0001646 Bureau Direct 09/2015 09/2033 3.134% 10,000 10,0001647 Bureau Direct 04/2016 04/2031 2.661% 17,000 17,0001648 Bureau Direct 07/2016 07/2030 2.145% 12,000 12,0001649 Bureau Direct 07/2016 07/2030 2.145% 25,000 25,0001650 Conservation 09/1983 09/2003 12.200% 140,000 01651 Conservation 09/1984 09/2004 13.050% 150,000 01652 Conservation 09/1985 09/1990 10.150% 50,000 01653 Conservation 03/1986 03/1991 7.800% 50,000 01654 Conservation 03/1986 03/1996 8.150% 50,000 01655 Conservation 04/1987 04/2007 9.300% 75,000 01656 Conservation 06/1987 06/1992 8.350% 50,000 01657 Conservation 04/1988 04/2008 9.900% 90,000 01658 Conservation 07/1989 07/2009 8.550% 40,000 0
BP-18-FS-BPA-02A Page 208
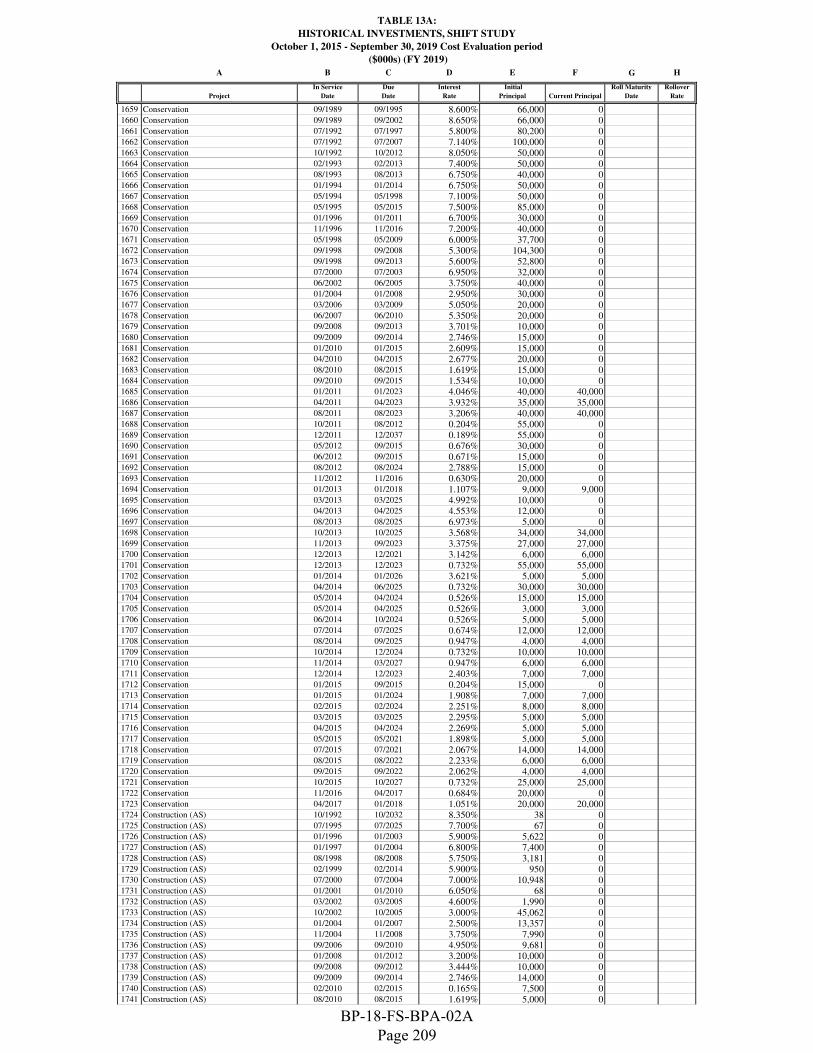
TABLE 13A:
HISTORICAL INVESTMENTS, SHIFT STUDY
October 1, 2015 - September 30, 2019 Cost Evaluation period
($000s) (FY 2019)
A B C D E F G H
Project
In Service
Date
Due
Date
Interest
Rate
Initial
Principal Current Principal
Roll Maturity
Date
Rollover
Rate
1659 Conservation 09/1989 09/1995 8.600% 66,000 01660 Conservation 09/1989 09/2002 8.650% 66,000 01661 Conservation 07/1992 07/1997 5.800% 80,200 01662 Conservation 07/1992 07/2007 7.140% 100,000 01663 Conservation 10/1992 10/2012 8.050% 50,000 01664 Conservation 02/1993 02/2013 7.400% 50,000 01665 Conservation 08/1993 08/2013 6.750% 40,000 01666 Conservation 01/1994 01/2014 6.750% 50,000 01667 Conservation 05/1994 05/1998 7.100% 50,000 01668 Conservation 05/1995 05/2015 7.500% 85,000 01669 Conservation 01/1996 01/2011 6.700% 30,000 01670 Conservation 11/1996 11/2016 7.200% 40,000 01671 Conservation 05/1998 05/2009 6.000% 37,700 01672 Conservation 09/1998 09/2008 5.300% 104,300 01673 Conservation 09/1998 09/2013 5.600% 52,800 01674 Conservation 07/2000 07/2003 6.950% 32,000 01675 Conservation 06/2002 06/2005 3.750% 40,000 01676 Conservation 01/2004 01/2008 2.950% 30,000 01677 Conservation 03/2006 03/2009 5.050% 20,000 01678 Conservation 06/2007 06/2010 5.350% 20,000 01679 Conservation 09/2008 09/2013 3.701% 10,000 01680 Conservation 09/2009 09/2014 2.746% 15,000 01681 Conservation 01/2010 01/2015 2.609% 15,000 01682 Conservation 04/2010 04/2015 2.677% 20,000 01683 Conservation 08/2010 08/2015 1.619% 15,000 01684 Conservation 09/2010 09/2015 1.534% 10,000 01685 Conservation 01/2011 01/2023 4.046% 40,000 40,0001686 Conservation 04/2011 04/2023 3.932% 35,000 35,0001687 Conservation 08/2011 08/2023 3.206% 40,000 40,0001688 Conservation 10/2011 08/2012 0.204% 55,000 01689 Conservation 12/2011 12/2037 0.189% 55,000 01690 Conservation 05/2012 09/2015 0.676% 30,000 01691 Conservation 06/2012 09/2015 0.671% 15,000 01692 Conservation 08/2012 08/2024 2.788% 15,000 01693 Conservation 11/2012 11/2016 0.630% 20,000 01694 Conservation 01/2013 01/2018 1.107% 9,000 9,0001695 Conservation 03/2013 03/2025 4.992% 10,000 01696 Conservation 04/2013 04/2025 4.553% 12,000 01697 Conservation 08/2013 08/2025 6.973% 5,000 01698 Conservation 10/2013 10/2025 3.568% 34,000 34,0001699 Conservation 11/2013 09/2023 3.375% 27,000 27,0001700 Conservation 12/2013 12/2021 3.142% 6,000 6,0001701 Conservation 12/2013 12/2023 0.732% 55,000 55,0001702 Conservation 01/2014 01/2026 3.621% 5,000 5,0001703 Conservation 04/2014 06/2025 0.732% 30,000 30,0001704 Conservation 05/2014 04/2024 0.526% 15,000 15,0001705 Conservation 05/2014 04/2025 0.526% 3,000 3,0001706 Conservation 06/2014 10/2024 0.526% 5,000 5,0001707 Conservation 07/2014 07/2025 0.674% 12,000 12,0001708 Conservation 08/2014 09/2025 0.947% 4,000 4,0001709 Conservation 10/2014 12/2024 0.732% 10,000 10,0001710 Conservation 11/2014 03/2027 0.947% 6,000 6,0001711 Conservation 12/2014 12/2023 2.403% 7,000 7,0001712 Conservation 01/2015 09/2015 0.204% 15,000 01713 Conservation 01/2015 01/2024 1.908% 7,000 7,0001714 Conservation 02/2015 02/2024 2.251% 8,000 8,0001715 Conservation 03/2015 03/2025 2.295% 5,000 5,0001716 Conservation 04/2015 04/2024 2.269% 5,000 5,0001717 Conservation 05/2015 05/2021 1.898% 5,000 5,0001718 Conservation 07/2015 07/2021 2.067% 14,000 14,0001719 Conservation 08/2015 08/2022 2.233% 6,000 6,0001720 Conservation 09/2015 09/2022 2.062% 4,000 4,0001721 Conservation 10/2015 10/2027 0.732% 25,000 25,0001722 Conservation 11/2016 04/2017 0.684% 20,000 01723 Conservation 04/2017 01/2018 1.051% 20,000 20,0001724 Construction (AS) 10/1992 10/2032 8.350% 38 01725 Construction (AS) 07/1995 07/2025 7.700% 67 01726 Construction (AS) 01/1996 01/2003 5.900% 5,622 01727 Construction (AS) 01/1997 01/2004 6.800% 7,400 01728 Construction (AS) 08/1998 08/2008 5.750% 3,181 01729 Construction (AS) 02/1999 02/2014 5.900% 950 01730 Construction (AS) 07/2000 07/2004 7.000% 10,948 01731 Construction (AS) 01/2001 01/2010 6.050% 68 01732 Construction (AS) 03/2002 03/2005 4.600% 1,990 01733 Construction (AS) 10/2002 10/2005 3.000% 45,062 01734 Construction (AS) 01/2004 01/2007 2.500% 13,357 01735 Construction (AS) 11/2004 11/2008 3.750% 7,990 01736 Construction (AS) 09/2006 09/2010 4.950% 9,681 01737 Construction (AS) 01/2008 01/2012 3.200% 10,000 01738 Construction (AS) 09/2008 09/2012 3.444% 10,000 01739 Construction (AS) 09/2009 09/2014 2.746% 14,000 01740 Construction (AS) 02/2010 02/2015 0.165% 7,500 01741 Construction (AS) 08/2010 08/2015 1.619% 5,000 0
BP-18-FS-BPA-02A Page 209

TABLE 13A:
HISTORICAL INVESTMENTS, SHIFT STUDY
October 1, 2015 - September 30, 2019 Cost Evaluation period
($000s) (FY 2019)
A B C D E F G H
Project
In Service
Date
Due
Date
Interest
Rate
Initial
Principal Current Principal
Roll Maturity
Date
Rollover
Rate
1742 Construction (AS) 06/2011 06/2016 1.957% 7,000 01743 Construction (AS) 08/2011 08/2016 1.423% 3,500 01744 Construction (AS) 01/2012 09/2012 0.146% 10,000 01745 Construction (AS) 06/2012 09/2015 0.671% 7,700 01746 Construction (AS) 11/2012 11/2018 1.109% 5,250 5,2501747 Construction (AS) 04/2013 04/2017 0.622% 2,450 01748 Construction (AS) 06/2013 06/2017 1.271% 3,000 3,000 06/2018 0.75%1749 Construction (AS) 08/2013 08/2017 1.494% 2,000 2,000 08/2018 0.75%1750 Construction (AS) 10/2013 10/2019 2.039% 4,200 4,2001751 Construction (AS) 10/2013 10/2019 2.039% 5,000 5,0001752 Construction (AS) 01/2014 01/2020 2.183% 1,750 1,7501753 Construction (AS) 01/2014 01/2020 2.183% 2,000 2,0001754 Construction (AS) 02/2014 09/2014 0.117% 950 01755 Construction (AS) 04/2014 03/2020 0.947% 1,400 1,4001756 Construction (AS) 04/2014 03/2020 0.947% 2,000 2,0001757 Construction (AS) 05/2014 04/2020 0.526% 700 7001758 Construction (AS) 07/2014 07/2020 0.674% 1,050 1,0501759 Construction (AS) 11/2014 11/2020 1.809% 2,100 2,1001760 Construction (AS) 12/2014 12/2020 1.922% 1,050 1,0501761 Construction (AS) 02/2015 02/2021 1.761% 1,750 1,7501762 Construction (AS) 05/2015 05/2021 1.898% 2,100 2,1001763 Construction (AS) 09/2015 09/2017 0.744% 7,700 7,700 09/2018 0.75%1764 Construction (AS) 10/2015 10/2021 1.942% 2,800 2,8001765 Construction (AS) 02/2016 02/2022 0.697% 3,000 3,0001766 Construction (AS) 06/2016 09/2016 0.436% 7,000 01767 Construction (AS) 04/2017 01/2018 1.051% 2,450 2,4501768 Corps 09/2015 09/2033 3.134% 4,000 4,0001769 Corps 02/2016 02/2045 0.697% 3,000 3,0001770 Corps 04/2016 04/2031 2.661% 53,000 53,0001771 Corps 05/2016 05/2030 2.599% 15,000 15,0001772 Fish and Wildlife 05/1989 05/1999 8.950% 25,000 01773 Fish and Wildlife 05/1991 05/1996 7.950% 50,000 01774 Fish and Wildlife 02/1993 02/2008 6.950% 20,000 01775 Fish and Wildlife 09/1994 09/1999 7.650% 20,000 01776 Fish and Wildlife 08/1995 08/2010 7.200% 35,000 01777 Fish and Wildlife 01/1998 01/2013 6.100% 60,000 01778 Fish and Wildlife 09/1999 09/2003 6.300% 20,000 01779 Fish and Wildlife 01/2001 01/2005 5.650% 25,000 01780 Fish and Wildlife 09/2003 09/2007 3.100% 20,000 01781 Fish and Wildlife 09/2005 09/2008 4.250% 20,000 01782 Fish and Wildlife 09/2006 09/2010 4.950% 20,000 01783 Fish and Wildlife 06/2007 06/2010 5.350% 30,000 01784 Fish and Wildlife 09/2007 09/2011 4.700% 20,000 01785 Fish and Wildlife 09/2008 09/2012 3.444% 20,000 01786 Fish and Wildlife 06/2009 06/2024 4.556% 20,000 20,0001787 Fish and Wildlife 12/2009 12/2018 4.069% 26,000 26,0001788 Fish and Wildlife 08/2010 08/2019 2.646% 20,000 20,0001789 Fish and Wildlife 01/2011 01/2026 4.440% 50,000 50,0001790 Fish and Wildlife 02/2011 02/2026 4.398% 15,000 15,0001791 Fish and Wildlife 06/2011 06/2026 4.205% 15,000 15,0001792 Fish and Wildlife 01/2012 01/2038 3.893% 30,000 01793 Fish and Wildlife 05/2012 05/2029 0.140% 5,000 01794 Fish and Wildlife 06/2012 06/2041 3.666% 11,000 01795 Fish and Wildlife 08/2012 08/2027 3.090% 11,000 01796 Fish and Wildlife 11/2012 11/2027 5.046% 25,000 01797 Fish and Wildlife 01/2013 09/2013 0.149% 60,000 01798 Fish and Wildlife 03/2013 03/2028 5.445% 10,000 01799 Fish and Wildlife 04/2013 04/2028 5.042% 6,000 01800 Fish and Wildlife 06/2013 06/2028 6.607% 8,000 01801 Fish and Wildlife 08/2013 08/2028 7.249% 5,000 01802 Fish and Wildlife 10/2013 12/2026 3.717% 28,000 28,0001803 Fish and Wildlife 10/2013 05/2027 3.762% 11,000 11,0001804 Fish and Wildlife 10/2013 10/2028 3.880% 22,000 22,0001805 Fish and Wildlife 11/2013 09/2022 3.125% 31,000 31,0001806 Fish and Wildlife 11/2013 09/2023 3.375% 23,000 23,000 09/2028 3.64%1807 Fish and Wildlife 11/2013 05/2027 0.713% 5,000 5,0001808 Fish and Wildlife 01/2014 01/2029 3.896% 7,000 7,0001809 Fish and Wildlife 04/2014 02/2029 0.697% 7,000 7,0001810 Fish and Wildlife 05/2014 04/2027 0.526% 11,000 11,0001811 Fish and Wildlife 08/2014 07/2029 0.674% 5,000 5,0001812 Fish and Wildlife 10/2014 01/2029 0.674% 15,000 15,0001813 Fish and Wildlife 11/2014 03/2030 0.947% 8,000 8,0001814 Fish and Wildlife 01/2015 01/2024 1.908% 5,000 5,0001815 Fish and Wildlife 03/2015 03/2028 2.511% 3,000 3,0001816 Fish and Wildlife 10/2015 02/2031 0.697% 4,000 4,0001817 Fish and Wildlife 10/2015 03/2031 0.947% 5,000 5,0001818 Fish and Wildlife 02/2016 02/2031 0.697% 4,000 4,0001819 Technology (G) 01/2015 01/2021 1.469% 35,000 35,0001820 Technology (G) 10/2015 07/2022 0.674% 6,000 6,0001821 Totals: 12,248,313 4,251,052
BP-18-FS-BPA-02A Page 210

TABLE 13B
PROJECTED INVESTMENTS, SHIFT STUDY
October 1, 2015 - September 30, 2019 Cost Evaluation period
($000s) (FY 2019)
A B C D E F G
Project
In Service
Date
Due
Date
Interest
Rate
Current
Principal
Roll
Maturity Date
Rollover
Rate
1 Bureau Direct 07/2017 07/2032 2.180% 13,000
2 Bureau Direct 08/2017 08/2032 2.180% 13,000
3 Bureau Direct 09/2017 09/2032 2.180% 14,000
4 Bureau Direct 07/2018 07/2033 3.250% 28,000
5 Bureau Direct 08/2018 08/2034 3.290% 28,000
6 Bureau Direct 09/2018 09/2035 3.330% 29,000
7 Bureau Direct 07/2019 07/2036 3.960% 47,000
8 Bureau Direct 08/2019 08/2037 3.990% 48,000
9 Bureau Direct 09/2019 09/2038 4.030% 48,000
10 Columbia River Fish Mitigation 09/2017 09/2067 2.380% 63,629
11 Columbia River Fish Mitigation 09/2018 09/2068 3.320% 147,186
12 Columbia River Fish Mitigation 09/2019 09/2069 3.870% 63,746
13 Construction (AS) 09/2017 09/2023 1.510% 3,150
14 Construction (AS) 09/2018 09/2024 2.560% 5,600
15 Construction (AS) 09/2019 09/2025 3.270% 5,950
16 Corps 07/2017 07/2032 2.180% 26,796
17 Corps 08/2017 08/2032 2.180% 26,796
18 Corps 09/2017 09/2032 2.180% 27,796
19 Corps 07/2018 07/2033 3.250% 53,000
20 Corps 08/2018 08/2034 3.290% 53,000
21 Corps 09/2018 09/2035 3.330% 53,000
22 Corps 07/2019 07/2036 3.960% 40,000
23 Corps 08/2019 08/2037 3.990% 41,000
24 Corps 09/2019 09/2038 4.030% 41,000
25 Fish and Wildlife 09/2017 09/2032 2.180% 40,000
26 Fish and Wildlife 09/2018 09/2033 3.250% 51,000
27 Fish and Wildlife 09/2019 09/2034 3.890% 44,000
28 Technology (G) 09/2017 09/2022 1.400% 8,000
29 Technology (G) 09/2018 09/2023 2.440% 5,000
30 Technology (G) 09/2019 03/2024 3.160% 5,000
31 Totals: 1,072,650
BP-18-FS-BPA-02A Page 211
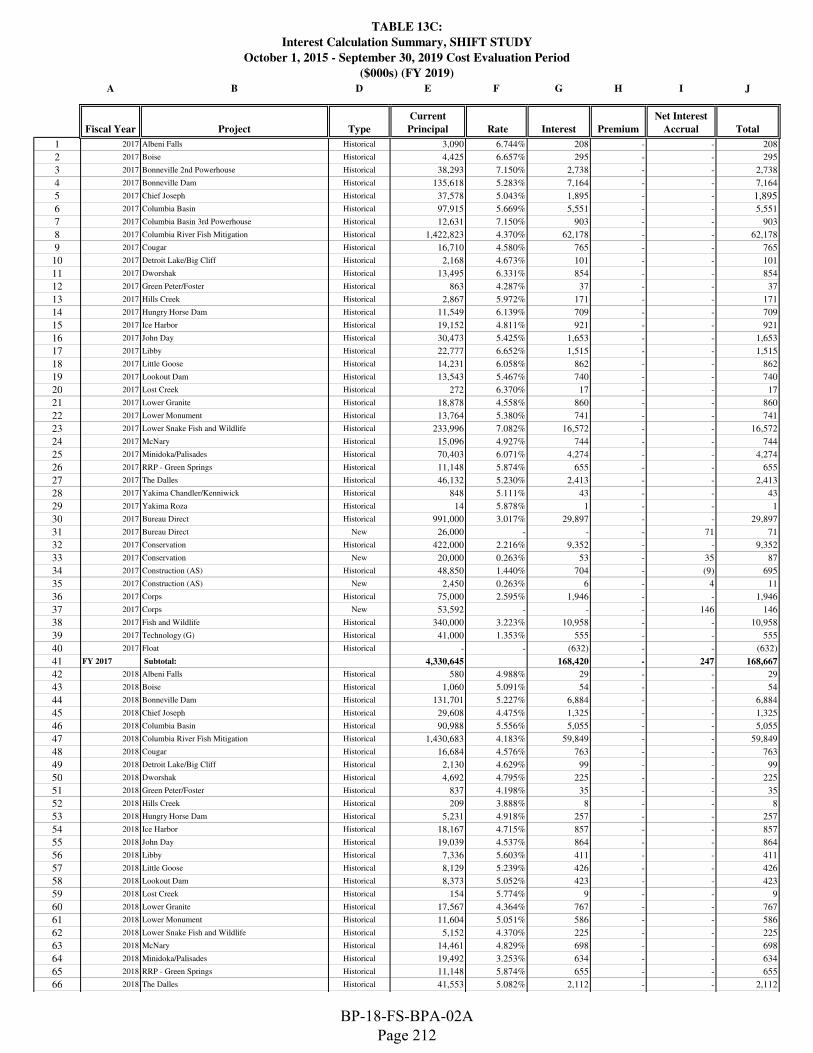
TABLE 13C:
Interest Calculation Summary, SHIFT STUDY
October 1, 2015 - September 30, 2019 Cost Evaluation Period
($000s) (FY 2019)
A B D E F G H I J
Fiscal Year Project Type
Current
Principal Rate Interest Premium
Net Interest
Accrual Total
1 2017 Albeni Falls Historical 3,090 6.744% 208 - - 208
2 2017 Boise Historical 4,425 6.657% 295 - - 295
3 2017 Bonneville 2nd Powerhouse Historical 38,293 7.150% 2,738 - - 2,738
4 2017 Bonneville Dam Historical 135,618 5.283% 7,164 - - 7,164
5 2017 Chief Joseph Historical 37,578 5.043% 1,895 - - 1,895
6 2017 Columbia Basin Historical 97,915 5.669% 5,551 - - 5,551
7 2017 Columbia Basin 3rd Powerhouse Historical 12,631 7.150% 903 - - 903
8 2017 Columbia River Fish Mitigation Historical 1,422,823 4.370% 62,178 - - 62,178
9 2017 Cougar Historical 16,710 4.580% 765 - - 765
10 2017 Detroit Lake/Big Cliff Historical 2,168 4.673% 101 - - 101
11 2017 Dworshak Historical 13,495 6.331% 854 - - 854
12 2017 Green Peter/Foster Historical 863 4.287% 37 - - 37
13 2017 Hills Creek Historical 2,867 5.972% 171 - - 171
14 2017 Hungry Horse Dam Historical 11,549 6.139% 709 - - 709
15 2017 Ice Harbor Historical 19,152 4.811% 921 - - 921
16 2017 John Day Historical 30,473 5.425% 1,653 - - 1,653
17 2017 Libby Historical 22,777 6.652% 1,515 - - 1,515
18 2017 Little Goose Historical 14,231 6.058% 862 - - 862
19 2017 Lookout Dam Historical 13,543 5.467% 740 - - 740
20 2017 Lost Creek Historical 272 6.370% 17 - - 17
21 2017 Lower Granite Historical 18,878 4.558% 860 - - 860
22 2017 Lower Monument Historical 13,764 5.380% 741 - - 741
23 2017 Lower Snake Fish and Wildlife Historical 233,996 7.082% 16,572 - - 16,572
24 2017 McNary Historical 15,096 4.927% 744 - - 744
25 2017 Minidoka/Palisades Historical 70,403 6.071% 4,274 - - 4,274
26 2017 RRP - Green Springs Historical 11,148 5.874% 655 - - 655
27 2017 The Dalles Historical 46,132 5.230% 2,413 - - 2,413
28 2017 Yakima Chandler/Kenniwick Historical 848 5.111% 43 - - 43
29 2017 Yakima Roza Historical 14 5.878% 1 - - 1
30 2017 Bureau Direct Historical 991,000 3.017% 29,897 - - 29,897
31 2017 Bureau Direct New 26,000 - - - 71 71
32 2017 Conservation Historical 422,000 2.216% 9,352 - - 9,352
33 2017 Conservation New 20,000 0.263% 53 - 35 87
34 2017 Construction (AS) Historical 48,850 1.440% 704 - (9) 695
35 2017 Construction (AS) New 2,450 0.263% 6 - 4 11
36 2017 Corps Historical 75,000 2.595% 1,946 - - 1,946
37 2017 Corps New 53,592 - - - 146 146
38 2017 Fish and Wildlife Historical 340,000 3.223% 10,958 - - 10,958
39 2017 Technology (G) Historical 41,000 1.353% 555 - - 555
40 2017 Float Historical - - (632) - - (632)
41 FY 2017 Subtotal: 4,330,645 168,420 - 247 168,667
42 2018 Albeni Falls Historical 580 4.988% 29 - - 29
43 2018 Boise Historical 1,060 5.091% 54 - - 54
44 2018 Bonneville Dam Historical 131,701 5.227% 6,884 - - 6,884
45 2018 Chief Joseph Historical 29,608 4.475% 1,325 - - 1,325
46 2018 Columbia Basin Historical 90,988 5.556% 5,055 - - 5,055
47 2018 Columbia River Fish Mitigation Historical 1,430,683 4.183% 59,849 - - 59,849
48 2018 Cougar Historical 16,684 4.576% 763 - - 763
49 2018 Detroit Lake/Big Cliff Historical 2,130 4.629% 99 - - 99
50 2018 Dworshak Historical 4,692 4.795% 225 - - 225
51 2018 Green Peter/Foster Historical 837 4.198% 35 - - 35
52 2018 Hills Creek Historical 209 3.888% 8 - - 8
53 2018 Hungry Horse Dam Historical 5,231 4.918% 257 - - 257
54 2018 Ice Harbor Historical 18,167 4.715% 857 - - 857
55 2018 John Day Historical 19,039 4.537% 864 - - 864
56 2018 Libby Historical 7,336 5.603% 411 - - 411
57 2018 Little Goose Historical 8,129 5.239% 426 - - 426
58 2018 Lookout Dam Historical 8,373 5.052% 423 - - 423
59 2018 Lost Creek Historical 154 5.774% 9 - - 9
60 2018 Lower Granite Historical 17,567 4.364% 767 - - 767
61 2018 Lower Monument Historical 11,604 5.051% 586 - - 586
62 2018 Lower Snake Fish and Wildlife Historical 5,152 4.370% 225 - - 225
63 2018 McNary Historical 14,461 4.829% 698 - - 698
64 2018 Minidoka/Palisades Historical 19,492 3.253% 634 - - 634
65 2018 RRP - Green Springs Historical 11,148 5.874% 655 - - 655
66 2018 The Dalles Historical 41,553 5.082% 2,112 - - 2,112
BP-18-FS-BPA-02A Page 212

TABLE 13C:
Interest Calculation Summary, SHIFT STUDY
October 1, 2015 - September 30, 2019 Cost Evaluation Period
($000s) (FY 2019)
A B D E F G H I J
Fiscal Year Project Type
Current
Principal Rate Interest Premium
Net Interest
Accrual Total
67 2018 Yakima Chandler/Kenniwick Historical 848 5.111% 43 - - 43
68 2018 Yakima Roza Historical 14 5.878% 1 - - 1
69 2018 Bureau Direct Historical 1,031,000 2.984% 30,768 - - 30,768
70 2018 Bureau Direct New 56,000 - - - 228 228
71 2018 Conservation Historical 442,000 2.128% 9,407 - (51) 9,356
72 2018 Construction (AS) Historical 54,450 1.245% 678 - (7) 670
73 2018 Corps Historical 156,389 2.378% 3,719 - - 3,719
74 2018 Corps New 106,000 - - - 432 432
75 2018 Fish and Wildlife Historical 380,000 3.113% 11,830 - - 11,830
76 2018 Technology (G) Historical 49,000 1.360% 667 - - 667
77 2018 Float Historical - - (611) - - (611)
78 FY 2018 Subtotal: 4,172,280 139,752 - 601 140,353
79 2019 Albeni Falls Historical 580 4.988% 29 - - 29
80 2019 Boise Historical 1,060 5.091% 54 - - 54
81 2019 Bonneville Dam Historical 107,256 5.022% 5,387 - - 5,387
82 2019 Chief Joseph Historical 29,608 4.475% 1,325 - - 1,325
83 2019 Columbia Basin Historical 90,988 5.556% 5,055 - - 5,055
84 2019 Columbia River Fish Mitigation Historical 1,541,604 4.056% 62,523 - - 62,523
85 2019 Cougar Historical 16,684 4.576% 763 - - 763
86 2019 Detroit Lake/Big Cliff Historical 2,130 4.629% 99 - - 99
87 2019 Dworshak Historical 4,692 4.795% 225 - - 225
88 2019 Green Peter/Foster Historical 638 3.673% 23 - - 23
89 2019 Hills Creek Historical 202 3.813% 8 - - 8
90 2019 Hungry Horse Dam Historical 4,679 4.806% 225 - - 225
91 2019 Ice Harbor Historical 17,402 4.664% 812 - - 812
92 2019 John Day Historical 18,421 4.492% 827 - - 827
93 2019 Libby Historical 1,774 4.751% 84 - - 84
94 2019 Little Goose Historical 3,521 4.406% 155 - - 155
95 2019 Lookout Dam Historical 8,373 5.052% 423 - - 423
96 2019 Lost Creek Historical 7 3.748% - -
97 2019 Lower Granite Historical 15,542 4.168% 648 - - 648
98 2019 Lower Monument Historical 8,303 4.723% 392 - - 392
99 2019 Lower Snake Fish and Wildlife Historical 4,827 4.268% 206 - - 206
100 2019 McNary Historical 13,414 4.747% 637 - - 637
101 2019 Minidoka/Palisades Historical 19,450 3.247% 632 - - 632
102 2019 RRP - Green Springs Historical 3 3.244% - -
103 2019 The Dalles Historical 41,553 5.082% 2,112 - - 2,112
104 2019 Yakima Chandler/Kenniwick Historical 848 5.111% 43 - - 43
105 2019 Bureau Direct Historical 1,116,000 3.001% 33,493 - (1,121) 32,372
106 2019 Bureau Direct New 95,000 - - - 469 469
107 2019 Conservation Historical 413,000 2.240% 9,252 - - 9,252
108 2019 Construction (AS) Historical 44,900 1.640% 736 - (20) 717
109 2019 Corps Historical 315,389 2.836% 8,945 - - 8,945
110 2019 Corps New 81,000 - - - 400 400
111 2019 Fish and Wildlife Historical 431,000 3.007% 12,958 - (309) 12,649
112 2019 Technology (G) Historical 54,000 1.460% 789 - - 789
113 2019 Float Historical - - (1,144) - - (1,144)
114 FY 2019 Subtotal: 4,503,846 147,718 - (582) 147,136
115 2020 Albeni Falls Historical 580 4.988% 29 - - 29
116 2020 Boise Historical 1,060 5.091% 54 - - 54
117 2020 Bonneville Dam Historical 107,256 5.022% 5,387 - - 5,387
118 2020 Chief Joseph Historical 29,608 4.475% 1,325 - - 1,325
119 2020 Columbia Basin Historical 76,752 5.497% 4,219 - - 4,219
120 2020 Columbia River Fish Mitigation Historical 1,602,497 4.045% 64,822 - - 64,822
121 2020 Cougar Historical 16,684 4.576% 763 - - 763
122 2020 Detroit Lake/Big Cliff Historical 1,848 4.439% 82 - - 82
123 2020 Dworshak Historical 4,692 4.795% 225 - - 225
124 2020 Green Peter/Foster Historical 638 3.673% 23 - - 23
125 2020 Hills Creek Historical 202 3.813% 8 - - 8
126 2020 Hungry Horse Dam Historical 4,679 4.806% 225 - - 225
127 2020 Ice Harbor Historical 17,402 4.664% 812 - - 812
128 2020 John Day Historical 18,421 4.492% 827 - - 827
129 2020 Libby Historical 1,774 4.751% 84 - - 84
130 2020 Little Goose Historical 3,521 4.406% 155 - - 155
131 2020 Lookout Dam Historical 8,373 5.052% 423 - - 423
132 2020 Lost Creek Historical 7 3.748% - -
BP-18-FS-BPA-02A Page 213

TABLE 13C:
Interest Calculation Summary, SHIFT STUDY
October 1, 2015 - September 30, 2019 Cost Evaluation Period
($000s) (FY 2019)
A B D E F G H I J
Fiscal Year Project Type
Current
Principal Rate Interest Premium
Net Interest
Accrual Total
133 2020 Lower Granite Historical 15,542 4.168% 648 - - 648
134 2020 Lower Monument Historical 8,303 4.723% 392 - - 392
135 2020 Lower Snake Fish and Wildlife Historical 4,827 4.268% 206 - - 206
136 2020 McNary Historical 13,414 4.747% 637 - - 637
137 2020 Minidoka/Palisades Historical 19,450 3.247% 632 - - 632
138 2020 RRP - Green Springs Historical 3 3.244% - -
139 2020 The Dalles Historical 41,553 5.082% 2,112 - - 2,112
140 2020 Yakima Chandler/Kenniwick Historical 848 5.111% 43 - - 43
141 2020 Bureau Direct Historical 1,154,000 3.161% 36,480 - (1,023) 35,458
142 2020 Conservation Historical 413,000 2.240% 9,252 - - 9,252
143 2020 Construction (AS) Historical 45,600 1.647% 751 - (94) 657
144 2020 Corps Historical 437,389 3.158% 13,813 - - 13,813
145 2020 Fish and Wildlife Historical 429,000 3.173% 13,613 - - 13,613
146 2020 Replacements New 218,435 2.215% 4,838 - - 4,838
147 2020 Technology (G) Historical 59,000 1.604% 947 - - 947
148 2020 Float Historical - - (975) - - (975)
149 FY 2020 Subtotal: 4,756,356 162,853 - (1,117) 161,736
150 2021 Albeni Falls Historical 580 4.988% 29 - - 29
151 2021 Boise Historical 1,060 5.091% 54 - - 54
152 2021 Bonneville Dam Historical 107,256 5.022% 5,387 - - 5,387
153 2021 Chief Joseph Historical 29,608 4.475% 1,325 - - 1,325
154 2021 Columbia Basin Historical 70,209 5.462% 3,835 - - 3,835
155 2021 Columbia River Fish Mitigation Historical 1,602,497 4.045% 64,822 - - 64,822
156 2021 Cougar Historical 16,684 4.576% 763 - - 763
157 2021 Detroit Lake/Big Cliff Historical 1,848 4.439% 82 - - 82
158 2021 Dworshak Historical 4,692 4.795% 225 - - 225
159 2021 Green Peter/Foster Historical 638 3.673% 23 - - 23
160 2021 Hills Creek Historical 202 3.813% 8 - - 8
161 2021 Hungry Horse Dam Historical 4,679 4.806% 225 - - 225
162 2021 Ice Harbor Historical 17,402 4.664% 812 - - 812
163 2021 John Day Historical 18,421 4.492% 827 - - 827
164 2021 Libby Historical 1,774 4.751% 84 - - 84
165 2021 Little Goose Historical 3,521 4.406% 155 - - 155
166 2021 Lookout Dam Historical 8,373 5.052% 423 - - 423
167 2021 Lost Creek Historical 7 3.748% - -
168 2021 Lower Granite Historical 15,542 4.168% 648 - - 648
169 2021 Lower Monument Historical 8,303 4.723% 392 - - 392
170 2021 Lower Snake Fish and Wildlife Historical 4,827 4.268% 206 - - 206
171 2021 McNary Historical 13,414 4.747% 637 - - 637
172 2021 Minidoka/Palisades Historical 19,450 3.247% 632 - - 632
173 2021 RRP - Green Springs Historical 3 3.244% - -
174 2021 The Dalles Historical 41,553 5.082% 2,112 - - 2,112
175 2021 Yakima Chandler/Kenniwick Historical 848 5.111% 43 - - 43
176 2021 Bureau Direct Historical 1,034,000 3.282% 33,936 - (165) 33,771
177 2021 Conservation Historical 413,000 2.240% 9,252 - (80) 9,173
178 2021 Construction (AS) Historical 27,500 1.982% 545 - (34) 511
179 2021 Corps Historical 437,389 3.158% 13,813 - - 13,813
180 2021 Fish and Wildlife Historical 429,000 3.173% 13,613 - - 13,613
181 2021 Replacements Historical 218,435 4.430% 9,677 - - 9,677
182 2021 Replacements New 218,435 2.215% 4,838 - - 4,838
183 2021 Technology (G) Historical 59,000 1.169% 690 - (85) 605
184 2021 Float Historical - - (1,006) - - (1,006)
185 FY 2021 Subtotal: 4,830,148 169,108 - (363) 168,745
186 2022 Albeni Falls Historical 580 4.988% 29 - - 29
187 2022 Boise Historical 1,060 5.091% 54 - - 54
188 2022 Bonneville Dam Historical 107,256 5.022% 5,387 - - 5,387
189 2022 Chief Joseph Historical 29,608 4.475% 1,325 - - 1,325
190 2022 Columbia Basin Historical 68,069 5.449% 3,709 - - 3,709
191 2022 Columbia River Fish Mitigation Historical 1,602,497 4.045% 64,822 - - 64,822
192 2022 Cougar Historical 16,684 4.576% 763 - - 763
193 2022 Detroit Lake/Big Cliff Historical 1,848 4.439% 82 - - 82
194 2022 Dworshak Historical 4,692 4.795% 225 - - 225
195 2022 Green Peter/Foster Historical 638 3.673% 23 - - 23
196 2022 Hills Creek Historical 202 3.813% 8 - - 8
197 2022 Hungry Horse Dam Historical 4,679 4.806% 225 - - 225
198 2022 Ice Harbor Historical 17,402 4.664% 812 - - 812
BP-18-FS-BPA-02A Page 214

TABLE 13C:
Interest Calculation Summary, SHIFT STUDY
October 1, 2015 - September 30, 2019 Cost Evaluation Period
($000s) (FY 2019)
A B D E F G H I J
Fiscal Year Project Type
Current
Principal Rate Interest Premium
Net Interest
Accrual Total
199 2022 John Day Historical 18,421 4.492% 827 - - 827
200 2022 Libby Historical 1,774 4.751% 84 - - 84
201 2022 Little Goose Historical 3,521 4.406% 155 - - 155
202 2022 Lookout Dam Historical 8,373 5.052% 423 - - 423
203 2022 Lost Creek Historical 7 3.748% - -
204 2022 Lower Granite Historical 15,542 4.168% 648 - - 648
205 2022 Lower Monument Historical 8,303 4.723% 392 - - 392
206 2022 Lower Snake Fish and Wildlife Historical 4,827 4.268% 206 - - 206
207 2022 McNary Historical 13,414 4.747% 637 - - 637
208 2022 Minidoka/Palisades Historical 19,450 3.247% 632 - - 632
209 2022 RRP - Green Springs Historical 3 3.244% - -
210 2022 The Dalles Historical 41,553 5.082% 2,112 - - 2,112
211 2022 Yakima Chandler/Kenniwick Historical 848 5.111% 43 - - 43
212 2022 Bureau Direct Historical 937,000 3.351% 31,396 - - 31,396
213 2022 Conservation Historical 394,000 2.227% 8,774 - (58) 8,715
214 2022 Construction (AS) Historical 20,500 2.064% 423 - (24) 399
215 2022 Corps Historical 437,389 3.158% 13,813 - - 13,813
216 2022 Fish and Wildlife Historical 429,000 3.173% 13,613 - - 13,613
217 2022 Replacements Historical 436,871 4.430% 19,353 - - 19,353
218 2022 Replacements New 218,435 2.215% 4,838 - - 4,838
219 2022 Technology (G) Historical 24,000 1.802% 432 - (7) 426
220 2022 Float Historical - - (898) - - (898)
221 FY 2022 Subtotal: 4,888,444 175,369 - (89) 175,279
222 2023 Albeni Falls Historical 580 4.988% 29 - - 29
223 2023 Boise Historical 1,060 5.091% 54 - - 54
224 2023 Bonneville Dam Historical 107,256 5.022% 5,387 - - 5,387
225 2023 Chief Joseph Historical 29,608 4.475% 1,325 - - 1,325
226 2023 Columbia Basin Historical 30,368 4.920% 1,494 - - 1,494
227 2023 Columbia River Fish Mitigation Historical 1,602,497 4.045% 64,822 - - 64,822
228 2023 Cougar Historical 16,684 4.576% 763 - - 763
229 2023 Detroit Lake/Big Cliff Historical 1,848 4.439% 82 - - 82
230 2023 Dworshak Historical 4,692 4.795% 225 - - 225
231 2023 Green Peter/Foster Historical 638 3.673% 23 - - 23
232 2023 Hills Creek Historical 202 3.813% 8 - - 8
233 2023 Hungry Horse Dam Historical 4,679 4.806% 225 - - 225
234 2023 Ice Harbor Historical 17,402 4.664% 812 - - 812
235 2023 John Day Historical 18,421 4.492% 827 - - 827
236 2023 Libby Historical 1,774 4.751% 84 - - 84
237 2023 Little Goose Historical 3,521 4.406% 155 - - 155
238 2023 Lookout Dam Historical 8,373 5.052% 423 - - 423
239 2023 Lost Creek Historical 7 3.748% - -
240 2023 Lower Granite Historical 15,542 4.168% 648 - - 648
241 2023 Lower Monument Historical 8,303 4.723% 392 - - 392
242 2023 Lower Snake Fish and Wildlife Historical 4,827 4.268% 206 - - 206
243 2023 McNary Historical 13,414 4.747% 637 - - 637
244 2023 Minidoka/Palisades Historical 19,450 3.247% 632 - - 632
245 2023 RRP - Green Springs Historical 3 3.244% - -
246 2023 The Dalles Historical 41,553 5.082% 2,112 - - 2,112
247 2023 Yakima Chandler/Kenniwick Historical 848 5.111% 43 - - 43
248 2023 Bureau Direct Historical 918,000 3.397% 31,182 - (456) 30,726
249 2023 Conservation Historical 378,000 2.025% 7,654 - (947) 6,708
250 2023 Construction (AS) Historical 14,700 2.622% 385 - - 385
251 2023 Corps Historical 437,389 3.158% 13,813 - - 13,813
252 2023 Fish and Wildlife Historical 398,000 3.177% 12,644 - - 12,644
253 2023 Replacements Historical 655,306 4.430% 29,030 - - 29,030
254 2023 Replacements New 218,435 2.215% 4,838 - - 4,838
255 2023 Technology (G) Historical 10,000 2.800% 280 - - 280
256 2023 Float Historical - - (977) - - (977)
257 FY 2023 Subtotal: 4,983,378 180,259 - (1,402) 178,857
258 2024 Albeni Falls Historical 580 4.988% 29 - - 29
259 2024 Boise Historical 1,060 5.091% 54 - - 54
260 2024 Bonneville Dam Historical 107,256 5.022% 5,387 - - 5,387
261 2024 Chief Joseph Historical 29,608 4.475% 1,325 - - 1,325
262 2024 Columbia Basin Historical 30,368 4.920% 1,494 - - 1,494
263 2024 Columbia River Fish Mitigation Historical 1,602,497 4.045% 64,822 - - 64,822
264 2024 Cougar Historical 16,684 4.576% 763 - - 763
BP-18-FS-BPA-02A Page 215

TABLE 13C:
Interest Calculation Summary, SHIFT STUDY
October 1, 2015 - September 30, 2019 Cost Evaluation Period
($000s) (FY 2019)
A B D E F G H I J
Fiscal Year Project Type
Current
Principal Rate Interest Premium
Net Interest
Accrual Total
265 2024 Detroit Lake/Big Cliff Historical 1,848 4.439% 82 - - 82
266 2024 Dworshak Historical 4,692 4.795% 225 - - 225
267 2024 Green Peter/Foster Historical 638 3.673% 23 - - 23
268 2024 Hills Creek Historical 202 3.813% 8 - - 8
269 2024 Hungry Horse Dam Historical 4,679 4.806% 225 - - 225
270 2024 Ice Harbor Historical 17,402 4.664% 812 - - 812
271 2024 John Day Historical 18,421 4.492% 827 - - 827
272 2024 Libby Historical 1,774 4.751% 84 - - 84
273 2024 Little Goose Historical 3,521 4.406% 155 - - 155
274 2024 Lookout Dam Historical 8,373 5.052% 423 - - 423
275 2024 Lost Creek Historical 7 3.748% - -
276 2024 Lower Granite Historical 15,542 4.168% 648 - - 648
277 2024 Lower Monument Historical 8,303 4.723% 392 - - 392
278 2024 Lower Snake Fish and Wildlife Historical 4,827 4.268% 206 - - 206
279 2024 McNary Historical 13,414 4.747% 637 - - 637
280 2024 Minidoka/Palisades Historical 19,450 3.247% 632 - - 632
281 2024 RRP - Green Springs Historical 3 3.244% - -
282 2024 The Dalles Historical 41,553 5.082% 2,112 - - 2,112
283 2024 Yakima Chandler/Kenniwick Historical 848 5.111% 43 - - 43
284 2024 Bureau Direct Historical 918,000 3.335% 30,615 - - 30,615
285 2024 Conservation Historical 236,000 1.202% 2,837 - (260) 2,577
286 2024 Construction (AS) Historical 11,550 2.926% 338 - - 338
287 2024 Corps Historical 437,389 3.158% 13,813 - - 13,813
288 2024 Fish and Wildlife Historical 398,000 3.180% 12,658 - (244) 12,415
289 2024 Replacements Historical 873,742 4.430% 38,707 - - 38,707
290 2024 Replacements New 218,435 2.215% 4,838 - - 4,838
291 2024 Technology (G) Historical 5,000 1.580% 79 - - 79
292 2024 Float Historical - - (951) - - (951)
293 FY 2024 Subtotal: 5,051,664 184,342 - (503) 183,839
294 2025 Albeni Falls Historical 580 4.988% 29 - - 29
295 2025 Boise Historical 1,060 5.091% 54 - - 54
296 2025 Bonneville Dam Historical 107,256 5.022% 5,387 - - 5,387
297 2025 Chief Joseph Historical 29,608 4.475% 1,325 - - 1,325
298 2025 Columbia Basin Historical 25,489 4.737% 1,207 - - 1,207
299 2025 Columbia River Fish Mitigation Historical 1,602,497 4.045% 64,822 - - 64,822
300 2025 Cougar Historical 16,684 4.576% 763 - - 763
301 2025 Detroit Lake/Big Cliff Historical 1,848 4.439% 82 - - 82
302 2025 Dworshak Historical 4,692 4.795% 225 - - 225
303 2025 Green Peter/Foster Historical 638 3.673% 23 - - 23
304 2025 Hills Creek Historical 202 3.813% 8 - - 8
305 2025 Hungry Horse Dam Historical 4,679 4.806% 225 - - 225
306 2025 Ice Harbor Historical 17,402 4.664% 812 - - 812
307 2025 John Day Historical 18,421 4.492% 827 - - 827
308 2025 Libby Historical 1,774 4.751% 84 - - 84
309 2025 Little Goose Historical 3,521 4.406% 155 - - 155
310 2025 Lookout Dam Historical 8,373 5.052% 423 - - 423
311 2025 Lost Creek Historical 7 3.748% - -
312 2025 Lower Granite Historical 15,542 4.168% 648 - - 648
313 2025 Lower Monument Historical 8,303 4.723% 392 - - 392
314 2025 Lower Snake Fish and Wildlife Historical 4,827 4.268% 206 - - 206
315 2025 McNary Historical 13,414 4.747% 637 - - 637
316 2025 Minidoka/Palisades Historical 19,450 3.247% 632 - - 632
317 2025 RRP - Green Springs Historical 3 3.244% - -
318 2025 The Dalles Historical 41,553 5.082% 2,112 - - 2,112
319 2025 Yakima Chandler/Kenniwick Historical 848 5.111% 43 - - 43
320 2025 Bureau Direct Historical 918,000 3.335% 30,615 - - 30,615
321 2025 Conservation Historical 139,000 1.507% 2,095 - (104) 1,991
322 2025 Construction (AS) Historical 5,950 3.270% 195 - - 195
323 2025 Corps Historical 437,389 3.158% 13,813 - - 13,813
324 2025 Fish and Wildlife Historical 373,000 3.137% 11,699 - - 11,699
325 2025 Replacements Historical 1,092,177 4.430% 48,383 - - 48,383
326 2025 Replacements New 218,435 2.215% 4,838 - - 4,838
327 2025 Float Historical - - (847) - - (847)
328 FY 2025 Subtotal: 5,132,620 191,914 - (104) 191,810
BP-18-FS-BPA-02A Page 216

TABLE 13C:
Interest Calculation Summary, SHIFT STUDY
October 1, 2015 - September 30, 2019 Cost Evaluation Period
($000s) (FY 2019)
A B D E F G H I J
Fiscal Year Project Type
Current
Principal Rate Interest Premium
Net Interest
Accrual Total
329 2026 Albeni Falls Historical 580 4.988% 29 - - 29
330 2026 Boise Historical 1,060 5.091% 54 - - 54
331 2026 Bonneville Dam Historical 104,278 5.000% 5,213 - - 5,213
332 2026 Chief Joseph Historical 29,261 4.459% 1,305 - - 1,305
333 2026 Columbia Basin Historical 21,762 4.542% 988 - - 988
334 2026 Columbia River Fish Mitigation Historical 1,593,700 4.037% 64,338 - - 64,338
335 2026 Cougar Historical 16,684 4.576% 763 - - 763
336 2026 Detroit Lake/Big Cliff Historical 1,830 4.428% 81 - - 81
337 2026 Dworshak Historical 4,493 4.764% 214 - - 214
338 2026 Green Peter/Foster Historical 638 3.673% 23 - - 23
339 2026 Hills Creek Historical 200 3.800% 8 - - 8
340 2026 Hungry Horse Dam Historical 4,679 4.806% 225 - - 225
341 2026 Ice Harbor Historical 12,768 4.396% 561 - - 561
342 2026 John Day Historical 14,911 4.284% 639 - - 639
343 2026 Libby Historical 1,774 4.751% 84 - - 84
344 2026 Little Goose Historical 3,494 4.398% 154 - - 154
345 2026 Lookout Dam Historical 8,373 5.052% 423 - - 423
346 2026 Lost Creek Historical 7 3.748% - -
347 2026 Lower Granite Historical 13,411 3.964% 532 - - 532
348 2026 Lower Monument Historical 8,273 4.720% 391 - - 391
349 2026 Lower Snake Fish and Wildlife Historical 3,930 3.987% 157 - - 157
350 2026 McNary Historical 13,414 4.747% 637 - - 637
351 2026 Minidoka/Palisades Historical 19,450 3.247% 632 - - 632
352 2026 RRP - Green Springs Historical 3 3.244% - -
353 2026 The Dalles Historical 40,327 5.070% 2,044 - - 2,044
354 2026 Yakima Chandler/Kenniwick Historical 848 5.111% 43 - - 43
355 2026 Bureau Direct Historical 918,000 3.335% 30,615 - - 30,615
356 2026 Conservation Historical 70,000 1.338% 937 - (533) 404
357 2026 Corps Historical 437,389 3.158% 13,813 - - 13,813
358 2026 Fish and Wildlife Historical 373,000 2.751% 10,259 - (580) 9,680
359 2026 Replacements Historical 1,310,612 4.430% 58,060 - - 58,060
360 2026 Replacements New 218,435 2.215% 4,838 - - 4,838
361 2026 Float Historical - - (928) - - (928)
362 FY 2026 Subtotal: 5,247,585 197,134 - (1,113) 196,021
363 2027 Albeni Falls Historical 580 4.988% 29 - - 29
364 2027 Boise Historical 1,060 5.091% 54 - - 54
365 2027 Bonneville Dam Historical 104,278 5.000% 5,213 - - 5,213
366 2027 Chief Joseph Historical 29,261 4.459% 1,305 - - 1,305
367 2027 Columbia Basin Historical 21,762 4.542% 988 - - 988
368 2027 Columbia River Fish Mitigation Historical 1,593,700 4.037% 64,338 - - 64,338
369 2027 Cougar Historical 16,684 4.576% 763 - - 763
370 2027 Detroit Lake/Big Cliff Historical 1,830 4.428% 81 - - 81
371 2027 Dworshak Historical 4,493 4.764% 214 - - 214
372 2027 Green Peter/Foster Historical 638 3.673% 23 - - 23
373 2027 Hills Creek Historical 200 3.800% 8 - - 8
374 2027 Hungry Horse Dam Historical 4,679 4.806% 225 - - 225
375 2027 Ice Harbor Historical 11,778 4.314% 508 - - 508
376 2027 John Day Historical 14,911 4.284% 639 - - 639
377 2027 Libby Historical 1,774 4.751% 84 - - 84
378 2027 Little Goose Historical 3,494 4.398% 154 - - 154
379 2027 Lookout Dam Historical 8,373 5.052% 423 - - 423
380 2027 Lost Creek Historical 7 3.748% - -
381 2027 Lower Granite Historical 13,411 3.964% 532 - - 532
382 2027 Lower Monument Historical 8,273 4.720% 391 - - 391
383 2027 Lower Snake Fish and Wildlife Historical 3,930 3.987% 157 - - 157
384 2027 McNary Historical 13,414 4.747% 637 - - 637
385 2027 Minidoka/Palisades Historical 19,450 3.247% 632 - - 632
386 2027 RRP - Green Springs Historical 3 3.244% - -
387 2027 The Dalles Historical 40,327 5.070% 2,044 - - 2,044
388 2027 Yakima Chandler/Kenniwick Historical 848 5.111% 43 - - 43
389 2027 Bureau Direct Historical 918,000 3.335% 30,615 - - 30,615
390 2027 Conservation Historical 31,000 0.682% 211 - - 211
391 2027 Corps Historical 437,389 3.158% 13,813 - - 13,813
392 2027 Fish and Wildlife Historical 293,000 2.618% 7,670 - (435) 7,236
393 2027 Replacements Historical 1,529,048 4.430% 67,737 - - 67,737
BP-18-FS-BPA-02A Page 217

TABLE 13C:
Interest Calculation Summary, SHIFT STUDY
October 1, 2015 - September 30, 2019 Cost Evaluation Period
($000s) (FY 2019)
A B D E F G H I J
Fiscal Year Project Type
Current
Principal Rate Interest Premium
Net Interest
Accrual Total
394 2027 Replacements New 218,435 2.215% 4,838 - - 4,838
395 2027 Float Historical - - (889) - - (889)
396 FY 2027 Subtotal: 5,346,031 203,482 - (435) 203,047
397 2028 Albeni Falls Historical 580 4.988% 29 - - 29
398 2028 Boise Historical 1,060 5.091% 54 - - 54
399 2028 Bonneville Dam Historical 84,910 4.914% 4,172 - - 4,172
400 2028 Chief Joseph Historical 29,261 4.459% 1,305 - - 1,305
401 2028 Columbia Basin Historical 21,762 4.542% 988 - - 988
402 2028 Columbia River Fish Mitigation Historical 1,572,958 4.019% 63,224 - - 63,224
403 2028 Cougar Historical 16,684 4.576% 763 - - 763
404 2028 Detroit Lake/Big Cliff Historical 1,830 4.428% 81 - - 81
405 2028 Dworshak Historical 3,864 4.665% 180 - - 180
406 2028 Green Peter/Foster Historical 638 3.673% 23 - - 23
407 2028 Hills Creek Historical 200 3.800% 8 - - 8
408 2028 Hungry Horse Dam Historical 4,679 4.806% 225 - - 225
409 2028 Ice Harbor Historical 7,552 3.720% 281 - - 281
410 2028 John Day Historical 12,081 4.029% 487 - - 487
411 2028 Libby Historical 1,774 4.751% 84 - - 84
412 2028 Little Goose Historical 3,426 4.379% 150 - - 150
413 2028 Lookout Dam Historical 8,373 5.052% 423 - - 423
414 2028 Lost Creek Historical 7 3.748% - -
415 2028 Lower Granite Historical 13,411 3.964% 532 - - 532
416 2028 Lower Monument Historical 4,850 4.258% 207 - - 207
417 2028 Lower Snake Fish and Wildlife Historical 3,700 3.901% 144 - - 144
418 2028 McNary Historical 7,276 4.218% 307 - - 307
419 2028 Minidoka/Palisades Historical 19,450 3.247% 632 - - 632
420 2028 RRP - Green Springs Historical 3 3.244% - -
421 2028 The Dalles Historical 40,145 5.068% 2,035 - - 2,035
422 2028 Yakima Chandler/Kenniwick Historical 848 5.111% 43 - - 43
423 2028 Bureau Direct Historical 918,000 3.335% 30,615 - - 30,615
424 2028 Conservation Historical 25,000 0.366% 92 - (76) 16
425 2028 Corps Historical 437,389 3.158% 13,813 - - 13,813
426 2028 Fish and Wildlife Historical 238,000 2.775% 6,605 - - 6,605
427 2028 Replacements Historical 1,747,483 4.430% 77,414 - - 77,414
428 2028 Replacements New 218,435 2.215% 4,838 - - 4,838
429 2028 Float Historical - - (784) - - (784)
430 FY 2028 Subtotal: 5,445,630 208,969 - (76) 208,893
431 2029 Albeni Falls Historical 580 4.988% 29 - - 29
432 2029 Boise Historical 1,060 5.091% 54 - - 54
433 2029 Bonneville Dam Historical 84,910 4.914% 4,172 - - 4,172
434 2029 Chief Joseph Historical 29,261 4.459% 1,305 - - 1,305
435 2029 Columbia Basin Historical 21,762 4.542% 988 - - 988
436 2029 Columbia River Fish Mitigation Historical 1,568,334 4.015% 62,975 - - 62,975
437 2029 Cougar Historical 16,684 4.576% 763 - - 763
438 2029 Detroit Lake/Big Cliff Historical 1,830 4.428% 81 - - 81
439 2029 Dworshak Historical 3,864 4.665% 180 - - 180
440 2029 Green Peter/Foster Historical 638 3.673% 23 - - 23
441 2029 Hills Creek Historical 200 3.800% 8 - - 8
442 2029 Hungry Horse Dam Historical 4,679 4.806% 225 - - 225
443 2029 Ice Harbor Historical 7,552 3.720% 281 - - 281
444 2029 John Day Historical 12,081 4.029% 487 - - 487
445 2029 Libby Historical 1,774 4.751% 84 - - 84
446 2029 Little Goose Historical 3,426 4.379% 150 - - 150
447 2029 Lookout Dam Historical 8,373 5.052% 423 - - 423
448 2029 Lost Creek Historical 7 3.748% - -
449 2029 Lower Granite Historical 13,411 3.964% 532 - - 532
450 2029 Lower Monument Historical 4,850 4.258% 207 - - 207
451 2029 Lower Snake Fish and Wildlife Historical 3,700 3.901% 144 - - 144
452 2029 McNary Historical 7,276 4.218% 307 - - 307
453 2029 Minidoka/Palisades Historical 19,450 3.247% 632 - - 632
454 2029 RRP - Green Springs Historical 3 3.244% - -
455 2029 The Dalles Historical 40,145 5.068% 2,035 - - 2,035
456 2029 Yakima Chandler/Kenniwick Historical 848 5.111% 43 - - 43
457 2029 Bureau Direct Historical 893,000 3.254% 29,056 - (325) 28,731
458 2029 Corps Historical 437,389 3.158% 13,813 - - 13,813
459 2029 Fish and Wildlife Historical 212,000 2.402% 5,091 - (426) 4,666
BP-18-FS-BPA-02A Page 218

TABLE 13C:
Interest Calculation Summary, SHIFT STUDY
October 1, 2015 - September 30, 2019 Cost Evaluation Period
($000s) (FY 2019)
A B D E F G H I J
Fiscal Year Project Type
Current
Principal Rate Interest Premium
Net Interest
Accrual Total
460 2029 Replacements Historical 1,965,919 4.430% 87,090 - - 87,090
461 2029 Replacements New 218,435 2.215% 4,838 - - 4,838
462 2029 Float Historical - - (1,861) - - (1,861)
463 FY 2029 Subtotal: 5,583,441 214,156 - (750) 213,405
464 2030 Albeni Falls Historical 580 4.988% 29 - - 29
465 2030 Boise Historical 1,060 5.091% 54 - - 54
466 2030 Bonneville Dam Historical 53,588 4.666% 2,500 - - 2,500
467 2030 Chief Joseph Historical 28,269 4.435% 1,254 - - 1,254
468 2030 Columbia Basin Historical 21,762 4.542% 988 - - 988
469 2030 Columbia River Fish Mitigation Historical 1,424,874 3.895% 55,499 - - 55,499
470 2030 Cougar Historical 13,061 4.354% 569 - - 569
471 2030 Detroit Lake/Big Cliff Historical 1,607 4.332% 70 - - 70
472 2030 Dworshak Historical 3,102 4.552% 141 - - 141
473 2030 Green Peter/Foster Historical 638 3.673% 23 - - 23
474 2030 Hills Creek Historical 154 3.404% 5 - - 5
475 2030 Hungry Horse Dam Historical 1,728 4.260% 74 - - 74
476 2030 Ice Harbor Historical 7,502 3.711% 278 - - 278
477 2030 John Day Historical 9,254 3.694% 342 - - 342
478 2030 Libby Historical 1,774 4.751% 84 - - 84
479 2030 Little Goose Historical 3,280 4.346% 143 - - 143
480 2030 Lookout Dam Historical 883 4.435% 39 - - 39
481 2030 Lost Creek Historical 7 3.748% - -
482 2030 Lower Granite Historical 12,977 3.925% 509 - - 509
483 2030 Lower Monument Historical 4,301 4.148% 178 - - 178
484 2030 Lower Snake Fish and Wildlife Historical 3,598 3.866% 139 - - 139
485 2030 McNary Historical 6,630 4.130% 274 - - 274
486 2030 Minidoka/Palisades Historical 19,450 3.247% 632 - - 632
487 2030 RRP - Green Springs Historical 3 3.244% - -
488 2030 The Dalles Historical 4,126 4.574% 189 - - 189
489 2030 Yakima Chandler/Kenniwick Historical 15 4.377% 1 - - 1
490 2030 Bureau Direct Historical 772,000 3.022% 23,331 - (935) 22,396
491 2030 Corps Historical 437,389 3.158% 13,813 - (131) 13,682
492 2030 Fish and Wildlife Historical 156,000 2.809% 4,382 - - 4,382
493 2030 Replacements Historical 2,184,354 4.430% 96,767 - - 96,767
494 2030 Replacements New 218,435 2.215% 4,838 - - 4,838
495 2030 Float Historical - - (1,585) - - (1,585)
496 FY 2030 Subtotal: 5,392,403 205,561 - (1,066) 204,495
497 2031 Albeni Falls Historical 99 4.322% 4 - - 4
498 2031 Boise Historical 81 4.792% 4 - - 4
499 2031 Bonneville Dam Historical 32,739 4.378% 1,433 - - 1,433
500 2031 Chief Joseph Historical 28,269 4.435% 1,254 - - 1,254
501 2031 Columbia Basin Historical 9,871 3.852% 380 - - 380
502 2031 Columbia River Fish Mitigation Historical 1,345,001 3.827% 51,473 - - 51,473
503 2031 Cougar Historical 4,811 3.035% 146 - - 146
504 2031 Detroit Lake/Big Cliff Historical 576 2.913% 17 - - 17
505 2031 Dworshak Historical 2,390 4.381% 105 - - 105
506 2031 Green Peter/Foster Historical 638 3.673% 23 - - 23
507 2031 Hills Creek Historical 154 3.404% 5 - - 5
508 2031 Hungry Horse Dam Historical 1,434 4.108% 59 - - 59
509 2031 Ice Harbor Historical 7,502 3.711% 278 - - 278
510 2031 John Day Historical 9,021 3.660% 330 - - 330
511 2031 Libby Historical 1,774 4.751% 84 - - 84
512 2031 Little Goose Historical 3,280 4.346% 143 - - 143
513 2031 Lookout Dam Historical 311 3.396% 11 - - 11
514 2031 Lost Creek Historical 7 3.748% - -
515 2031 Lower Granite Historical 12,977 3.925% 509 - - 509
516 2031 Lower Monument Historical 4,301 4.148% 178 - - 178
517 2031 Lower Snake Fish and Wildlife Historical 3,598 3.866% 139 - - 139
518 2031 McNary Historical 6,630 4.130% 274 - - 274
519 2031 Minidoka/Palisades Historical 19,450 3.247% 632 - - 632
520 2031 RRP - Green Springs Historical 3 3.244% - -
521 2031 The Dalles Historical 3,987 4.559% 182 - - 182
522 2031 Yakima Chandler/Kenniwick Historical 15 4.377% 1 - - 1
523 2031 Bureau Direct Historical 583,516 2.625% 15,319 - (991) 14,328
524 2031 Corps Historical 422,389 3.178% 13,423 - (585) 12,838
525 2031 Fish and Wildlife Historical 148,000 2.900% 4,293 - (5) 4,288
BP-18-FS-BPA-02A Page 219

TABLE 13C:
Interest Calculation Summary, SHIFT STUDY
October 1, 2015 - September 30, 2019 Cost Evaluation Period
($000s) (FY 2019)
A B D E F G H I J
Fiscal Year Project Type
Current
Principal Rate Interest Premium
Net Interest
Accrual Total
526 2031 Replacements Historical 2,402,789 4.430% 106,444 - - 106,444
527 2031 Replacements New 218,435 2.215% 4,838 - - 4,838
528 2031 Float Historical - - (1,690) - - (1,690)
529 FY 2031 Subtotal: 5,274,049 200,291 - (1,581) 198,710
530 2032 Albeni Falls Historical 99 4.322% 4 - - 4
531 2032 Boise Historical 81 4.792% 4 - - 4
532 2032 Bonneville Dam Historical 32,739 4.378% 1,433 - - 1,433
533 2032 Chief Joseph Historical 28,269 4.435% 1,254 - - 1,254
534 2032 Columbia Basin Historical 9,871 3.852% 380 - - 380
535 2032 Columbia River Fish Mitigation Historical 1,153,947 3.716% 42,875 - - 42,875
536 2032 Cougar Historical 4,811 3.035% 146 - - 146
537 2032 Detroit Lake/Big Cliff Historical 576 2.913% 17 - - 17
538 2032 Dworshak Historical 2,390 4.381% 105 - - 105
539 2032 Green Peter/Foster Historical 638 3.673% 23 - - 23
540 2032 Hills Creek Historical 154 3.404% 5 - - 5
541 2032 Hungry Horse Dam Historical 1,434 4.108% 59 - - 59
542 2032 Ice Harbor Historical 7,502 3.711% 278 - - 278
543 2032 John Day Historical 8,420 3.600% 303 - - 303
544 2032 Libby Historical 1,774 4.751% 84 - - 84
545 2032 Little Goose Historical 3,280 4.346% 143 - - 143
546 2032 Lookout Dam Historical 311 3.396% 11 - - 11
547 2032 Lost Creek Historical 7 3.748% - -
548 2032 Lower Granite Historical 12,977 3.925% 509 - - 509
549 2032 Lower Monument Historical 4,016 4.123% 166 - - 166
550 2032 Lower Snake Fish and Wildlife Historical 3,219 3.792% 122 - - 122
551 2032 McNary Historical 2,550 3.537% 90 - - 90
552 2032 Minidoka/Palisades Historical 19,450 3.247% 632 - - 632
553 2032 RRP - Green Springs Historical 3 3.244% - -
554 2032 The Dalles Historical 1,957 4.621% 90 - - 90
555 2032 Yakima Chandler/Kenniwick Historical 15 4.377% 1 - - 1
556 2032 Bureau Direct Historical 482,000 2.668% 12,859 - (133) 12,726
557 2032 Corps Historical 369,389 3.252% 12,013 - (146) 11,867
558 2032 Fish and Wildlife Historical 135,000 3.142% 4,241 - - 4,241
559 2032 Replacements Historical 2,621,225 4.430% 116,120 - - 116,120
560 2032 Replacements New 218,435 2.215% 4,838 - - 4,838
561 2032 Float Historical - - (2,030) - - (2,030)
562 FY 2032 Subtotal: 5,126,539 196,776 - (279) 196,497
563 2033 Albeni Falls Historical 99 4.322% 4 - - 4
564 2033 Boise Historical 64 4.875% 3 - - 3
565 2033 Bonneville Dam Historical 30,111 4.367% 1,315 - - 1,315
566 2033 Chief Joseph Historical 28,269 4.435% 1,254 - - 1,254
567 2033 Columbia Basin Historical 7,884 3.688% 291 - - 291
568 2033 Columbia River Fish Mitigation Historical 875,403 3.481% 30,470 - - 30,470
569 2033 Cougar Historical 4,581 2.964% 136 - - 136
570 2033 Detroit Lake/Big Cliff Historical 576 2.913% 17 - - 17
571 2033 Dworshak Historical 10 4.877% - -
572 2033 Green Peter/Foster Historical 638 3.673% 23 - - 23
573 2033 Hills Creek Historical 154 3.404% 5 - - 5
574 2033 Hungry Horse Dam Historical 1,434 4.108% 59 - - 59
575 2033 Ice Harbor Historical 4,887 3.355% 164 - - 164
576 2033 John Day Historical 8,420 3.600% 303 - - 303
577 2033 Libby Historical 1,774 4.751% 84 - - 84
578 2033 Little Goose Historical 109 3.493% 4 - - 4
579 2033 Lookout Dam Historical 311 3.396% 11 - - 11
580 2033 Lost Creek Historical 7 3.748% - -
581 2033 Lower Granite Historical 7,308 3.576% 261 - - 261
582 2033 Lower Monument Historical 1,684 3.773% 64 - - 64
583 2033 Lower Snake Fish and Wildlife Historical 1,685 3.261% 55 - - 55
584 2033 McNary Historical 2,550 3.537% 90 - - 90
585 2033 Minidoka/Palisades Historical 19,450 3.247% 632 - - 632
586 2033 RRP - Green Springs Historical 3 3.244% - -
587 2033 The Dalles Historical 1,957 4.621% 90 - - 90
588 2033 Yakima Chandler/Kenniwick Historical 15 4.377% 1 - - 1
589 2033 Bureau Direct Historical 416,000 2.223% 9,246 - (827) 8,419
590 2033 Corps Historical 288,000 2.967% 8,545 - (439) 8,105
591 2033 Fish and Wildlife Historical 95,000 3.546% 3,369 - - 3,369
BP-18-FS-BPA-02A Page 220

TABLE 13C:
Interest Calculation Summary, SHIFT STUDY
October 1, 2015 - September 30, 2019 Cost Evaluation Period
($000s) (FY 2019)
A B D E F G H I J
Fiscal Year Project Type
Current
Principal Rate Interest Premium
Net Interest
Accrual Total
592 2033 Replacements Historical 2,839,660 4.430% 125,797 - - 125,797
593 2033 Replacements New 218,435 2.215% 4,838 - - 4,838
594 2033 Float Historical - - (2,048) - - (2,048)
595 FY 2033 Subtotal: 4,856,478 185,083 - (1,266) 183,817
596 2034 Albeni Falls Historical 57 4.375% 2 - - 2
597 2034 Boise Historical 64 4.875% 3 - - 3
598 2034 Bonneville Dam Historical 25,942 4.373% 1,134 - - 1,134
599 2034 Chief Joseph Historical 3,542 4.856% 172 - - 172
600 2034 Columbia Basin Historical 7,007 3.618% 254 - - 254
601 2034 Columbia River Fish Mitigation Historical 818,572 3.427% 28,055 - - 28,055
602 2034 Cougar Historical 4,522 2.947% 133 - - 133
603 2034 Detroit Lake/Big Cliff Historical 576 2.913% 17 - - 17
604 2034 Dworshak Historical 10 4.877% - -
605 2034 Green Peter/Foster Historical 638 3.673% 23 - - 23
606 2034 Hills Creek Historical 154 3.404% 5 - - 5
607 2034 Hungry Horse Dam Historical 654 3.939% 26 - - 26
608 2034 Ice Harbor Historical 4,680 3.316% 155 - - 155
609 2034 John Day Historical 8,064 3.571% 288 - - 288
610 2034 Libby Historical 1,734 4.763% 83 - - 83
611 2034 Little Goose Historical 79 3.203% 3 - - 3
612 2034 Lookout Dam Historical 311 3.396% 11 - - 11
613 2034 Lost Creek Historical 7 3.748% - -
614 2034 Lower Granite Historical 6,152 3.449% 212 - - 212
615 2034 Lower Monument Historical 1,684 3.773% 64 - - 64
616 2034 Lower Snake Fish and Wildlife Historical 1,674 3.254% 54 - - 54
617 2034 McNary Historical 2,550 3.537% 90 - - 90
618 2034 Minidoka/Palisades Historical 19,450 3.247% 632 - - 632
619 2034 RRP - Green Springs Historical 3 3.244% - -
620 2034 The Dalles Historical 1,957 4.621% 90 - - 90
621 2034 Yakima Chandler/Kenniwick Historical 15 4.377% 1 - - 1
622 2034 Bureau Direct Historical 194,000 1.671% 3,241 - (417) 2,824
623 2034 Corps Historical 146,409 2.913% 4,265 - (392) 3,873
624 2034 Fish and Wildlife Historical 44,000 3.890% 1,712 - - 1,712
625 2034 Replacements Historical 3,058,096 4.430% 135,474 - - 135,474
626 2034 Replacements New 218,435 2.215% 4,838 - - 4,838
627 2034 Float Historical - - (2,038) - - (2,038)
628 FY 2034 Subtotal: 4,571,037 179,000 - (809) 178,191
629 2035 Albeni Falls Historical 57 4.375% 2 - - 2
630 2035 Boise Historical 64 4.875% 3 - - 3
631 2035 Bonneville Dam Historical 25,941 4.373% 1,134 - - 1,134
632 2035 Chief Joseph Historical 3,542 4.856% 172 - - 172
633 2035 Columbia Basin Historical 5,266 3.574% 188 - - 188
634 2035 Columbia River Fish Mitigation Historical 582,535 3.260% 18,989 - - 18,989
635 2035 Cougar Historical 4,511 2.945% 133 - - 133
636 2035 Detroit Lake/Big Cliff Historical 558 2.882% 16 - - 16
637 2035 Dworshak Historical 10 4.877% - -
638 2035 Green Peter/Foster Historical 166 3.166% 5 - - 5
639 2035 Hills Creek Historical 142 3.375% 5 - - 5
640 2035 Hungry Horse Dam Historical 139 4.628% 6 - - 6
641 2035 Ice Harbor Historical 3,862 3.224% 124 - - 124
642 2035 John Day Historical 7,890 3.567% 281 - - 281
643 2035 Libby Historical 1,582 4.860% 77 - - 77
644 2035 Little Goose Historical 79 3.203% 3 - - 3
645 2035 Lookout Dam Historical 294 3.375% 10 - - 10
646 2035 Lower Granite Historical 3,499 3.127% 109 - - 109
647 2035 Lower Monument Historical 254 3.199% 8 - - 8
648 2035 Lower Snake Fish and Wildlife Historical 1,452 3.159% 46 - - 46
649 2035 McNary Historical 1,226 3.230% 40 - - 40
650 2035 Minidoka/Palisades Historical 19,450 3.247% 632 - - 632
651 2035 RRP - Green Springs Historical 3 3.244% - -
652 2035 The Dalles Historical 1,957 4.621% 90 - - 90
653 2035 Yakima Chandler/Kenniwick Historical 15 4.377% 1 - - 1
654 2035 Bureau Direct Historical 64,000 1.878% 1,202 - - 1,202
655 2035 Corps Historical 56,000 3.189% 1,786 - - 1,786
656 2035 Replacements Historical 3,276,531 4.430% 145,150 - - 145,150
BP-18-FS-BPA-02A Page 221
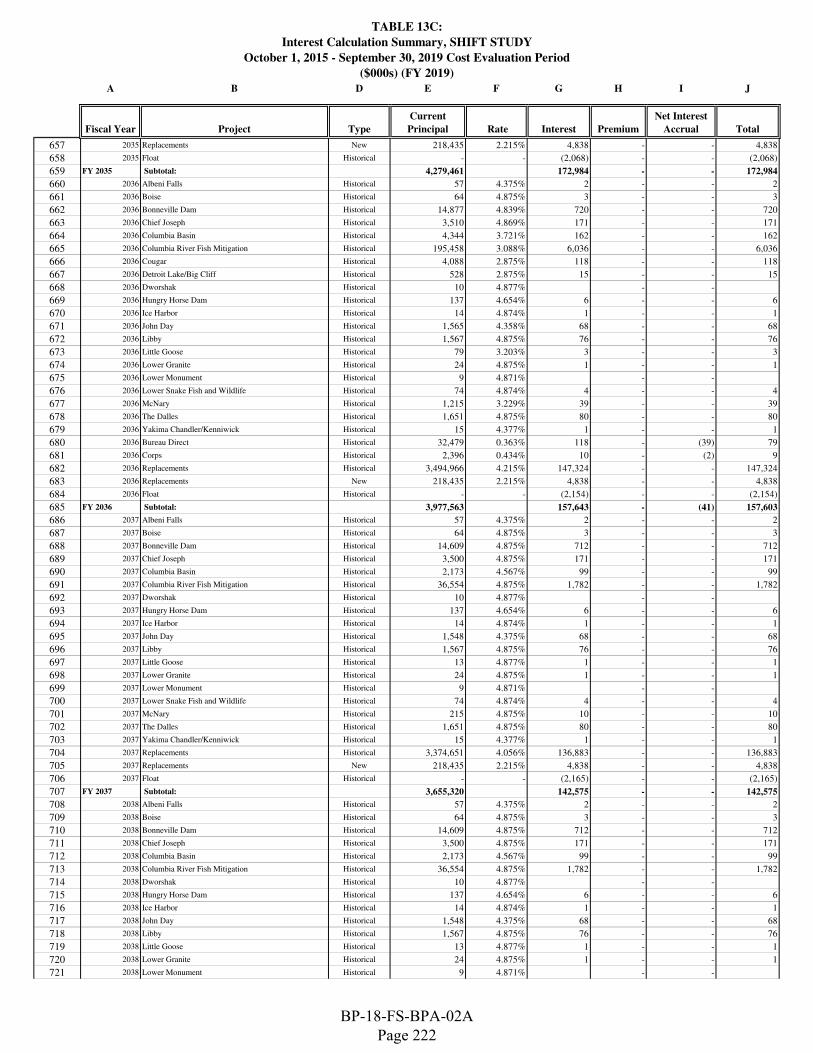
TABLE 13C:
Interest Calculation Summary, SHIFT STUDY
October 1, 2015 - September 30, 2019 Cost Evaluation Period
($000s) (FY 2019)
A B D E F G H I J
Fiscal Year Project Type
Current
Principal Rate Interest Premium
Net Interest
Accrual Total
657 2035 Replacements New 218,435 2.215% 4,838 - - 4,838
658 2035 Float Historical - - (2,068) - - (2,068)
659 FY 2035 Subtotal: 4,279,461 172,984 - - 172,984
660 2036 Albeni Falls Historical 57 4.375% 2 - - 2
661 2036 Boise Historical 64 4.875% 3 - - 3
662 2036 Bonneville Dam Historical 14,877 4.839% 720 - - 720
663 2036 Chief Joseph Historical 3,510 4.869% 171 - - 171
664 2036 Columbia Basin Historical 4,344 3.721% 162 - - 162
665 2036 Columbia River Fish Mitigation Historical 195,458 3.088% 6,036 - - 6,036
666 2036 Cougar Historical 4,088 2.875% 118 - - 118
667 2036 Detroit Lake/Big Cliff Historical 528 2.875% 15 - - 15
668 2036 Dworshak Historical 10 4.877% - -
669 2036 Hungry Horse Dam Historical 137 4.654% 6 - - 6
670 2036 Ice Harbor Historical 14 4.874% 1 - - 1
671 2036 John Day Historical 1,565 4.358% 68 - - 68
672 2036 Libby Historical 1,567 4.875% 76 - - 76
673 2036 Little Goose Historical 79 3.203% 3 - - 3
674 2036 Lower Granite Historical 24 4.875% 1 - - 1
675 2036 Lower Monument Historical 9 4.871% - -
676 2036 Lower Snake Fish and Wildlife Historical 74 4.874% 4 - - 4
677 2036 McNary Historical 1,215 3.229% 39 - - 39
678 2036 The Dalles Historical 1,651 4.875% 80 - - 80
679 2036 Yakima Chandler/Kenniwick Historical 15 4.377% 1 - - 1
680 2036 Bureau Direct Historical 32,479 0.363% 118 - (39) 79
681 2036 Corps Historical 2,396 0.434% 10 - (2) 9
682 2036 Replacements Historical 3,494,966 4.215% 147,324 - - 147,324
683 2036 Replacements New 218,435 2.215% 4,838 - - 4,838
684 2036 Float Historical - - (2,154) - - (2,154)
685 FY 2036 Subtotal: 3,977,563 157,643 - (41) 157,603
686 2037 Albeni Falls Historical 57 4.375% 2 - - 2
687 2037 Boise Historical 64 4.875% 3 - - 3
688 2037 Bonneville Dam Historical 14,609 4.875% 712 - - 712
689 2037 Chief Joseph Historical 3,500 4.875% 171 - - 171
690 2037 Columbia Basin Historical 2,173 4.567% 99 - - 99
691 2037 Columbia River Fish Mitigation Historical 36,554 4.875% 1,782 - - 1,782
692 2037 Dworshak Historical 10 4.877% - -
693 2037 Hungry Horse Dam Historical 137 4.654% 6 - - 6
694 2037 Ice Harbor Historical 14 4.874% 1 - - 1
695 2037 John Day Historical 1,548 4.375% 68 - - 68
696 2037 Libby Historical 1,567 4.875% 76 - - 76
697 2037 Little Goose Historical 13 4.877% 1 - - 1
698 2037 Lower Granite Historical 24 4.875% 1 - - 1
699 2037 Lower Monument Historical 9 4.871% - -
700 2037 Lower Snake Fish and Wildlife Historical 74 4.874% 4 - - 4
701 2037 McNary Historical 215 4.875% 10 - - 10
702 2037 The Dalles Historical 1,651 4.875% 80 - - 80
703 2037 Yakima Chandler/Kenniwick Historical 15 4.377% 1 - - 1
704 2037 Replacements Historical 3,374,651 4.056% 136,883 - - 136,883
705 2037 Replacements New 218,435 2.215% 4,838 - - 4,838
706 2037 Float Historical - - (2,165) - - (2,165)
707 FY 2037 Subtotal: 3,655,320 142,575 - - 142,575
708 2038 Albeni Falls Historical 57 4.375% 2 - - 2
709 2038 Boise Historical 64 4.875% 3 - - 3
710 2038 Bonneville Dam Historical 14,609 4.875% 712 - - 712
711 2038 Chief Joseph Historical 3,500 4.875% 171 - - 171
712 2038 Columbia Basin Historical 2,173 4.567% 99 - - 99
713 2038 Columbia River Fish Mitigation Historical 36,554 4.875% 1,782 - - 1,782
714 2038 Dworshak Historical 10 4.877% - -
715 2038 Hungry Horse Dam Historical 137 4.654% 6 - - 6
716 2038 Ice Harbor Historical 14 4.874% 1 - - 1
717 2038 John Day Historical 1,548 4.375% 68 - - 68
718 2038 Libby Historical 1,567 4.875% 76 - - 76
719 2038 Little Goose Historical 13 4.877% 1 - - 1
720 2038 Lower Granite Historical 24 4.875% 1 - - 1
721 2038 Lower Monument Historical 9 4.871% - -
BP-18-FS-BPA-02A Page 222

TABLE 13C:
Interest Calculation Summary, SHIFT STUDY
October 1, 2015 - September 30, 2019 Cost Evaluation Period
($000s) (FY 2019)
A B D E F G H I J
Fiscal Year Project Type
Current
Principal Rate Interest Premium
Net Interest
Accrual Total
722 2038 Lower Snake Fish and Wildlife Historical 74 4.874% 4 - - 4
723 2038 McNary Historical 215 4.875% 10 - - 10
724 2038 The Dalles Historical 1,651 4.875% 80 - - 80
725 2038 Yakima Chandler/Kenniwick Historical 15 4.377% 1 - - 1
726 2038 Replacements Historical 3,023,595 3.982% 120,393 - - 120,393
727 2038 Replacements New 218,435 2.215% 4,838 - - 4,838
728 2038 Float Historical - - (2,224) - - (2,224)
729 FY 2038 Subtotal: 3,304,265 126,026 - - 126,026
730 2039 Albeni Falls Historical 57 4.375% 2 - - 2
731 2039 Boise Historical 64 4.875% 3 - - 3
732 2039 Bonneville Dam Historical 14,609 4.875% 712 - - 712
733 2039 Chief Joseph Historical 3,500 4.875% 171 - - 171
734 2039 Columbia Basin Historical 2,173 4.567% 99 - - 99
735 2039 Columbia River Fish Mitigation Historical 36,554 4.875% 1,782 - - 1,782
736 2039 Dworshak Historical 10 4.877% - -
737 2039 Hungry Horse Dam Historical 137 4.654% 6 - - 6
738 2039 Ice Harbor Historical 14 4.874% 1 - - 1
739 2039 John Day Historical 1,548 4.375% 68 - - 68
740 2039 Libby Historical 1,567 4.875% 76 - - 76
741 2039 Little Goose Historical 13 4.877% 1 - - 1
742 2039 Lower Granite Historical 24 4.875% 1 - - 1
743 2039 Lower Monument Historical 9 4.871% - -
744 2039 Lower Snake Fish and Wildlife Historical 74 4.874% 4 - - 4
745 2039 McNary Historical 215 4.875% 10 - - 10
746 2039 The Dalles Historical 1,651 4.875% 80 - - 80
747 2039 Yakima Chandler/Kenniwick Historical 15 4.377% 1 - - 1
748 2039 Replacements Historical 2,630,190 3.884% 102,158 - - 102,158
749 2039 Replacements New 218,435 2.215% 4,838 - - 4,838
750 2039 Float Historical - - (2,360) - - (2,360)
751 FY 2039 Subtotal: 2,910,860 107,656 - - 107,656
752 2040 Albeni Falls Historical 57 4.375% 2 - - 2
753 2040 Boise Historical 64 4.875% 3 - - 3
754 2040 Bonneville Dam Historical 14,609 4.875% 712 - - 712
755 2040 Chief Joseph Historical 3,500 4.875% 171 - - 171
756 2040 Columbia Basin Historical 2,173 4.567% 99 - - 99
757 2040 Columbia River Fish Mitigation Historical 36,554 4.875% 1,782 - - 1,782
758 2040 Dworshak Historical 10 4.877% - -
759 2040 Hungry Horse Dam Historical 137 4.654% 6 - - 6
760 2040 Ice Harbor Historical 14 4.874% 1 - - 1
761 2040 John Day Historical 1,548 4.375% 68 - - 68
762 2040 Libby Historical 1,567 4.875% 76 - - 76
763 2040 Little Goose Historical 13 4.877% 1 - - 1
764 2040 Lower Granite Historical 24 4.875% 1 - - 1
765 2040 Lower Monument Historical 9 4.871% - -
766 2040 Lower Snake Fish and Wildlife Historical 74 4.874% 4 - - 4
767 2040 McNary Historical 215 4.875% 10 - - 10
768 2040 The Dalles Historical 1,651 4.875% 80 - - 80
769 2040 Yakima Chandler/Kenniwick Historical 15 4.377% 1 - - 1
770 2040 Replacements Historical 2,200,364 3.741% 82,311 - - 82,311
771 2040 Replacements New 218,435 2.215% 4,838 - - 4,838
772 2040 Float Historical - - (2,399) - - (2,399)
773 FY 2040 Subtotal: 2,481,033 87,770 - - 87,770
774 2041 Albeni Falls Historical 57 4.375% 2 - - 2
775 2041 Boise Historical 64 4.875% 3 - - 3
776 2041 Bonneville Dam Historical 14,609 4.875% 712 - - 712
777 2041 Chief Joseph Historical 3,500 4.875% 171 - - 171
778 2041 Columbia Basin Historical 2,173 4.567% 99 - - 99
779 2041 Columbia River Fish Mitigation Historical 36,554 4.875% 1,782 - - 1,782
780 2041 Dworshak Historical 10 4.877% - -
781 2041 Hungry Horse Dam Historical 137 4.654% 6 - - 6
782 2041 Ice Harbor Historical 14 4.874% 1 - - 1
783 2041 John Day Historical 1,548 4.375% 68 - - 68
784 2041 Libby Historical 1,567 4.875% 76 - - 76
785 2041 Little Goose Historical 13 4.877% 1 - - 1
786 2041 Lower Granite Historical 24 4.875% 1 - - 1
787 2041 Lower Monument Historical 9 4.871% - -
BP-18-FS-BPA-02A Page 223
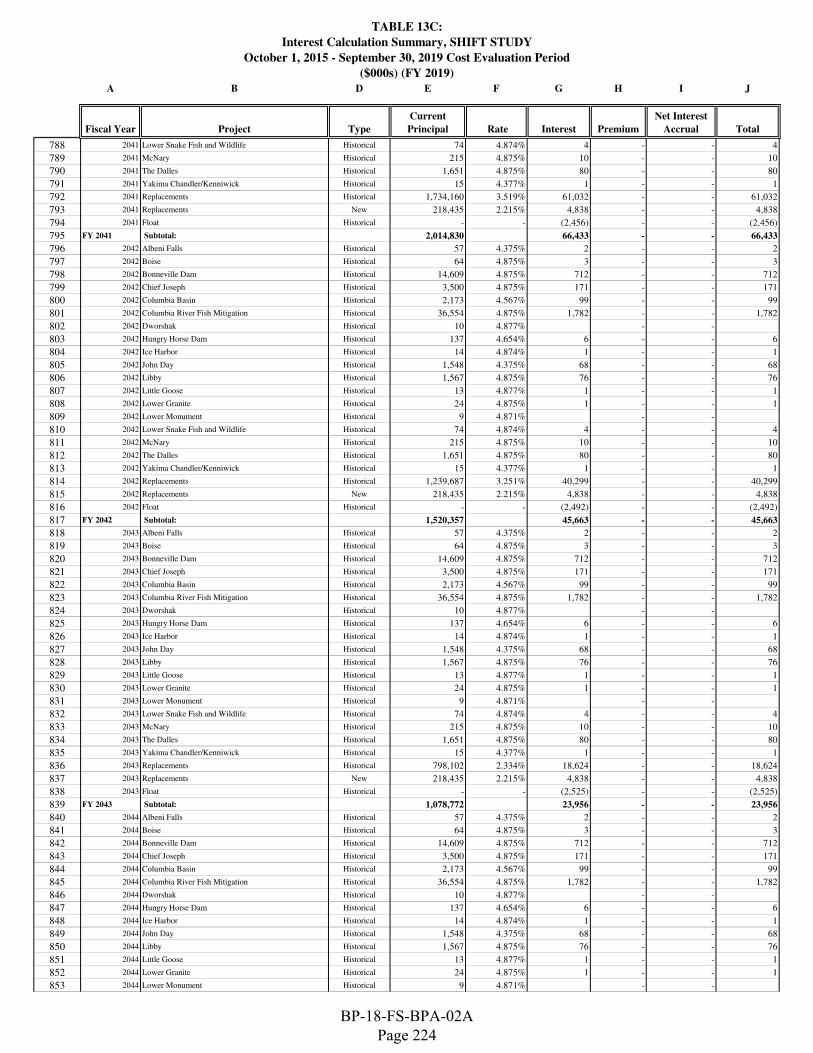
TABLE 13C:
Interest Calculation Summary, SHIFT STUDY
October 1, 2015 - September 30, 2019 Cost Evaluation Period
($000s) (FY 2019)
A B D E F G H I J
Fiscal Year Project Type
Current
Principal Rate Interest Premium
Net Interest
Accrual Total
788 2041 Lower Snake Fish and Wildlife Historical 74 4.874% 4 - - 4
789 2041 McNary Historical 215 4.875% 10 - - 10
790 2041 The Dalles Historical 1,651 4.875% 80 - - 80
791 2041 Yakima Chandler/Kenniwick Historical 15 4.377% 1 - - 1
792 2041 Replacements Historical 1,734,160 3.519% 61,032 - - 61,032
793 2041 Replacements New 218,435 2.215% 4,838 - - 4,838
794 2041 Float Historical - - (2,456) - - (2,456)
795 FY 2041 Subtotal: 2,014,830 66,433 - - 66,433
796 2042 Albeni Falls Historical 57 4.375% 2 - - 2
797 2042 Boise Historical 64 4.875% 3 - - 3
798 2042 Bonneville Dam Historical 14,609 4.875% 712 - - 712
799 2042 Chief Joseph Historical 3,500 4.875% 171 - - 171
800 2042 Columbia Basin Historical 2,173 4.567% 99 - - 99
801 2042 Columbia River Fish Mitigation Historical 36,554 4.875% 1,782 - - 1,782
802 2042 Dworshak Historical 10 4.877% - -
803 2042 Hungry Horse Dam Historical 137 4.654% 6 - - 6
804 2042 Ice Harbor Historical 14 4.874% 1 - - 1
805 2042 John Day Historical 1,548 4.375% 68 - - 68
806 2042 Libby Historical 1,567 4.875% 76 - - 76
807 2042 Little Goose Historical 13 4.877% 1 - - 1
808 2042 Lower Granite Historical 24 4.875% 1 - - 1
809 2042 Lower Monument Historical 9 4.871% - -
810 2042 Lower Snake Fish and Wildlife Historical 74 4.874% 4 - - 4
811 2042 McNary Historical 215 4.875% 10 - - 10
812 2042 The Dalles Historical 1,651 4.875% 80 - - 80
813 2042 Yakima Chandler/Kenniwick Historical 15 4.377% 1 - - 1
814 2042 Replacements Historical 1,239,687 3.251% 40,299 - - 40,299
815 2042 Replacements New 218,435 2.215% 4,838 - - 4,838
816 2042 Float Historical - - (2,492) - - (2,492)
817 FY 2042 Subtotal: 1,520,357 45,663 - - 45,663
818 2043 Albeni Falls Historical 57 4.375% 2 - - 2
819 2043 Boise Historical 64 4.875% 3 - - 3
820 2043 Bonneville Dam Historical 14,609 4.875% 712 - - 712
821 2043 Chief Joseph Historical 3,500 4.875% 171 - - 171
822 2043 Columbia Basin Historical 2,173 4.567% 99 - - 99
823 2043 Columbia River Fish Mitigation Historical 36,554 4.875% 1,782 - - 1,782
824 2043 Dworshak Historical 10 4.877% - -
825 2043 Hungry Horse Dam Historical 137 4.654% 6 - - 6
826 2043 Ice Harbor Historical 14 4.874% 1 - - 1
827 2043 John Day Historical 1,548 4.375% 68 - - 68
828 2043 Libby Historical 1,567 4.875% 76 - - 76
829 2043 Little Goose Historical 13 4.877% 1 - - 1
830 2043 Lower Granite Historical 24 4.875% 1 - - 1
831 2043 Lower Monument Historical 9 4.871% - -
832 2043 Lower Snake Fish and Wildlife Historical 74 4.874% 4 - - 4
833 2043 McNary Historical 215 4.875% 10 - - 10
834 2043 The Dalles Historical 1,651 4.875% 80 - - 80
835 2043 Yakima Chandler/Kenniwick Historical 15 4.377% 1 - - 1
836 2043 Replacements Historical 798,102 2.334% 18,624 - - 18,624
837 2043 Replacements New 218,435 2.215% 4,838 - - 4,838
838 2043 Float Historical - - (2,525) - - (2,525)
839 FY 2043 Subtotal: 1,078,772 23,956 - - 23,956
840 2044 Albeni Falls Historical 57 4.375% 2 - - 2
841 2044 Boise Historical 64 4.875% 3 - - 3
842 2044 Bonneville Dam Historical 14,609 4.875% 712 - - 712
843 2044 Chief Joseph Historical 3,500 4.875% 171 - - 171
844 2044 Columbia Basin Historical 2,173 4.567% 99 - - 99
845 2044 Columbia River Fish Mitigation Historical 36,554 4.875% 1,782 - - 1,782
846 2044 Dworshak Historical 10 4.877% - -
847 2044 Hungry Horse Dam Historical 137 4.654% 6 - - 6
848 2044 Ice Harbor Historical 14 4.874% 1 - - 1
849 2044 John Day Historical 1,548 4.375% 68 - - 68
850 2044 Libby Historical 1,567 4.875% 76 - - 76
851 2044 Little Goose Historical 13 4.877% 1 - - 1
852 2044 Lower Granite Historical 24 4.875% 1 - - 1
853 2044 Lower Monument Historical 9 4.871% - -
BP-18-FS-BPA-02A Page 224

TABLE 13C:
Interest Calculation Summary, SHIFT STUDY
October 1, 2015 - September 30, 2019 Cost Evaluation Period
($000s) (FY 2019)
A B D E F G H I J
Fiscal Year Project Type
Current
Principal Rate Interest Premium
Net Interest
Accrual Total
854 2044 Lower Snake Fish and Wildlife Historical 74 4.874% 4 - - 4
855 2044 McNary Historical 215 4.875% 10 - - 10
856 2044 The Dalles Historical 1,651 4.875% 80 - - 80
857 2044 Yakima Chandler/Kenniwick Historical 15 4.377% 1 - - 1
858 2044 Replacements Historical 261,149 2.215% 5,784 - - 5,784
859 2044 Replacements New 218,435 2.215% 4,838 - - 4,838
860 2044 Float Historical - - (2,172) - - (2,172)
861 FY 2044 Subtotal: 541,818 11,469 - - 11,469
862 2045 Albeni Falls Historical 57 4.375% 2 - - 2
863 2045 Boise Historical 64 4.875% 3 - - 3
864 2045 Bonneville Dam Historical 14,609 4.875% 712 - - 712
865 2045 Chief Joseph Historical 3,500 4.875% 171 - - 171
866 2045 Columbia Basin Historical 2,173 4.567% 99 - - 99
867 2045 Columbia River Fish Mitigation Historical 36,554 4.875% 1,782 - - 1,782
868 2045 Dworshak Historical 10 4.877% - -
869 2045 Hungry Horse Dam Historical 137 4.654% 6 - - 6
870 2045 Ice Harbor Historical 14 4.874% 1 - - 1
871 2045 John Day Historical 1,548 4.375% 68 - - 68
872 2045 Libby Historical 1,567 4.875% 76 - - 76
873 2045 Little Goose Historical 13 4.877% 1 - - 1
874 2045 Lower Granite Historical 24 4.875% 1 - - 1
875 2045 Lower Monument Historical 9 4.871% - -
876 2045 Lower Snake Fish and Wildlife Historical 74 4.874% 4 - - 4
877 2045 McNary Historical 215 4.875% 10 - - 10
878 2045 The Dalles Historical 1,651 4.875% 80 - - 80
879 2045 Yakima Chandler/Kenniwick Historical 15 4.377% 1 - - 1
880 2045 Replacements Historical 218,435 2.215% 4,838 - - 4,838
881 2045 Replacements New 218,435 2.215% 4,838 - - 4,838
882 2045 Float Historical - - (1,008) - - (1,008)
883 FY 2045 Subtotal: 499,105 11,687 - - 11,687
884 2046 Albeni Falls Historical 57 4.375% 2 - - 2
885 2046 Boise Historical 64 4.875% 3 - - 3
886 2046 Bonneville Dam Historical 14,609 4.875% 712 - - 712
887 2046 Chief Joseph Historical 3,500 4.875% 171 - - 171
888 2046 Columbia Basin Historical 2,173 4.567% 99 - - 99
889 2046 Columbia River Fish Mitigation Historical 36,554 4.875% 1,782 - - 1,782
890 2046 Dworshak Historical 10 4.877% - -
891 2046 Hungry Horse Dam Historical 137 4.654% 6 - - 6
892 2046 Ice Harbor Historical 14 4.874% 1 - - 1
893 2046 John Day Historical 1,548 4.375% 68 - - 68
894 2046 Libby Historical 1,567 4.875% 76 - - 76
895 2046 Little Goose Historical 13 4.877% 1 - - 1
896 2046 Lower Granite Historical 24 4.875% 1 - - 1
897 2046 Lower Monument Historical 9 4.871% - -
898 2046 Lower Snake Fish and Wildlife Historical 74 4.874% 4 - - 4
899 2046 McNary Historical 215 4.875% 10 - - 10
900 2046 The Dalles Historical 1,651 4.875% 80 - - 80
901 2046 Yakima Chandler/Kenniwick Historical 15 4.377% 1 - - 1
902 2046 Replacements Historical 218,435 2.215% 4,838 - - 4,838
903 2046 Replacements New 218,435 2.215% 4,838 - - 4,838
904 2046 Float Historical - - (1,008) - - (1,008)
905 FY 2046 Subtotal: 499,105 11,687 - - 11,687
906 2047 Albeni Falls Historical 57 4.375% 2 - - 2
907 2047 Boise Historical 64 4.875% 3 - - 3
908 2047 Bonneville Dam Historical 14,609 4.875% 712 - - 712
909 2047 Chief Joseph Historical 3,500 4.875% 171 - - 171
910 2047 Columbia Basin Historical 2,173 4.567% 99 - - 99
911 2047 Columbia River Fish Mitigation Historical 36,554 4.875% 1,782 - - 1,782
912 2047 Dworshak Historical 10 4.877% - -
913 2047 Hungry Horse Dam Historical 137 4.654% 6 - - 6
914 2047 Ice Harbor Historical 14 4.874% 1 - - 1
915 2047 John Day Historical 1,548 4.375% 68 - - 68
916 2047 Libby Historical 1,567 4.875% 76 - - 76
917 2047 Little Goose Historical 13 4.877% 1 - - 1
918 2047 Lower Granite Historical 24 4.875% 1 - - 1
BP-18-FS-BPA-02A Page 225

TABLE 13C:
Interest Calculation Summary, SHIFT STUDY
October 1, 2015 - September 30, 2019 Cost Evaluation Period
($000s) (FY 2019)
A B D E F G H I J
Fiscal Year Project Type
Current
Principal Rate Interest Premium
Net Interest
Accrual Total
919 2047 Lower Monument Historical 9 4.871% - -
920 2047 Lower Snake Fish and Wildlife Historical 74 4.874% 4 - - 4
921 2047 McNary Historical 215 4.875% 10 - - 10
922 2047 The Dalles Historical 1,651 4.875% 80 - - 80
923 2047 Yakima Chandler/Kenniwick Historical 15 4.377% 1 - - 1
924 2047 Replacements Historical 218,435 2.215% 4,838 - - 4,838
925 2047 Replacements New 218,435 2.215% 4,838 - - 4,838
926 2047 Float Historical - - (1,008) - - (1,008)
927 FY 2047 Subtotal: 499,105 11,687 - - 11,687
928 2048 Albeni Falls Historical 57 4.375% 2 - - 2
929 2048 Boise Historical 64 4.875% 3 - - 3
930 2048 Bonneville Dam Historical 14,609 4.875% 712 - - 712
931 2048 Chief Joseph Historical 3,500 4.875% 171 - - 171
932 2048 Columbia Basin Historical 2,173 4.567% 99 - - 99
933 2048 Columbia River Fish Mitigation Historical 36,554 4.875% 1,782 - - 1,782
934 2048 Dworshak Historical 10 4.877% - -
935 2048 Hungry Horse Dam Historical 137 4.654% 6 - - 6
936 2048 Ice Harbor Historical 14 4.874% 1 - - 1
937 2048 John Day Historical 1,548 4.375% 68 - - 68
938 2048 Libby Historical 1,567 4.875% 76 - - 76
939 2048 Little Goose Historical 13 4.877% 1 - - 1
940 2048 Lower Granite Historical 24 4.875% 1 - - 1
941 2048 Lower Monument Historical 9 4.871% - -
942 2048 Lower Snake Fish and Wildlife Historical 74 4.874% 4 - - 4
943 2048 McNary Historical 215 4.875% 10 - - 10
944 2048 The Dalles Historical 1,651 4.875% 80 - - 80
945 2048 Yakima Chandler/Kenniwick Historical 15 4.377% 1 - - 1
946 2048 Replacements Historical 218,435 2.215% 4,838 - - 4,838
947 2048 Replacements New 218,435 2.215% 4,838 - - 4,838
948 2048 Float Historical - - (1,008) - - (1,008)
949 FY 2048 Subtotal: 499,105 11,687 - - 11,687
950 2049 Albeni Falls Historical 57 4.375% 2 - - 2
951 2049 Boise Historical 64 4.875% 3 - - 3
952 2049 Bonneville Dam Historical 14,609 4.875% 712 - - 712
953 2049 Chief Joseph Historical 3,500 4.875% 171 - - 171
954 2049 Columbia Basin Historical 2,173 4.567% 99 - - 99
955 2049 Columbia River Fish Mitigation Historical 36,554 4.875% 1,782 - - 1,782
956 2049 Dworshak Historical 10 4.877% - -
957 2049 Hungry Horse Dam Historical 137 4.654% 6 - - 6
958 2049 Ice Harbor Historical 14 4.874% 1 - - 1
959 2049 John Day Historical 1,548 4.375% 68 - - 68
960 2049 Libby Historical 1,567 4.875% 76 - - 76
961 2049 Little Goose Historical 13 4.877% 1 - - 1
962 2049 Lower Granite Historical 24 4.875% 1 - - 1
963 2049 Lower Monument Historical 9 4.871% - -
964 2049 Lower Snake Fish and Wildlife Historical 74 4.874% 4 - - 4
965 2049 McNary Historical 215 4.875% 10 - - 10
966 2049 The Dalles Historical 1,651 4.875% 80 - - 80
967 2049 Yakima Chandler/Kenniwick Historical 15 4.377% 1 - - 1
968 2049 Replacements Historical 218,435 2.215% 4,838 - - 4,838
969 2049 Replacements New 218,435 2.215% 4,838 - - 4,838
970 2049 Float Historical - - (1,008) - - (1,008)
971 FY 2049 Subtotal: 499,105 11,687 - - 11,687
BP-18-FS-BPA-02A Page 226

TABLE 13C:
Interest Calculation Summary, SHIFT STUDY
October 1, 2015 - September 30, 2019 Cost Evaluation Period
($000s) (FY 2019)
A B D E F G H I J
Fiscal Year Project Type
Current
Principal Rate Interest Premium
Net Interest
Accrual Total
972 2050 Albeni Falls Historical 57 4.375% 2 - - 2
973 2050 Boise Historical 64 4.875% 3 - - 3
974 2050 Bonneville Dam Historical 14,609 4.875% 712 - - 712
975 2050 Chief Joseph Historical 3,500 4.875% 171 - - 171
976 2050 Columbia Basin Historical 2,173 4.567% 99 - - 99
977 2050 Columbia River Fish Mitigation Historical 36,554 4.875% 1,782 - - 1,782
978 2050 Dworshak Historical 10 4.877% - -
979 2050 Hungry Horse Dam Historical 137 4.654% 6 - - 6
980 2050 Ice Harbor Historical 14 4.874% 1 - - 1
981 2050 John Day Historical 1,548 4.375% 68 - - 68
982 2050 Libby Historical 1,567 4.875% 76 - - 76
983 2050 Little Goose Historical 13 4.877% 1 - - 1
984 2050 Lower Granite Historical 24 4.875% 1 - - 1
985 2050 Lower Monument Historical 9 4.871% - -
986 2050 Lower Snake Fish and Wildlife Historical 74 4.874% 4 - - 4
987 2050 McNary Historical 215 4.875% 10 - - 10
988 2050 The Dalles Historical 1,651 4.875% 80 - - 80
989 2050 Yakima Chandler/Kenniwick Historical 15 4.377% 1 - - 1
990 2050 Replacements Historical 218,435 2.215% 4,838 - - 4,838
991 2050 Replacements New 218,435 2.215% 4,838 - - 4,838
992 2050 Float Historical - - (1,008) - - (1,008)
993 FY 2050 Subtotal: 499,105 11,687 - - 11,687
994 2051 Albeni Falls Historical 57 4.375% 2 - - 2
995 2051 Boise Historical 64 4.875% 3 - - 3
996 2051 Bonneville Dam Historical 14,609 4.875% 712 - - 712
997 2051 Chief Joseph Historical 3,500 4.875% 171 - - 171
998 2051 Columbia Basin Historical 2,173 4.567% 99 - - 99
999 2051 Columbia River Fish Mitigation Historical 36,554 4.875% 1,782 - - 1,782
1000 2051 Dworshak Historical 10 4.877% - -
1001 2051 Hungry Horse Dam Historical 137 4.654% 6 - - 6
1002 2051 Ice Harbor Historical 14 4.874% 1 - - 1
1003 2051 John Day Historical 1,548 4.375% 68 - - 68
1004 2051 Libby Historical 1,567 4.875% 76 - - 76
1005 2051 Little Goose Historical 13 4.877% 1 - - 1
1006 2051 Lower Granite Historical 24 4.875% 1 - - 1
1007 2051 Lower Monument Historical 9 4.871% - -
1008 2051 Lower Snake Fish and Wildlife Historical 74 4.874% 4 - - 4
1009 2051 McNary Historical 215 4.875% 10 - - 10
1010 2051 The Dalles Historical 1,651 4.875% 80 - - 80
1011 2051 Yakima Chandler/Kenniwick Historical 15 4.377% 1 - - 1
1012 2051 Replacements Historical 218,435 2.215% 4,838 - - 4,838
1013 2051 Replacements New 218,435 2.215% 4,838 - - 4,838
1014 2051 Float Historical - - (1,008) - - (1,008)
1015 FY 2051 Subtotal: 499,105 11,687 - - 11,687
1016 2052 Albeni Falls Historical 57 4.375% 2 - - 2
1017 2052 Boise Historical 64 4.875% 3 - - 3
1018 2052 Bonneville Dam Historical 14,609 4.875% 712 - - 712
1019 2052 Chief Joseph Historical 3,500 4.875% 171 - - 171
1020 2052 Columbia Basin Historical 2,173 4.567% 99 - - 99
1021 2052 Columbia River Fish Mitigation Historical 36,554 4.875% 1,782 - - 1,782
1022 2052 Dworshak Historical 10 4.877% - -
1023 2052 Hungry Horse Dam Historical 137 4.654% 6 - - 6
1024 2052 Ice Harbor Historical 14 4.874% 1 - - 1
1025 2052 John Day Historical 1,548 4.375% 68 - - 68
1026 2052 Libby Historical 1,567 4.875% 76 - - 76
1027 2052 Little Goose Historical 13 4.877% 1 - - 1
1028 2052 Lower Granite Historical 24 4.875% 1 - - 1
1029 2052 Lower Monument Historical 9 4.871% - -
1030 2052 Lower Snake Fish and Wildlife Historical 74 4.874% 4 - - 4
1031 2052 McNary Historical 215 4.875% 10 - - 10
1032 2052 The Dalles Historical 1,651 4.875% 80 - - 80
1033 2052 Yakima Chandler/Kenniwick Historical 15 4.377% 1 - - 1
1034 2052 Replacements Historical 218,435 2.215% 4,838 - - 4,838
1035 2052 Replacements New 218,435 2.215% 4,838 - - 4,838
1036 2052 Float Historical - - (1,008) - - (1,008)
1037 FY 2052 Subtotal: 499,105 11,687 - - 11,687
BP-18-FS-BPA-02A Page 227

TABLE 13C:
Interest Calculation Summary, SHIFT STUDY
October 1, 2015 - September 30, 2019 Cost Evaluation Period
($000s) (FY 2019)
A B D E F G H I J
Fiscal Year Project Type
Current
Principal Rate Interest Premium
Net Interest
Accrual Total
1038 2053 Albeni Falls Historical 57 4.375% 2 - - 2
1039 2053 Boise Historical 64 4.875% 3 - - 3
1040 2053 Bonneville Dam Historical 14,609 4.875% 712 - - 712
1041 2053 Chief Joseph Historical 3,500 4.875% 171 - - 171
1042 2053 Columbia Basin Historical 2,173 4.567% 99 - - 99
1043 2053 Columbia River Fish Mitigation Historical 36,554 4.875% 1,782 - - 1,782
1044 2053 Dworshak Historical 10 4.877% - -
1045 2053 Hungry Horse Dam Historical 137 4.654% 6 - - 6
1046 2053 Ice Harbor Historical 14 4.874% 1 - - 1
1047 2053 John Day Historical 1,548 4.375% 68 - - 68
1048 2053 Libby Historical 1,567 4.875% 76 - - 76
1049 2053 Little Goose Historical 13 4.877% 1 - - 1
1050 2053 Lower Granite Historical 24 4.875% 1 - - 1
1051 2053 Lower Monument Historical 9 4.871% - -
1052 2053 Lower Snake Fish and Wildlife Historical 74 4.874% 4 - - 4
1053 2053 McNary Historical 215 4.875% 10 - - 10
1054 2053 The Dalles Historical 1,651 4.875% 80 - - 80
1055 2053 Yakima Chandler/Kenniwick Historical 15 4.377% 1 - - 1
1056 2053 Replacements Historical 218,435 2.215% 4,838 - - 4,838
1057 2053 Replacements New 218,435 2.215% 4,838 - - 4,838
1058 2053 Float Historical - - (1,008) - - (1,008)
1059 FY 2053 Subtotal: 499,105 11,687 - - 11,687
1060 2054 Albeni Falls Historical 57 4.375% 2 - - 2
1061 2054 Boise Historical 64 4.875% 3 - - 3
1062 2054 Bonneville Dam Historical 14,609 4.875% 712 - - 712
1063 2054 Chief Joseph Historical 3,500 4.875% 171 - - 171
1064 2054 Columbia Basin Historical 2,173 4.567% 99 - - 99
1065 2054 Columbia River Fish Mitigation Historical 36,554 4.875% 1,782 - - 1,782
1066 2054 Dworshak Historical 10 4.877% - -
1067 2054 Hungry Horse Dam Historical 137 4.654% 6 - - 6
1068 2054 Ice Harbor Historical 14 4.874% 1 - - 1
1069 2054 John Day Historical 1,548 4.375% 68 - - 68
1070 2054 Libby Historical 1,567 4.875% 76 - - 76
1071 2054 Little Goose Historical 13 4.877% 1 - - 1
1072 2054 Lower Granite Historical 24 4.875% 1 - - 1
1073 2054 Lower Monument Historical 9 4.871% - -
1074 2054 Lower Snake Fish and Wildlife Historical 74 4.874% 4 - - 4
1075 2054 McNary Historical 215 4.875% 10 - - 10
1076 2054 The Dalles Historical 1,651 4.875% 80 - - 80
1077 2054 Yakima Chandler/Kenniwick Historical 15 4.377% 1 - - 1
1078 2054 Replacements Historical 218,435 2.215% 4,838 - - 4,838
1079 2054 Replacements New 218,435 2.215% 4,838 - - 4,838
1080 2054 Float Historical - - (1,008) - - (1,008)
1081 FY 2054 Subtotal: 499,105 11,687 - - 11,687
1082 2055 Albeni Falls Historical 57 4.375% 2 - - 2
1083 2055 Boise Historical 64 4.875% 3 - - 3
1084 2055 Bonneville Dam Historical 14,609 4.875% 712 - - 712
1085 2055 Chief Joseph Historical 3,500 4.875% 171 - - 171
1086 2055 Columbia Basin Historical 2,173 4.567% 99 - - 99
1087 2055 Columbia River Fish Mitigation Historical 36,554 4.875% 1,782 - - 1,782
1088 2055 Dworshak Historical 10 4.877% - -
1089 2055 Hungry Horse Dam Historical 137 4.654% 6 - - 6
1090 2055 Ice Harbor Historical 14 4.874% 1 - - 1
1091 2055 John Day Historical 1,548 4.375% 68 - - 68
1092 2055 Libby Historical 1,567 4.875% 76 - - 76
1093 2055 Little Goose Historical 13 4.877% 1 - - 1
1094 2055 Lower Granite Historical 24 4.875% 1 - - 1
1095 2055 Lower Monument Historical 9 4.871% - -
1096 2055 Lower Snake Fish and Wildlife Historical 74 4.874% 4 - - 4
1097 2055 McNary Historical 215 4.875% 10 - - 10
1098 2055 The Dalles Historical 1,651 4.875% 80 - - 80
1099 2055 Yakima Chandler/Kenniwick Historical 15 4.377% 1 - - 1
1100 2055 Replacements Historical 218,435 2.215% 4,838 - - 4,838
1101 2055 Replacements New 218,435 2.215% 4,838 - - 4,838
1102 2055 Float Historical - - (1,008) - - (1,008)
1103 FY 2055 Subtotal: 499,105 11,687 - - 11,687
BP-18-FS-BPA-02A Page 228

TABLE 13C:
Interest Calculation Summary, SHIFT STUDY
October 1, 2015 - September 30, 2019 Cost Evaluation Period
($000s) (FY 2019)
A B D E F G H I J
Fiscal Year Project Type
Current
Principal Rate Interest Premium
Net Interest
Accrual Total
1104 2056 Albeni Falls Historical 57 4.375% 2 - - 2
1105 2056 Boise Historical 64 4.875% 3 - - 3
1106 2056 Bonneville Dam Historical 14,609 4.875% 712 - - 712
1107 2056 Chief Joseph Historical 3,500 4.875% 171 - - 171
1108 2056 Columbia Basin Historical 2,173 4.567% 99 - - 99
1109 2056 Columbia River Fish Mitigation Historical 36,554 4.875% 1,782 - - 1,782
1110 2056 Dworshak Historical 10 4.877% - -
1111 2056 Hungry Horse Dam Historical 137 4.654% 6 - - 6
1112 2056 Ice Harbor Historical 14 4.874% 1 - - 1
1113 2056 John Day Historical 1,548 4.375% 68 - - 68
1114 2056 Libby Historical 1,567 4.875% 76 - - 76
1115 2056 Little Goose Historical 13 4.877% 1 - - 1
1116 2056 Lower Granite Historical 24 4.875% 1 - - 1
1117 2056 Lower Monument Historical 9 4.871% - -
1118 2056 Lower Snake Fish and Wildlife Historical 74 4.874% 4 - - 4
1119 2056 McNary Historical 215 4.875% 10 - - 10
1120 2056 The Dalles Historical 1,651 4.875% 80 - - 80
1121 2056 Yakima Chandler/Kenniwick Historical 15 4.377% 1 - - 1
1122 2056 Replacements Historical 218,435 2.215% 4,838 - - 4,838
1123 2056 Replacements New 218,435 2.215% 4,838 - - 4,838
1124 2056 Float Historical - - (1,008) - - (1,008)
1125 FY 2056 Subtotal: 499,105 11,687 - - 11,687
1126 2057 Albeni Falls Historical 57 4.375% 2 - - 2
1127 2057 Boise Historical 64 4.875% 3 - - 3
1128 2057 Bonneville Dam Historical 14,609 4.875% 712 - - 712
1129 2057 Chief Joseph Historical 3,500 4.875% 171 - - 171
1130 2057 Columbia Basin Historical 2,173 4.567% 99 - - 99
1131 2057 Columbia River Fish Mitigation Historical 36,554 4.875% 1,782 - - 1,782
1132 2057 Dworshak Historical 10 4.877% - -
1133 2057 Hungry Horse Dam Historical 137 4.654% 6 - - 6
1134 2057 Ice Harbor Historical 14 4.874% 1 - - 1
1135 2057 John Day Historical 1,548 4.375% 68 - - 68
1136 2057 Libby Historical 1,567 4.875% 76 - - 76
1137 2057 Little Goose Historical 13 4.877% 1 - - 1
1138 2057 Lower Granite Historical 24 4.875% 1 - - 1
1139 2057 Lower Monument Historical 9 4.871% - -
1140 2057 Lower Snake Fish and Wildlife Historical 74 4.874% 4 - - 4
1141 2057 McNary Historical 215 4.875% 10 - - 10
1142 2057 The Dalles Historical 1,651 4.875% 80 - - 80
1143 2057 Yakima Chandler/Kenniwick Historical 15 4.377% 1 - - 1
1144 2057 Replacements Historical 218,435 2.215% 4,838 - - 4,838
1145 2057 Replacements New 218,435 2.215% 4,838 - - 4,838
1146 2057 Float Historical - - (1,008) - - (1,008)
1147 FY 2057 Subtotal: 499,105 11,687 - - 11,687
1148 2058 Albeni Falls Historical 57 4.375% 2 - - 2
1149 2058 Boise Historical 64 4.875% 3 - - 3
1150 2058 Bonneville Dam Historical 14,609 4.875% 712 - - 712
1151 2058 Chief Joseph Historical 3,500 4.875% 171 - - 171
1152 2058 Columbia Basin Historical 2,173 4.567% 99 - - 99
1153 2058 Columbia River Fish Mitigation Historical 36,554 4.875% 1,782 - - 1,782
1154 2058 Dworshak Historical 10 4.877% - -
1155 2058 Hungry Horse Dam Historical 137 4.654% 6 - - 6
1156 2058 Ice Harbor Historical 14 4.874% 1 - - 1
1157 2058 John Day Historical 1,548 4.375% 68 - - 68
1158 2058 Libby Historical 1,567 4.875% 76 - - 76
1159 2058 Little Goose Historical 13 4.877% 1 - - 1
1160 2058 Lower Granite Historical 24 4.875% 1 - - 1
1161 2058 Lower Monument Historical 9 4.871% - -
1162 2058 Lower Snake Fish and Wildlife Historical 74 4.874% 4 - - 4
1163 2058 McNary Historical 215 4.875% 10 - - 10
1164 2058 The Dalles Historical 1,651 4.875% 80 - - 80
1165 2058 Yakima Chandler/Kenniwick Historical 15 4.377% 1 - - 1
1166 2058 Replacements Historical 218,435 2.215% 4,838 - - 4,838
1167 2058 Replacements New 218,435 2.215% 4,838 - - 4,838
1168 2058 Float Historical - - (1,008) - - (1,008)
1169 FY 2058 Subtotal: 499,105 11,687 - - 11,687
1170 2059 Albeni Falls Historical 57 4.375% 2 - - 2
BP-18-FS-BPA-02A Page 229

TABLE 13C:
Interest Calculation Summary, SHIFT STUDY
October 1, 2015 - September 30, 2019 Cost Evaluation Period
($000s) (FY 2019)
A B D E F G H I J
Fiscal Year Project Type
Current
Principal Rate Interest Premium
Net Interest
Accrual Total
1171 2059 Columbia Basin Historical 1,338 4.375% 59 - - 59
1172 2059 Hungry Horse Dam Historical 60 4.376% 3 - - 3
1173 2059 John Day Historical 1,548 4.375% 68 - - 68
1174 2059 Yakima Chandler/Kenniwick Historical 15 4.377% 1 - - 1
1175 2059 Replacements Historical 218,435 2.215% 4,838 - - 4,838
1176 2059 Replacements New 218,435 2.215% 4,838 - - 4,838
1177 2059 Float Historical - - (1,008) - - (1,008)
1178 FY 2059 Subtotal: 439,889 8,800 - - 8,800
1179 2060 Replacements Historical 218,435 2.215% 4,838 - - 4,838
1180 2060 Replacements New 218,435 2.215% 4,838 - - 4,838
1181 2060 Float Historical - - (1,008) - - (1,008)
1182 FY 2060 Subtotal: 436,871 8,668 - - 8,668
1183 2061 Replacements Historical 218,435 2.215% 4,838 - - 4,838
1184 2061 Replacements New 218,435 2.215% 4,838 - - 4,838
1185 2061 Float Historical - - (1,008) - - (1,008)
1186 FY 2061 Subtotal: 436,871 8,668 - - 8,668
1187 2062 Replacements Historical 218,435 2.215% 4,838 - - 4,838
1188 2062 Replacements New 218,435 2.215% 4,838 - - 4,838
1189 2062 Float Historical - - (1,008) - - (1,008)
1190 FY 2062 Subtotal: 436,871 8,668 - - 8,668
1191 2063 Replacements Historical 218,435 2.215% 4,838 - - 4,838
1192 2063 Replacements New 218,435 2.215% 4,838 - - 4,838
1193 2063 Float Historical - - (1,008) - - (1,008)
1194 FY 2063 Subtotal: 436,871 8,668 - - 8,668
1195 2064 Replacements Historical 218,435 2.215% 4,838 - - 4,838
1196 2064 Replacements New 218,435 2.215% 4,838 - - 4,838
1197 2064 Float Historical - - (1,008) - - (1,008)
1198 FY 2064 Subtotal: 436,871 8,668 - - 8,668
1199 2065 Replacements Historical 218,435 2.215% 4,838 - - 4,838
1200 2065 Replacements New 218,435 2.215% 4,838 - - 4,838
1201 2065 Float Historical - - (1,008) - - (1,008)
1202 FY 2065 Subtotal: 436,871 8,668 - - 8,668
1203 2066 Replacements Historical 218,435 2.215% 4,838 - - 4,838
1204 2066 Replacements New 218,435 2.215% 4,838 - - 4,838
1205 2066 Float Historical - - (1,008) - - (1,008)
1206 FY 2066 Subtotal: 436,871 8,668 - - 8,668
1207 2067 Replacements Historical 218,435 2.215% 4,838 - - 4,838
1208 2067 Replacements New 218,435 2.215% 4,838 - - 4,838
1209 2067 Float Historical - - (1,008) - - (1,008)
1210 FY 2067 Subtotal: 436,871 8,668 - - 8,668
1211 2068 Replacements Historical 218,435 2.215% 4,838 - - 4,838
1212 2068 Replacements New 218,435 2.215% 4,838 - - 4,838
1213 2068 Float Historical - - (1,008) - - (1,008)
1214 FY 2068 Subtotal: 436,871 8,668 - - 8,668
1215 2069 Replacements Historical 218,435 2.215% 4,838 - - 4,838
1216 2069 Replacements New 218,435 2.215% 4,838 - - 4,838
1217 2069 Float Historical - - (1,008) - - (1,008)
1218 FY 2069 Subtotal: 436,871 8,668 - - 8,668
1219 Grand Total: 127,052,919 4,511,470 - (10,729) 4,500,741
BP-18-FS-BPA-02A Page 230
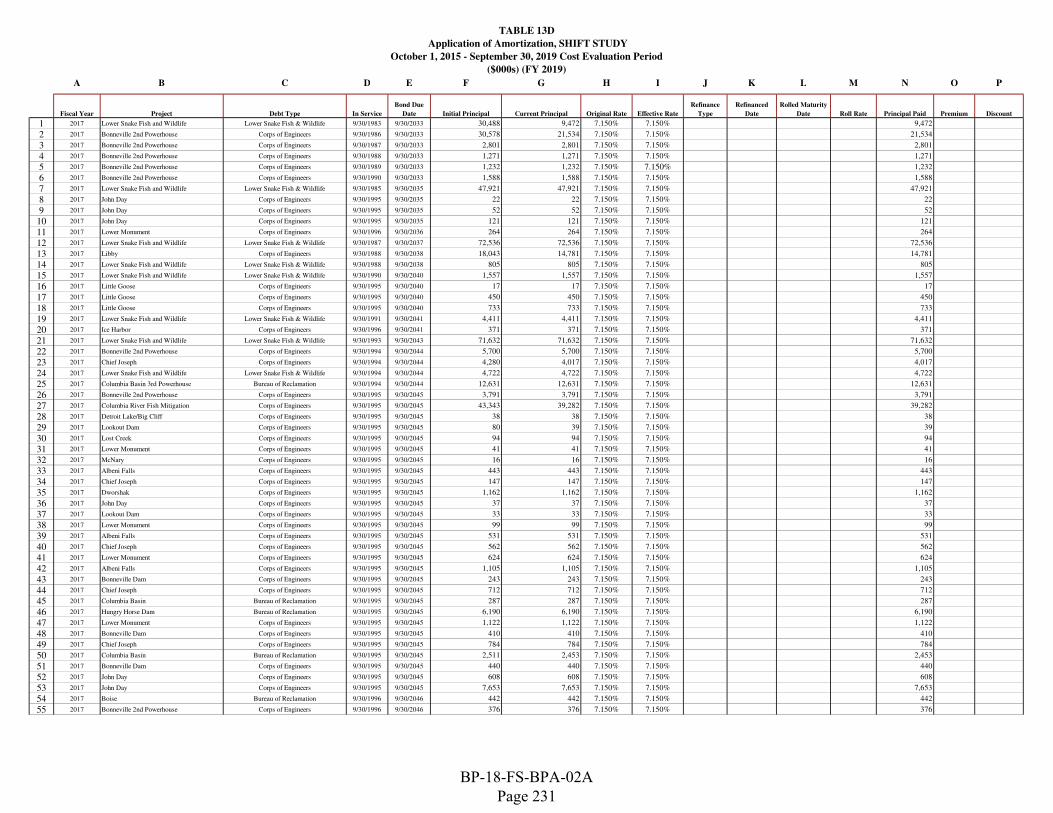
TABLE 13D
Application of Amortization, SHIFT STUDY
October 1, 2015 - September 30, 2019 Cost Evaluation Period
($000s) (FY 2019)
A B C D E F G H I J K L M N O P
Fiscal Year Project Debt Type In Service
Bond Due
Date Initial Principal Current Principal Original Rate Effective Rate
Refinance
Type
Refinanced
Date
Rolled Maturity
Date Roll Rate Principal Paid Premium Discount
1 2017 Lower Snake Fish and Wildlife Lower Snake Fish & Wildlife 9/30/1983 9/30/2033 30,488 9,472 7.150% 7.150% 9,472
2 2017 Bonneville 2nd Powerhouse Corps of Engineers 9/30/1986 9/30/2033 30,578 21,534 7.150% 7.150% 21,534
3 2017 Bonneville 2nd Powerhouse Corps of Engineers 9/30/1987 9/30/2033 2,801 2,801 7.150% 7.150% 2,801
4 2017 Bonneville 2nd Powerhouse Corps of Engineers 9/30/1988 9/30/2033 1,271 1,271 7.150% 7.150% 1,271
5 2017 Bonneville 2nd Powerhouse Corps of Engineers 9/30/1989 9/30/2033 1,232 1,232 7.150% 7.150% 1,232
6 2017 Bonneville 2nd Powerhouse Corps of Engineers 9/30/1990 9/30/2033 1,588 1,588 7.150% 7.150% 1,588
7 2017 Lower Snake Fish and Wildlife Lower Snake Fish & Wildlife 9/30/1985 9/30/2035 47,921 47,921 7.150% 7.150% 47,921
8 2017 John Day Corps of Engineers 9/30/1995 9/30/2035 22 22 7.150% 7.150% 22
9 2017 John Day Corps of Engineers 9/30/1995 9/30/2035 52 52 7.150% 7.150% 52
10 2017 John Day Corps of Engineers 9/30/1995 9/30/2035 121 121 7.150% 7.150% 121
11 2017 Lower Monument Corps of Engineers 9/30/1996 9/30/2036 264 264 7.150% 7.150% 264
12 2017 Lower Snake Fish and Wildlife Lower Snake Fish & Wildlife 9/30/1987 9/30/2037 72,536 72,536 7.150% 7.150% 72,536
13 2017 Libby Corps of Engineers 9/30/1988 9/30/2038 18,043 14,781 7.150% 7.150% 14,781
14 2017 Lower Snake Fish and Wildlife Lower Snake Fish & Wildlife 9/30/1988 9/30/2038 805 805 7.150% 7.150% 805
15 2017 Lower Snake Fish and Wildlife Lower Snake Fish & Wildlife 9/30/1990 9/30/2040 1,557 1,557 7.150% 7.150% 1,557
16 2017 Little Goose Corps of Engineers 9/30/1995 9/30/2040 17 17 7.150% 7.150% 17
17 2017 Little Goose Corps of Engineers 9/30/1995 9/30/2040 450 450 7.150% 7.150% 450
18 2017 Little Goose Corps of Engineers 9/30/1995 9/30/2040 733 733 7.150% 7.150% 733
19 2017 Lower Snake Fish and Wildlife Lower Snake Fish & Wildlife 9/30/1991 9/30/2041 4,411 4,411 7.150% 7.150% 4,411
20 2017 Ice Harbor Corps of Engineers 9/30/1996 9/30/2041 371 371 7.150% 7.150% 371
21 2017 Lower Snake Fish and Wildlife Lower Snake Fish & Wildlife 9/30/1993 9/30/2043 71,632 71,632 7.150% 7.150% 71,632
22 2017 Bonneville 2nd Powerhouse Corps of Engineers 9/30/1994 9/30/2044 5,700 5,700 7.150% 7.150% 5,700
23 2017 Chief Joseph Corps of Engineers 9/30/1994 9/30/2044 4,280 4,017 7.150% 7.150% 4,017
24 2017 Lower Snake Fish and Wildlife Lower Snake Fish & Wildlife 9/30/1994 9/30/2044 4,722 4,722 7.150% 7.150% 4,722
25 2017 Columbia Basin 3rd Powerhouse Bureau of Reclamation 9/30/1994 9/30/2044 12,631 12,631 7.150% 7.150% 12,631
26 2017 Bonneville 2nd Powerhouse Corps of Engineers 9/30/1995 9/30/2045 3,791 3,791 7.150% 7.150% 3,791
27 2017 Columbia River Fish Mitigation Corps of Engineers 9/30/1995 9/30/2045 43,343 39,282 7.150% 7.150% 39,282
28 2017 Detroit Lake/Big Cliff Corps of Engineers 9/30/1995 9/30/2045 38 38 7.150% 7.150% 38
29 2017 Lookout Dam Corps of Engineers 9/30/1995 9/30/2045 80 39 7.150% 7.150% 39
30 2017 Lost Creek Corps of Engineers 9/30/1995 9/30/2045 94 94 7.150% 7.150% 94
31 2017 Lower Monument Corps of Engineers 9/30/1995 9/30/2045 41 41 7.150% 7.150% 41
32 2017 McNary Corps of Engineers 9/30/1995 9/30/2045 16 16 7.150% 7.150% 16
33 2017 Albeni Falls Corps of Engineers 9/30/1995 9/30/2045 443 443 7.150% 7.150% 443
34 2017 Chief Joseph Corps of Engineers 9/30/1995 9/30/2045 147 147 7.150% 7.150% 147
35 2017 Dworshak Corps of Engineers 9/30/1995 9/30/2045 1,162 1,162 7.150% 7.150% 1,162
36 2017 John Day Corps of Engineers 9/30/1995 9/30/2045 37 37 7.150% 7.150% 37
37 2017 Lookout Dam Corps of Engineers 9/30/1995 9/30/2045 33 33 7.150% 7.150% 33
38 2017 Lower Monument Corps of Engineers 9/30/1995 9/30/2045 99 99 7.150% 7.150% 99
39 2017 Albeni Falls Corps of Engineers 9/30/1995 9/30/2045 531 531 7.150% 7.150% 531
40 2017 Chief Joseph Corps of Engineers 9/30/1995 9/30/2045 562 562 7.150% 7.150% 562
41 2017 Lower Monument Corps of Engineers 9/30/1995 9/30/2045 624 624 7.150% 7.150% 624
42 2017 Albeni Falls Corps of Engineers 9/30/1995 9/30/2045 1,105 1,105 7.150% 7.150% 1,105
43 2017 Bonneville Dam Corps of Engineers 9/30/1995 9/30/2045 243 243 7.150% 7.150% 243
44 2017 Chief Joseph Corps of Engineers 9/30/1995 9/30/2045 712 712 7.150% 7.150% 712
45 2017 Columbia Basin Bureau of Reclamation 9/30/1995 9/30/2045 287 287 7.150% 7.150% 287
46 2017 Hungry Horse Dam Bureau of Reclamation 9/30/1995 9/30/2045 6,190 6,190 7.150% 7.150% 6,190
47 2017 Lower Monument Corps of Engineers 9/30/1995 9/30/2045 1,122 1,122 7.150% 7.150% 1,122
48 2017 Bonneville Dam Corps of Engineers 9/30/1995 9/30/2045 410 410 7.150% 7.150% 410
49 2017 Chief Joseph Corps of Engineers 9/30/1995 9/30/2045 784 784 7.150% 7.150% 784
50 2017 Columbia Basin Bureau of Reclamation 9/30/1995 9/30/2045 2,511 2,453 7.150% 7.150% 2,453
51 2017 Bonneville Dam Corps of Engineers 9/30/1995 9/30/2045 440 440 7.150% 7.150% 440
52 2017 John Day Corps of Engineers 9/30/1995 9/30/2045 608 608 7.150% 7.150% 608
53 2017 John Day Corps of Engineers 9/30/1995 9/30/2045 7,653 7,653 7.150% 7.150% 7,653
54 2017 Boise Bureau of Reclamation 9/30/1996 9/30/2046 442 442 7.150% 7.150% 442
55 2017 Bonneville 2nd Powerhouse Corps of Engineers 9/30/1996 9/30/2046 376 376 7.150% 7.150% 376
BP-18-FS-BPA-02A Page 231
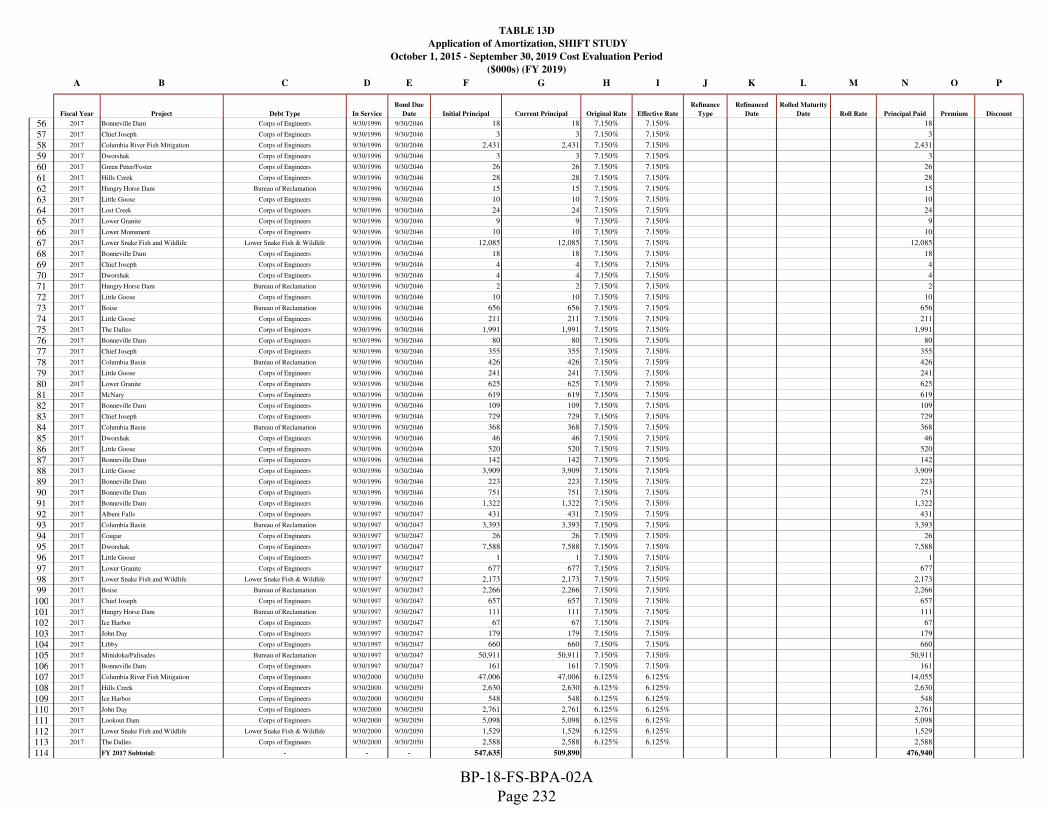
TABLE 13D
Application of Amortization, SHIFT STUDY
October 1, 2015 - September 30, 2019 Cost Evaluation Period
($000s) (FY 2019)
A B C D E F G H I J K L M N O P
Fiscal Year Project Debt Type In Service
Bond Due
Date Initial Principal Current Principal Original Rate Effective Rate
Refinance
Type
Refinanced
Date
Rolled Maturity
Date Roll Rate Principal Paid Premium Discount
56 2017 Bonneville Dam Corps of Engineers 9/30/1996 9/30/2046 18 18 7.150% 7.150% 18
57 2017 Chief Joseph Corps of Engineers 9/30/1996 9/30/2046 3 3 7.150% 7.150% 3
58 2017 Columbia River Fish Mitigation Corps of Engineers 9/30/1996 9/30/2046 2,431 2,431 7.150% 7.150% 2,431
59 2017 Dworshak Corps of Engineers 9/30/1996 9/30/2046 3 3 7.150% 7.150% 3
60 2017 Green Peter/Foster Corps of Engineers 9/30/1996 9/30/2046 26 26 7.150% 7.150% 26
61 2017 Hills Creek Corps of Engineers 9/30/1996 9/30/2046 28 28 7.150% 7.150% 28
62 2017 Hungry Horse Dam Bureau of Reclamation 9/30/1996 9/30/2046 15 15 7.150% 7.150% 15
63 2017 Little Goose Corps of Engineers 9/30/1996 9/30/2046 10 10 7.150% 7.150% 10
64 2017 Lost Creek Corps of Engineers 9/30/1996 9/30/2046 24 24 7.150% 7.150% 24
65 2017 Lower Granite Corps of Engineers 9/30/1996 9/30/2046 9 9 7.150% 7.150% 9
66 2017 Lower Monument Corps of Engineers 9/30/1996 9/30/2046 10 10 7.150% 7.150% 10
67 2017 Lower Snake Fish and Wildlife Lower Snake Fish & Wildlife 9/30/1996 9/30/2046 12,085 12,085 7.150% 7.150% 12,085
68 2017 Bonneville Dam Corps of Engineers 9/30/1996 9/30/2046 18 18 7.150% 7.150% 18
69 2017 Chief Joseph Corps of Engineers 9/30/1996 9/30/2046 4 4 7.150% 7.150% 4
70 2017 Dworshak Corps of Engineers 9/30/1996 9/30/2046 4 4 7.150% 7.150% 4
71 2017 Hungry Horse Dam Bureau of Reclamation 9/30/1996 9/30/2046 2 2 7.150% 7.150% 2
72 2017 Little Goose Corps of Engineers 9/30/1996 9/30/2046 10 10 7.150% 7.150% 10
73 2017 Boise Bureau of Reclamation 9/30/1996 9/30/2046 656 656 7.150% 7.150% 656
74 2017 Little Goose Corps of Engineers 9/30/1996 9/30/2046 211 211 7.150% 7.150% 211
75 2017 The Dalles Corps of Engineers 9/30/1996 9/30/2046 1,991 1,991 7.150% 7.150% 1,991
76 2017 Bonneville Dam Corps of Engineers 9/30/1996 9/30/2046 80 80 7.150% 7.150% 80
77 2017 Chief Joseph Corps of Engineers 9/30/1996 9/30/2046 355 355 7.150% 7.150% 355
78 2017 Columbia Basin Bureau of Reclamation 9/30/1996 9/30/2046 426 426 7.150% 7.150% 426
79 2017 Little Goose Corps of Engineers 9/30/1996 9/30/2046 241 241 7.150% 7.150% 241
80 2017 Lower Granite Corps of Engineers 9/30/1996 9/30/2046 625 625 7.150% 7.150% 625
81 2017 McNary Corps of Engineers 9/30/1996 9/30/2046 619 619 7.150% 7.150% 619
82 2017 Bonneville Dam Corps of Engineers 9/30/1996 9/30/2046 109 109 7.150% 7.150% 109
83 2017 Chief Joseph Corps of Engineers 9/30/1996 9/30/2046 729 729 7.150% 7.150% 729
84 2017 Columbia Basin Bureau of Reclamation 9/30/1996 9/30/2046 368 368 7.150% 7.150% 368
85 2017 Dworshak Corps of Engineers 9/30/1996 9/30/2046 46 46 7.150% 7.150% 46
86 2017 Little Goose Corps of Engineers 9/30/1996 9/30/2046 520 520 7.150% 7.150% 520
87 2017 Bonneville Dam Corps of Engineers 9/30/1996 9/30/2046 142 142 7.150% 7.150% 142
88 2017 Little Goose Corps of Engineers 9/30/1996 9/30/2046 3,909 3,909 7.150% 7.150% 3,909
89 2017 Bonneville Dam Corps of Engineers 9/30/1996 9/30/2046 223 223 7.150% 7.150% 223
90 2017 Bonneville Dam Corps of Engineers 9/30/1996 9/30/2046 751 751 7.150% 7.150% 751
91 2017 Bonneville Dam Corps of Engineers 9/30/1996 9/30/2046 1,322 1,322 7.150% 7.150% 1,322
92 2017 Albeni Falls Corps of Engineers 9/30/1997 9/30/2047 431 431 7.150% 7.150% 431
93 2017 Columbia Basin Bureau of Reclamation 9/30/1997 9/30/2047 3,393 3,393 7.150% 7.150% 3,393
94 2017 Cougar Corps of Engineers 9/30/1997 9/30/2047 26 26 7.150% 7.150% 26
95 2017 Dworshak Corps of Engineers 9/30/1997 9/30/2047 7,588 7,588 7.150% 7.150% 7,588
96 2017 Little Goose Corps of Engineers 9/30/1997 9/30/2047 1 1 7.150% 7.150% 1
97 2017 Lower Granite Corps of Engineers 9/30/1997 9/30/2047 677 677 7.150% 7.150% 677
98 2017 Lower Snake Fish and Wildlife Lower Snake Fish & Wildlife 9/30/1997 9/30/2047 2,173 2,173 7.150% 7.150% 2,173
99 2017 Boise Bureau of Reclamation 9/30/1997 9/30/2047 2,266 2,266 7.150% 7.150% 2,266
100 2017 Chief Joseph Corps of Engineers 9/30/1997 9/30/2047 657 657 7.150% 7.150% 657
101 2017 Hungry Horse Dam Bureau of Reclamation 9/30/1997 9/30/2047 111 111 7.150% 7.150% 111
102 2017 Ice Harbor Corps of Engineers 9/30/1997 9/30/2047 67 67 7.150% 7.150% 67
103 2017 John Day Corps of Engineers 9/30/1997 9/30/2047 179 179 7.150% 7.150% 179
104 2017 Libby Corps of Engineers 9/30/1997 9/30/2047 660 660 7.150% 7.150% 660
105 2017 Minidoka/Palisades Bureau of Reclamation 9/30/1997 9/30/2047 50,911 50,911 7.150% 7.150% 50,911
106 2017 Bonneville Dam Corps of Engineers 9/30/1997 9/30/2047 161 161 7.150% 7.150% 161
107 2017 Columbia River Fish Mitigation Corps of Engineers 9/30/2000 9/30/2050 47,006 47,006 6.125% 6.125% 14,055
108 2017 Hills Creek Corps of Engineers 9/30/2000 9/30/2050 2,630 2,630 6.125% 6.125% 2,630
109 2017 Ice Harbor Corps of Engineers 9/30/2000 9/30/2050 548 548 6.125% 6.125% 548
110 2017 John Day Corps of Engineers 9/30/2000 9/30/2050 2,761 2,761 6.125% 6.125% 2,761
111 2017 Lookout Dam Corps of Engineers 9/30/2000 9/30/2050 5,098 5,098 6.125% 6.125% 5,098
112 2017 Lower Snake Fish and Wildlife Lower Snake Fish & Wildlife 9/30/2000 9/30/2050 1,529 1,529 6.125% 6.125% 1,529
113 2017 The Dalles Corps of Engineers 9/30/2000 9/30/2050 2,588 2,588 6.125% 6.125% 2,588
114 FY 2017 Subtotal: - - - 547,635 509,890 476,940
BP-18-FS-BPA-02A Page 232

TABLE 13D
Application of Amortization, SHIFT STUDY
October 1, 2015 - September 30, 2019 Cost Evaluation Period
($000s) (FY 2019)
A B C D E F G H I J K L M N O P
Fiscal Year Project Debt Type In Service
Bond Due
Date Initial Principal Current Principal Original Rate Effective Rate
Refinance
Type
Refinanced
Date
Rolled Maturity
Date Roll Rate Principal Paid Premium Discount
115 2018 Construction (AS) - 6/30/2013 6/30/2017 3,000 3,000 1.271% 0.750% Global 42916 43281 0.75 3,000
116 2018 Construction (AS) - 8/31/2013 8/31/2017 2,000 2,000 1.494% 0.750% Global 42978 43343 0.75 2,000
117 2018 Construction (AS) - 9/30/2015 9/30/2017 7,700 7,700 0.744% 0.750% Global 43008 43373 0.75 7,700
118 2018 Construction (AS) - 4/30/2017 1/31/2018 2,450 2,450 1.051% 1.051% 2,450
119 2018 Conservation - 1/31/2013 1/31/2018 9,000 9,000 1.107% 1.107% 9,000
120 2018 Conservation - 4/30/2017 1/31/2018 20,000 20,000 1.051% 1.051% 20,000
121 2018 Bonneville Dam Corps of Engineers 9/30/2000 9/30/2050 24,446 24,446 6.125% 6.125% 24,446
122 2018 Columbia River Fish Mitigation Corps of Engineers 9/30/2000 9/30/2050 47,006 32,951 6.125% 6.125% 32,951
123 2018 Columbia River Fish Mitigation Corps of Engineers 9/30/2001 9/30/2051 6,168 6,168 5.875% 5.875% 3,315
124 2018 Green Peter/Foster Corps of Engineers 9/30/2001 9/30/2051 200 200 5.875% 5.875% 200
125 2018 Hills Creek Corps of Engineers 9/30/2001 9/30/2051 8 8 5.875% 5.875% 8
126 2018 Hungry Horse Dam Bureau of Reclamation 9/30/2001 9/30/2051 552 552 5.875% 5.875% 552
127 2018 Ice Harbor Corps of Engineers 9/30/2001 9/30/2051 764 764 5.875% 5.875% 764
128 2018 John Day Corps of Engineers 9/30/2001 9/30/2051 619 619 5.875% 5.875% 619
129 2018 Libby Corps of Engineers 9/30/2001 9/30/2051 5,562 5,562 5.875% 5.875% 5,562
130 2018 Little Goose Corps of Engineers 9/30/2001 9/30/2051 4,608 4,608 5.875% 5.875% 4,608
131 2018 Lost Creek Corps of Engineers 9/30/2001 9/30/2051 147 147 5.875% 5.875% 147
132 2018 Lower Granite Corps of Engineers 9/30/2001 9/30/2051 2,025 2,025 5.875% 5.875% 2,025
133 2018 Lower Monument Corps of Engineers 9/30/2001 9/30/2051 3,301 3,301 5.875% 5.875% 3,301
134 2018 Lower Snake Fish and Wildlife Lower Snake Fish & Wildlife 9/30/2001 9/30/2051 325 325 5.875% 5.875% 325
135 2018 McNary Corps of Engineers 9/30/2001 9/30/2051 1,046 1,046 5.875% 5.875% 1,046
136 2018 Minidoka/Palisades Bureau of Reclamation 9/30/2001 9/30/2051 42 42 5.875% 5.875% 42
137 2018 RRP - Green Springs Bureau of Reclamation 9/30/2001 9/30/2051 11,145 11,145 5.875% 5.875% 11,145
138 2018 Yakima Roza Bureau of Reclamation 9/30/2001 9/30/2051 15 14 5.875% 5.875% 14
139 FY 2018 Subtotal: - - - 152,129 138,073 135,220
140 2019 Bureau Direct - 10/31/2009 10/31/2018 24,000 24,000 3.719% 3.719% 24,000
141 2019 Construction (AS) - 11/30/2012 11/30/2018 5,250 5,250 1.109% 1.109% 5,250
142 2019 Fish and Wildlife - 12/31/2009 12/31/2018 26,000 26,000 4.069% 4.069% 26,000
143 2019 Bureau Direct - 1/16/2014 12/31/2018 43,000 43,000 1.943% 1.943% 43,000
144 2019 Bureau Direct - 1/16/2014 12/31/2018 38,000 38,000 1.943% 1.943% 38,000
145 2019 Fish and Wildlife - 8/31/2010 8/31/2019 20,000 20,000 2.646% 2.646% 20,000
146 2019 Columbia Basin Bureau of Reclamation 9/30/2001 9/30/2051 69,226 69,226 5.875% 5.875% 14,236
147 2019 Columbia River Fish Mitigation Corps of Engineers 9/30/2001 9/30/2051 6,168 2,853 5.875% 5.875% 2,853
148 2019 Detroit Lake/Big Cliff Corps of Engineers 9/30/2001 9/30/2051 282 282 5.875% 5.875% 282
149 FY 2019 Subtotal: - - - 231,926 228,611 173,622
150 2020 Construction (AS) - 10/31/2013 10/31/2019 4,200 4,200 2.039% 2.039% 4,200
151 2020 Construction (AS) - 10/31/2013 10/31/2019 5,000 5,000 2.039% 2.039% 5,000
152 2020 Bureau Direct - 10/31/2009 10/31/2019 20,000 20,000 3.842% 3.842% 20,000
153 2020 Bureau Direct - 11/30/2009 11/30/2019 7,000 7,000 3.637% 3.637% 7,000
154 2020 Bureau Direct - 12/31/2009 12/31/2019 13,000 13,000 4.194% 4.194% 13,000
155 2020 Construction (AS) - 1/31/2014 1/31/2020 1,750 1,750 2.183% 2.183% 1,750
156 2020 Construction (AS) - 1/31/2014 1/31/2020 2,000 2,000 2.183% 2.183% 2,000
157 2020 Construction (AS) - 4/30/2014 3/31/2020 1,400 1,400 0.947% 0.947% 1,400
158 2020 Construction (AS) - 4/30/2014 3/31/2020 2,000 2,000 0.947% 0.947% 2,000
159 2020 Bureau Direct - 3/31/2010 3/31/2020 30,000 30,000 4.083% 4.083% 30,000
160 2020 Bureau Direct - 4/30/2010 4/30/2020 18,000 18,000 3.973% 3.973% 18,000
161 2020 Construction (AS) - 5/31/2014 4/30/2020 700 700 0.526% 0.526% 700
162 2020 Bureau Direct - 5/31/2010 5/31/2020 15,000 15,000 3.574% 3.574% 15,000
163 2020 Bureau Direct - 7/31/2010 7/31/2020 17,000 17,000 3.118% 3.118% 17,000
164 2020 Construction (AS) - 7/31/2014 7/31/2020 1,050 1,050 0.674% 0.674% 1,050
165 2020 Columbia Basin Bureau of Reclamation 9/30/2001 9/30/2051 69,226 54,989 5.875% 5.875% 6,543
166 FY 2020 Subtotal: - - - 207,326 193,089 144,643
167 2021 Construction (AS) - 11/30/2014 11/30/2020 2,100 2,100 1.809% 1.809% 2,100
168 2021 Construction (AS) - 12/31/2014 12/31/2020 1,050 1,050 1.922% 1.922% 1,050
169 2021 Technology (G) - 1/31/2015 1/31/2021 35,000 35,000 1.469% 1.469% 35,000
170 2021 Bureau Direct - 1/31/2009 1/31/2021 25,000 25,000 3.999% 3.999% 25,000
171 2021 Construction (AS) - 2/28/2015 2/28/2021 1,750 1,750 1.761% 1.761% 1,750
172 2021 Construction (AS) - 5/31/2015 5/31/2021 2,100 2,100 1.898% 1.898% 2,100
173 2021 Conservation - 5/31/2015 5/31/2021 5,000 5,000 1.898% 1.898% 5,000
BP-18-FS-BPA-02A Page 233

TABLE 13D
Application of Amortization, SHIFT STUDY
October 1, 2015 - September 30, 2019 Cost Evaluation Period
($000s) (FY 2019)
A B C D E F G H I J K L M N O P
Fiscal Year Project Debt Type In Service
Bond Due
Date Initial Principal Current Principal Original Rate Effective Rate
Refinance
Type
Refinanced
Date
Rolled Maturity
Date Roll Rate Principal Paid Premium Discount
174 2021 Conservation - 7/31/2015 7/31/2021 14,000 14,000 2.067% 2.067% 14,000
175 2021 Bureau Direct - 11/20/2013 9/30/2021 50,000 50,000 2.812% 2.812% 50,000
176 2021 Bureau Direct - 9/30/2010 9/30/2021 22,000 22,000 2.883% 2.883% 22,000
177 2021 Columbia Basin Bureau of Reclamation 9/30/2001 9/30/2051 69,226 48,446 5.875% 5.875% 2,140
178 FY 2021 Subtotal: - - - 227,226 206,446 160,140
179 2022 Construction (AS) - 10/31/2015 10/31/2021 2,800 2,800 1.942% 1.942% 2,800
180 2022 Conservation - 12/31/2013 12/31/2021 6,000 6,000 3.142% 3.142% 6,000
181 2022 Construction (AS) - 2/29/2016 2/28/2022 3,000 3,000 0.697% 0.697% 3,000
182 2022 Technology (G) - 10/31/2015 7/31/2022 6,000 6,000 0.674% 0.674% 6,000
183 2022 Conservation - 8/31/2015 8/31/2022 6,000 6,000 2.233% 2.233% 6,000
184 2022 Bureau Direct - 11/20/2013 9/30/2022 19,000 19,000 3.125% 3.125% 19,000
185 2022 Fish and Wildlife - 11/20/2013 9/30/2022 31,000 31,000 3.125% 3.125% 31,000
186 2022 Conservation - 9/30/2015 9/30/2022 4,000 4,000 2.062% 2.062% 4,000
187 2022 Technology (G) - 9/30/2017 9/30/2022 8,000 8,000 1.400% 1.400% 8,000
188 2022 Columbia Basin Bureau of Reclamation 9/30/2001 9/30/2051 69,226 46,306 5.875% 5.875% 37,701
189 FY 2022 Subtotal: - - - 155,026 132,106 123,501
190 2023 Conservation - 1/31/2011 1/31/2023 40,000 40,000 4.046% 4.046% 40,000
191 2023 Conservation - 4/30/2011 4/30/2023 35,000 35,000 3.932% 3.932% 35,000
192 2023 Conservation - 8/12/2011 8/31/2023 40,000 40,000 3.206% 3.206% 40,000
193 2023 Conservation - 11/20/2013 9/30/2023 27,000 27,000 3.375% 3.375% 27,000
194 2023 Technology (G) - 9/30/2018 9/30/2023 5,000 5,000 2.440% 2.440% 5,000
195 2023 Construction (AS) - 9/30/2017 9/30/2023 3,150 3,150 1.510% 1.510% 3,150
196 FY 2023 Subtotal: - - - 150,150 150,150 150,150
197 2024 Conservation - 12/31/2013 12/31/2023 55,000 55,000 0.732% 0.732% 55,000
198 2024 Conservation - 12/31/2014 12/31/2023 7,000 7,000 2.403% 2.403% 7,000
199 2024 Conservation - 1/31/2015 1/31/2024 7,000 7,000 1.908% 1.908% 7,000
200 2024 Fish and Wildlife - 1/31/2015 1/31/2024 5,000 5,000 1.908% 1.908% 5,000
201 2024 Conservation - 2/28/2015 2/29/2024 8,000 8,000 2.251% 2.251% 8,000
202 2024 Technology (G) - 9/30/2019 3/31/2024 5,000 5,000 3.160% 3.160% 5,000
203 2024 Conservation - 4/30/2015 4/30/2024 5,000 5,000 2.269% 2.269% 5,000
204 2024 Conservation - 5/31/2014 4/30/2024 15,000 15,000 0.526% 0.526% 15,000
205 2024 Fish and Wildlife - 6/30/2009 6/30/2024 20,000 20,000 4.556% 4.556% 20,000
206 2024 Construction (AS) - 9/30/2018 9/30/2024 5,670 5,600 2.560% 2.560% 5,600
207 2024 Columbia Basin Bureau of Reclamation 9/30/2001 9/30/2051 69,226 8,605 5.875% 5.875% 4,879
208 FY 2024 Subtotal: - - - 201,896 141,205 137,479
209 2025 Conservation - 6/30/2014 10/31/2024 5,000 5,000 0.526% 0.526% 5,000
210 2025 Conservation - 10/31/2014 12/31/2024 10,000 10,000 0.732% 0.732% 10,000
211 2025 Conservation - 3/31/2015 3/31/2025 5,000 5,000 2.295% 2.295% 5,000
212 2025 Conservation - 5/31/2014 4/30/2025 3,000 3,000 0.526% 0.526% 3,000
213 2025 Conservation - 4/30/2014 6/30/2025 30,000 30,000 0.732% 0.732% 30,000
214 2025 Conservation - 7/31/2014 7/31/2025 12,000 12,000 0.674% 0.674% 12,000
215 2025 Conservation - 8/31/2014 9/30/2025 4,000 4,000 0.947% 0.947% 4,000
216 2025 Construction (AS) - 9/30/2019 9/30/2025 5,670 5,950 3.270% 3.270% 5,950
217 2025 Ice Harbor Corps of Engineers 9/30/1999 9/30/2049 5,516 5,516 5.375% 5.375% 3,620
218 2025 John Day Corps of Engineers 9/30/1999 9/30/2049 3,510 3,510 5.375% 5.375% 3,510
219 2025 Lower Granite Corps of Engineers 9/30/1999 9/30/2049 856 856 5.375% 5.375% 856
220 2025 Lower Snake Fish and Wildlife Lower Snake Fish & Wildlife 9/30/1999 9/30/2049 7 7 5.375% 5.375% 7
221 2025 Bonneville Dam Corps of Engineers 9/30/2001 9/30/2051 2,530 2,530 5.875% 5.875% 2,530
222 2025 Chief Joseph Corps of Engineers 9/30/2001 9/30/2051 345 345 5.875% 5.875% 345
223 2025 Columbia Basin Bureau of Reclamation 9/30/2001 9/30/2051 69,226 3,727 5.875% 5.875% 3,727
224 2025 Bonneville Dam Corps of Engineers 9/30/2002 9/30/2052 448 448 5.500% 5.500% 448
225 2025 Chief Joseph Corps of Engineers 9/30/2002 9/30/2052 2 2 5.500% 5.500% 2
226 2025 Columbia River Fish Mitigation Corps of Engineers 9/30/2002 9/30/2052 8,797 8,797 5.500% 5.500% 8,797
227 2025 Detroit Lake/Big Cliff Corps of Engineers 9/30/2002 9/30/2052 18 18 5.500% 5.500% 18
228 2025 Dworshak Corps of Engineers 9/30/2002 9/30/2052 199 199 5.500% 5.500% 199
229 2025 Hills Creek Corps of Engineers 9/30/2002 9/30/2052 2 2 5.500% 5.500% 2
230 2025 Ice Harbor Corps of Engineers 9/30/2002 9/30/2052 1,014 1,014 5.500% 5.500% 1,014
BP-18-FS-BPA-02A Page 234

TABLE 13D
Application of Amortization, SHIFT STUDY
October 1, 2015 - September 30, 2019 Cost Evaluation Period
($000s) (FY 2019)
A B C D E F G H I J K L M N O P
Fiscal Year Project Debt Type In Service
Bond Due
Date Initial Principal Current Principal Original Rate Effective Rate
Refinance
Type
Refinanced
Date
Rolled Maturity
Date Roll Rate Principal Paid Premium Discount
231 2025 Little Goose Corps of Engineers 9/30/2002 9/30/2052 27 27 5.500% 5.500% 27
232 2025 Lower Granite Corps of Engineers 9/30/2002 9/30/2052 1,275 1,275 5.500% 5.500% 1,275
233 2025 Lower Monument Corps of Engineers 9/30/2002 9/30/2052 29 29 5.500% 5.500% 29
234 2025 Lower Snake Fish and Wildlife Lower Snake Fish & Wildlife 9/30/2002 9/30/2052 890 890 5.500% 5.500% 890
235 2025 The Dalles Corps of Engineers 9/30/2002 9/30/2052 1,226 1,226 5.500% 5.500% 1,226
236 FY 2025 Subtotal: - - - 170,585 105,366 103,470
237 2026 Conservation - 10/31/2013 10/31/2025 34,000 34,000 3.568% 3.568% 34,000
238 2026 Conservation - 1/31/2014 1/31/2026 5,000 5,000 3.621% 3.621% 5,000
239 2026 Fish and Wildlife - 1/31/2011 1/31/2026 50,000 50,000 4.440% 4.440% 50,000
240 2026 Fish and Wildlife - 2/28/2011 2/28/2026 15,000 15,000 4.398% 4.398% 15,000
241 2026 Fish and Wildlife - 6/22/2011 6/30/2026 15,000 15,000 4.205% 4.205% 15,000
242 2026 Ice Harbor Corps of Engineers 9/30/1999 9/30/2049 5,516 1,896 5.375% 5.375% 990
243 FY 2026 Subtotal: - - - 124,516 120,896 119,990
244 2027 Fish and Wildlife - 10/31/2013 12/31/2026 28,000 28,000 3.717% 3.717% 28,000
245 2027 Conservation - 11/30/2014 3/31/2027 6,000 6,000 0.947% 0.947% 6,000
246 2027 Fish and Wildlife - 5/31/2014 4/30/2027 11,000 11,000 0.526% 0.526% 11,000
247 2027 Fish and Wildlife - 11/30/2013 5/31/2027 5,000 5,000 0.713% 0.713% 5,000
248 2027 Fish and Wildlife - 10/31/2013 5/31/2027 11,000 11,000 3.762% 3.762% 11,000
249 2027 Bonneville Dam Corps of Engineers 9/30/1999 9/30/2049 19,368 19,368 5.375% 5.375% 19,368
250 2027 Columbia River Fish Mitigation Corps of Engineers 9/30/1999 9/30/2049 14,115 14,115 5.375% 5.375% 14,115
251 2027 Dworshak Corps of Engineers 9/30/1999 9/30/2049 630 630 5.375% 5.375% 630
252 2027 Ice Harbor Corps of Engineers 9/30/1999 9/30/2049 5,516 906 5.375% 5.375% 906
253 2027 Columbia River Fish Mitigation Corps of Engineers 9/30/2004 9/30/2054 60,581 60,581 5.375% 5.375% 6,627
254 2027 Ice Harbor Corps of Engineers 9/30/2004 9/30/2054 3,321 3,321 5.375% 5.375% 3,321
255 2027 John Day Corps of Engineers 9/30/2004 9/30/2054 2,830 2,830 5.375% 5.375% 2,830
256 2027 Little Goose Corps of Engineers 9/30/2004 9/30/2054 68 67 5.375% 5.375% 67
257 2027 Lower Monument Corps of Engineers 9/30/2004 9/30/2054 3,423 3,423 5.375% 5.375% 3,423
258 2027 Lower Snake Fish and Wildlife Lower Snake Fish & Wildlife 9/30/2004 9/30/2054 230 230 5.375% 5.375% 230
259 2027 McNary Corps of Engineers 9/30/2004 9/30/2054 6,138 6,138 5.375% 5.375% 6,138
260 2027 The Dalles Corps of Engineers 9/30/2004 9/30/2054 182 182 5.375% 5.375% 182
261 FY 2027 Subtotal: - - - 177,399 172,789 118,835
262 2028 Bureau Direct - 4/30/2009 4/30/2023 25,000 25,000 4.391% 3.642% Global 45046 46873 3.642 25,000
263 2028 Fish and Wildlife - 11/20/2013 9/30/2023 23,000 23,000 3.375% 3.642% Global 45199 47026 3.642 23,000
264 2028 Conservation - 10/31/2015 10/31/2027 25,000 25,000 0.732% 0.732% 25,000
265 2028 Fish and Wildlife - 3/31/2015 3/31/2028 3,000 3,000 2.511% 2.511% 3,000
266 2028 Columbia River Fish Mitigation Corps of Engineers 9/30/2004 9/30/2054 60,581 53,953 5.375% 5.375% 4,624
267 FY 2028 Subtotal: - - - 136,581 129,953 80,624
268 2029 Bureau Direct - 1/16/2014 12/31/2018 26,000 26,000 1.943% 3.705% Global 43465 47483 3.705 26,000
269 2029 Bureau Direct - 1/16/2014 12/31/2018 21,000 21,000 1.943% 3.705% Global 43465 47483 3.705 21,000
270 2029 Bureau Direct - 1/16/2014 12/31/2018 14,000 14,000 1.943% 3.705% Global 43465 47483 3.705 14,000
271 2029 Bureau Direct - 1/31/2010 1/31/2019 10,000 10,000 3.714% 3.705% Global 43496 47149 3.705 10,000
272 2029 Bureau Direct - 9/30/2009 9/30/2019 25,000 25,000 3.699% 3.705% Global 43738 47391 3.705 25,000
273 2029 Fish and Wildlife - 10/31/2013 10/31/2028 22,000 22,000 3.880% 3.880% 22,000
274 2029 Fish and Wildlife - 1/31/2014 1/31/2029 7,000 7,000 3.896% 3.896% 7,000
275 2029 Fish and Wildlife - 10/31/2014 1/31/2029 15,000 15,000 0.674% 0.674% 15,000
276 2029 Fish and Wildlife - 4/30/2014 2/28/2029 7,000 7,000 0.697% 0.697% 7,000
277 2029 Fish and Wildlife - 8/31/2014 7/31/2029 5,000 5,000 0.674% 0.674% 5,000
278 2029 Bureau Direct - 6/30/2009 6/30/2039 25,000 25,000 5.192% 5.192% 25,000 2308.004
279 2029 Bonneville Dam Corps of Engineers 9/30/2003 9/30/2053 4,581 4,581 5.125% 5.125% 4,581
280 2029 Columbia River Fish Mitigation Corps of Engineers 9/30/2003 9/30/2053 68,440 68,440 5.125% 5.125% 68,440
281 2029 Detroit Lake/Big Cliff Corps of Engineers 9/30/2003 9/30/2053 223 223 5.125% 5.125% 223
282 2029 Dworshak Corps of Engineers 9/30/2003 9/30/2053 761 761 5.125% 5.125% 761
283 2029 Ice Harbor Corps of Engineers 9/30/2003 9/30/2053 50 50 5.125% 5.125% 50
284 2029 Little Goose Corps of Engineers 9/30/2003 9/30/2053 146 146 5.125% 5.125% 146
285 2029 Lookout Dam Corps of Engineers 9/30/2003 9/30/2053 135 135 5.125% 5.125% 135
286 2029 Lower Granite Corps of Engineers 9/30/2003 9/30/2053 42 42 5.125% 5.125% 42
287 2029 Lower Monument Corps of Engineers 9/30/2003 9/30/2053 22 22 5.125% 5.125% 22
288 2029 Lower Snake Fish and Wildlife Lower Snake Fish & Wildlife 9/30/2003 9/30/2053 98 98 5.125% 5.125% 98
289 2029 McNary Corps of Engineers 9/30/2003 9/30/2053 97 97 5.125% 5.125% 97
BP-18-FS-BPA-02A Page 235

TABLE 13D
Application of Amortization, SHIFT STUDY
October 1, 2015 - September 30, 2019 Cost Evaluation Period
($000s) (FY 2019)
A B C D E F G H I J K L M N O P
Fiscal Year Project Debt Type In Service
Bond Due
Date Initial Principal Current Principal Original Rate Effective Rate
Refinance
Type
Refinanced
Date
Rolled Maturity
Date Roll Rate Principal Paid Premium Discount
290 2029 Chief Joseph Corps of Engineers 9/30/2003 9/30/2053 992 992 5.125% 5.125% 992
291 2029 Bonneville Dam Corps of Engineers 9/30/2004 9/30/2054 26,741 26,741 5.375% 5.375% 26,741
292 2029 Columbia River Fish Mitigation Corps of Engineers 9/30/2004 9/30/2054 60,581 49,329 5.375% 5.375% 49,329
293 2029 Cougar Corps of Engineers 9/30/2004 9/30/2054 3,622 3,622 5.375% 5.375% 3,622
294 2029 Columbia River Fish Mitigation Corps of Engineers 9/30/2005 9/30/2055 52,039 52,039 5.125% 5.125% 25,691
295 2029 Hills Creek Corps of Engineers 9/30/2005 9/30/2055 46 46 5.125% 5.125% 46
296 2029 Hungry Horse Dam Bureau of Reclamation 9/30/2005 9/30/2055 2,951 2,951 5.125% 5.125% 2,951
297 2029 John Day Corps of Engineers 9/30/2005 9/30/2055 2,828 2,827 5.125% 5.125% 2,827
298 2029 Lookout Dam Corps of Engineers 9/30/2005 9/30/2055 7,355 7,355 5.125% 5.125% 7,355
299 2029 Lower Granite Corps of Engineers 9/30/2005 9/30/2055 393 393 5.125% 5.125% 393
300 2029 Lower Monument Corps of Engineers 9/30/2005 9/30/2055 527 527 5.125% 5.125% 527
301 2029 Lower Snake Fish and Wildlife Lower Snake Fish & Wildlife 9/30/2005 9/30/2055 4 4 5.125% 5.125% 4
302 2029 McNary Corps of Engineers 9/30/2005 9/30/2055 550 550 5.125% 5.125% 550
303 2029 The Dalles Corps of Engineers 9/30/2005 9/30/2055 36,019 36,019 5.125% 5.125% 36,019
304 2029 Yakima Chandler/Kenniwick Bureau of Reclamation 9/30/2005 9/30/2055 833 833 5.125% 5.125% 833
305 FY 2029 Subtotal: - - - 447,073 435,822 409,474 2308.004
306 2030 Bureau Direct - 6/30/2010 6/30/2020 10,000 10,000 3.243% 4.057% Global 44012 47664 4.057 10,000
307 2030 Bureau Direct - 6/30/2010 6/30/2020 30,000 30,000 3.243% 4.057% Global 44012 47664 4.057 30,000
308 2030 Bureau Direct - 11/20/2013 9/30/2020 51,000 51,000 2.473% 4.057% Global 44104 47756 4.057 51,000
309 2030 Fish and Wildlife - 11/30/2014 3/31/2030 8,000 8,000 0.947% 0.947% 8,000
310 2030 Corps - 5/31/2016 5/31/2030 15,000 15,000 2.599% 2.599% 15,000
311 2030 Bureau Direct - 7/31/2016 7/31/2030 12,000 12,000 2.145% 2.145% 12,000
312 2030 Bureau Direct - 7/31/2016 7/31/2030 25,000 25,000 2.145% 2.145% 25,000
313 2030 Bureau Direct - 1/31/2011 1/31/2039 35,000 35,000 5.040% 5.040% 35,000 2705.474
314 2030 Bureau Direct - 2/28/2011 2/28/2040 50,000 50,000 4.995% 4.995% 25,484 1820.641
315 2030 Albeni Falls Corps of Engineers 9/30/2005 9/30/2055 481 481 5.125% 5.125% 481
316 2030 Boise Bureau of Reclamation 9/30/2005 9/30/2055 903 903 5.125% 5.125% 903
317 2030 Bonneville Dam Corps of Engineers 9/30/2005 9/30/2055 19,725 19,725 5.125% 5.125% 19,725
318 2030 Columbia Basin Bureau of Reclamation 9/30/2005 9/30/2055 10,963 10,963 5.125% 5.125% 10,963
319 2030 Columbia River Fish Mitigation Corps of Engineers 9/30/2005 9/30/2055 52,039 26,348 5.125% 5.125% 26,348
320 2030 Cougar Corps of Engineers 9/30/2005 9/30/2055 8,130 8,130 5.125% 5.125% 8,130
321 2030 Detroit Lake/Big Cliff Corps of Engineers 9/30/2005 9/30/2055 1,031 1,031 5.125% 5.125% 1,031
322 2030 Dworshak Corps of Engineers 9/30/2005 9/30/2055 713 713 5.125% 5.125% 713
323 2030 Boise Bureau of Reclamation 9/30/2007 9/30/2057 76 76 5.000% 5.000% 76
324 2030 Bonneville Dam Corps of Engineers 9/30/2007 9/30/2057 1,124 1,124 5.000% 5.000% 1,124
325 2030 Columbia Basin Bureau of Reclamation 9/30/2007 9/30/2057 929 929 5.000% 5.000% 929
326 2030 Columbia River Fish Mitigation Corps of Engineers 9/30/2007 9/30/2057 53,525 53,525 5.000% 5.000% 53,525
327 2030 Cougar Corps of Engineers 9/30/2007 9/30/2057 120 120 5.000% 5.000% 120
328 2030 Hungry Horse Dam Bureau of Reclamation 9/30/2007 9/30/2057 294 294 5.000% 5.000% 294
329 2030 John Day Corps of Engineers 9/30/2007 9/30/2057 233 233 5.000% 5.000% 233
330 2030 Lookout Dam Corps of Engineers 9/30/2007 9/30/2057 572 572 5.000% 5.000% 572
331 2030 The Dalles Corps of Engineers 9/30/2007 9/30/2057 140 140 5.000% 5.000% 140
332 FY 2030 Subtotal: - - - 386,997 361,306 336,790 4526.115
333 2031 Fish and Wildlife - 2/29/2016 2/28/2031 4,000 4,000 0.697% 0.697% 4,000
334 2031 Fish and Wildlife - 10/31/2015 2/28/2031 4,000 4,000 0.697% 0.697% 4,000
335 2031 Fish and Wildlife - 10/31/2015 3/31/2031 5,000 5,000 0.947% 0.947% 5,000
336 2031 Corps - 4/30/2016 4/30/2031 53,000 53,000 2.661% 2.661% 53,000
337 2031 Bureau Direct - 4/30/2016 4/30/2031 17,000 17,000 2.661% 2.661% 17,000
338 2031 Bureau Direct - 6/22/2011 6/30/2036 30,000 30,000 4.629% 4.629% 30,000 1470.333
339 2031 Bureau Direct - 6/22/2011 6/30/2038 30,000 30,000 4.700% 4.700% 30,000 1698.58
340 2031 Bureau Direct - 2/28/2011 2/28/2040 50,000 24,516 4.995% 4.995% 24,516 1785.863
341 2031 Columbia River Fish Mitigation Corps of Engineers 9/30/2006 9/30/2056 366,395 366,395 4.500% 4.500% 191,054
342 2031 John Day Corps of Engineers 9/30/2006 9/30/2056 601 601 4.500% 4.500% 601
343 2031 Lower Monument Corps of Engineers 9/30/2006 9/30/2056 285 285 4.500% 4.500% 285
344 2031 Lower Snake Fish and Wildlife Lower Snake Fish & Wildlife 9/30/2006 9/30/2056 379 379 4.500% 4.500% 379
345 2031 The Dalles Corps of Engineers 9/30/2006 9/30/2056 2,030 2,030 4.500% 4.500% 2,030
346 2031 McNary Corps of Engineers 9/30/2006 9/30/2056 4,080 4,080 4.500% 4.500% 4,080
347 FY 2031 Subtotal: - - - 566,769 541,285 365,945 4954.776
348 2032 Bureau Direct - 9/30/2014 5/31/2032 16,000 16,000 0.713% 0.713% 16,000
BP-18-FS-BPA-02A Page 236

TABLE 13D
Application of Amortization, SHIFT STUDY
October 1, 2015 - September 30, 2019 Cost Evaluation Period
($000s) (FY 2019)
A B C D E F G H I J K L M N O P
Fiscal Year Project Debt Type In Service
Bond Due
Date Initial Principal Current Principal Original Rate Effective Rate
Refinance
Type
Refinanced
Date
Rolled Maturity
Date Roll Rate Principal Paid Premium Discount
349 2032 Bureau Direct - 9/30/2014 5/31/2032 10,000 10,000 0.713% 0.713% 10,000
350 2032 Bureau Direct - 7/31/2017 7/31/2032 13,000 13,000 2.180% 2.180% 13,000
351 2032 Corps - 7/31/2017 7/31/2032 54,000 26,796 2.180% 2.180% 26,796
352 2032 Bureau Direct - 8/31/2017 8/31/2032 13,000 13,000 2.180% 2.180% 13,000
353 2032 Corps - 8/31/2017 8/31/2032 54,000 26,796 2.180% 2.180% 26,796
354 2032 Bureau Direct - 9/30/2017 9/30/2032 14,000 14,000 2.180% 2.180% 14,000
355 2032 Corps - 9/30/2017 9/30/2032 55,000 27,796 2.180% 2.180% 27,796
356 2032 Fish and Wildlife - 9/30/2017 9/30/2032 40,000 40,000 2.180% 2.180% 40,000
357 2032 Boise Bureau of Reclamation 9/30/2006 9/30/2056 15 15 4.500% 4.500% 15
358 2032 Bonneville Dam Corps of Engineers 9/30/2006 9/30/2056 2,628 2,628 4.500% 4.500% 2,628
359 2032 Columbia Basin Bureau of Reclamation 9/30/2006 9/30/2056 1,987 1,987 4.500% 4.500% 1,987
360 2032 Columbia River Fish Mitigation Corps of Engineers 9/30/2006 9/30/2056 366,395 175,340 4.500% 4.500% 175,340
361 2032 Cougar Corps of Engineers 9/30/2006 9/30/2056 109 109 4.500% 4.500% 109
362 2032 Dworshak Corps of Engineers 9/30/2006 9/30/2056 73 73 4.500% 4.500% 73
363 2032 Boise Bureau of Reclamation 9/30/2009 9/30/2059 2 2 4.375% 4.375% 2
364 2032 Columbia River Fish Mitigation Corps of Engineers 9/30/2009 9/30/2059 103,203 103,203 4.375% 4.375% 103,203
365 2032 Cougar Corps of Engineers 9/30/2009 9/30/2059 121 121 4.375% 4.375% 121
366 2032 Dworshak Corps of Engineers 9/30/2009 9/30/2059 2,307 2,307 4.375% 4.375% 2,307
367 2032 Ice Harbor Corps of Engineers 9/30/2009 9/30/2059 2,615 2,615 4.375% 4.375% 2,615
368 2032 Little Goose Corps of Engineers 9/30/2009 9/30/2059 3,171 3,171 4.375% 4.375% 3,171
369 2032 Lower Granite Corps of Engineers 9/30/2009 9/30/2059 5,669 5,669 4.375% 4.375% 5,669
370 2032 Lower Monument Corps of Engineers 9/30/2009 9/30/2059 2,332 2,332 4.375% 4.375% 2,332
371 2032 Lower Snake Fish and Wildlife Lower Snake Fish & Wildlife 9/30/2009 9/30/2059 1,540 1,540 4.375% 4.375% 1,534
372 FY 2032 Subtotal: - - - 761,167 488,501 488,496
373 2033 Bureau Direct - 9/30/2014 6/30/2033 11,000 11,000 0.732% 0.732% 11,000
374 2033 Bureau Direct - 9/30/2014 6/30/2033 12,000 12,000 0.732% 0.732% 12,000
375 2033 Bureau Direct - 9/30/2014 7/31/2033 15,000 15,000 0.674% 0.674% 15,000
376 2033 Bureau Direct - 7/31/2018 7/31/2033 28,000 28,000 3.250% 3.250% 28,000
377 2033 Corps - 7/31/2018 7/31/2033 53,000 53,000 3.250% 3.250% 53,000
378 2033 Bureau Direct - 9/30/2015 9/30/2033 10,000 10,000 3.134% 3.134% 10,000
379 2033 Corps - 9/30/2015 9/30/2033 4,000 4,000 3.134% 3.134% 4,000
380 2033 Fish and Wildlife - 9/30/2018 9/30/2033 51,000 51,000 3.250% 3.250% 51,000
381 2033 Bureau Direct - 10/31/2010 10/31/2034 20,000 20,000 4.211% 4.211% 20,000 265
382 2033 Corps - 7/31/2019 7/31/2036 40,000 40,000 3.960% 3.960% 2,591
383 2033 Bureau Direct - 8/12/2011 8/31/2037 30,000 30,000 4.208% 4.208% 30,000 833
384 2033 Bureau Direct - 8/31/2019 8/31/2037 48,000 48,000 3.990% 3.990% 48,000
385 2033 Corps - 8/31/2019 8/31/2037 41,000 41,000 3.990% 3.990% 41,000
386 2033 Bureau Direct - 9/30/2019 9/30/2038 48,000 48,000 4.030% 4.030% 48,000
387 2033 Corps - 9/30/2019 9/30/2038 41,000 41,000 4.030% 4.030% 41,000
388 2033 Bonneville Dam Corps of Engineers 9/30/2009 9/30/2059 2,744 2,744 4.375% 4.375% 2,744
389 2033 Chief Joseph Corps of Engineers 9/30/2009 9/30/2059 24,727 24,727 4.375% 4.375% 24,727
390 2033 Lower Snake Fish and Wildlife Lower Snake Fish & Wildlife 9/30/2009 9/30/2059 1,540 5 4.375% 4.375% 5
391 2033 Little Goose Corps of Engineers 9/30/2010 9/30/2060 30 30 4.250% 4.250% 30
392 2033 Lower Granite Corps of Engineers 9/30/2010 9/30/2060 1,156 1,156 4.250% 4.250% 1,156
393 2033 Albeni Falls Corps of Engineers 9/30/2010 9/30/2060 42 42 4.250% 4.250% 42
394 2033 Bonneville Dam Corps of Engineers 9/30/2010 9/30/2060 1,425 1,425 4.250% 4.250% 1,425
395 2033 Columbia Basin Bureau of Reclamation 9/30/2010 9/30/2060 877 877 4.250% 4.250% 877
396 2033 Columbia River Fish Mitigation Corps of Engineers 9/30/2010 9/30/2060 56,832 56,832 4.250% 4.250% 56,832
397 2033 Cougar Corps of Engineers 9/30/2010 9/30/2060 59 59 4.250% 4.250% 59
398 2033 Hungry Horse Dam Bureau of Reclamation 9/30/2010 9/30/2060 779 779 4.250% 4.250% 779
399 2033 Ice Harbor Corps of Engineers 9/30/2010 9/30/2060 207 207 4.250% 4.250% 207
400 2033 John Day Corps of Engineers 9/30/2010 9/30/2060 356 356 4.250% 4.250% 356
401 2033 Libby Corps of Engineers 9/30/2010 9/30/2060 40 40 4.250% 4.250% 40
402 2033 Lower Snake Fish and Wildlife Lower Snake Fish & Wildlife 9/30/2010 9/30/2060 6 6 4.250% 4.250% 6
403 FY 2033 Subtotal: - - - 542,819 541,285 503,876 1,098
404 2034 Bureau Direct - 2/27/2012 2/28/2034 55,000 55,000 0.697% 0.697% 55,000
405 2034 Bureau Direct - 8/31/2018 8/31/2034 28,000 28,000 3.290% 3.290% 28,000
406 2034 Corps - 8/31/2018 8/31/2034 53,000 53,000 3.290% 3.290% 53,000
407 2034 Fish and Wildlife - 9/30/2019 9/30/2034 44,000 44,000 3.890% 3.890% 44,000
BP-18-FS-BPA-02A Page 237

TABLE 13D
Application of Amortization, SHIFT STUDY
October 1, 2015 - September 30, 2019 Cost Evaluation Period
($000s) (FY 2019)
A B C D E F G H I J K L M N O P
Fiscal Year Project Debt Type In Service
Bond Due
Date Initial Principal Current Principal Original Rate Effective Rate
Refinance
Type
Refinanced
Date
Rolled Maturity
Date Roll Rate Principal Paid Premium Discount
408 2034 Bureau Direct - 7/31/2019 7/31/2036 47,000 47,000 3.960% 3.960% 47,000
409 2034 Corps - 7/31/2019 7/31/2036 40,000 37,409 3.960% 3.960% 37,409
410 2034 Hungry Horse Dam Bureau of Reclamation 9/30/2011 9/30/2061 503 503 3.750% 3.750% 503
411 2034 Columbia Basin Bureau of Reclamation 9/30/2011 9/30/2061 1,723 1,723 3.750% 3.750% 1,723
412 2034 Columbia River Fish Mitigation Corps of Engineers 9/30/2011 9/30/2061 106,014 106,014 3.750% 3.750% 62,219
413 2034 Green Peter/Foster Corps of Engineers 9/30/2011 9/30/2061 87 87 3.750% 3.750% 87
414 2034 Hills Creek Corps of Engineers 9/30/2011 9/30/2061 12 12 3.750% 3.750% 12
415 2034 Ice Harbor Corps of Engineers 9/30/2011 9/30/2061 819 819 3.750% 3.750% 819
416 2034 John Day Corps of Engineers 9/30/2011 9/30/2061 175 175 3.750% 3.750% 175
417 2034 Libby Corps of Engineers 9/30/2011 9/30/2061 152 152 3.750% 3.750% 152
418 2034 Lookout Dam Corps of Engineers 9/30/2011 9/30/2061 17 17 3.750% 3.750% 17
419 2034 Lost Creek Corps of Engineers 9/30/2011 9/30/2061 7 7 3.750% 3.750% 7
420 2034 Lower Granite Corps of Engineers 9/30/2011 9/30/2061 8 8 3.750% 3.750% 8
421 2034 McNary Corps of Engineers 9/30/2011 9/30/2061 565 565 3.750% 3.750% 565
422 2034 Columbia Basin Bureau of Reclamation 9/30/2014 9/30/2064 18 18 3.875% 3.875% 18
423 2034 Cougar Corps of Engineers 9/30/2014 9/30/2064 12 12 3.875% 3.875% 12
424 2034 Hungry Horse Dam Bureau of Reclamation 9/30/2014 9/30/2064 12 12 3.875% 3.875% 12
425 2034 Bonneville Dam Corps of Engineers 9/30/2014 9/30/2064 3.875% 3.875%
426 2034 Columbia River Fish Mitigation Corps of Engineers 9/30/2014 9/30/2064 110,071 110,071 3.875% 3.875% 110,071
427 2034 Detroit Lake/Big Cliff Corps of Engineers 9/30/2014 9/30/2064 18 18 3.875% 3.875% 18
428 2034 Green Peter/Foster Corps of Engineers 9/30/2014 9/30/2064 385 385 3.875% 3.875% 385
429 2034 Lower Granite Corps of Engineers 9/30/2014 9/30/2064 2,644 2,644 3.875% 3.875% 2,644
430 2034 Lower Monument Corps of Engineers 9/30/2014 9/30/2064 1,430 1,430 3.875% 3.875% 1,430
431 2034 Lower Snake Fish and Wildlife Lower Snake Fish & Wildlife 9/30/2014 9/30/2064 222 222 3.875% 3.875% 222
432 2034 McNary Corps of Engineers 9/30/2014 9/30/2064 759 759 3.875% 3.875% 759
433 2034 Columbia River Fish Mitigation Corps of Engineers 9/30/2019 9/30/2069 63,746 63,746 3.870% 3.870% 63,746
434 FY 2034 Subtotal: - - - 556,399 553,807 510,012
435 2035 Bureau Direct - 9/30/2018 9/30/2035 29,000 29,000 3.330% 3.330% 29,000
436 2035 Corps - 9/30/2018 9/30/2035 53,000 53,000 3.330% 3.330% 53,000
437 2035 Bonneville Dam Corps of Engineers 9/30/2011 9/30/2061 10,962 10,962 3.750% 3.750% 10,962
438 2035 Chief Joseph Corps of Engineers 9/30/2011 9/30/2061 4 4 3.750% 3.750% 4
439 2035 Columbia River Fish Mitigation Corps of Engineers 9/30/2011 9/30/2061 106,014 43,795 3.750% 3.750% 43,795
440 2035 Cougar Corps of Engineers 9/30/2011 9/30/2061 282 282 3.750% 3.750% 282
441 2035 Lower Snake Fish and Wildlife Lower Snake Fish & Wildlife 9/30/2011 9/30/2061 122 122 3.750% 3.750% 122
442 2035 Cougar Corps of Engineers 9/30/2012 9/30/2062 139 139 3.375% 3.375% 139
443 2035 Hungry Horse Dam Bureau of Reclamation 9/30/2012 9/30/2062 3 3 3.375% 3.375% 3
444 2035 Minidoka/Palisades Bureau of Reclamation 9/30/2012 9/30/2062 7 7 3.375% 3.375% 7
445 2035 Green Peter/Foster Corps of Engineers 9/30/2012 9/30/2062 28 28 3.375% 3.375% 28
446 2035 Chief Joseph Corps of Engineers 9/30/2012 9/30/2062 28 28 3.375% 3.375% 28
447 2035 Columbia Basin Bureau of Reclamation 9/30/2012 9/30/2062 11 11 3.375% 3.375% 11
448 2035 Columbia River Fish Mitigation Corps of Engineers 9/30/2012 9/30/2062 101,616 101,616 3.375% 3.375% 101,616
449 2035 Hills Creek Corps of Engineers 9/30/2012 9/30/2062 142 142 3.375% 3.375% 142
450 2035 Ice Harbor Corps of Engineers 9/30/2012 9/30/2062 115 115 3.375% 3.375% 115
451 2035 John Day Corps of Engineers 9/30/2012 9/30/2062 6,161 6,161 3.375% 3.375% 6,161
452 2035 Libby Corps of Engineers 9/30/2012 9/30/2062 16 16 3.375% 3.375% 16
453 2035 Lookout Dam Corps of Engineers 9/30/2012 9/30/2062 294 294 3.375% 3.375% 294
454 2035 Lower Monument Corps of Engineers 9/30/2012 9/30/2062 89 89 3.375% 3.375% 89
455 2035 McNary Corps of Engineers 9/30/2012 9/30/2062 12 11 3.375% 3.375% 11
456 2035 RRP - Green Springs Bureau of Reclamation 9/30/2012 9/30/2062 2 2 3.375% 3.375% 2
457 2035 Columbia Basin Bureau of Reclamation 9/30/2013 9/30/2063 3,083 3,083 2.875% 2.875% 911
458 2035 RRP - Green Springs Bureau of Reclamation 9/30/2013 9/30/2063 1 1 2.875% 2.875% 1
459 2035 Bonneville Dam Corps of Engineers 9/30/2015 9/30/2065 102 102 3.250% 3.250% 102
460 2035 Columbia River Fish Mitigation Corps of Engineers 9/30/2015 9/30/2065 64,291 64,291 3.250% 3.250% 64,291
461 2035 Green Peter/Foster Corps of Engineers 9/30/2015 9/30/2065 68 68 3.250% 3.250% 68
462 2035 Hungry Horse Dam Bureau of Reclamation 9/30/2015 9/30/2065 3.250% 3.250%
463 2035 Ice Harbor Corps of Engineers 9/30/2015 9/30/2065 3,175 3,175 3.250% 3.250% 3,175
464 2035 John Day Corps of Engineers 9/30/2015 9/30/2065 163 163 3.250% 3.250% 163
465 2035 Lower Granite Corps of Engineers 9/30/2015 9/30/2065 1,597 1,597 3.250% 3.250% 1,597
466 2035 Minidoka/Palisades Bureau of Reclamation 9/30/2015 9/30/2065 19,237 19,237 3.250% 3.250% 19,237
BP-18-FS-BPA-02A Page 238
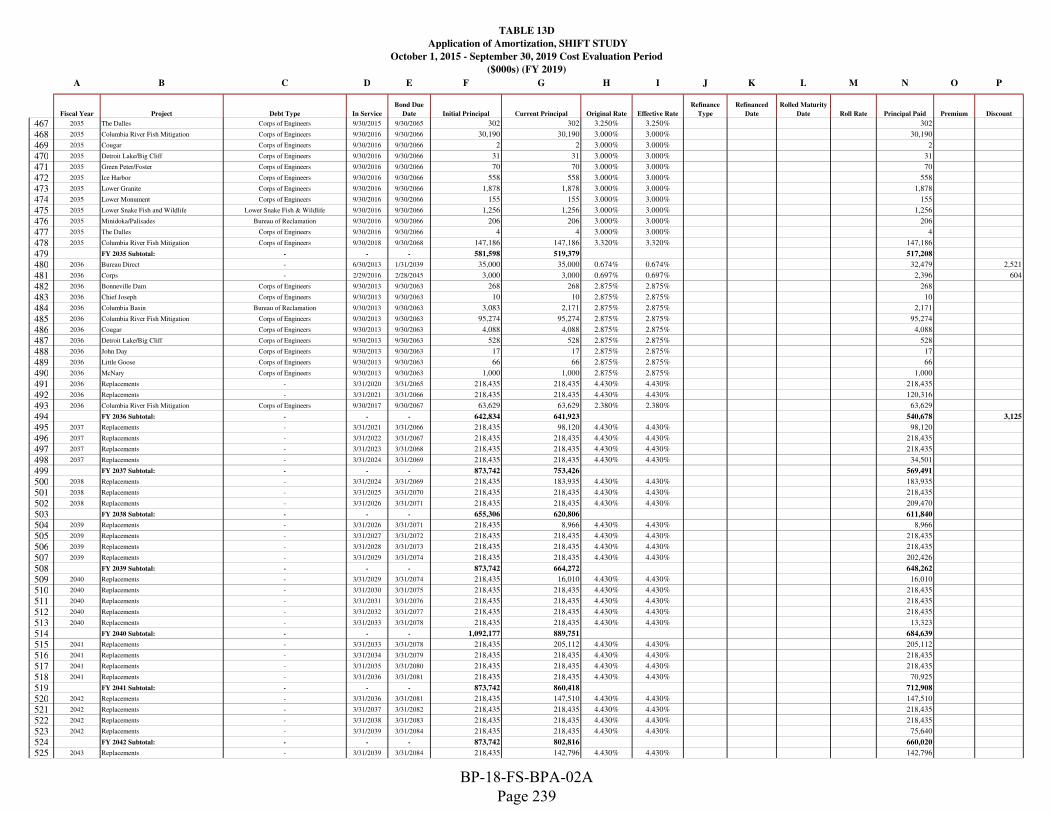
TABLE 13D
Application of Amortization, SHIFT STUDY
October 1, 2015 - September 30, 2019 Cost Evaluation Period
($000s) (FY 2019)
A B C D E F G H I J K L M N O P
Fiscal Year Project Debt Type In Service
Bond Due
Date Initial Principal Current Principal Original Rate Effective Rate
Refinance
Type
Refinanced
Date
Rolled Maturity
Date Roll Rate Principal Paid Premium Discount
467 2035 The Dalles Corps of Engineers 9/30/2015 9/30/2065 302 302 3.250% 3.250% 302
468 2035 Columbia River Fish Mitigation Corps of Engineers 9/30/2016 9/30/2066 30,190 30,190 3.000% 3.000% 30,190
469 2035 Cougar Corps of Engineers 9/30/2016 9/30/2066 2 2 3.000% 3.000% 2
470 2035 Detroit Lake/Big Cliff Corps of Engineers 9/30/2016 9/30/2066 31 31 3.000% 3.000% 31
471 2035 Green Peter/Foster Corps of Engineers 9/30/2016 9/30/2066 70 70 3.000% 3.000% 70
472 2035 Ice Harbor Corps of Engineers 9/30/2016 9/30/2066 558 558 3.000% 3.000% 558
473 2035 Lower Granite Corps of Engineers 9/30/2016 9/30/2066 1,878 1,878 3.000% 3.000% 1,878
474 2035 Lower Monument Corps of Engineers 9/30/2016 9/30/2066 155 155 3.000% 3.000% 155
475 2035 Lower Snake Fish and Wildlife Lower Snake Fish & Wildlife 9/30/2016 9/30/2066 1,256 1,256 3.000% 3.000% 1,256
476 2035 Minidoka/Palisades Bureau of Reclamation 9/30/2016 9/30/2066 206 206 3.000% 3.000% 206
477 2035 The Dalles Corps of Engineers 9/30/2016 9/30/2066 4 4 3.000% 3.000% 4
478 2035 Columbia River Fish Mitigation Corps of Engineers 9/30/2018 9/30/2068 147,186 147,186 3.320% 3.320% 147,186
479 FY 2035 Subtotal: - - - 581,598 519,379 517,208
480 2036 Bureau Direct - 6/30/2013 1/31/2039 35,000 35,000 0.674% 0.674% 32,479 2,521
481 2036 Corps - 2/29/2016 2/28/2045 3,000 3,000 0.697% 0.697% 2,396 604
482 2036 Bonneville Dam Corps of Engineers 9/30/2013 9/30/2063 268 268 2.875% 2.875% 268
483 2036 Chief Joseph Corps of Engineers 9/30/2013 9/30/2063 10 10 2.875% 2.875% 10
484 2036 Columbia Basin Bureau of Reclamation 9/30/2013 9/30/2063 3,083 2,171 2.875% 2.875% 2,171
485 2036 Columbia River Fish Mitigation Corps of Engineers 9/30/2013 9/30/2063 95,274 95,274 2.875% 2.875% 95,274
486 2036 Cougar Corps of Engineers 9/30/2013 9/30/2063 4,088 4,088 2.875% 2.875% 4,088
487 2036 Detroit Lake/Big Cliff Corps of Engineers 9/30/2013 9/30/2063 528 528 2.875% 2.875% 528
488 2036 John Day Corps of Engineers 9/30/2013 9/30/2063 17 17 2.875% 2.875% 17
489 2036 Little Goose Corps of Engineers 9/30/2013 9/30/2063 66 66 2.875% 2.875% 66
490 2036 McNary Corps of Engineers 9/30/2013 9/30/2063 1,000 1,000 2.875% 2.875% 1,000
491 2036 Replacements - 3/31/2020 3/31/2065 218,435 218,435 4.430% 4.430% 218,435
492 2036 Replacements - 3/31/2021 3/31/2066 218,435 218,435 4.430% 4.430% 120,316
493 2036 Columbia River Fish Mitigation Corps of Engineers 9/30/2017 9/30/2067 63,629 63,629 2.380% 2.380% 63,629
494 FY 2036 Subtotal: - - - 642,834 641,923 540,678 3,125
495 2037 Replacements - 3/31/2021 3/31/2066 218,435 98,120 4.430% 4.430% 98,120
496 2037 Replacements - 3/31/2022 3/31/2067 218,435 218,435 4.430% 4.430% 218,435
497 2037 Replacements - 3/31/2023 3/31/2068 218,435 218,435 4.430% 4.430% 218,435
498 2037 Replacements - 3/31/2024 3/31/2069 218,435 218,435 4.430% 4.430% 34,501
499 FY 2037 Subtotal: - - - 873,742 753,426 569,491
500 2038 Replacements - 3/31/2024 3/31/2069 218,435 183,935 4.430% 4.430% 183,935
501 2038 Replacements - 3/31/2025 3/31/2070 218,435 218,435 4.430% 4.430% 218,435
502 2038 Replacements - 3/31/2026 3/31/2071 218,435 218,435 4.430% 4.430% 209,470
503 FY 2038 Subtotal: - - - 655,306 620,806 611,840
504 2039 Replacements - 3/31/2026 3/31/2071 218,435 8,966 4.430% 4.430% 8,966
505 2039 Replacements - 3/31/2027 3/31/2072 218,435 218,435 4.430% 4.430% 218,435
506 2039 Replacements - 3/31/2028 3/31/2073 218,435 218,435 4.430% 4.430% 218,435
507 2039 Replacements - 3/31/2029 3/31/2074 218,435 218,435 4.430% 4.430% 202,426
508 FY 2039 Subtotal: - - - 873,742 664,272 648,262
509 2040 Replacements - 3/31/2029 3/31/2074 218,435 16,010 4.430% 4.430% 16,010
510 2040 Replacements - 3/31/2030 3/31/2075 218,435 218,435 4.430% 4.430% 218,435
511 2040 Replacements - 3/31/2031 3/31/2076 218,435 218,435 4.430% 4.430% 218,435
512 2040 Replacements - 3/31/2032 3/31/2077 218,435 218,435 4.430% 4.430% 218,435
513 2040 Replacements - 3/31/2033 3/31/2078 218,435 218,435 4.430% 4.430% 13,323
514 FY 2040 Subtotal: - - - 1,092,177 889,751 684,639
515 2041 Replacements - 3/31/2033 3/31/2078 218,435 205,112 4.430% 4.430% 205,112
516 2041 Replacements - 3/31/2034 3/31/2079 218,435 218,435 4.430% 4.430% 218,435
517 2041 Replacements - 3/31/2035 3/31/2080 218,435 218,435 4.430% 4.430% 218,435
518 2041 Replacements - 3/31/2036 3/31/2081 218,435 218,435 4.430% 4.430% 70,925
519 FY 2041 Subtotal: - - - 873,742 860,418 712,908
520 2042 Replacements - 3/31/2036 3/31/2081 218,435 147,510 4.430% 4.430% 147,510
521 2042 Replacements - 3/31/2037 3/31/2082 218,435 218,435 4.430% 4.430% 218,435
522 2042 Replacements - 3/31/2038 3/31/2083 218,435 218,435 4.430% 4.430% 218,435
523 2042 Replacements - 3/31/2039 3/31/2084 218,435 218,435 4.430% 4.430% 75,640
524 FY 2042 Subtotal: - - - 873,742 802,816 660,020
525 2043 Replacements - 3/31/2039 3/31/2084 218,435 142,796 4.430% 4.430% 142,796
BP-18-FS-BPA-02A Page 239

TABLE 13D
Application of Amortization, SHIFT STUDY
October 1, 2015 - September 30, 2019 Cost Evaluation Period
($000s) (FY 2019)
A B C D E F G H I J K L M N O P
Fiscal Year Project Debt Type In Service
Bond Due
Date Initial Principal Current Principal Original Rate Effective Rate
Refinance
Type
Refinanced
Date
Rolled Maturity
Date Roll Rate Principal Paid Premium Discount
526 2043 Replacements - 3/31/2040 3/31/2085 218,435 218,435 4.430% 4.430% 218,435
527 2043 Replacements - 3/31/2041 3/31/2086 218,435 218,435 4.430% 4.430% 218,435
528 2043 Replacements - 3/31/2042 3/31/2087 218,435 218,435 4.430% 4.430% 175,722
529 FY 2043 Subtotal: - - - 873,742 798,102 755,389
530 2044 Replacements - 3/31/2042 3/31/2087 218,435 42,713 4.430% 4.430% 42,713
531 2044 Replacements - 3/31/2043 3/31/2088 218,435 218,435 4.430% 4.430% 218,435
532 FY 2044 Subtotal: - - - 436,871 261,149 261,149
533 2045 Replacements - 3/31/2044 3/31/2089 218,435 218,435 4.430% 4.430% 218,435
534 FY 2045 Subtotal: - - - 218,435 218,435 218,435
535 2046 Replacements - 3/31/2045 3/31/2090 218,435 218,435 4.430% 4.430% 218,435
536 FY 2046 Subtotal: - - - 218,435 218,435 218,435
537 2047 Replacements - 3/31/2046 3/31/2091 218,435 218,435 4.430% 4.430% 218,435
538 FY 2047 Subtotal: - - - 218,435 218,435 218,435
539 2048 Replacements - 3/31/2047 3/31/2092 218,435 218,435 4.430% 4.430% 218,435
540 FY 2048 Subtotal: - - - 218,435 218,435 218,435
541 2049 Replacements - 3/31/2048 3/31/2093 218,435 218,435 4.430% 4.430% 218,435
542 FY 2049 Subtotal: - - - 218,435 218,435 218,435
543 2050 Replacements - 3/31/2049 3/31/2094 218,435 218,435 4.430% 4.430% 218,435
544 FY 2050 Subtotal: - - - 218,435 218,435 218,435
545 2051 Replacements - 3/31/2050 3/31/2095 218,435 218,435 4.430% 4.430% 218,435
546 FY 2051 Subtotal: - - - 218,435 218,435 218,435
547 2052 Replacements - 3/31/2051 3/31/2096 218,435 218,435 4.430% 4.430% 218,435
548 FY 2052 Subtotal: - - - 218,435 218,435 218,435
549 2053 Replacements - 3/31/2052 3/31/2097 218,435 218,435 4.430% 4.430% 218,435
550 FY 2053 Subtotal: - - - 218,435 218,435 218,435
551 2054 Replacements - 3/31/2053 3/31/2098 218,435 218,435 4.430% 4.430% 218,435
552 FY 2054 Subtotal: - - - 218,435 218,435 218,435
553 2055 Replacements - 3/31/2054 3/31/2099 218,435 218,435 4.430% 4.430% 218,435
554 FY 2055 Subtotal: - - - 218,435 218,435 218,435
555 2056 Replacements - 3/31/2055 3/31/2100 218,435 218,435 4.430% 4.430% 218,435
556 FY 2056 Subtotal: - - - 218,435 218,435 218,435
557 2057 Replacements - 3/31/2056 3/31/2101 218,435 218,435 4.430% 4.430% 218,435
558 FY 2057 Subtotal: - - - 218,435 218,435 218,435
559 2058 Boise Bureau of Reclamation 9/30/2008 9/30/2058 64 64 4.875% 4.875% 64
560 2058 Bonneville Dam Corps of Engineers 9/30/2008 9/30/2058 14,609 14,609 4.875% 4.875% 14,609
561 2058 Columbia River Fish Mitigation Corps of Engineers 9/30/2008 9/30/2058 36,554 36,554 4.875% 4.875% 36,554
562 2058 Dworshak Corps of Engineers 9/30/2008 9/30/2058 10 10 4.875% 4.875% 10
563 2058 Hungry Horse Dam Bureau of Reclamation 9/30/2008 9/30/2058 76 76 4.875% 4.875% 76
564 2058 Ice Harbor Corps of Engineers 9/30/2008 9/30/2058 14 14 4.875% 4.875% 14
565 2058 Libby Corps of Engineers 9/30/2008 9/30/2058 1,567 1,567 4.875% 4.875% 1,567
566 2058 Little Goose Corps of Engineers 9/30/2008 9/30/2058 13 13 4.875% 4.875% 13
567 2058 Lower Granite Corps of Engineers 9/30/2008 9/30/2058 24 24 4.875% 4.875% 24
568 2058 Lower Monument Corps of Engineers 9/30/2008 9/30/2058 9 9 4.875% 4.875% 9
569 2058 Lower Snake Fish and Wildlife Lower Snake Fish & Wildlife 9/30/2008 9/30/2058 74 74 4.875% 4.875% 74
570 2058 McNary Corps of Engineers 9/30/2008 9/30/2058 215 215 4.875% 4.875% 215
571 2058 The Dalles Corps of Engineers 9/30/2008 9/30/2058 1,651 1,651 4.875% 4.875% 1,651
572 2058 Chief Joseph Corps of Engineers 9/30/2008 9/30/2058 3,500 3,500 4.875% 4.875% 3,500
573 2058 Columbia Basin Bureau of Reclamation 9/30/2008 9/30/2058 835 835 4.875% 4.875% 835
574 2058 Replacements - 3/31/2057 3/31/2102 218,435 218,435 4.430% 4.430% 218,435
575 FY 2058 Subtotal: - - - 277,651 277,651 277,651
576 2059 Albeni Falls Corps of Engineers 9/30/2009 9/30/2059 57 57 4.375% 4.375% 57
577 2059 Columbia Basin Bureau of Reclamation 9/30/2009 9/30/2059 1,338 1,338 4.375% 4.375% 1,338
578 2059 Hungry Horse Dam Bureau of Reclamation 9/30/2009 9/30/2059 60 60 4.375% 4.375% 60
579 2059 John Day Corps of Engineers 9/30/2009 9/30/2059 1,548 1,548 4.375% 4.375% 1,548
580 2059 Yakima Chandler/Kenniwick Bureau of Reclamation 9/30/2009 9/30/2059 15 15 4.375% 4.375% 15
581 2059 Replacements - 3/31/2058 3/31/2103 218,435 218,435 4.430% 4.430% 218,435
582 FY 2059 Subtotal: - - - 221,454 221,454 221,454
BP-18-FS-BPA-02A Page 240

TABLE 13D
Application of Amortization, SHIFT STUDY
October 1, 2015 - September 30, 2019 Cost Evaluation Period
($000s) (FY 2019)
A B C D E F G H I J K L M N O P
Fiscal Year Project Debt Type In Service
Bond Due
Date Initial Principal Current Principal Original Rate Effective Rate
Refinance
Type
Refinanced
Date
Rolled Maturity
Date Roll Rate Principal Paid Premium Discount
583 2060 Replacements - 3/31/2059 3/31/2104 218,435 218,435 4.430% 4.430% 218,435
584 FY 2060 Subtotal: - - - 218,435 218,435 218,435
585 2061 Replacements - 3/31/2060 3/31/2105 218,435 218,435 4.430% 4.430% 218,435
586 FY 2061 Subtotal: - - - 218,435 218,435 218,435
587 2062 Replacements - 3/31/2061 3/31/2106 218,435 218,435 4.430% 4.430% 218,435
588 FY 2062 Subtotal: - - - 218,435 218,435 218,435
589 2063 Replacements - 3/31/2062 3/31/2107 218,435 218,435 4.430% 4.430% 218,435
590 FY 2063 Subtotal: - - - 218,435 218,435 218,435
591 2064 Replacements - 3/31/2063 3/31/2108 218,435 218,435 4.430% 4.430% 218,435
592 FY 2064 Subtotal: - - - 218,435 218,435 218,435
593 2065 Replacements - 3/31/2064 3/31/2109 218,435 218,435 4.430% 4.430% 218,435
594 FY 2065 Subtotal: - - - 218,435 218,435 218,435
595 2066 Replacements - 3/31/2065 3/31/2110 218,435 218,435 4.430% 4.430% 218,435
596 FY 2066 Subtotal: - - - 218,435 218,435 218,435
597 2067 Replacements - 3/31/2066 3/31/2111 218,435 218,435 4.430% 4.430% 218,435
598 FY 2067 Subtotal: - - - 218,435 218,435 218,435
599 2068 Replacements - 3/31/2067 3/31/2112 218,435 218,435 4.430% 4.430% 218,435
600 FY 2068 Subtotal: - - - 218,435 218,435 218,435
601 2069 Replacements - 3/31/2068 3/31/2113 218,435 218,435 4.430% 4.430% 218,435
602 FY 2069 Subtotal: - - - 218,435 218,435 218,435
603 Grand Total 19,044,233 17,485,744 16,023,912 12,887 3,125
BP-18-FS-BPA-02A Page 241

TABLE 13E:
Summary of Interest, Shift Study
October 1, 2015 - September 30, 2019 Cost Evaluation Period
($000s) (FY 2019)
Obligation Type General Project Specific Project 2017 2018 2019 2020 2021 2022 2023 2024 2025 2026 2027 2028 2029 2030 2031 2032 2033
Boise 295 54 54 54 54 54 54 54 54 54 54 54 54 54 4 4 3
Columbia Basin 5,551 5,055 5,055 4,219 3,835 3,709 1,494 1,494 1,207 988 988 988 988 988 380 380 291
Columbia Basin 3rd Powerhouse 903 - - - - - - - - - - - - - - - -
Hungry Horse Dam 709 257 225 225 225 225 225 225 225 225 225 225 225 74 59 59 59
Minidoka/Palisades 4,274 634 632 632 632 632 632 632 632 632 632 632 632 632 632 632 632
RRP - Green Springs 655 655
Yakima Chandler/Kenniwick 43 43 43 43 43 43 43 43 43 43 43 43 43 1 1 1 1
Yakima Roza 1 1 - - - - - - - - - - - - - - -
Bureau of Reclamation Subtotal: 12,431 6,700 6,009 5,173 4,789 4,663 2,448 2,448 2,161 1,942 1,942 1,942 1,942 1,748 1,075 1,075 985
Albeni Falls 208 29 29 29 29 29 29 29 29 29 29 29 29 29 4 4 4
Bonneville 2nd Powerhouse 2,738 - - - - - - - - - - - - - - - -
Bonneville Dam 7,164 6,884 5,387 5,387 5,387 5,387 5,387 5,387 5,387 5,213 5,213 4,172 4,172 2,500 1,433 1,433 1,315
Chief Joseph 1,895 1,325 1,325 1,325 1,325 1,325 1,325 1,325 1,325 1,305 1,305 1,305 1,305 1,254 1,254 1,254 1,254
Columbia River Fish Mitigation 62,178 59,849 62,523 64,822 64,822 64,822 64,822 64,822 64,822 64,338 64,338 63,224 62,975 55,499 51,473 42,875 30,470
Cougar 765 763 763 763 763 763 763 763 763 763 763 763 763 569 146 146 136
Detroit Lake/Big Cliff 101 99 99 82 82 82 82 82 82 81 81 81 81 70 17 17 17
Dworshak 854 225 225 225 225 225 225 225 225 214 214 180 180 141 105 105
Green Peter/Foster 37 35 23 23 23 23 23 23 23 23 23 23 23 23 23 23 23
Hills Creek 171 8 8 8 8 8 8 8 8 8 8 8 8 5 5 5 5
Ice Harbor 921 857 812 812 812 812 812 812 812 561 508 281 281 278 278 278 164
John Day 1,653 864 827 827 827 827 827 827 827 639 639 487 487 342 330 303 303
Libby 1,515 411 84 84 84 84 84 84 84 84 84 84 84 84 84 84 84
Little Goose 862 426 155 155 155 155 155 155 155 154 154 150 150 143 143 143 4
Lookout Dam 740 423 423 423 423 423 423 423 423 423 423 423 423 39 11 11 11
Lost Creek 17 9
Lower Granite 860 767 648 648 648 648 648 648 648 532 532 532 532 509 509 509 261
Lower Monument 741 586 392 392 392 392 392 392 392 391 391 207 207 178 178 166 64
McNary 744 698 637 637 637 637 637 637 637 637 637 307 307 274 274 90 90
The Dalles 2,413 2,112 2,112 2,112 2,112 2,112 2,112 2,112 2,112 2,044 2,044 2,035 2,035 189 182 90 90
Corps of Engineers Subtotal: 86,580 76,370 76,472 78,755 78,755 78,755 78,755 78,755 78,755 77,440 77,387 74,290 74,042 62,127 56,450 47,537 34,296
Lower Snake Fish and Wildlife 16,572 225 206 206 206 206 206 206 206 157 157 144 144 139 139 122 55
Lower Snake Fish & Wildlife Subtotal: 16,572 225 206 206 206 206 206 206 206 157 157 144 144 139 139 122 55
115,582 83,295 82,688 84,134 83,750 83,624 81,409 81,409 81,122 79,539 79,486 76,377 76,128 64,015 57,664 48,735 35,336
(Less Interest Income) (632) (611) (1,144) (975) (1,006) (898) (977) (951) (847) (928) (889) (784) (1,861) (1,585) (1,690) (2,030) (2,048)
Bureau Direct 29,897 30,768 33,493 36,480 33,936 31,396 31,182 30,615 30,615 30,615 30,615 30,615 29,056 23,331 15,319 12,859 9,246
Interest Accrual 5,735 5,963 5,310 4,287 4,122 4,122 3,667 3,667 3,667 3,667 3,667 3,667 3,342 2,407 1,416 1,283 456
Interest Accrual Reversal (5,664) (5,735) (5,963) (5,310) (4,287) (4,122) (4,122) (3,667) (3,667) (3,667) (3,667) (3,667) (3,667) (3,342) (2,407) (1,416) (1,283)
Conservation 9,405 9,407 9,252 9,252 9,252 8,774 7,654 2,837 2,095 937 211 92 - - - - -
Interest Accrual 2,109 2,058 2,058 2,058 1,978 1,920 973 713 609 76 76 - - - - - -
Interest Accrual Reversal (2,074) (2,109) (2,058) (2,058) (2,058) (1,978) (1,920) (973) (713) (609) (76) (76) - - - - -
Construction (AS) 710 678 736 751 545 423 385 338 195 - - - - - - - -
Interest Accrual 179 172 152 58 24 - - - - - - - - - - - -
Interest Accrual Reversal (184) (179) (172) (152) (58) (24) - - - - - - - - - - -
Corps 1,946 3,719 8,945 13,813 13,813 13,813 13,813 13,813 13,813 13,813 13,813 13,813 13,813 13,813 13,423 12,013 8,545
Interest Accrual 863 1,295 1,695 1,695 1,695 1,695 1,695 1,695 1,695 1,695 1,695 1,695 1,695 1,564 979 833 394
Interest Accrual Reversal (718) (863) (1,295) (1,695) (1,695) (1,695) (1,695) (1,695) (1,695) (1,695) (1,695) (1,695) (1,695) (1,695) (1,564) (979) (833)
Fish and Wildlife 10,958 11,830 12,958 13,613 13,613 13,613 12,644 12,658 11,699 10,259 7,670 6,605 5,091 4,382 4,293 4,241 3,369
Interest Accrual 1,998 1,998 1,688 1,688 1,688 1,688 1,688 1,445 1,445 865 430 430 5 5 - - -
Interest Accrual Reversal (1,998) (1,998) (1,998) (1,688) (1,688) (1,688) (1,688) (1,688) (1,445) (1,445) (865) (430) (430) (5) (5) - -
Technology (G) 555 667 789 947 690 432 280 79 - - - - - - - - -
Interest Accrual 92 92 92 92 7 - - - - - - - - - - - -
Interest Accrual Reversal (92) (92) (92) (92) (92) (7) - - - - - - - - - - -
BPA Borrowing Subtotal: 53,085 57,058 64,449 72,764 70,481 67,464 63,580 58,885 57,466 53,583 50,986 50,265 45,348 38,875 29,764 26,803 17,845
Replacements - - - 4,838 14,515 24,192 33,868 43,545 53,222 62,898 72,575 82,252 91,929 101,605 111,282 120,959 130,635
Federal Generation Replacements Subtotal: - - - 4,838 14,515 24,192 33,868 43,545 53,222 62,898 72,575 82,252 91,929 101,605 111,282 120,959 130,635
53,085 57,058 64,449 77,603 84,996 91,656 97,448 102,430 110,688 116,482 123,561 132,516 137,277 140,480 141,046 147,762 148,481
$168,667 $140,353 $147,136 $161,736 $168,745 $175,279 $178,857 $183,839 $191,810 $196,021 $203,047 $208,893 $213,405 $204,495 $198,710 $196,497 $183,817
Appropriation
Bureau of Reclamation
Corps of Engineers
Lower Snake Fish & Wildlife
Appropriation Subtotal:
Treasury
BPA Borrowing
Federal Generation Replacements
Treasury Subtotal:
Grand Total:
BP-18-FS-BPA-02A Page 242

TABLE 13E:
Summary of Interest, Shift Study
October 1, 2015 - September 30, 2019 Cost Evaluation Period
($000s) (FY 2019)
Obligation Type General Project Specific Project
Boise
Columbia Basin
Columbia Basin 3rd Powerhouse
Hungry Horse Dam
Minidoka/Palisades
RRP - Green Springs
Yakima Chandler/Kenniwick
Yakima Roza
Bureau of Reclamation Subtotal:
Albeni Falls
Bonneville 2nd Powerhouse
Bonneville Dam
Chief Joseph
Columbia River Fish Mitigation
Cougar
Detroit Lake/Big Cliff
Dworshak
Green Peter/Foster
Hills Creek
Ice Harbor
John Day
Libby
Little Goose
Lookout Dam
Lost Creek
Lower Granite
Lower Monument
McNary
The Dalles
Corps of Engineers Subtotal:
Lower Snake Fish and Wildlife
Lower Snake Fish & Wildlife Subtotal:
(Less Interest Income)
Bureau Direct
Interest Accrual
Interest Accrual Reversal
Conservation
Interest Accrual
Interest Accrual Reversal
Construction (AS)
Interest Accrual
Interest Accrual Reversal
Corps
Interest Accrual
Interest Accrual Reversal
Fish and Wildlife
Interest Accrual
Interest Accrual Reversal
Technology (G)
Interest Accrual
Interest Accrual Reversal
BPA Borrowing Subtotal:
Replacements
Federal Generation Replacements Subtotal:
Appropriation
Bureau of Reclamation
Corps of Engineers
Lower Snake Fish & Wildlife
Appropriation Subtotal:
Treasury
BPA Borrowing
Federal Generation Replacements
Treasury Subtotal:
Grand Total:
2034 2035 2036 2037 2038 2039 2040 2041 2042 2043 2044 2045 2046 2047 2048 2049 2050 2051
3 3 3 3 3 3 3 3 3 3 3 3 3 3 3 3 3 3
254 188 162 99 99 99 99 99 99 99 99 99 99 99 99 99 99 99
- - - - - - - - - - - - - - - - - -
26 6 6 6 6 6 6 6 6 6 6 6 6 6 6 6 6 6
632 632 - - - - - - - - - - - - - - - -
- - - - - - - - - - - - - - - -
1 1 1 1 1 1 1 1 1 1 1 1 1 1 1 1 1 1
- - - - - - - - - - - - - - - - - -
915 830 172 109 109 109 109 109 109 109 109 109 109 109 109 109 109 109
2 2 2 2 2 2 2 2 2 2 2 2 2 2 2 2 2 2
- - - - - - - - - - - - - - - - - -
1,134 1,134 720 712 712 712 712 712 712 712 712 712 712 712 712 712 712 712
172 172 171 171 171 171 171 171 171 171 171 171 171 171 171 171 171 171
28,055 18,989 6,036 1,782 1,782 1,782 1,782 1,782 1,782 1,782 1,782 1,782 1,782 1,782 1,782 1,782 1,782 1,782
133 133 118 - - - - - - - - - - - - - - -
17 16 15 - - - - - - - - - - - - - - -
23 5 - - - - - - - - - - - - - - - -
5 5 - - - - - - - - - - - - - - - -
155 124 1 1 1 1 1 1 1 1 1 1 1 1 1 1 1 1
288 281 68 68 68 68 68 68 68 68 68 68 68 68 68 68 68 68
83 77 76 76 76 76 76 76 76 76 76 76 76 76 76 76 76 76
3 3 3 1 1 1 1 1 1 1 1 1 1 1 1 1 1 1
11 10 - - - - - - - - - - - - - - - -
- - - - - - - - - - - - - - - - -
212 109 1 1 1 1 1 1 1 1 1 1 1 1 1 1 1 1
64 8
90 40 39 10 10 10 10 10 10 10 10 10 10 10 10 10 10 10
90 90 80 80 80 80 80 80 80 80 80 80 80 80 80 80 80 80
30,538 21,200 7,331 2,906 2,906 2,906 2,906 2,906 2,906 2,906 2,906 2,906 2,906 2,906 2,906 2,906 2,906 2,906
54 46 4 4 4 4 4 4 4 4 4 4 4 4 4 4 4 4
54 46 4 4 4 4 4 4 4 4 4 4 4 4 4 4 4 4
31,507 22,076 7,507 3,019 3,019 3,019 3,019 3,019 3,019 3,019 3,019 3,019 3,019 3,019 3,019 3,019 3,019 3,019
(2,038) (2,068) (2,154) (2,165) (2,224) (2,360) (2,399) (2,456) (2,492) (2,525) (2,172) (1,008) (1,008) (1,008) (1,008) (1,008) (1,008) (1,008)
3,241 1,202 118 - - - - - - - - - - - - - - -
39 39 - - - - - - - - - - - - - - - -
(456) (39) (39) - - - - - - - - - - - - - - -
- - - - - - - - - - - - - - - - - -
- - - - - - - - - - - - - - - - - -
- - - - - - - - - - - - - - - - - -
- - - - - - - - - - - - - - - - - -
- - - - - - - - - - - - - - - - - -
- - - - - - - - - - - - - - - - - -
4,265 1,786 10 - - - - - - - - - - - - - - -
2 2 - - - - - - - - - - - - - - - -
(394) (2) (2) - - - - - - - - - - - - - - -
1,712 - - - - - - - - - - - - - - - - -
- - - - - - - - - - - - - - - - - -
- - - - - - - - - - - - - - - - - -
- - - - - - - - - - - - - - - - - -
- - - - - - - - - - - - - - - - - -
- - - - - - - - - - - - - - - - - -
6,372 919 (2,066) (2,165) (2,224) (2,360) (2,399) (2,456) (2,492) (2,525) (2,172) (1,008) (1,008) (1,008) (1,008) (1,008) (1,008) (1,008)
140,312 149,989 152,162 141,721 125,231 106,997 87,150 65,871 45,137 23,462 10,623 9,677 9,677 9,677 9,677 9,677 9,677 9,677
140,312 149,989 152,162 141,721 125,231 106,997 87,150 65,871 45,137 23,462 10,623 9,677 9,677 9,677 9,677 9,677 9,677 9,677
146,684 150,908 150,096 139,556 123,007 104,637 84,751 63,415 42,645 20,937 8,451 8,668 8,668 8,668 8,668 8,668 8,668 8,668
$178,191 $172,984 $157,603 $142,575 $126,026 $107,656 $87,770 $66,433 $45,663 $23,956 $11,469 $11,687 $11,687 $11,687 $11,687 $11,687 $11,687 $11,687
BP-18-FS-BPA-02A Page 243

TABLE 13E:
Summary of Interest, Shift Study
October 1, 2015 - September 30, 2019 Cost Evaluation Period
($000s) (FY 2019)
Obligation Type General Project Specific Project
Boise
Columbia Basin
Columbia Basin 3rd Powerhouse
Hungry Horse Dam
Minidoka/Palisades
RRP - Green Springs
Yakima Chandler/Kenniwick
Yakima Roza
Bureau of Reclamation Subtotal:
Albeni Falls
Bonneville 2nd Powerhouse
Bonneville Dam
Chief Joseph
Columbia River Fish Mitigation
Cougar
Detroit Lake/Big Cliff
Dworshak
Green Peter/Foster
Hills Creek
Ice Harbor
John Day
Libby
Little Goose
Lookout Dam
Lost Creek
Lower Granite
Lower Monument
McNary
The Dalles
Corps of Engineers Subtotal:
Lower Snake Fish and Wildlife
Lower Snake Fish & Wildlife Subtotal:
(Less Interest Income)
Bureau Direct
Interest Accrual
Interest Accrual Reversal
Conservation
Interest Accrual
Interest Accrual Reversal
Construction (AS)
Interest Accrual
Interest Accrual Reversal
Corps
Interest Accrual
Interest Accrual Reversal
Fish and Wildlife
Interest Accrual
Interest Accrual Reversal
Technology (G)
Interest Accrual
Interest Accrual Reversal
BPA Borrowing Subtotal:
Replacements
Federal Generation Replacements Subtotal:
Appropriation
Bureau of Reclamation
Corps of Engineers
Lower Snake Fish & Wildlife
Appropriation Subtotal:
Treasury
BPA Borrowing
Federal Generation Replacements
Treasury Subtotal:
Grand Total:
2052 2053 2054 2055 2056 2057 2058 2059 2060 2061 2062 2063 2064 2065 2066 2067 2068 2069 Total
3 3 3 3 3 3 3 - - - - - - - - - - - 1,084
99 99 99 99 99 99 99 59 - - - - - - - - - - 40,459
- - - - - - - - - - - - - - - - - - 903
6 6 6 6 6 6 6 3 - - - - - - - - - - 3,871
- - - - - - - - - - - - - - - - - - 15,646
- - - - - - - - - - - - - - - - - - 1,311
1 1 1 1 1 1 1 1 - - - - - - - - - - 584
- - - - - - - - - - - - - - - - - - 2
109 109 109 109 109 109 109 62 - - - - - - - - - - 63,860
2 2 2 2 2 2 2 2 - - - - - - - - - - 662
- - - - - - - - - - - - - - - - - - 2,738
712 712 712 712 712 712 712 - - - - - - - - - - - 95,865
171 171 171 171 171 171 171 - - - - - - - - - - - 26,998
1,782 1,782 1,782 1,782 1,782 1,782 1,782 - - - - - - - - - - - 1,100,961
- - - - - - - - - - - - - - - - - - 11,306
- - - - - - - - - - - - - - - - - - 1,283
- - - - - - - - - - - 3,806
- - - - - - - - - - - - - - - - - - 452
- - - - - - - - - - - - - - - - - - 295
1 1 1 1 1 1 1 - - - - - - - - - - - 10,385
68 68 68 68 68 68 68 68 - - - - - - - - - - 14,033
76 76 76 76 76 76 76 - - - - - - - - - - - 5,107
1 1 1 1 1 1 1 - - - - - - - - - - - 3,434
- - - - - - - - - - - - - - - - - - 5,908
- - - - - - - - - - - - - - - - - - 31
1 1 1 1 1 1 1 - - - - - - - - - - - 10,426
- - - - - - - - - - - 5,934
10 10 10 10 10 10 10 - - - - - - - - - - - 8,915
80 80 80 80 80 80 80 - - - - - - - - - - - 30,050
2,906 2,906 2,906 2,906 2,906 2,906 2,906 70 - - - - - - - - - - 1,338,589
4 4 4 4 4 4 4 - - - - - - - - - - - 19,480
4 4 4 4 4 4 4 - - - - - - - - - - - 19,480
3,019 3,019 3,019 3,019 3,019 3,019 3,019 132 - - - - - - - - - - 1,421,928
(1,008) (1,008) (1,008) (1,008) (1,008) (1,008) (1,008) (1,008) (1,008) (1,008) (1,008) (1,008) (1,008) (1,008) (1,008) (1,008) (1,008) (1,008) (70,117)
- - - - - - - - - - - - - - - - - - 474,599
- - - - - - - - - - - - - - - - - - 60,524
- - - - - - - - - - - - - - - - - - (66,188)
- - - - - - - - - - - - - - - - - - 69,169
- - - - - - - - - - - - - - - - - - 14,627
- - - - - - - - - - - - - - - - - - (16,701)
- - - - - - - - - - - - - - - - - - 4,761
- - - - - - - - - - - - - - - - - - 585
- - - - - - - - - - - - - - - - - - (769)
- - - - - - - - - - - - - - - - - - 206,595
- - - - - - - - - - - - - - - - - - 24,573
- - - - - - - - - - - - - - - - - - (25,290)
- - - - - - - - - - - - - - - - - - 161,210
- - - - - - - - - - - - - - - - - - 17,062
- - - - - - - - - - - - - - - - - - (19,060)
- - - - - - - - - - - - - - - - - - 4,437
- - - - - - - - - - - - - - - - - - 373
- - - - - - - - - - - - - - - - - - (464)
(1,008) (1,008) (1,008) (1,008) (1,008) (1,008) (1,008) (1,008) (1,008) (1,008) (1,008) (1,008) (1,008) (1,008) (1,008) (1,008) (1,008) (1,008) 839,926
9,677 9,677 9,677 9,677 9,677 9,677 9,677 9,677 9,677 9,677 9,677 9,677 9,677 9,677 9,677 9,677 9,677 9,677 2,238,887
9,677 9,677 9,677 9,677 9,677 9,677 9,677 9,677 9,677 9,677 9,677 9,677 9,677 9,677 9,677 9,677 9,677 9,677 2,238,887
8,668 8,668 8,668 8,668 8,668 8,668 8,668 8,668 8,668 8,668 8,668 8,668 8,668 8,668 8,668 8,668 8,668 8,668 3,078,813
$11,687 $11,687 $11,687 $11,687 $11,687 $11,687 $11,687 $8,800 $8,668 $8,668 $8,668 $8,668 $8,668 $8,668 $8,668 $8,668 $8,668 $8,668 $4,500,741
BP-18-FS-BPA-02A Page 244

TABLE 13F:
Summary of Amortization, Shift Study
October 1, 2015 - September 30, 2019 Cost Evaluation Period
($000s) (FY 2019)
Obligation Type General Project Specific Project 2017 2018 2019 2020 2021 2022 2023 2024 2025 2026 2027 2028 2029 2030 2031 2032 2033
Boise 3,365 - - - - - - - - - - - - 979 - 17 -
Columbia Basin 6,927 - 14,236 6,543 2,140 37,701 - 4,879 3,727 - - - - 11,891 - 1,987 877
Columbia Basin 3rd Powerhouse 12,631 - - - - - - - - - - - - - - - -
Hungry Horse Dam 6,318 552 - - - - - - - - - - 2,951 294 - - 779
Minidoka/Palisades 50,911 42 - - - - - - - - - - - - - - -
RRP - Green Springs - 11,145 - - - - - - - - - - - - - - -
Yakima Chandler/Kenniwick - - - - - - - - - - - - 833 - - - -
Yakima Roza - 14 - - - - - - - - - - - - - - -
Bureau of Reclamation Subtotal: 80,151 11,754 14,236 6,543 2,140 37,701 - 4,879 3,727 - - - 3,784 13,164 - 2,004 1,656
Albeni Falls 2,510 - - - - - - - - - - - - 481 - - 42
Bonneville 2nd Powerhouse 38,293 - - - - - - - - - - - - - - - -
Bonneville Dam 3,917 24,446 - - - - - - 2,978 - 19,368 - 31,322 20,849 - 2,628 4,169
Chief Joseph 7,970 - - - - - - - 347 - - - 992 - - - 24,727
Columbia River Fish Mitigation 55,768 36,266 2,853 - - - - - 8,797 - 20,742 4,624 143,460 79,873 191,054 278,543 56,832
Cougar 26 - - - - - - - - - - - 3,622 8,250 - 230 59
Detroit Lake/Big Cliff 38 - 282 - - - - - 18 - - - 223 1,031 - - -
Dworshak 8,803 - - - - - - - 199 - 630 - 761 713 - 2,380 -
Green Peter/Foster 26 200 - - - - - - - - - - - - - - -
Hills Creek 2,658 8 - - - - - - 2 - - - 46 - - - -
Ice Harbor 986 764 - - - - - - 4,634 990 4,227 - 50 - - 2,615 207
John Day 11,433 619 - - - - - - 3,510 - 2,830 - 2,827 233 601 - 356
Libby 15,441 5,562 - - - - - - - - - - - - - - 40
Little Goose 6,102 4,608 - - - - - - 27 - 67 - 146 - - 3,171 30
Lookout Dam 5,170 - - - - - - - - - - - 7,490 572 - - -
Lost Creek 118 147 - - - - - - - - - - - - - - -
Lower Granite 1,311 2,025 - - - - - - 2,131 - - - 434 - - 5,669 1,156
Lower Monument 2,160 3,301 - - - - - - 29 - 3,423 - 549 - 285 2,332 -
McNary 635 1,046 - - - - - - - - 6,138 - 646 - 4,080 - -
The Dalles 4,579 - - - - - - - 1,226 - 182 - 36,019 140 2,030 - -
Corps of Engineers Subtotal: 167,945 78,991 3,135 - - - - - 23,897 990 57,605 4,624 228,588 112,142 198,050 297,569 87,618
Lower Snake Fish and Wildlife 228,843 325 - - - - - - 897 - 230 - 102 - 379 1,534 11
Lower Snake Fish & Wildlife Subtotal: 228,843 325 - - - - - - 897 - 230 - 102 - 379 1,534 11
476,940 91,070 17,372 6,543 2,140 37,701 - 4,879 28,520 990 57,835 4,624 232,474 125,306 198,429 301,107 89,285
Bureau Direct - - 105,000 120,000 97,000 19,000 - - - - - 25,000 121,000 188,484 101,516 66,000 222,000
Principal Accrual - - - - - - - - - - - - - - - - -
Principal Accrual Reversal - - - - - - - - - - - - - - - - -
Conservation - 29,000 - - 19,000 16,000 142,000 97,000 69,000 39,000 6,000 25,000 - - - - -
Principal Accrual - - - - - - - - - - - - - - - - -
Principal Accrual Reversal - - - - - - - - - - - - - - - - -
Construction (AS) - 15,150 5,250 18,100 7,000 5,800 3,150 5,600 5,950 - - - - - - - -
Principal Accrual - - - - - - - - - - - - - - - - -
Principal Accrual Reversal - - - - - - - - - - - - - - - - -
Corps - - - - - - - - - - - - - 15,000 53,000 81,389 141,591
Principal Accrual - - - - - - - - - - - - - - - - -
Principal Accrual Reversal - - - - - - - - - - - - - - - - -
Fish and Wildlife - - 46,000 - - 31,000 - 25,000 - 80,000 55,000 26,000 56,000 8,000 13,000 40,000 51,000
Principal Accrual - - - - - - - - - - - - - - - - -
Principal Accrual Reversal - - - - - - - - - - - - - - - - -
Technology (G) - - - - 35,000 14,000 5,000 5,000 - - - - - - - - -
Principal Accrual - - - - - - - - - - - - - - - - -
Principal Accrual Reversal - - - - - - - - - - - - - - - - -
BPA Borrowing Subtotal: - 44,150 156,250 138,100 158,000 85,800 150,150 132,600 74,950 119,000 61,000 76,000 177,000 211,484 167,516 187,389 414,591
Replacements - - - - - - - - - - - - - - - - -
Principal Accrual - - - - - - - - - - - - - - - - -
Principal Accrual Reversal - - - - - - - - - - - - - - - - -
Federal Generation Replacements Subtotal: - - - - - - - - - - - - - - - - -
Discounts - - - - - - - - - - - - - - - - -
Premiums - - - - - - - - - - - - 2,308 4,526 4,955 - 1,098
Make Whole Call Subtotal: - - - - - - - - - - - - 2,308 4,526 4,955 - 1,098
- 44,150 156,250 138,100 158,000 85,800 150,150 132,600 74,950 119,000 61,000 76,000 177,000 211,484 167,516 187,389 414,591
Irrigation Assistance 50,769 27,234 56,573 24,317 14,747 16,060 12,846 15,117 13,543 20,755 6,118 11,186 4,065 1,996 10,524 - 4,347
Irrigation Assistance Subtotal: 50,769 27,234 56,573 24,317 14,747 16,060 12,846 15,117 13,543 20,755 6,118 11,186 4,065 1,996 10,524 - 4,347
50,769 27,234 56,573 24,317 14,747 16,060 12,846 15,117 13,543 20,755 6,118 11,186 4,065 1,996 10,524 - 4,347
$527,709 $162,454 $230,194 $168,960 $174,887 $139,561 $162,996 $152,596 $117,013 $140,745 $124,954 $91,811 $413,538 $338,786 $376,469 $488,496 $508,223
Appropriation
Bureau of Reclamation
Corps of Engineers
Lower Snake Fish & Wildlife
Appropriation Subtotal:
Grand Total:
Bond
BPA Borrowing
Federal Generation Replacements
Make Whole Call
Bond Subtotal:
IrrigationIrrigation Assistance
Irrigation Subtotal:
BP-18-FS-BPA-02A Page 245
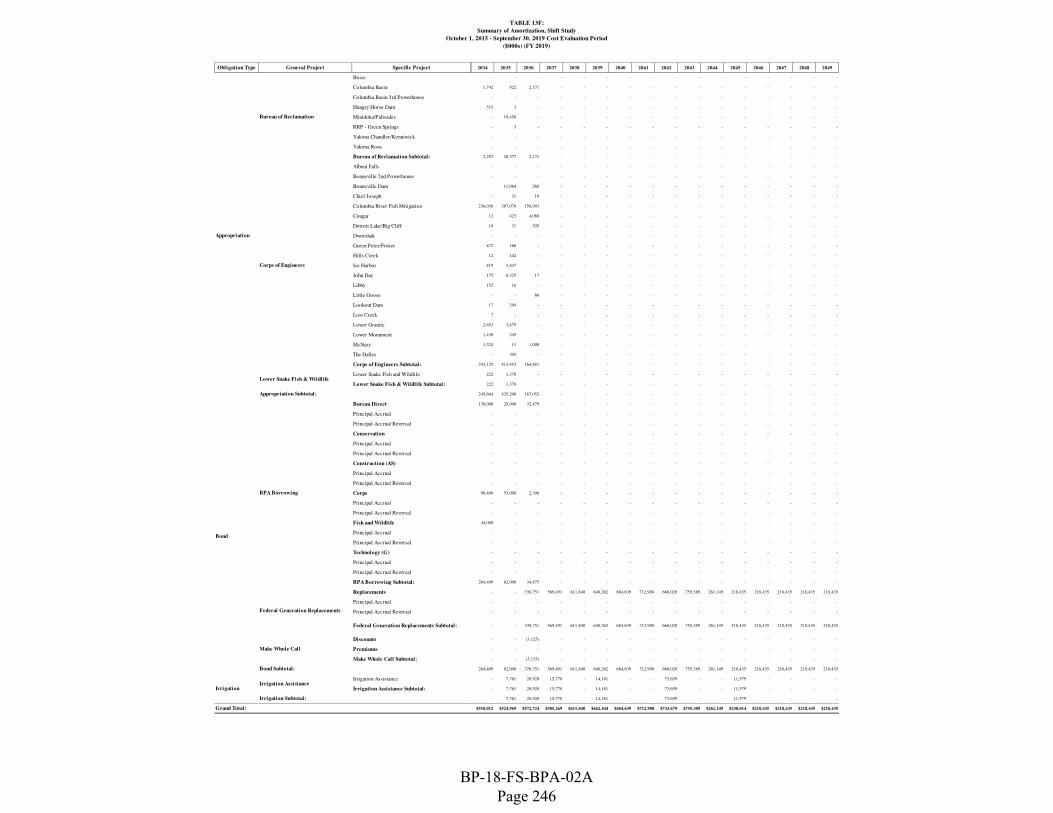
TABLE 13F:
Summary of Amortization, Shift Study
October 1, 2015 - September 30, 2019 Cost Evaluation Period
($000s) (FY 2019)
Obligation Type General Project Specific Project
Boise
Columbia Basin
Columbia Basin 3rd Powerhouse
Hungry Horse Dam
Minidoka/Palisades
RRP - Green Springs
Yakima Chandler/Kenniwick
Yakima Roza
Bureau of Reclamation Subtotal:
Albeni Falls
Bonneville 2nd Powerhouse
Bonneville Dam
Chief Joseph
Columbia River Fish Mitigation
Cougar
Detroit Lake/Big Cliff
Dworshak
Green Peter/Foster
Hills Creek
Ice Harbor
John Day
Libby
Little Goose
Lookout Dam
Lost Creek
Lower Granite
Lower Monument
McNary
The Dalles
Corps of Engineers Subtotal:
Lower Snake Fish and Wildlife
Lower Snake Fish & Wildlife Subtotal:
Bureau Direct
Principal Accrual
Principal Accrual Reversal
Conservation
Principal Accrual
Principal Accrual Reversal
Construction (AS)
Principal Accrual
Principal Accrual Reversal
Corps
Principal Accrual
Principal Accrual Reversal
Fish and Wildlife
Principal Accrual
Principal Accrual Reversal
Technology (G)
Principal Accrual
Principal Accrual Reversal
BPA Borrowing Subtotal:
Replacements
Principal Accrual
Principal Accrual Reversal
Federal Generation Replacements Subtotal:
Discounts
Premiums
Make Whole Call Subtotal:
Irrigation Assistance
Irrigation Assistance Subtotal:
Appropriation
Bureau of Reclamation
Corps of Engineers
Lower Snake Fish & Wildlife
Appropriation Subtotal:
Grand Total:
Bond
BPA Borrowing
Federal Generation Replacements
Make Whole Call
Bond Subtotal:
IrrigationIrrigation Assistance
Irrigation Subtotal:
2034 2035 2036 2037 2038 2039 2040 2041 2042 2043 2044 2045 2046 2047 2048 2049
- - - - - - - - - - - - - - - -
1,742 922 2,171 - - - - - - - - - - - - -
- - - - - - - - - - - - - - - -
515 3 - - - - - - - - - - - - - -
- 19,450 - - - - - - - - - - - - - -
- 3 - - - - - - - - - - - - - -
- - - - - - - - - - - - - - - -
- - - - - - - - - - - - - - - -
2,257 20,377 2,171 - - - - - - - - - - - - -
- - - - - - - - - - - - - - - -
- - - - - - - - - - - - - - - -
11,064 268 - - - - - - - - - - - - -
- 31 10 - - - - - - - - - - - - -
236,036 387,078 158,903 - - - - - - - - - - - - -
12 423 4,088 - - - - - - - - - - - - -
18 31 528 - - - - - - - - - - - - -
- - - - - - - - - - - - - - - -
472 166 - - - - - - - - - - - - - -
12 142 - - - - - - - - - - - - - -
819 3,847 - - - - - - - - - - - - - -
175 6,325 17 - - - - - - - - - - - - -
152 16 - - - - - - - - - - - - - -
- - 66 - - - - - - - - - - - - -
17 294 - - - - - - - - - - - - - -
7 - - - - - - - - - - - - - - -
2,653 3,475 - - - - - - - - - - - - - -
1,430 245 - - - - - - - - - - - - - -
1,324 11 1,000 - - - - - - - - - - - - -
- 305 - - - - - - - - - - - - - -
243,125 413,453 164,881 - - - - - - - - - - - - -
222 1,378 - - - - - - - - - - - - - -
222 1,378 - - - - - - - - - - - - - -
245,604 435,208 167,052 - - - - - - - - - - - - -
130,000 29,000 32,479 - - - - - - - - - - - - -
- - - - - - - - - - - - - - - -
- - - - - - - - - - - - - - - -
- - - - - - - - - - - - - - - -
- - - - - - - - - - - - - - - -
- - - - - - - - - - - - - - - -
- - - - - - - - - - - - - - - -
- - - - - - - - - - - - - - - -
- - - - - - - - - - - - - - - -
90,409 53,000 2,396 - - - - - - - - - - - - -
- - - - - - - - - - - - - - - -
- - - - - - - - - - - - - - - -
44,000 - - - - - - - - - - - - - - -
- - - - - - - - - - - - - - - -
- - - - - - - - - - - - - - - -
- - - - - - - - - - - - - - - -
- - - - - - - - - - - - - - - -
- - - - - - - - - - - - - - - -
264,409 82,000 34,875 - - - - - - - - - - - - -
- - 338,751 569,491 611,840 648,262 684,639 712,908 660,020 755,389 261,149 218,435 218,435 218,435 218,435 218,435
- - - - - - - - - - - - - - - -
- - - - - - - - - - - - - - - -
- - 338,751 569,491 611,840 648,262 684,639 712,908 660,020 755,389 261,149 218,435 218,435 218,435 218,435 218,435
- - (3,125) - - - - - - - - - - - - -
- - - - - - - - - - - - - - - -
- - (3,125) - - - - - - - - - - - - -
264,409 82,000 376,751 569,491 611,840 648,262 684,639 712,908 660,020 755,389 261,149 218,435 218,435 218,435 218,435 218,435
- 7,761 28,920 15,778 - 14,181 - - 73,659 - - 11,579 - - - -
- 7,761 28,920 15,778 - 14,181 - - 73,659 - - 11,579 - - - -
- 7,761 28,920 15,778 - 14,181 - - 73,659 - - 11,579 - - - -
$510,012 $524,969 $572,724 $585,269 $611,840 $662,444 $684,639 $712,908 $733,679 $755,389 $261,149 $230,014 $218,435 $218,435 $218,435 $218,435
BP-18-FS-BPA-02A Page 246

TABLE 13F:
Summary of Amortization, Shift Study
October 1, 2015 - September 30, 2019 Cost Evaluation Period
($000s) (FY 2019)
Obligation Type General Project Specific Project
Boise
Columbia Basin
Columbia Basin 3rd Powerhouse
Hungry Horse Dam
Minidoka/Palisades
RRP - Green Springs
Yakima Chandler/Kenniwick
Yakima Roza
Bureau of Reclamation Subtotal:
Albeni Falls
Bonneville 2nd Powerhouse
Bonneville Dam
Chief Joseph
Columbia River Fish Mitigation
Cougar
Detroit Lake/Big Cliff
Dworshak
Green Peter/Foster
Hills Creek
Ice Harbor
John Day
Libby
Little Goose
Lookout Dam
Lost Creek
Lower Granite
Lower Monument
McNary
The Dalles
Corps of Engineers Subtotal:
Lower Snake Fish and Wildlife
Lower Snake Fish & Wildlife Subtotal:
Bureau Direct
Principal Accrual
Principal Accrual Reversal
Conservation
Principal Accrual
Principal Accrual Reversal
Construction (AS)
Principal Accrual
Principal Accrual Reversal
Corps
Principal Accrual
Principal Accrual Reversal
Fish and Wildlife
Principal Accrual
Principal Accrual Reversal
Technology (G)
Principal Accrual
Principal Accrual Reversal
BPA Borrowing Subtotal:
Replacements
Principal Accrual
Principal Accrual Reversal
Federal Generation Replacements Subtotal:
Discounts
Premiums
Make Whole Call Subtotal:
Irrigation Assistance
Irrigation Assistance Subtotal:
Appropriation
Bureau of Reclamation
Corps of Engineers
Lower Snake Fish & Wildlife
Appropriation Subtotal:
Grand Total:
Bond
BPA Borrowing
Federal Generation Replacements
Make Whole Call
Bond Subtotal:
IrrigationIrrigation Assistance
Irrigation Subtotal:
2050 2051 2052 2053 2054 2055 2056 2057 2058 2059 2060 2061 2062 2063 2064 2065 2066 2067 2068 2069 Total
- - - - - - - - 64 - - - - - - - - - - - 4,425
- - - - - - - - 835 1,338 - - - - - - - - - - 97,915
- - - - - - - - - - - - - - - - - - - - 12,631
- - - - - - - - 76 60 - - - - - - - - - - 11,549
- - - - - - - - - - - - - - - - - - - - 70,403
- - - - - - - - - - - - - - - - - - - - 11,148
- - - - - - - - - 15 - - - - - - - - - - 848
- - - - - - - - - - - - - - - - - - - - 14
- - - - - - - - 975 1,414 - - - - - - - - - - 208,933
- - - - - - - - - 57 - - - - - - - - - - 3,090
- - - - - - - - - - - - - - - - - - - - 38,293
- - - - - - - - 14,609 - - - - - - - - - - - 135,618
- - - - - - - - 3,500 - - - - - - - - - - - 37,578
- - - - - - - - 36,554 - - - - - - - - - - - 1,697,384
- - - - - - - - - - - - - - - - - - - - 16,710
- - - - - - - - - - - - - - - - - - - - 2,168
- - - - - - - - 10 - - - - - - - - - - - 13,495
- - - - - - - - - - - - - - - - - - - - 863
- - - - - - - - - - - - - - - - - - - - 2,867
- - - - - - - - 14 - - - - - - - - - - - 19,152
- - - - - - - - - 1,548 - - - - - - - - - - 30,473
- - - - - - - - 1,567 - - - - - - - - - - - 22,777
- - - - - - - - 13 - - - - - - - - - - - 14,231
- - - - - - - - - - - - - - - - - - - - 13,543
- - - - - - - - - - - - - - - - - - - - 272
- - - - - - - - 24 - - - - - - - - - - - 18,878
- - - - - - - - 9 - - - - - - - - - - - 13,764
- - - - - - - - 215 - - - - - - - - - - - 15,096
- - - - - - - - 1,651 - - - - - - - - - - - 46,132
- - - - - - - - 58,167 1,605 - - - - - - - - - - 2,142,385
- - - - - - - - 74 - - - - - - - - - - - 233,996
- - - - - - - - 74 - - - - - - - - - - - 233,996
- - - - - - - - 59,216 3,018 - - - - - - - - - - 2,585,313
- - - - - - - - - - - - - - - - - - - - 1,256,479
- - - - - - - - - - - - - - - - - - - - -
- - - - - - - - - - - - - - - - - - - - -
- - - - - - - - - - - - - - - - - - - - 442,000
- - - - - - - - - - - - - - - - - - - - -
- - - - - - - - - - - - - - - - - - - - -
- - - - - - - - - - - - - - - - - - - - 66,000
- - - - - - - - - - - - - - - - - - - - -
- - - - - - - - - - - - - - - - - - - - -
- - - - - - - - - - - - - - - - - - - - 436,784
- - - - - - - - - - - - - - - - - - - - -
- - - - - - - - - - - - - - - - - - - - -
- - - - - - - - - - - - - - - - - - - - 475,000
- - - - - - - - - - - - - - - - - - - - -
- - - - - - - - - - - - - - - - - - - - -
- - - - - - - - - - - - - - - - - - - - 59,000
- - - - - - - - - - - - - - - - - - - - -
- - - - - - - - - - - - - - - - - - - - -
- - - - - - - - - - - - - - - - - - - - 2,735,264
218,435 218,435 218,435 218,435 218,435 218,435 218,435 218,435 218,435 218,435 218,435 218,435 218,435 218,435 218,435 218,435 218,435 218,435 218,435 218,435 10,703,335
- - - - - - - - - - - - - - - - - - - - -
- - - - - - - - - - - - - - - - - - - - -
218,435 218,435 218,435 218,435 218,435 218,435 218,435 218,435 218,435 218,435 218,435 218,435 218,435 218,435 218,435 218,435 218,435 218,435 218,435 218,435 10,703,335
- - - - - - - - - - - - - - - - - - - - (3,125)
- - - - - - - - - - - - - - - - - - - - 12,887
- - - - - - - - - - - - - - - - - - - - 9,761
218,435 218,435 218,435 218,435 218,435 218,435 218,435 218,435 218,435 218,435 218,435 218,435 218,435 218,435 218,435 218,435 218,435 218,435 218,435 218,435 13,441,724
- - - - - - - - - - - - - - - - - - - - 442,075
- - - - - - - - - - - - - - - - - - - - 442,075
- - - - - - - - - - - - - - - - - - - - 442,075
$218,435 $218,435 $218,435 $218,435 $218,435 $218,435 $218,435 $218,435 $277,651 $221,454 $218,435 $218,435 $218,435 $218,435 $218,435 $218,435 $218,435 $218,435 $218,435 $218,435 $16,469,111
BP-18-FS-BPA-02A Page 247

14. REPAYMENT THEORY AND OPERATION
14.1 Introduction
The Bonneville Power Administration (BPA) is required to collect sufficient revenues to meet the annual expenses and cover the long-term obligations of the Federal Columbia River Power System (FCRPS). The Repayment Program is used to determine whether a given set of annual revenues is sufficient to meet a given set of annual expenses and cover a given set of long-term obligations when applied in accordance with the requirements of Department of energy (DOE) Order RA 6120.2. The Program is also used to determine by what minimum factor the future revenues can be multiplied to obtain a new set of revenues which will be sufficient. The revenues and expenses of the cost evaluation year will be assigned to all future years. This will have the effect of levelizing the long-term obligations over all future years.
14.2 Repayment Program Logic
The diagrams on the following pages show the flow of logic in BPA’s repayment program. The first diagram shows the logic of the binary search used to locate minimum sufficient revenues. A necessary part of this search is the test for sufficiency. The logic of the test for sufficiency is shown on the remaining two diagrams. The equations which are referred to are:
• Revenue Equation: Net revenues of each year are expended on interest and payments on the principles.
• Investment equation: The payments on each investment are less than or equal to the principle of that investment (and equal to the principle of that investment after the investment is due).
• Predictor equation: For each future year the accumulated revenues less the accumulated interest less the accumulated investments due is equal to the accumulated payments on high interest rate investments which are not due.
BP-18-FS-BPA-02A Page 248

14.3 Bond Rollover Feature
Since the 2002 Wholesale Power Rate Case, BPA has incorporated a new data manipulation feature associated with the repayment program. This does not change any methodology of the model. It allows the user to assume that short-term bond(s) associated with assets with average service lives considerably longer than the bond maturity date are refinanced on the original maturity date, and recognizes replacement bonds with new maturity dates and corresponding interest rates. This feature reflects BPA’s practice of rolling over a bond when it comes due if funds are not available to pay it at that time or if market conditions justify refinancing such bonds within the allowable repayment period of the associated assets. Reflecting this practice in the model allows a more realistic calculation of interest expense.
BP-18-FS-BPA-02A Page 249
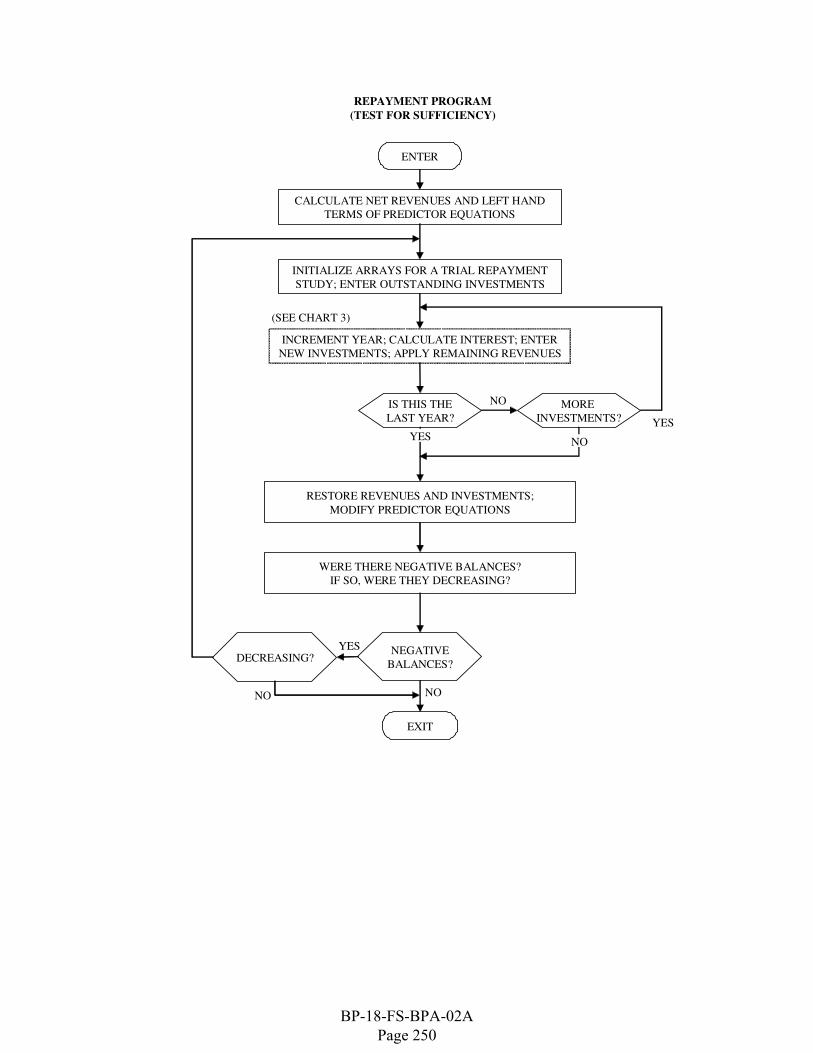
ENTER
CALCULATE NET REVENUES AND LEFT HANDTERMS OF PREDICTOR EQUATIONS
INITIALIZE ARRAYS FOR A TRIAL REPAYMENT
STUDY; ENTER OUTSTANDING INVESTMENTS
IS THIS THE
LAST YEAR?
MORE
INVESTMENTS?
RESTORE REVENUES AND INVESTMENTS;
MODIFY PREDICTOR EQUATIONS
NEGATIVE
BALANCES?
EXIT
REPAYMENT PROGRAM
(TEST FOR SUFFICIENCY)
INCREMENT YEAR; CALCULATE INTEREST; ENTER
NEW INVESTMENTS; APPLY REMAINING REVENUES
(SEE CHART 3)
YES
WERE THERE NEGATIVE BALANCES?
IF SO, WERE THEY DECREASING?
DECREASING?
NO
NO
YES
NO NO
YES
BP-18-FS-BPA-02A Page 250

ENTER
INCREMENT YEAR; CALCULATE INTEREST; ENTER
INVESTMENTS; ADJUST PREDICTOR EQUATIONS
MAKE ANY NECESSARY DEFERRALS OR PAYMENTS
ON DEFERRALS; ADJUST PREDICTOR EQUATIONS
OUTSTANDING
INVESTMENTS?
LOAN
DUE?
SEARCH FOR INVESTMENTS WHICH ARE DUE
(SATISFY INVESTMENT EQUATIONS)
OUTSTANDING
INVESTMENTS AND
REVENUE BALANCES?
EXIT
REPAYMENT PROGRAM
(APPLICATION OF REVENUES)
YES
ADJUST REVENUE AND PREDICTOR EQUATIONS
FOR ANY NEGATIVE BALANCES
NO
YES
MAKE PAYMENT; REMOVE INVESTMENT;
ADJUST PREDICTOR EQUATIONS
YES
NO
EVALUATE LEFTHAND SIDE OF
PREDICTOR EQUATIONS
LIMIT YEAR
EXISTS?
MAKE PAYMENT; REMOVE INVESTMENT
IF RETIRED; ADJUST PREDICTOR EQUATIONS
SEARCH FOR INVESTMENT WHICH HAS HIGHEST
INTEREST RATE; DETERMINE MAXIMUM PAYMENT
SEARCH FOR INVESTMENT WHICH HAS HIGHEST
INTEREST RATE AND IS DUE ON OR BEFORE LIMIT YEAR
MISCELLANEOUS END-OF-YEAR CALCULATIONS
NO
YES
BP-18-FS-BPA-02A Page 251


BONNEVILLE POWER ADMINISTRATION DOE/BP-4804 • July 2017