brasil-canada agriculture forum
TRANSCRIPT
WWW.INSPER.EDU.BR
BRASIL-CANADA AGRICULTURE FORUMBrazil-Canada Trade in the Agri-Food Sector (Session 2)
GLOBAL CHALLENGES FOR BILATERAL TRADE(KEYNOTE SPEECH)
Marcos Sawaya JankProfessor of Global Agribusiness
May 25th, 2021

WWW.INSPER.EDU.BR
✓ Senior Professor of Global Agribusiness and coordinator of Insper Agro Global.
✓ Chair Professor of the Luiz de Queiroz Chair on Integrated Agri-Food Systems at ESALQ-USP (2019/2020)
✓ President of the Asia-Brazil Agro Alliance (ABAA), an initiative to represent the Brazilian trade associations in Asia, located in Singapore (2017-19)
✓ Vice-President of Corporate Affairs and Business Development of BRF Asia-Pacific (2013-16)
✓ CEO of the Brazilian Sugarcane Industry Association (UNICA) – (2007-12)
✓ President of the Brazilian Institute for International Trade Negotiations (ICONE) - 2002-07
✓ Associate Professor at the University of São Paulo’s (USP) Colleges of Economics (FEA), Agricultural Sciences (ESALQ) and International Relations (IRI) – 1989-2007
✓ Board Member of RUMO Logistics, COMERC Energy, Agrotools and at Minerva and Cargill Global Committees on Sustainability and Forest Protection.
✓ Education: Tenure in Agricultural Economics at ESALQ-USP, Doctorate in Business Economics at USP Scholl of Economics and Business (FEA), M.Sc. in Ag Policy in Montpellier-France, and a B.Sc. degree in Agronomy at ESALQ
BIO

WWW.INSPER.EDU.BR
Canada & BrazilCompetitive Advantages in the Agri-Food Sector
CANADA BRAZIL• 5th ag exporter and 9th in total ag area.
• Trade agreements covering most ag exports: market access, lower tariffs.
• Reputation and differentiation: quality, food safety, traceability.
• Long-term international presence →
government and private sector.
• Commodity based exports, value-added products and branding.
• Food Chain organization.
• Regulatory system: simple, focused.
• 3rd ag exporter and 5th in total ag area.
• Availability of natural resources: land, water, climate conditions.
• “Tropicalization”: genetic improvement (soy, grasses, zebu), double cropping, crop-livestock integration, no-till, large scale farming systems, integrated supply chains
• Benchmark in biofuels (ethanol biodiesel).
• Commodity based exports: volumes and low costs, value-added still a challenge.
• Farmers: young entrepreneurs, motivated, risk takers, intense internal migrations.
• New agricultural frontiers, especially pasture conversions and MAPITOBA).
More complementarities than competition!

WWW.INSPER.EDU.BR
Agricultural trade balances by regionFood surpluses and deficits (contant value 1990–2025)
Source: OECD and FAO agricultural outlook 2016–2025
WWW.INSPER.EDU.BR
-100-90-80-70-60-50-40-30-20-10
0102030405060708090
100
US
D b
illio
n
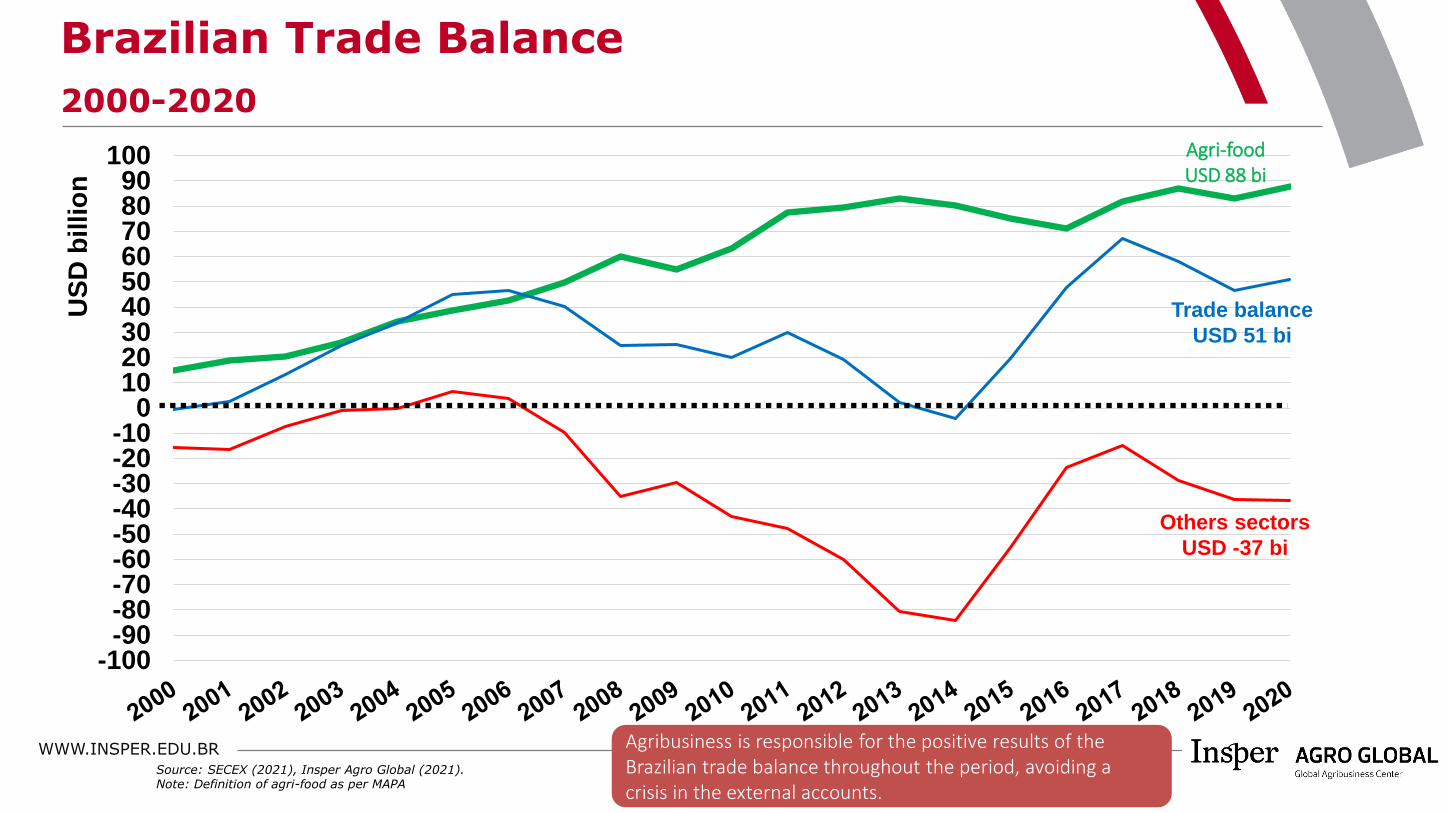
Trade balance
USD 51 bi
Others sectors
USD -37 bi
Agri-foodUSD 88 bi
Source: SECEX (2021), Insper Agro Global (2021).Note: Definition of agri-food as per MAPA
Agribusiness is responsible for the positive results of the Brazilian trade balance throughout the period, avoiding a crisis in the external accounts.
Brazilian Trade Balance
2000-2020

WWW.INSPER.EDU.BR
0
10
20
30
40
50
60
70
80
90
100
110
2010 2011 2012 2013 2014 2015 2016 2017 2018 2019 2020
US$
Bill
ion
Fonte: SECEX (2021), Insper Agro Global (2021).Definition of Agribusiness from MAPA, which considers 2949 agri-food products.
2020 (US bi)
2020 (%)
CAGR (10-20)
13.1 12.9% -2.3%
Soybean complex
Meat
Forest products
Sugar and EthanolCorn
Cotton
Others
3.2 3.2% 8.0%
6.0 5.9% 7.0%5.5 5.5% -2.9%
10.1 10.0% -6.7%
11.4 11.3% 3.5%
16.4 16.3% 1.1%
35.2 34.9% 5.6%
Coffee
US$ 101 bi
Brazil: Agri-Food Exports by productsValue, 2010 to 2020 (USD billion)
Top 4 agri-food chains → 73%

WWW.INSPER.EDU.BR
0
10
20
30
40
50
60
70
2009 2010 2011 2012 2013 2014 2015 2016 2017 2018 2019
US$
Bill
ion
Canada: Agri-Food Exports by productsValue, 2009 to 2019 (USD billion)
2019 (US bl)
2019 (%)
CAGR (09-19)
11.7 18.5% 3.5%Forest products
Others 18.2 28.7% 4.2%
Source: UN COMTRADE (2021), Insper Agro Global (2021).
Fish products
Wheat
Vegetables
RapeseedPork
Vegetable oilsBeef
PulsesSoy
ChocolateLive animals
5.6 8.9% 5.0%
5.5 8.8% 0.1%3.4 5.3% 4.7%3.2 5.1% 1.2%3.0 4.8% 1.5%2.9 4.6% 2.6%2.4 3.9% 7.2%2.3 3.7% 2.5%1.8 2.8% 5.0%1.6 2.6% 7.9%1.5 2.4% -0.5%

WWW.INSPER.EDU.BR
Brazil: Agri-Food Exports by destinationValue, 2000 to 2020 (USD billion)
European Union (17%)
Asia ex-China (17%)
MENA (9%)
Latin America (8%)USA/Canada (8%)
SSA Africa (6%)
Source: SECEX (2021), Insper Agro Global (2021). Note: Asia ex-China includes East Asia (ex. China), South Asia, ASEAN, Russia and Central Asia. Definition of Agribusiness from MAPA, which considers 2949 agri-food products.MENA is Middle East and North Africa. SSA Africa is Sub-Saharan Africa.
0
5
10
15
20
25
30
35
40
US$
Bill
ion
China & HK
(34%)

WWW.INSPER.EDU.BR
0%
10%
20%
30%
40%
50%
60%
70%
80%
90%
100%
China & HK
European Union
MENA
Latin America
USA/Canada
SSA Africa
4%
41%
11%
6%
14%
19%
2%
34%
18%
16%
12%
8%
8%
3%
Asia (ex-China)
Brazil: Agri-Food Exports by destinationShare, 2000 to 2020 (%)
Source: SECEX (2021), Insper Agro Global (2021). Note: Asia ex-China includes East Asia (ex. China), South Asia, ASEAN, Russia and Central Asia. Definition of Agribusiness from MAPA, which considers 2949 agri-food products.MENA is Middle East and North Africa. SSA Africa is Sub-Saharan Africa.

WWW.INSPER.EDU.BR
0
10
20
30
40
50
60
70
2009 2010 2011 2012 2013 2014 2015 2016 2017 2018 2019
US$
Bill
ion
2019 (US bl)
2019 (%)
CAGR (09-19)
37.9 60.0% 4.7%USA
EU-28
Source: UN COMTRADE (2021), Insper Agro Global (2021).
China & HK
Others Asia
ex-China
Latin America
Others
9.1 14.4% 0.6%
6.5 10.3% 6.8%
3.5 5.5% 0.5%3.0 4.7% 0.0%
3.2 5.1% -1.3%
Canada: Agri-Food Exports by destinationValue, 2009 to 2019 (USD billion)

WWW.INSPER.EDU.BR
0
5
10
15
20
25
30
35
40
45
2009 2010 2011 2012 2013 2014 2015 2016 2017 2018 2019
US$
Bill
ion
2019 (US bl)
2019 (%)
CAGR (09-19)
24.1 55.9% 2.5%
Others
Source: UN COMTRADE (2021), Insper Agro Global (2021).
OceaniaChinaASEANMexico
Latin America (ex-MEX)
EU-28
USA
5.2 12.1% 3.9%
3.6 8.4% 1.0%
2.4 5.5% 7.7%2.0 4.7% 2.4%1.9 4.3% 2.7%0.9 2.1% 2.2%3.0 7.1% 7.6%
Canada: Agri-Food Imports by originValue, 2009 to 2019 (USD billion)

WWW.INSPER.EDU.BRSource: SECEX (2021), Insper Agro Global (2021).
Brazil-Canada Agri-Food TradeValue, 2009 to 2019 (USD billion)
-
100
200
300
400
500
600
700
800
900
2010 2011 2012 2013 2014 2015 2016 2017 2018 2019 2020
USD
Mill
ion
NET exports Exports Imports
BRASILCAGR Exports: -3.5%
CANADACAGR Imports: -10.1%

WWW.INSPER.EDU.BR
0
100
200
300
400
500
600
700
800
900
2010 2011 2012 2013 2014 2015 2016 2017 2018 2019 2020
US$
Mill
ion
Source: SECEX (2021), Insper Agro Global (2021).
2020 (USD mi)
2020 (%)
CAGR (10-20)
282.9 47.2% -7.0%Sugar
118.0 19.7% 0.4%
Coffee
Forest productsPoultryFruitsBeef
Others44.2 7.4% 0.7%26.1 4.4% -4.7%18.0 3.0% 5.5%12.8 2.1% 1.8%97.1 16.2% 0.4%
Brazil: Agri-Food Exports to CanadaValue, 2009 to 2019 (USD billion)

WWW.INSPER.EDU.BR
0
50
100
150
200
250
300
350
400
2010 2011 2012 2013 2014 2015 2016 2017 2018 2019 2020
US$
Mill
ion
Source: SECEX (2021), Insper Agro Global (2021).
2020 (USD mi)
2020 (%)
CAGR (10-20)
26.1 21.3% 4.1%Wheat
PulsesFeeds & Fodders
Paper & Cellulose
Others
18.6 15.2% 0.3%16.9 13.8% 13.3%13.3 10.8% -22.3%
47.7 38.9% 1.5%
Brazil: Agri-Food Imports from CanadaValue, 2009 to 2019 (USD billion)

WWW.INSPER.EDU.BR
100
120
140
160
180
200
220
240
260
280
19
80
19
81
19
82
19
83
19
84
19
85
19
86
19
87
19
88
19
89
19
90
19
91
19
92
19
93
19
94
19
95
19
96
19
97
19
98
19
99
20
00
20
01
20
02
20
03
20
04
20
05
20
06
20
07
20
08
20
09
20
10
20
11
20
12
20
13
20
14
20
15
20
16
Ín
dic
e (
19
80
=1
00
)
Brazil
India
Australia
World Average
Canada
USA
Total Factor Productivity (TFP) growthin Agriculture
TFP → Land, Labor and Capital efficiency
Brazil´s TFP: 2.4% p.a.
Source: USDA/ERS, International Agricultural Productivity data productNote: The TFP (Total Factor Productivity) representes the aggregate efficiency of land, labor and capital resources. Higher TFP means more efficient the production outcomes.

WWW.INSPER.EDU.BR
Land Potential and Water Availability
0
1
2
3
4
5
6
7
8
9
10
0
10
20
30
40
50
60
70
80
90
100
Wat
er
(Tri
llio
n m
3/y
ear
)
Lan
d (
Mill
ion
He
ctar
e)
Arable LAND Available WATER
Note: LAND: available, non-protected and non cultivated, include pastures that could be converted into agriculture. WATER: all sources of renewable water. Sources: Fischer e Shah (2010), mentioned in World Bank, 2010 (Rising Global Interest in Farmland: Can it Yield Sustainable and Equitable Benefits?), ICONE, FAO.

WWW.INSPER.EDU.BR
Native vegetation: 565 M ha (66% of the total area)
Pastures: 175 M ha (20%)
Urbanization: 4 M ha (0,5%)
Agriculture: 85 M ha (10%)
Source: Mapbiomas (2020)
Land Use in Brazil
Current sustainability challenges
Agriculture + livestock + planted forests: 260 M ha (30%)
TOTAL: 850 M ha
Agriculture
Others: 21 M ha (2,5%): mining, waters, dunes, etc.

WWW.INSPER.EDU.BR
0
5
10
15
20
25
30
35
40
45
50
164
166
168
170
172
174
176
178
180
182
184
186
Kg/
ha/
year
Mill
ion
he
ctar
es Productivity
Pasture area
Sustainability governance Productivity gains and the proliferation of integrated systems
Pasture area and productivity Crop-Livestock-Forest Integration and double cropping
Source graph 1:Source graph 2: 2: Athenagro, dados da Kleffmann / Rede Fomento, IBGE (Censo, 2017) e Agroconsult
Incresing beef production doesn´t need new land. It needs inputs, improvements and technology!
23
34
56
78
910
1113
1415
1617
3 35 5
55
68
910 10
11
13 12
1415
0
2
4
6
8
10
12
14
16
18
20
Mill
ion
he
ctar
es
Integratedsystems
Double cropping

WWW.INSPER.EDU.BR
Current Projected
Aratu
Santarém
BR-364 BR-158
BR-163
Itacoatiara
VDC/Bacarena
Itaqui/São Luís
Santana
Vitória (Tubarão)
Aratu
PortoRodoviaHidroviaFerroviaTransbordo
LEGENDA:
Santos
Paranaguá
Rio Grande
São Francisco
Ilhéus
Aratu
Santarém
BR-364 BR-158
BR-163
Itacoatiara
VDC/Bacarena
Itaqui/São Luís
Santana
Vitória (Tubarão)
Aratu
PortoRodoviaHidroviaFerroviaFerrovia ProjetosTransbordo
LEGENDA:
Santos
Paranaguá
Rio Grande
São Francisco
Ilhéus
Ferrogrão
Fico
Rumo Fiol
VLI
Logistics InfrastructureRailways expansion projects
Source: CONAB (2019), Wall Street Research Reports (2019), CNT (2019), RUMO (2019).

WWW.INSPER.EDU.BRSource: UN´s Food & Agriculture Organization Global Perspectives Studies, Bloomberg.
Food DependenceTrade as a share of domestic food supply

WWW.INSPER.EDU.BR
Source: from Derek Headey’s presentation, Senior Research Fellow from the International Food Policy Research Institute (IFPRI). Note: estimated on basis of price data from the ICP reference for a healthy diet EAT-Lancet (2011).
Challenge: access to healthy diets
+1,5 billion people do not have access to
healthy diets in Africaand AsiaCost of a healthy diet
as % of medium family income
CHEAPEST AND MOST DURABLE PRODUCTS:➢ Carbs, snack foods, tubers, sugar, vegetable oils, soft drinks MORE EXPENSIVE AND LESS DURABLE PRODUCTS:➢ Fruits & vegetables, eggs, meats, fresh fish

WWW.INSPER.EDU.BR
Meat ConsumptionAnnual Average (Kg/year)
Source: FAO (2019), Insper Agro Global (2019). Note: Data for meat, pork, poultry and sheep.
Meat consumption(per capita - Kg/year)

WWW.INSPER.EDU.BR
0%
10%
20%
30%
40%
50%
60%
70%
80%
90%
100%
Pork Soybeancomplex
Corn Poultry Rice Cotton Milkproducts
Wheat Beef Sugar
Top 5 Exporters
Top 5 Importers
Top 5 exporters and importersShare by commodity (2017-2019)
Top net exporters: US, Brazil, Argentina, Canada, Australia, NZ, Indonesia, Thailand, IndiaTop net importers: China/HK, Japan, Korea, EU, Middle East, Mexico, US, Russia
Source: UN COMTRADE (2021), Insper Agro Global (2021).

WWW.INSPER.EDU.BR
How to achieve?
…with import restrictions and self-sufficiency policies?
Food Security Food Safety & Nutrition
AffordabilityLow Inflation
Sustainability
Trade is still very limited in the agri-food sector…
Top priority issues are challengingtrade-offs
WWW.INSPER.EDU.BR
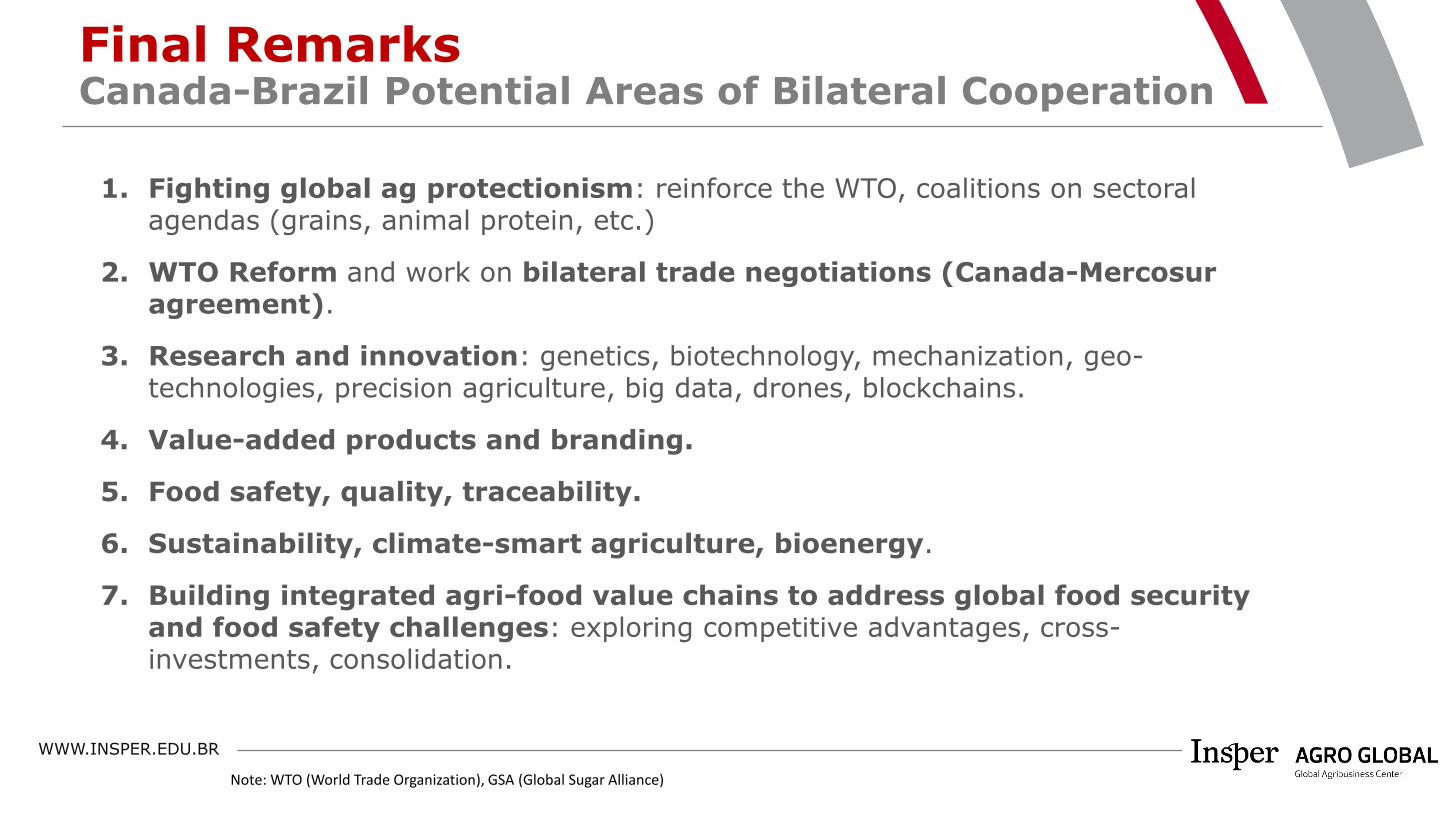
Final RemarksCanada-Brazil Potential Areas of Bilateral Cooperation
1. Fighting global ag protectionism: reinforce the WTO, coalitions on sectoral agendas (grains, animal protein, etc.)
2. WTO Reform and work on bilateral trade negotiations (Canada-Mercosur agreement).
3. Research and innovation: genetics, biotechnology, mechanization, geo-technologies, precision agriculture, big data, drones, blockchains.
4. Value-added products and branding.
5. Food safety, quality, traceability.
6. Sustainability, climate-smart agriculture, bioenergy.
7. Building integrated agri-food value chains to address global food security and food safety challenges: exploring competitive advantages, cross-investments, consolidation.
Note: WTO (World Trade Organization), GSA (Global Sugar Alliance)

WWW.INSPER.EDU.BR
Thank you / Obrigado
Marcos Jank
https://www.insper.edu.br/pesquisa-e-conhecimento/centro-de-agronegocio-global/