braveheart investment group plc portfolio service braveheart’s assisted portfolio service provides...
TRANSCRIPT

The Cherrybank CentreCherrybank GardensPerthPH2 0PFUnited Kingdom
[email protected]: +44 (0)1738 587555F: +44 (0)1738 587666
www.braveheartinvestmentgroup.co.uk
Bra
veh
eart In
vestm
en
t Gro
up
plc A
nn
ual R
epo
rt and
Acco
un
ts 2011
Annual Report and Accounts
Braveheart Investment Group plc
2011

Assisted portfolio serviceBraveheart’s assisted portfolio service provides direct investment opportunities for investors (often under EIS for UK based investors), into high growth companies with the added comfort of investing alongside or being led by an experienced fund management group.
Self-build portfolio service Working with a diverse range of young dynamic companies in need of growth and expansion capital, Envestors screens and introduces the best and most exciting investment opportunities to its investor network. Investors actively build and monitor their portfolios at their own speed.
Fund managementWe offer a fully managed fund service for public sector funding and for the busy or less experienced private investor. All aspects are managed for the investor to a pre-agreed investment mandate.
MAkInG And MAnAGInG
InveStMentSEstablished in 1997, Braveheart Investment Group plc is an AIM listed investment management business (AIM:BRH) headquartered in Perth, Scotland. Aside from managing investments made directly from the Group’s balance sheet, we specialise in building tax efficient portfolios for business angels, high net worth individuals and family offices, and have a track record of producing market leading returns for our clients.
Our two most recent acquisitions underpin our current service offering: in 2009 we acquired Viking Fund Managers which manages the Viking Fund and the Viking Loan Fund and which operates the Yorkshire Association of Business Angels, and in October 2010 we acquired Envestors which is headquartered in London and runs a number of regional private investor networks. The Group now provides a full suite of investment offerings to investors and funding solutions to high-growth companies from offices in Perth, London, Yorkshire, Manchester, Jersey and Dubai.
Our business is based on the following principles:
Growth, Support, Service and Partnership
directors, Secretary, Registered Office and Advisers
Directors Garry S Watson OBE CA, Chairman (n) (r)
Geoffrey C B Thomson, Chief Executive Officer Carolyn Smith BA Hons ACIS, Chief Investment Officer Colin C Grant BCom CA, Chief Financial Officer Edward B Cunningham CBE FRSE, Non-executive Director (a) (n) (r)
J Kenneth Brown BA CA, Non-executive Director (a) (r)
Jeremy H Delmar-Morgan MA MSI, Non-executive Director (a)
(a) Member of Audit and Risk Management Committee (n) Member of Nominations Committee (r) Member of Remuneration Committee
Secretary Colin C Grant BCom CA
Registration Number SC247376
Registered Office The Cherrybank Centre Cherrybank Gardens Perth PH2 0PF Telephone +44 (0) 1738 587555
Website www.braveheartinvestmentgroup.co.uk
Advisers Registrar Nominated Adviser and Broker Capita Registrars Ltd Seymour Pierce Limited Northern House 20 Old Bailey Woodsome Park London Fenay Bridge EC4M 7EN Huddersfield HD8 0LA Solicitors Solicitors Semple Fraser LLP Maclay Murray & Spens LLP 80 George Street Quartermile One Edinburgh 15 Lauriston Place EH2 3BU Edinburgh EH3 6EP
Principal Bankers Principal Bankers HSBC Bank plc Bank of Scotland plc 76 Hanover Street Pentland House Edinburgh 8 Lochside Avenue EH2 1HQ Edinburgh EH12 9DJ
Auditors Grant Thornton UK LLP 1-4 Atholl Crescent Edinburgh EH3 8LQ
Designed and produced by corporateprm, Edinburgh and London.www.corporateprm.co.uk
61COMPANY INFORMATION |
Braveheart Investment Group | Annual Report and Accounts 2011
Braveheart Investment Group | Annual Report and Accounts 2011
KEY POINTS | Overview | 01
Overview
01 Key Points02 Chairman’s Statement
Business Review
04 Chief Executive Officer’s Report
06 Chief Financial Officer’s Report08 Chief Investment Officer’s
Report11 Our services
Governance
14 Directors’ Report18 Board of Directors and
Management Board20 Corporate Governance
Statement23 Directors’ Remuneration
Report26 Independent Auditors’
Report
Accounts and Notes
27 Consolidated Statement of Comprehensive Income
28 Consolidated Statement of Financial Position
29 Company Statement of Financial Position
30 Consolidated Statement of Cash Flows
31 Company Statement of Cash Flows
32 Consolidated Statement of Changes in Equity
33 Notes to the Financial Statements
58 Notice of Annual General Meeting
61 Company Information
Operational
Financial
Events since the year end
• AcquiredLondon-basedEnvestorsLtd
• EnlargedGroupnowhasofficesinPerth,Yorkshire,LondonandJersey,withfranchiseoperationsinManchesterandDubai
• Threedifferentlevelsofinvestmentservicenowofferedtobusinessangels,highnetworthandfamily office investors
• Envestorsled£3.69mfinancingforclientcompanies since acquisition
• InstigatedbankingpartnershipwithHSBC Bank plc
• Furtherdirectinvestmentof£1.66mbytheGroup and its clients made into 11 portfolio companies
• Clientexitportfolioshowinganinternalrateofreturnof30%(2010:30%)
• Overallclientportfolio(beingbothrealisedandunrealisedinvestments)showinganinternalrateofreturnof22%(2010:23%)
• FirstexitofaninvestmentfundedbyIPOproceeds,generatingarealisedgainof£168,000(2010:£nil)
• Investmentmanagementandconsultancyfeeincomeincreases63%to£926,000(2010:£568,000)
• Excludingunrealisedportfoliomovements,thelossbeforetaxfell20%to£862,000(2010:£1.08m)
• Netunrealisedlossonrevaluationofportfolioinvestmentsof£444,000(2010:gainof£316,000)
• Includingunrealisedportfoliomovements,thelossbeforetaxincreases70%to£1.31m(2010:£767,000)
• Cashutilisationintheyeardecreasesto£831,000(2010:£1.75m)
• Cashbalancesof£643,000(2010:£1.47m)
• Netassetspershareof30.66pence(2010: 40.25pence)
• Placed4,132,574sharesraising£950,000(beforeexpenses)
• Facilitatedthestrategicallyrequiredexitoftwomajor institutional shareholders
• VikingFundManagersLtdappointedbyNorthEast Access to Finance to develop a network of angel investors operating across the North East of England
• Envestorsledafurther£1.95mfinancingforclient companies
DisclaimerThisAnnualReportcontainscertainforward-lookingstatementswhichreflecttheknowledgeofandinformationavailableto,thedirectorsatthedateofpreparationofthisAnnualReport.Bytheirnature,thesestatementsinvolveriskanduncertaintybecausetheyrelatetoevents and depend on circumstances that may or may not occur in the future and there are anumberoffactorsthatcouldcauseactualresultsordevelopmentstodiffermateriallyfromthoseexpressedorimpliedbytheseforward-lookingstatements.

Braveheart Investment Group | Annual Report and Accounts 2011
| Overview | CHAIRMAN’SSTATEMENT02
Four Years OnThis is my fifth Chairman’s Statement since we raised capital from institutional investors and introduced our shares to trading on the AIM Market in March 2007.
The purpose of that move was to facilitate the growth of our fee business, both in terms of the depth of services that we provide for informal investment and our geographical reach, and to finance increased investment from our own balance sheet into our portfolio companies.
Soon after listing we announced our first acquisition, that of W L Ventures (latterly renamed Caledonia Portfolio Realisations), and in 2009 we expanded into Yorkshire and the North East of England through the acquisition of Viking Fund Managers. In October 2010, as reported in our recent Interim Statement, we extended our activities into London, the Home Counties and the Channel Islands by acquiring Envestors with its proven success in managing private angel investment.
We have also built our directly held investment portfolio and during the year we saw the first realisation of an investment made from our IPO proceeds.
Post year end, in June, we completed a re-structuring of our capital base, placing the holdings of two major institutional shareholders and at the same time raising approximately £950,000 (pre-expenses) of new capital to support our operations and growth.
The implications of Envestors joining the Group and the changes in our capital structure are explained below and in reports from my executive colleagues.
ResultsTotal fee-based revenue and finance income for the year ended 31 March 2011 increased to £958,000 (2010: £602,000). Additionally, we recorded a gain on the realisation referred to above of £168,000. Total operating costs increased 18% to £1,988,000 (2010: £1,685,000), resulting in a loss before unrealised movements in portfolio investments of £862,000 (2010: £1,083,000).
However, one of the challenges we face in presenting our figures is that bottom line results may include short term movements in the valuation of unrealised portfolio investments that do not reflect management’s expectations on ultimate disposal. Several of our portfolio investments were refinanced on terms adversely affecting our current carrying value, while some under-performing investments were culled from the portfolio during the year. The net unrealised movement on the revaluation of portfolio investments was a loss of £444,000 compared with a gain of £316,000 in 2010, disguising performance at an operating level.
After taking account of portfolio movements, the loss after tax was £1,306,000 (2010: £767,000) equating to a loss per share of 9.06 pence (2010: 5.61 pence).
I have pleasure in providing shareholders with my Statement which accompanies the results of the Group for the year ended 31 March 2011.

Braveheart Investment Group | Annual Report and Accounts 2011
03 CHAIRMAN’SSTATEMENT | Overview |
Cash utilisation in the year decreased to £831,000 (2010: £1.75m) and the Group ended the year with cash balances of £643,000 (2010: £1.47m), which were subsequently increased upon completion of our capital placing.
Capital StructureOver the past year we have been conscious of the need to resolve the future of two major shareholdings, that of Bank of Scotland, which had been acquired by Lloyds Banking Group plc, and of the former Kenmore Property Group. As noted in my opening remarks, we successfully concluded arrangements for the placing of these shares at the same time as a placing of new shares, and we are pleased to welcome a number of new investors to the Group.
Next StepsThe acquisition of Envestors is an important step in the implementation of our growth strategy, both in strategic terms and specifically to spearhead an increase in Group income. Braveheart has faced the classic situation of a small company requiring to break out of the confines of its earlier existence, namely the need to expand and develop its executive team, with a consequent increase in overhead costs, to enable that to be achieved. The integration of Envestors is well advanced, as our CEO describes in his Report, and the focus of our effort is now to use the greater capacity of the Group to achieve a material increase in fee income.
Investment PortfolioThere have been some frustrations in the management of our portfolio over the past year. A disposal of our holding in Im-Sense Ltd, the photographic enhancement software business, resulted in a pleasing investment gain but the progress of certain other investments has been slower than we had hoped for. Nonetheless my colleagues and I are confident that, taken as a whole, the portfolio is robust, with a number of companies exhibiting impressive growth and we anticipate that further realisations will be achieved in the future.
Board, Management and Staff There were no changes in our Board of Directors during the year.
Braveheart is fortunate in having a loyal and dedicated management and staff who have worked skilfully on various initiatives that have been undertaken. It is a tribute to them that we have enjoyed a further year during which compliance requirements have been scrupulously observed and I would like to thank everyone for their hard work.
ProspectsThe next year will not be an easy one, as prospects for economic growth in our home market remain muted. Valuable foundations for growth have been laid, which we believe gives us the platform that we need to expand, and we will seek to utilise them to the full. At the same time we will nurture our investment portfolio with the expectation that good realisations will be secured.
Annual General MeetingThe notice regarding the business to be dealt with at the Company’s Annual General Meeting, to be held on 15 September 2011, is set out on pages 58 to 60. In particular I would like to draw your attention to Resolution 6 which renews the directors’ authority to allot up to 5,784,314 new shares for cash without reverting to the shareholders for further approval. This authority provides the Group with the flexibility to take advantage of expansion opportunities and to satisfy liquidity requirements. Your directors are unanimously in favour of Resolutions 1 - 6 (inclusive), which they consider to be in the best interests of the shareholders as a whole. Accordingly, your directors recommend shareholders to vote in favour of these resolutions, as they intend to do in respect of their own beneficial shareholdings. I look forward to welcoming those shareholders who are able to attend.
Garry S WatsonChairman
“The integration of Envestors is well advanced and the focus of our effort is now to use the greater capacity of the Group to achieve a material increase in fee income. My colleagues and I are confident that, taken as a whole, the portfolio is robust, with a number of companies exhibiting impressive growth and we anticipate that further realisations will be achieved in the future. Valuable foundations for growth have been laid, which we believe gives us the platform that we need to expand and we will seek to utilise them to the full. At the same time we will nurture our investment portfolio with the expectation that good realisations will be secured.”

04
Braveheart Investment Group | Annual Report and Accounts 2011
| Business Review | CHIEFExECuTIVEOFFICER’SREPORT
We have a coalition government which has been in power for a little over a year and which is firmly behind the need to encourage investment in Small and Medium Sized Enterprises (SMEs) in order to deliver sustainable economic recovery. This has been evidenced by a number of new or extended financing initiatives announced by HM Treasury and/or the Department for Business Innovation and Skills (BIS): these include enhanced Enterprise Investment Scheme (EIS) tax breaks, a new Business Angel Co-investment Fund for England, an extension of the Enterprise Finance Guarantee loan scheme and more public money for Enterprise Capital Funds. All of these are expected to impact our business in a positive way and I give further details below.
There were two landmark events for us in the last year: The first was that we achieved our maiden exit of an investment funded by IPO proceeds. When we came to the market in 2007 we did so on the back of the track record of investment returns that we had produced for clients. The IPO gave us the cash to invest from our own balance sheet and hence build up a key asset in terms of shareholder value. Since the investments were made we have nurtured the portfolio with particular emphasis on what we term our ‘gazelle’ companies. It was gratifying that we were able to achieve an exit from an investment that had its own challenges and was not in the gazelle category, at a good price in July last year. Our portfolio is now maturing and we are looking forward to more exits in the foreseeable future. The recent uptick in technology valuations is helpful to our case and whilst interim ‘fair value’ measurements of assets for accounting purposes may not always look attractive (as discussed below), it is the value on exit that matters.
The second event was the acquisition of Envestors. This was our third and largest acquisition to date and demonstrably scales our investment management business – one of our strategic aims as reported previously. As a group we now provide a comprehensive service offering across the early and growth stage venture capital market. This offering encompasses three key investor products for business angels, high net worth individuals and family offices, all of which utilise tax breaks provided by EIS: our assisted portfolio service, our self-build portfolio service and our fully managed fund service. We do not believe any other investment manager offers such a comprehensive service in the UK. In addition, we are active in the Channel Islands and we have a franchise business in Dubai. In total we now operate investment networks in Scotland, the North East of England (a recent contract award), Yorkshire, Manchester, London, the Channel Islands and Dubai. These networks are financed through a variety of means ranging from our own financial resources, contractual arrangements with the public sector and franchises.
We live in interesting times and much has happened to our company since I penned my last annual CEO report.
Braveheart Investment Group | Annual Report and Accounts 2011
05CHIEFExECuTIVEOFFICER’SREPORT | Business Review |
Since the year end we have completed a share placing (the Placing) which has provided additional capital of just under £1m to the Group. At the same time we managed to achieve an exit for two institutional shareholders who were required to realise their investment in the Group for strategic reasons. This Placing and the removal of the share ‘overhang’ gives us confidence going forward for two reasons: firstly it provides additional working capital and mitigates against us taking sub-optimal exits due to cash flow requirements. Secondly, we have introduced a new group of shareholders who are primarily family offices. These shareholders have joined us
because they have a strategic interest in the space we occupy and also see co-investment opportunities going forward. It is particularly pleasing that we raised a high proportion of the funding ourselves through our own contacts. We thank the new shareholders for their support and look forward to working with them.
I now turn to the financial performance of the business. The results are somewhat like the proverbial curate’s egg – good in parts. Whilst there are encouraging signs on fee income, which grew 63%, and at the operating level, where we reduced our losses by 20%, the carrying value of our portfolio has suffered and has led to an overall disappointing performance. As I note above, the carrying value of the portfolio may not be fully reflective of its future market potential and this is an ongoing issue we will continue to wrestle with. I believe we have controlled our cash well and geared it as much as possible given the financial climate.
Since acquiring Envestors we have enlarged the Management Board, and it now comprises the three Group executive directors (myself, Carolyn Smith and Colin Grant), the two directors of Viking Fund Managers (Andrew Burton and Viv Hallam) and the three directors of Envestors (being Oliver Woolley, Scott Haughton and Bob Taylor). This group meets monthly and, in addition to operational matters, it provides an important source of feedback on market opportunities for our Group plc Board.
At the start of this report I mentioned various government initiatives that are particularly aimed at SMEs. This is our marketplace and these initiatives will impact our business in a positive way: The Scottish Co-investment Fund has been operating since 2003 and the new £50m Business Angel Co-investment Fund for England is modelled on its Scottish counterpart. We were instrumental in establishing the former and, working closely with others, we have been instrumental in establishing the latter. Whilst the amount of money committed by the Government to the new fund is relatively modest, this is a start and it is up to us, as members of the advisory board of the fund, to make sure that it is an operational success.
Various welcome modifications were made to EIS in the budget – the most important of these was the increase by 50% in income tax relief and for every pound invested 30 pence can now be claimed back. EIS is now an asset class in its own right but it is not a ‘wrapped’ product and we still find that advisers have difficulty with it and are hesitant to recommend it to clients. More work needs to be done by industry bodies in promoting this highly effective scheme.
As an Enterprise Finance Guarantee approved lender we were pleased to see that the scheme has recently been extended in quantum and lifespan. We are looking at various scenarios whereby we might use this scheme to provide specialist finance to SMEs that would otherwise not be able to secure working or loan capital.
Our strategy for the next year is ‘more of the same’ but in an enlarged way. That means we will continue to grow our investment management business towards profitability, we will continue to look for value realisations from our portfolio and we will continue to grow our business. The last of these will be by a combination of increased geographic footprint, extension of our service offering and by way of M&A should opportunities present themselves.
In closing I would like to thank our staff for their continued commitment to the Group and their hard work over the year.
Geoffrey C B ThomsonChief Executive Officer
“We will continue to move our investment management business towards profitability, we will continue to look for value realisations from our portfolio, and we will continue to grow our business.”

06
Braveheart Investment Group | Annual Report and Accounts 2011
| Business Review | CHIEFFINANCIALOFFICER’SREPORT
OverviewFirstly, on 5 October 2010, the Company acquired the entire issued share capital of Envestors Ltd, a specialist corporate finance advisory business based in London and the results for the year include those of Envestors since the acquisition date.
Fee based revenue, which is now generated by the group’s three principal operating companies Braveheart Ventures Ltd (BVL), Viking Fund Managers Ltd (VFM) and Envestors, and comprises investment management revenue and consultancy income, grew 63% during the year.
Investment management revenue is generated by BVL and VFM from a number of sources including portfolio companies, clients and other co-investors and is directly related to the number and value of investments made in any given period, and from fund management contracts. Envestors also generates success fees on sums raised for its client companies.
Consultancy income is generated by VFM from the provision of business advisory services to SMEs and local authorities, and by Envestors from the provision of corporate finance advisory services to companies seeking to raise finance.
Reflecting the Group’s strategic expansion, employee numbers and related employee benefits expense together with other operating costs have risen in the year, although strict cost control has limited the aggregate increase to 18% and like for like costs fell 8%.
Secondly, the Group makes investments from its own cash resources and during the year we saw the first profitable realisation of an investment funded by our IPO proceeds. However a number of other portfolio companies were refinanced on terms disadvantageous to the Group or experienced trading difficulties, and we incurred a substantial unrealised revaluation loss.
Excluding unrealised portfolio movements, our loss before tax fell, although the aggregate effect of all the above factors, including unrealised portfolio movements, was a 26% decrease in total income and an increase in the annual loss with a consequent reduction in net assets.
Income statementIncomeFee based revenue for the year has risen 63% to £926,000 from £568,000.
Investment management revenue, including £148,000 (2010: £nil) success fees generated by Envestors, was £678,000 (2010: £483,000).
Consultancy income, earned from the provision of business advisory services by VFM and by the provisions of corporate finance services by Envestors, was £248,000 (2010: £85,000).
Finance income was £32,000 (2010: £34,000), a decrease in bank interest offset by an increase in interest from certain loan note investments.
At the start of the year, the Group’s own active investment portfolio of 27 companies was valued at £4.53m. During the year the Group made cash investments totalling £113,000 (2010: £557,000) into one new and five existing portfolio companies. Of this cash investment, £78,000 (2010: £247,000) was made by way of equity and £35,000 (2010: £310,000) by way of convertible loan notes. One realisation was made in the year generating a gain on disposal of £168,000 (2010: £nil). Four companies instigated insolvency proceedings and three others were refinanced on
The financial statements for the year ended 31 March 2011 reflect the impact of the two landmark events described in the CEO Report.

Braveheart Investment Group | Annual Report and Accounts 2011
07 CHIEFFINANCIALOFFICER’SREPORT | Business Review |
terms adversely affecting the Group’s current carrying value. At 31 March 2011 the fair value of the active investment portfolio of 23 companies was £3.98m, resulting in an aggregate unrealised revaluation loss of £464,000 (2010: unrealised revaluation gain £611,000). This comprises an unrealised gain of £18,000 (2010: unrealised gain £19,000) on listed equity investments, an unrealised loss of £521,000 (2010: unrealised gain of £735,000) on unlisted equity investments and an unrealised gain of £39,000 (2010: loss of £143,000) on convertible loan notes as previously impaired loan notes were converted into equity.
The Group’s investments are held either by the Company, Strathclyde Innovation Fund LP (which made its first investments in 2010), or Caledonia Portfolio Realisations Ltd (CPR) (acquired on a contingent consideration basis in 2007). Offsetting the aggregate unrealised loss is a decrease in contingent consideration of £20,000 (2010: increase in contingent consideration of £295,000) payable on future exit values of CPR portfolio companies.
Total income for the year ended 31 March 2011 including realised gains and unrealised revaluation losses was £682,000, a decrease from £918,000 in 2010.
Operating costsWithin the overall context of the group’s expansion strategy, underlying cost control and cash management remain priorities for the Board.
Like for like operating costs fell 8% from 2010, although with the mid-year acquisition of Envestors aggregate annual costs increased to £1.99m against £1.68m in 2010. Employee benefits expense (excluding share based compensation of £35,000 (2010: £49,000)) was restricted to £1.26m (2010: £1.18m) despite an increase in average headcount to 22 (2010: 19). Other operating and finance costs, which included £45,000 (2010: £nil) fees and expenses associated with the acquisition as required under IFRS 3 Revised and £6,000 amortisation of intangible assets (2010: £nil), increased to £697,000 (2010: £455,000).
LossExcluding unrealised portfolio movements, the loss before tax fell 20% to £862,000 (2010: £1.08m). The total loss after tax and amounts attributable to minority interests increased to £1.31m (2010: £776,000), equivalent to a loss per share of 9.06 pence (2010: 5.61 pence).
Financial positionNet assets at 31 March 2011 were £4.52m (2010: £5.60m), equivalent to 30.66 pence per share (2010: 40.25 pence). The decrease reflects the excess of operating costs over fee income and the adverse movement on the valuation of our investment portfolio.
The Group’s net assets also include goodwill of £987,000 (2010: £327,000) and intangible assets of £122,000 (2010: £nil). Goodwill arises from the acquisitions of VFM and Envestors, the latter also generating intangible assets relating to an evaluation of their brand and database of high net worth investor contacts. The carrying value of goodwill has been reviewed during the year and in light of current projections of future performance the directors do not believe the assets are impaired. Intangible assets are amortised straight line over ten years. Both these acquisitions were made on a contingent consideration basis dependent on their future performance and for which the provision at the year end is £698,079 (2010: £166,738).
At the year end the Group had cash balances of £643,000 (2010: £1.47m) and no material borrowings. While the strategic expansion of the Group continued during the year, cash utilisation decreased to £831,000 (2010: £1.75m) and comprised £30,000 (2010: £176,000) relating to the acquisition of Envestors, £113,000 (2010: £557,000) invested in portfolio companies, £1.00m (2010: £1.01m) used in other operating activities, all offset by £315,000 (2010: £nil) received on the realisation of an investment.
Events since the year endWhile short term valuations may fluctuate, the realisation during the year was a positive endorsement of the potential of our investment portfolio. However the timing and quantum of future exits cannot be accurately predicted. Accordingly the directors deemed it prudent to raise additional capital and on 24 June 2011 we completed a placing of 4,132,574 new shares raising approximately £950,000 (before expenses) to augment cash balances and strengthen our balance sheet.
Colin C Grant Chief Financial Officer
A summary analysis of the Group’s performance is:
2011 2010 £’000 £’000
Investment management revenue 678 483Consultancy income 248 85
Fee-based revenue 926 568Finance income 32 34
Income before portfolio movements 958 602Realised gain on disposal of investments 168 –Net unrealised movement arising on the revaluation of investments (444) 316
Total income 682 918
Employee benefits expense (including share based compensation) (1,291) (1,230)Other operating and finance costs (697) (455)
Total costs (1,988) (1,685)
Loss before tax (1,306) (767)
Loss after tax and amount attributable to minority interest (1,306) (776)
Loss per share 9.06 pence 5.61 pence
Opening cash balance 1,474 3,222Increase in portfolio investments (113) (557)Decrease in relation to acquisition of Envestors / VFM (46) (174)Utilised in other activities (672) (1,017)
Closing cash balance 643 1,474
Net assets 4,522 5,601
Net assets per share 30.66 pence 40.25 pence

08
Braveheart Investment Group | Annual Report and Accounts 2011
| Business Review | CHIEFINVESTMENTOFFICER’SREPORT
Investment ActivityWe were therefore pleased to be able to report in July last year the news of the sale of Im-Sense, an image signal processing technology spin-out from the University of East Anglia. Having first invested in the company in 2008 we realised a cash consideration in excess of twice our aggregate investment of £150,000.
In the same month we completed an investment into our newest addition to the portfolio - mLED - a spin-out from the University of Strathclyde’s prestigious Institute of Photonics. Having acquired exclusive rights to the Institute’s micro light emitting diode technology, mLED delivers unique solid-state optical micro-projection systems (‘mini light engines’) to its initial target market of life sciences. The features of micro light emitting diodes (LEDs) make them particularly useful for miniature applications such as the field of neuroscience.
Throughout the year the Group and its clients made a further 16 rounds of funding into eleven portfolio companies - Biopta, Conjunct, Traak Systems, NiTech Solutions, AppShare, Tayside Flow Technologies (TFT), Elonics, Design LED Products (DLP), Pyreos, Atlas Genetics and mLED. The Group itself invested an aggregate £113,000 into six of these companies. Including the Group’s clients, our companies received other funding of c£12m including substantial funds from venture capital funds, reflecting the sign of a maturing portfolio. The terms attached to certain of these refinancings led to a reduction in the Group’s carrying value of the respective companies at the year end but we welcome the increased capital base and breadth of experience brought by new investors which should in turn lead to increased shareholder value in the fullness of time. One notable investment was in DLP which first received investment of c£50,000 in 2004 from the Group and its clients. In January 2011 a funding package of £1.1m was raised for this company that has developed and patented technology to embed LEDs within printed light-guide devices. This enables thin, flexible, high efficiency light panels and displays suitable for a range of applications from consumer electronic devices to large area LED lighting and liquid crystal display (LCD) TV backlighting. The company attracted the interest of Siemens’ Technology-to-Business Center which invests in early stage technology companies whose inventions or innovations could have a significant impact on the future business of Siemens, including Siemens Group company OSRAM - a leading global lighting and LED supplier. DLP aims to enter the high growth lighting and LCD TV backlighting market where it will seek to displace traditional and emerging LED technologies.
I said last year that certain of our companies were exhibiting signs of exit potential that may be realised if the right circumstances and market conditions prevailed.
Braveheart Investment Group | Annual Report and Accounts 2011
09 CHIEFINVESTMENTOFFICER’SREPORT | Business Review |
Other companies in our portfolio that have a global reach include: • Bioptawhichhasestablisheditselfasaworldleaderinthe
use of fresh human tissues to better predict drug activity prior to clinical trials - 90% of Biopta’s sales for the financial year 2010 were outside the UK;
• TFThasdistributorsworldwideforitsinnovativeperipheralvascular grafts with primary markets in Europe and the USA;
• Elonics,thefablessmixed-signalsemiconductorcompany,has continued to expand its global reach by opening up a new Asia Technical Support Centre in Taiwan offering customers the opportunity to locally evaluate, test and qualify new designs;
• Pufferfishhasbeencreatingastirwithitssphericaldisplaysystem with a recent feature on Channel 5’s Gadget Show and a new centrepiece display at the London Stock Exchange being unveiled by the Chancellor in May. The PufferSphere can also be found at Disney’s Epcot® Centre in Florida for a ‘Smarter Planet’ exhibition from Walt Disney Imagineering and IBM; and
• EctoPharmahassuccessfullycompletedaresearchanddevelopment programme using its proprietary technology for a head lice application culminating in a European-wide licence agreement with leading independent pharmaceutical manufacturer Thornton & Ross. Plans are now underway for a summer release of a new head lice product initially in the UK.
At the end of the year under review our portfolio comprised investments in 23 companies after the successful sale of Im-Sense, the loss of four companies (NXVision, PSI Electronics, Scensive Technologies and Spiral Gateway) some of which struggled with market demand for their respective technologies and ultimately entered into insolvency proceedings, and the introduction of mLED as noted above. The year end portfolio is shown on page 10.
Viking Fund Managers (VFM)Throughout the year VFM continued to manage the Viking Fund and the Viking Loan Fund and operate the Yorkshire Association of Business Angels. Through VFM twelve companies received £538,000, with a further £378,000 being leveraged in from elsewhere.
Since the year end we were pleased to announce that VFM have been appointed by North East Access to Finance to develop a network of angel investors in the North East of England.
EnvestorsDuring the year under review we acquired London-based Envestors which matches high net worth individuals with companies seeking funding in the £20,000 to £5m bracket. Through Envestors, in the period 5 October 2010 to 31 March 2011, ten companies received £2.5m funds from introductions made by Envestors, with a further £1.2m being leveraged in from elsewhere. The most significant of these was in respect of Chargemaster, the premier supplier of electric vehicle charging solutions, which raised an aggregate of £1.8m.
Portfolio ReturnsDuring the year the Group’s own portfolio showed an unrealised loss of £464,000 before the movement on contingent consideration of £20,000 (2010: unrealised revaluation gain of £611,000) with the loss partly being the result of adverse terms on refinancings as noted above. Our rebased client exit portfolio (being a portfolio where all exited investment returns are modelled since Braveheart’s inception in 1997) showed an IRR of 30% while the overall client portfolio (modelling both exited and unexited investment returns) is showing a return of 22%.
In summation, we continue to provide funding and support to our portfolio companies and are committed to driving shareholder value by realising the potential that we see in our maturing portfolio.
Carolyn SmithChief Investment Officer

10
Braveheart Investment Group | Annual Report and Accounts 2011
| Business Review | CHIEFINVESTMENTOFFICER’SREPORT
Group’s Portfolio
The Group’s portfolio (including the Caledonia Portfolio Realisation (CPR) and Strathclyde Innovation Fund (SIF) portfolios) comprised 23 companies at the year end:
Portfolio Company Description of business Company portfolio
AppShare Ltd¹ Web collaboration software design
Atlas Genetics Ltd Rapid ‘point-of-care’ molecular diagnostic equipment
Biopta Ltd Contract research services for drug and tissue measurement
The Capital Pub Company plc Purchase and operation of pubs
Cascade Technologies Ltd Laser-based equipment to detect presence of gases, explosives, etc
Conjunct Ltd Optical communications components
Convivial London Pubs plc Purchase and operation of pubs
Design LED Products Ltd Lighting display technology based on LEDs
Dimensional Imaging Ltd 3D and 4D image capture systems
EctoPharma Ltd² Therapeutic healthcare pesticides and cancer therapeutics
Elonics Ltd Multi-band radio frequency (RF) IC products
MicroStencil Ltd Manufactures stencils for microelectronics sector
mLED Ltd1 Solid-state optical micro-projection systems
NiTech Solutions Ltd Designs manufacturing solutions for chemical and process industries
Phase Focus Ltd Lensless microscope technology
Pufferfish Ltd 360° display solutions principally for promotional activities
Pyreos Ltd Infrared sensor arrays and components for commercial applications
Tayside Flow Technologies Ltd Cardiovascular medical devices
Traak Systems Ltd Intelligent self-learning RFID identification and sensor network solutions
CPR portfolio
Bloxx Ltd Web filtering and internet filtering software
Leading Software Ltd IT services
Scalar Technologies Ltd Thin film measurement
Verbalis Ltd Language translation software
¹ Also a SIF portfolio company
² Also a CPR portfolio company

Braveheart Investment Group | Annual Report and Accounts 2011
11 OuRSERVICES | Business Review |
Assisted portfolio service
Braveheart provides direct investment opportunities for investors to build a portfolio of high growth companies with the added comfort of investing alongside, or being led by, an experienced investment management group.
Braveheart typically offers six to twelve such opportunities each year mainly in companies where there is potential for significant growth through the successful commercialisation of intellectual property. The companies are selected from the various routes available within the Group including the existing portfolio of companies noted on page 10. Most opportunities are structured to qualify for tax relief under the Enterprise Investment Scheme (where appropriate). We undertake thorough due diligence on each new company and the results of our diligence are incorporated in the form of a private placing memorandum (PPM). The PPM seeks to address all aspects of the investment opportunity ranging from technical evaluation, market review, financial appraisal, shareholding structure, pricing and exit expectations. We also arrange for presentations from management, providing the opportunity for interaction between management and potential investors.
By virtue of our FSA authorisation we are able to hold client money and client assets which means we usually lead the book-building process. We also are able to utilise the services of our in-house legal counsel to complete the legal paperwork leading up to completion of the deal. Post investment, portfolio companies are actively managed to exit by our portfolio team and we report on progress to investors on a regular basis.
Since 1997 Braveheart has completed over 100 rounds of funding and is showing market-leading returns as demonstrated on page 9.
The Capital Pub Company PLC

12
Braveheart Investment Group | Annual Report and Accounts 2011
| Business Review | OuRSERVICES
Envestors is dedicated to assisting dynamic companies source growth capital from its business angel networks in London and the Home Counties, Jersey/the Channel Islands, Manchester and Dubai.
Self-build portfolio service
Authorised by the Financial Services Authority to provide corporate finance advice and focusing on companies seeking to raise up to £5m, Envestors offers screened companies to the proactive investor who wants to build and manage his or her own investment portfolio.
To date Envestors has helped more than 90 companies, from a diverse range of sectors/locations, raise in excess of £35m.
Envestors provides to the company seeking finance:
•Assistancepriortoembarkingonfundraisingactivitiesincluding high level due diligence, deal structuring, valuation, quantum and type of funding commensurate for the stage of business
•Preparationofmarketingmaterial,presentationcoaching,investor presentation events and tailored meetings
•IntroductionstotheEnvestorsprivateinvestornetworkwhichcomprises more than 700 private investors, 20 family offices and a range of funds and venture capital sources
•Executiveandnon-executivedirectorplacementservice
Envestors provides to the investor:
•Pre-screenedopportunities,manyeligiblefortaxreliefunderthe Enterprise Investment Scheme
•Bi-monthlyinvestorbulletinshowcasingcurrentopportunities
•Invitationstocompanyinvestmentpresentationevents
•Opportunitytoparticipateincompaniesviaplacementservice

Braveheart Investment Group | Annual Report and Accounts 2011
13 OuRSERVICES | Business Review |
Fund management
Braveheart is an experienced fund manager and has a long history of managing both public sector funds and discretionary funds for the busy or less experienced private investor.
In 2004 our subsidiary Viking Fund Managers (VFM) launched and managed the £4m Viking Fund for predominantly early-stage, technology-rich companies based in Yorkshire. Capital was provided by the Department for Business Innovation and Skills (BIS) under its Early Growth Fund initiative and was matched with more than £4m from sources identified by VFM including investment from business angels in the Viking Club, a subset of the Yorkshire Association of Business Angels, run by VFM. This was followed in early 2009 by the provision of £1m loan funding from BIS: the Viking Loan Fund, also managed by VFM, was set up to protect jobs in viable SMEs threatened by a lack of working capital.
Braveheart has also been a leading partner of the £72m Scottish Co-investment Fund (SCF) since its establishment by Scottish Enterprise (SE) in 2003. The SCF was designed to increase the amount of risk money invested in SMEs in Scotland and since 2004, Braveheart has drawn down matching co-investment funding from SCF of c£9m into 26 companies over multiple rounds of funding. SE also runs other funds aimed at Scottish SMEs at various stages in their lifecycle: the Scottish Seed Fund
and the Scottish Venture Fund, which have been used to match c£1m into Braveheart companies.
Co-investment is a theme that runs through the funds that Braveheart has set up and managed in the past and which are largely aimed at the private investor.
We offer a fully managed fund service from initial investment to exit and all aspects are managed for the investor to a pre-agreed investment mandate. Early funds included our SMART Equity Fund to support the development of early stage investment opportunities rich in intellectual property from a number of universities/science parks in Scotland. This fund was fully utilised in 2006 and was followed by a second fund built on the same principles, the Alpha EIS Fund, which is close to being fully invested.
Meanwhile our active funds are the Strathclyde Innovation Fund, which is in its investment phase, and our most recently established fund, the Viking Growth Fund:
Strathclyde Innovation Fund
•£4.5mfundestablishedin2008asadedicatedfundforspin-out companies or licence opportunities from the University of Strathclyde
•PartnersincludetheGroup,theUniversityofStrathclydeandalumni of the University together with matched funding from SCF
•Todatefourroundsoffundingofc£335,000intheaggregatehas been invested into four companies
The Viking Growth Fund
•Newfundannouncedin2011tobuildadiversifiedportfolioof dynamic young companies that have market potential on a global scale
•Exposuretodifferentstagesofcompanyandindustrysectorswith a bias towards technology
•Benefitfromcertaintaxreliefs,subjecttopersonalcircumstances
•PortfoliomanagedbyBraveheartthroughtoexitonbehalfofinvestors
In addition to making new investments from our active funds we continue to manage the aforementioned funds to exit.

14
Braveheart Investment Group | Annual Report and Accounts 2011
| Governance | DIRECTOR’S REPORT
The directors present their report together with the audited financial statements for the year ended 31 March 2011.
Principal ActivitiesThe Group makes and manages investments in young, emerging British companies, specialising in building tax efficient portfolios for business angels, high net worth individuals and family offices. The Group also provides specialist advisory services.
Results and DividendsThe financial statements of the Group and the Company for the year to 31 March 2011 are set out on pages 27 to 57.
The Group’s consolidated loss for the year after tax was £1,306,132 (2010: £767,155), which has been transferred to reserves.
The directors do not recommend payment of a dividend for the year (2010: £nil).
Directors and their InterestsThe names of the directors who held office during the financial year are listed on page 61.
Biographical details of the directors who held office at the end of the financial year are shown on page 18.
No director had a material interest in any contract, other than their contract for services, during or at the end of the financial year that was significant to the Group’s business.
Directors’ Interests in SharesThe directors at 31 March 2011 and their interests in the share capital in the Company (all of which are held beneficially, other than 39,062 shares held by Garry Watson as executor for his late wife, 13,750 shares held in trust for Garry Watson’s children, 10,000 shares held in trust for Garry Watson’s grandchildren, and options to acquire ordinary shares which are detailed in the analysis of options included in the Directors’ Remuneration Report) are as follows:
At 31 March 2011 At 31 March 2010 Options over Options over Ordinary ordinary Ordinary ordinaryDirectors shares shares shares shares
G S Watson 328,177 – 328,177 33,454G C B Thomson 2,750,890 339,242 2,750,890 261,732C Smith 231,680 239,394 231,680 171,191C C Grant – 213,967 – 100,600E B Cunningham 493,275 – 493,275 13,360J K Brown – – – –J H Delmar-Morgan – – – –
Since 31 March 2011 G C B Thomson has sold 400,000 shares and surrendered 65,411 share options and C Smith has surrendered 47,382 share options. No notification of any other change in the above interests has been received in the period from 31 March 2011 to the date of this report.
Business Review and Future DevelopmentsAccompanying this Directors’ Report are the Chairman’s Statement, Chief Executive Officer’s Report, Chief Financial Officer’s Report, Chief Investment Officer’s Report, Corporate Governance Statement and Directors’ Remuneration Report.
A review of the business and the future developments of the Group is presented in the Chairman’s Statement on pages 2 and 3, the Chief Executive Officer’s Report on pages 4 and 5, the Chief Financial Officer’s Report on pages 6 and 7, and the Chief Investment Officer’s Report on pages 8 to 10, all of which forms part of this Directors’ Report by reference.
Braveheart Investment Group | Annual Report and Accounts 2011
15DIRECTOR’S REPORT | Governance |
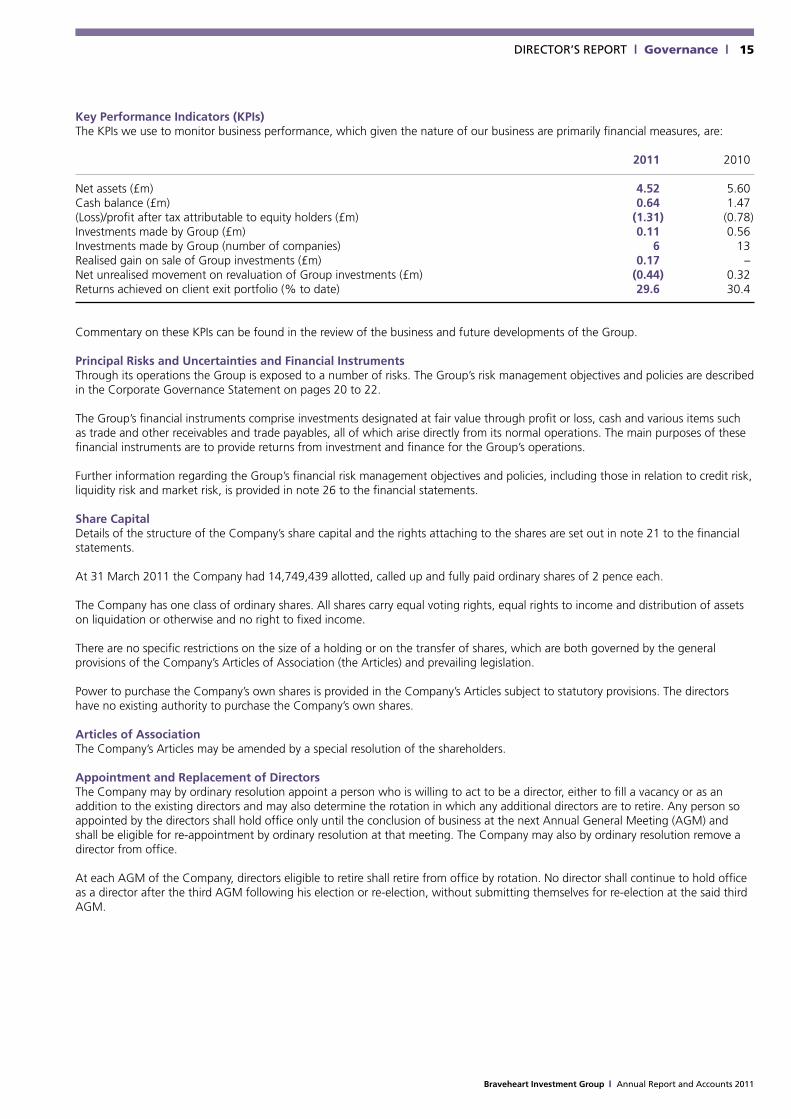
Key Performance Indicators (KPIs)The KPIs we use to monitor business performance, which given the nature of our business are primarily financial measures, are:
2011 2010
Net assets (£m) 4.52 5.60Cash balance (£m) 0.64 1.47(Loss)/profit after tax attributable to equity holders (£m) (1.31) (0.78)Investments made by Group (£m) 0.11 0.56Investments made by Group (number of companies) 6 13Realised gain on sale of Group investments (£m) 0.17 –Net unrealised movement on revaluation of Group investments (£m) (0.44) 0.32Returns achieved on client exit portfolio (% to date) 29.6 30.4
Commentary on these KPIs can be found in the review of the business and future developments of the Group.
Principal Risks and Uncertainties and Financial InstrumentsThrough its operations the Group is exposed to a number of risks. The Group’s risk management objectives and policies are described in the Corporate Governance Statement on pages 20 to 22.
The Group’s financial instruments comprise investments designated at fair value through profit or loss, cash and various items such as trade and other receivables and trade payables, all of which arise directly from its normal operations. The main purposes of these financial instruments are to provide returns from investment and finance for the Group’s operations.
Further information regarding the Group’s financial risk management objectives and policies, including those in relation to credit risk, liquidity risk and market risk, is provided in note 26 to the financial statements.
Share CapitalDetails of the structure of the Company’s share capital and the rights attaching to the shares are set out in note 21 to the financial statements.
At 31 March 2011 the Company had 14,749,439 allotted, called up and fully paid ordinary shares of 2 pence each.
The Company has one class of ordinary shares. All shares carry equal voting rights, equal rights to income and distribution of assets on liquidation or otherwise and no right to fixed income.
There are no specific restrictions on the size of a holding or on the transfer of shares, which are both governed by the general provisions of the Company’s Articles of Association (the Articles) and prevailing legislation.
Power to purchase the Company’s own shares is provided in the Company’s Articles subject to statutory provisions. The directors have no existing authority to purchase the Company’s own shares.
Articles of AssociationThe Company’s Articles may be amended by a special resolution of the shareholders.
Appointment and Replacement of DirectorsThe Company may by ordinary resolution appoint a person who is willing to act to be a director, either to fill a vacancy or as an addition to the existing directors and may also determine the rotation in which any additional directors are to retire. Any person so appointed by the directors shall hold office only until the conclusion of business at the next Annual General Meeting (AGM) and shall be eligible for re-appointment by ordinary resolution at that meeting. The Company may also by ordinary resolution remove a director from office.
At each AGM of the Company, directors eligible to retire shall retire from office by rotation. No director shall continue to hold office as a director after the third AGM following his election or re-election, without submitting themselves for re-election at the said third AGM.

16
Braveheart Investment Group | Annual Report and Accounts 2011
| Governance | DIRECTOR’S REPORT
Significant ShareholdingsAs at 31 March 2011, the following beneficial owners each held 3% or more of the Company’s issued share capital:
Name Number Percentage
G C B Thomson 2,750,890 18.65Kenmore Private Equity Ltd 2,500,000 16.95Uberior Investments plc1 1,338,410 9.07A T G Burton 613,818 4.16Securities Services Nominees Ltd2 503,411 3.41E B Cunningham 493,275 3.34K J Campbell 454,500 3.08
1 A subsidiary of Lloyds Banking Group plc
2 Beneficial owner being A M Threipland
Directors’ ResponsibilitiesThe directors are responsible for preparing the Annual Report and the financial statements in accordance with applicable United Kingdom law and those International Financial Reporting Standards (IFRS) as adopted by the European Union. The directors are required to prepare financial statements for each financial year, which give a true and fair view of the financial position of the Group and of the Company and the financial performance of the Group and cash flows of the Group and of the Company for that period. In preparing those financial statements, the directors are required to:
1 select suitable accounting policies and then apply them consistently;2 present information, including accounting policies, in a manner that provides relevant, reliable, comparable and understandable
information; 3 provide additional disclosures when compliance with the specific requirements in IFRS is insufficient to enable users to understand
the impact of particular transactions, other events and conditions on the Group and Company’s financial position and financial performance;
4 state that the Group and Company have complied with IFRS, subject to any material departures disclosed and explained in the financial statements;
5 prepare the financial statements on a going concern basis unless it is inappropriate to presume that the Company will continue in business; and
6 make judgements and estimates that are reasonable and prudent.
The directors are responsible for keeping adequate accounting records which disclose with reasonable accuracy at any time the financial position of the Group and of the Company and enable them to ensure that the financial statements comply with the Companies Act 2006. They are also responsible for safeguarding the assets of the Group and the Company and hence for taking reasonable steps for the prevention and detection of fraud and other irregularities.
Financial statements are published on the Group’s website in accordance with legislation in the United Kingdom governing the preparation and dissemination of financial statements, which may vary from legislation in other jurisdictions. The maintenance and integrity of the Group’s website is the responsibility of the directors.

Braveheart Investment Group | Annual Report and Accounts 2011
17DIRECTOR’S REPORT | Governance |
Creditor Payment PolicyThe Group’s policy is to:a) agree payment terms with each supplier when placing orders and b) adhere to the agreed terms.
The Group’s and Company’s average creditor payment period at 31 March 2011 was 30 days (2010: 30 days) and 28 days (2010: 26 days) respectively.
Political and Charitable DonationsIt is the Board’s policy not to make charitable and political donations which exceed £200. The Group did not make any such donations in the year (2010: £nil).
Disclosure of Information to AuditorsAll of the current directors have taken all the steps that they ought to have taken to make themselves aware of any information needed by the Group’s auditors for the purposes of their audit and to establish that the auditors are aware of that information. The directors are not aware of any relevant audit information of which the auditors are unaware.
AuditorsIn accordance with section 489 of the Companies Act 2006, a resolution proposing the re-appointment of Grant Thornton UK LLP will be put to the shareholders at the forthcoming Annual General Meeting.
On behalf of the Board
Colin C GrantCompany Secretary25 July 2011

Braveheart Investment Group | Annual Report and Accounts 2011
| Governance | BOARD OF DIRECTORS18
Left to right: J Kenneth Brown, Jeremy H Delmar-Morgan, Colin C Grant, Garry S Watson, Geoffrey C B Thomson, Carolyn Smith, Edward B Cunningham
Garry S Watson OBE CA ChairmanGarry is a former Managing Director of Hill Samuel Bank (Head of Investment Finance), Legal Services Ombudsman for Scotland, and a Governor and Deputy Chairman of the former Macaulay Land Use Research Institute in Aberdeen. He is currently a Director and Chairman of the Nominations and Governance Committee of Places for People Group, one of the largest UK providers of mixed tenure housing. Garry has been associated with the Group since 1997 and joined the plc Board on the Company’s inception in 2003.
Geoffrey C B Thomson (m) Chief Executive OfficerOne of the founders of Braveheart, Geoffrey is a well known business angel and deal maker. Geoffrey has written columns on investment for various national broadsheets and regularly speaks at business events in Scotland. Other than Braveheart, he is a Director of NESTech (the challenge fund of the universities of St Andrews, Dundee and Aberdeen) and sits on the advisory board of EPSRC (a steering body for innovation in UK Biotechnology). Geoffrey’s contribution to Scottish businesses was recognised by the receipt of a special Ernst & Young Entrepreneur of the Year (Scotland) award in 2008. Geoffrey joined the plc Board on the Company’s inception in 2003.
Carolyn Smith BA Hons ACIS (m) Chief Investment OfficerCarolyn has an honours degree in accountancy from the University of Stirling and is a Chartered Secretary. She spent five years working in insolvency before moving to business development and investment. After five years working in private equity with LINC Scotland, the national association for business angels in Scotland, she joined Braveheart as Chief Investment Officer in 2000 and was appointed to the Board in 2006.
Colin C Grant BCom CA (m) Chief Financial Officer and Company Secretary Colin joined the Board as Chief Financial Officer in October 2008, bringing with him experience of public markets and venture backed technology companies. Prior to joining Braveheart he was Chief Financial Officer and Company Secretary and before that Chief Operating Officer for Digital Bridges Ltd, a leading global provider of mobile entertainment software applications. Previous to that he worked as Finance Director and Company Secretary at VISION Group plc, a LSE-listed university spin-out company which pioneered CMOS imaging.
Edward B Cunningham CBE Senior non-executive DirectorEdward has UK and international industry experience. Latterly he was Director, Industry and Enterprise Development with the Scottish Development Agency. He has been chairman of a number of 3i-invested companies as well as other companies including the Scottish Exhibition and Conference Centre. He has also been a Director of TSB Bank Scotland and Watson & Philip. He is currently chairman of two companies and on the board of one other. Edward has been associated with the Group since 1999 and joined the plc Board on the Company’s inception in 2003.
J Kenneth Brown BA CA Non-executive DirectorKen is a non-executive director of several private and public companies, a member of the Court of the University of Glasgow and provides advisory services to clients in several sectors including real estate and renewable energy. He has extensive experience as finance director of listed and private groups in real estate, consumer goods, manufacturing and construction. He is a Chartered Accountant. Ken joined the Board in 2007.
Jeremy H Delmar-Morgan MA MSI Non-executive DirectorJeremy is Chairman of Allenby Capital and The Brendoncare Foundation, and is a Director of the London Symphony Orchestra Endowment Trust and Daylight Ltd. Previously Jeremy was a partner in Hoblyn, Dix & Maurice and a Director of Vickers Da Costa before joining Teather & Greenwood in 1979 where he went on to become Chairman. He subsequently joined Hichens, Harrison & Co as Chairman in 2004. Jeremy joined the Board in 2008.
(m) Member of Management Board

Braveheart Investment Group | Annual Report and Accounts 2011
MANAGEMENT BOARD | Governance | 19
Andrew T G Burton BSc Andrew is Managing Director of Viking Fund Managers Ltd (VFM). Andrew has been involved in early stage technology investing since 1986. Before setting up VFM in 2002 he ran the Yorkshire Association of Business Angels (which he now chairs) and previously worked for UniVentures International at Leeds Metropolitan University where he was responsible for high growth programmes and incubators.
Vivian D Hallam MBA BSc CEngViv is Consultancy Director of VFM. Viv is a Chartered Mechanical Engineer and has an MBA from Aston Business School. He joined VFM in 2003 following twenty years of senior management in international advanced engineering companies, including Sarna, GKN and GEC where he was responsible for design, development and marketing of new products for the plastics, automotive and power industries.
Oliver Woolley MBA BA HonsOliver is Managing Director of Envestors. Oliver is an Executive Director of the British Business Angels Association (BBAA) and has an MBA from Imperial College Management School. After university Oliver raised private equity and bank debt to start his own venture in the food industry – including a retail catering business in central London and a chain of shops in the south-east. In 1997 he sold the business and moved into the world of early-stage investing and fundraising. He co-founded Envestors in 2004.
Robert N K Taylor MBA BA HonsBob is Director of Envestors. Bob has a degree in Geology and an MBA from Ashridge. Bob has worked in the oil industry with Mobil Oil, initially in Africa as a field seismologist, before moving to CIBC World Markets (Singapore) where he had group profit & loss responsibility for originating and structuring transactions (mainly project finance) for clients across Asia. He then moved into the telecoms sector to launch Vodafone live! across nine countries. He is an active private investor and co-founded Envestors in 2004. W Scott M Haughton MBA BA HonsScott is Marketing Director of Envestors. Scott has a degree in Economics and Business and an MBA from Aberystwyth. After 16 years working in senior sales and marketing roles for multi-national blue chip FMCG corporations, including Mars Confectionery and GlaxoSmithKline, Scott left the corporate consumer product world to set up a unique premium quality family leisure concept. In doing so, he secured venture capital backing, business angel investment, bank debt and a DTI Small Firms Loan. He co-founded Envestors in 2004.
1: Andrew Burton, 2: Viv Hallam, 3: Oliver Woolley, 4: Bob Taylor, 5: Scott Haughton, 6: Geoffrey Thomson, 7: Carolyn Smith, 8: Colin Grant.
6
7 8
1 2
4
5
3

20
Braveheart Investment Group | Annual Report and Accounts 2011
| Governance | CORPORATEGOVERNANCESTATEMENT
The directors recognise the importance of sound corporate governance. As a company whose shares are traded on the London Stock Exchange (Alternative Investment Market) (AIM), the Company is not obliged to comply with the corporate governance regime as set out in the UK Corporate Governance Code, but it does support the principles of the Code. It intends to comply with the Quoted Companies Alliance’s Corporate Governance Guidelines for Smaller Quoted Companies insofar as it is reasonably practicable for a public company of its size and nature. The directors have adopted a code of conduct for dealings by directors and employees which complies with the AIM Rules and are committed to maintaining the highest standards of corporate governance.
The Board of Directors The Board currently comprises the Chairman, Garry Watson, three other non-executive directors, Edward Cunningham, the senior non-executive director, Ken Brown and Jeremy Delmar-Morgan and three executive directors, the Chief Executive Officer, Geoffrey Thomson, the Chief Investment Officer, Carolyn Smith and the Chief Financial Officer, Colin Grant.
Biographical details of the current directors are set out on page 18. Executive and non-executive directors are subject to re-election at intervals of no more than three years. The letters of appointment of all directors are available for inspection at the Company’s registered office during normal business hours. The Board meets at least eight times per annum. It has established an Audit and Risk Management Committee, a Remuneration Committee and a Nominations Committee, particulars of which appear hereafter.
All members of the Board and its committees served throughout the year.
Certain executive and non-executive directors are clients of Braveheart Ventures Ltd, an investment management subsidiary. Further information regarding related party transactions during the year is detailed in note 25 to the financial statements.
Non-executive DirectorsThe non-executive directors have a broad range of experience, as evidenced by their biographical details and are well equipped to bring independent judgement to bear on issues of strategy, performance, resources and standards of conduct that are vital to the success of the Company.
The Board has adopted guidelines for the appointment of non-executive directors which have been in place and which have been observed throughout the year. These provide for the orderly and constructive succession and rotation of the chairman and non-executive directors insofar as both chairman and non-executive directors will be appointed for an initial term of three years and may, at the Board’s discretion believing it to be in the best interests of the Company, be appointed for subsequent terms. The Chairman may serve as a non-executive director before commencing a first term as chairman.
In accordance with the Companies Act 2006, the directors comply with: a duty to act within their powers; a duty to promote the success of the Company; a duty to exercise independent judgement; a duty to exercise reasonable care, skill and diligence; a duty to avoid conflicts of interest; a duty not to accept benefits from third parties and a duty to declare any interest in a proposed transaction or arrangement.
Delegation of Responsibilities by the Board of DirectorsUltimate authority for all aspects of the Group’s activities rests with the Board, the respective responsibilities of the Chairman and Chief Executive Officer arising as a consequence of delegation by the Board. The Board has adopted two statements: the first sets out matters which are reserved to the Board and the second establishes the division of responsibilities between the Chairman and the Chief Executive Officer. The Chairman is responsible for the effectiveness of the Board and for ensuring communication with shareholders, while management of the Group’s business has been delegated by the Board to the Chief Executive Officer.
Audit and Risk Management CommitteeThe Audit and Risk Management Committee comprises Ken Brown (its Chairman), Edward Cunningham and Jeremy Delmar-Morgan and has primary responsibility for monitoring the quality of internal controls and ensuring that the financial performance of the Group is properly measured and reported. It receives reports from the executive management and auditors relating to the interim and annual accounts and the accounting and internal control systems in use throughout the Group. The Audit and Risk Management Committee meets not less than three times in each financial year and has unrestricted access to the Group’s auditors.

Braveheart Investment Group | Annual Report and Accounts 2011
21CORPORATEGOVERNANCESTATEMENT | Governance |
Remuneration CommitteeThe Remuneration Committee comprises Edward Cunningham (its Chairman), Ken Brown and Garry Watson. The Remuneration Committee reviews the performance of the executive directors and employees and makes recommendations to the Board on matters relating to their remuneration and terms of employment. The Remuneration Committee also considers and approves the granting of share options pursuant to the share option plan.
Nominations CommitteeThe Nominations Committee comprises Edward Cunningham (its Chairman) and Garry Watson and is responsible for the identification and nomination of candidates for the roles of Chairman, Chief Executive Officer, other executive directors and non-executive directors, the nomination of all directors of subsidiary companies and succession planning in relation to the above aforementioned posts. It is also concerned with matters relating to corporate governance, insofar as they may relate to concerns or complaints from shareholders concerning the conduct of Board directors and bringing any such issue to the attention of the Board.
Attendance at Board and Committee Meetings The following table summarises the number of board and committee meetings held during the year and the attendance record of individual directors:
Audit and Risk Board Management Remuneration Nominations
Eligible Eligible Eligible Eligible Attended to attend Attended to attend Attended to attend Attended to attend
G S Watson 10 11 – – 2 2 2 2G C B Thomson 11 11 – – – – – –C Smith 11 11 – – – – – –C C Grant 11 11 – – – – – –E B Cunningham 11 11 2 3 2 2 2 2J K Brown 11 11 3 3 2 2 – –J H Delmar–Morgan 10 11 3 3 – – – –
Share DealingsThe Company has adopted, with effect from the date on which its shares were admitted to AIM, a code for directors’ and employees’ dealings in securities which is appropriate for a company whose securities are traded on AIM and is in accordance with rule 21 of the AIM rules.
Investment AuthoritiesInvestment authorities are reviewed in March of each year and more frequently as determined by the Board. These authorities relate to the maximum amount that the executive directors may invest from the Group’s own resources in any one portfolio investment. Investments outwith the agreed parameters may be made with the agreement of a non-executive director or by the Board.
Risk Management and Internal ControlRisk management is the responsibility of the Risk Management Group, which comprises the three executive directors. The Risk Management Group reports to the Audit and Risk Management Committee, which is responsible to the Board for ensuring that procedures are in place and are being effectively implemented to identify, evaluate and manage the significant risks faced by the Group. A risk assessment matrix sets out those risks and identifies their ownership and the controls that are in place. The Risk Management Group updates this matrix as changes arise in the nature of risks or the controls that are implemented to mitigate them. The Audit and Risk Management Committee reviews the risk matrix and the effectiveness of scenario testing by the Risk Management Group on a regular basis.
22
Braveheart Investment Group | Annual Report and Accounts 2011
| Governance | CORPORATEGOVERNANCESTATEMENT
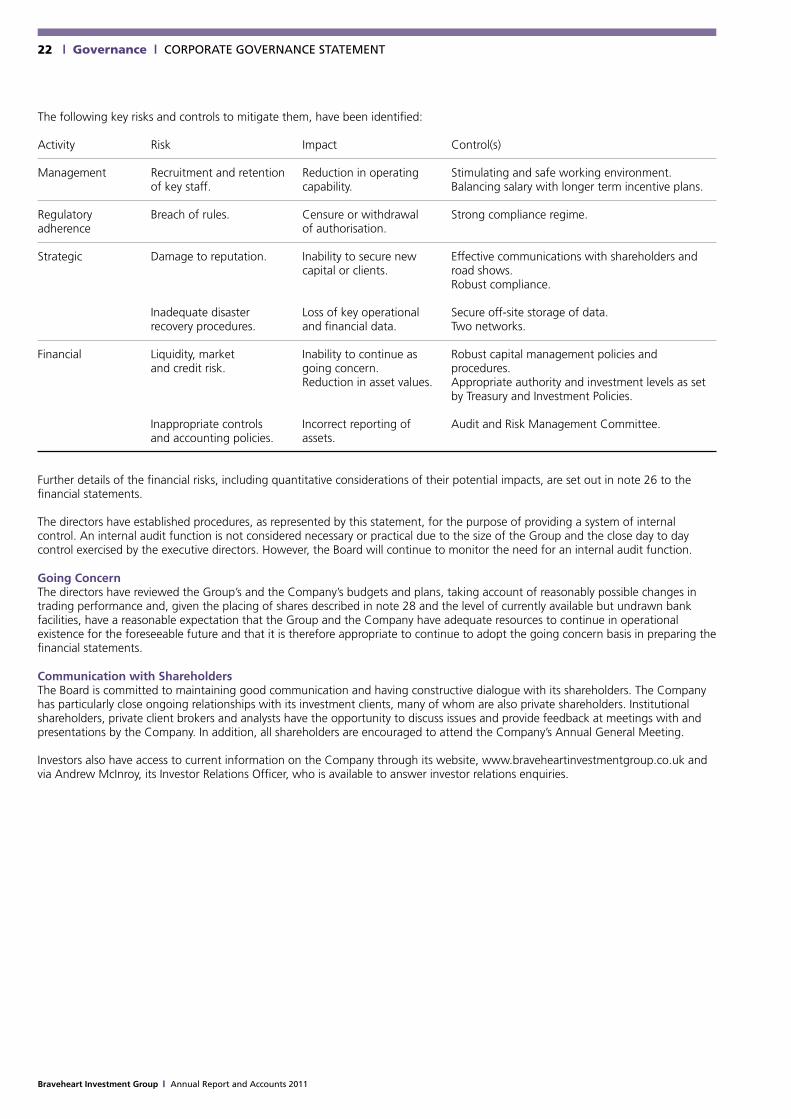
The following key risks and controls to mitigate them, have been identified:
Activity Risk Impact Control(s)
Management Recruitment and retention Reduction in operating Stimulating and safe working environment. of key staff. capability. Balancing salary with longer term incentive plans.
Regulatory Breach of rules. Censure or withdrawal Strong compliance regime.adherence of authorisation.
Strategic Damage to reputation. Inability to secure new Effective communications with shareholders and capital or clients. road shows. Robust compliance.
Inadequate disaster Loss of key operational Secure off-site storage of data. recovery procedures. and financial data. Two networks.
Financial Liquidity, market Inability to continue as Robust capital management policies and and credit risk. going concern. procedures. Reduction in asset values. Appropriate authority and investment levels as set by Treasury and Investment Policies.
Inappropriate controls Incorrect reporting of Audit and Risk Management Committee. and accounting policies. assets.
Further details of the financial risks, including quantitative considerations of their potential impacts, are set out in note 26 to the financial statements.
The directors have established procedures, as represented by this statement, for the purpose of providing a system of internal control. An internal audit function is not considered necessary or practical due to the size of the Group and the close day to day control exercised by the executive directors. However, the Board will continue to monitor the need for an internal audit function.
Going ConcernThe directors have reviewed the Group’s and the Company’s budgets and plans, taking account of reasonably possible changes in trading performance and, given the placing of shares described in note 28 and the level of currently available but undrawn bank facilities, have a reasonable expectation that the Group and the Company have adequate resources to continue in operational existence for the foreseeable future and that it is therefore appropriate to continue to adopt the going concern basis in preparing the financial statements.
Communication with ShareholdersThe Board is committed to maintaining good communication and having constructive dialogue with its shareholders. The Company has particularly close ongoing relationships with its investment clients, many of whom are also private shareholders. Institutional shareholders, private client brokers and analysts have the opportunity to discuss issues and provide feedback at meetings with and presentations by the Company. In addition, all shareholders are encouraged to attend the Company’s Annual General Meeting.
Investors also have access to current information on the Company through its website, www.braveheartinvestmentgroup.co.uk and via Andrew McInroy, its Investor Relations Officer, who is available to answer investor relations enquiries.

Braveheart Investment Group | Annual Report and Accounts 2011
23DIRECTORS’REMuNERATIONREPORT | Governance |
Remuneration CommitteeThe Remuneration Committee is comprised entirely of non-executive directors. It is chaired by Edward Cunningham and its other members are Garry Watson and Ken Brown. The Chief Executive Officer, Geoffrey Thomson, attends by invitation and assists the Committee. The Committee met twice during the year.
Remuneration PolicyThe Remuneration Committee is responsible for implementing and maintaining a remuneration policy which ensures that executive directors, other Group company directors, senior management and other employees are remunerated in such a manner as to ensure that (i) they are fairly rewarded in a manner which secures and retains the skilled and experienced individuals the Group requires to meet its corporate objectives, including an increase in shareholder value; (ii) conflicts of interest are minimised and that the interests of staff are aligned with the long term interests of the Group; and (iii) remuneration is consistent with and promotes sound and effective risk management and does not encourage risk taking that exceeds the level of tolerated risk set by the Board and is in line with the business strategy, objectives, values and long-term interests of the Group.
Determination of Directors’ and Senior Management’s SalariesThe Remuneration Committee believes that the interests of the executive directors, other Group company directors, senior management and staff and those of the shareholders and other stakeholders are best aligned by a remuneration policy that provides a base salary together with awards under the Group’s Executive Share Option Scheme. The Remuneration Committee reviews and determines annually directors’ and senior management’s salaries in relation to the tasks and responsibilities involved and the level of comparable salaries in the market place. In particular, the Committee seeks to ensure that salaries are competitive. In its final determination of salaries, the Committee’s conclusions are set within what is affordable. During the year salaries at Envestors Ltd, acquired in October 2010, were aligned with those then current elsewhere in the Group and contribution to certain Viking Fund Managers Ltd employee pension arrangements continued. Otherwise, the Group did not increase any salaries during the year, nor contribute to any other pension schemes or pay any bonuses.
Executive Director Service AgreementsEach of the executive directors has a service agreement with the Company. These agreements can be terminated by either party giving the other written notice at any time, not less than six months in the case of Geoffrey Thomson and not less than three months in the cases of Carolyn Smith and Colin Grant. Payments on termination are restricted to the value of the salary for the notice period.
Non-executive DirectorsThe fees payable to the Chairman and the non-executive directors are first reviewed by the Committee, taking into account market rates, following which it submits recommendations to the Board for approval. The Company did not increase non-executive directors’ fees during the year.
The Chairman and each non-executive director have agreed a letter of appointment which sets out their duties, responsibilities and fees.
Directors’ Remuneration The total amount of directors’ remuneration is set out below:
Total Total 2011 2010 £ £
Executive directors: G C B Thomson 113,400 141,750C Smith 84,000 105,000C C Grant 80,000 100,000Non-executive directors: G S Watson 11,025 15,750E B Cunningham 7,350 10,500J K Brown 7,350 10,500J H Delmar-Morgan 7,350 10,500
310,475 394,000
The Company did not contribute to any director’s pension scheme nor pay any bonuses to directors during the year (2010: £nil). During the year the Company paid private medical insurance premiums of £1,394, £484 and £1,119 (2010: £1,214, £373 and £975) in respect of Geoffrey Thomson, Carolyn Smith and Colin Grant.
Share Option SchemeThe Company operates the Braveheart Investment Group plc Executive Share Option Scheme 2006 (the Scheme), which comprises Part A, a share option scheme approved by HMRC (the Approved Scheme) and Part B, an unapproved share option scheme (the Unapproved Scheme).
Historically, the Scheme was open to all directors and employees of the Group, although non-executive directors could only participate in Part B. The Scheme is now open only to all executive directors and employees.

24
Braveheart Investment Group | Annual Report and Accounts 2011
| Governance | DIRECTORS’REMuNERATIONREPORT
Options are granted by the Board taking into account the need to motivate, retain and recruit high calibre employees and with regard to the contribution that such employees are expected to make in achieving the Company’s objectives.
Options granted under the Scheme are categorised as Employment Options, Performance Options or Other Options. Employment Options may be granted under either Part A or Part B. All Performance Options and Other Options are granted under Part B.
Employment Options vest and become exercisable on the third anniversary of date of grant and generally lapse on the earlier of cessation of employment (or 6 months thereafter if options have vested at cessation date) or the 10th anniversary of date of grant.
Performance Options have to date had vesting conditions linked to the growth in the Company’s market capitalisation from the date of grant (Performance Conditions). If a Performance Condition is not met, the related Performance Option lapses at the end of the relevant measurement period.
Otherwise Performance Options vest on attainment of the Performance Condition and become exercisable on the 1st anniversary of the date of the Performance Condition being met and lapse on the 10th anniversary of date of grant.
Other Options, granted for the first time during the year ended 31 March 2011, are immediately exercisable and lapse on the 10th anniversary of date of grant.
Share Options The interests of the directors in share options were as follows:
No of No of No of At Options Options Options At Date of 1 April granted exercised lapsed 31 March Exercise Date first Grant 2010 in year in year in year 2011 Price exercisable Expiry date
Employment Options granted under Part A
G Thomson 25 June 25 June 24 June 2008 26,086 – – – 26,086 £1.15 2011 2018
C Smith 18 June 18 June 17 June 2007 18,237 – – – 18,237 £1.645 2010 2017
C Grant 8 December 8 December 7 December 2008 28,902 – – – 28,902 £0.35 2011 2018
18 June 18 June 17 June 2009 30,160 – – – 30,160 £0.295 2012 2019
5 July 5 July 4 July 2010 – 34,677 – – 34,677 £0.255 2013 2020
59,062 34,677 – – 93,739
Employment Options granted under Part B
G Thomson 18 June 18 June 17 June 2007 24,948 – – – 24,948 £1.645 2010 2017
25 June 25 June 24 June 2008 14,377 – – – 14,377 £1.15 2011 2018
18 June 18 June 17 June 2009 42,753 – – – 42,753 £0.295 2012 2019
5 July 5 July 4 July 2010 – 49,155 – – 49,155 £0.255 2013 2020
82,078 49,155 – – 131,233
C Smith 18 June 18 June 17 June 2007 243 – – – 243 £1.645 2010 2017
25 June 25 June 24 June 2008 28,902 – – – 28,902 £1.15 2011 2018
18 June 18 June 17 June 2009 31,669 – – – 31,669 £0.295 2012 2019 5 July 5 July 4 July 2010 – 36,411 – – 36,411 £0.255 2013 2020
60,814 36,411 – – 97,225

Braveheart Investment Group | Annual Report and Accounts 2011
25DIRECTORS’REMuNERATIONREPORT | Governance |
No of No of No of At Options Options Options At Date of 1 April granted exercised lapsed 31 March Exercise Date first Grant 2010 in year in year in year 2011 Price exercisable Expiry date
Performance Options granted under Part B
G Watson 18 June 18 June 17 June 2007 33,454 – – (33,454) – £1.645 2010 2017
E Cunningham 18 June 18 June 17 June 2007 13,360 – – (13,360) – £1.645 2010 2017
G Thomson 18 June 18 June 17 June 2007 84,337 – – (84,337) – £1.645 2010 2017
18 June 18 June 17 June 2009 69,231 – – (69,231) – £0.295 2010 2019
5 July 5 October 4 July 2010 – 76,923 – – 76,923 £0.255 2011 2020
153,568 76,923 – (153,568) 76,923
C Smith 18 June 18 June 17 June 2007 50,602 – – (50,602) – £1.645 2010 2017
18 June 18 June 17 June 2009 41,538 – – (41,538) – £0.295 2010 2019
5 July 5 October 4 July 2010 – 46,154 – – 46,154 £0.255 2011 2020
92,140 46,154 – (92,140) 46,154
C Grant 18 June 18 June 17 June 2009 41,538 – – (41,538) – £0.295 2010 2019 5 July 5 October 4 July 2010 – 46,154 – – 46,154 £0.255 2011 2020
41,538 46,154 – (41,538) 46,154
No of No of No of At Options Options Options At Date of 1 April granted exercised lapsed 31 March Exercise Date first Grant 2010 in year in year in year 2011 Price exercisable Expiry date
Other Options granted under Part B
G Thomson 5 July 2010 – 105,000 – – 105,000 £0.255 5 July 2010 4 July 2020
C Smith 5 July 2010 – 77,778 – – 77,778 £0.255 5 July 2010 4 July 2020
C Grant 5 July 2010 – 74,074 – – 74,074 £0.255 5 July 2010 4 July 2020
The Performance Conditions attached to the Performance Options are as follows:
Percentage of the grant to which theDate of grant Performance Condition Performance Condition applies to
5 July 2010 The Company’s market capitalisation exceeds the benchmark price 100.00% by 25% for 5 consecutive business days at any time before the 5 October 2011.
The benchmark price is the option exercise price multiplied by the number of ordinary shares of 2 pence each in the issued share capital of the Company on the date of grant of the related option.
The charge made in respect of the fair value of options granted to directors was:
2011 2010 £ £
Expense arising from equity-settled share-based payments transactions 15,696 31,147
Additional information on share options is provided at note 22.

26
Braveheart Investment Group | Annual Report and Accounts 2011
| Governance | INDEPENDENTAuDITORS’REPORTTOTHEMEMBERSOFBRAVEHEARTINVESTMENTGROuPPLC
We have audited the Group and Parent Company financial statements (the Financial Statements) of Braveheart Investment Group plc for the year ended 31 March 2011 which comprise the Consolidated Statement of Comprehensive Income, the Consolidated and Parent Company Statement of Financial Position, the Consolidated and Parent Company Statement of Cash Flows, the Consolidated and Parent Company Statement of Changes in Equity and the related notes. The financial reporting framework that has been applied in their preparation is applicable law and International Financial Reporting Standards (IFRS) as adopted by the European Union and, as regards the parent company financial statements, as applied in accordance with the provisions of the Companies Act 2006.
This report is made solely to the Company’s members, as a body, in accordance with Chapter 3 of Part 16 of the Companies Act 2006. Our audit work has been undertaken so that we might state to the Company’s members those matters we are required to state to them in an auditors’ report and for no other purpose. To the fullest extent permitted by law, we do not accept or assume responsibility to anyone other than the Company and the Company’s members as a body, for our audit work, for this report, or for the opinions we have formed.
Respective responsibilities of directors and auditorsAs explained more fully in the Directors’ Responsibilities Statement on page 16, the directors are responsible for the preparation of the financial statements and for being satisfied that they give a true and fair view. Our responsibility is to audit and express an opinion on the financial statements in accordance with applicable law and International Standards on Auditing (UK and Ireland). Those standards require us to comply with the Auditing Practices Board’s (APB’s) Ethical Standards for Auditors.
Scope of the audit of the financial statementsA description of the scope of an audit of financial statements is provided on the APB’s website at www.frc.org.uk/apb/scope/private.cfm
Opinion on financial statementsIn our opinion:• thefinancialstatementsgiveatrueandfairviewofthestateoftheGroup’sandoftheParentCompany’saffairsasat31March
2011 and of the Group’s loss for the year then ended; • theParentCompanyfinancialstatementshavebeenproperlypreparedinaccordancewithIFRSasadoptedbytheEuropean
Union and as applied in accordance with the provisions of the Companies Act 2006;• theGroupfinancialstatementshavebeenproperlypreparedinaccordancewithIFRSasadoptedbytheEuropeanUnion;and• thefinancialstatementshavebeenpreparedinaccordancewiththerequirementsoftheCompaniesAct2006.
Opinion on other matters prescribed by the Companies Act 2006In our opinion the information given in the Directors’ Report for the financial year for which the financial statements are prepared is consistent with the financial statements.
Matters on which we are required to report by exceptionWe have nothing to report in respect of the following matters where the Companies Act 2006 requires us to report to you if, in our opinion:• adequateaccountingrecordshavenotbeenkeptbytheParentCompany,orreturnsadequateforouraudithavenotbeen
received from branches not visited by us; or• theParentCompanyfinancialstatementsarenotinagreementwiththeaccountingrecordsandreturns;or• certaindisclosuresofdirectors’remunerationspecifiedbylawarenotmade;or• wehavenotreceivedalltheinformationandexplanationswerequireforouraudit.
Robert HannahSenior Statutory AuditorFor and on behalf of Grant Thornton UK LLPStatutory AuditorChartered AccountantsEDINBURGH25 July 2011

Braveheart Investment Group | Annual Report and Accounts 2011
27 ConsolidAted stAtement of CompRehensive inCome for the year ended 31 March 2011 | Accounts and notes
2011 2010 Notes £ £
Revenue 3 925,781 568,241Unrealised (loss)/profit on the fair value movements of investments 12 (464,029) 611,186Movement on contingent consideration 13 20,314 (295,392)Realised profit on the disposal of investment 168,365 –Finance revenue 5 31,629 33,541
Total income 682,060 917,576
Employee benefits expense 4 (1,291,280) (1,230,188)Other operating costs (692,543) (452,769)Finance costs 6 (4,369) (1,774)
Total costs (1,988,192) (1,684,731)
Loss before tax (1,306,132) (767,155) Tax 8 – –
Total loss and total comprehensive loss for the year (1,306,132) (767,155)
Loss attributable to: Equity holders of the parent (1,305,815) (775,513)Non–controlling interest (317) 8,358
(1,306,132) (767,155)
Loss per share Pence Pence- basic and diluted 10 (9.06) (5.61)
All revenues and losses arise from continuing operations.
The accompanying accounting policies and notes form part of these financial statements.

28
Braveheart Investment Group | Annual Report and Accounts 2011
| Accounts and Notes | ConsolidAted stAtement of finAnCiAl position as at 31 March 2011
2011 2010 Notes £ £
ASSETS Non–current assets Goodwill 15 987,105 327,064Other intangibles 16 121,951 –Property, plant and equipment 11 28,646 31,367Investments at fair value through profit or loss 12 3,978,621 4,530,747Other receivables 17 54,112 –
5,170,435 4,889,178
Current assets Trade and other receivables 17 182,106 101,907Cash and cash equivalents 18 643,203 1,473,943
825,309 1,575,850
Total assets 5,995,744 6,465,028
LIABILITIES Current liabilities Trade and other payables 19 (244,722) (126,036)Contingent consideration 20 (592,420) (592,819)Deferred income (14,202) (20,230)Borrowings 24 (6,629) (10,696)
(857,973) (749,781)
Non–current liabilities Contingent consideration 20 (574,378) (78,822)Borrowings 24 (41,664) (35,205)
(616,042) (114,027)
Total liabilities (1,474,015) (863,808)
Net assets 4,521,729 5,601,220
EQUITY Called up share capital 21 294,988 278,316Merger reserve 316,101 140,783Retained earnings 3,919,926 5,191,090
Equity attributable to owners of the Parent 4,531,015 5,610,189Non–controlling interest (9,286) (8,969)
Total equity 4,521,729 5,601,220
Registered number: SC247376Approved for issue by the Board of Directors on 25 July 2011 and signed on its behalf by:
Garry S WatsonChairman
The accompanying accounting policies and notes form part of these financial statements.

29
Braveheart Investment Group | Annual Report and Accounts 2011
CompAny stAtement of finAnCiAl position as at 31 March 2011 | Accounts and notes
2011 2010 Notes £ £
ASSETS Non-current assets Investments at fair value through profit or loss 12 2,509,143 3,124,654Investment in subsidiaries 13 2,238,097 2,296,205Other receivables 17 54,112 –
4,801,352 5,420,859
Current assets Trade and other receivables 17 505,409 348,880Cash and cash equivalents 18 573,965 1,377,327
1,079,374 1,726,207
Total assets 5,880,726 7,147,066
LIABILITIES Current liabilities Trade and other payables 19 (334,619) (270,813)Contingent consideration 20 (592,420) (592,819)
(927,039) (863,632)
Non-current liabilities Contingent consideration 20 (574,378) (78,822)
(574,378) (78,822)
Total liabilities (1,501,417) (942,454)
Net assets 4,379,309 6,204,612
EQUITY Called up share capital 21 294,988 278,316Merger reserve 316,101 140,783Share-based payments 265,771 –Retained earnings 3,502,449 5,785,513
Equity attributable to owners of the Parent 4,379,309 6,204,612
Registered number: SC247376Approved for issue by the Board of Directors on 25 July 2011 and signed on its behalf by:
Garry S WatsonChairman
The accompanying accounting policies and notes form part of these financial statements.

30
Braveheart Investment Group | Annual Report and Accounts 2011
| Accounts and Notes | ConsolidAted stAtement of CAsh flows for the year ended 31 March 2011
2011 2010 £ £
Operating activities Loss before tax (1,306,132) (767,155)Adjustments to reconcile loss before tax to net cash flows from operating activities Depreciation of property, plant and equipment 9,631 13,333Amortisation of intangibles 6,418 –Share-based payments expense 34,651 46,902Decrease/(increase) on the fair value movements of investments 464,029 (611,186)Gain on disposal of equity investments (168,365) –Acquisition of subsidiaries (45,267) –Loss on disposal of property, plant and equipment 5,561 –Interest income (31,629) (33,541)(Increase)/decrease in trade and other receivables (12,055) 198,414(Decrease)/increase in trade and other payables (18,310) 115,551
Net cash flow from operating activities (1,061,468) (1,037,682)
Investing activities Acquisition of subsidiaries (net of cash acquired) – (124,349)Net cash and cash equivalents acquired on acquisition 15,257 (52,137)Proceeds from sale of equity investments 315,006 –Increase in investments (112,656) (557,400)Purchase cost of property, plant and equipment (7,811) –Interest received 31,629 33,541
Net cash flow from investing activities 241,425 (700,345)
Financing activities Capital element of hire purchase contract (10,697) (9,874)
Net cash flow from financing activities (10,697) (9,874)
Net decrease in cash and cash equivalents (830,740) (1,747,901)Cash and cash equivalents at the beginning of the year 1,473,943 3,221,844
Cash and cash equivalents at the end of the year 643,203 1,473,943
The accompanying accounting policies and notes form part of these financial statements.

Braveheart Investment Group | Annual Report and Accounts 2011
31CompAny stAtement of CAsh flows for the year ended 31 March 2011 | Accounts and Notes |
2011 2010 £ £
Operating activities Loss before tax (2,283,064) (578,540)Adjustments to reconcile loss before tax to net cash flows from operating activities Decrease on the fair value movements of investments 484,912 63,235Decrease on the fair value of subsidiaries 1,442,848 –Gain on disposal of equity investments (156,622) –Acquisition of subsidiaries (45,267) –Interest income (30,038) (30,825)Increase in trade and other receivables (156,529) (56,865)Increase in trade and other payables 97,251 81,943
Net cash flow from operating activities (646,509) (521,052)
Investing activities Acquisition of subsidiaries – (124,349)Investment in subsidiaries (420,000) (325,000)Proceeds from sale of equity investments 283,263 –Increase in investments (50,154) (452,400)Interest received 30,038 30,825
Net cash flow from investing activities (156,853) (870,924)
Net decrease in cash and cash equivalents (803,362) (1,391,976)Cash and cash equivalents at the beginning of the year 1,377,327 2,769,303
Cash and cash equivalents at the end of the year 573,965 1,377,327
The accompanying accounting policies and notes form part of these financial statements.

32
Braveheart Investment Group | Annual Report and Accounts 2011
| Accounts and Notes | ConsolidAted stAtement of ChAnges in equity for the year ended 31 March 2011
Attributable to owners of the Parent
Non- Share Merger Retained controlling Total Capital Reserve Earnings Total Interest Equity £ £ £ £ £ £
Group At 1 April 2009 268,078 – 5,919,701 6,187,779 (17,327) 6,170,452
Issue of new share capital 10,238 140,783 – 151,021 – 151,021Share-based payments – – 46,902 46,902 – 46,902
Transactions with owners 10,238 140,783 46,902 197,923 – 197,923
Loss and total comprehensive loss for the year – – (775,513) (775,513) 8,358 (767,155)
At 1 April 2010 278,316 140,783 5,191,090 5,610,189 (8,969) 5,601,220
Issue of new share capital 16,672 175,318 – 191,990 – 191,990Share-based payments – – 34,651 34,651 – 34,651
Transactions with owners 16,672 175,318 34,651 226,641 – 226,641
Loss and total comprehensive loss for the year – – (1,305,815) (1,305,815) (317) (1,306,132)
At 31 March 2011 294,988 316,101 3,919,926 4,531,015 (9,286) 4,521,729
Share Merger Retained Capital Reserve Earnings Total £ £ £ £
Company At 1 April 2009 268,078 – 6,364,053 6,632,131
Issue of new share capital 10,238 140,783 – 151,021
Transactions with owners 10,238 140,783 – 151,021
Loss and total comprehensive loss for the year – – (578,540) (578,540)
At 1 April 2010 278,316 140,783 5,785,513 6,204,612
Issue of new share capital 16,672 175,318 – 191,990Share-based payments – – 265,771 265,771
Transactions with owners 16,672 175,318 265,771 457,761
Loss and total comprehensive loss for the year – – (2,283,064) (2,283,064)
At 31 March 2011 294,988 316,101 3,768,220 4,379,309
The accompanying accounting policies and notes form part of these financial statements.
Braveheart Investment Group | Annual Report and Accounts 2011
33notes to the finAnCiAl stAtements for the year ended 31 March 2011 | Accounts and Notes |
1 Corporate informationThe Group and Company financial statements of Braveheart Investment Group plc (the Company) for the year ended 31 March 2011 were authorised for issue by the Board of Directors on 25 July 2011 and the statements of financial position were signed on the Board’s behalf by Garry Watson.
Braveheart Investment Group plc is a company incorporated in the United Kingdom under the Companies Act 2006. The address of the registered office is detailed at the back of this report. The nature of the Group’s operations and its principal activities are set out in the Directors’ Report. The Company is registered in Scotland. The Company’s ordinary shares are traded on the London Stock Exchange (Alternative Investment Market) (AIM).
2 Accounting policies(a) Basis of preparationThe Group and Company financial statements have been prepared in accordance with International Financial Reporting Standards (IFRS) as adopted by the European Union as they apply to financial statements for the year ended 31 March 2011 and as applied in accordance with the provisions of the Companies Act 2006. The principal accounting policies adopted by the Group and by the Company are set out in the following notes.
The Company has taken advantage of the provision of section 408 of the Companies Act 2006 not to publish its own statement of comprehensive income. The amount of loss for the financial year dealt with in the financial statements of the Company is set out in note 9 to the accounts.
The financial statements have been prepared on a historical cost basis, except where otherwise indicated. The financial statements are presented in sterling and all values are rounded to the nearest pound (£) except where otherwise indicated.
The Group’s business activities (together with the factors likely to affect its future development, performance and position) and its financial position are set out in the Chairman’s Statement on pages 2 and 3, the Chief Executive Officer’s Report on pages 4 and 5, the Chief Financial Officer’s Report on pages 6 and 7 and the Chief Investment Officer’s Report on pages 8 to 10. The Group’s risk management objectives and policies are described in the Corporate Governance Statement on pages 20 to 22. Further information regarding the Group’s financial risk management objectives and policies, including those in relation to credit risk, liquidity risk and market risk, is provided in note 26 to the financial statements. The Group’s capital management objectives are stated below on page 37.
The directors have reviewed the Group’s and the Company’s budgets and plans, taking account of reasonably possible changes in trading performance and, given the placing of shares described in note 28 and the level of currently available but undrawn bank facilities, have a reasonable expectation that the Group and the Company have adequate resources to continue in operational existence for the foreseeable future and that it is therefore appropriate to continue to adopt the going concern basis in preparing the financial statements.
(b) Changes in accounting policy and disclosuresThe following revised standard and amendment became effective and were adopted during the year commencing 1 April 2010:
IFRS 3 (revised) Business CombinationsRevised IFRS 3 retains the requirement to apply acquisition accounting in all cases and to identify and recognise intangible assets separately from goodwill. However, for current and future acquisitions, all acquisition costs are to be written off to profit or loss instead of being included in the cost of investment and contingent consideration is to be recognised at fair value on the acquisition date (with subsequent changes recognised in the statement of comprehensive income and not as a change to goodwill).
IAS 27 Consolidated and Separate Financial Statements (Amendment)Amendment to IAS 27 no longer restricts the allocation to non-controlling interest of losses incurred by a subsidiary to the amount of the non-controlling equity investment in the subsidiary. A partial disposal of equity interest in a subsidiary that does not result in a loss of control will be accounted for as an equity transaction and will have no impact on goodwill nor will it give rise to any gain or loss. Where there is loss of control of a subsidiary, any retained interest will have to be re-measured to fair value, which will impact the gain or loss recognised on disposal.
The adoption of the revised standard and amendment did not result in changes to previously published financial information and accordingly no additional comparable statement of financial position is presented.
None of the other new standards, interpretations and amendments effective from 1 April 2010 has had a material effect on the Group’s financial statements.
34
Braveheart Investment Group | Annual Report and Accounts 2011
| Accounts and Notes | notes to the finAnCiAl stAtements for the year ended 31 March 2011 continued
(c) new standards and interpretations not yet applied The International Accounting Standards Board and the International Financial Reporting Interpretations Committee have issued the following standards and interpretations with an effective date after the date of these financial statements:
International Accounting Standards (IAS/IFRS) Effective for accounting periods commencing on or after
Improvements to IFRS 1 July 2010/1 January 2011IAS 24 Related Party Disclosure (Revised 2009) 1 January 2011IFRS 7 Financial Instruments Disclosure (Amendment) 1 July 2011IAS 12 Income Taxes (Amendment) 1 January 2012IFRS 9 Financial Instruments 1 January 2013IFRS 10 Consolidated Financial Statements 1 January 2013IFRS 11 Joint Arrangements 1 January 2013IFRS 12 Disclosure of Interests in Other Entities 1 January 2013IFRS 13 Fair Value Measurement 1 January 2013IAS 27 Consolidated and Separate Financial Statements 1 January 2013IAS 28 Investments in Associates 1 January 2013
International Financial Reporting Interpretations Committee (IFRIC) Effective for accounting periods commencing on or after
IFRIC 19 Extinguishing Financial Liabilities with Equity Instruments 1 July 2010IFRIC 14 Prepayments of a Minimum Funding Requirement 1 January 2011
IFRS 9 will eventually replace IAS 39 in its entirety and is intended to simplify the classification and measurement requirements for financial instruments. The process has been divided into three main phases, classification and measurement; impairment; and hedge accounting. The standard’s eventual adoption may result in changes to the classification and measurement of financial instruments.
IFRS 13 establishes a single framework for all fair value measurements when fair value is required or permitted by IFRS. IFRS 13 does not change when an entity is required to use fair value, but rather, describes how to measure fair value under IFRS when it is required or permitted by IFRS.
The directors do not anticipate that adoption of IFRS 13 or of the remaining standards and interpretations will have a material impact on the Group’s financial statements in the period of initial application.
(d) Basis of consolidationThe Group’s financial statements consolidate the results of Braveheart Investment Group plc and its subsidiaries (together referred to as the ‘Group’) drawn up to 31 March each year. The financial statements of the subsidiaries used in the preparation of the consolidated financial statements are prepared for the same reporting year as the parent company using consistent accounting policies. All intra-group balances, transactions, income and expenses are eliminated in full on consolidation.
The subsidiaries have been consolidated from the date of their acquisition, being the date on which the Group obtained control will continue to be consolidated until the date that such control ceases. Control comprises the power to govern the financial and operating policies of the subsidiary so as to obtain benefit from its activities and is achieved through direct ownership.
Group companies manage, and have an 89.29% equity interest in, Strathclyde Innovation Fund LP, which is included in the consolidated financial statements.
Non-controlling interests represent the portion of profit or loss and net assets that is not held by the Group and are presented separately in the consolidated statement of comprehensive income and within equity in the consolidated statement of financial position separately from parent shareholders’ equity.
(e) use of estimates and assumptionsThe preparation of the financial statements in conformity with IFRS requires management to make judgements, estimates and assumptions that affect the application of policies and reported amounts of assets and liabilities, income and expenses. The estimates and associated assumptions are based on historical experience and other factors that are believed to be reasonable under the circumstances, the results of which form the basis of making the judgements about carrying values of assets and liabilities that are not readily apparent from other sources. Actual results may differ from these estimates. Where management’s judgement has been applied, this is noted in the relevant accounting policy.
Braveheart Investment Group | Annual Report and Accounts 2011
35notes to the finAnCiAl stAtements for the year ended 31 March 2011 continued | Accounts and Notes |
The key assumptions concerning the future and other key sources of estimating uncertainty at the reporting date that have a significant risk of causing a material adjustment to the carrying amounts of assets and liabilities within the next financial year are discussed below:
Fair value of unquoted investmentsUnquoted investments have been valued by the directors in compliance with the principles of the International Private Equity and Venture Capital Guidelines. The use of such valuation techniques requires the directors to make certain judgements including making assessments of future revenue and earnings of portfolio companies, appropriate multiples to apply and marketability and other risk discounts and provisions and hence they are subject to uncertainty. The fair value of unquoted investments at 31 March 2011 was £3,925,991 (2010: £4,495,726).
Share-based paymentsThe Group measures the cost of equity-settled transactions by reference to the fair value of the equity instruments at the date at which they were granted. Judgement is required in determining the most appropriate valuation model for a grant of equity instruments depending on the terms and conditions of the grant. Management are also required to use certain assumptions in determining the most appropriate inputs to the valuation model including expected life of the option, volatility, risk free rate and dividend yield. The assumptions and models used are fully disclosed in note 22.
Contingent considerationUnder IFRS 3: Business combinations contingent consideration is included in the cost of a business combination to the extent that it is deemed probable and can be measured reliably. This requires management to assess the probability and to estimate the financial impact of events on which consideration is contingent. Under IFRS 3 Revised an assessment of probability is no longer required but initial fair value has to be assessed at acquisition date and post acquisition changes in fair value are charged to the statement of comprehensive income.
Intangible assetsIntangible assets that are acquired as a result of a business combination are separately recognised on acquisition at their fair value and amortised over their expected useful life. This requires management to make an assessment of an asset’s separability, revenue stream and life, and apply suitable valuation methodologies thereto.
Impairment of goodwill Goodwill is subject to an impairment test on an annual basis or earlier where any event or change in circumstance is identified that indicates that the carrying value may not be recoverable. Testing for impairment requires a comparison of the carrying value amount of goodwill against the recoverable amount, which is the value-in-use of the cash-generating unit to which the goodwill is allocated. Value-in-use requires estimation of future cash flows expected from the cash-generating unit as well as an appropriate growth factor and discount rate to calculate the present value of the cash flows.
(f) Revenue recognition and segmental reportingThe Group earns fee income from the services it provides to its clients. Revenue is recognised at the fair value of the consideration received or receivable, excluding rebates. Fees earned for the provision of an ongoing service are recognised as that service is provided. Deal fees and facilitation fees are earned on individual transactions and related revenue is recognised on completion of the underlying transaction.
Dividend income is recognised when the Group’s right to receive payment is established.
Interest income is recognised using the effective interest method. Interest income is interest earned on bank deposit accounts and loan notes and is included within the statement of comprehensive income.
The business is regarded as one segment due to the nature of services provided and the methods used to provide these services. All operations are conducted in the United Kingdom and the Channel Islands.
(g) taxation The tax expense represents the sum of the tax currently payable and deferred tax. Current tax is based on taxable profit for the year. Taxable profit differs from net profit as reported in the statement of comprehensive income because it excludes items of income or expenses that are deductible in other years and it further excludes items that are never taxable or deductible. The Group’s liability for current tax is calculated using tax rates that have been enacted or substantively enacted by the reporting date.
Deferred tax is the tax expected to be payable or recoverable on differences between the carrying amounts of assets and liabilities in the financial statements and the corresponding tax bases used in the computation of taxable profits (‘temporary differences’) and is accounted for using the liability method.
A deferred tax asset or liability shall be recognised for all taxable temporary differences, except to the extent that the deferred tax asset or liability arises from (a) the initial recognition of goodwill, (b) the initial recognition of an asset or liability in a transaction which (i) is not a business combination and (ii) at the time of the transaction, affects neither accounting profit/(loss) nor taxable profit/(loss) or (c) relates to an investment in subsidiary, except to the extent that (i) the parent is able to control timing of reversal and (ii) it is probable that temporary differences will not reverse in the foreseeable future. Deferred tax assets are recognised to the extent that it is probable that taxable profits will be available against which deductible temporary differences can be utilised. Deferred tax is calculated at the tax rates that are expected to apply in the period when the liability is settled or the asset is realised using tax rates and laws that have been enacted or substantively enacted by the reporting date.
36
Braveheart Investment Group | Annual Report and Accounts 2011
| Accounts and Notes | notes to the finAnCiAl stAtements for the year ended 31 March 2011 continued
(h) property, plant and equipment Property, plant and equipment are stated at cost less accumulated depreciation and any recognised impairment.
Depreciation has been provided on the following basis annually: Computer equipment 33.3% reducing balance Fixtures and fittings 20.0% reducing balance
The carrying value of assets and their useful lives are reviewed at each reporting date and if an indication of impairment exists, the assets will be written down to their recoverable amount and the impairment charged to the statement of comprehensive income in the period in which it arises.
(i) intangible assetsGoodwillGoodwill represents the excess of the cost of an acquisition over the fair value of the net identifiable assets of the acquired subsidiary at the date of acquisition. Goodwill on acquisition of subsidiaries is included in intangible assets. Goodwill is tested annually for impairment and carried at cost less accumulated impairment losses.
Other intangible assetsIntangible assets that are acquired as a result of a business combination are separately recognised on acquisition at their fair value. Brands are valued using the ‘relief from royalty’ method and databases are valued using the ‘cost to recreate’ method. Amortisation is charged on a 10% straight line basis to the statement of comprehensive income over their expected useful economic lives and is included within “other operating costs”.
(j) impairment of intangible assets Goodwill is subject to an impairment test on an annual basis or earlier where any event or change in circumstance is identified that indicates that the carrying value may not be recoverable. Testing for impairment requires a comparison of the carrying value amount of goodwill against the recoverable amount, which is the value-in-use of the cash-generating unit to which the goodwill is allocated. Value-in-use requires estimation of future cash flows expected from the cash-generating unit as well as an appropriate growth factor and discount rate to calculate the present value of the cash flows.
Assets that are subject to amortisation are tested for impairment whenever events or changes in circumstances indicate that the carrying amount may not be recoverable. The recoverable amount is the higher of an asset’s fair value less costs to sell and its value-in-use.
Impairment losses are recognised immediately in the statement of comprehensive income.
(k) financial assets Financial assets are recognised when the Group becomes party to the contracts that give rise to them and are classified at initial recognition as either financial assets at fair value through profit or loss or loans and receivables. Financial assets are derecognised when the rights to receive cash flows from the asset have expired or the Group has transferred substantially all the risks and rewards of the asset.
Investments at fair value through profit or loss Investments, which include equity and debt investments, are designated on initial recognition as financial assets at fair value through profit or loss. This measurement basis is consistent with the fact that the Group’s performance in respect of its portfolio investments is evaluated on a fair value basis in accordance with an established investment strategy. When investments are recognised initially, they are measured at fair value.
After initial recognition the fair value of listed investments is determined by reference to bid prices at the close of business on the reporting date.
Unlisted equity investments are measured at fair value by the directors in compliance with the principles of the International Private Equity and Venture Capital Guidelines, updated and effective August 2010, as recommended by the European Venture Capital Association. The fair value of unlisted equity investments is determined using one of the valuation methodologies set out in the guidelines. These include using recent arm’s length market transactions; reference to the current market value of another instrument which is substantially the same; earnings or profit multiples; indicative offers; discounted cash flow analysis and pricing models.
Wherever possible the Group uses valuation techniques which make maximum use of observable market based inputs and accordingly the basis of the valuation methodology used most commonly by the Group is ‘price of most recent investment’.
In calculating fair value, the directors have also taken account of rights which when exercised either enhance or diminish the value of the investment. These rights are reviewed on a regular basis to assess whether they are likely to be exercised. The extent of any impact on the value of the investments has been calculated on the basis that all quantifiable rights are, or are likely to be exercisable, or occur automatically on certain events taking place, such as exit and liquidation preferences on realisation.

Braveheart Investment Group | Annual Report and Accounts 2011
37notes to the finAnCiAl stAtements for the year ended 31 March 2011 continued | Accounts and Notes |
Debt investments are generally unquoted debt instruments which are convertible to equity at a future point in time. Such instruments are considered to be hybrid instruments containing a fixed rate debt host contract with an embedded equity derivative. The Group designates the entire hybrid contract at fair value through profit or loss on initial recognition and accordingly, the embedded derivative is not separated from the host contract and accounted for separately. Given their short term nature, the fair value of debt investments is deemed to be cost less any impairment provision.
The gains and losses arising from changes in fair value are recognised in the statement of comprehensive income in the period in which they arise.
Loans and receivablesLoans and receivables are non-derivative financial assets with fixed or determinable payments that are not quoted in an active market and comprise trade and other receivables, other financial assets and cash and cash equivalents, all of which are initially recognised at fair value and are subsequently measured at amortised cost using the effective interest rate method.
Trade receivablesTrade receivables are initially recognised at fair value which is normally the invoice value in short term receivables. Thereafter the receivables are carried at amortised cost. Provision is made where there is objective evidence that a balance will not be recovered in full in accordance with the instruments original terms. An impairment calculation is based on a comparison between the carrying amount and the net present value of expected future cash flows, discounted by the original effective rate.
Cash and cash equivalents Cash and cash equivalents comprise cash in hand and short term bank deposits.
(l) financial liabilitiesFinancial liabilities, which comprise trade and other payables, are initially recognised at fair value and are carried at amortised cost.
(m) the Company’s investment in its subsidiariesIn the Company’s accounts, investment in its subsidiary undertakings is stated at cost less any provision for impairment.
(n) Contingent considerationContingent consideration is recognised at fair value. Under IFRS 3 contingent consideration was recognised when it was probable and was capable of being measured reliably and changes after initial recognition were recognised as movements in goodwill. Under IFRS 3 Revised, contingent consideration is fair valued at initial recognition even if it is not probable, with subsequent changes recognised in the statement of comprehensive income.
(o) leases Lease payments under operating leases, where a significant proportion of the risks and benefits remain with the lessor, are recognised on a straight line basis over the term of the lease.
Hire purchase contracts, which transfer to the Group substantially all the risks and benefits incidental to ownership of the leased assets, are capitalised at the commencement of the lease at the fair value of the leased assets or, if lower, at the present value of the minimum lease payments. Lease payments are apportioned between finance charges and reduction of the lease liability so as to achieve a constant rate of interest on the remaining balance of the liability. Finance charges are recognised in the statement of comprehensive income.
(p) share capitalFinancial instruments issued by the Group are treated as equity if the holders have only a residual interest in the Group’s assets after deducting all liabilities. The Group considers its capital to comprise its share capital, merger reserve and retained earnings.
The Group’s capital management objectives are:
• toensuretheGroup’sabilitytocontinueasagoingconcern;• toensureasufficientcashbalanceismaintained;and• tomaximisereturnstoshareholders.
The Group continuously monitors rolling cash flow forecasts to ensure sufficient cash is available for anticipated cash requirements. The Group may issue new shares or realise investments to meet such requirements. To date the Group has negligible borrowings and does not pay a dividend. Investments made by the Group are subject to detailed selection criteria and are monitored carefully by the Board.
Braveheart Ventures Ltd, a Group investment management subsidiary, and Envestors Ltd, a Group corporate finance subsidiary, are subject to external capital requirements imposed by the Financial Services Authority and as such must ensure that they have sufficient capital to satisfy these requirements. The Group ensures it remains compliant with these requirements as described in the financial statements of each company.
There has been no change in capital management objectives, policies and procedures from the previous year.

38
Braveheart Investment Group | Annual Report and Accounts 2011
| Accounts and Notes | notes to the finAnCiAl stAtements for the year ended 31 March 2011 continued
(q) share-based paymentsThe cost of equity-settled transactions with employees is measured by reference to the fair value of the instruments issued at the date at which they are granted and is recognised as an expense over the vesting period, which ends on the date on which the relevant employees become fully entitled to the award. Fair value is determined using an appropriate pricing model. In valuing equity-settled transactions, no account is taken of any vesting conditions, other than conditions linked to the price of the shares of the Company (market conditions).
No expense is recognised for awards that do not ultimately vest, except for awards where vesting is conditional upon a market condition, which are treated as vesting irrespective of whether or not the market condition is satisfied, provided that all other performance conditions are satisfied.
At each reporting date before vesting, the cumulative expense is calculated, representing the extent to which the vesting period has expired and management’s best estimate of the achievement or otherwise of non-market conditions and of the number of equity instruments that will ultimately vest or, in the case of an instrument subject to a market condition, be treated as vesting as described above. The movement in cumulative expense since the previous reporting date is recognised in the statement of comprehensive income, with a corresponding entry in equity.
Where the terms of an equity-settled award are modified or a new award is designated as replacing a cancelled or settled award, the cost based on the original award terms continues to be recognised over the original vesting period. In addition, any expense is recognised over the remainder of the new vesting period for the incremental fair value of any modification, based on the difference between the fair value of the original award and the fair value of the modified award, both as measured on the date of the modification. No reduction is recognised if this difference is negative.
Where an equity-settled award is cancelled, it is treated as if it had vested on the date of cancellation and any cost not yet recognised in the statement of comprehensive income for the award is expensed immediately. Any compensation paid up to the fair value of the award at the cancellation or settlement date is deducted from equity, with any excess over fair value being treated as an expense in the statement of comprehensive income.
(r) pensionsThe Group makes defined pension contributions under flexible remuneration arrangements to certain employees of Viking Fund Managers Ltd, one of its subsidiary undertakings.
(s) Business combinationsThe Group uses the purchase method of accounting to account for acquisition of subsidiaries. The cost of an acquisition is measured as the fair value of the assets given, equity instruments issued and liabilities incurred or assumed at the date of exchange, plus, under IFRS 3 but no longer under IFRS 3 Revised, costs directly attributable to the acquisition. Identifiable assets acquired and liabilities and contingent liabilities assumed in a business combination are measured initially at their fair value at the acquisition date, irrespective of the extent of any non-controlling interest. The excess of the cost of acquisition over the fair value of the Group’s share of the identifiable net assets acquired is recorded as goodwill. If the cost of acquisition is less than the fair value of the net assets of the subsidiary acquired, the difference is recognised directly in the statement of comprehensive income.
3 Revenue Revenue is attributable to the principal activities of the Group. 97% arose within the United Kingdom and 3% within the Channel Islands.
Group Group 2011 2010 £ £
Investment management 677,767 483,438Consultancy 248,014 84,803
925,781 568,241
During the year, one customer accounted for £140,754 of the Group’s combined investment management and consultancy revenue (2010: two customers totalling £234,200). The business is regarded as and financial performance is reported to the Board in respect of, one segment due to the nature of services provided and the methods used to provide these services.
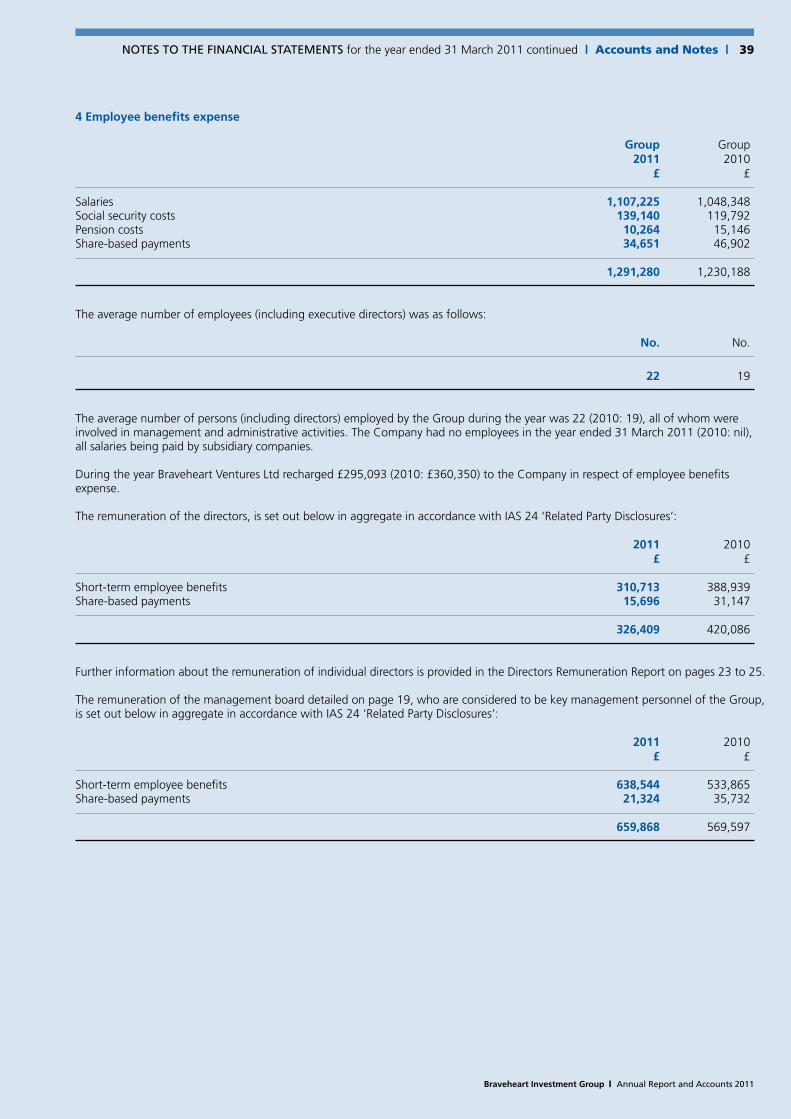
Braveheart Investment Group | Annual Report and Accounts 2011
39notes to the finAnCiAl stAtements for the year ended 31 March 2011 continued | Accounts and Notes |
4 Employee benefits expense
Group Group 2011 2010 £ £
Salaries 1,107,225 1,048,348Social security costs 139,140 119,792Pension costs 10,264 15,146Share-based payments 34,651 46,902
1,291,280 1,230,188
The average number of employees (including executive directors) was as follows:
No. No.
22 19
The average number of persons (including directors) employed by the Group during the year was 22 (2010: 19), all of whom were involved in management and administrative activities. The Company had no employees in the year ended 31 March 2011 (2010: nil), all salaries being paid by subsidiary companies.
During the year Braveheart Ventures Ltd recharged £295,093 (2010: £360,350) to the Company in respect of employee benefits expense.
The remuneration of the directors, is set out below in aggregate in accordance with IAS 24 ‘Related Party Disclosures’:
2011 2010 £ £
Short-term employee benefits 310,713 388,939Share-based payments 15,696 31,147
326,409 420,086
Further information about the remuneration of individual directors is provided in the Directors Remuneration Report on pages 23 to 25.
The remuneration of the management board detailed on page 19, who are considered to be key management personnel of the Group, is set out below in aggregate in accordance with IAS 24 ‘Related Party Disclosures’:
2011 2010 £ £
Short-term employee benefits 638,544 533,865Share-based payments 21,324 35,732
659,868 569,597

40
Braveheart Investment Group | Annual Report and Accounts 2011
| Accounts and Notes | notes to the finAnCiAl stAtements for the year ended 31 March 2011 continued
5 Finance revenue
Group Group 2011 2010 £ £
Bank interest receivable 9,856 24,202Interest on loan notes 21,773 9,339
31,629 33,541
6 Finance costs
Group Group 2011 2010 £ £
Finance charges payable under hire purchase contract 956 1,774Bank charges 3,413 –
4,369 1,774
7 Loss before tax
Group Group 2011 2010 £ £
Loss for the year has been arrived at after charging:Depreciation of property, plant and equipment 9,631 13,333Amortisation of intangibles 6,418 –Lease payments recognised as an operating lease (office rent) 79,486 78,747Loss on the disposal of property, plant and equipment 5,561 –Auditors remuneration: - audit of parent company 23,000 21,500 - audit of subsidiary companies 21,000 20,000 - audit related regulatory reporting 3,350 3,000 - taxation compliance 11,300 6,250

Braveheart Investment Group | Annual Report and Accounts 2011
41notes to the finAnCiAl stAtements for the year ended 31 March 2011 continued | Accounts and Notes |
8 Tax on loss on ordinary activities No liability to UK corporation tax arose on ordinary activities for the year ended 31 March 2011 or for the year ended 31 March 2010.
Group Group 2011 2010 £ £
Reconciliation of total tax: Loss before tax (1,306,132) (767,155) Tax at the rate of 21% (2010: 21%) (274,288) (161,102)Disallowed expenses 46,841 115,263Unrealised loss/(profit) on the fair value movement of investments 73,441 (170,213)Increase in unutilised tax losses 150,636 213,157Other adjustments 3,370 2,895
Total tax reported in the statement of comprehensive income – –
The Group has potential deferred tax assets in respect of:• excessmanagementexpensesof£1,475,547arisingfromBraveheartInvestmentGroupplc;• excessmanagementexpensesof£928,777arisingfromCaledoniaPortfolioRealisationsLtd;• unutilisedtradinglossesof£1,343,471inBraveheartVenturesLtd;• unutilisedtradinglossesof£145,887inVikingFundManagersLtd;and• unutilisedtradinglossesof£132,543inEnvestorsLtd.
No deferred tax assets have been recognised in respect of these amounts as it is uncertain that there will be suitable taxable profits from which the future reversal of the deferred tax could be deducted.
9 Loss of the Parent Company
2011 2010 £ £
Loss of the Parent Company only (2,283,064) (578,540)
10 Loss per share
Basic loss per share has been calculated by dividing the loss attributable to equity holders of the parent by the weighted average number of ordinary shares in issue during the year.
The calculations of loss per share are based on the following loss and numbers of shares in issue:
2011 2010 £ £
Loss for the year attributable to equity holders of the parent (1,305,815) (775,513)
No. No.
Weighted average number of ordinary shares in issue: For basic loss per ordinary share 14,412,495 13,824,665Potentially dilutive ordinary shares – –
For diluted loss per ordinary share 14,412,495 13,824,665
There were no potentially dilutive ordinary shares which would increase the loss per share at the year end.
Following the year end, on 24 June 2011 the Company issued 4,132,574 new shares (see note 28).

42
Braveheart Investment Group | Annual Report and Accounts 2011
| Accounts and Notes | notes to the finAnCiAl stAtements for the year ended 31 March 2011 continued
11 Property, plant and equipment
Fixtures & Computer fittings equipment TotalGroup £ £ £
Cost At 1 April 2009 32,747 48,575 81,322Additions – 666 666
At 31 March 2010 32,747 49,241 81,988Additions 4,242 3,569 7,811Acquired 4,660 – 4,660Disposals (6,887) (3,310) (10,197)
At 31 March 2011 34,762 49,500 84,262
Accumulated depreciation At 1 April 2009 17,666 19,622 37,288Charge for year 3,017 10,316 13,333
At 31 March 2010 20,683 29,938 50,621Charge for year 3,007 6,624 9,631Disposals (1,777) (2,859) (4,636)
At 31 March 2011 21,913 33,703 55,616
Net Book ValueAt 31 March 2011 12,849 15,797 28,646
At 31 March 2010 12,064 19,303 31,367
Included within the net book value of computer equipment is £8,509 (2010: £12,763) relating to an asset held under a hire purchase agreement. The depreciation of computer equipment charged to the financial statements in the year in respect of this asset amounted to £4,254 (2010: £6,381).
12 Investments at fair value through profit or loss
Level 1 Level 2 Level 3
Equity Equity Debt Equity Debt investments investments investments in investments investments in quoted in unquoted unquoted in unquoted in unquoted companies companies companies companies companies Total
Group £ £ £ £ £ £
At 1 April 2009 15,652 3,017,026 227,834 3,260,512 Additions at Cost – – – 348,533 310,516 659,049 Conversions – – – 100,872 (100,872) – Change in Fair Value 19,369 – – 734,870 (143,053) 611,186
At 31 March 2010 35,021 – – 4,201,301 294,425 4,530,747 Additions at Cost – – – 77,389 35,267 112,656Disposals – – – (200,753) – (200,753)Conversions – – – 239,117 (239,117) –Change in Fair Value 17,609 – – (521,063) 39,425 (464,029)
At 31 March 2011 52,630 – – 3,795,991 130,000 3,978,621

Braveheart Investment Group | Annual Report and Accounts 2011
43notes to the finAnCiAl stAtements for the year ended 31 March 2011 continued | Accounts and Notes |
Level 1 Level 2 Level 3
Equity Equity Debt Equity Debt investments investments investments in investments investments in quoted in unquoted unquoted in unquoted in unquoted companies companies companies companies companies Total
Company £ £ £ £ £ £
At 1 April 2009 15,652 – – 2,498,003 221,834 2,735,489 Additions at Cost – – – 141,884 310,516 452,400 Conversions – – – 100,872 (100,872) – Change in Fair Value 19,369 – – 54,449 (137,053) (63,235)
At 31 March 2010 35,021 – – 2,795,208 294,425 3,124,654 Additions at Cost – – – 14,887 35,267 50,154Disposals – – – (180,753) – (180,753)Conversions – – – 239,117 (239,117) –Change in Fair Value 17,609 – – (541,946) 39,425 (484,912)
At 31 March 2011 52,630 – – 2,326,513 130,000 2,509,143
Investments, which include equity and debt investments, are designated on initial recognition as financial assets at fair value through profit or loss. This measurement basis is consistent with the fact that the Group’s performance in respect of its portfolio investments is evaluated on a fair value basis in accordance with an established investment strategy. When investments are recognised initially, they are measured at fair value.
After initial recognition the fair value of listed investments is determined by reference to bid prices at the close of business on the reporting date.
Unlisted equity investments are measured at fair value by the directors in compliance with the principles of the International Private Equity and Venture Capital Guidelines, updated and effective August 2010, as recommended by the European Venture Capital Association. The fair value of unlisted equity investments is determined using one of the valuation methodologies set out in the guidelines. These include using recent arm’s length market transactions; reference to the current market value of another instrument which is substantially the same; earnings or profit multiples; indicative offers; discounted cash flow analysis and pricing models.
The Group classifies its investments using a fair value hierarchy. Classification within the hierarchy has been determined on the basis of the lowest level input that is significant to the fair value measurement of the relevant investment as follows:
• Level1-valuedusingquotedpricesinactivemarketsforidenticalassets;• Level2-valuedbyreferencetovaluationtechniquesusingobservableinputsotherthanquotedpricesincludedwithinLevel1;
and• Level3-valuedbyreferencetovaluationtechniquesusinginputsthatarenotbasedonobservablemarketdata.
All unquoted investments have been classified within Level 3, their respective valuations having been calculated using a number of valuation techniques and assumptions, notwithstanding that the basis of the valuation methodology used most commonly by the Group is ‘price of most recent investment’. The use of reasonably possible alternative assumptions has no material effect on the fair valuation of the related investments. £181,276 of the Group Level 3 reduction in fair value (2010: £nil) and £91,206 of the Company Level 3 reduction in fair value (2010: £nil) relate to investments no longer held at the year end.
Details of investments where the nominal value of the holding in the undertaking is 20% or more of any class of share are as follows:
Name of Company Holding % of shares held Nature of Business
Verbalis Ltd (Verbalis) A Ordinary shares 100% Design and production of automated language translation systems
The above shareholding, which is held by Caledonia Portfolio Realisations Ltd (CPR), represents a 20% aggregate shareholding in Verbalis. Neither CPR nor the Company is represented on the Board or within management of Verbalis and in the opinion of the directors, this shareholding does not entitle the Company to exert a significant or dominant influence over Verbalis. The carrying value of Verbalis is nil.

44
Braveheart Investment Group | Annual Report and Accounts 2011
| Accounts and Notes | notes to the finAnCiAl stAtements for the year ended 31 March 2011 continued
13 Investment in subsidiariesThe Company has the following interests in subsidiary undertakings:
Name Country of Incorporation Nature of Business % Interest
Braveheart Ventures Ltd (BVL) Scotland Investment management 100%Caledonia Portfolio Realisations Ltd (CPR) Scotland Investment management 100%Caledonia LP Ltd Scotland Investment management 100%Strathclyde Innovation Fund GP Ltd Scotland Investment management 100%Caledonia Specialist Finance Ltd Scotland Dormant 100%Envestors Ltd England Investment management & business advisory services 100%Viking Fund Managers Ltd (VFM) England Investment management & business advisory services 100%Inkopo Consulting Ltd England Dormant 100%
Company £
Cost At 1 April 2009 1,233,705Additions: BVL (note 25) 325,000Additions: VFM 511,014Increase in investment value: CPR 295,392Impairment in investment value: VFM (note 15) (68,906)
At 31 March 2010 2,296,205Increase in investment value arising from share-based payments 265,771Additions: BVL (note 25) 200,000Impairment in investment value: BVL (1,442,848)Additions: Envestors (note 14, 25) 894,403Decrease in investment value: CPR (20,314)Increase in investment value: VFM (note 15) 44,880
At 31 March 2011 2,238,097
During the year the directors determined to write down the carrying value of the Company’s investment in BVL by £1,442,848 (2010: £nil) to BVL’s net asset value. This impairment provision is charged within the Company’s operating costs.
CPR is an unlisted company based in Scotland specialising in making investments in technology businesses. The acquisition of CPR included contingent consideration based on future exit values of its investment portfolio (see note 20).
Group entities act as General Partner to and have an interest in, the following limited partnership:
Name Place of Business % Interest
Strathclyde Innovation Fund LP (SIF) Scotland 89.29%
SIF has been included in the consolidated financial statements since 1 April 2008.
In addition, VFM holds the undernoted interest in the following business:
Name Country of Incorporation Nature of Business % Interest
Ridings Holdings Ltd (RHL) England Fund management 33.33%
This holding is classified as an investment held by a venture capital organisation and is measured at a fair value of £nil (2010: £nil) in accordance with IAS 39 Financial Instruments: Recognition and Measurement. For the 12 months ended 31 March 2011 RHL generated a profit after tax of £198,448 (15 months ended 31 March 2010: £2,191) and at 31 March 2011 had share capital and reserves of £200,112 (2010: £1,664).
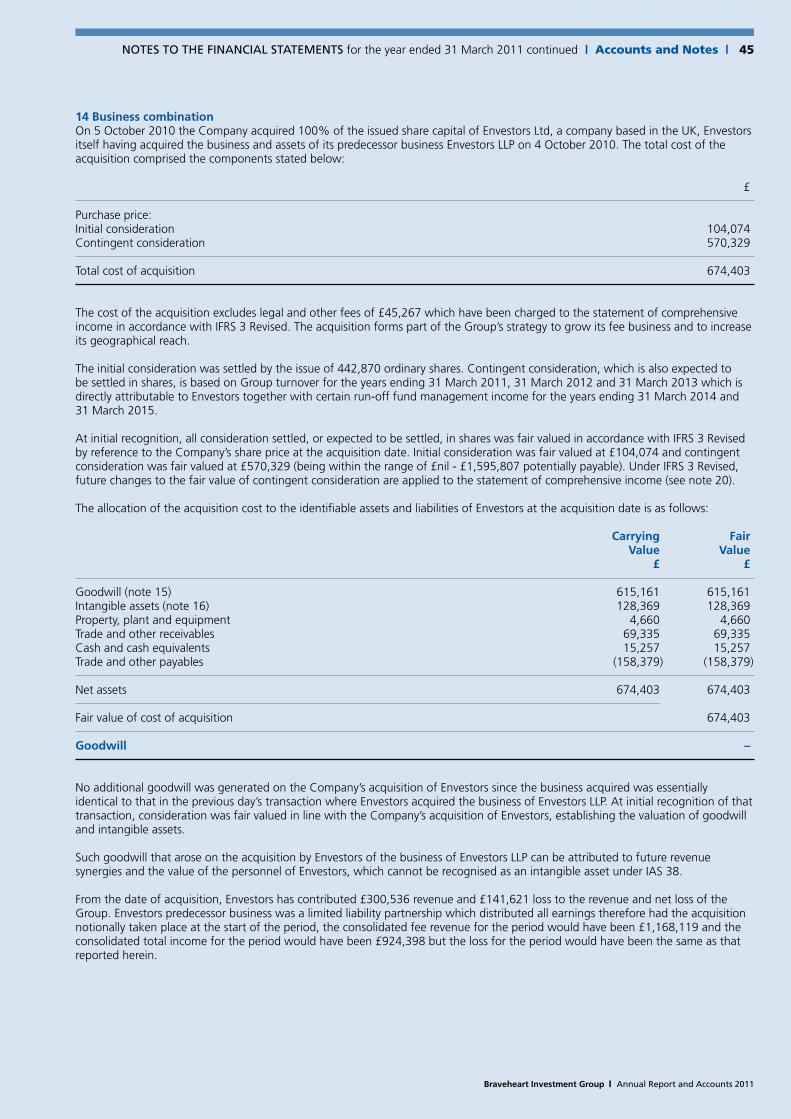
Braveheart Investment Group | Annual Report and Accounts 2011
45notes to the finAnCiAl stAtements for the year ended 31 March 2011 continued | Accounts and Notes |
14 Business combinationOn 5 October 2010 the Company acquired 100% of the issued share capital of Envestors Ltd, a company based in the UK, Envestors itself having acquired the business and assets of its predecessor business Envestors LLP on 4 October 2010. The total cost of the acquisition comprised the components stated below:
£
Purchase price: Initial consideration 104,074Contingent consideration 570,329
Total cost of acquisition 674,403
The cost of the acquisition excludes legal and other fees of £45,267 which have been charged to the statement of comprehensive income in accordance with IFRS 3 Revised. The acquisition forms part of the Group’s strategy to grow its fee business and to increase its geographical reach.
The initial consideration was settled by the issue of 442,870 ordinary shares. Contingent consideration, which is also expected to be settled in shares, is based on Group turnover for the years ending 31 March 2011, 31 March 2012 and 31 March 2013 which is directly attributable to Envestors together with certain run-off fund management income for the years ending 31 March 2014 and 31 March 2015.
At initial recognition, all consideration settled, or expected to be settled, in shares was fair valued in accordance with IFRS 3 Revised by reference to the Company’s share price at the acquisition date. Initial consideration was fair valued at £104,074 and contingent consideration was fair valued at £570,329 (being within the range of £nil - £1,595,807 potentially payable). Under IFRS 3 Revised, future changes to the fair value of contingent consideration are applied to the statement of comprehensive income (see note 20).
The allocation of the acquisition cost to the identifiable assets and liabilities of Envestors at the acquisition date is as follows:
Carrying Fair Value Value £ £
Goodwill (note 15) 615,161 615,161Intangible assets (note 16) 128,369 128,369Property, plant and equipment 4,660 4,660Trade and other receivables 69,335 69,335Cash and cash equivalents 15,257 15,257Trade and other payables (158,379) (158,379)
Net assets 674,403 674,403
Fair value of cost of acquisition 674,403
Goodwill –
No additional goodwill was generated on the Company’s acquisition of Envestors since the business acquired was essentially identical to that in the previous day’s transaction where Envestors acquired the business of Envestors LLP. At initial recognition of that transaction, consideration was fair valued in line with the Company’s acquisition of Envestors, establishing the valuation of goodwill and intangible assets.
Such goodwill that arose on the acquisition by Envestors of the business of Envestors LLP can be attributed to future revenue synergies and the value of the personnel of Envestors, which cannot be recognised as an intangible asset under IAS 38.
From the date of acquisition, Envestors has contributed £300,536 revenue and £141,621 loss to the revenue and net loss of the Group. Envestors predecessor business was a limited liability partnership which distributed all earnings therefore had the acquisition notionally taken place at the start of the period, the consolidated fee revenue for the period would have been £1,168,119 and the consolidated total income for the period would have been £924,398 but the loss for the period would have been the same as that reported herein.

46
Braveheart Investment Group | Annual Report and Accounts 2011
| Accounts and Notes | notes to the finAnCiAl stAtements for the year ended 31 March 2011 continued
15 Goodwill
VFM Envestors Total £ £ £
At 1 April 2009 – – –Arising on initial recognition of acquisition 395,970 – 395,970(Decrease) in period (68,906) – (68,906)
At 31 March 2010 327,064 – 327,064Acquired on acquisition (note 14) – 615,161 615,161Increase in period 44,880 – 44,880
At 31 March 2011 371,944 615,161 987,105
The acquisition of Viking Fund Managers (VFM) has been accounted for under IFRS 3. At initial recognition, contingent consideration settled, or to be settled, in shares was fair valued by reference to the Company’s share price at the acquisition date. The movement in goodwill in the period since acquisition is primarily due to movements in the fair value of contingent consideration resulting from movements in the Company’s share price.
The acquisition of Envestors has been accounted for under IFRS 3 Revised. At initial recognition, consideration settled, or to be settled, in shares was fair valued by reference to the Company’s share price at the acquisition date. Under IFRS 3 Revised, future changes to the fair value of contingent consideration are applied to the statement of comprehensive income and accordingly goodwill will remain constant unless impaired.
At the end of the reporting period, the Group assessed the recoverable amount of the above goodwill associated with each of the VFM and Envestors cash-generating units (both being part of the Group’s only operating segment) and determined that goodwill was not impaired. The recoverable amount was assessed by reference to the cash-generating unit’s value-in-use based on internally prepared and approved 10 year cash flow projections (a reasonable measurement period in the Group’s line of business) assuming the following inflationary growth rates and applying the following discount factors:
VFM EnvestorsCash-generating unit 2011 2010 2011 2010
Inflationary growth rate (average p.a.) 3 - 5% 4% 3 - 5% –Discount factor (p.a.) 9% 9% 9% –
These factors are based on past experience and future expectations which the directors consider to be appropriate. Value-in-use estimates arising from reasonably possible changes to these factors do not indicate impairment.
16 Intangible assets
Brand Database TotalGroup £ £ £
Cost At 1 April 2009 and 31 March 2010 – – –Acquired on acquisition (note 14) 66,869 61,500 128,369
At 31 March 2011 66,869 61,500 128,369
Accumulated amortisation At 1 April 2009 and 31 March 2010 – – –Amortisation 3,343 3,075 6,418
At 31 March 2011 3,343 3,075 6,418
Net Book ValueAt 31 March 2011 63,526 58,425 121,951
At 31 March 2010 – – –

Braveheart Investment Group | Annual Report and Accounts 2011
47notes to the finAnCiAl stAtements for the year ended 31 March 2011 continued | Accounts and Notes |
Intangible assets acquired on acquisition first arose on the acquisition by Envestors of the business of Envestors LLP (as described in note 14) and comprise Envestors’ brand and database of high-net-worth investor contacts. The brand has been valued using the ‘relief from royalty’ method and the database using the ‘cost to recreate’ method.
All intangible assets are amortised at 10% straight line over 10 years.
17 Trade and other receivables
Group Group Company Company 2011 2010 2011 2010
Trade receivables 124,895 83,398 – –Prepayments and accrued income 57,211 18,509 18,571 7,434Amounts due from related parties – – 477,373 326,190Other receivables 54,112 – 63,577 15,256
236,218 101,907 559,521 348,880
As trade receivables are generally of short term maturity, the directors consider the carrying amounts to approximate their fair value. All receivables are non-interest bearing and unsecured.
18 Cash and cash equivalents
Group Group Company Company 2011 2010 2011 2010
Cash at bank and on hand 643,203 1,473,943 573,965 1,377,327
Cash balances are held with Bank of Scotland plc and HSBC Bank plc and earn interest at floating rates based on daily bank deposit rates.
19 Trade and other payables
Group Group Company Company 2011 2010 2011 2010
Trade payables 74,714 13,124 25,994 418Amounts due to related parties – – 269,675 226,542Other taxes and social security 65,424 39,771 – –Accruals 104,584 73,141 38,950 43,853
244,722 126,036 334,619 270,813
Due to the short term maturity of trade payables, the directors consider the carrying amounts to approximate their fair value. Trade payables are non-interest bearing and are normally settled on 30-day terms.
20 Contingent considerationShort term contingent consideration of £592,420 (2010: £592,819) comprises (i) £123,701 (2010: £87,916) being the fair value of the consideration due at 31 March 2011 in respect of the acquisition of Viking Fund Managers (VFM) and will be satisfied by the issue of 399,034 ordinary shares of 2 pence each in the Company (2010: 390,737 shares) and (ii) £468,719 (2010: £504,903) being the sum due on future exit values of the Caledonia Portfolio Realisation portfolio. No short term consideration is payable in respect of the acquisition of Envestors.
Long term contingent consideration of £574,378 (2010: £78,822) represents (i) £574,378 (2010: £nil) being the fair value of long term contingent consideration due in respect of the acquisition of Envestors (equivalent to 1,852,832 ordinary shares of 2 pence each). Other than as noted above, no further consideration (2010: £78,822) remains payable in respect of the acquisition of VFM.

48
Braveheart Investment Group | Annual Report and Accounts 2011
| Accounts and Notes | notes to the finAnCiAl stAtements for the year ended 31 March 2011 continued
21 Share capital
2011 2010 £ £
Allotted, called up and fully paid 14,749,439 ordinary shares of 2 pence each(2010: 13,915,832 ordinary shares of 2 pence each) 294,988 278,316
During the year, the Company issued 442,870 ordinary shares of 2 pence each as initial consideration for the acquisition of Envestors and 390,737 ordinary shares of 2 pence each as the second tranche consideration for the acquisition of Viking Fund Managers. The Company has one class of ordinary shares. All shares carry equal voting rights, equal rights to income and distribution of assets on liquidation or otherwise and no right to fixed income.
22 Share-based payments The Group operates the Braveheart Investment Group plc Executive Share Option Scheme 2006 (the Scheme), which comprises Part A, a share option scheme approved by HMRC (the Approved Scheme) and Part B, an unapproved share option scheme (the Unapproved Scheme).
Historically, the Scheme was open to all directors and employees of the Group, although non-executive directors could only participate in Part B. The Scheme is now only open to all executive directors and employees.
Options are granted by the Board taking into account the need to motivate, retain and recruit high calibre employees and with regard to the contribution that such employees are expected to make in achieving the Group’s objectives.
Options granted under the Scheme are categorised as either Employment Options, Performance Options or Other Options. Employment Options may be granted under either Part A or Part B. All Performance Options and Other Options are granted under Part B.
Employment Options vest and become exercisable on the third anniversary of date of grant and generally lapse on the earlier of cessation of employment (or 6 months thereafter if options have vested at cessation date) or the 10th anniversary of date of grant.
Performance Options have vesting conditions linked to the growth in the Company’s market capitalisation from the date of grant (Performance Conditions). If a Performance Condition is not met, the related Performance Option lapses at the end of the relevant measurement period.
Otherwise Performance Options vest on attainment of the Performance Condition and become exercisable on the 1st anniversary of the date of the Performance Condition being met and lapse on the 10th anniversary of date of grant.
Other Options, granted for the first time during the year ended 31 March 2011, are immediately exercisable and lapse on the 10th anniversary of date of grant.
During the year ended 31 March 2010, on 18 June 2009, 291,826 Employment Options and 292,500 Performance Options were granted. No Employment Options vested or were exercised and 28,314 lapsed. No Performance Options have vested or were exercised and 443,899 lapsed, the majority due to the related Performance Condition not having been met.
During the current year ended 31 March 2011, on 5 July 2010, 322,257 Employment Options, 338,458 Performance Options and 353,538 Other Options were granted. On 5 October 2010, 96,154 Employment Options and 95,237 Performance Options were granted. 63,386 Employment Options vested, none were exercised and 66,049 lapsed. 512,975 Performance Options lapsed during the year, the majority due to the related Performance Condition not having been met. All 426,003 Performance Options remaining outstanding at 31 March 2011 have vested, though are not yet exercisable. Also, 8,889 Other Options lapsed during the year.
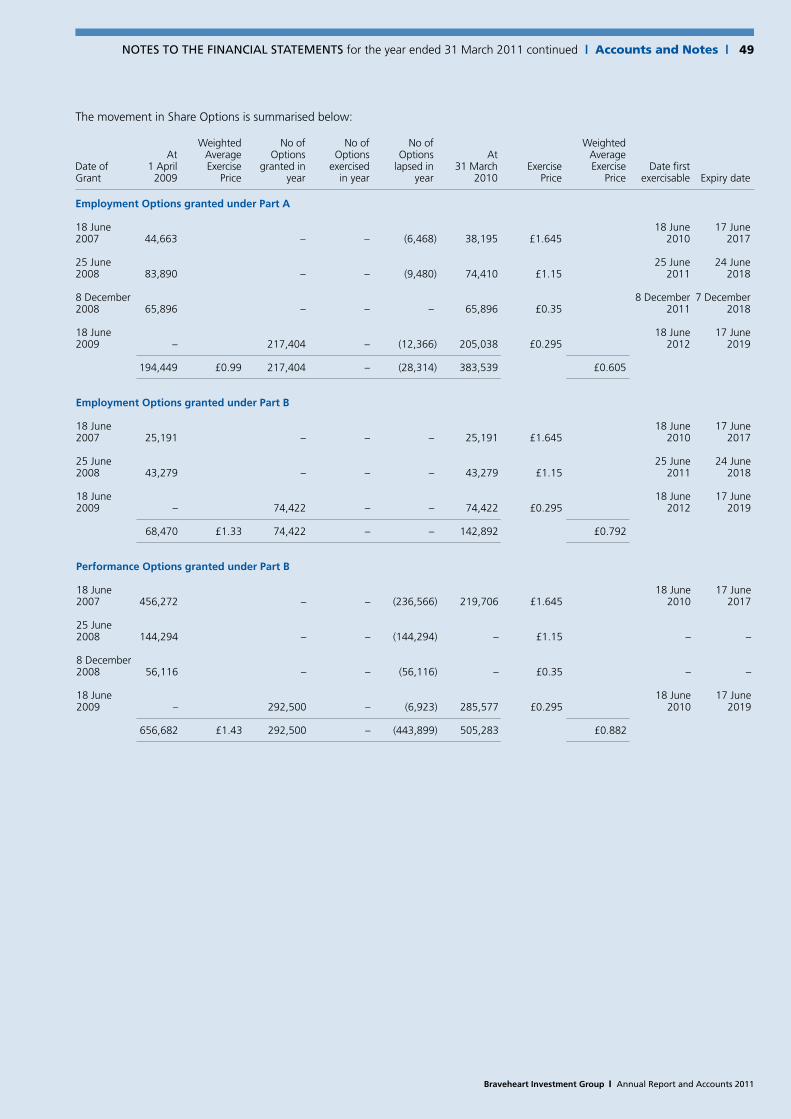
Braveheart Investment Group | Annual Report and Accounts 2011
49notes to the finAnCiAl stAtements for the year ended 31 March 2011 continued | Accounts and Notes |
The movement in Share Options is summarised below:
Weighted No of No of No of Weighted At Average Options Options Options At AverageDate of 1 April Exercise granted in exercised lapsed in 31 March Exercise Exercise Date firstGrant 2009 Price year in year year 2010 Price Price exercisable Expiry date
Employment Options granted under Part A 18 June 18 June 17 June 2007 44,663 – – (6,468) 38,195 £1.645 2010 2017
25 June 25 June 24 June2008 83,890 – – (9,480) 74,410 £1.15 2011 2018
8 December 8 December 7 December2008 65,896 – – – 65,896 £0.35 2011 2018
18 June 18 June 17 June2009 – 217,404 – (12,366) 205,038 £0.295 2012 2019
194,449 £0.99 217,404 – (28,314) 383,539 £0.605
Employment Options granted under Part B 18 June 18 June 17 June2007 25,191 – – – 25,191 £1.645 2010 2017
25 June 25 June 24 June2008 43,279 – – – 43,279 £1.15 2011 2018
18 June 18 June 17 June2009 – 74,422 – – 74,422 £0.295 2012 2019
68,470 £1.33 74,422 – – 142,892 £0.792
Performance Options granted under Part B 18 June 18 June 17 June2007 456,272 – – (236,566) 219,706 £1.645 2010 2017 25 June 2008 144,294 – – (144,294) – £1.15 – –
8 December 2008 56,116 – – (56,116) – £0.35 – –
18 June 18 June 17 June2009 – 292,500 – (6,923) 285,577 £0.295 2010 2019
656,682 £1.43 292,500 – (443,899) 505,283 £0.882

50
Braveheart Investment Group | Annual Report and Accounts 2011
| Accounts and Notes | notes to the finAnCiAl stAtements for the year ended 31 March 2011 continued
The movement in Share Options is summarised below:
Weighted No of No of No of Weighted At Average Options Options Options At AverageDate of 1 April Exercise granted in exercised lapsed in 31 March Exercise Exercise Date firstGrant 2010 Price year in year year 2011 Price Price exercisable Expiry date
Employment Options granted under Part A 18 June 18 June 17 June2007 38,195 – – – 38,195 £1.645 2010 2017
25 June 25 June 24 June2008 74,410 – – (5,549) 68,861 £1.15 2011 2018
8 December 8 December 7 December2008 65,896 – – (20,809) 45,087 £0.35 2011 2018
18 June 18 June 17 June2009 205,038 – – (31,368) 173,670 £0.295 2012 2019
5 July 5 July 4 July2010 – 232,648 – (8,323) 224,325 £0.255 2013 2020
5 October 5 October 4 October2010 – 96,154 – – 96,154 £0.235 2013 2020
383,539 £0.605 328,802 – (66,049) 646,292 £0.447
Employment Options granted under Part B 18 June 18 June 17 June2007 25,191 – – – 25,191 £1.645 2010 2017
25 June 25 June 24 June2008 43,279 – – – 43,279 £1.15 2011 2018
18 June 18 June 17 June2009 74,422 – – – 74,422 £0.295 2012 2019
5 July 5 July 4 July2010 – 89,609 – – 89,609 £0.255 2013 2020
142,892 £0.792 89,609 – – 232,501 £0.585
Performance Options granted under Part B 18 June 18 June 17 June2007 219,706 – – (219,706) – £1.645 2010 2017
18 June 18 June 17 June2009 285,577 – – (285,577) – £0.295 2010 2019
5 July 5 October 4 July2010 – 338,458 – (7,692) 330,766 £0.255 2011 2020
5 October 5 January 4 October2010 – 95,237 – – 95,237 £0.235 2012 2020
505,283 £0.882 433,695 – (512,975) 426,003 £0.251
Other Options granted under Part B
5 July 5 July 4 July2010 – – 353,538 – (8,889) 344,649 £0.255 £0.255 2010 2020
408,035 shares were exercisable at 31 March 2011 (2010: nil). The weighted average exercise price of the total number of options granted and not exercised at 31 March 2011 was £0.376 (2010: £0.766) and the weighted average contractual life of the options was 3,227 days (2010: 3,112 days).

Braveheart Investment Group | Annual Report and Accounts 2011
51notes to the finAnCiAl stAtements for the year ended 31 March 2011 continued | Accounts and Notes |
The Performance Conditions attached to the Performance Options are as follows:
Percentage of the grant to which theDate of grant Performance Condition Performance Condition applies
5 July 2010 Braveheart’s market capitalisation exceeds the benchmark 100.00% price by 25% for 5 consecutive business days at any time before 5 October 2011.
5 October 2010 Braveheart’s market capitalisation exceeds the benchmark 100.00% price by 25% for 5 consecutive business days at any time before 5 January 2012.
The benchmark price is the option exercise price multiplied by the number of ordinary shares of 2 pence each in the issued share capital of the Company on the date of grant of the related option.
The option exercise price is the closing mid-market price on AIM of an ordinary share of 2 pence each in Braveheart Investment Group plc share on the last business day prior to the date of the grant. The charge made in respect of the fair value of options granted was:
2011 2010 £ £
Expense arising from equity-settled share-based payments transactions 34,651 46,902
The fair value of Performance Options is estimated at the date of grant using a Trinomial option pricing model. The fair value of Employment Options is estimated at the date of grant using a Black-Scholes option pricing model.
The following assumptions have been used in calculating the fair value of share options:
Options granted in year ended 31 March 2011 2010 Employment Performance Employment Performance Options Options Options Options
Valuation method Black-Scholes Trinomial Black-Scholes TrinomialRisk free interest rate 1.5% 1.5% 2.3% 2.3%Expected life (average years) 3 2 3 2Expected volatility 42% 42% 40% 40%Dividend yield 0% 0% 0% 0%
The expected life of the options is the expected average point at which an option becomes exercisable. The expected volatility is based on historical volatility of the share price of the Company and of quoted comparable companies over the most recent period at the date of grant that is commensurate with the average expected life of the option. The weighted average share price used in each calculation was equal to the option exercise price.
23 Operating lease commitments The Group entered into a commercial lease on its office premises in Perth in June 2005 for a five year period and the lease has been extended for a further five years. Viking Fund Managers entered into a one year commercial lease on its office premises in November 2010. Envestors entered into a five year commercial lease on its office premises commencing July 2010. Renewals are at the option of the lessor. There are no restrictions placed upon the lessee by entering into these leases.
Future minimum rentals payable under operating leases are as follows:
2011 2010 £ £
Future minimum payments due: Not later than one year 77,980 47,180In two to five years 210,933 140,000
288,913 187,180

52
Braveheart Investment Group | Annual Report and Accounts 2011
| Accounts and Notes | notes to the finAnCiAl stAtements for the year ended 31 March 2011 continued
24 BorrowingsThe Group entered into a hire purchase contract for the purchase of computer equipment in November 2008. The asset is included under computer equipment in note 11. The effective interest rate is 7.6%
Future minimum rentals payable under the hire purchase contract are as follows:
2011 2010 £ £
Future minimum payments due: Not later than one year 6,629 10,696In two to five years – 6,625
6,629 17,321
At 31 March 2011 Strathclyde Innovation Fund LP had received £41,664 (2010: £28,580) from limited partners unrelated to the Group to cover partnership obligations. Such sums are treated as long terms loans from limited partners.
25 Related party disclosuresTrade and other receivables (note 17) include the following amounts due from subsidiary undertakings:
2011 2010 £ £
Caledonia Portfolio Realisations Ltd 21,210 50,453Caledonia LP Ltd 293,972 238,167Viking Fund Managers Ltd (VFM) 161,570 37,570Envestors Ltd 621 –
477,373 326,190
Trade and other payables (note 19) include the following amounts due to subsidiary undertakings:
2011 2010 £ £
Braveheart Ventures Ltd (BVL) 269,675 226,542
All above amounts are unsecured, interest free and repayable on demand.
During the year, the Company subscribed for 2,000,000 redeemable preference shares (2010: 3,250,000) of 10 pence each in BVL at an aggregate cost of £200,000 (2010: £325,000). The Company also subscribed for 220,000 redeemable preference shares of £1 each in Envestors at an aggregate cost of £220,000.
Transactions between the Company and its subsidiaries are eliminated on consolidation.
Group entities have a limited partnership interest in (note 13) and act as General Partner to, Strathclyde Innovation Fund LP.
Certain executive and non-executive directors are clients of BVL. Investment transactions executed on their behalf are carried out on the same commercial terms as all other clients of BVL. Fees arising during the year from such transactions were as follows: Garry Watson £1,090 (2010: £503) and Edward Cunningham £5,154 (2010: £nil).
Andrew Burton is a director of VFM. During the year Mr Burton was a 33% shareholder in Yorkshire Association of Business Angels Ltd which VFM invoiced £140,754 (2010: £120,600) for services during the year of which £14,203 (2010: £13,395) was outstanding at 31 March 2011.
During the year, VFM was charged rent totalling £20,880 (2010: £20,783) in respect of business premises owned personally by Mr and Mrs Burton. As at 31 March 2011, £3,600 (2010: £nil) was due to Mr and Mrs Burton.

Braveheart Investment Group | Annual Report and Accounts 2011
53notes to the finAnCiAl stAtements for the year ended 31 March 2011 continued | Accounts and Notes |
26 Financial risk management objectives and policies (Group and Company)The Group and Company’s financial instruments comprise investments designated at fair value through profit or loss, cash and various items such as trade and other receivables and trade and other payables, all of which arise directly from its normal operations.
The carrying values of all of the Group and Company’s financial instruments approximate their fair values at 31 March 2011 and 31 March 2010. The Accounting Policies described in note 2 outline how the financial instruments are measured.
An analysis of the statement of financial position, relevant to an analysis of risk management, is as follows:
Financial Instruments
Non-financial assets & financial Designated at fair assets outwith value through Loans and the scope profit or loss receivables of IAS 39 Total £ £ £ £
Group 2011 Investments 3,978,621 – – 3,978,621Trade and other receivables – 179,007 57,211 236,218Cash and cash equivalents – 643,203 – 643,203
3,978,621 822,210 57,211 4,858,042
2010 Investments 4,530,747 – – 4,530,747Trade and other receivables – 83,398 18,509 101,907Cash and cash equivalents – 1,473,943 – 1,473,943
4,530,747 1,557,341 18,509 6,106,597
Company 2011 Investments 2,509,143 – 2,238,097 4,747,240Trade and other receivables – 540,950 18,571 559,521Cash and cash equivalents – 573,965 – 573,965
2,509,143 1,114,915 2,256,668 5,880,726
2010 Investments 3,124,654 – 2,296,205 5,420,859Trade and other receivables – 341,446 7,434 348,880Cash and cash equivalents – 1,377,327 – 1,377,327
3,124,654 1,718,773 2,303,639 7,147,066

54
Braveheart Investment Group | Annual Report and Accounts 2011
| Accounts and Notes | notes to the finAnCiAl stAtements for the year ended 31 March 2011 continued
Other Liabilities financial not within liabilities at the scope amortised cost of IAS 39 Total £ £ £
Group 2011 Trade and other payables 244,722 – 244,722Contingent consideration 698,079 468,719 1,166,798Borrowings 40,713 6,629 47,342
983,514 475,348 1,458,862
2010 Trade and other payables 126,036 – 126,036Contingent consideration 504,903 166,738 671,641Borrowings 28,580 17,321 45,901
659,519 184,059 843,578
Company 2011 Trade and other payables 334,619 – 334,619Contingent consideration 698,079 468,719 1,166,798
1,032,698 468,719 1,501,417
2010 Trade and other payables 270,813 – 270,813Contingent consideration 504,903 166,738 671,641
775,716 166,738 942,454
One of the Group’s principal objectives and policies is to achieve income and capital gains through investment in equity shares in a portfolio of UK companies, the majority of which are unlisted.

Braveheart Investment Group | Annual Report and Accounts 2011
55notes to the finAnCiAl stAtements for the year ended 31 March 2011 continued | Accounts and Notes |
Through its normal operations the Group is exposed to a number of financial risks, namely credit risk, liquidity risk and market risk. The Board reviews and agrees policies for managing each of these risks as summarised below.
Credit riskCredit risk arises from the exposure to the risk of loss if the counterparty fails to perform its financial obligations to the Group. The Group’s financial assets predominantly comprise investments designated at fair value through profit or loss and cash. In accordance with its Investment Policy the Group seeks to manage credit risk related to its investments through detailed investment selection criteria and diversification and by placing limits on individual investments. In accordance with its Treasury Policy, the Group seeks to mitigate this risk on cash by placing funds only with banks with high credit-ratings assigned by international credit-rating agencies.
The Group has no significant concentration of credit risk within any of its other financial assets. Included within such other financial assets are balances which are past due at the reporting date for which the Group has not provided as there has not been a significant change in their credit quality and which the Group believes are fully recoverable. The age profile of the Group and Company’s other financial assets is as follows:
Neither past due nor Less than 3 to 12 More than impaired 3 months months 1 year Total £ £ £ £ £
Group 2011 Trade receivables 91,180 29,161 4,554 – 124,895Other receivables 71,882 – – – 71,882
163,062 29,161 4,554 – 196,777
2010 Trade receivables 57,137 21,987 2,916 1,358 83,398Other receivables 3,979 – – – 3,979
61,116 21,987 2,916 1,358 87,377
Company 2011 Amounts due from related parties 477,343 – – – 477,343Other receivables 77,647 – – – 77,647
554,990 – – – 554,990
2010 Amounts due from related parties 326,190 – – – 326,190Other receivables 17,690 – – – 17,690
343,880 – – – 343,880
The Group considers its exposure to credit risk is negligible.
liquidity riskLiquidity risk is the risk that the Group will not be able to meet its financial obligations as they fall due.
The Group seeks to manage its liquidity risk by holding sufficient cash reserves to meet foreseeable needs and by investing cash assets safely. The Group continuously monitors rolling cash flow forecasts to ensure sufficient cash is available for anticipated cash requirements and, in accordance with its Treasury Policy, the Group only invests cash assets with reputable counterparties.
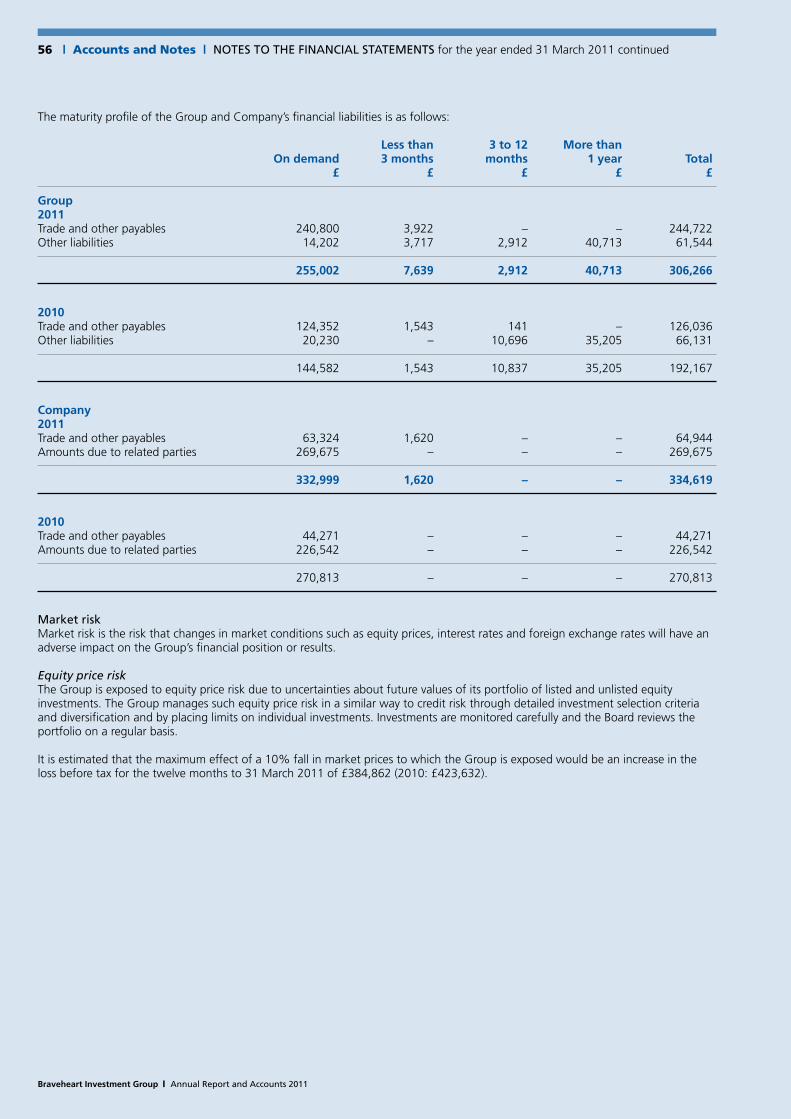
56
Braveheart Investment Group | Annual Report and Accounts 2011
| Accounts and Notes | notes to the finAnCiAl stAtements for the year ended 31 March 2011 continued
The maturity profile of the Group and Company’s financial liabilities is as follows:
Less than 3 to 12 More than On demand 3 months months 1 year Total £ £ £ £ £
Group 2011 Trade and other payables 240,800 3,922 – – 244,722Other liabilities 14,202 3,717 2,912 40,713 61,544
255,002 7,639 2,912 40,713 306,266
2010 Trade and other payables 124,352 1,543 141 – 126,036Other liabilities 20,230 – 10,696 35,205 66,131
144,582 1,543 10,837 35,205 192,167
Company 2011 Trade and other payables 63,324 1,620 – – 64,944Amounts due to related parties 269,675 – – – 269,675
332,999 1,620 – – 334,619
2010 Trade and other payables 44,271 – – – 44,271Amounts due to related parties 226,542 – – – 226,542
270,813 – – – 270,813
market riskMarket risk is the risk that changes in market conditions such as equity prices, interest rates and foreign exchange rates will have an adverse impact on the Group’s financial position or results.
Equity price riskThe Group is exposed to equity price risk due to uncertainties about future values of its portfolio of listed and unlisted equity investments. The Group manages such equity price risk in a similar way to credit risk through detailed investment selection criteria and diversification and by placing limits on individual investments. Investments are monitored carefully and the Board reviews the portfolio on a regular basis.
It is estimated that the maximum effect of a 10% fall in market prices to which the Group is exposed would be an increase in the loss before tax for the twelve months to 31 March 2011 of £384,862 (2010: £423,632).

Braveheart Investment Group | Annual Report and Accounts 2011
57notes to the finAnCiAl stAtements for the year ended 31 March 2011 continued | Accounts and Notes |
Interest rate riskThe Group finances its operations through equity funding as opposed to debt and therefore minimises its exposure to interest rate risks. The Group’s financial instruments are non-interest bearing, with the exception of loan notes which attract fixed rate interest and cash balances which attract variable interest rates determined with reference to the bank interest rate.
The interest rate profile of the Group’s financial instruments is as follows:
Fixed Variable Interest Rate Rate Free Total £ £ £ £
2011 Financial assets Investments: equity – – 3,848,621 3,848,621Investments: loan notes 130,000 – – 130,000Cash and cash equivalents – 643,203 – 643,203Other financial assets – – 236,218 236,218
130,000 643,203 4,084,839 4,858,042
Financial liabilities Contingent consideration – – 1,166,798 1,166,798Other financial liabilities – 6,629 299,637 306,266
– 6,629 1,466,435 1,473,064
2010 Financial assets Investments: equity – – 4,236,322 4,236,322Investments: loan notes 294,425 – – 294,425Cash and cash equivalents – 1,473,943 – 1,473,943Other financial assets – – 101,907 101,907
294,425 1,473,943 4,338,229 6,106,597
Financial liabilities Contingent consideration – – 671,641 671,641Other financial liabilities – 17,321 174,846 192,167
– 17,321 846,487 863,808
It is estimated that the maximum effect of a one percentage point (100 basis points) fall in interest rates to which the Group is exposed would be an increase in loss before tax for the twelve months to 31 March 2011 of £6,642 (2010: £14,739).
Foreign currency riskThe Group is not exposed to foreign currency risk as all of its financial instruments are denominated in sterling.
27 Ultimate controlling partyThere is no ultimate controlling party.
28 Post-reporting date eventsOn 24 June 2011 the Company raised approximately £950,000 (before expenses) via the placing of 4,132,574 ordinary shares of 2 pence each at an issue price of 23 pence each.
58
Braveheart Investment Group | Annual Report and Accounts 2011
| notiCe of AnnuAl geneRAl meeting
BRAVEHEART INVESTMENT GROUP PLC(‘the Company’)
NOTICE OF ANNUAL GENERAL MEETING(Registered in Scotland with company number: SC247376)
NOTICE IS HEREBY GIVEN that an Annual General Meeting of the Company will be held at The Cherrybank Centre, Cherrybank Gardens, Perth, PH2 0PF on Thursday 15 September 2011 at 12.30 pm to consider the following resolutions:
Ordinary Business To consider and, if thought fit, pass the following resolutions which will be proposed as Ordinary Resolutions of the Company:
Resolution 1THAT the audited accounts of the Company for the financial year ended 31 March 2011 and the reports of the directors and auditors thereon be received.
Resolution 2THAT Grant Thornton UK LLP be re-appointed as auditors of the Company to hold office until the conclusion of the next general meeting of the Company before which audited accounts are laid.
Resolution 3THAT the directors be authorised to determine the remuneration of the auditors.
Resolution 4THAT Edward Brandwood Cunningham who retires by rotation under article 109.1 of the Company’s existing Articles of Association, be re-elected as a director of the Company.
Resolution 5THAT Jeremy Hugh Delmar-Morgan, who retires by rotation under article 109.1 of the Company’s existing Articles of Association, be re-elected as a director of the Company.
Special Business To consider and, if thought fit, pass the following resolution which will be proposed as a Special Resolution of the Company:
Resolution 6That the directors, pursuant to the general authority conferred on them, be empowered pursuant to section 570 of the Companies Act 2006 (‘the CA 2006’) to allot for cash equity securities (as defined in section 560 of the CA 2006) as if section 561 of the CA 2006 did not apply to such allotment provided that this power shall be limited to the allotment of equity securities wholly for cash up to an aggregate nominal value of £115,686.28 (being 30% of the issued share capital of the Company as at 19 August 2011) and shall expire on 15 September 2012 or, if earlier, the date of the next annual general meeting of the Company, save that the Company may, before such expiry, make offers or agreements which would or might require equity securities to be allotted and the directors may allot equity securities in pursuance of such offer or agreement notwithstanding that the authority conferred by this resolution has expired.
Registered office: BY ORDER OF THE BOARD The Cherrybank Centre Colin GrantCherrybank Gardens Company SecretaryPerthPH2 0PF
Dated: 19 August 2011
Braveheart Investment Group | Annual Report and Accounts 2011
59notiCe of AnnuAl geneRAl meeting continued |
Explanations of the Resolutions proposedExplanation of Resolution 1: The directors are required by law to present to the shareholders of the Company at a general meeting the audited accounts of the Company for the financial year ended 31 March 2011 and the reports of the directors and auditors thereon. The report of directors and the audited accounts have been approved by the directors and the report of the auditors has been approved by the auditors. A copy of each of these documents may be found in the annual report of the Company.
Explanation of Resolution 2: The auditors are responsible for examining the annual accounts of the Company and forming an opinion as to whether or not they give a true and fair view of its results and financial position. It is a requirement of law that the Company appoint auditors at each meeting at which accounts are presented to its shareholders, such appointment to continue until the next meeting at which accounts are presented.
Explanation of Resolution 3: The resolution gives the directors of the Company the authority to determine the remuneration paid to the auditors for the next financial year. The amount of the remuneration for the next financial year will be disclosed in the next audited accounts of the Company.
Explanation of Resolution 4: Edward Cunningham, a director of the Company, is retiring by rotation pursuant to the requirements of the Company’s Articles of Association and is making himself available for re-election. Biographical details for Mr Cunningham are shown on page 18 of the annual report.
Explanation of Resolution 5: Jeremy Delmar-Morgan, a director of the Company, is retiring by rotation pursuant to the requirements of the Company’s Articles of Association and is making himself available for re-election. Biographical details for Mr Delmar-Morgan are shown on page 18 of the annual report.
Explanation of Resolution 6: This resolution, which will be proposed as a special resolution, supplements the directors’ general authority to allot shares as conferred on them at last year’s AGM. Section 561 of the CA 2006 requires a company proposing to allot equity securities to offer them first to existing shareholders in proportion to their existing shareholdings. If passed, this requirement will not apply to allotments of shares for cash up to a total nominal value of £115,686.28 being 30% of the issued share capital of the Company at 19 August 2011. This authority enables the directors to raise additional equity capital through an issue of shares for cash. This authority will expire after one year or at the date of the next annual general meeting, whichever is the earlier.

60
Braveheart Investment Group | Annual Report and Accounts 2011
| notiCe of AnnuAl geneRAl meeting continued
Notes:1. A member entitled to attend and vote at the Annual General Meeting (‘the Meeting’) is entitled to appoint one or more proxies
to exercise all or any of his rights to attend, vote and speak instead of him. A proxy need not be a member of the Company. You may appoint more than one proxy provided each proxy is appointed to exercise rights attached to different shares. You may not appoint more than one proxy to exercise the rights attached to any one share.
2. To be valid, a form of proxy (other than an electronic communication appointing a proxy) together with the power of attorney or other authority (if any) under which it is signed (or a copy of such authority certified notarially) must be lodged at the office of the Company’s registrars, Capita Registrars, PXS, 34 Beckenham Road, Beckenham, Kent, BR3 4TU by 12.30 pm on 13 September 2011, or not less than 48 hours before the time appointed for holding any adjourned meeting.
3. Pursuant to Regulation 41 of the Uncertificated Securities Regulation 2001, the Company has specified that only those shareholders registered in the register of members of the Company as at 6.00 pm on 13 September 2011 or, in the event that this meeting is adjourned, in the register of members 48 hours before the time of any adjourned meeting, will be entitled to vote, or to appoint one or more proxies to vote on their behalf, at this meeting in respect of the number of shares registered in their names at that time. Changes to entries on the register of members after 6.00 pm on 13 September 2011 or, in the event that this meeting is adjourned, in the register of members 48 hours before the time of any adjourned meeting, shall be disregarded in determining the rights of any person to attend or vote at the meeting.
4. Completion and return of a form of proxy will not prevent a member from attending the meeting and voting in person should he wish to do so.
5. CREST members who wish to appoint a proxy or proxies by utilising the CREST electronic proxy appointment service may do so for the Meeting and any adjournment(s) thereof by utilising the procedures described in the CREST Manual. CREST personal members or other CREST sponsored members and those CREST members who have appointed a voting service provider(s), should refer to their CREST sponsor or voting service provider(s), who will be able to take the appropriate action on their behalf.
6. In order for a proxy appointment made by means of CREST to be valid, the appropriate CREST message (a ‘CREST Proxy Instruction’) must be properly authenticated in accordance with Euroclear UK & Ireland Limited’s (‘EUI’) specifications and must contain the information required for such instructions, as described in the CREST Manual. The message regardless of whether it relates to the appointment of a proxy or to an amendment to the instruction given to a previously appointed proxy must, in order to be valid, be transmitted so as to be received by the issuer’s agent (ID RA10) by 12.30 pm on 13 September 2011. For this purpose, the time of receipt will be taken to be the time (as determined by the timestamp applied to the message by the CREST Applications Host) from which the issuer’s agent is able to retrieve the message by enquiry to CREST in the manner prescribed by CREST.
7. CREST members and, where applicable, their CREST sponsors or voting service providers should note that EUI does not make available special procedures in CREST for any particular messages. Normal system timings and limitations will therefore apply in relation to the input of CREST Proxy Instructions. It is therefore the responsibility of the CREST member concerned to take (or, if the CREST member is a CREST personal member or sponsored member or has appointed a voting service provider(s), to procure that his CREST sponsor or voting service provider(s) take(s)) such action as shall be necessary to ensure that a message is transmitted by means of the CREST system by any particular time. In this connection, CREST members and, where applicable, their CREST sponsors or voting service providers are referred, in particular, to those sections of the CREST Manual concerning practical limitations of the CREST system and timings.
8. The Company may treat as invalid a CREST Proxy Instruction in the circumstances set out in Regulation 35(5) (a) of the Uncertificated Securities Regulations 2001.
9. In order to facilitate voting by corporate representatives at the meeting, arrangements will be put in place at the meeting so that (i) if a corporate shareholder has appointed the chairman of the meeting as its corporate representative to vote on a poll in accordance with the directions of all the other corporate representatives for that shareholder at the meeting, then on a poll those corporate representatives will give voting directions to the chairman and the chairman will vote (or withhold a vote) as corporate representative in accordance with those directions; and (ii) if more than one corporate representative for the same corporate shareholder attends the meeting but the corporate shareholder has not appointed the chairman of the meeting as its corporate representative, a designated corporate representative will be nominated, from those corporate representatives who attend, who will vote on a poll and the other corporate representatives will give voting directions to that designated corporate representative. Corporate shareholders are referred to the guidance issued by the Institute of Chartered Secretaries and Administrators on proxies and corporate representatives (www.icsa.org.uk) for further details of this procedure. The guidance includes a sample form of appointment letter if the chairman is being appointed as described in (i) above.
10. Copies of the Articles of Association of the Company will be available for inspection at the Company’s registered office from 19 August 2011 to (and including) the date of the Meeting during normal business hours on any day (Saturdays, Sundays and public holidays excepted).

Assisted portfolio serviceBraveheart’s assisted portfolio service provides direct investment opportunities for investors (often under EIS for UK based investors), into high growth companies with the added comfort of investing alongside or being led by an experienced fund management group.
Self-build portfolio service Working with a diverse range of young dynamic companies in need of growth and expansion capital, Envestors screens and introduces the best and most exciting investment opportunities to its investor network. Investors actively build and monitor their portfolios at their own speed.
Fund managementWe offer a fully managed fund service for public sector funding and for the busy or less experienced private investor. All aspects are managed for the investor to a pre-agreed investment mandate.
MAkInG And MAnAGInG
InveStMentSEstablished in 1997, Braveheart Investment Group plc is an AIM listed investment management business (AIM:BRH) headquartered in Perth, Scotland. Aside from managing investments made directly from the Group’s balance sheet, we specialise in building tax efficient portfolios for business angels, high net worth individuals and family offices, and have a track record of producing market leading returns for our clients.
Our two most recent acquisitions underpin our current service offering: in 2009 we acquired Viking Fund Managers which manages the Viking Fund and the Viking Loan Fund and which operates the Yorkshire Association of Business Angels, and in October 2010 we acquired Envestors which is headquartered in London and runs a number of regional private investor networks. The Group now provides a full suite of investment offerings to investors and funding solutions to high-growth companies from offices in Perth, London, Yorkshire, Manchester, Jersey and Dubai.
Our business is based on the following principles:
Growth, Support, Service and Partnership
directors, Secretary, Registered Office and Advisers
Directors Garry S Watson OBE CA, Chairman (n) (r)
Geoffrey C B Thomson, Chief Executive Officer Carolyn Smith BA Hons ACIS, Chief Investment Officer Colin C Grant BCom CA, Chief Financial Officer Edward B Cunningham CBE FRSE, Non-executive Director (a) (n) (r)
J Kenneth Brown BA CA, Non-executive Director (a) (r)
Jeremy H Delmar-Morgan MA MSI, Non-executive Director (a)
(a) Member of Audit and Risk Management Committee (n) Member of Nominations Committee (r) Member of Remuneration Committee
Secretary Colin C Grant BCom CA
Registration Number SC247376
Registered Office The Cherrybank Centre Cherrybank Gardens Perth PH2 0PF Telephone +44 (0) 1738 587555
Website www.braveheartinvestmentgroup.co.uk
Advisers Registrar Nominated Adviser and Broker Capita Registrars Ltd Seymour Pierce Limited Northern House 20 Old Bailey Woodsome Park London Fenay Bridge EC4M 7EN Huddersfield HD8 0LA Solicitors Solicitors Semple Fraser LLP Maclay Murray & Spens LLP 80 George Street Quartermile One Edinburgh 15 Lauriston Place EH2 3BU Edinburgh EH3 6EP
Principal Bankers Principal Bankers HSBC Bank plc Bank of Scotland plc 76 Hanover Street Pentland House Edinburgh 8 Lochside Avenue EH2 1HQ Edinburgh EH12 9DJ
Auditors Grant Thornton UK LLP 1-4 Atholl Crescent Edinburgh EH3 8LQ
Designed and produced by corporateprm, Edinburgh and London.www.corporateprm.co.uk
61COMPANY INFORMATION |
Braveheart Investment Group | Annual Report and Accounts 2011

The Cherrybank CentreCherrybank GardensPerthPH2 0PFUnited Kingdom
[email protected]: +44 (0)1738 587555F: +44 (0)1738 587666
www.braveheartinvestmentgroup.co.uk
Bra
veh
eart In
vestm
en
t Gro
up
plc A
nn
ual R
epo
rt and
Acco
un
ts 2011
Annual Report and Accounts
Braveheart Investment Group plc
2011