brazil pharma march 2012
DESCRIPTION
TRANSCRIPT

Institutional Presentation
March 2012

The Sector
3
126 / 161 / 199
65 / 163 / 99
144 / 199 / 163
166 / 166 / 166
217 / 217 / 217
2 / 79 / 159
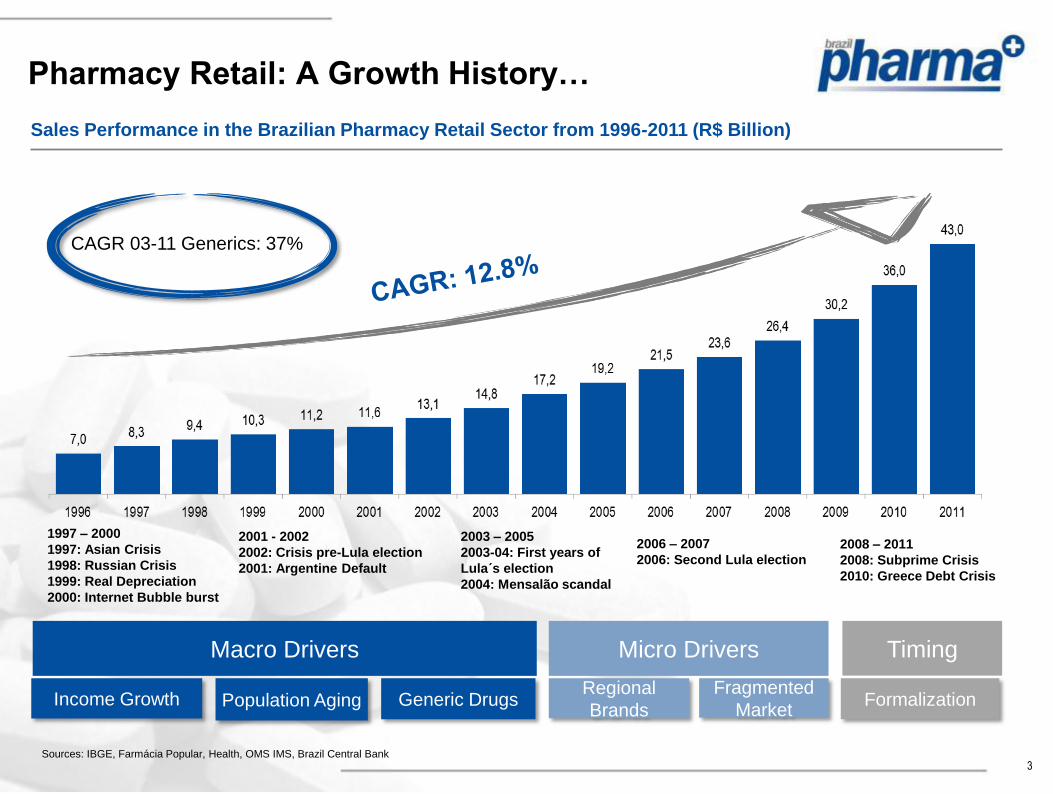
Sales Performance in the Brazilian Pharmacy Retail Sector from 1996-2011 (R$ Billion)
Pharmacy Retail: A Growth History…
Sources: IBGE, Farmácia Popular, Health, OMS IMS, Brazil Central Bank
Micro Drivers Timing
Regional
Brands
Fragmented
Market Formalization
Macro Drivers
Income Growth Population Aging Generic Drugs
1997 – 2000
1997: Asian Crisis
1998: Russian Crisis
1999: Real Depreciation
2000: Internet Bubble burst
2001 - 2002
2002: Crisis pre-Lula election
2001: Argentine Default
2003 – 2005
2003-04: First years of
Lula´s election
2004: Mensalão scandal
2006 – 2007
2006: Second Lula election
2008 – 2011
2008: Subprime Crisis
2010: Greece Debt Crisis
CAGR 03-11 Generics: 37%

4
126 / 161 / 199
65 / 163 / 99
144 / 199 / 163
166 / 166 / 166
217 / 217 / 217
2 / 79 / 159 Market Share and Players Footprint
Source: IMS Health, Companies web site, Brazil Pharma
Brazil Pharma is located in strategic regions with low competition, high growth perspectives and large
complementarities to top players.
Revenues
Breakdown per
State
Raia +
Drogasil
Drogaria
S. Paulo +
Pacheco
Brazil
Pharma
São Paulo 31%
Rio de Janeiro 14%
Minas Gerais 10%
Rio Grande do Sul 8%
Paraná 6%
Goiás + DF 5%
Bahia 4%
Santa Catarina 4%
Pernambuco 3%
Ceará 3%
Pará 2%
Others 11%
Pharmacy Retail: ... With Consolidation Opportunity
South
East
Region
Other
Regions
Brazil Pharma Focus
Peers Focus

The Company

6
126 / 161 / 199
65 / 163 / 99
144 / 199 / 163
166 / 166 / 166
217 / 217 / 217
2 / 79 / 159 Geographic Location Strong Organic Growth Capacity (# Stores)¹
TOTAL: 986
627 own stores e
359 franchise stores
Brazil Pharma: Ready to Grow
Largest Pharmacy Retail Company in Brazil outside the Southeast
Profitable Mix (4Q11 Sales Mix)¹
Brazil Pharma Abrafarma
Branded
Generics
Non-Medicines
¹Excluded Big Ben and Sant´ana’s Stores
104 own stores
1st
228 own stores
1st
359 franchise stores
1st
194 own stores
2nd
5
1
95 20
14
89 7
8
187
7
1
7
85
98
52
150
71
221
71
292
378
2007 2008 2009 2010 2011
86
101 own stores
101
1st
32,9%
47,7%
19,4%

7
126 / 161 / 199
65 / 163 / 99
144 / 199 / 163
166 / 166 / 166
217 / 217 / 217
2 / 79 / 159
(1) Including Sant’ana and Big Ben acquisition that is still pending shares incorporation
Brazil Pharma: The Shareholders
BTG is our main Shareholder
Farmais Rosário
Distrital
Mais
Econômica
100% 100% 100%
Big Ben
100%
Sant’ana
100%
Operating
Partners
23%
Free Float
39%
BTG
Pactual(2)
38%

8
126 / 161 / 199
65 / 163 / 99
144 / 199 / 163
166 / 166 / 166
217 / 217 / 217
2 / 79 / 159
Experienced management with more than 25 years in the pharmacy retail industry on average
Brazil Pharma: Our People
André Sá
CEO
Marcelo Doubek
CFO
Renato Lobo
Investor Relations
Management
Board of Directors
Marcelo Kalim
Board Member
Carlos Fonseca
Board Member
Roberto Martins
Board Member
José Luiz Depiere
Board Member
2
2
n/a
36
# Years
Pharmacy Retail
n/a
n/a
20
14
25
# Years
Financial Industry
12
14
18
n/a
15
14
22
n/a
n/a Artur Grynbaum
Independent Board Member
Experience
Álvaro Silveira
Board Member
Carlos Dutra
Comercial Director 20 n/a
Financial Expertise
Retail Expertise
Manufacturing Expertise
Pharmacy Retail
Experience
Entrepreneurship
Experience
Gilberto Portela
Head of Institutional Relations 30 n/a
Álvaro Silveira Jr.
Head of Midwest Operations
Wilson José Lopes
Head of South Operations
22
25
n/a
n/a
Raul Aguilera
Head of North and Northeast Operations 25 n/a
José Santana
Head of Bahia Operations 30 n/a
9
126 / 161 / 199
65 / 163 / 99
144 / 199 / 163
166 / 166 / 166
217 / 217 / 217
2 / 79 / 159
110
45
100
200
245
Set/09 - Abr/10 Mai/10 - Jan/10 Jul/10 - Jan/11 Fev/11 - Set/11 Out/11 - Dez/11 Jan/12 - Fev/12
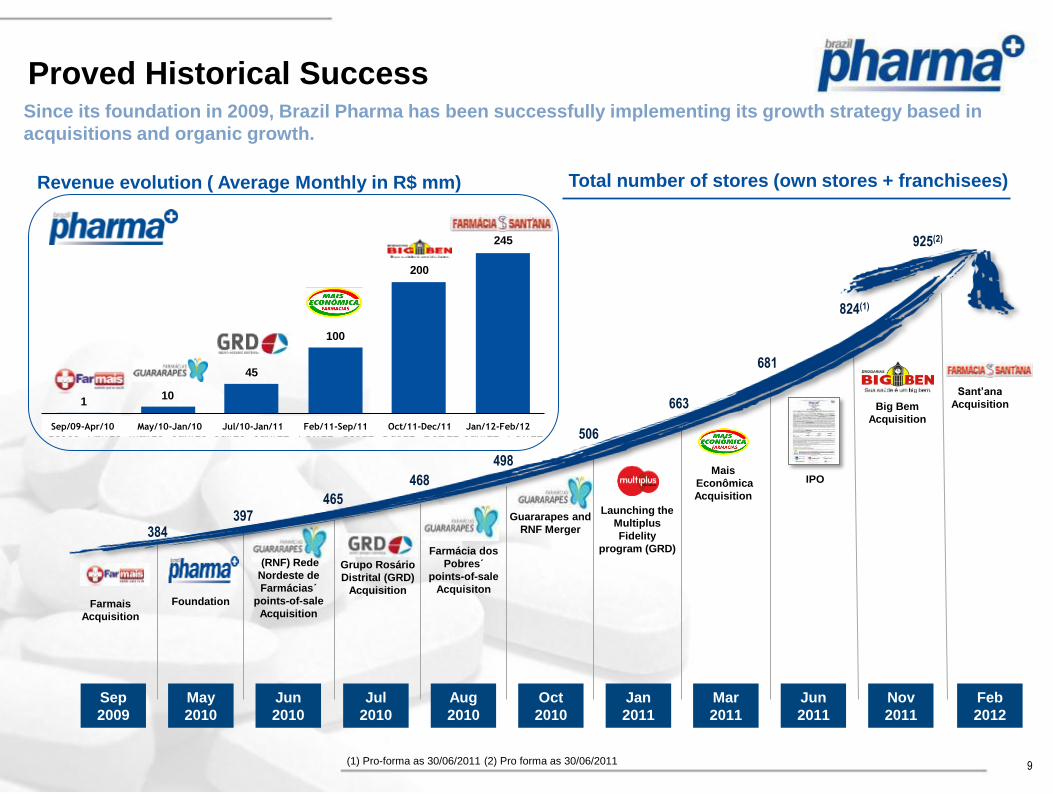
Proved Historical Success Since its foundation in 2009, Brazil Pharma has been successfully implementing its growth strategy based in
acquisitions and organic growth.
Revenue evolution ( Average Monthly in R$ mm)
Foundation
Farmácia dos
Pobres´
points-of-sale
Acquisiton
Guararapes and
RNF Merger
(RNF) Rede
Nordeste de
Farmácias´
points-of-sale
Acquisition
Launching the
Multiplus
Fidelity
program (GRD)
Mais
Econômica
Acquisition
Grupo Rosário
Distrital (GRD)
Acquisition
384 397
465
468
506
663
Sep
2009
Aug
2010
Oct
2010
May
2010
Jun
2010
Jan
2011
Mar
2011
Nov
2011
681
IPO
Jul
2010
Jun
2011
498
Big Bem
Acquisition
824(1)
(1) Pro-forma as 30/06/2011 (2) Pro forma as 30/06/2011
Total number of stores (own stores + franchisees)
Feb
2012
Farmais
Acquisition
Sant’ana
Acquisition
925(2)
Sep/09-Apr/10 May/10-Jan/10 Jul/10-Jan/11 Feb/11-Sep/11 Oct/11-Dec/11 Jan/12-Feb/12

10
126 / 161 / 199
65 / 163 / 99
144 / 199 / 163
166 / 166 / 166
217 / 217 / 217
2 / 79 / 159
Brazil Pharma: Strategies to Create Value
Organic Growth
Opening of new stores
to consolidate local
leadership and enter
new states
Operational
Efficiency
Strong synergy to come
through integration
Market Consolidation
Highly fragmented
market with
opportunities for
consolidation
Differentiation
Product development,
private label and loyalty
programs
Integration / Stabilization
Restructuring Governance
G&A Synergies
Training, Career Plan and Remuneration
Improvements prioritization
Monitoring of process indicators
Implementation of culture and services
Scalability
Operational Consolidation
Migration of new processes
Operational efficiency
Organic Growth
Geographic presence in all regions boosts the
opportunity to grow organically
11
126 / 161 / 199
65 / 163 / 99
144 / 199 / 163
166 / 166 / 166
217 / 217 / 217
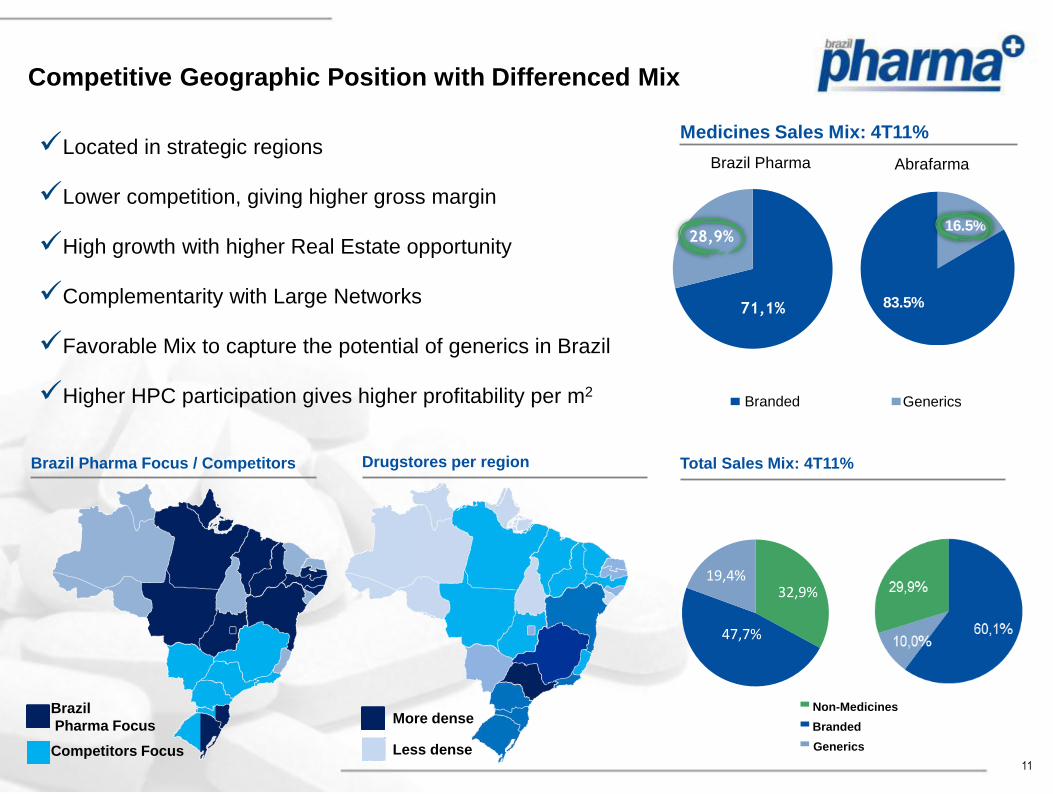
2 / 79 / 159 16.5%
83.5%
Competitive Geographic Position with Differenced Mix
Brazil Pharma Focus / Competitors Drugstores per region
Brazil
Pharma Focus
Competitors Focus
More dense
Less dense
Located in strategic regions
Lower competition, giving higher gross margin
High growth with higher Real Estate opportunity
Complementarity with Large Networks
Favorable Mix to capture the potential of generics in Brazil
Higher HPC participation gives higher profitability per m2
Brazil Pharma Abrafarma
Branded Generics
Medicines Sales Mix: 4T11%
Total Sales Mix: 4T11%
Branded
Generics
Non-Medicines
71,1%
28,9%
32,9%
47,7%
19,4%
12
126 / 161 / 199
65 / 163 / 99
144 / 199 / 163
166 / 166 / 166
217 / 217 / 217
2 / 79 / 159
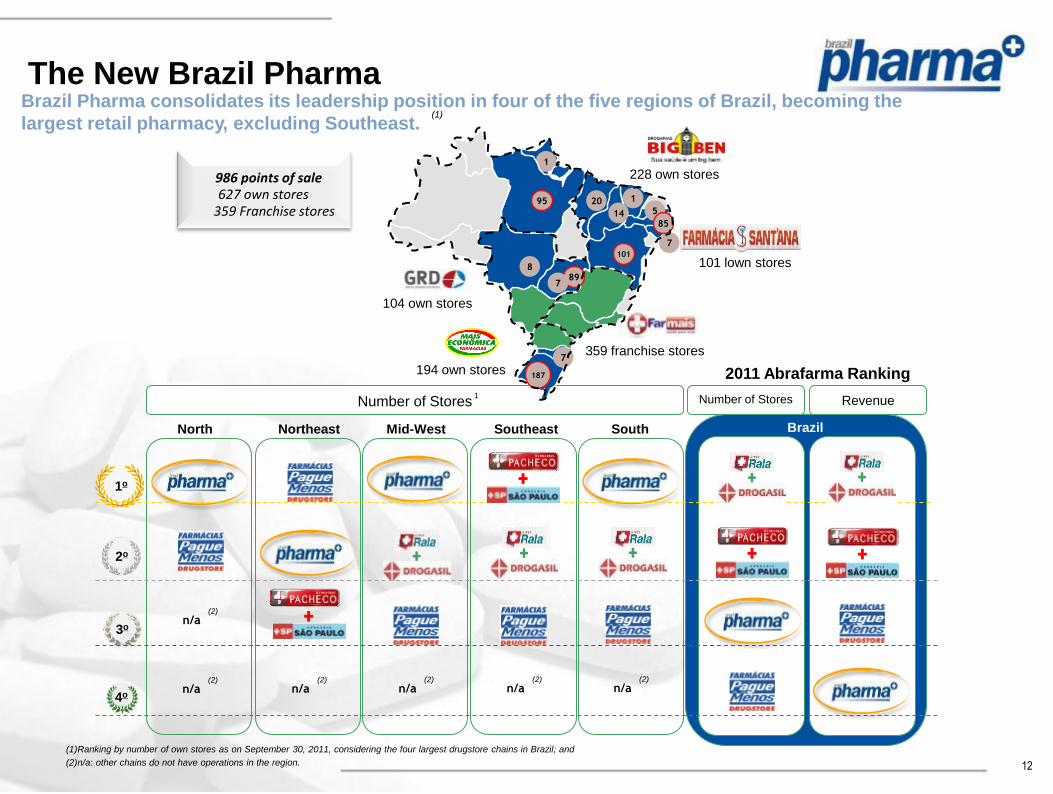
Brazil
4o
2o
1o
3o
North
n/a (2)
n/a (2)
Northeast
n/a (2)
Mid-West
n/a (2)
Southeast
n/a (2)
South
n/a (2)
(1). Number of Stores Number of Stores Revenue
2011 Abrafarma Ranking
1
The New Brazil Pharma Brazil Pharma consolidates its leadership position in four of the five regions of Brazil, becoming the
largest retail pharmacy, excluding Southeast. (1)
986 points of sale 627 own stores
359 Franchise stores
359 franchise stores
228 own stores
104 own stores
101 lown stores
5
1
95 20
14
89 7
8
187
7
1
7
85
101
194 own stores
(1)Ranking by number of own stores as on September 30, 2011, considering the four largest drugstore chains in Brazil; and
(2)n/a: other chains do not have operations in the region.

13
126 / 161 / 199
65 / 163 / 99
144 / 199 / 163
166 / 166 / 166
217 / 217 / 217
2 / 79 / 159
Results Consistency with Margin Stability
Gross Revenue
(R$ million; Pro-forma)
Gross Profit and Gross Margin
(R$ million)
EBITDA and EBITDA Margin
Number of own Stores and Organic Growth
Stores Maturation¹
221 292
378
627 71
86
148
101
2009 2010 2011 - 2011
¹ Pro-forma to include Big Ben and Sant’ana
192 279 396
802 267
138
29,1% 30,2% 34,7%
30,1% 26,2% 31,3%
2009 2010 2011 2011 PF

14
126 / 161 / 199
65 / 163 / 99
144 / 199 / 163
166 / 166 / 166
217 / 217 / 217
2 / 79 / 159
627
743
Brazil Pharma: Comparing With The Peers
Solid track record in sales, Gross Margin and EBITDA
LTM 3Q11 EBITDA and EBITDA Margin
(R$ million, % of Gross Revenues
LTM 3Q11 Selling, General, Administrative and Other
Expenses and % of Gross Revenue
(R$ million, % of Gross Revenues)
¹ Pro-forma to include Big Ben and Sant’ana 2 As of 30-sep-2011
LTM 3Q11 Gross Profit and Gross Margin
(R$ million, % of Gross Revenues)
Stores (as of December 31, 2011)¹
1
1 1
1

Integration Process

16
126 / 161 / 199
65 / 163 / 99
144 / 199 / 163
166 / 166 / 166
217 / 217 / 217
2 / 79 / 159
Operations Administrative
(SSC) Procurement
Corporate
Finance
Accounts Payable
Human Resource
Accounting
IT
Legal department
Sales (pricing, mix,
location
New stores
Logistics
Purchase process
Relationship with
manufactures
Service Level
Working Capital
G&A Reduction Sales increase
Operational efficience
Gross margin Benefits
We have three operations areas:
(i) Procurement
(ii) Sales and Operations
(iii) Back Office
Brazil Pharma: Integration Process

17
126 / 161 / 199
65 / 163 / 99
144 / 199 / 163
166 / 166 / 166
217 / 217 / 217
2 / 79 / 159
Em 5 de março de 2012 inauguramos nosso Centro de Serviços Compartilhados,
que integrará as áreas de back office das operações da Companhia, permitindo a
integração e otimização de suas atividades e processos e a implementação de um
sistema de gestão unificado
CSC Brazil Pharma

Operational and Financial Highlights 4Q2011/2011
19
126 / 161 / 199
65 / 163 / 99
144 / 199 / 163
166 / 166 / 166
217 / 217 / 217
2 / 79 / 159
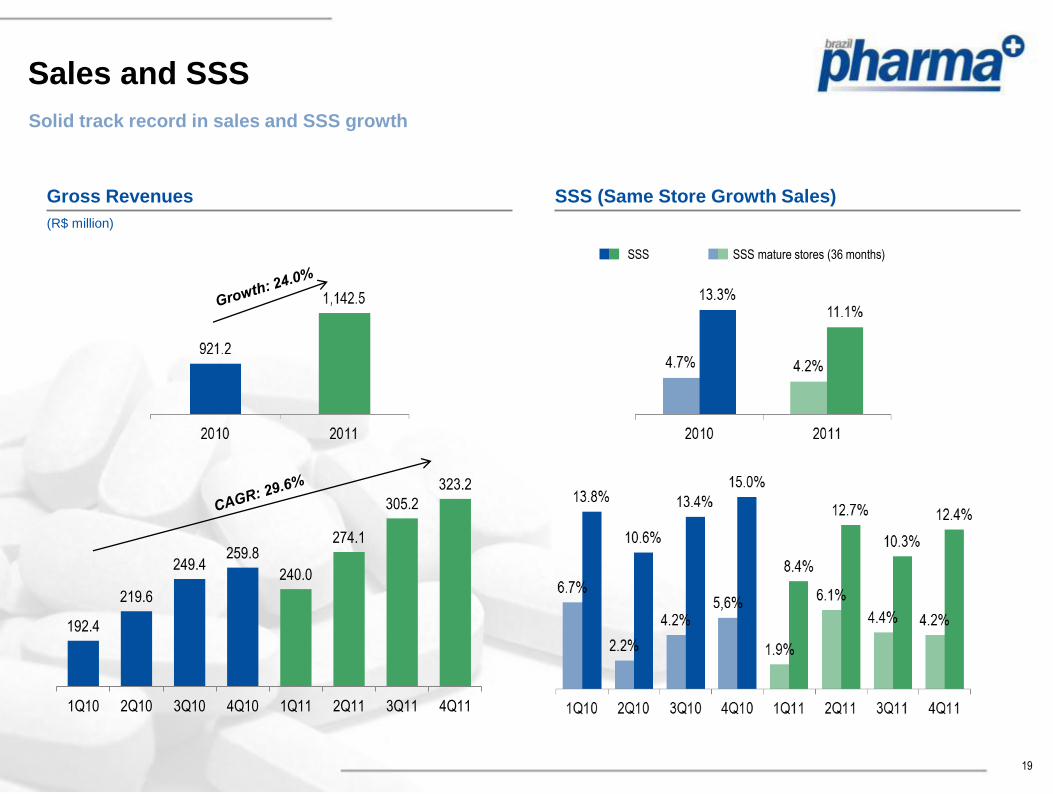
Sales and SSS
Solid track record in sales and SSS growth
Gross Revenues
(R$ million)
SSS (Same Store Growth Sales)
SSS SSS mature stores (36 months)
192.4
219.6
249.4 259.8
240.0
274.1
305.2
323.2
1Q10 2Q10 3Q10 4Q10 1Q11 2Q11 3Q11 4Q11

20
126 / 161 / 199
65 / 163 / 99
144 / 199 / 163
166 / 166 / 166
217 / 217 / 217
2 / 79 / 159
Sales Mix and Average Ticket
Increase in average ticket even with the growing relevance of generics in our sales mix
Sales Mix
(% of sales)
Average Ticket
(R$)

21
126 / 161 / 199
65 / 163 / 99
144 / 199 / 163
166 / 166 / 166
217 / 217 / 217
2 / 79 / 159
Gross Profit and Expenses
Gross margin expansion, given better mix and inventory management
Gross Profit and Gross Margin
(R$ million, % of gross revenues)
Selling, General, Administrative and Other
Expenses1 and % of Gross Revenue
(R$ million, % of gross revenue)
(1) The figures disregard each period’s SOP expenses and “non-recurring expenses”. In 4Q11, our non-
recurring expenses came to R$3.4 million, relating to M&As.

22
126 / 161 / 199
65 / 163 / 99
144 / 199 / 163
166 / 166 / 166
217 / 217 / 217
2 / 79 / 159
EBITDA and Net Income
Positive EBITDA evolution since the creation of Brazil Pharma
EBITDA and EBITDA Margin
(R$ million, % of gross revenue)
44.4
70.9
4.8%
6.2%
2010 2011
Net Income and Net Margin1
(R$ million, % of gross revenue)
(1) Net income before minority interest and adjusted to exclude non-recurring expenses in the period.
29.6
16.2 20.1
45.8
2.6% 2.2%
4.0%
2010 2011

23
126 / 161 / 199
65 / 163 / 99
144 / 199 / 163
166 / 166 / 166
217 / 217 / 217
2 / 79 / 159
Contact Details
Investor Relations
Renato Lobo IR Officer
Mara Boaventura
IR Manager
(55 11) 2117 -5200
www.brazilpharma.com.br/ri
Brazil Pharma S.A.
Rua Gomes de Carvalho, 1629
6th and 7th floors
CEP 04547-006
São Paulo, SP, Brazil