brazilian call center industry report 2005 (the global ... · brazilian call center industry report...
TRANSCRIPT

1
Brazilian Call Center Industry Report 2005
(The Global Call Center Industry Project)
Moacir de Miranda Oliveira Júnior – Coordinator Arnoldo José de Hoyos Guevara
Leonardo Nelmi Trevisan Arnaldo José França M. Nogueira
Paulo Roberto Gião Maria de Fátima Silva
Pedro Lucas de Resende Melo Programa de Pós-Graduação em Administração
Pontifícia Universidade Católica de São Paulo – Puc-SP Campus Monte Alegre – Edifício Bandeira de Mello
Rua Ministro Godoi, 969 – 4º. Andar – Sala 4B01 CEP 05015-901 – Perdizes – São Paulo - SP
Tel: 55 11 3670-8513 E-mail: [email protected]
Pontifícia Universidade Católica de São Paulo
2
Table of Contents
Participants and Contact 3 Acknowledgements...........................................................................................4 Executive Summary..........................................................................................5 Introduction .......................................................................................................5 1 – Introduction .................................................................................................9 2 – Objectives of the Brazilian Call Center Industry Report ...........................12 3 – Brazilian Call Center Indt ustrial Landscape 13
3.1 – Industry and market segments .......................................................13 3.2 – Organizational Characteristics of Call Centers ..............................14
4 – Strategic Dimensions in Brazilian Call Center..........................................19 4.1 – Business strategy ...........................................................................19 4.2 – Location strategy ............................................................................23
5 – Market Segments and Human Resource Practices in Call Centers ........25 5.1 – Customer segmentation and human resource systems.................25 5.2 – Selection of workforce and staffing strategies................................27
6 – Technology and work organizations; skills and incentive mechanisms ...31 6.1 – Adoption of technologies ................................................................31 6.2 – Skills and training ...........................................................................32
7 – Work organization: pattern, autonomy, teamwork....................................36 7.1 – Number of calls per day .................................................................36 7.2 – Autonomy on job.............................................................................37 7.3 – Annual earnings´ levels in Call Centers .........................................40 7.4 – Turnover and employment stability ................................................41 7.5 – Promotion to higher positions.........................................................42 7.6 – Dismissal rates in Brazilian Call Centers .......................................42 7.7 – Percent of employees with less than one year of tenure ...............42 7.8 – Managers in Call Centers...............................................................43
8 – The institutional setting: public support and union effects .......................46 8.1 – Public segment support for call centers .........................................46 8.2 – Union effects on call center practices ............................................48
9 – Final considerations..................................................................................50 References......................................................................................................51

3
Participants and Contact Pontifícia Universidade Católica de São Paulo – PUC-SP Prof. Dr. Moacir de Miranda Oliveira Júnior – Coordinator Prof. Dr. Arnoldo José de Hoyos Guevara Prof. Dr. Leonardo Nelmi Trevisan Prof. Dr. Arnaldo José França M. Nogueira Paulo Roberto Gião Maria de Fátima Silva Pedro Lucas de Resende Melo
Associação Brasileira de Telesserviços – ABT Topázio Silveira Neto – President Carlos Umberto Allegretti – Director PUC-JR Carmen Vanin Daniel Machado Fábio Louza Felipe Pascowitch Felipe Ruiz Fernando Ber Gabriel Zanetti Leandro Tadeu Bevilacqua Lucas Bittencourt Paloma Del Rio Gomez Afonso Martinez Samuel Levy Contact: For further information about this and other works regarding Call Centers in Brazil, please contact: Prof. Dr. Moacir de Miranda Oliveira Júnior [email protected] [email protected]

4
Acknowledgements We would like to thank Mr. Topázio da Silveira Neto, president of the Associação Brasileira de Telesserviços, for financial support and access to companies in the sector, who made possible the survey realization. We would like to thank Prof. Dr. Luciano Prates Junqueira, coordinator of the Graduate Program in Business Administration of PUC-SP, for his support and incentive in all phases of the project, since before the structuring and start up of the project. We also express generous thanks to managers and executives and their companies for the attention and patience in responding to the twenty-one page questionnaire, essential for the successful accomplishment of this report. Within the University, we thank the master student Paulo Roberto Gião for data handling and analysis, to master student Fátima Silva for excellent job in data collecting, to master student Pedro Melo for his participation in several phases of this work, to PUC Jr´s members for making contacts and completing questionnaires and finally to our friend Débora Paiva, who stayed with us for small, but valuable period. Last but not least, we thank the Global Coordinators of ‘Global Call Center Research Project’, Prof. Dr. Rosemary Batt, from Cornell University-USA, and Prof. Dr. Stephen Wood and Prof. Dr. David Holman from Sheffield University- UK, for creating opportunities for the present joint-work and for key contributions during the survey.

5
Executive Summary
The present executive summary is part of the first multidisciplinary survey involving HR and work practices, technologies and strategy applied in Call Center Industry in Brazil. This survey was coordinated by the Graduate Program in Business Administration of PUC-SP and the methodological structure was developed by leadership teams in Cornell University in United States and Sheffield University in United Kingdom, as part of The Global Call Center Research Project carried out in almost twenty countries in all continents.
The survey is based in a sample of 103 organizations, totalizing 114
questionnaires responded. Managers have been asked to answer detailed questions about the call center industry involving technologies and administrative practices, such as required skills for the job, work organization, training, payment levels and HR policies. Also, performance parameters, turnover rates, increase in sales and perspectives for the industry for an overall view of the industry.
In this work, the institutional environment data is handled based on governmental, union and public training. Of course, the declared strategies for the organizations were investigated to understand if the structure follows the strategy and vice-versa. The database obtained allows many comparative analyses among a great variety of industries, including Banks, Telecommunications, IT, Retail, Insurance, etc. In addition, it allows the comparison between internal procedures of in-house and outsourced (sub-contractors) call centers. In this sample, in-house and outsourced call centers represent 47% and 53%, respectively. This report presents some highlights about environment, HR practices, technologies, strategies in the Brazilian call center industry. These main points are presented below. Sectorial and Organization Characteristics Brazilian call centers are relatively new. 72% of them have less than 8 years
of implementation and 96% were created after 1990. The majority of researched call centers can be considered small, 50% of them
with less than 100 seats. 24.6% of the sample represent medium size call centers from 100 to 500 seats and large call centers, above 500 seats, represent 25.4%.
This sample represents 125,806 employees,, from which 89% and 11% are,
respectively, in outsourced and in-house call centers, totalizing 62,201 seats.
6
Typical call centers serve the national market; however, there are a significant
portion serving local and regional markets and a small number of call centers providing international markets (offshore).
In business strategy, including in-house and outsourced, 63% of call centers
adopt service differentiation as main strategy. Customer Loyalty, price leadership and one-stop shopping received 25%, 5% and 5% of total citations, respectively. However, among in-house call centers, Service Differentiation strategy drops to 54% and Customer Loyalty grows to 36%.
Employee Demographics, Training and Contract The large majority of call center workers has high school degree, representing
74% of total. Operators with basic and college degree correspond to 4% and 22%, respectively. When the analysis split the database in in-house and outsourced, the percentage of college operators is 33% for in-house and 12% for outsourced call centers.
Female workforce prevails in call center industry; 76.2% of operators are
women. There is no difference between in-house and outsourced call centers rates. The less expressive female presence is observed in IT help desk, in a percentage of 57.2%
Call centers provide an average of 4.4 weeks for employees initial training. In
outsourced call centers the average drops to 3.5 weeks while in in-house the average is around 5.4 weeks. Observing the different industry segments, in Telecommunications the initial training is 7.1 weeks for in-house and 3.7 weeks for outsourced call centers. When comparing different strategies, for Customer Loyalty the initial training represents a period of 8.3 weeks while for Service Differentiation the period is 7.0 weeks.
To become proficient in the service, the required average period is 19.0
weeks, with slight difference between in-house and outsourced Call Centers, 19.9 and 18.2 weeks, respectively. Also, depending on the segment and the main activity, the observed variations are quite significant. When the largest volume of contacts is, for instance, aimed at current customers, the average is of 25.3 weeks; when the main activity refers to collection, that average is of 13.0 weeks
The full-time employees represent 87% of the total and the part-time, working
less than 36 hours per week, 13%; 26% of researched Call Centers use temporary workers to accommodate eventual demand increases, to substitute the operator’s absence and even for saving costs.

7
Working conditions On average, the operators answer and/or complete 74 calls a day. When the
activity is in-house Call Centers the average is 69 calls a day and in the outsourced, 79 calls a day. The variations among segments and the main activity developed by Call Center are expressive, for instance, in the activities of collections and sales to prospective customers, the averages are, respectively, 113 and 59 calls a day.
In general, the average time of a call is 3 minutes and 27 seconds. When it is
restricted to customers' services, this average drops to 3 minutes and 21 seconds and when it is collection services, that average grows to 4 minutes and 27 seconds. When it is inbound and outbound traffic, the averages were similar to the general average: 3 minutes and 27 seconds.
Call Center technology The adoption of complementary technologies to the traditional telephony is
also verified by the survey, definitively transforming Call Centers in Contact Centers, with multiple communication channels for consumers' interactions.
It is already observed the higher use of e-mail (72%) in relation to the use of
fax (67%). Very close to this percentage are the web-enablement methods involving chat, icq, among others, with 62%, showing a growing integration between the telephony and the Internet. Very significant to mention the Call Center´s percentual that use CRM: 59%, allowing the operators to access customer´s information before interaction.
A quite surprising percentile is in the use of Voice over IP (VoIP): 25% of the
respondents declared to use this technology in their operations, what shows the convergence between the telecommunications and the IP protocol and the cost reduction that can be significant in the results of the companies.
Human resource management practices The annual turnover, defined in this international project as the employees
that quit, were dismissed, retired and were promoted for other positions, internally or for other companies of the group, presented a general average of 38,6%, with differences among the type of Call Center: in-house, 29,9% and outsourced, 36,0%. The dismissed employees' index was 12,8% for the in-house and 18,0% for the outsourced. A positive and significant indicator is the in-house Call Centers employees' promotion, which represents 16,1% of the total of 29,9%.

8
The average permanence of the operators in Call Centers is 2.4 years. However, 44.0% of them have less than 1 year and only 12.7% have more than 5 years.
Annual earnings for operators showed an average of US$ 4,513. Comparing
in-house and outsourced Call Centers, the averages were respectively US$ 5,579 and US$ 3,374. When the largest volume of calls refers to customers’ services and sales, the average rises to US$ 5,454, and when the strategy of the company is associated to Price Leadership, the average is US$ 3,475.
Call Center managers The qualification of Call Center´s managers is quite significant. 95% of them
have university or master degree (29%). Managers' annual average remuneration is US$ 23,597. According to Call
Centers's size, large, medium and small, the remuneration averages are, respectively, US$ 26,808, US$ 25,410 and US$ 21,290.
Call Centers's managers have an average permanence of 4.3 years in the
same position. In-house Call Centers show the average of 5.2 years, while outsourced shows the average of 3.4 years.
Institutional environment of call centers Governmental participation, support or assistance in the Call Center industry
seems still incipient. Answering questions regarding recruitment through worker´s support centers, governmental training programs and support / orientation for installation of Call Centers, 57%, 63% and 68% of the respondents, respectively, said that have never appealed to such procedures.
Also, 66% answered that they have never had any kind of fiscal advantage
and 78% have never needed to finance their operations. Being unionized seems to have influence in the turnover rates. In general, the
turnover percentage is higher among the non unionized, 17.0% and 14.4%, respectively. When comparing non-unionized workers of in-house and outsourced Call Centers, rates are still more divergent: 13.3% and 20.6%, respectively.

9
1 – Introduction The expansion of the Call Center industry is a global phenomenon and in Brazil it could not be different. Some factors contributed to the development of this industry. The Liberalization of the telecommunications segment occurred in
1997/1998 allowed a larger degree of competitiveness naturally reducing the costs of telecommunications.
The fast development integrating computation and telecommunications
(CTI), especially with the Internet, allowed a larger integration of systems and possibilities of interaction with the consumers.
With the enforcement of Consumer Protection Code (CDC) in 1990, the
consumers acquired important rights in the products and services purchasing processes. They have the right, by law, to appropriate and clear information on acquired products and services, protection against misleading and abusive publicity, to receive effective public services, among other rights. All this caused the organizations to offer Call Center services.
Of all those important movements, the privatization of the telecommunications segment seems to be the decisive factor, for the development of the Call Center industry. Besides the fact that new companies were established and had to create their Call Centers, the number of phone subscribers, both fixed and mobile, have grown significantly. According to ANATEL (2005), the number of fixed and mobile phone accesses grew from 19.2 million in 1996 to 42.8 million in 1999, representing a growth of 123% in the period, and it continues in full expansion. In the end of 2005, the country already counted with more than 125 million accesses among fixed and mobile phones. This is also confirmed by the amount of Call Centers that have been implemented right after the years of liberalization and privatization of the former TELEBRÁS System, as it will be shown ahead. The industry´s growth is also reported by DATAMONITOR (2003) that shows an average annual growth of 17% from 2002 to 2003. This rate was very superior to the GDP´s country rate in the same period, 7.7% (IBGE, 2005). According to this consulting company, in the same period, the number of seats (workstations) increased 19.7% on average, from 100,800 seats in 2002 to 149,900 in 2004. However, the information about Call Center's industry in Brazil is still imprecise. The CALL CENTER (2005) estimated for the end of 2004, 102,486 seats and 196,656 employees. The CLIENTE S.A. (2005), based on a research accomplished by the company DMS developed in the end of 2005, estimated about 340,000 seats and 600.000 operators, showing that the industry is in accelerated growth.
10
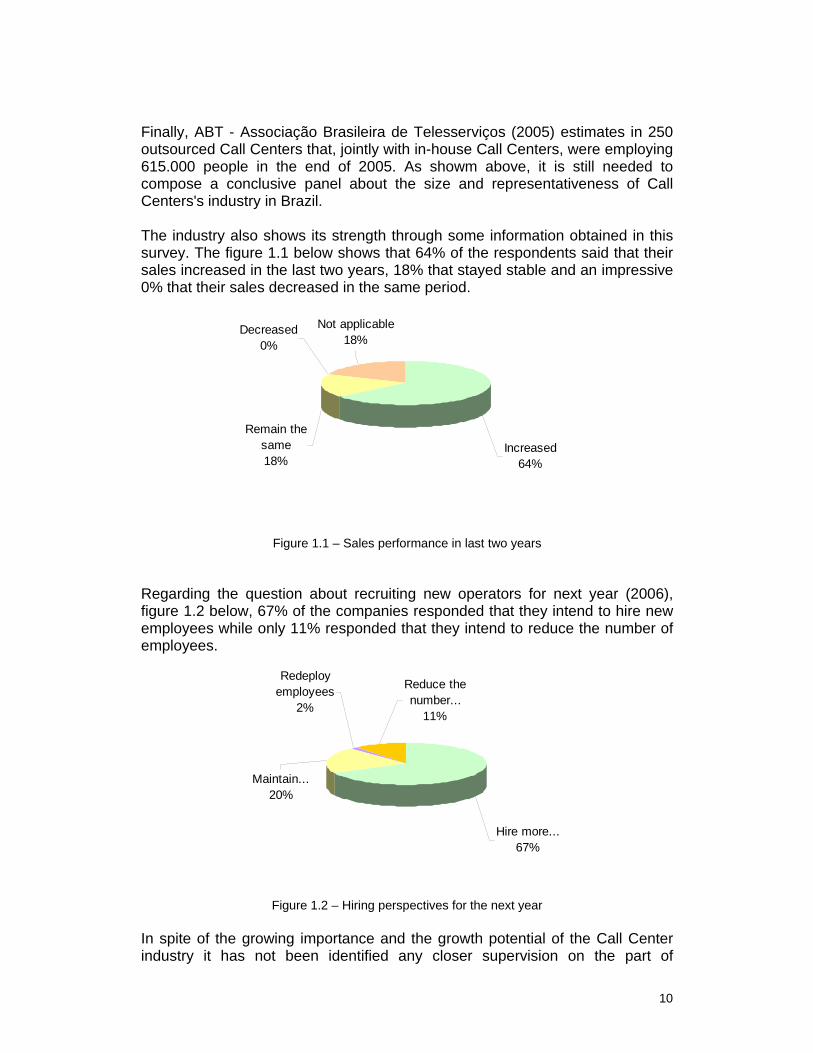
Finally, ABT - Associação Brasileira de Telesserviços (2005) estimates in 250 outsourced Call Centers that, jointly with in-house Call Centers, were employing 615.000 people in the end of 2005. As showm above, it is still needed to compose a conclusive panel about the size and representativeness of Call Centers's industry in Brazil. The industry also shows its strength through some information obtained in this survey. The figure 1.1 below shows that 64% of the respondents said that their sales increased in the last two years, 18% that stayed stable and an impressive 0% that their sales decreased in the same period.
Not applicable18%
Remain the same18%
Decreased0%
Increased64%
Figure 1.1 – Sales performance in last two years
Regarding the question about recruiting new operators for next year (2006), figure 1.2 below, 67% of the companies responded that they intend to hire new employees while only 11% responded that they intend to reduce the number of employees.
Reduce the number...
11%
Hire more...67%
Redeploy employees
2%
Maintain...20%
Figure 1.2 – Hiring perspectives for the next year
In spite of the growing importance and the growth potential of the Call Center industry it has not been identified any closer supervision on the part of

11
governmental organs that could guarantee more precise numbers about Call Center industry in Brazil. Concurrent to that and concerned with the operation, the destiny of the industry and their practices, the companies conjoined and launched in the end of November of 2005 a document called PROBARE - Programa Brasileiro de Auto-Regulamentação (Self-Regulation Brazilian Program) (Call Center/ Contact Center/ Help Desk / SAC / Telemarketing).
12
2 – Objectives of the Brazilian Call Center Industry Report This report is the first version of the more complete survey so far accomplished in the industry of Call Center in Brazil, involving strategies, performance, technology and work practices and human resources. It has been coordinated by the Graduate Program in Business Administration of the Pontifícia Universidade Católica de São Paulo – PUCSP – in partnership with the ABT- Associação Brasileira de Telesserviços. The methodological structure was the same developed in ¨ The Global Call Center Industry Project ¨ coordinated globally by the universities of Cornell in the United States and Sheffield in United Kingdom and that is being similarly applied in 20 countries in all the continents. The survey is based on the application of a standardized questionnaire to Call Centers managers, similar or superior’s positions, that are familiar with the strategic and tactical activities of Call Centers and the companies which they serve. The obtained sample corresponds to 114 answered questionnaires by 103 companies among almost 200 companies consulted. Using DATAMONITOR forecasting (2005), it represents 5.6% of all Brazilian Call Centers. Using the estimated values shown in the introduction, it represents around 10.0% of the total of Call Centers in the country. It has been requested from the respondents information about the types of users and industries that they serve, as well as the competitive conditions that they face. They have also supplied detailed information about the additional technologies used, administration practices, work organization, training, payment and reward policies, turnover levels, expectations of growth of the segment and future perspectives. Call Centers participants of this report account for a workforce of 126.806 workers that represent approximately 31% of the employees of the industry, using the average obtained in the previous item. As Call Centers serve multiple segments of consumers and industries, many questions refer directly to main employees, defined as the major group of employees, (operators, telemarketing operators, the positions depending on each company) that executes the main activity carried out by Call Centers. This report presents a radiograph of the Call Center industry with information obtained in the survey and that make possible a wide range of studies and evaluations depending on what it is intended to analyze. Some of those analyses and interpretations are presented as follows.

13
3 – Brazilian Call Center Industrial Overview
3.1 – Industry and market segments 3.1.1 – Industry segment
The survey has involved Call Centers working for a great variety of industrial segments. The figure 3.1 shows the 15 major segments mentioned by the respondents. The figures represent the total of Call Centers working for the each mentioned segment. A first group is observed involving retail, banks and telecommunications with occurrences between 48 and 54, being retail the most significant segment of all.
54
50
48
34
31
30
27
26
24
22
22
21
19
18
16
0 10 20 30 40 50 60
Retail
Banks
Telecom
Insurance
Media
Health
Utilities
Publishing and Printing
Public sector services
Local government
Food and drink
Pharmaceuticals
Recreation and leisure
Manufacturing
Charity
Figure 3.1 – Segment distribution – 15 main mentioned segments
In comparison with these three segments, the other segments are far behind. The results obtained in Brazil were relatively aligned with the observed in other countries. In France, for instance, the four major segments assisted were Insurance, Retail, Telecommunications and Banks. Germany´s report have shown a cluster of segments, being Financial Services, Graphic services/ Media / Editorials, Public Services and Retail the most mentioned. In the United States, Telecommunications, Financial Services, IT and Businesses Services and Retail.

14
3.1.2 – Types of services
The types of services rendered by Call Centers can be quite different as it is observed in the figure 3.2. Those differences are important in the definition of the business strategy and also in the human resources policies Depending on the rendered service, the employees' profile is different, corresponding to different skills.
In this study, 43 of all Call Centers (38%) render services and offer sales, 22 (19%) only services and another 22 (19%) render telemarketing as the main service.
43
22
22
10
4
4
0 5 10 15 20 25 30 35 40 45
Customer service andsales
Customer service only
Telemarketing
Collections
IT Help-desk
Sales to existingcustomers only
Figure 3.2 – Call Center distribution by primary type of customer interaction
The results obtained in the Brazilian survey are similar to the obtained in the United States for the first three positions, Customer Services and Sales, Customer Service Only and Telemarketing. In France, Customer Service Only occupied the first position with 34% of the total sample, followed by Customer Service and Sales and Telemarketing with 25% and 18%, respectively.
3.2 – Organizational Characteristics of Call Centers
This survey identified a great variety of Call Centers in terms of size, structure, implementation time, location and market.
15
3.2.1 – Size of Call Centers
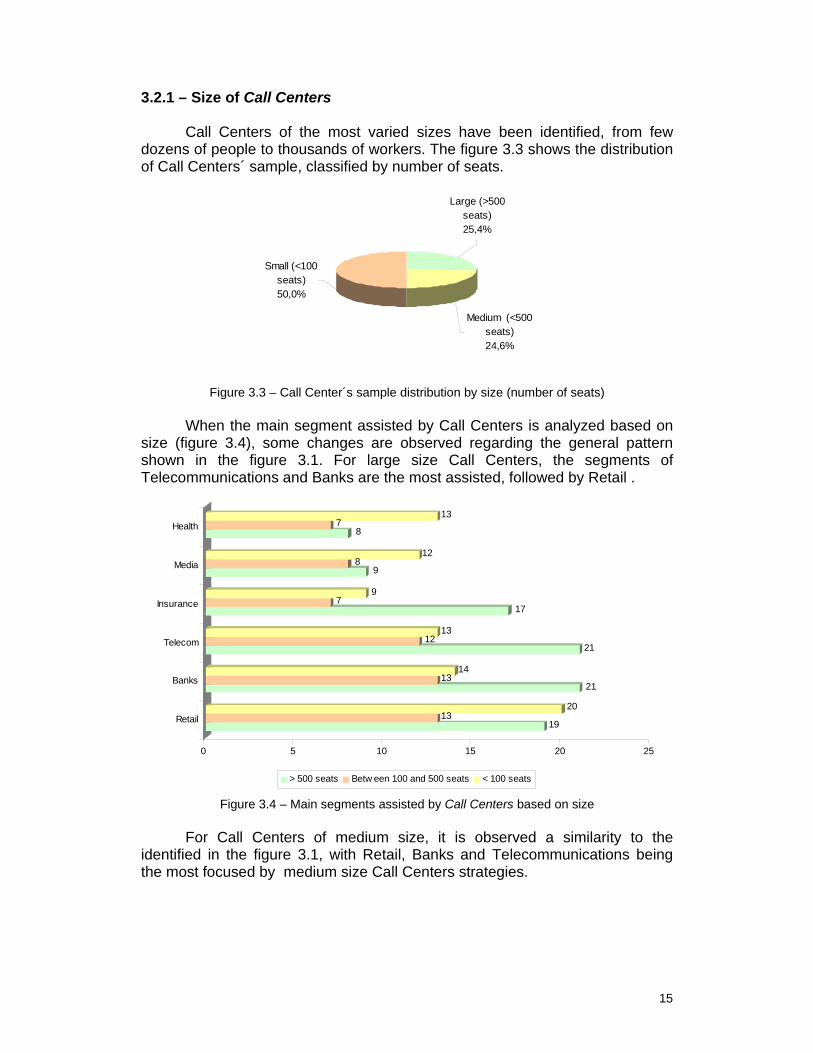
Call Centers of the most varied sizes have been identified, from few dozens of people to thousands of workers. The figure 3.3 shows the distribution of Call Centers´ sample, classified by number of seats.
Small (<100 seats)50,0%
Medium (<500 seats)24,6%
Large (>500 seats)25,4%
Figure 3.3 – Call Center´s sample distribution by size (number of seats)
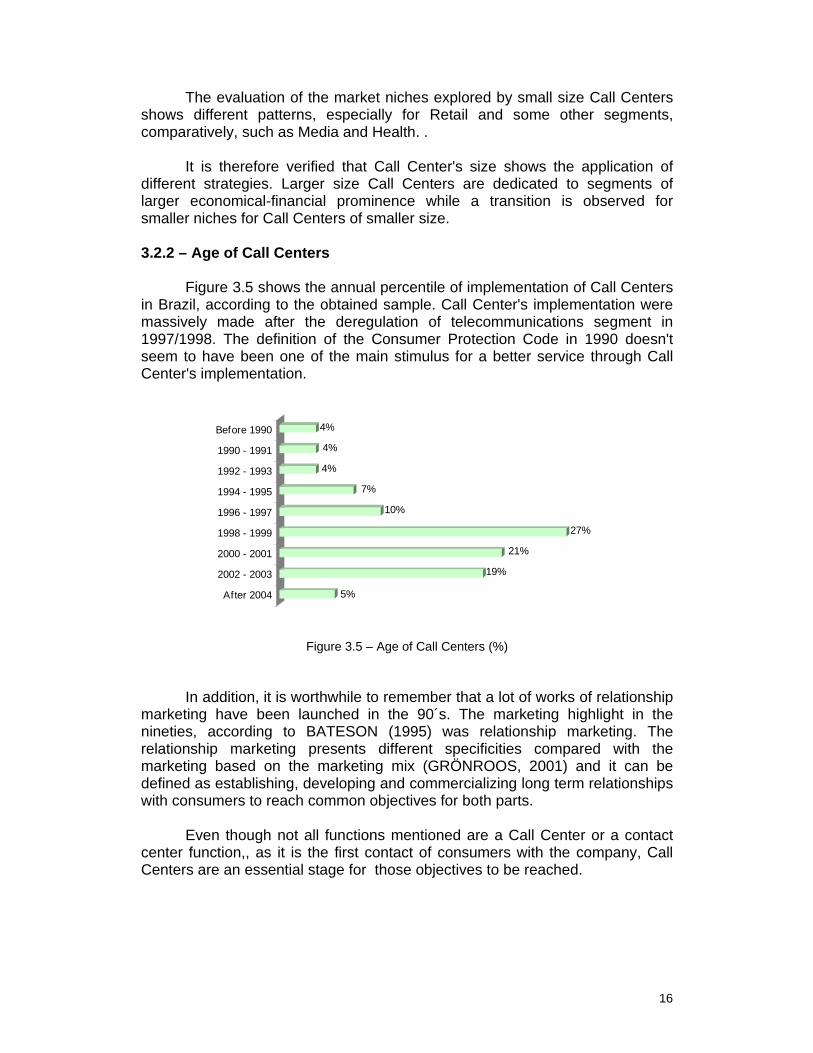
When the main segment assisted by Call Centers is analyzed based on
size (figure 3.4), some changes are observed regarding the general pattern shown in the figure 3.1. For large size Call Centers, the segments of Telecommunications and Banks are the most assisted, followed by Retail .
1913
20
2113
14
2112
13
177
9
98
12
87
13
0 5 10 15 20 25
Retail
Banks
Telecom
Insurance
Media
Health
> 500 seats Betw een 100 and 500 seats < 100 seats
Figure 3.4 – Main segments assisted by Call Centers based on size
For Call Centers of medium size, it is observed a similarity to the identified in the figure 3.1, with Retail, Banks and Telecommunications being the most focused by medium size Call Centers strategies.
16
The evaluation of the market niches explored by small size Call Centers shows different patterns, especially for Retail and some other segments, comparatively, such as Media and Health. .
It is therefore verified that Call Center's size shows the application of different strategies. Larger size Call Centers are dedicated to segments of larger economical-financial prominence while a transition is observed for smaller niches for Call Centers of smaller size. 3.2.2 – Age of Call Centers
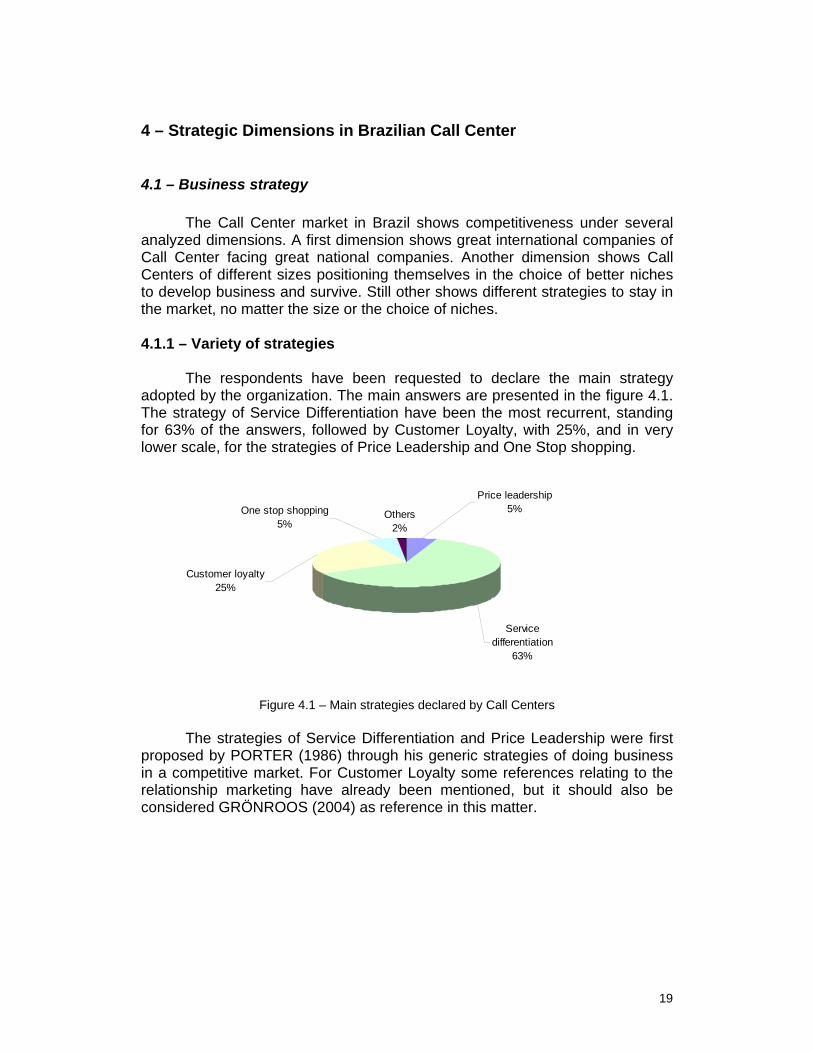
Figure 3.5 shows the annual percentile of implementation of Call Centers
in Brazil, according to the obtained sample. Call Center's implementation were massively made after the deregulation of telecommunications segment in 1997/1998. The definition of the Consumer Protection Code in 1990 doesn't seem to have been one of the main stimulus for a better service through Call Center's implementation.
5%
19%
21%
27%
10%
7%
4%
4%
4%
After 2004
2002 - 2003
2000 - 2001
1998 - 1999
1996 - 1997
1994 - 1995
1992 - 1993
1990 - 1991
Before 1990
Figure 3.5 – Age of Call Centers (%)
In addition, it is worthwhile to remember that a lot of works of relationship marketing have been launched in the 90´s. The marketing highlight in the nineties, according to BATESON (1995) was relationship marketing. The relationship marketing presents different specificities compared with the marketing based on the marketing mix (GRÖNROOS, 2001) and it can be defined as establishing, developing and commercializing long term relationships with consumers to reach common objectives for both parts.
Even though not all functions mentioned are a Call Center or a contact center function,, as it is the first contact of consumers with the company, Call Centers are an essential stage for those objectives to be reached.

17
3.2.3 - Call Centers as a part of large corporations
From the obtained sample, 53% of Call Centers are outsourced and 47% are in-house (figure 3.6). The outsourced are specialized companies in Call Center services and that render their services to other companies that hire their services. In-house Call Centers are part of a larger organization that maintained this service to customers as part of its business.
Among outsourced Call Centers it can also be found some that are subsidiaries or companies part of a group for which they render services. In these cases, the proximity and the control over the Call Center or vice-versa, can indicate a closer relationship, causing difficulties in identifying clear borders between them, especially in what refers to procedures and quality patterns
47%
53%
In-house Sub-contractor
Figure 3.6 – In-house and outsourced Call Centers (%)
The option for the maintenance of an in-house and outsourced Call
Center can be a complex decision within the company, based on two important theoretical approaches. The first, from PRAHALAD and HAMEL (1990) proposes that the company should identify their core competences and strive to potentialize them, thus outsourcing the activities that are not directly associated to the main business. Therefore, outsource activities of Call Center would be a form of focusing in the development of the core competences of the company.
On the other hand, the relationship marketing followers as STONE and WOODCOCK (2002) who propose to identify their customers, to create a relationship between a company and those customers and to administer that relationship in benefit of both parts. They can understand that the relationship is very important to be under the responsibility of a third party (outsourced Call Center). MCKENNA (1992) also advocates that ¨a personal relationship is the only way to keep the customers' fidelity¨. The analysis of this item becomes still more complex when the results of the other international surveys developed within the global project are examined. In the United States, 86% of Call Centers are in-house while the others 14% are outsourced. Similar situation also is verified in France where 72% are in-house and 28% are outsourced. However, in Germany, 33% are in-house and 67% are outsourced. Therefore, it doesn't seem to be a correct format to reinforce one or other strategy.

18
3.2.4 - Structure
Call Centers possess extremely flat structures as it can be seen in the
figure 3.7. The relationship among managers, supervisors and operators has the average of one manager for each 20 supervisors and for each supervisor an average of 20 operators.
119.426 ; 95%
5.832 ; 5% 548 ; 0%
Managers Supervisors Operators
Figure 3.7 – Managers, supervisors and operators distribution (%)
In specific cases very different relations from the average have been observed, but still confirming Call Centers's flat functional structure.
What calls attention, is that in Brazil this flattening is superior to the
observed in other countries of the project. While in Brazil, the percentile of managers and supervisors doesn't overcome 6%, it is at least 14% in the United States and 9% in France.
19
4 – Strategic Dimensions in Brazilian Call Center
4.1 – Business strategy
The Call Center market in Brazil shows competitiveness under several analyzed dimensions. A first dimension shows great international companies of Call Center facing great national companies. Another dimension shows Call Centers of different sizes positioning themselves in the choice of better niches to develop business and survive. Still other shows different strategies to stay in the market, no matter the size or the choice of niches. 4.1.1 – Variety of strategies
The respondents have been requested to declare the main strategy adopted by the organization. The main answers are presented in the figure 4.1. The strategy of Service Differentiation have been the most recurrent, standing for 63% of the answers, followed by Customer Loyalty, with 25%, and in very lower scale, for the strategies of Price Leadership and One Stop shopping.
Others2%
One stop shopping5%
Price leadership5%
Service differentiation
63%
Customer loyalty25%
Figure 4.1 – Main strategies declared by Call Centers
The strategies of Service Differentiation and Price Leadership were first
proposed by PORTER (1986) through his generic strategies of doing business in a competitive market. For Customer Loyalty some references relating to the relationship marketing have already been mentioned, but it should also be considered GRÖNROOS (2004) as reference in this matter.

20
The One Stop Shopping to customers has been a tendency observed in some countries and in some segments as, for instance, telecommunications in the United States. For final consumers, packages are offered, involving fixed and mobile telephony, broadband access and long distance for lower prices when compared to the purchasing of each service separately. Also, for great customers they offer consultancy on their networks, better technological options and a technical support in the desired level and agreed with the client. From the literature on strategy, what seems better to characterize this strategic option is described in HAX and WILDE II (2001) through the strategy of Complete Solutions for the Customers.
When in-house and outsourced Call Centers (figure 4.2) are examined separately, some differences are identified. The Service Differentiation remains as the most used strategy, but only for in-house Call Centers, Customer Loyalty increases from 25% to 35% on average while the Price Leadership strategy is reduced from 5% to 2%.
5%2%
8%
62%
54%
70%
25%
35%
17%5% 6% 5%
2% 2% 0%
Price leadership Servicedifferentiation
Customer loyalty One stopshopping
Others
All of them In-houses Sub-contractors
Figure 4.2 – In-house and outsourced Call Centers – Comparing strategies
For outsourced Call Centers, however, the Service Differentiation becomes still more significant, but Customer Loyalty drops to 17%. Also the Price Leadership goes from an average of 5% to 8%.
The strategic perspective can still be evaluated in several other ways. One of them verifies the strategy declared in sales behavior during the last two years (figure 4.3).

21
61%
20% 20%
69%
14% 17%
50%
33%
17%
83%
0%
17%
Servicedifferentiation
Customer loyalty Price leadership On stop shopping
Increased Decreased Remained the same Not Applicable
Figure 4.3 – Strategies and sales in last two years
The survey shows that Call Centers that adopted the Service Differentiation, have not obtained the largest percentile in increase of sales, (61%). This percentile was reached by those that adopted One Stop Shopping option, with 83%. However, as the amount of respondents of this strategic option was small, the result cannot be validated as a market trend.
On the other hand, it is verified that Customer Loyalty obtained an increase in sales (69%) superior to the Service Differentiation and in this case the analysis is valid, because it was the second more numerous sample of the survey. The Price Leadership strategy presents the same sampling situation as the One Stop Shopping. However it is interesting to observe that it has presented the smallest sales increase rate (50%) and the largest sales rate remains the same (33%). 4.1.2 – Differences by segment
The figure 4.4 shows the use of the strategies in the six main segments identified in the survey. Service Differentiation strategy is majority in all segments, but with percentile varying from 73% in Health to 52% in Media. On the other hand, Customer Loyalty appears with 32% in Media and only 7% in Health.

22
65% 22% 4% 7%
66% 10% 12% 8%
58% 23% 10% 6%
68% 12% 6% 12%
52% 32% 6% 6%
73% 7% 10% 7%
0% 10% 20% 30% 40% 50% 60% 70% 80% 90% 100%
Retail
Banks
Telecom
Insurance
Media
Health
Service differentiation Customer loyalty Price leadership One stop shopping Others
Figure 4.4 – Strategies and six main market segments
Regarding the less mentioned strategies, it is interesting to observe a percentile of 12% in Banks segment for the strategy of Price Leadership and 12% in Insurance segment for One Stop Shopping strategy. 4.1.3 – Geographical Market
Regarding the geographical market, the great majority of respondents affirmed to have the national market as main target (64%) (Figure 4.5). The service to the international market is still quite incipient with only 2.6%.
International; 2,6%
National; 64,0%
Regional; 15,8%
Local; 17,5%
Figure 4.5 – Main geographical market

23
When the evaluation is made in the six largest segments, the
predominance of the national scope is still evident (figure 4.6), varying from 67% in the segments of Health and Retail up to 79% in the segment of Insurance. Regionally it is verified an accentuated performance of Bank segment in detriment of Health that is far below the average.
67% 11% 19% 4%
68% 20% 10% 2%
73% 13% 10% 4%
79% 12% 6% 3%
74% 10% 10% 6%
67% 7% 20% 7%
0% 10% 20% 30% 40% 50% 60% 70% 80% 90% 100%
Retail
Banks
Telecom
Insurance
Media
Health
National Regional Local International
Figure 4.6 – Six main segments scope
In local market, Retail and Health play a great role, respectively with 19% and 20%. Finally, in the international setting,, excepting for Bank, all others segments were above the average, in special Health .
4.2 – Location strategy 4.2.1 – Geographical location of Call Centers
From the obtained sample, the great majority of Call Centers is in the most significant markets, especially in the state of São Paulo. But there are also Call Centers in several other states, and some great companies have Call Centers in several sites spread for several cities.

24
When asked about the reason to choose the places where Call Centers are implemented (figure 4.7) there was a certain balance among the answers Presence of skilled workforce (26%), Presence of firms important to your business (25%) and Infrastructure (20%). It is interesting to note that only 4% of the respondents reported low salaries as the reason to choose a certain place .
Presence of skilled workforce
26%
Presence of other firms important to
your business25%
Others12%Low wages
4%
Infrastructure20%
Low real estate costs13%
Figure 4.7 – Call Centers location reason
The strategic questions allow a great number of evaluations and crossing of information that make possible a better evaluation, interpretation and even strategic adjustments for business improvement. Depending on the adopted strategy, it becomes clear that the performance in the business can vary, interfering in the final consumers' satisfaction.
In the countries under benchmark it was verified that in the United States the Service Differentiation was the most mentioned strategy (45%), followed by the One Stop Shopping (21%) and Customer Loyalty (16%). In France, the Service Differentiation strategy took the fourth position (8%) and the strategies better positioned were Customer Loyalty (42%), Brand Identification (27%) and One Stop Shopping (14%)
25
5 – Market Segments and Human Resource Practices in Call Centers
Following, the different practices of Human Resources (HR) adopted by the companies, and how these practices are adapted to each segment of customers both in in-house and in outsourced Call Centers.
5.1 – Customer segmentation and human resource systems
With the consumers' segmentation,the adoption of different human resource practices can drive to a better service to fulfill the needs of the specific target audience. When providing service to great companies, the development of relationship politicies gain strength in the search of a personalized service to their specifications, with a view to long term relationships, having in mind the importance of these consumers to the organization.
When dealing with small companies, the operators have the possibility to
determine a closer relationship, offering customized services to respond to their needs. Finally, when dealing with general public, simpler operations are presented, as complaints, payments issuance and providing information to this assisted customer. 5.1.1 – Number of calls per day
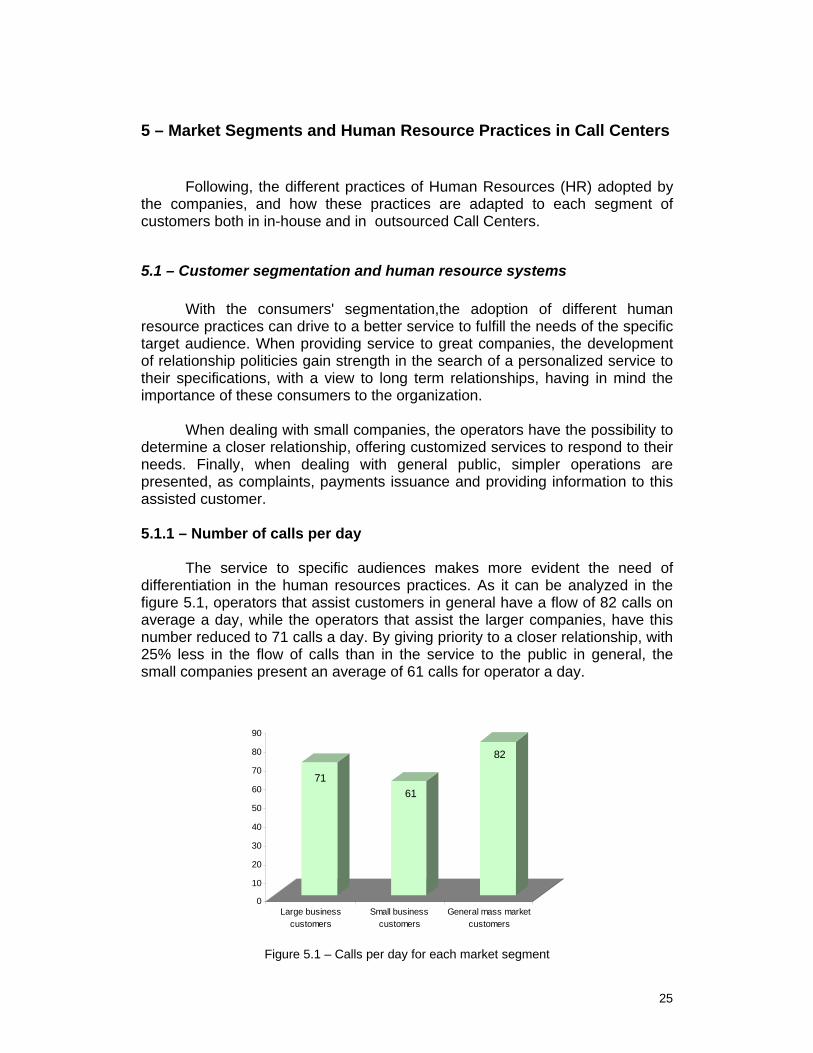
The service to specific audiences makes more evident the need of differentiation in the human resources practices. As it can be analyzed in the figure 5.1, operators that assist customers in general have a flow of 82 calls on average a day, while the operators that assist the larger companies, have this number reduced to 71 calls a day. By giving priority to a closer relationship, with 25% less in the flow of calls than in the service to the public in general, the small companies present an average of 61 calls for operator a day.
7161
82
0
10
20
30
40
50
60
70
80
90
Large businesscustomers
Small businesscustomers
General mass marketcustomers
Figure 5.1 – Calls per day for each market segment

26
5.1.2 – Length of each call
The service to small companies, according to what can be observed in the previous graph indicates that the operator prioritize a reduction in the number of calls with longer contact with the consumer, with average connection length coming up to 4 min. and 20s. In the other segments, Big Companies and Customers in General, there is a similarity in the length of calls, respectively in 3 min and 40s and, 3 min and 50s, according to figure 5.2.
3,4
4,2
3,5
0
0,5
1
1,5
2
2,5
3
3,5
4
4,5
Large businesscustomers
Small businesscustomers
General mass marketcustomers
Figure 5.2 – Length of calls (min.)
5.1.3 – Payment level by market segment
The differences presented in the services rendered to custormers´ segments, reflect the applications and skills of the operators to perform this service, influencing the payment level of the operator. The operator of small companies have a larger annual level of income,, around US$ 6,020;, on the other hand, for general public, the operator is paid an annual salary of US$ 4,404. Smaller income is paid for the service to the larger companies, something around US$ 4,025, as shown in figure 5.3. The difference between the largest and smaller wage among segments is around 33%.

27
4.025
6.020
4.404
-
1.000
2.000
3.000
4.000
5.000
6.000
7.000
Large businesscustomers
Small businesscustomers
General mass marketcustomers
Figure 5.3 – Payment level by market segment
5.2 – Selection of workforce and staffing strategies 5.2.1 – Educational level
As it can be observed in the figure 5.4, the great majority of the operators in the Call Center industry has high school degree as instruction level .
4% 85% 11%
2% 82% 16%
4% 85% 10%
81% 19%
6% 81% 13%
3% 80% 17%
7% 59% 33%
2% 87% 12%
0% 10% 20% 30% 40% 50% 60% 70% 80% 90% 100%
Retail
Banks
Telecom
Insurance
Media
Health
In-houses
Sub-contractors
No qualif ication High school Graduate
Figure 5.4 – Operators education level When comparing the level of education of in-house and outsourced Call
Centers, it is observed that higher education is more expressive in in-house Call Center representing 33% and 12% in the outsourced.
28
The high rates of high school degree can be understood as a minimum requirement of the instruction degree demanded by the companies to their candidates in the selection processes to a vacancy. Another aspect to be considered is that according to ABT - Associação Brasileira de Telesserviços, 45% of these professionals are youngsters in their first job, therefore they are in the beginning of the professional career and they use this opportunity to subsidize the costs of the university.. 5.2.2 – Gender distribution
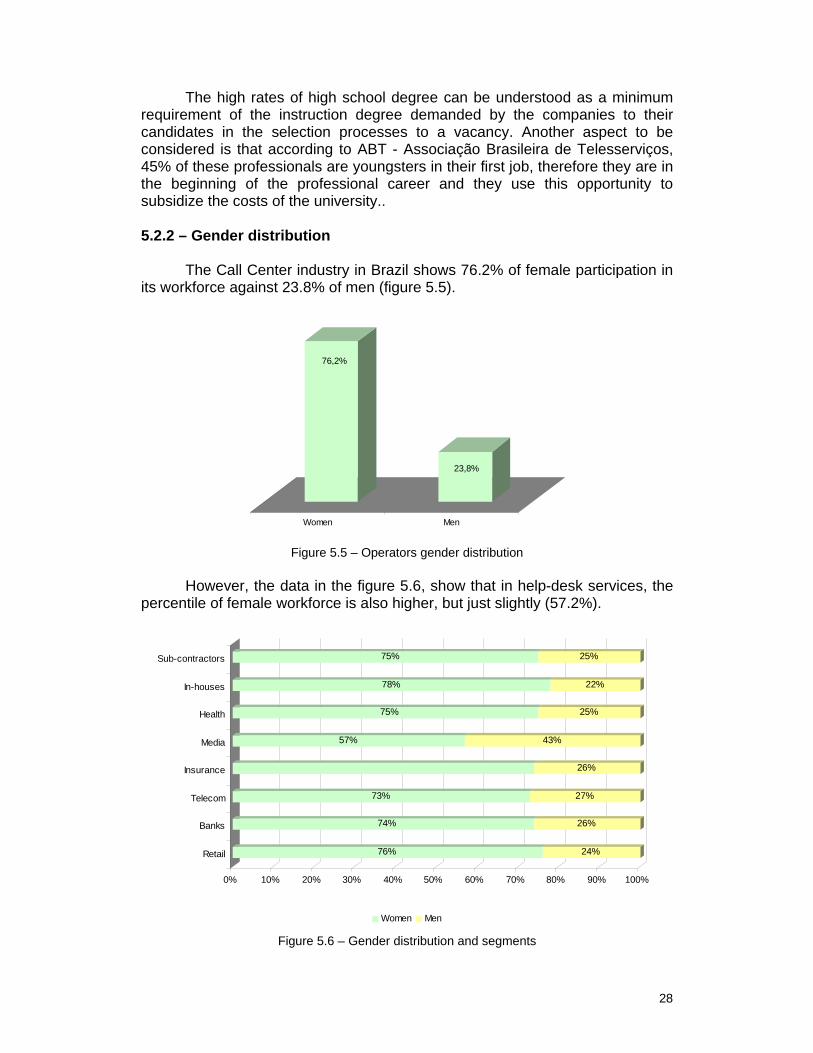
The Call Center industry in Brazil shows 76.2% of female participation in
its workforce against 23.8% of men (figure 5.5).
76,2%
23,8%
Women Men
Figure 5.5 – Operators gender distribution
However, the data in the figure 5.6, show that in help-desk services, the
percentile of female workforce is also higher, but just slightly (57.2%).
76% 24%
74% 26%
73% 27%
26%
57% 43%
75% 25%
78% 22%
75% 25%
0% 10% 20% 30% 40% 50% 60% 70% 80% 90% 100%
Retail
Banks
Telecom
Insurance
Media
Health
In-houses
Sub-contractors
Women Men
Figure 5.6 – Gender distribution and segments

29
When comparing this Brazilian distribution to countries such as Germany, France and United States, the same indicators, larger concentration of female workforce, is observed in relation to men. Besides this, a smaller variation of women in services of information technology, as characterized in Brazil. 5.2.3 – Hiring of full-time, part-time and temporary workers
The study reveals that there is a tendency in the Call Center industry to hire employees in full-time regime (according to figure 5.7). The data of the figure 5.8 indicate that in outsourced Call Center, 85% of the employees work as full-time (36 hours) and in the in-house, this rate corresponds to 65%. In part-time (less than 36 hours) the outsourced present a rate of 15% and the in-house a rate of 35% of employees in part-time regime.
109.288
16.518
Full-time Part-time
Figure 5.7 – Full-time and part-time works in the sample
Help-desk (IT) appears in the study as having the higher rate of part-time workers with a percentile of 90%, maybe for the technical specificity that characterizes the service rendered by this segment. Followed by Health with an index of 30% of workers hired in part-time regime.

30
94% 6%
86% 14%
87% 13%
14%
11% 89%
72% 28%
69% 31%
89% 11%
0% 10% 20% 30% 40% 50% 60% 70% 80% 90% 100%
Retail
Banks
Telecom
Insurance
Media
Health
In-houses
Sub-contractors
Full-time Part-time
Figure 5.8 – Full-time and part-time workers by segment Retail has 90% of their employees on average in the full-time regime.
Similarly, the Insurance, Bank and Telecom also act in the majority of cases with full-time workers. The part-time workers are minority in those segments.
Among researched Call Centers 26% hire temporary workers, in order to accommodate eventual demand increases, to cover operators’ absence and even for costs saving.
5.2.4 – Hiring practices
Candidates´s recruiting and selection require an efficient process that
take into consideration the characteristics of the job position and the desired profile to match appropriate candidates to the needs of the company. In this way, the selection relies on several techniques that make possible to identify the right person for the right place, that is, to the position to be filled . The most used techniques are: interviews, tests and group dynamics and they indicate if these candidates are qualified or not to join the company.
The study shows that 87% of the companies use recruitment and
selection techniques and systems structured to identify candidates to join the the company. The companies declare that the average cost to recruit and to select is of US$ 101 per candidate.
This is a relevant data to help the company in the HR analysis, when
making comparisons among turnover taxes, average time of training and relative costs of training activities.
31
6 – Technology and work organizations; skills and incentive mechanisms
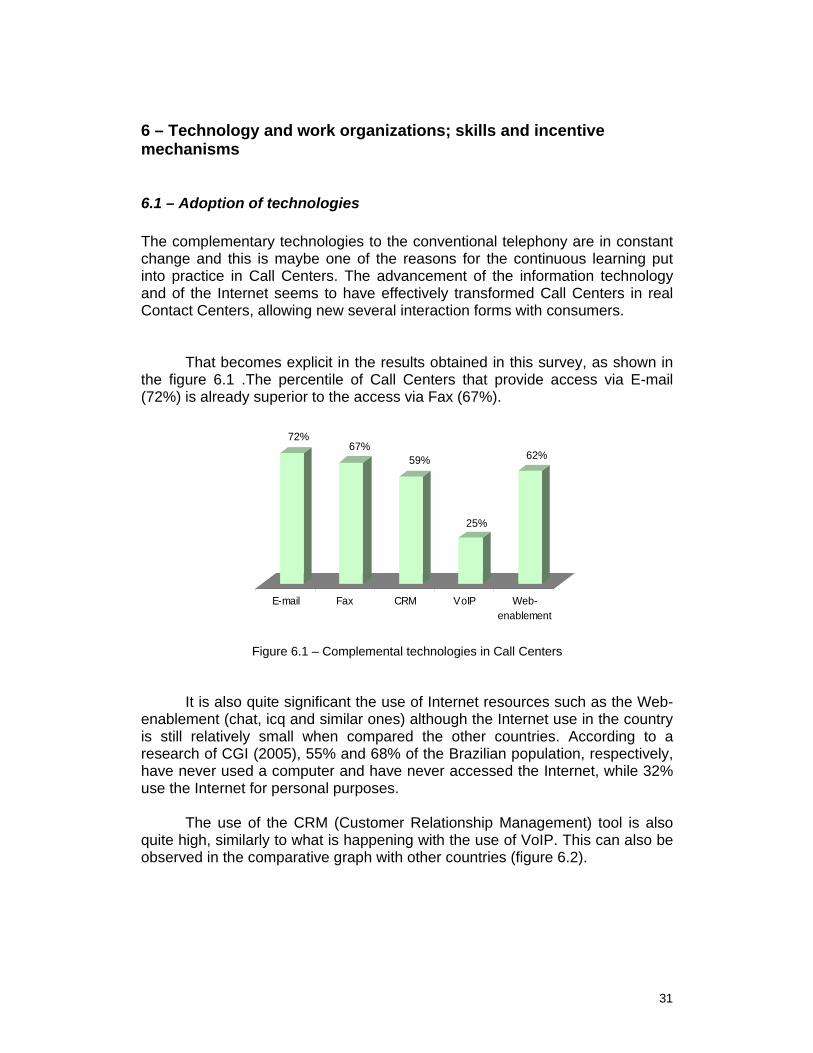
6.1 – Adoption of technologies The complementary technologies to the conventional telephony are in constant change and this is maybe one of the reasons for the continuous learning put into practice in Call Centers. The advancement of the information technology and of the Internet seems to have effectively transformed Call Centers in real Contact Centers, allowing new several interaction forms with consumers.
That becomes explicit in the results obtained in this survey, as shown in the figure 6.1 .The percentile of Call Centers that provide access via E-mail (72%) is already superior to the access via Fax (67%).
Figure 6.1 – Complemental technologies in Call Centers
It is also quite significant the use of Internet resources such as the Web-enablement (chat, icq and similar ones) although the Internet use in the country is still relatively small when compared the other countries. According to a research of CGI (2005), 55% and 68% of the Brazilian population, respectively, have never used a computer and have never accessed the Internet, while 32% use the Internet for personal purposes.
The use of the CRM (Customer Relationship Management) tool is also
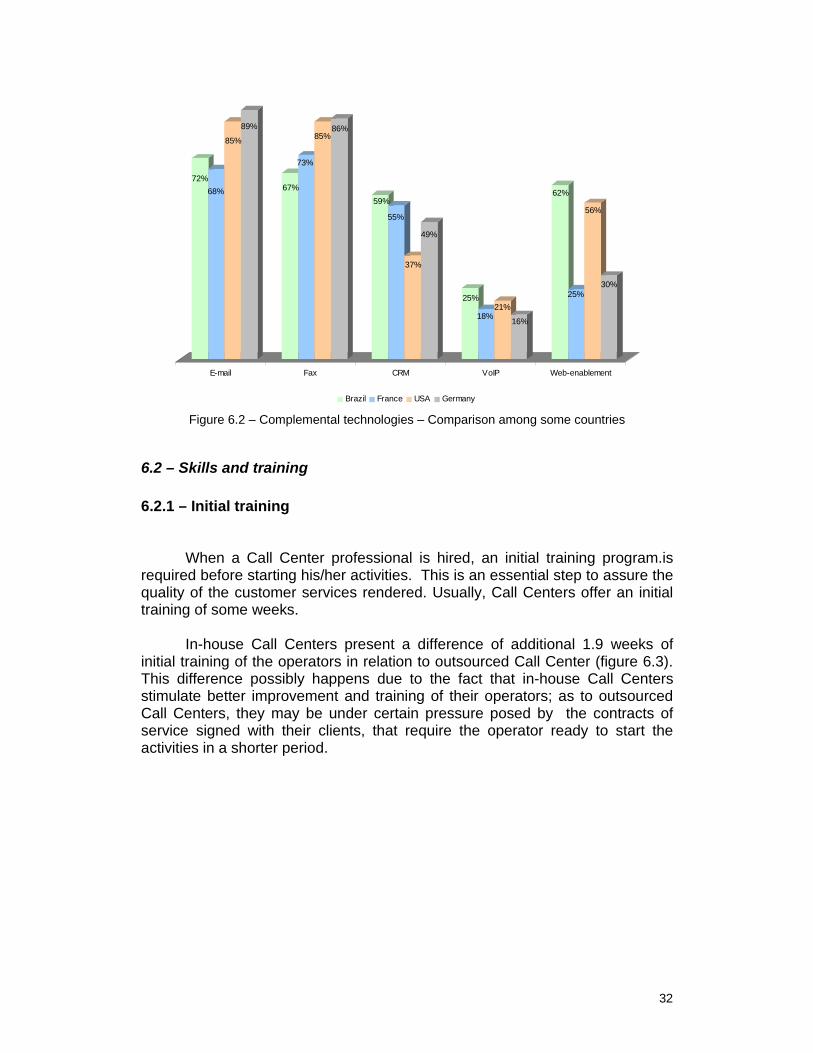
quite high, similarly to what is happening with the use of VoIP. This can also be observed in the comparative graph with other countries (figure 6.2).
72%67%
59%
25%
62%
E-mail Fax CRM VoIP Web-enablement
32
72%68%
85%
89%
67%
73%
85%86%
59%
55%
37%
49%
25%
18%21%
16%
62%
25%
56%
30%
E-mail Fax CRM VoIP Web-enablement
Brazil France USA Germany
Figure 6.2 – Complemental technologies – Comparison among some countries
6.2 – Skills and training 6.2.1 – Initial training
When a Call Center professional is hired, an initial training program.is
required before starting his/her activities. This is an essential step to assure the quality of the customer services rendered. Usually, Call Centers offer an initial training of some weeks.
In-house Call Centers present a difference of additional 1.9 weeks of
initial training of the operators in relation to outsourced Call Center (figure 6.3). This difference possibly happens due to the fact that in-house Call Centers stimulate better improvement and training of their operators; as to outsourced Call Centers, they may be under certain pressure posed by the contracts of service signed with their clients, that require the operator ready to start the activities in a shorter period.

33
4,5
3,6
4,7
3,8
3,8
4,1
5,4
3,5
0 1 2 3 4 5 6
Retail
Banks
Telecom
Insurance
Media
Health
In-houses
Sub-contractors
Weeks
Figure 6.3 – Initial training by segment (weeks)
Telecommunications segment, for the technical specificity of the products
and services, demand 4.7 weeks in the initial training; following comes Retail with 4.5 weeks, possibly for being a segment related to products and services selling, characterizing the need of high training, in order to reach high productivity rates.
This requirement, however, is centered in the initial training; later, this
rate is smaller, as it is shown in figure 6.4, because, after the initial phase, the professional can develop the day-by-day abilities during the function execution. 6.2.2 – Continuous training
The continuous training is a requirement of the process that recommends constant updating of the operators. Therefore, the Call Centers (in-house and outsourced), identify the importance and the need of a continuous training, determining an annual time load to, recycle and to stimulate the professionals' continuous development.
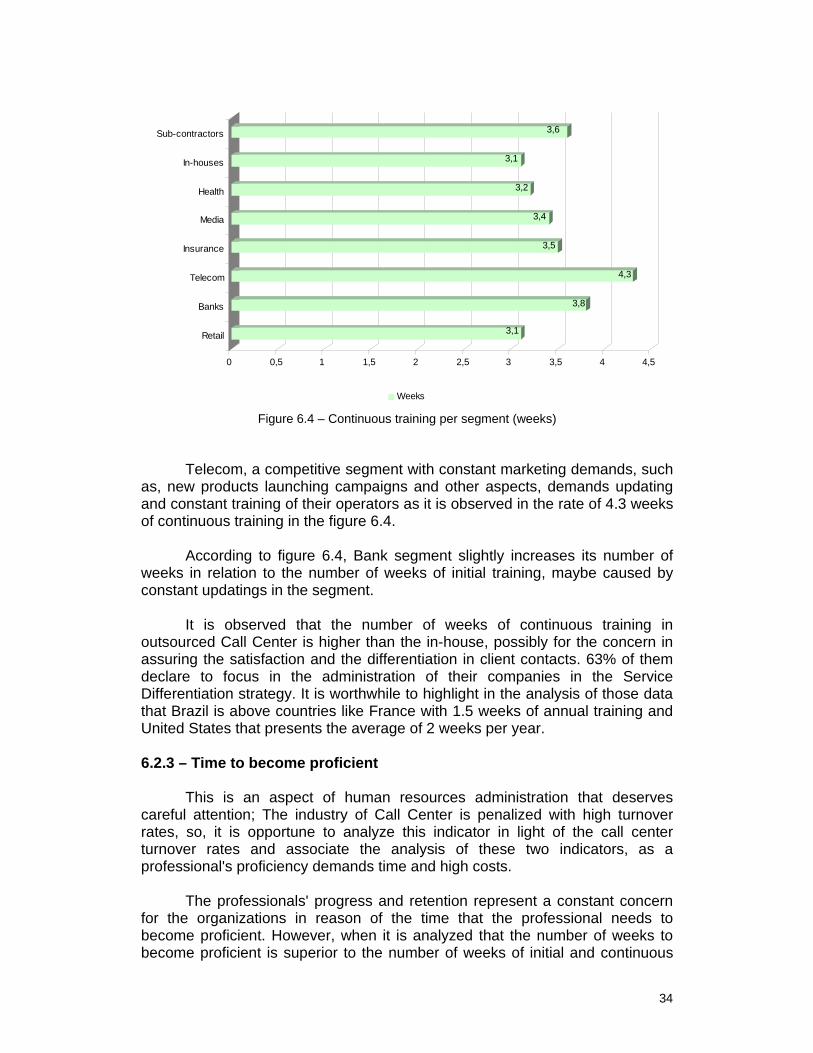
Data in the figure 6.4 show larger number of weeks in the training of
telecommunications professionals, possibly for the need of updating to technological changes of the products and services. However, the Retail segment reduces the number of weeks in relation to the weeks of initial training, possibly for the development of skills that happens along the practical work, because the professional in this function is relatively more monitored, receiving feedback more frequently.
34
3,1
3,8
4,3
3,5
3,4
3,2
3,1
3,6
0 0,5 1 1,5 2 2,5 3 3,5 4 4,5
Retail
Banks
Telecom
Insurance
Media
Health
In-houses
Sub-contractors
Weeks
Figure 6.4 – Continuous training per segment (weeks)
Telecom, a competitive segment with constant marketing demands, such
as, new products launching campaigns and other aspects, demands updating and constant training of their operators as it is observed in the rate of 4.3 weeks of continuous training in the figure 6.4.
According to figure 6.4, Bank segment slightly increases its number of weeks in relation to the number of weeks of initial training, maybe caused by constant updatings in the segment.
It is observed that the number of weeks of continuous training in
outsourced Call Center is higher than the in-house, possibly for the concern in assuring the satisfaction and the differentiation in client contacts. 63% of them declare to focus in the administration of their companies in the Service Differentiation strategy. It is worthwhile to highlight in the analysis of those data that Brazil is above countries like France with 1.5 weeks of annual training and United States that presents the average of 2 weeks per year. 6.2.3 – Time to become proficient
This is an aspect of human resources administration that deserves
careful attention; The industry of Call Center is penalized with high turnover rates, so, it is opportune to analyze this indicator in light of the call center turnover rates and associate the analysis of these two indicators, as a professional's proficiency demands time and high costs.
The professionals' progress and retention represent a constant concern
for the organizations in reason of the time that the professional needs to become proficient. However, when it is analyzed that the number of weeks to become proficient is superior to the number of weeks of initial and continuous
35
training, an aspect of the administration of people is identified and should have the attention of HR professionals and of the Call Center operation..
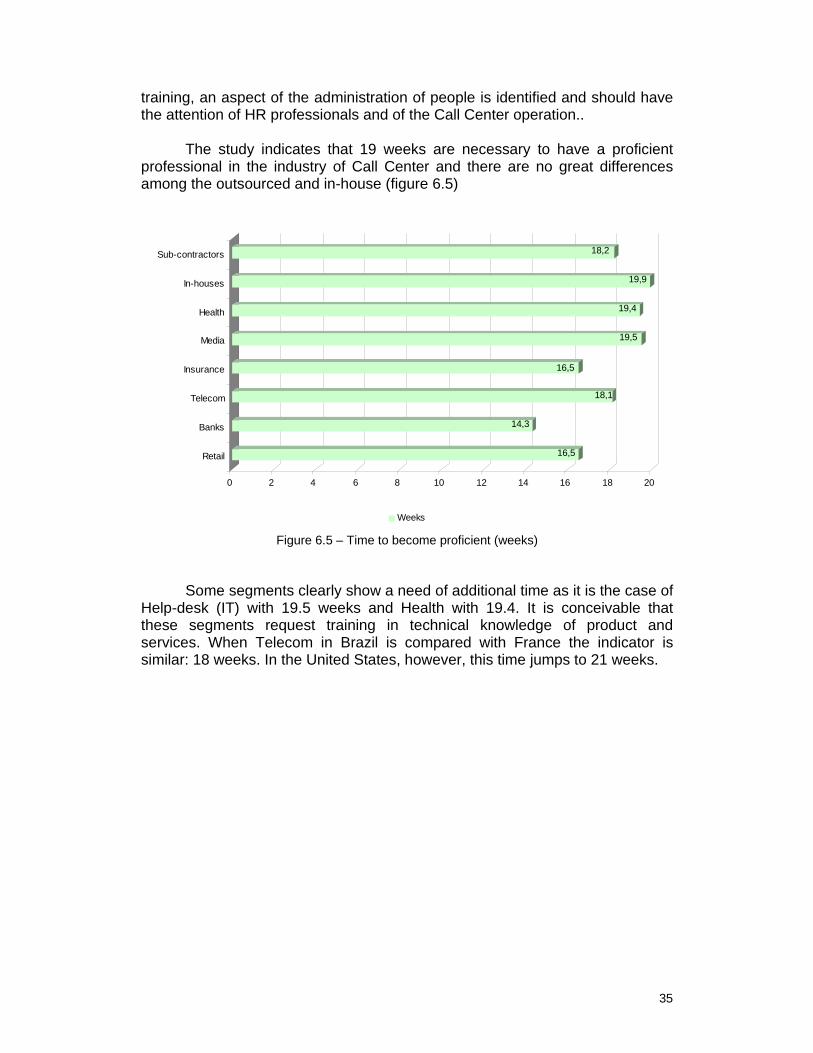
The study indicates that 19 weeks are necessary to have a proficient
professional in the industry of Call Center and there are no great differences among the outsourced and in-house (figure 6.5)
16,5
14,3
18,1
16,5
19,5
19,4
19,9
18,2
0 2 4 6 8 10 12 14 16 18 20
Retail
Banks
Telecom
Insurance
Media
Health
In-houses
Sub-contractors
Weeks
Figure 6.5 – Time to become proficient (weeks)
Some segments clearly show a need of additional time as it is the case of
Help-desk (IT) with 19.5 weeks and Health with 19.4. It is conceivable that these segments request training in technical knowledge of product and services. When Telecom in Brazil is compared with France the indicator is similar: 18 weeks. In the United States, however, this time jumps to 21 weeks.

36
7 – Work organization: pattern, autonomy, teamwork
7.1 – Number of calls per day
In general, outsourced Call Centers answer a higher number of calls, 82 a day, compared to the 70 calls of in-house Call Centers. The largest volume of calls among segments as Telecommunications, with 77 calls and Bank, with 88 calls, can be explained as these are market segments with the larger number of customers requesting services, or accessing them for new products opportunities. The figure 7.1 illustrates these data.
76
88
77
68
72
70
82
0 10 20 30 40 50 60 70 80 90
Retail
Banks
Telecom
Insurance
Media
In-houses
Sub-contractors
Figure 7.1 – Number of calls per day per operator
When comparing the duration of calls of in-house and outsourced Call Centers it is observed that there is no difference, both around 4 minutes per call. Among the segments, it is worthwhile to mention Bank segment that does a call every 3 minutes on average, much more than other segments, which legth varies from 4 min. to 4 min. 10s. An interesting fact to mention is observed in the previous figure; Call Center in Bank segment presents a larger flow of calls, what causes a smaller length for each call, probably due to the type of interaction and the automation degree (consults to accounts, etc.). See figure 7.2.

37
4,07
3,40
4,04
4,27
4,11
3,57
3,42
0,00 0,50 1,00 1,50 2,00 2,50 3,00 3,50 4,00 4,50
Retail
Banks
Telecom
Insurance
Media
In-houses
Sub-contractors
Figure 7.2 –Duration of calls
7.2 – Autonomy on job 7.2.1 – Use of scripted texts
According to Oliveira (2002), the script is a mechanism of vulnerability
control resulting from the increase in company-customer's connection possibilities. It is an attempt to produce a uniform, egalitarian and trustful service which controlls the interactive process, reduces the sensitiveness to the context restrictions and to the participants' reciprocal influence over the flow of that conversation and to the perspective and feelings of participants - customers and the operator.
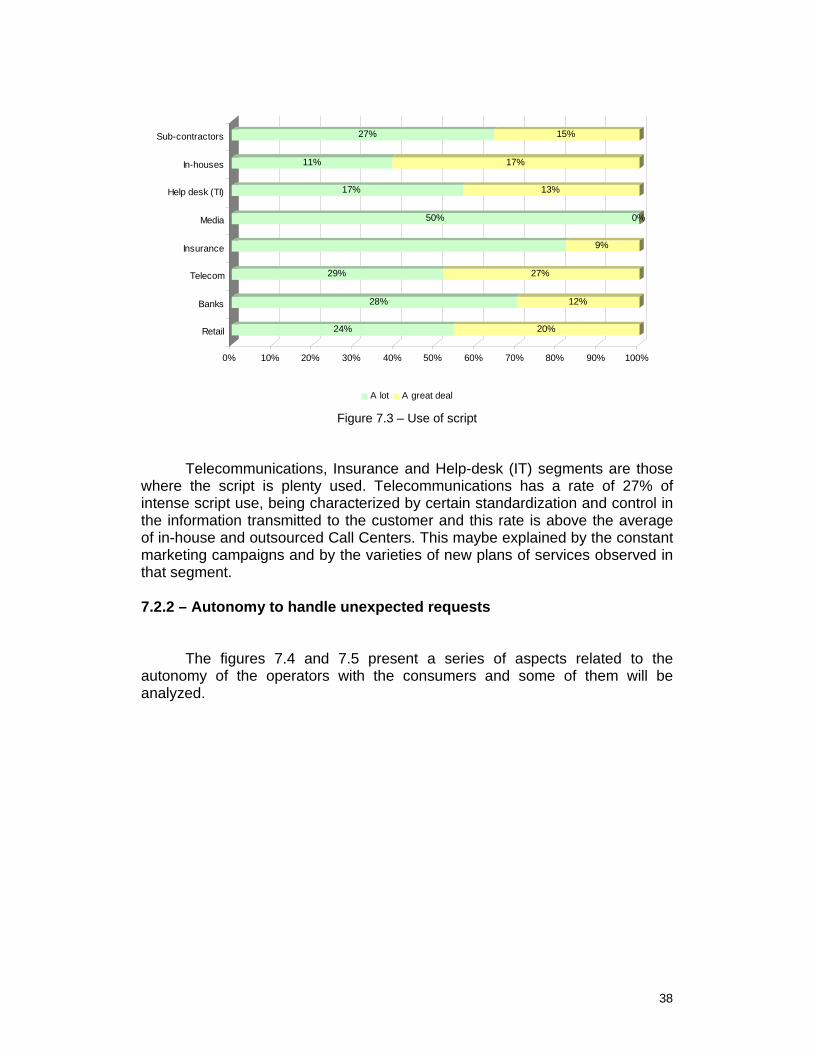
The study points out that the script is more used in outsourced Call Center in a rate of 42%, denoting more conditioning in the way of performing the service in comparison with in-house Call Center, where the rate is 28%, according to figure 7.3.
38
24% 20%
28% 12%
29% 27%
9%
50% 0%
17% 13%
11% 17%
27% 15%
0% 10% 20% 30% 40% 50% 60% 70% 80% 90% 100%
Retail
Banks
Telecom
Insurance
Media
Help desk (TI)
In-houses
Sub-contractors
A lot A great deal
Figure 7.3 – Use of script
Telecommunications, Insurance and Help-desk (IT) segments are those
where the script is plenty used. Telecommunications has a rate of 27% of intense script use, being characterized by certain standardization and control in the information transmitted to the customer and this rate is above the average of in-house and outsourced Call Centers. This maybe explained by the constant marketing campaigns and by the varieties of new plans of services observed in that segment.
7.2.2 – Autonomy to handle unexpected requests
The figures 7.4 and 7.5 present a series of aspects related to the autonomy of the operators with the consumers and some of them will be analyzed.

39
38% 28% 21% 7% 6%
16% 37% 31% 11% 5%
5% 33% 39% 16% 6%
9% 20% 35% 29% 7%
9% 24% 32% 19% 16%
0% 10% 20% 30% 40% 50% 60% 70% 80% 90% 100%
Setting their daily lunch andbreak schedule?
Revising w ork methods?
Handling additional requestsor problems that arise
unexpectedly?
Settling customer complaintsw ithout referral to a
supervisor or other expert?
To w hat extent are coreemployees required to usescripts w hen talking to a
customer?
Not at all A little Moderate A lot A great deal
Figure 7.4 – Work autonomy When analyzing data in the figure 7.4, the professionals' low autonomy is
observed in the items: Setting daily hour and break schedule and also Revising working methods. Based in these aspects we can understand dimensions of service availability and standardization of the interactions with the customers.
In the aspects on the Settling customer complaints without referral to a
supervisor or other expert, a discreet moderate autonomy is observed, from moderate to intense, denoting that the professionals are qualified to assist different situations without appealing to the superiors.
7.2.3 - Autonomy over the pace of work
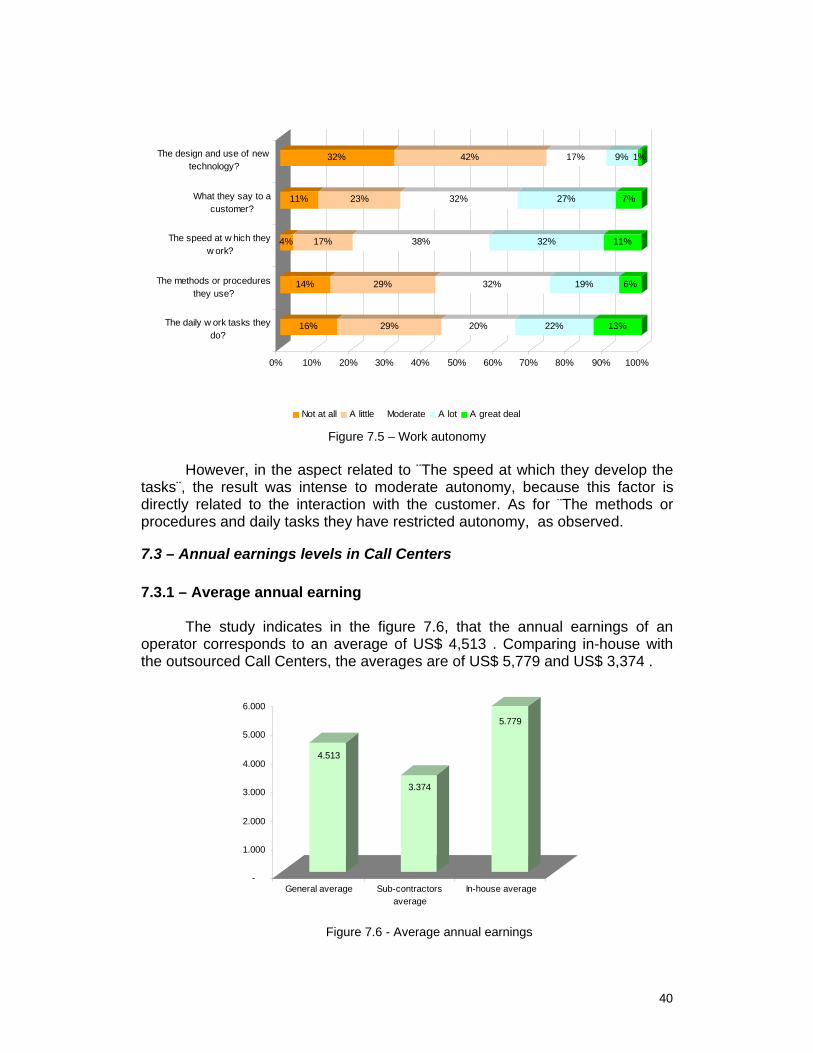
As it is demonstrated in the figure 7.5, in the aspect that explains the ¨Design and use of new technology¨, the autonomy rate is low or inexistent. It can be inferred that this rate denotes a superior strategic dimension that deliberates about this factor, so,that the autonomy on this item is limited to the strategic positions of the hierarchy to define them, transferring to the line professionals the responsibility for the execution, excluded the power of decision.
40
16% 29% 20% 22% 13%
14% 29% 32% 19% 6%
4% 17% 38% 32% 11%
11% 23% 32% 27% 7%
32% 42% 17% 9% 1%
0% 10% 20% 30% 40% 50% 60% 70% 80% 90% 100%
The daily w ork tasks theydo?
The methods or proceduresthey use?
The speed at w hich theyw ork?
What they say to acustomer?
The design and use of newtechnology?
Not at all A little Moderate A lot A great deal
Figure 7.5 – Work autonomy However, in the aspect related to ¨The speed at which they develop the
tasks¨, the result was intense to moderate autonomy, because this factor is directly related to the interaction with the customer. As for ¨The methods or procedures and daily tasks they have restricted autonomy, as observed.
7.3 – Annual earnings levels in Call Centers 7.3.1 – Average annual earning
The study indicates in the figure 7.6, that the annual earnings of an operator corresponds to an average of US$ 4,513 . Comparing in-house with the outsourced Call Centers, the averages are of US$ 5,779 and US$ 3,374 .
4.513
3.374
5.779
-
1.000
2.000
3.000
4.000
5.000
6.000
General average Sub-contractorsaverage
In-house average
Figure 7.6 - Average annual earnings

41
In Call Centers where the largest volume of calls refers to Customer
Service and Sales, the average rises to US$ 5,454. When the strategy declared by the company is Price Leadership the average drops to US$ 3,475, representing a loss of 33% in the annual earnings of the operator, in relation to the general average shown in the study.
7.3.2 – Percent of individual performance-based pay
The study shows in the figure 7.7, that 15% of outsourced Call Centers and 11% of in-house Call Centers adopt the system of individual commission, based on the professionals' performance. The average of the industry in the payment of individual commission is 13%.
13,2%
11,3%
15,0%
0,0% 2,0% 4,0% 6,0% 8,0% 10,0% 12,0% 14,0% 16,0%
General average
In-houses
Sub-contractors
% Individual based commissions
Figure 7.7 - Percent of individual performance-based pay
7.4 – Turnover and employment stability
Call Center companies must pay special attention and concern to the theme turnover. Because there are some associated costs, the turnover rate impacts in the organizations, as for example, in candidates´recruitment and selection, training and in the poor performance of inexperienced professionals. To overcome those rates, the organizations need to develop and implement HR practices to stimulate the stability of the operators, creating career perspectives, both in the company and externally.
Some points to consider: a) this is an activity that hires inexperienced
workforce; b) it is a young workforce and the majority of people finds in the segment their first job; c) the workers are submitted to a reasonable training period. Therefore, one of the reasons to justify the existing turnover can be the continuous training and the consequent, possibility to find other other job opportunities, maybe more aligned to their vocation.

42
13,4%
6,2%7,3%
15,7%
0,1%
Quit Werepromoted
Werepromoted(outside)
Weredismissed
Retired
, Figure 7.8 – Turnover rates
Based on data analysis, it is observed that the annual turnover rate
includes the employees that resigned; the ones that were dismissed, the ones that retired, the ones that were promoted for other positions, internally or in other companies of the group. According to the international methodology used in the project the general average was 33.1%, with small differences depending on the type of Call Center.
7.5 – Promotion to higher positions The study demonstrates that the opportunity for promotion and
professional growth in the career are larger in companies with in-house Call Center, with a rate of 29.9%, in comparison with an outsourced Call Center, which has a flattened hierarchical structure, 16.1%
7.6 – Dismissal rates in Brazilian Call Centers The rate of employees dismissal is 12.8% for in-house Call Centers and
18% for outsourced. The difference is possibly based on the fact that the outsourced suffer the impact of the length of contracts of the services in addition to the practices adopted in people's management, specifically related to candidates' recruitment and selection.
7.7 – Percentile of employees with less than one year of tenure
The rates of the study indicate that the professionals in operator´s position are submitted to the largest turnover, with a general average of 38.7%, with significant differences among in-house and outsourced Call Centers, with averages respectively 44.7% and 32.0% (figure 7.9).

43
38,7%
32,0%
44,7%
0,0%
5,0%
10,0%
15,0%
20,0%
25,0%
30,0%
35,0%
40,0%
45,0%
General average Sub-contractorsaverage
In-house average
Figure 7.9 - Employees with less than one year of tenure (%)
7.8 – Managers in Call Centers 7.8.1 – Academic background of managers
The efficiency in the service rendered depends as much of the skills of
the operators as on the motivation techniques and on the leadership skills of the superiors. A high level of education can be observed among the Call Centers managers the rates are 29% for post-graduate degree, 66% for higher education degrees, and only 5% for high school degree, as shown in figure 7.10
High school5%
Graduate66%
Master degree29%
Figure 7.10 – Academic background of managers (%)
7.8.2 – Years of tenure
In-house Call Centers showed a 5.2 years on average for managers´s
tenure. In the outsourced the average is 3.4 years. In the market segments surveyed, variation of 3 to 5 years is observed. The most prominent case is the Media segment, in 4.8 years of manager´s tenure. (figure 7.11.)

44
3,4
3,6
4,3
3,7
4,8
5,2
3,4
0 1 2 3 4 5 6
Retail
Banks
Telecom
Insurance
Media
In-houses
Sub-contractors
Figure 7.11 – Managers – Years of tenure by segment
7.8.3 – Managers´ annual earnings
These data regarding the remuneration show variations that deserve
special attention. While a Manager of in-house Call Center receives an average of US$ 26,322 , the same function performed in outsourced Call Centers have ao average remuneration of US$ 21,166 , representing a variation around 20%. Typically, the outsourced services companies, attempting to offer attractive prices for their clients, adopt a conservative structure of costs, a practice that can explain the reason of the lower wages in outsourced Call Centers.
Media segment, among the segments surveyed, is the one that shows managers´ longer tenure and higher salaries, US$ 25,605 annually, compared with other segments. Retail, on the other hand, has, among the most representative segments, the smallest average income, US$ 21,749 that is, a variation of 15%. The figure 7.12 shows those values precisely.
45
21.749
22.332
22.422
24.798
25.605
26.323
21.166
- 5.000 10.000 15.000 20.000 25.000 30.000
Retail
Banks
Telecom
Insurance
Media
In-houses
Sub-contractors
Figure 7.12 – Managers – Annual pay by segments (US$)
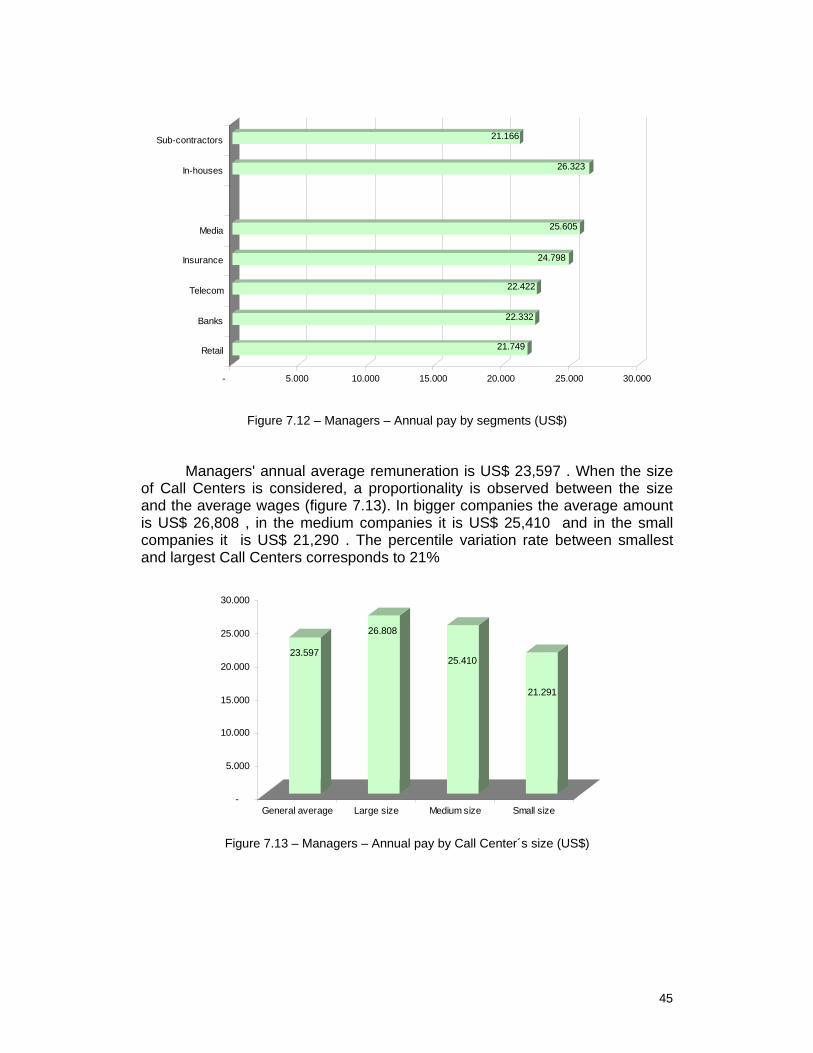
Managers' annual average remuneration is US$ 23,597 . When the size
of Call Centers is considered, a proportionality is observed between the size and the average wages (figure 7.13). In bigger companies the average amount is US$ 26,808 , in the medium companies it is US$ 25,410 and in the small companies it is US$ 21,290 . The percentile variation rate between smallest and largest Call Centers corresponds to 21%
23.597
26.808
25.410
21.291
-
5.000
10.000
15.000
20.000
25.000
30.000
General average Large size Medium size Small size
Figure 7.13 – Managers – Annual pay by Call Center´s size (US$)

46
8 – The institutional setting: public support and union effects
8.1 – Public segment support for call centers
The governmental support to Call Centers installation or operation seems incipient if non-existent, in a segment that has been presenting high growth and employment rates The figure 8.1 shows these issues and the percentile of answers observed in the sample. In this kind of scale, the answers ¨not at all¨ and ¨a little¨ represents low governmental support to the segment and ¨a lot¨ and ¨a great deal¨, high governmental support.
57% 23% 14% 5%
63% 14% 11% 9%
68% 23% 8% 1%
75% 16% 8% 2%
66% 18% 14% 2%
78% 14% 7%1%
0% 10% 20% 30% 40% 50% 60% 70% 80% 90% 100%
Job recruitment andplacement services
Training resources orprogrammes
Site location assistance
Incentives for locating intargeted zones
Tax abatements
Special loans and/or grants
Not at all A little Moderate level A lot A great deal
Figure 8.1 – Public segment support for call centers
It is observed that, in the best of the cases, more than 50% have never used recruitment (support center to the worker). Of all researched items, considering answers ¨not at all¨ and ¨a little¨, all, excepting “training programs” are above 80%. “Training programs” shows a percentile slightly above 10% for Call Centers that use public programs for this purpose.
The general average of answers ¨ never ¨ for the segment was 68% and total sum of all items of the answers ¨a lot¨ and ¨ a great deal ¨ was 24%.
47
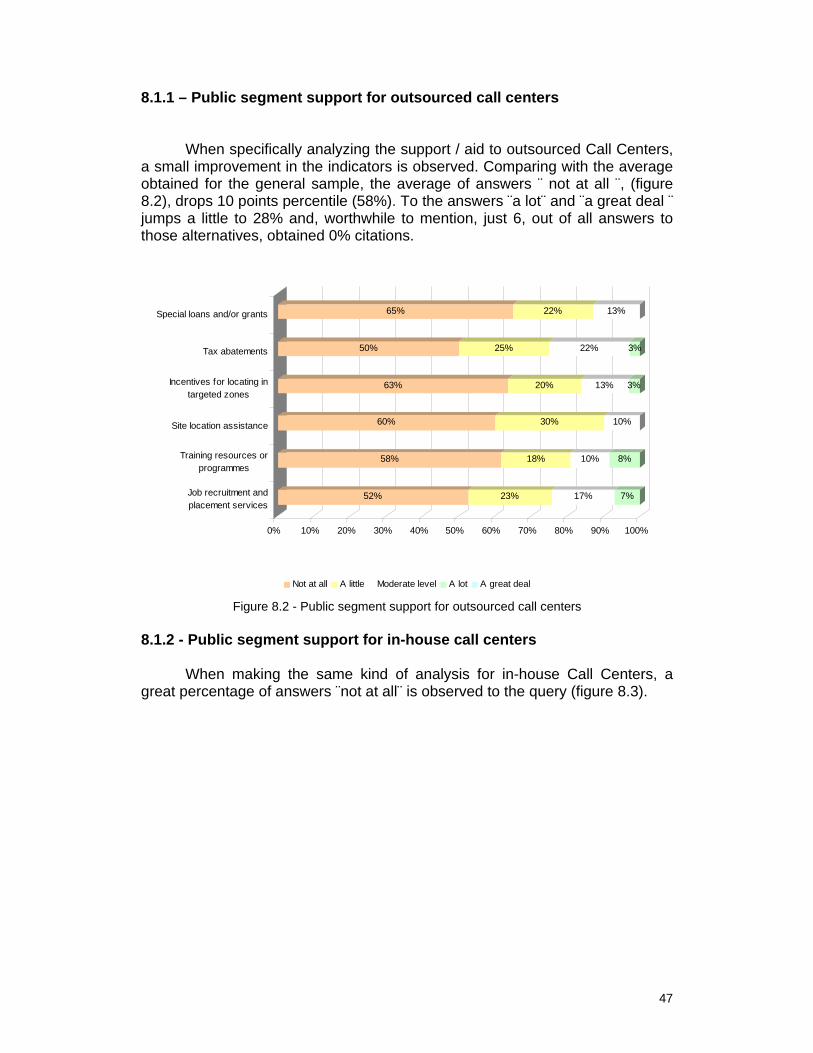
8.1.1 – Public segment support for outsourced call centers
When specifically analyzing the support / aid to outsourced Call Centers, a small improvement in the indicators is observed. Comparing with the average obtained for the general sample, the average of answers ¨ not at all ¨, (figure 8.2), drops 10 points percentile (58%). To the answers ¨a lot¨ and ¨a great deal ¨ jumps a little to 28% and, worthwhile to mention, just 6, out of all answers to those alternatives, obtained 0% citations.
52% 23% 17% 7%
58% 18% 10% 8%
60% 30% 10%
63% 20% 13% 3%
50% 25% 22% 3%
65% 22% 13%
0% 10% 20% 30% 40% 50% 60% 70% 80% 90% 100%
Job recruitment andplacement services
Training resources orprogrammes
Site location assistance
Incentives for locating intargeted zones
Tax abatements
Special loans and/or grants
Not at all A little Moderate level A lot A great deal
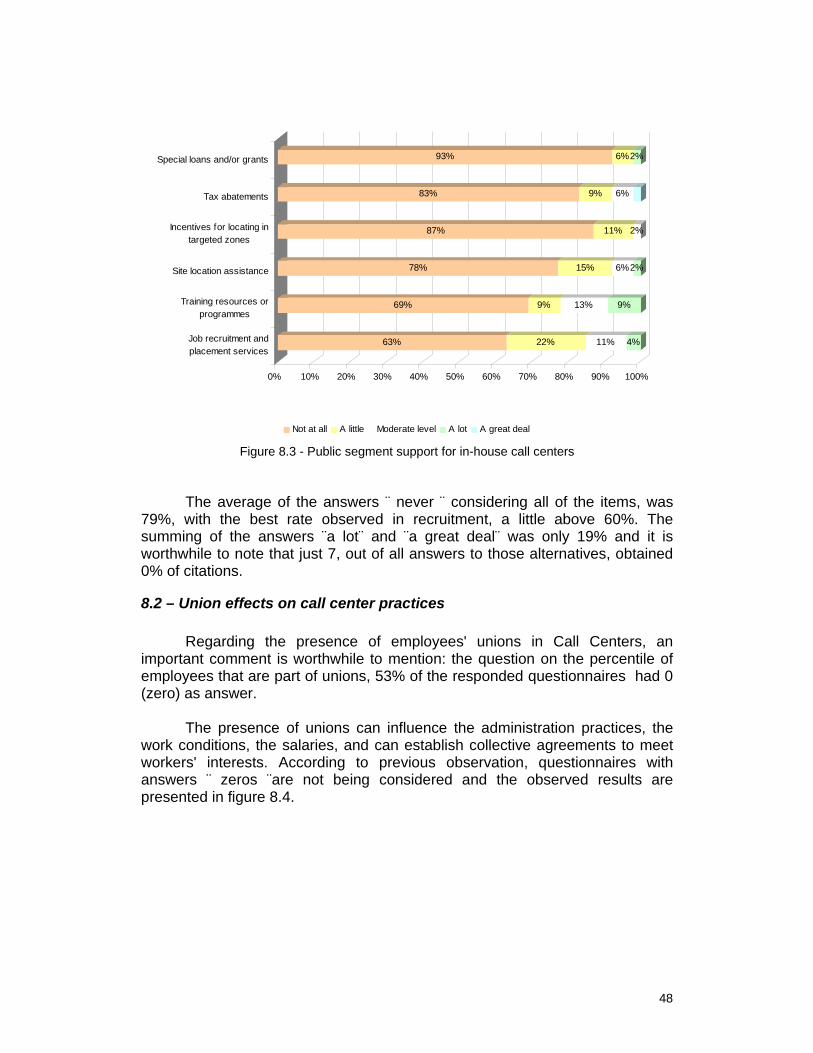
Figure 8.2 - Public segment support for outsourced call centers 8.1.2 - Public segment support for in-house call centers
When making the same kind of analysis for in-house Call Centers, a great percentage of answers ¨not at all¨ is observed to the query (figure 8.3).
48
63% 22% 11% 4%
69% 9% 13% 9%
78% 15% 6%2%
87% 11% 2%
83% 9% 6%
93% 6%2%
0% 10% 20% 30% 40% 50% 60% 70% 80% 90% 100%
Job recruitment andplacement services
Training resources orprogrammes
Site location assistance
Incentives for locating intargeted zones
Tax abatements
Special loans and/or grants
Not at all A little Moderate level A lot A great deal
Figure 8.3 - Public segment support for in-house call centers
The average of the answers ¨ never ¨ considering all of the items, was 79%, with the best rate observed in recruitment, a little above 60%. The summing of the answers ¨a lot¨ and ¨a great deal¨ was only 19% and it is worthwhile to note that just 7, out of all answers to those alternatives, obtained 0% of citations.
8.2 – Union effects on call center practices
Regarding the presence of employees' unions in Call Centers, an important comment is worthwhile to mention: the question on the percentile of employees that are part of unions, 53% of the responded questionnaires had 0 (zero) as answer.
The presence of unions can influence the administration practices, the
work conditions, the salaries, and can establish collective agreements to meet workers' interests. According to previous observation, questionnaires with answers ¨ zeros ¨are not being considered and the observed results are presented in figure 8.4.

49
50,4%
42,1%
62,9%
General average Sub-contractors In-houses
Figure 8.4 – Percentile of unionized employees
When answers ¨ zero ¨ are excluded, the general percentile is 50.4% of unionized employees and the relationship between “unionized at in-house” and “at outsourced” Call Centers becomes quite significant, a difference of 20 percentage points .

50
9 – Final considerations
The Call Center industry in Brazil had its development associated to the 1990´s, especially after the privatization of telecommunications segment, ocurred in 1997/1998. With the opening of the economy ,increase in competition and reduction of tariffs for installations, great international companies of the telephony segment and other national companies started a strong expansion in their activities in this segment. . In approximately ten years, the segment had a positive balance of about 600,000 jobs; however, as it was already noted, this data is not so precise; thus, it must be observed that future studies are desirable.
According tothe sample used in this survey, the segment´s business is developing in a very good pace. .The answers results showed that 64% declared that their sales have an increase of 58% on average in the last two years. Also 67% of the respondents intend to hire new employees during 2006. In addition, Information Technology (IT) seems to have permanently incorporated in the Call Center activities. . The new multimedia access through E-mail, the use of CRM and even the use of VoIP presents significant percentile, showing the state of the art of technological innovation in the segment.
The strategy used by Call Centers, as they are in the front line, close to consumers, concentrates in two factors: the Customer Loyalty and the Service Differentiation. This conclusion came to be a positive surprise,in relation to what was expected, a larger percentage of answers regarding the Price Leadership.
Human resources policies have contributed to the professionalization and training of the workforce. On the other hand they are not enough to reduce the high related turnover . Operators seeking more appropriate jobs to their profiles after receiving training and relatively low wages are other possible causes. tOn the other hand, the Call Center promotion rates (to higher job positions, external or internal) to other activities was significantly positive, unlikely to what is observed in other countries.
It is worthwhile to observe, as it was one of the main points for analysis, some work conditions observed in in-house and outsourced Call Centers.For example, it can be mentioned the rate of script use, 28% and 42%, respectively. Differences have also been observed in the permanence in the organization, annual remuneration of the operators and managers, percentile for individual performance, among others.
Finally, the Call Center industry shows a strong growth potential and is expected to stimulate greater governmental involvement for institutional regulation and to expand activities towards internationalization.
51
References ABT – Associação Brasileira de Telesserviços. 2005. Disponível em: http://www.abt.org.br/ Acesso em: 30.11.2005. ANATEL, Agência Nacional de Telecomunicações. Perspectivas para Ampliação e Modernização do Setor de Telecomunicações. 2005. Disponível em: http://www.anatel.gov.br/indicadores/default.asp Acesso em: 04/12/2005. BATESON, E. John e HOFFMAN, Douglas. Marketing de Serviços. Bookman, 1995, 1a. Edição. BATT, Rosemary; DOELLGAST, Virginia e KWON, Hyunji. The U.S. Call Center Industry 2004: National Benchmark Report. The Global Call Center Industry Project. Cornell University, 2004. CALL CENTER, Quadro Resumo das Empresas de Call Center. 2005. Disponível em: http://www.callcenter.inf.br/ranking/default.asp?sp=rankingquadroresumo.asp Acesso em: 04.12.2005. CGI.Br – Comitê Gestor da Internet no Brasil. CGI.br divulga indicadores inéditos sobre a internet no país. 24/11/2005. Disponível em: http://www.cgi.br/releases/2005/rl-2005-07.htm Acesso em: 09.12.2005. CLIENTE S.A. Setor está em crescimento. 24.11.2005. Disponível em: http://www.clientesa.com.br/Default.asp?sp=Materia_Integra.asp&codigo=8239&secao=3 Acesso em: 04.12.2005. DATAMONITOR. Opportunities in Caribbean and Latin American Call Center Markets to 2007: Are the opportunities worth the risks? 2003. GRÖNROOS, Christian. Defining Marketing: A Market-Oriented Approach. European Journal of Marketing: 2001. GRÖNROOS, Christian. Marketing: Gerenciamento e Serviços. Rio de Janeiro: Elsevier, 2004, 2ª. Reimpressão. HAX, Arnold C., WILDE II, Dean L. The delta project: discovering new sources of profitability in a networked economy. New York: Palgrave, 2001. HOLMAN, David; WOOD, Stephen e STRIDE, Chris. Human Resource Management in Call Centres. University of Shefield, 2005. IBGE – Instituto Brasileiro de Geografia e Estatística. Indicadores IBGE: Pesquisa mensal de emprego – agosto 2005. Disponível em: http://www.ibge.gov.br/ Acesso em: 14.11.2005.

52
_____________. PIB acumulou crescimento de 5,2% em 2004, a maior taxa desde 1994. março 2005. Disponível em: http://www.ibge.gov.br/home/presidencia/noticias/noticia_visualiza.php?id_noticia=321&id_pagina=1 Acesso em: 09.12.2005. LANCIANO-MORANDAT, Caroline; NOHARA, Hiroatsu e TCHOBANIAN, Robert. French Call Centre Industry Report 2004. Laboratoire d'Economie et de Sociologie du Travail (LEST), 2005. McKENNA, Regis. Marketing de Relacionamento. Rio de Janeiro: Campus, 1992. OLIVEIRA, M. do C. L. BARBOSA, B. T. Novas Tecnologias, Novos Padrões de Interação: Um Estudo Da Fala No Contexto De Um Call Center. Rio de Janeiro, PUC-Rio: Revista Palavra. 2002. PORTER, Michael E. Estratégia competitiva - Técnicas para análise de indústrias e da concorrência. São Paulo, Campus, 1986. PRAHALAD C.K and HAMEL G. (1990) The Core Competence of the Corporation. Harvard Business Review, 68 (3): 79-91. PROBARE - Programa Brasileiro de Auto-Regulamentação (Call Center/ Contact Center/ Help Desk / SAC / Telemarketing). 2005. Disponível em: http://www.probare.org/ Acesso em: 05.12.2005. SILVA, José R. G.; OLIVEIRA, Maria do C. L.; CONSTANTINO, Rafaello. ZALTZMAN, Cláudio. Operadores de Call Center: Inconsistências e Desafios da Gestão de Pessoas. Enanpad, 2002. SILVA, José R. G. Avaliação da Qualidade do Serviço Telefônico Privativo da Petrobrás Conforme percebido pelos usuários lotados no edifício da sede da empresa. Dissertação de mestrado. Rio de Janeiro: Departamento de Administração da PUC-Rio, 1997. STONE, Merlin e WOODCOCK, Neil. Marketing de Relacionamento. São Paulo: Littera Mundi. 2002.