brazilian market opportunities - b3 - ri...
TRANSCRIPT

December 2010

Forward Looking Statements
This presentation may contain certain statements that express the management’s expectations, beliefs and assumptions about future events or results. Such statements are not historical fact, being based on currently available competitive, financial and economic data, and on current projections about the industries BM&FBovespa works in.The verbs “anticipate,” “believe,” “estimate,” “expect,” “forecast,” “plan,” “predict,” “project,” “target” and other similarverbs are intended to identify these forward-looking statements, which involve risks and uncertainties that could cause actual results to differ materially from those projected in this presentation and do not guarantee any future BM&FBovespa performance.
The factors that might affect performance include, but are not limited to: (i) market acceptance of BM&FBOVESPA services; (ii) volatility related to (a) the Brazilian economy and securities markets and (b) the highly-competitive industries BM&FBovespa operates in; (iii) changes in (a) domestic and foreign legislation and taxation and (b) government policies related to the financial and securities markets; (iv) increasing competition from new entrants to the Brazilian markets; (v) ability to keep up with rapid changes in technological environment, including the implementation of enhanced functionality demanded by BM&FBovespa customers; (vi) ability to maintain an ongoing process for introducing competitive new products and services, while maintaining the competitiveness of existing ones; (vii) ability to attract new customers in domestic and foreign jurisdictions; (viii) ability to expand the offer of BM&FBovespa products in foreign jurisdictions.All forward-looking statements in this presentation are based on information and data available as of the date they were made, and BM&FBovespa undertakes no obligation to update them in light of new information or future development.This presentation does not constitute an offer to sell or the solicitation of an offer to buy any securities, nor shall there beany sale of securities where such offer or sale would be unlawful prior to registration or qualification under the securitieslaw. No offering shall be made except by means of a prospectus meeting the requirements of the Brazilian Securities Commission CVM Instruction 400 of 2003, as amended.
2
BRAZILIAN MARKET OPPORTUNITIES
3

Brazil represents a unique investment opportunity
New growth cycle and
investments in infra-structure
Pre-salt Oil Exploration
Development of Mortgage Market
Expansion of Middle Class
Entrepreneurial StimulusGreater Internal Demand
Rio Olympics 2016 and World Cup 2014
Increase in Income Levels
Interest Rate Decline
Brazil will have the 6th
highest world purchasing
power by 2013 (Price
Coopers) (1)
Brazilian per capita income will rise from US$7,900 to US$10,900
in 2011 (Bank of America
Merrill Lynch) (1)
(1) As of Jan/10.4

jan/05 jul/05 jan/06 jul/06 jan/07 jul/07 jan/08 jul/08 jan/09 jul/09 jan/10 jul/10
35-40%
35-40%
5-10%
US EUR BR
(1) Updated until Oct/2010;(2) HFT: High Frequency Trading - Source: Rosemblatt Securities Inc.; Source: WFE
Low penetration of equity and derivatives in the main investors’ portfolios
Stable and “low” interest rate environment would encourage exposure in securities
Recent growth in the number of retail investors, but still low compared to other markets
Low number of listed companies compared to other countries
Nov´10
644,055
128,615
66%
35%
5-10%
US EUR BR
Equities Futures
5
6,408
5,179
3,700 3,472 3,019 2,792
2,335 1,966 1,788
386
Índia USA Canada Spain China /HK London Japan Australia Korea Brazil
Brazilian Capital Markets: high growth potential
High Growth Potential Number of Custody Accounts(1)
HFT to Total Volume Traded(2) 2009 Listed Companies (28th in the World)

MAIN INITIATIVES TO INCREASE GROWTH
6

Brings the concept “quer ser sócio?” (wanna be a shareholder?) as a differential to attract new investors. The campaign will be released in mass medias
All the pieces will have a reference to the campaign web site www.quersersocio.com.br
Main Strategies to Attract Retail Investors2010 – launching of the campaign “Quer ser Sócio?”
New Campaign “Quer ser Sócio?”
Other Popularization and Education Initiatives
Launching of the on line (web) version of the DesafioBM&FBOVESPA
Launching of the Turma da Bolsa, a financial education web site for kids;
Beginning of the second season of the EducaçãoFinanceira program, with 42 episodes to be exhibited from March to December 2010
“ENEF” – printing and distribution of books for the schools which participate of the pilot project, and beginning of the development of the contents for school
“Fica Mais” – mileage and member get member program for investors
7
BOVESPA Segment: capital raising activity
Public Offerings (BRL billions)
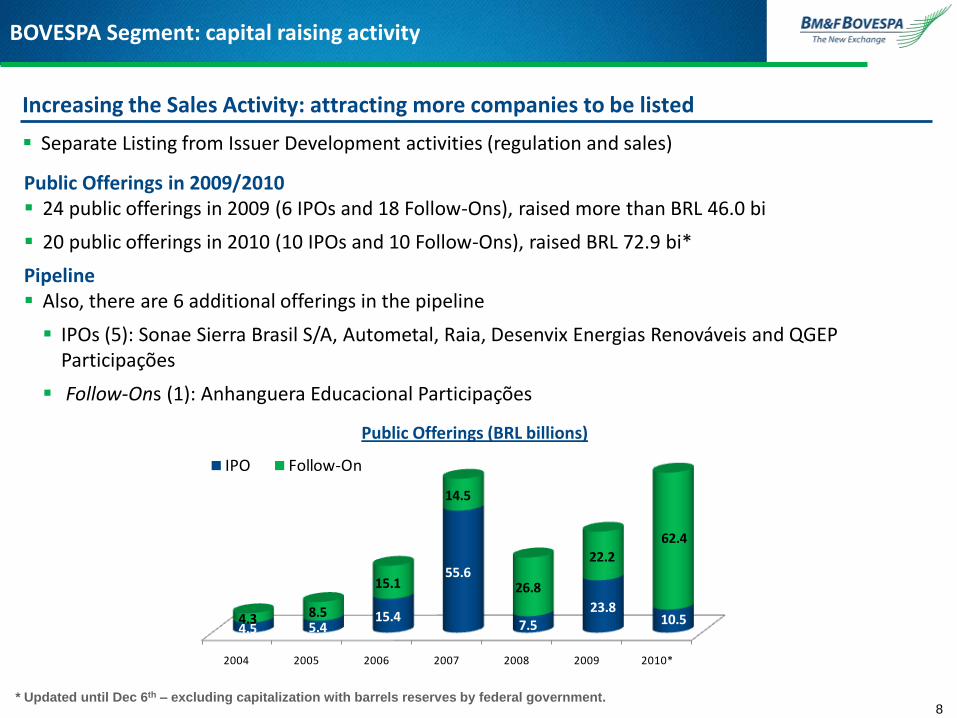
Public Offerings in 2009/2010 24 public offerings in 2009 (6 IPOs and 18 Follow-Ons), raised more than BRL 46.0 bi
20 public offerings in 2010 (10 IPOs and 10 Follow-Ons), raised BRL 72.9 bi*
Pipeline Also, there are 6 additional offerings in the pipeline
IPOs (5): Sonae Sierra Brasil S/A, Autometal, Raia, Desenvix Energias Renováveis and QGEP Participações
Follow-Ons (1): Anhanguera Educacional Participações
8
Increasing the Sales Activity: attracting more companies to be listed
Separate Listing from Issuer Development activities (regulation and sales)
* Updated until Dec 6th – excluding capitalization with barrels reserves by federal government.
2004 2005 2006 2007 2008 2009 2010*
4.5 5.4 15.4
55.6
7.5 23.8
10.5 4.3 8.5
15.1
14.5
26.8
22.2
62.4
IPO Follow-On

New Products Pipeline
9
Equity Order Book in Foreign Currencies
BM&FBOVESPA and Chi-X Global Term Sheet for joint development of software
Trading of stocks listed in Brazil with simultaneous FX execution - allows non residents to match stocks in US$ and other currencies
Legal requirements to invest in Brazil keep unchanged
ETFs – BRL million
New DevelopmentsCompany focus on becoming a global marketplace
Only 7 ETFs listed on the Exchange
Financial Index ETF to be launched in 4Q10
Other ETFs under development: Dividends, Utilities and IBRX-20
8.8 5.3
11.4
20.3 22.0 23.5 21.7
21.5
26.625.6
18.3 16.9
22.2
27.1
25.3
33.1
29.1
24.5 26.7 27.2
30.8 32.7 33.1
Jan-
09
Feb-
09
Mar
-09
Apr-
09
May
-09
Jun-
09
Jul-0
9
Aug-
09
Sep-
09
Oct
-09
Nov-
09
Dec-
09
Jan-
10
Feb-
10
Mar
-10
Apr-
10
May
-10
Jun-
10
Jul-1
0
Aug-
10
Sep-
10
Oct
-10
Nov-
10
Non-Sponsored BDR – Level 1
Deutsche Bank will be the first depository institution and will list 10 large cap stocks listed in the US (Start of trading in October 5, 2010)
Citibank was chosen to list 10 other large cap stocks (Start of trading in October 5, 2010)

Globally preferred strategic partners
Development of new multi-class trading platform
Reciprocal participation in CME and BVMF Board of Directors
Increase of BVMF stake in CME from 1.8% to 5.0%
Order routing
International market data distribution
Nasdaq OMX product licensing to Brazilian companies
High frequency international link and greater capability to support trading
Exploring global partnership initiatives
10
IT DEVELOPMENT, DMA EVOLUTION AND HIGH
FREQUENCY TRADING ACTIVITY
11

Excellence in IT Solutions and Post-Trading Services
12
Market Access Co-location
Capacity: phase II implemented in Jul’10; Bovespa Segment: launched in Sep’10
Market Data Distribution: Unified Market Data Feed - UMDF for both segments (by 4Q10)
EntryPoint: unified order entry interface for both segments (by 2Q11)
ISVs: Trading Technologies (TT) will provide screens for BM&F Segment in 1Q11
Brazil Easy Investing (partnership with Chi-X): order book in USD and other currencies
Trading Systems (Mega Bolsa and GTS)
New Trading System: project commenced in Feb’10
Schedule: Derivatives and cash FX (1Q11), Equities (1Q12) and Fixed income (2Q12)
Capacity Increasing
BOVESPA Segment: from 1.5 million to 3 million trades / day (by 4Q10)
BM&F Segment: from 200 thousand to 400 thousand trades / day (completed in the 3Q10)
Performance: improving performance in both systems (one digit latency by YE10)
Post-trading Developments
Data Center: rent of a facility for the new back up site and the construction of the main site
Clearing Integration: ongoing delivery of some integration basics and project planning for 2011 new clearing infrastructure
Sungard/GMI (back office for FCMs): to be implemented in 4Q10
IT DevelopmentsInitiatives to support future growth
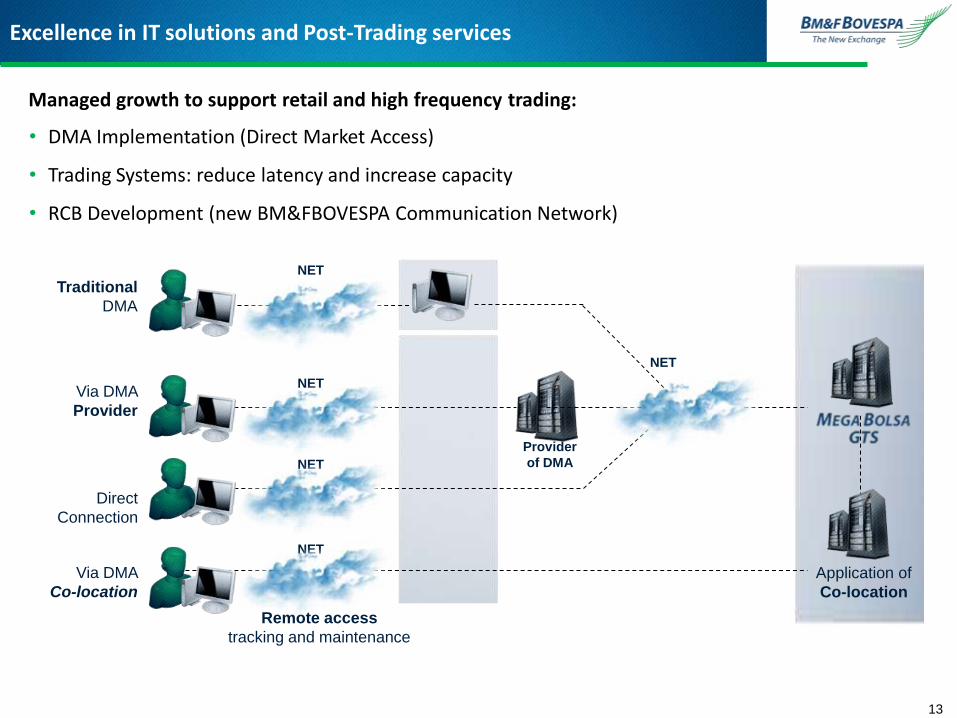
Managed growth to support retail and high frequency trading:
• DMA Implementation (Direct Market Access)
• Trading Systems: reduce latency and increase capacity
• RCB Development (new BM&FBOVESPA Communication Network)
Via DMA
Co-location
Traditional
DMA
Via DMA
Provider
Direct
Connection
NET
NET
NET
NET
Remote access
tracking and maintenance
Application of
Co-location
NET
Provider
of DMA
Excellence in IT solutions and Post-Trading services
13

* Updated until November 30, 201014
BM&F Segment: DMA Order Routing Evolution
DMA ADTV – in thousands of contracts
157 195 197 216327 380 337
451 416
276 367 353 290 350
551 4 30 71
129
156148
44
161 214
70 48 40
46 51
47
51
92
176223
240
279 204
189
254 262 204
270
317
203
13
21138
156
84 164
162
151 156 162
203
161
5.5%
7.5%
11.3%
14.4%
13.9%
17.6%
16.0%
16.0% 20.1%
16.9%
13.5% 16.6%
17.7%
20.4%
19.7%
0%
4%
8%
12%
16%
20%
-100
100
300
500
700
900
1100
1Q09 2Q09 3Q09 4Q09 1Q10 2Q10 3Q10 Apr-10 May-10 Jun-10 Jul-10 Aug-10 Sep-10 Oct-10 nov-10
Traditional DMA CME Globex DMA Provider CoLocation % of DMA in overall ADTV

New Products Pipeline
15
High Frequency Trading - HFTNew pricing policy (both segments)
Main Characteristics
Differentiated fees by tier only for day trades transactions executed by a registered HFT
A HFT Committee created to approve and monitor the HFTs
The new pricing policy is being implemented in two steps: Nov’10 and Jan’11 (consolidated volume executed in more than one broker)
Bovespa Segment
In the Bovespa Segment, different tiers were created for individuals and non-individuals HFT investors
IndividualsADTV tier (BRL millions) Trading Fee (%)Up to 4 (inclusive) 0.019From 4 to 12.5 (inclusive) 0.017
From 12.5 to 25 (inclusive) 0.014
From 25 to 50 (inclusive) 0.012Above 50 0.010
Non-individualsADTV tier (BRL millions) Trading Fee (%)
Up to 20 (inclusive) 0.019From 20 to 50 (inclusive) 0.017
From 50 to 250 (inclusive) 0.014
From 250 to 500 (inclusive) 0.012Above 500 0.010
BM&F Segment
In the BM&F Segment, the 70% flat discount was replaced by a volume tiered based discount, only for day trades

0 1 3 7 12 15 13 17 20 25
84
164 162 151 156 162
203
161
Jun-09 Jul-09 Aug-09 Sep-09 Oct-09 Nov-09 Dec-09 Jan-10 Feb-10 Mar-10 Apr-10 May-10 Jun-10 Jul-10 Aug-10 Sep-10 Oct-10 Nov-10
3.2%
1.4%
3.3% 3.2% 2.6% 4.1%
4.8%
2.9%
Seven active investors
22 active participants in Oct’10
16
BM&F Segment: High Frequency Trading (HFT)HFT is playing an important role in derivatives market
•Updated until: November 30h, 2010
HFT(ADTV in thousands of contracts and mkt. share)*
HFT(participation per group of contracts)
Co-location
BM&F Segment (thousands of contracts)
4 20 41 50 69
155 74 92 73 58 75 89
5 18
44 41
50
43 40
45 43 45 38
4 7
22 53
77
93
90 85 87 98 125 92
59
0.3%1.0%
2.8%
4.8%3.8%
6.0%
4.4% 4.0% 4.5% 5.7%6.4%
5.3%
-
100
200
300
400
500
1Q09 2Q09 3Q09 4Q09 1Q10 2Q10 3Q10 Jul-10 Aug-10 Sep-10 Oct-10 Nov-10
FX Equities Mini contracts Interest Rates % in Overall Volume
BM&F Segment: 28 units
Both Segments: 8 units
Pipeline: 40 units
10.3%
23.7%
60.7%
FX contracts Index-based contracts Mini contracts

Round Trip Time, in milliseconds 2007 2008 2009 2010e
Equity Market 450 300 10 One digit
Derivatives Market 70 25 10 One digit
Throughput in thousands of trades
Equity Market – Average Capacity 390 770 1,500 3,000
Daily Average 153 245 332 432
Market peaks 343 414 591 800
Derivatives Market – Average Capacity 55 200 200 400e
Daily Average 23 29 39 68
Market peaks 42 49 76 152
Network Carrier RCCF`s Sole Provider 8 Networks (RCB)
17
Improving IT Capacity and Performance

OPERATIONAL HIGHLIGHTS
18

Daily Average Number of Trades (Thousands)
Average Daily Traded Value - ADTV (BRL Billions)
Number of Custody Accounts (Thousands) Turnover Velocity** (12 months average)
**Relation of the trading value in the cash market and the market cap of the exchange*Updated until: November 30th, 2010 19
BOVESPA Segment: operational highlights
1.2 1.6
2.4
4.9 5.5 5.3 6.5 6.8 6.6 6.5 6.9 7.3
5.8 5.4 5.6 6.7
7.8
6.3
2.004 2.005 2.006 2.007 2.008 2.009 YTD* jan-10 fev-10 mar-10 abr-10 mai-10 jun-10 Jul-10 Aug-10 Sep-10 Oct-10 nov-10
54 62 87 153
245
332
431 424 409 393 405 489
399 395 408 448
511 463
2.004 2.005 2.006 2.007 2.008 2.009 YTD* jan-10 fev-10 mar-10 abr-10 mai-10 jun-10 Jul-10 Aug-10 Sep-10 Oct-10 nov-10
30.8% 29.4%36.8% 37.6% 38.7%
42.3%
56.4%63.2%
66.6%
64.4%
2001 2002 2003 2004 2005 2006 2007 2008 2009
508 540 551 559 548 543 538
576 581 580
661 645 644
1Q08 2Q08 3Q08 4Q08 1Q09 2Q09 3Q09 4Q09 1Q10 2Q10 3Q10 Oct´10 Nov´10

* For the overall market, it is the result of the annualized monthly value traded in the cash market on the average market capitalization. For VALE and PETR , it is the result of the annualized monthly number of shares traded in the Brazilian cash market on the average outstanding sharecount.
20
Market OverhangImpacts from the Petrobrás offering
Petro vs. Vale (Brazil trading)
Average Daily Number of Traded Shares (millions)
Average Daily Traded Value (BRL billions)
Overhang in the Market
Turnover Velocity* (%)
Price Level Evolution (Sep’09 = 100)
0.7
0.9 0.9
0.7
0.9 0.9 0.9
1.3
0.9 0.8 0.7
0.9 1.0
0,8 0.7 0.8 0.8
0.7 0.8 0.8
0.9 0.8 0.9
0.7
0.4
0.6
1.3 1.2
0,8
5.4
7.3
6.5 6.7
6.8 6.6
6.5
6.9 7.3
5.8 5.4 5.6
6.7
7.8
6,3
-
1,0
2,0
3,0
4,0
5,0
6,0
7,0
8,0
9,0
-
0,2
0,4
0,6
0,8
1,0
1,2
1,4
1,6
1,8
VALE PETR Overall Volume
19 22 20
16 20 21 19 21
29
21 20 17
20 20 16
21 21 21 18 22 24 25 24
29
22
15
21
47 45
29
VALE PETR
60
80
100
120
140
160
180
Petr3 Petr4 Vale3 Vale5 Ibovespa
0%
20%
40%
60%
80%
100%
120%
140%
160%
Total do Mercado Vale Petr

30.3.%
26.4%
13.3%
30.0%
Nov´10
Source: Bloomberg (in USD traded value of 35 companies with ADRs programs )
End of CPMF(Financial
Transaction Tax) Sarbanes-Oxley Act(SOX)
*Updated until 10/29/2010
43.3%
56.7%
Novo MercadoLaunching
21
Brazilian´s stock trading breakdown
2001 2002 2003 2004 2005 2006 2007 2008 2009 2010* TotalIPOs - 1 - 7 9 26 64 4 6 10 127 Follow ons 14 5 8 8 10 16 12 8 18 10 109 Total 14 6 8 15 19 42 76 12 24 20 236
Dual Listings - - - 2 1 1 - - 1 - 5
Public Offerings in Number of Companies
0%
10%
20%
30%
40%
50%
60%
70%
80%
90%
100%
19
96
19
97
19
98
19
99
20
00
20
01
20
02
20
03
20
04
20
05
20
06
20
07
20
08
20
09
Jan
-10
Feb
-10
Mar
-10
Ap
r-1
0
May
-10
Jun
-10
Jul-
10
Au
g-1
0
Sep
-10
Oct
-10
No
v-1
0
Other USA Venues - Brazilian ADRs NYSE - Brazilian ADRs BM&FBOVESPA - companies with ADRs BM&FBOVESPA (except companies with ADRs)

Average Daily Traded Volume - ADTV (thousands of contracts)
Rate per Contract - RPC (BRL)
*Updated until: November 30th, 201022
BM&F Segment: operational highlights
805852
1,167
1,740 1,573 1,521
2,468
1,9062,184
3,117 3,0542,479
2,063
2,8632,442
1,9802,138
2,738
422 501 711 988 789 843
1,633 1,135 1,255
2,270 2,171 1,483 1,278
2,121 1,669
1,193 1,267
1,988
110 168 266
473 535 447
548
525 642
603 611
670 530
477
479
489 540
467
86 74 68
112 88 80
90
78 106
75 96
106
96
75
97
80 104
79
187 109
124
167 162 150
192
168 181
170 176
220
159
189
197
218 228
202
jun-05 jun-05 jun-05 jun-05 jun-05 jul-05 YTD* jan-10 fev-10 mar-10 abr-10 mai-10 jun-10 Jul-10 Aug-10 Sep-10 Oct-10 nov-10
BRL Int. Rate (Thousands) FX (Thousands) Index (Thousands) Others (Thousands)
2004 2005 2006 2007 2008 2009 YTD* J-10 F-10 M-10 A-10 M-10 J-10 J-10 A-10 S-10 O-10 N-10
Interest rates in BRL 0.887 0.962 0.906 0.950 1.141 0.979 0.907 0.971 0.977 0.722 0.780 0.961 1.044 0.893 0.952 1.054 1.016 0.887
FX rates 4.002 2.858 2.244 1.859 2.065 2.161 1.919 1.968 2.005 1.837 1.872 1.752 1.908 1.983 1.954 2.030 1.926 1.975
Stock Indices 1.561 1.688 1.419 1.501 2.145 1.620 1.536 1.466 1.716 1.372 1.616 1.313 1.643 1.372 1.619 1.466 1.758 1.484
Interest rates in USD 1.999 1.385 1.094 0.965 1.283 1.357 1.150 1.104 1.319 1.239 1.203 1.145 1.137 1.086 1.072 1.071 1.103 1.230
Commodities 7.159 5.693 4.749 3.195 3.587 2.307 2.135 1.711 2.029 1.934 2.281 1.890 2.216 2.021 2.266 2.232 2.544 2.151
Mini contracts - 0.038 0.034 0.054 0.162 0.176 0.127 0.133 0.139 0.129 0.136 0.122 0.133 0.124 0.130 0.121 0.118 0.125
OTC 1.199 1.703 1.571 2.111 2.355 1.655 1.602 1.588 1.408 1.626 1.790 1.646 1.895 1.684 1.973 1.384 1.318 1.384
Total RPC 1.620 1.467 1.247 1.224 1.527 1.365 1.149 1.254 1.308 0.961 1.031 1.171 1.274 1.084 1.167 1.287 1.258 1.092

-
200
400
600
800
1.000
1.200
2007 2008 2009 2010 Jan-10 Feb-10 Mar-10 Apr-10 May-10 Jun-10 Jul-10 Aug-10 Sep-10 Oct-10 Nov-10
1st. Maturity 2nd. Maturity 3rd Maturity 4th. Maturity 5th Maturity
23
Interest Rate in BRL ContractsStructural changes behind the growth in volumes
Interest Rate in BRL Contracts Breakdown by Maturity (thousands of contracts)
Uncertainty in consensus
impacts short term contracts
Fixed Rate Credit – in BRL billions Public Debt / Fixed Rate - in BRL billions
Source: Brazilian Central Bank
0
100
200
300
400
500
600
700
Jan-07 May-07 Sep-07 Jan-08 May-08 Sep-08 Jan-09 May-09 Sep-09 Jan-10 May-10 Sep-10
0
100
200
300
400
500
600
700
Jan-07 May-07 Sep-07 Jan-08 May-08 Sep-08 Jan-09 May-09 Sep-09 Jan-10 May-10 Sep-10

* Brazilian Hedge Funds
* Others include: Asset backed securities, real estate, FX, off-shore and retirement funds
Source: Anbima
24
Brazilian Investment Funds IndustryRecent development
Investment Funds: Portfolio Breakdown (BRL billions)
Investment Funds: Multimarket and Equities Evolution (BRL billions)
55% 52%63% 54% 47% 48% 44% 45% 45% 44% 44%
28% 29%17%
23% 24% 23%24% 23% 23% 24% 24%
8% 8%8%
10%16%
10%
12% 11% 11% 11% 11%
10% 11%12%
13%14%
18%
21% 21% 21% 21% 21%
770 815 972
1,190
1,361 1,222
1,549 1,604 1,597 1,633 1,654
2003 2004 2005 2006 2007 2008 2009 Jul-10 Aug-10 Sep-10 Oct-10
Fixed Income Multimarkets Equities Others*
212 233
167
270 324
286
368 368 363 389 400
61 67 81 121
211
123
184 179 174 180 181
2003 2004 2005 2006 2007 2008 2009 Jul-10 Aug-10 Sep-10 Oct-10
Multimarkets Equities

BM&F Segment: open interest
Nov/10
41.5MM
Nov/10
34.1MM
25
Derivatives Open Interest (millions of contracts)
0,0
5,0
10,0
15,0
20,0
25,0
30,0
35,0
40,0
45,0
Jan-07 Apr-07 Jul-07 Oct-07 Jan-08 Apr-08 Jul-08 Oct-08 Jan-09 Apr-09 Jul-09 Oct-09 Jan-10 Apr-10 Jul-10 Oct-10
Interest Rates in BRL
Total Open Interest

BUSINESS MODEL
26
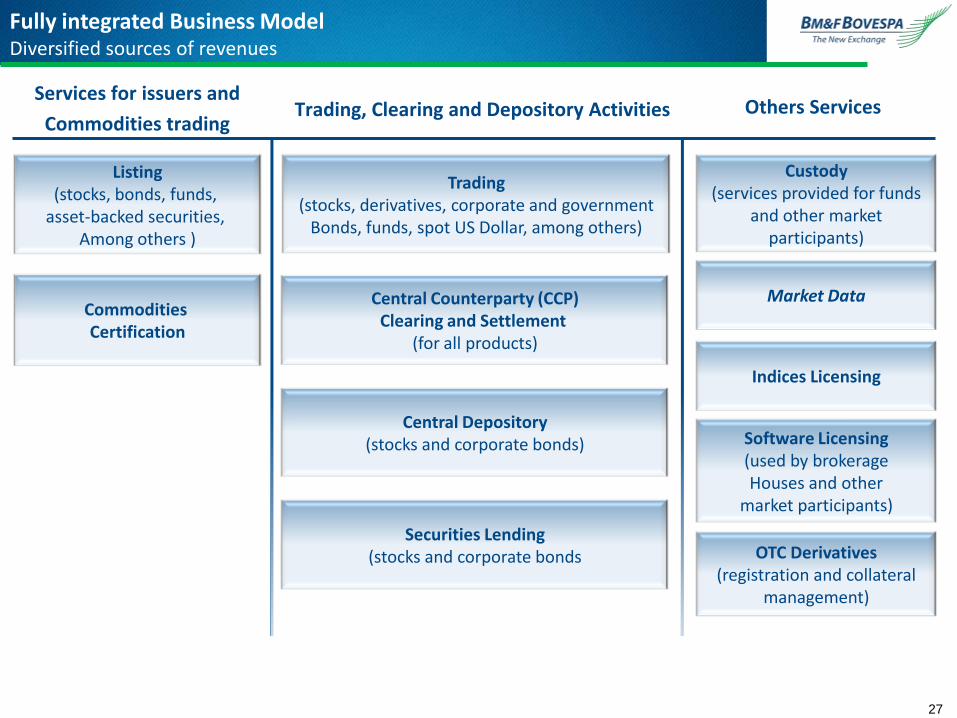
Listing(stocks, bonds, funds,
asset-backed securities, Among others )
Commodities Certification
Trading(stocks, derivatives, corporate and government
Bonds, funds, spot US Dollar, among others)
Central Counterparty (CCP)Clearing and Settlement
(for all products)
Central Depository(stocks and corporate bonds)
Securities Lending(stocks and corporate bonds
Custody(services provided for funds
and other marketparticipants)
Market Data
Indices Licensing
Software Licensing(used by brokerageHouses and other
market participants)
OTC Derivatives(registration and collateral
management)
Fully integrated Business ModelDiversified sources of revenues
Services for issuers and
Commodities tradingTrading, Clearing and Depository Activities Others Services
27

Brokers & investors
Trading
Pos-Trading
Business Model, regulation and competition
Regulation prohibits internalization of orders, dark pools and ATS/MTFs, stocks trading in both exchange and OTC simultaneously
Settlement and clearing of stocks trading must be done through a CCP
Settlement and clearing at the beneficial owner level make the Brazilian market safer and more resilient
Under the regulation in place, potential competitors would be obliged to provide the same integrated solution, with the same rules and transparency
The final investor pays the exchange fee
Other exchanges have been seeking integrated models (self clearing models)
Naked access is not allowed
Naked short selling is not possible
28

Updated until: 12/03/2010
Market Capitalization (US$ billions) and 2009 EBITDA Margin (%)
Listed Exchange Business Model
Diversified and Integrated Integrated Derivatives Diversified but Not Integrated*
* Do not provide post-trading services for the equity market
Diversified and integrated Derivatives Diversified but not integrated
Business Model
29
Source: Bloomberg
25.620.8
16.312.8
8.5 7.6 7.1 6.6 4.5 3.4 2.6 2.1
80.2%
71.3%64.9%
51.9%
62.7%
43.1%
60.8%
74.3%
48.7%
39.0%
56.7%
66.5%
0,0%
10,0%
20,0%
30,0%
40,0%
50,0%
60,0%
70,0%
80,0%
-
5
10
15
20
25
30
35
HKEx CME BVMF Deutsche Boerse
ICE Nyse Euronext
SGX ASX Nasdaq LSE TMX BME
EBITDA Margin 2009

28.6% 27.2%
36.3% 34.4%
11.5% 10.9%
23.7% 27.6%
Broker trading Fee Exchange Trading fee Exchange Clearing fee Exchange Depository fee
Brasil USA
Trading
Trading
Clearing
Central Counterparty (CCP)
Intermediary in the trading activity
Clearing
Securities Lending s activity
Counterparty risk on the Internalization of orders (1)
Intermediary in the trading activity
Central Depository
Securities Lending
Brokerage House
Stock Exchange
All-in Transaction Cost Comparison / Services Offered to
Investors
(1) Not allowed according to Brazilian regulation.Assumptions: 3 months holding period; Brazilian Investment fund trade; 1.5 Bp Broker Fee; and Securities lending not considered.
Total Cost5.3 bps
Exchange Cost3.8 bps
1.3 Bp
0.6 Bp
1.9 Bp
1.5 Bp Broker Cost1.5 bps
USD14.0 – Stock Price
All-in cost: USD0.008
USD28.0 – Stock Price
All-in cost: USD0.015
Fully integrated Business ModelCompetitive all-in cost
30

BRAZIL USA
BVMF
BVMF
BVMF
DTCC
DTCC
NYSE Nasdaq
BATS Direct Edge
TRF Dark Pools
Beneficial Owner Level
Broker Level
All the trades must be
matched on an exchange
environment
Brokers can internalizeorders
Central Depository
Clearing (CCP)
Trading on the Exchange
Broker
Equity market settlement structure: Brazil compared with USA
31
32
Appendix

Source: Rosenblatt Securities Inc. – Trading Talk
33
USA Consolidated Equities Volume Breakdown (Oct’10)
US Exchanges and Trading Venues: market share
19.4%
27.4%
18.2%
13.5%
8.9%
10.2%
2.4%Nasdaq + BX
NYSE + Arca
TRF (Adjusted)
Dark Pools
BATS
EDGX + EDGA
Other
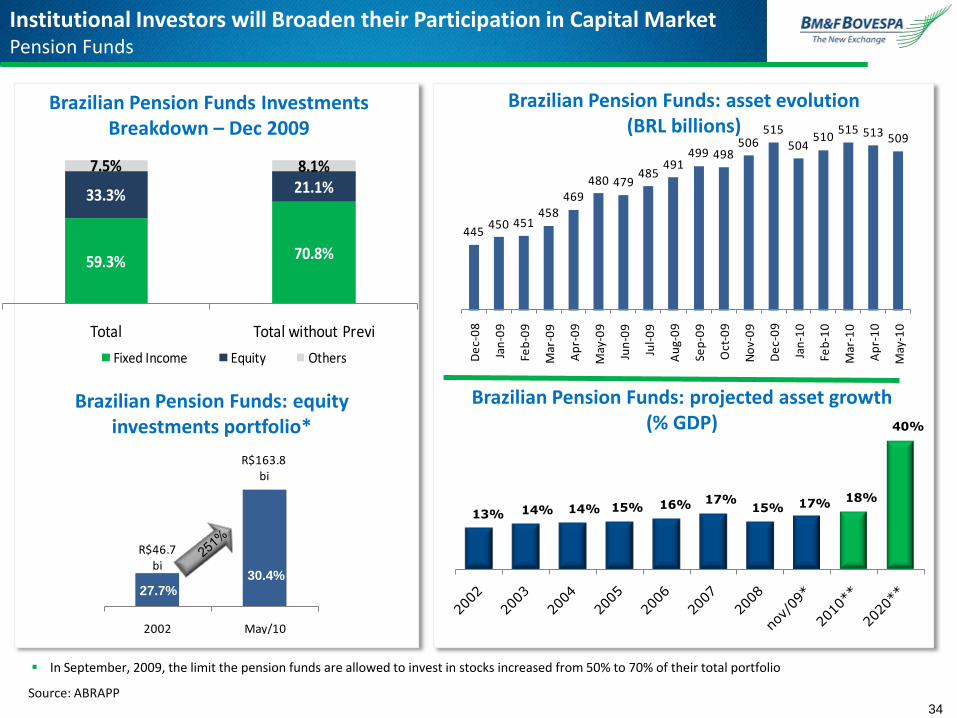
R$46.7bi
R$163.8bi
2002 May/10
13% 14% 14% 15% 16% 17%15% 17% 18%
40%
Brazilian Pension Funds: projected asset growth(% GDP)
Brazilian Pension Funds: asset evolution(BRL billions)
Brazilian Pension Funds: equity investments portfolio*
27.7%30.4%
Source: ABRAPP
59.3% 70.8%
33.3% 21.1%7.5% 8.1%
Total Total without Previ
Fixed Income Equity Others
Brazilian Pension Funds InvestmentsBreakdown – Dec 2009
In September, 2009, the limit the pension funds are allowed to invest in stocks increased from 50% to 70% of their total portfolio
34
Institutional Investors will Broaden their Participation in Capital MarketPension Funds
445450 451
458469
480 479485
491499 498
506515
504510
515 513 509
De
c-0
8
Jan
-09
Feb
-09
Mar
-09
Ap
r-0
9
May
-09
Jun
-09
Jul-
09
Au
g-0
9
Sep
-09
Oct
-09
No
v-0
9
De
c-0
9
Jan
-10
Feb
-10
Mar
-10
Ap
r-1
0
May
-10

On Line Trading
Performance of BOVESPA Segment – Individual investors
35
Nov´1015.8%
Nov´1027.1%
0%
5%
10%
15%
20%
25%
30%
35%
Jan-03 Aug-03 Mar-04 Oct-04 May-05 Dec-05 Jul-06 Feb-07 Sep-07 Apr-08 Nov-08 Jun-09 Jan-10 Aug-10
% traded value % number of trades

*Includes regular trades and public offering; updated until November 30th, 2010.
Monthly Net Flow of Foreign Investments* (in BRL billions)
BOVESPA Segment: foreign investment flow
36
-1.0
0.9
-0.6
6.0
2.9
-2.8
-7.3
5.3
-1.8
-4.7
-1.2-0.4-0.6
0.51.4
5.7 6.1
4.2
5.5
2.5
5.2
9.1
2.11.4
-2.1
0.7
5.8
1.5
-1.5
-0.1
7.3
-0.6
10.0
4.4
2.1

BM&F Segment (Investor’s Participation in Total Volume)
Bovespa Segment (Investor’s Participation in Total Value)
Operational highlights: investor s participation in Total Volume
37
25% 25% 23% 27% 31% 31% 32% 31% 25% 27% 26% 28% 27% 24% 23% 24%
27% 27% 30% 27% 26% 29% 29% 30% 35% 34% 35% 36% 35% 35% 32% 32%
33% 36% 35% 35% 34% 28% 28% 27% 28% 30% 28% 28% 28% 31% 33% 35%
12% 10% 10% 8% 7% 9% 9% 9% 9% 7% 8% 7% 8% 7% 9% 8%2% 2% 2% 3% 2% 2% 2% 2% 2% 2% 2% 2% 2% 2% 3% 2%
2005 2006 2007 2008 2009 Jan-10 Feb-10 Mar-10 Apr-10 May-10 Jun-10 Jul-10 Aug-10 Sep-10 Oct-10 Nov-10
Individuals Institutional Investors Foreign Investors Financial Insitutions Companies Others
56% 51% 49% 48% 45% 43% 43% 42% 44% 43% 40% 41% 42% 44% 40% 39%
24%25%
23% 23% 24% 27% 26% 30% 26% 25% 29% 32% 29% 28% 31% 34%
12% 15% 17% 19% 20% 22% 23% 22% 24% 26% 25% 22% 23% 22% 22% 22%
7% 7% 9% 8% 8% 5% 5% 3% 4% 4% 4% 3% 4% 4% 4% 4%
2% 2% 2% 3% 3% 2% 3% 2% 2% 2% 1% 1% 1% 2% 2% 2%
2005 2006 2007 2008 2009 Jan-10 Feb-10 Mar-10 Apr-10 May-10 Jun-10 Jul-10 Aug-10 Sep-10 Oct-10 Nov-10
Central Bank Companies Individuals Foreign Investors Institutional Investors Financial Institutions

Income Statement
38
(in thousands of BRL) 3Q10 3Q09Change
3Q10/3Q092Q10
Change
3Q10/2Q109M10 9M09
Change
9M10/9M09
Operational Revenues 541.609 426.505 27,0% 526.986 2,8% 1.579.255 1.199.004 31,7%
Trading / Clearing Systems - BM&F 186.802 132.017 41,5% 184.139 1,4% 541.154 403.930 34,0%
Trading / Clearing Systems-Bovespa 274.812 219.019 25,5% 259.309 6,0% 790.615 575.534 37,4%
Other Operational Revenues 79.995 75.469 6,0% 83.538 -4,2% 247.486 219.540 12,7%
Revenue deductions (54.743) (43.510) 25,8% (53.365) 2,6% (159.640) (121.219) 31,7%
Net Operational Revenues 486.866 382.995 27,1% 473.621 2,8% 1.419.615 1.077.785 31,7%
Operating Expenses (167.561) (132.502) 26,5% (143.494) 16,8% (444.839) (409.460) 8,6%
Operating Income 319.305 250.493 27,5% 330.127 -3,3% 974.776 668.325 45,9%
Equity account 23.142 - - - - 23.142 - -
Financial Income 77.407 57.042 35,7% 77.546 -0,2% 222.649 179.758 23,9%
Income before Taxes 419.854 307.535 36,5% 407.673 3,0% 1.220.567 848.083 43,9%
Net Income 293.208 246.795 18,8% 307.614 -4,7% 882.643 661.949 33,3%
Net Margin 60,2% 64,4% -4.2 pp 64,9% -4.7 pp 62,2% 61,4% 0.8 pp
EBITDA 336.375 262.039 28,4% 341.671 -1,5% 1.012.672 698.709 44,9%
EBITDA Margin 69,1% 68,4% 0.7 pp 72,1% -3.1 pp 71,3% 64,8% 6.5 pp
Adjusted Net Income 389.205 338.377 15,0% 426.272 -8,7% 1.217.945 909.523 33,9%
Adjusted net Margin 79,9% 88,4% -8.4 pp 90,0% -10.1 pp 85,8% 84,4% 1.4 pp
Adjusted Operational Expenses (145.846) (108.062) 35,0% (124.418) 17,2% (384.846) (313.006) 23,0%

Revenues Growth due to the market recovery
In BRL thousands 3Q10 3Q09% Change
3Q10/ 3Q09
Gross operating revenues 541,609 426,505 27.0%
BOVESPA Trd. / Sttmnt 232,890 210.117 10.8%
BOVESPA – Others* 41,922 8,902 370.9%
BM&F Trd. / Sttmnt 186,802 132,017 41.5%
Other operating revenues 79,995 75,469 6.0%
Depository and custody 21,447 17,235 24.4%
Vendors 15,352 16,082 -4.5%
Trading access (Brokers) 11,317 11,491 -1.5%
Listing 10,928 9,562 14.3%
Securities lending 12,714 8,866 43.4%
Bolsa Brasileira de Mercadorias 1,762 3,535 -50.2%
Settlement Bank 2,117 2,194 -3.5%
Other 4,358 6,504 -33.0%
Operating performance 3Q10 3Q09% Change
3Q10/3Q09
BM&F ADTV (thousands) 2,428.1 1,422.3 70.7%
BM&F RPC (in BRL) 1.167 1.391 -16.1%
BOVESPA ADTV (in BRL million) 5,905.8 5,214.4 13.3%
BOVESPA Margin (in bps) 6.162 6.296 -0.134bp
39
Bovespa segment revenues
BM&F segment revenues
Other revenues
219.0
274.8
3Q09 3Q10
132.0
186.8
3Q09 3Q10
75.5 80.0
3Q09 3Q10
25.5%
41.5%
6.0%
* It includes the fee from the settlement of the Petrobras Offering

13.3%
-0.13bp
BOVESPA SegmentStrong market recovery in the last two months
40
Revenue share Average Daily Traded Value (ADTV)
Average market capitalization 18.0% higher than 3Q09
52.7% growth in the ADTV of local institutional investors
Turnover velocity decreased to 59.2% in 3Q10 from 62.6% in 3Q09
(it was 71% in Oct´10 )
Trading / Settlement margin
Decrease to 6.16bps from 6.30bps, due mainly to the increase in
the participation of local institutional investors in the overall volume,
once this group of investors pay a lower fee in comparison with
other investors
Recent recovery in the equity market – ADTV (BRL billions)
51%
-11.6%
13.3%
31.7%
5.2 6.8 6.6 6.7 5.9 5.4 5.6
6.7 7.8
3Q09 4Q09 1Q10 2Q10 3Q10 Jul-10 Aug-10 Sep-10 Oct-10

1.7 1.6 1.5
2.4
1.4 1.3 1.7 1.6 1.5
1.9 1.4 1.4 1.5 1.7
1.4 1.6 1.9
2.2
3.1 3.1 2.5
2.1
2.9 2.4
2.0 2.1 0.3
2007
2008
2009
YTD
*
Jan-0
9
Feb
-09
Mar-0
9
Ap
r-09
May-0
9
Jun-0
9
Jul-0
9
Aug
-09
Sep
-09
Oct-0
9
No
v-0
9
Dec-0
9
Jan-1
0
Feb
-10
Mar-1
0
Ap
r-10
May-1
0
Jun-1
0
Jul-1
0
Aug
-10
Sep
-10
Oct-1
0
Additional ADTV from outlier months - Mar'10, Apr'10 and Jul'10 (millions)
ADTV excluding outlier months (millions)
2.1
70.7%
BM&F SegmentDespite the reduction of uncertainty in the market, volumes are still high
41
Revenue share Average Daily Traded Volume – ADTV
Climb in interest rates in BRL volumes (119.8% growth)
4.0% increase of FX volume and 21.2% increase of index based
contracts
Average Revenue per Contract - RPC
Increase in the participation of interest rates in BRL contracts in the
overall volume, to 68.4% from 53.1%
Negative impact due to FX appreciation (FX, interest rates in USD
and commodities contracts)
The higher the volume, the lower the RPC (volume tier based pricing)
Growth of HFT and DMA in the overall volume
Structural growth in the derivatives market (ADTV in millions of contracts)
34%
-16.1%
* Updated until October 2010

3Q10
In BRL thousands 3Q10 3Q09% Change
3Q10/ 3Q09
Operating Expenses (167,561) (132,502) 26.5%
Personnel (71,687) (63,883) 12.2%
Data processing (27,400) (24,233) 13.1%
Deprec. and amortization (15,067) (11,546) 30.5%
Outsourced services (12,293) (9,370) 31.2%
Communication (6,622) (6,219) 6.5%
Marketing (15,772) (5,841) 170.0%
Maintenance (2,529) (2,750) -8.0%
Board compensation (1,507) (1,184) 27.3%
Other (14,684) (7,476) 96.4%
3Q09
42
In BRL thousands 3Q10 3Q09% Change
3Q10/3Q09
Operating expenses (167,561) (132,502) 26.5%
Depreciation 15,067 11,546
Stock option plans 5,489 11,937
Tax related to equity accounting 2,003 -
Provision for doubtful accounts (845) 957
Adjusted operating expenses (145,846) (108,062) 35.0%
Operating Expenses Breakdown
Expense breakdown
43%
16%9%
7%
10%
15%
Personnel Data processing
Dep. and Amort. Third party serv.
Marketing Other
48%
18%
9%
7%
5%
13%
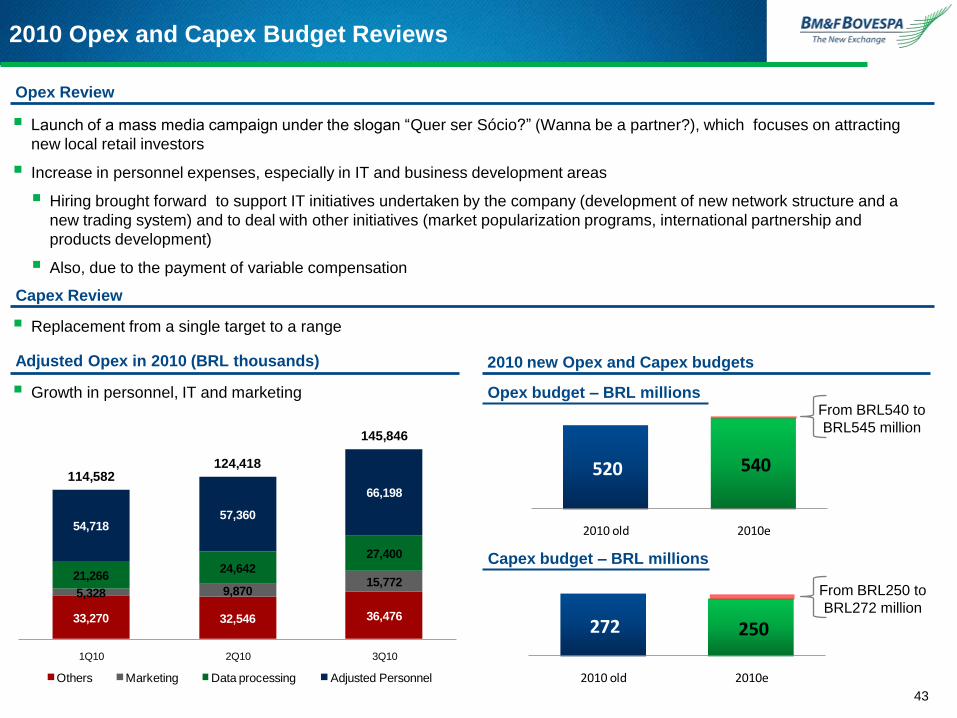
520 540
2010 old 2010e
272 250
2010 old 2010e
2010 Opex and Capex Budget Reviews
Adjusted Opex in 2010 (BRL thousands)
43
Opex Review
Launch of a mass media campaign under the slogan “Quer ser Sócio?” (Wanna be a partner?), which focuses on attracting
new local retail investors
Increase in personnel expenses, especially in IT and business development areas
Hiring brought forward to support IT initiatives undertaken by the company (development of new network structure and a
new trading system) and to deal with other initiatives (market popularization programs, international partnership and
products development)
Also, due to the payment of variable compensation
2010 new Opex and Capex budgets
From BRL540 to
BRL545 million
33,270 32,546 36,476
5,328 9,870 15,772
21,266 24,642
27,400
54,718 57,360
66,198
1Q10 2Q10 3Q10
Others Marketing Data processing Adjusted Personnel
124,418
145,846
114,582
Growth in personnel, IT and marketing
Capex Review
Replacement from a single target to a range
From BRL250 to
BRL272 million
Opex budget – BRL millions
Capex budget – BRL millions

BRL44.1 million in 3Q10: BRL36.2 million in IT and BRL7.9
million in other areas. The main projects were capacity increase
and the new trading platform
9M10: BRL138.1 million
3,659
3,688
•*Includes market participants cash collateral, earnings and rights on securities in custody and dividends and interest on capital pending payment
•** Includes third-party deposits (BRL175 million in 2Q10 and BRL142 million in 3Q10) and restricted funds (BRL10 million in both 2Q10 and 3Q10) from BM&F
Settlement Bank.
Financial HighlightsSolid financial position with strong cash generation
44
Cash, cash equivalents and investments (BRL millions) Financial income
BRL77.4 million in 3Q10: 35.7% higher than 3Q09
Financial revenues: BRL100.6 million in 3Q10, 52.7%
increase compared to 3Q09, mainly due to the increase of the
average interest rate
Financial expenses: BRL23.2 million in 3Q10, 162.4% higher
than 3Q09, mainly due to the financial cost of debt
Capex
From Aug’10 to Nov’10, 26.4 million shares were bought within
the program (BRL362 million)
The company can buy up to 31 million shares until Dec’10
Buyback program
BRL235.9 million as dividends, representing 80% of the GAAP
Net income in 3Q10
To be paid on November 25, 2010, based on the ownership
prevailing as of November 11, 2010
Earnings distribution (payout)
939
1,022
487
491
309
264
1,924
1,911
2Q10
3Q10
Market participants cash collateral and others*
Restricted funds
Subsidiaries**
Available funds

In BRL thousands
ASSETS Sep’ 10 Dec’09LIABILITIES AND
SHAREHOLDERS' EQUITYSep'10 Dec’09
Current assets 3,143,141 3,474,540 Current liabilities 1,422,836 1,142,076
Cash and cash equivalents 42,890 50,779 Collateral for transactions 984,766 810,317
Financial investments 2,917,792 3,295,356 Others 438,070 331,759
Others 182,459 128,405 Non-current liabilities 1,698,725 352,872
Non-current assets 19,217,204 17,383,299 Financing 1,027,188 2,495
Long-term receivables 1,099,771 973,305 Deferred Inc. Tax and Social Contrib. 616,448 300,930
Financial investments 727,517 605,648 Others 55,089 49,447
Others 372,254 367,657 Minority interest in subsidiaries 15,905 16,356
Investments 1,643,962 39,723
Shareholders' equity 19,238,784 19,362,891
Property and equipment 287,869 241,939 Capital 2,540,239 2,540,239
Capital reserve 16,533,760 16,512,260
Intangible assets 16,185,602 16,128,332 Others 148,880 294,036
TOTAL ASSETS 22,360,345 20,857,839 TOTAL LIAB. AND SHAREHOLDERS'
EQUITY22,360,345 20,857,839
Balance Sheet
45
