brazil's role in global food security and trade · brazil's role in global food security...
TRANSCRIPT

Food Security and Trade in the
Asia-Pacific & LAC Region
Brazil's Role in
Global Food Security and Trade
Marcos S. Jank Agribusiness and bioenergy leading expert
Former CEO of the Brazilian Sugarcane Industry Association (UNICA)
IPC Member
Washington DC,
May 17th, 2012

A CHALLENGING SCENARIO
World population to reach 9.3 billion people by 2050 and
consumption to double due to increase in income per capita.
• Middle class consumers to increase by 3 billion people by 2030.
177% increase in commodity prices since the turn of the
century (adjusted for inflation).
Minerals and oil scarcity – 100% increase in the average cost
of bringing a new oil well online over the past decade.
Agricultural sector to produce food and inputs for textiles,
bioenergy and biochemicals in a sustainable way.
Sources: Mckinsey “Resource revolution: meeting the world´s energy, materials, food, and water needs”, 2011. United Nations
Population Fund (2011)

EVOLUTION OF THE WORLD POPULATION
0,0
1,0
2,0
3,0
4,0
5,0
6,0
7,0
1970 1980 1990 2000 2010 2020 2030 2040 2050
Bill
ion
pe
op
le
Source: FAO.
Urban
Rural

SHARE OF URBAN POPULATION
IN TOTAL POPULATION
0%
10%
20%
30%
40%
50%
60%
70%
80%
90%
100%
1970 1980 1990 2000 2010 2020 2030 2040 2050
Africa
Asia
Oceania
Europe
South America North America
Source: FAO.

2000
2400
2800
3200
3600
1999/01 2015 2030 2050
PER CAPITA FOOD CONSUMPTION (kcal/person/day)
Eastern Asia
Southern Asia
Developed countries Transition
economies
Latin America
Sub-Saharan Africa
Middle East &
North Africa
Source: FAO (2006).
Note: Latin America includes the Carribbean. Transition economies include Eastern Europe and the countries of the CIS.
Over the next 40 years, we need to produce as much food as we did in the last 8,000 years!

Coal
Oil
Natural Gas
Hydro Nuclear
Other
Modern
BiomassBiomass
(firewood)
0
10
20
30
40
50
60
70
80
90
100
1850 1900 1950 2000 2050 2100
Solar
21ST CENTURY: BEGINNING OF A NEW ERA
Sources: Nakícenovic, Grübler and MacDonald, 1998
%
We are here
ENERGY SOURCES NEED TO DIVERSIFY

POTENTIAL LAND AND WATER AVAILABILITY
Note: Land – suitable non-cropped, non-protected (including pastures). Water – Total Renewable Water Sources.
Sources: Fischer and Shah (2010), cited in World Bank, 2010 (Rising Global Interest in Farmland: Can it Yield Sustainable and Equitable Benefits?),
ICONE, FAO.
0
1000
2000
3000
4000
5000
6000
7000
8000
9000
0
50
100
150
200
250
Wat
er:
Tri
llio
n m
3/y
ear
Lan
d:
Mill
ion
he
ctar
es
Land Water

IMPACT OF CHINESE INCREASING PER
CAPITA CONSUMPTION ON DEMAND
Notes: exports in carcass weight equivalent.
Scenario: Increase in China’s demand was considered to be met fully by imports; for Brazil exports, highest share in world
exports in the last three years was considered.
Source: USDA, FAO. Elaboration: ICONE.
Product
Current Per Capita
Consumption (kg)
Impact of a Chinese 1 kg per
capita consumption increase
on exports
China Brazil World Brazil
Beef 3.2 26.4 17% 51%
Poultry Meat 11.0 42.0 15% 21%
Sugar 12.3 68.9 2% 5%

0
20
40
60
80
100
120
140
160
US$
Bill
ion
Source: WTO
Elaboration: ICONE
MAIN EXPORTERS OF AGRI-FOOD PRODUCTS
(2010)
6.2%
7.7%
14.3%
15.5%
17.1%
11.8% 3.9%
11.3% 11.2%
5.1% 15.7% 11.4% 10.5% 8.0% 10.1%
Annual Growth Rates 2000-2010

BRAZILIAN AGRI-FOOD EXPORTS DYNAMISM
Sources: AGROSTAT/Ministry of Agriculture, ITC, COMTRADE. Elaboration: ICONE
0
2
4
6
8
10
12
14
16
18
20
US$
bill
ion
s
Average 1999-2001
Average 2009/2011
Soybean
Sugar/ Ethanol
Chicken Meat
Coffee Bovine Meat
Orange Juice
Tobacco Pork Meat
Maize Cocoa Cotton
Ranking 2nd 1st 1st 1st 1st 1st 1st 3rd 4th 8th 3rd
Share World 35% 46% 36% 33% 17% 77% 27% 8% 9.5% 4% 10%

0
10
20
30
40
50
60
2000 2001 2002 2003 2004 2005 2006 2007 2008 2009 2010 2011
BRAZILIAN AGRICULTURE EXPORTS:
THE IMPORTANCE OF DEVELOPING COUNTRIES
Source: Agrostat/MAPA. Elaboration: ICONE.
US
$ B
illio
n
Developed Countries
(CAGR 10%)
Developing countries
(CAGR 21%)

BRAZILIAN AGRICULTURE EXPORTS
BY DESTINATION
ASIA (incl. China) = 14% ASIA (incl. China) = 52%
Source: AGROSTAT/Ministry of Agriculture
25%
28% 24%
23%
2011
59%
11%
3%
27%
2000
EU+USA
Asia (Excluding China)
China
Rest of the World

PROFILE OF BRAZILIAN AGRICULTURAL
EXPORTS TO ASIA
0 2.000 4.000 6.000 8.000 10.000 12.000 14.000 16.000
Soybean complex
Meats
Sugarcane complex
Forest products
Fibers and textile products
Coffee
Leathers and derived products
Cereals, flours and preparations
Tobacco and products
Juices
Others
US$ Millions
2000 2011
Source: Agrostat. Elaboration: ICONE

CHANGES IN THE FOOD COMMODITY
COMPOSITION IN SOUTH ASIA
Sources: FAO, World Agriculture: Towards 2030/2050
0
50
100
150
200
250
300
350
400
450
500
1969/71 1979/81 1989/91 1999/01 2030 2050
19
69
/71
= 1
00
Vegetable oils, oilseeds
Meat
Milk and dairy
Roots and tubers
Sugar
Cereals, food
Pulses

3,63 3,28
3,09 2,83
2,59
2,03 1,8 1,7
0,87
0,33
-0,53 -1,0
0,0
1,0
2,0
3,0
4,0
Bra
zil
Form
er
Sovi
et
Un
ion
Sou
th A
fric
a
Ch
ina
Sou
the
ast
Asi
a
Arg
, Ch
ile, P
ar, U
ru
Asi
a, d
eve
lop
ed
Sou
th A
sia
Euro
pe
U.S
.A &
Can
ada
Au
stra
lia
AGRICULTURAL PRODUCTIVITY (TFP) GROWTH (2000 to 2008, average annual % over period)
Source: Alston, J,M,, B,A, Babcock, and P,G, Pardey eds (2010), The Shifting Patterns of Agricultural Productivity Worldwide, CARD-MATRIC Electronic Book, Center for Agricultural and Rural Development, The Midwest Agribusiness Trade Research and Information Center, Iowa State University, Ames, Iowa, Available at: www,matric,iastate,edu/shifting_patterns
TFP (Total Factors Productivity): represents resource efficiency on labor, capital and land.

LAND USE IN BRAZIL
In 2050, Brazil will account for 2.4% of the world population, Asia will account for more
than 50%
Native vegetation: 554 Mn ha (66% of total area)
Pastures: 198 Mha (23%)
Crops: 60 Mha (7%) Annual crops
Sources: Land use - INPE/Terra Class, MMA, Embrapa, PAM 2010, Censo 2006, Sparovek et. al (2011) e ICONE. Population - FAO.
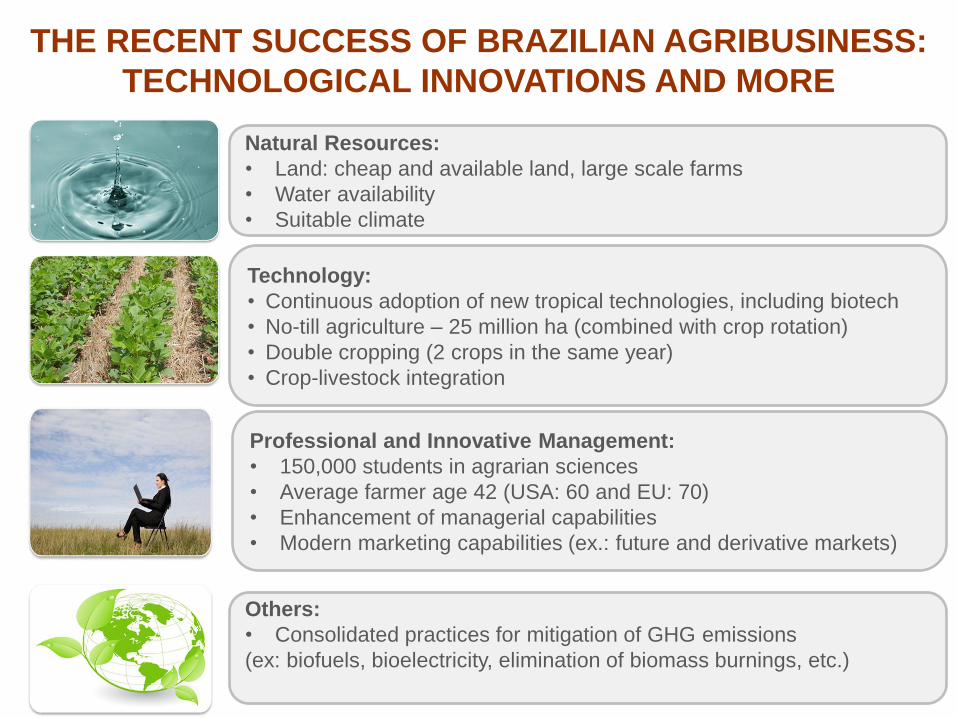
THE RECENT SUCCESS OF BRAZILIAN AGRIBUSINESS:
TECHNOLOGICAL INNOVATIONS AND MORE
Natural Resources:
• Land: cheap and available land, large scale farms
• Water availability
• Suitable climate
Technology:
• Continuous adoption of new tropical technologies, including biotech
• No-till agriculture – 25 million ha (combined with crop rotation)
• Double cropping (2 crops in the same year)
• Crop-livestock integration
Professional and Innovative Management:
• 150,000 students in agrarian sciences
• Average farmer age 42 (USA: 60 and EU: 70)
• Enhancement of managerial capabilities
• Modern marketing capabilities (ex.: future and derivative markets)
Others:
• Consolidated practices for mitigation of GHG emissions
(ex: biofuels, bioelectricity, elimination of biomass burnings, etc.)

CHALLENGES FOR BRAZILIAN AGRIBUSINESS
• Lack of good transport system (16% of roads are paved)
• High transportation costs and dependence on road transportation (74%)
• Inefficiency of ports, especially older ones (the largest ports are saturated)
• Poor infrastructure
Logistics “Custo Brasil”
• Weak institutions
• Legal uncertainty due to unstable legislation over time
• Lack of clear rules on land use (acquisition by foreign capital), property rights, the environment (reform of the Forest Code), and labor regulations (RN 31)
• Rising trade and investment protectionism impacting supply chains
Regulatory
Risks
“Unstable rules”
• Exchange rate: overvaluation and high volatility
• Agricultural protectionism around the world: tariffs, subsidies
• Lack of suitable financing and insurance mechanisms
• New technological breakthroughs
• Improved organizational structures to combine agricultural expansion and environmental conservation
Other challenges
“Expanding while
preserving”

CONCLUDING REMARKS
Deep structural changes are coming due to strong population growth,
higher per capita income and intense urbanization process in
developing countries, and especially in SE Asia.
Abundant natural resources and good technology performances are
necessary conditions but not sufficient to ensure the future food security
of the most dynamic regions. The equation is much more complex.
It is fundamental to create international/regional integrated and
efficient value chains. Identifying opportunities and removing potential
bottlenecks require a special attention on:
How countries are inserted into the global agribusiness value chains
Trade policies that reduce agri-food protectionism
Who are the main players involved in each of the supply chains
Efficiency of land and maritime logistics (domestic and international)
Availability of modern trade and project finance instruments
Potential technology improvement and technology transfer
How (natural) resources can be used sustainably
