brenda o'neill policy matters - home » institute for...
TRANSCRIPT

P o l i c y M a t t e r s
E n j e u x p u b l i c s
Brenda O’Neill
GenerationalPatterns in thePolitical Opinionsand Behaviourof Canadians
Separating theWheat from the Chaff
October 2001
Vol. 2, no. 5
Policy Matters ISSN 1492-7004

Brenda O’Neill is currently Assistant Professor of Political Studies at theUniversity of Manitoba. Dr. O'Neill's research is devoted to the study of Canadianwomen's political behaviour, specifically their political opinions and votingbehaviour. Recent publications include Citizen Politics: Research and Theory inCanadian Political Behaviour, co-edited with Dr. Joanna Everitt (Oxford UniversityPress) as well as articles in the Canadian Journal of Political Science, theInternational Political Science Review and the International Journal of CanadianStudies.
2 Enjeux publics Octobre 2001 Vol. 2, no. 5
Biographical note
The opinions expressed in this paper are those of the author and do not necessarily reflectthe views of IRPP or its Board of Directors.

3Policy Matters October 2001 Vol. 2, no. 5
Summary
This paper tackles questions of generational differences among Canadians intheir political attitudes and behaviours. Drawing on survey data collected byIRPP, it presents a detailed analysis of opinions toward many topical subjects,ranging from the influence of money in politics, to the role of minorities inelected bodies, to the general health of the Canadian democracy. Standardassumptions of inter-generational differences – heightened apathy among youngvoters, increasing disengagement from politics from one generation to the next– are put to test.
The principal conclusions include the following:
• In keeping with expectations, younger Canadians are less likely to followpolitics, to be politically knowledgeable, or to participate in politics atleast by voting or joining a political party.
• Somewhat surprisingly, younger Canadians reveal higher levels of satis-faction with a number of institutions, including Canadian democracy andelections generally and they hold healthier opinions of the federal gov-ernment, in that they are more likely to see it as fair and effective.
• As anticipated, younger Canadians are more willing to reform traditionalinstitutions and practices of Canadian democracy, showing higher levels ofsupport for such changes as fixed election dates and measures to ensurebetter representation of women and visible minorities in elected bodies.
This study also seeks to uncover the underlying sources of these patternsby analyzing attitudinal and behavioural changes that have occurred within dif-ferent age groups over the 1990 to 2000 period. This analysis focuses on threedistinct forces – life cycle, generational and period effects – that may account forage-related differences and change over time. At issue is whether today’s youngCanadians are unique in their political attitudes and behavioural dispositions, orare simply repeating patterns established by older generations at the same age.The analysis suggests that a variety of forces are at work:
• Today’s young Canadians are participating in the political system at lowerlevels than previous generations did at the same age, suggesting thatrecent declines in voting turnout and other measures of political partici-pation will not be reversed in future years.
• As Canadians age, they tend to develop a greater interest in politics, butthis is accompanied by a host of increasingly negative political evalua-
Generational Patterns in the Political Opinions and Behaviour of Canadians

tions, including a greater sense of political inefficacy, increased cynicismregarding political parties and the role of money in elections, and less sat-isfaction with democracy, elections and the electoral system in particular.
• Some changes have affected the population as a whole, including an over-all increase in satisfaction with democracy, federal elections and in pop-ulist sentiment, a decrease in political cynicism and perceptions of politi-cal inefficacy, a decreased willingness to accept the electoral system’s dis-torting effects, increased cynicism regarding the influence of money inpolitics and heightened dissatisfaction with the effective choice providedby existing political parties.
4 Enjeux publics Octobre 2001 Vol. 2, no. 5
Brenda O’Neill

5Policy Matters October 2001 Vol. 2, no. 5
Résumé
Cette étude porte sur les différences générationnelles qui caractérisent les atti-tudes et comportements des Canadiens à l’égard de la politique. À la lumière d’unsondage de l’IRPP, on y propose une analyse détaillée des opinions exprimées surune variété de thèmes parmi lesquels le rôle de l’argent en politique et celui desminorités dans les corps élus, en passant par la santé globale de la démocratiecanadienne. Sont ainsi mises à l’épreuve une série d’hypothèses souvent tenuespour acquises, en ce qui concerne par exemple l’indifférence des jeunes électeurset leur désengagement politique par rapport aux générations précédentes.
Voici les principales conclusions de l’étude :
• Les jeunes Canadiens sont effectivement moins enclins à s’intéresser à lavie politique, à se tenir informés en la matière, à s’engager politiquement– ne serait-ce qu’en exerçant leur droit de vote – ou à se joindre à un parti.
• Étonnamment, ils se disent plus satisfaits de nombreuses institutions, ycompris celles qui ont trait au fonctionnement de la démocratie et des élec-tions. Ils ont aussi une opinion plus favorable du gouvernement fédéral, ence sens qu’ils sont plus susceptibles de le juger efficace et équitable.
• Comme prévu, ils appuieraient en plus grand nombre une réforme des pra-tiques et institutions démocratiques traditionnelles, se montrant favorablesdans une plus grande proportion à certains changements comme les élec-tions à date fixe ou une représentativité accrue des femmes et des minoritésvisibles dans les corps élus.
L’étude examine aussi les causes sous-jacentes de ces schémas en analysantles changements d’attitude et de comportement intervenus dans chaque tranched’âge pendant la période 1990-2000. L’analyse porte sur trois forces distinctes,soit le cycle de vie, les effets générationnels et les effets périodiques, qui peuventexpliquer les écarts imputables à l’âge et l’évolution observée durant cettepériode. L’enjeu consiste à déterminer si les jeunes Canadiens ont aujourd’huiune attitude particulière à l’égard de la politique ou s’ils reproduisent simplementles schémas auxquels leurs aînés adhéraient au même âge. Voici, selon cetteanalyse, les facteurs à l’œuvre :
• Les jeunes Canadiens participent moins activement au système politiqueque leurs aînés au même âge. Il est donc peu probable qu’on assiste dansun proche avenir au renversement de la récente tendance au déclin de laparticipation électorale et de l’engagement politique en général.
Generational Patterns in the Political Opinions and Behaviour of Canadians

• À mesure qu’ils avancent en âge, les Canadiens tendent à s’intéresserdavantage à la politique tout en jugeant plus sévèrement son action dansplusieurs domaines. Ils en critiquent plus vivement l’inefficacité, se mon-trent plus cyniques à l’égard des partis et du rôle de l’argent en campagneélectorale, se disent moins satisfaits de la vie démocratique, des résultatsd’élection et du système électoral en particulier.
• En considérant l’ensemble de la population, on observe les principauxchangements suivants : satisfaction accrue vis-à-vis du fonctionnement dela démocratie et des élections fédérales, montée du sentiment populiste,baisse du cynisme et du sentiment d’inefficacité politique, moindre accep-tation des effets déformants du système électoral, cynisme accru face aurôle de l’argent en politique et insatisfaction plus marquée quant aux choixréels offerts par les partis actuels.
6 Enjeux publics Octobre 2001 Vol. 2, no. 5
Brenda O’Neill

7Policy Matters October 2001 Vol. 2, no. 5
Introduction 8
Age Patterns in Political Attitudesand Behaviour 11
Life Cycle, Generation Effects and Period Effects 33
Conclusion 41
Generational Patterns in the Political Opinions and Behaviour of Canadians

Introduction
A current marketing trend is to target advertising and goods toward particulargenerations of consumers. According to marketers, the tastes and buying pat-terns of Baby Boomers, Generation X and, most recently, Generation Y con-sumers (a.k.a. Echo Boomers) differ – distinct marketing strategies are neces-sary to target each group effectively. Marketers speak of cohorts, groups of con-sumers grouped by their birth years, sharing similar worldviews and behav-iours because of shared experiences in the formative years of youth and youngadulthood. Such strategies have had some success. The iMac computer, avail-able in a trendy range of neon colours, was developed and marketed specifi-cally for Generation Y consumers who are said to be less brand loyal and morewilling to purchase products simply because they are “cool” and reflect theirparticular culture.
The concept of generational cohorts has also been employed in the studyof political opinion and behaviour. Popular pieces, including Boom, Bust and Echoand Sex in the Snow, have examined generational differences in social, politicaland other values.1 If the marketing concept provides a means for increasing theprofits of companies that successfully target consumers, its equivalent in thestudy of public opinion might provide a means for assessing the degree to whichpolitical institutions and actors are considered legitimate in the eyes of particu-lar generations of citizens. From this, remedial measures can be developed thataddress issues of specific concern to different cohorts.
Two academic branches of research in the area of cohort analysis of pub-lic opinion and political behaviour suggest that democracy might very well beviewed differently across generations. The first and more optimistic branchsuggests that recent periods of economic and physical security in advancedindustrial societies and an increase in educational levels among younger gen-erations have had important consequences for democratic politics.2 Havingcome of age in periods quite different from those of previous generations, thepost-war generations redefined their interests away from the material andinstead adopted post-material interests; and they changed their politicalbehaviour in response to this redefinition of values. Younger generations aremore likely to engage in “new politics,” to be concerned with non-economicissues such as human rights and the environment, and to be involved withnon-traditional institutions and processes such as grassroots social move-ments and protest behaviour. Moreover, while these studies suggest that inter-est in politics has increased among post-war generations, expressed confi-dence in governmental and non-governmental institutions is dropping.
8 Enjeux publics Octobre 2001 Vol. 2, no. 5
Brenda O’Neill

9Policy Matters October 2001 Vol. 2, no. 5
Younger generations, while perhaps more interested in the stuff of politics, areturned off by its traditional manifestations.
The second branch of work suggests that technological and social changeover the last thirty years has led to a significant decline in social capital – con-sisting of levels of civic engagement, trust in traditional institutions and exchangeamong members of communities and neighbourhoods – which is most evidentamong younger generations in advanced industrial states.3 Increased cynicismtoward political institutions, lack of trust in politicians, weaker ties to politicalparties and decreasing levels of voter turnout have been linked to this phenom-enon. This drop in social capital is problematic for democracy in part because ittranslates into lower levels of participation in traditional democratic institutionsand processes. The success of democracy depends on its legitimacy in the eyes ofcitizens and on minimal levels of participation in its institutions and processes,most notably elections.
In keeping with these important veins of research, the objective of thisreport is to examine the degree to which the concept of generational cohortshelps in understanding the political beliefs and behavioural patterns ofCanadians. The instrument that makes this examination possible is a publicopinion survey (hereafter referred to as the Strengthening CanadianDemocracy Survey or SCD Survey) of 1,278 Canadians, commissioned by theInstitute for Research on Public Policy and carried out from February 16 toApril 2 of 2000.4 The SCD Survey provides an opportunity to investigate gen-erational patterns in Canadians’ levels of trust in political institutions and par-ticipation in democratic processes.
The report consists of two sections. The first examines whether youngerCanadians are distinguishable in their political activity and in their attitudestoward a range of political institutions and processes, information crucial foran assessment of the health of Canadian democracy. More specifically, the firstsection considers whether the decline in trust, and shifts in participation andin levels of support for political institutions are especially evident amongyounger Canadians. In order to do this, survey respondents are assigned to anage group. The determination of age groups – the breakdown of respondentsby birth year into groups that have shared similar formative experiences – isless than straightforward.5 For the purposes of this report, respondents weregrouped into one of five categories according to their year of birth: theyoungest group’s birth years are after 1972;6 the second group’s between 1963and 1972 inclusive; the third’s between 1953 and 1962; the fourth’s between1943 and 1952; and the final group’s before 1943. This breakdown providessufficiently small groupings to allow for a nuanced examination of younger
Generational Patterns in the Political Opinions and Behaviour of Canadians
Canadians without creating so many groups as to render the identification ofpatterns difficult. Throughout the first section of this report these groups willbe identified by their ages at the time of the survey: 18-27 years, 28-37 years,38-47 years, 48-57 years, and over 57.7
The second section of the report seeks to determine whether discoveredpatterns in opinion are due to generational, life cycle or period effects.Generational effects are those described above: differences that reflect theimportance of shared formative experiences among generational cohorts.Alternatively, variation across age groups may reflect life cycle effects: as peo-ple progress through life their attitudes and behaviour may shift in light of thechanging interests and experiences associated with different stages in the lifecycle. Lastly, patterns of opinion across age groups can also reveal the impor-tance of some shared experience or event common to all Canadians – that is,period effects. In order to isolate these competing effects, it is necessary toexamine how patterns of opinion change within different cohorts over time.Hence, in the second section of the report comparisons are made to the resultsfound in a survey conducted in 1990 for the Royal Commission on ElectoralReform and Party Financing (the Lortie Commission) and another conductedin 1993 at the time of the federal election.8 Several of the questions from theseearlier surveys were replicated in the SCD Survey, allowing for the direct com-parison of results between the two periods.
The importance of differentiating life cycle, period and generationaleffects stems from their differing consequences. As an example, evidence thattoday’s younger Canadians are less likely to vote may or may not be cause forconcern. This result might simply reflect life cycle effects: young people are lesslikely to see the importance of voting but as they age their turnout willincrease. The result is no substantial change in turnout level over time and lit-tle cause for concern.9 But if the source of such difference is generational, theresult is more disturbing: the lower level of turnout among younger Canadiansmay reflect some distinct formative experience shared by the generation that isunlikely to be completely overturned as they age, resulting in an overall dropin voter turnout at the aggregate level as this generation moves through the lifecycle. This type of generational effect would mean today’s younger Canadiansare less likely to vote than were younger Canadians of the previous generationat the same age, and aging alone is unlikely to allow them to “catch up.” Finally,period effects are also a worrying possibility. Period effects would be said toexist if a drop in turnout were reported in every age group over a certain peri-od of time. Such a result would also be of obvious concern for the health ofCanadian democracy.
10 Enjeux publics Octobre 2001 Vol. 2, no. 5
Brenda O’Neill

11Policy Matters October 2001 Vol. 2, no. 5
Age Patterns in Political Attitudes and
Behaviour
Political EngagementAre younger Canadians disengaged from traditional political institutions? Thesurvey provides several measures that suggest political engagement does vary byage group, and very often in the anticipated direction. The young appear at bestto be politically passive, and at worst, politically apathetic.
The survey asked respondents whether or not they “followed” politics. Thepattern revealed among the responses in Table 1 is clear: younger respondentsare significantly less likely to pay attention to politics and political news than areolder Canadians.10 In fact, in all age groups but the youngest, a majority revealthat they follow politics very or fairly closely. Among the 18-27 group, 59 per-cent of respondents said that they do not follow politics at any level. Among themost attentive group, respondents over 57, 68 percent said they follow politicsat some level. This most basic political act, requiring a minimum degree of effort,exhibits significant variation across age groups.
Following politics closely should result in greater political knowledge, andthe results suggest that older Canadians are indeed significantly more politicallyknowledgeable than younger Canadians. When asked to name the PrimeMinister, the federal Minister of Finance and the official opposition in Ottawa,older Canadians are more likely to answer correctly (Table 2). Although the dif-ferences in knowledge are relatively small for a well-known figure such as thePrime Minister, they become significant as the difficulty of the question increas-es. For example, only 22 percent of respondents aged 18-27 were able to identi-fy Paul Martin as the Minister of Finance while the corresponding figure among
Generational Patterns in the Political Opinions and Behaviour of Canadians
18-27 28-37 38-47 48-57 over 57
Very or fairly closely 41 59 58 64 68Not very closely or not at all 59 41 42 36 32(N) 271 268 281 224 211
Table 1Attention to Politics by Age Group
Note: Entries are percentages. Columns may not add to 100 due to rounding. Question wording: “Some peoplehave less interest in politics than others, how about you, would you say that you follow politics very closely, fairlyclosely, not very closely or not at all?”

those in the over-57 group is 65 percent. Similarly, while only 20 percent of theyoungest respondents knew that the Reform Party was the official opposition,this share consistently increases with age to 48 percent of respondents in the old-est age group. At least at the aggregate level, the greater attention paid to politicsby older Canadians appears to translate directly into greater political knowledge.
Respondents were then asked about their voting behaviour, a key politicalact for citizens in liberal democracies. Voting requires little effort, so low voterturnouts may suggest that the health of a democracy is in jeopardy. The patternacross age groups revealed in levels of political interest is reproduced in votingparticipation rates (Table 3). Although a majority of respondents in every agegroup reports having voted in the 1997 federal election, this share increasesdirectly with age. Among respondents in the 18-27 group who were of voting agein 1997, 66 percent report having cast a ballot in the 1997 federal election. Thecorresponding figures in the two oldest age groups are 92 percent and 91 percent.
12 Enjeux publics Octobre 2001 Vol. 2, no. 5
Brenda O’Neill
Correctly Prime Minister of OfficialIdentified the: Minister Finance Opposition
18-27 84 22 2028-37 89 46 3438-47 93 46 3448-57 93 61 45
over 57 89 65 48
Table 2Political Knowledge by Age Group
Note: Entries are percentage of respondents who provided the correct answer. Question wording:“We would like to know how well some political figures are known. Can you tell me the name ofthe Prime Minister (the Federal Minister of Finance)?” and “Do you happen to know which partyis the official opposition in Ottawa?”
18-27 28-37 38-47 48-57 over 57
Voted in 1997 federal election 66* 69 85 92 91Voting is essential or very important 75 85 89 86 91
Table 3Voting Turnout and Attitude by Age Group
Notes: Entries are percentages. *Includes only respondents born between 1973 and 1978; that is, those respon-dents who would have been too young to vote in 1997 were removed from the calculation. The result is a reducedsample size (N=173) in the first age group on this question.

13Policy Matters October 2001 Vol. 2, no. 5
This decreased willingness to exercise voting rights stems in part from astronger belief among younger respondents that voting is not very important(Table 3). Respondents were asked “In your view, how important is it that peoplevote in elections?” While 75 percent of the youngest respondents believe voting isessential or very important, about 90 percent of respondents in the three oldestage groups provided this response. This suggests the weaker participation amongyounger Canadians may be due to the lesser significance they accord to voting.11
If fewer younger Canadians are voting, it is also the case that almost noneof them have joined a political party (Table 4). In the 18-27 group, virtually all(98 percent) respondents report that they have never been a member of a polit-ical party. The participation rate improves as one moves across the age groups:among the over-57 group, 33 percent report having been a member of a politi-cal party at some point in their lives. (It should be noted that question wordingis partly responsible for this result. The question asks whether respondents haveever been a member of a political party, so the higher rates of participation amongolder respondents are to be expected.)
The low rate of party membership among younger Canadians is not likelydue to a lack of access since joining a political party often involves little more thana phone call to a constituency office or a visit to a website. Instead, it lies at leastpartly in the fact that few younger Canadians have even thought about joining apolitical party. Respondents who had never been a member of a party were asked,“Have you thought about joining one?” Among these non-party members, the vastmajority of respondents in all age groups have never thought of joining a party,but there is some evidence that party membership is less often considered amongyounger Canadians, ranging from 97 percent of non-members in the 18-27 groupto 85 percent in the 48-57 group (data not shown).
Generational Patterns in the Political Opinions and Behaviour of Canadians
18-27 28-37 38-47 48-57 over 57
Has been a political partymember 2 9 15 26 33
Has been a member of aninterest group 9 12 12 19 11
Ratio (interest group/partymembership) 4.5 1.3 0.8 0.7 0.3
Table 4Participation in Political Parties and Interest Groups by Age Group
Note: Entries are percentages.

Respondents were also asked if they had ever been a member of an inter-est group. And as in the case of political party membership the rate of participa-tion increases with age. While 9 percent of respondents in the youngest groupidentified themselves as having been an interest group member, this shareincreases to 19 percent among the 48-57 group. The trend is not consistent,however, in that interest group membership among the oldest age group dropsslightly to 11 percent.
Most interesting, however, is a comparison of rates of participation in partiesand interest groups. This reveals that younger Canadians are far more likely tochoose the latter over the former than older Canadians. The ratio of interest groupparticipation to political party participation (see Table 4) is 4.5 to 1 for theyoungest age group but only 0.3 to 1 among the oldest age group. Interest groupsare more likely to be the organization of choice for younger Canadians who wishto participate politically. Among older Canadians, political parties come out ahead.
This conclusion is reinforced by responses to an additional survey ques-tion asking respondents which of the two, interest groups or political parties, wasthe more effective instrument for bringing about political change. The results byage group appear in Figure 1. Although there is agreement across the age groupsthat interest groups are more effective than political parties as mechanisms ofpolitical change, this belief is strongest among younger Canadians. While 73 per-
14 Enjeux publics Octobre 2001 Vol. 2, no. 5
Brenda O’Neill
18-27 28-37 38-47 48-57 Over 570
20
40
60
80
100
Perc
enta
ge
73
24
1
2
77
17
4
3
72
19
6
3
58
26
10
6
56
31
6
6
Join Interest Group
Join Political Party
Both
Neither
Figure 1Most Effective Way to Work for Change by Age Group
15Policy Matters October 2001 Vol. 2, no. 5
cent of respondents in the youngest age group choose interest groups as the moreeffective mechanism, only 56 percent of respondents in the oldest age grouprespond similarly. Older Canadians are more likely to select the “both” and “nei-ther” responses and to consider political parties more effective than are youngerCanadians.
Thus, when compared to older Canadians, younger Canadians
• are less likely to follow politics closely;• are less politically knowledgeable;• are significantly less likely to have voted in the 1997 federal election;• are less likely to see voting as an “essential” democratic act;• are less likely to be or have been a member of a political party or interest
group; and• are more likely to believe interest groups are more effective than political
parties for bringing about change.
These preliminary findings point to significant political withdrawal amongyounger Canadians that may signal deeper problems ahead for Canadian democracy.
Political Attitudes and BeliefsThe SCD Survey allows us to examine the degree to which the generational
participation patterns outlined above are mirrored in levels of support for the polit-ical system, its institutions and processes and in expressed levels of political effica-cy, trust and cynicism. If younger Canadians are disengaged, is it linked to increasedlevels of political apathy or, alternatively, to a lack of support and trust in the sys-tem? Both explanations have implications for the health of Canadian democracy.
DemocracyWe begin by examining the level of satisfaction with democracy exhibited
across the age groups. If younger Canadians have stopped engaging democrati-cally, it may be due to their unhappiness with the system’s general political struc-tures. The results, however, reveal quite the opposite (Figure 2). Respondentswere asked, “On the whole, are you very satisfied, fairly satisfied, not very satis-fied or not satisfied at all with the way democracy works in Canada?” Contraryto expectations, younger Canadians are more likely to feel satisfied with democ-racy than are other Canadians. While 82 percent of the 18-27 group are very orfairly satisfied with democracy, only 65 percent of the over-57 group respondsimilarly. The relationship is clear: the older the respondent, the lower the levelof satisfaction with democracy.12
Generational Patterns in the Political Opinions and Behaviour of Canadians

This pattern persists for satisfaction with federal elections. The shareexpressing some measure of satisfaction ranges from 81 percent of the 18-27group to 66 percent of the 48-57 group (Figure 2). On the election question,however, significant variation exists across the age groups in the share of respon-dents responding “don’t know”: 43 percent of the 18-27 group but only 21 per-cent of the 48-57 group. Younger Canadians, it appears, haven’t thought muchabout federal elections, reflecting perhaps their more limited participation over-all. But among those who do offer an opinion, they are far more likely to be sat-isfied with federal elections than older Canadians.
The Federal Government: Fair and Effective?The SCD Survey also asked respondents their opinions about the fairness
and effectiveness of the federal government. Younger Canadians may be less politi-cally engaged because of their views of the federal government. But as shown inTable 5 the generational patterns found in satisfaction with democracy and federalelections are repeated for opinion on the federal government’s fairness and effec-tiveness. When read the statement, “The federal government generally treats allCanadians fairly,” younger Canadians are more likely to agree than older Canadians.Among the youngest age group a full 64 percent agreed with the statement, whilethis share drops to 47 and 53 percent respectively among the two oldest groups.
16 Enjeux publics Octobre 2001 Vol. 2, no. 5
Brenda O’Neill
18-27 28-37 38-47 48-57 Over 570
20
40
60
80
100
Perc
enta
ge
82
81
75
79
74
68
70
66
65
72
Democracy Federal Elections
Figure 2Satisfaction with Democracy and Elections by Age Group

17Policy Matters October 2001 Vol. 2, no. 5
The pattern is the same for the question concerning the federal govern-ment’s effectiveness. Younger Canadians are more likely to agree that “the feder-al government usually does a good job of getting things done” given all thedemands made on it. Among the two youngest age groups, roughly 60 percentof respondents either strongly or somewhat agree that the government is effec-tive in this sense, while the equivalent share in the three remaining age groupsdrops to between 48 and 52 percent. These results underscore a current of dis-satisfaction among older Canadians.
Political Efficacy, Confidence and TrustThis section examines whether the lower levels of satisfaction and more
negative evaluation of government performance expressed by older age groupsare accompanied by a sense of powerlessness vis-à-vis the government. That is,do those groups who are less politically satisfied overall also believe governmentdoes not respond to them or reveal skepticism regarding politicians and peoplein general? Moreover, is unhappiness with government and politics perhapsaccompanied by a desire to increase the political power of citizens at the grass-roots level, that is, by a hint of populism?
A series of statements were read to assess levels of political efficacy, trust,cynicism and support for populism. The analysis of these responses by age groupappears in Table 6. The results reveal that beliefs vary only slightly across the agegroups on these questions and, as such, are unlikely to be linked to generationaldifferences in political attitudes and behaviour.
Nevertheless, the results reveal the pervasiveness of certain negative opin-ions about our political system. The health of a democracy is directly linked tothe degree to which its citizens believe they can effect change if they so desire. Amajority of Canadians in all age groups agrees that “people like me do not havemuch say over what the government does.” The legitimacy of a representativesystem of government also depends on whether citizens believe their concerns
Generational Patterns in the Political Opinions and Behaviour of Canadians
18-27 28-37 38-47 48-57 over 57
Treats Canadians fairly 64 56 53 47 53Does a good job getting things
done 64 57 52 48 50
Table 5Federal Government’s Fairness and Effectiveness by Age Group
Note: Entries are percentages of respondents strongly or somewhat agreeing with the statement.

18 Enjeux publics Octobre 2001 Vol. 2, no. 5
Brenda O’Neill
18-2
728
-37
38-4
748
-57
over
57
Peop
le li
ke m
e do
not
hav
e m
uch
say
over
wha
tSt
rong
ly o
r so
mew
hat
agre
e58
6567
6961
the
gove
rnm
ent
does
Tho
se e
lect
ed t
o Pa
rlia
men
t so
on lo
se t
ouch
Stro
ngly
or
som
ewha
t ag
ree
7175
8170
67w
ith
the
peop
leG
ener
ally
mos
t pe
ople
can
not
be t
rust
edSt
rong
ly o
r so
mew
hat
agre
e42
4130
3340
Cou
ld s
olve
nat
iona
l pro
blem
s at
the
gra
ssro
ots
leve
lSt
rong
ly o
r so
mew
hat
agre
e78
8277
7576
Deg
ree
of c
onfid
ence
in t
he w
isdo
m a
nd g
ood
A g
reat
dea
l or
som
e78
7976
7971
judg
emen
t of
the
Can
adia
n pe
ople
in m
akin
gpo
litic
al d
ecis
ions
The
maj
or is
sues
of
the
day
are
too
com
plic
ated
Stro
ngly
or
som
ewha
t ag
ree
5249
4853
51fo
r m
ost
vote
rs
Tabl
e 6
Eff
icac
y, C
ynic
ism
and
Pop
ulis
m b
y A
ge G
roup
Not
e: E
ntri
es a
re p
erce
ntag
es.

19Policy Matters October 2001 Vol. 2, no. 5
are effectively represented within government. A strong majority in all age groupsagrees that “those elected to Parliament soon lose touch with the people.” Somevariation is recorded on this question: while 81 percent of the 38-47 group agreesthat members of Parliament soon lose touch, this share drops to 67 and 71 per-cent among the oldest and youngest age groups respectively.
Interestingly, however, when respondents were asked whether they agreethat “generally most people cannot be trusted,” the pattern is reversed. A major-ity in every age group disagrees with the statement although there is some vari-ation across the age groups. Canadians aged 38 to 47 reveal the greatest levels oftrust, with only 3 of 10 respondents agreeing with the statement. The level ofgeneral cynicism increases in each of the remaining age groups, peaking at 42percent in the 18-27 age group. Cynical views of politicians are not necessarilymatched by a general cynical outlook.13
Several questions address populist sentiment, that is, the support accord-ed to granting a greater measure of political power directly to the “people.” Forexample, the results reveal that a significant measure of consensus exists on thequestion of whether “We could probably solve most of our big national problemsif we brought them back to the grassroots level.” Between 75 percent and 82 per-cent of respondents in all age groups agree with the statement. On the relatedquestion of the degree of confidence respondents have in the ability of citizens torender good and wise judgements on political questions, a significant majority ineach age group expresses some confidence in Canadians, a level which variesonly marginally across the age groups (from 71 percent to 79 percent). Canadiansof all ages overwhelmingly believe that Canadians can and should be trusted tohelp solve national problems. In spite of this populist bent, however, opinion isevenly split within each age group between those who agree that “The majorissues of the day are too complicated for most voters” and those who do not.Canadians of all ages appear to desire increased political power even if they arenot convinced that all Canadians can deal with complicated political issues.
Money and PoliticsRecently, much attention has been paid to the effectiveness of existing
spending controls on campaigns and elections and to the need for tighteningthem.14 The generational differences seen above might reflect varying beliefs onthis score. The results, however, suggest a significant degree of pessimism existsamong all age groups regarding the degree to which money provides an unfairadvantage in Canadian politics.15
The SCD Survey asked respondents whether they agreed with the state-ments “People with money have a lot of influence over the government” and “The
Generational Patterns in the Political Opinions and Behaviour of Canadians

party that spends the most is the most sure to win the election.” Table 7 reportsthese results for each of the five age groups. There exists little in the way of a cleargenerational pattern in responses to the first question. The share of respondentsagreeing with the statement constitutes a majority of responses in all age groups.This majority is at its lowest, 86 percent, among the youngest respondents andat, or above, 90 percent in each of the remaining age groups, peaking at 96 per-cent in the 48-57 group. Nearly all Canadians believe money unfairly advantagessome individuals, though this belief is marginally weaker among youngerCanadians.
Canadians appear less convinced that money has an influence over elec-toral results, though a majority in every age group continues to agree that spend-ing determines electoral success. And older Canadians hold only slightly morecynical beliefs regarding elections as fair contests between relatively equal polit-ical parties than do younger Canadians. More than two out of every threerespondents over age 47 agree with the statement.
The Electoral SystemRespondents were asked for their views on the fairness of the first-past-
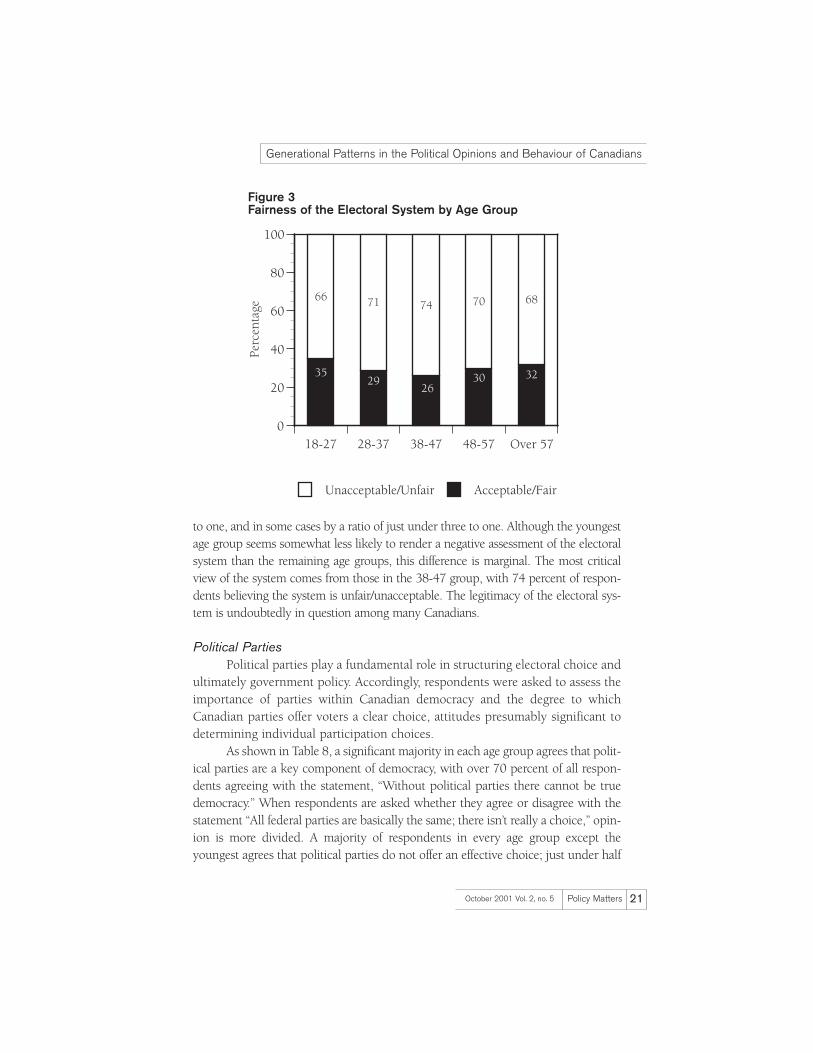
the-post system, an increasingly contested institution in light of its distortion ofvote shares among the electorate into seat shares in the legislature. Here again,beliefs regarding the fairness of this institution might account for differences inwillingness to participate in it. Responses to four versions of this question regard-ing the electoral system have been collapsed and appear in Figure 3.16 As shown,however, the results are less than helpful in explaining generational differencesin political behaviour.
A significant number of respondents in every age group do not hold an opin-ion on this question, the non-response rate being particularly high among the youngerage groups.17 But among those respondents who do offer an opinion, the system isoverwhelmingly regarded as unfair or unacceptable, often by a ratio of more than two
20 Enjeux publics Octobre 2001 Vol. 2, no. 5
Brenda O’Neill
18-27 28-37 38-47 48-57 over 57
People with money have a lotof influence over the government 86 93 91 96 90
Party that spends the most is sure to win the election 61 66 63 68 67
Table 7Money’s Influence over Politics by Age Group
Note: Entries are percentages of respondents agreeing strongly or agreeing somewhat with the statement.
21Policy Matters October 2001 Vol. 2, no. 5
to one, and in some cases by a ratio of just under three to one. Although the youngestage group seems somewhat less likely to render a negative assessment of the electoralsystem than the remaining age groups, this difference is marginal. The most criticalview of the system comes from those in the 38-47 group, with 74 percent of respon-dents believing the system is unfair/unacceptable. The legitimacy of the electoral sys-tem is undoubtedly in question among many Canadians.
Political PartiesPolitical parties play a fundamental role in structuring electoral choice and
ultimately government policy. Accordingly, respondents were asked to assess theimportance of parties within Canadian democracy and the degree to whichCanadian parties offer voters a clear choice, attitudes presumably significant todetermining individual participation choices.
As shown in Table 8, a significant majority in each age group agrees that polit-ical parties are a key component of democracy, with over 70 percent of all respon-dents agreeing with the statement, “Without political parties there cannot be truedemocracy.” When respondents are asked whether they agree or disagree with thestatement “All federal parties are basically the same; there isn’t really a choice,” opin-ion is more divided. A majority of respondents in every age group except theyoungest agrees that political parties do not offer an effective choice; just under half
Generational Patterns in the Political Opinions and Behaviour of Canadians
18-27 28-37 38-47 48-57 Over 570
20
40
60
80
100
Perc
enta
ge
35
66
29
71
26
74
30
70
32
68
Acceptable/FairUnacceptable/Unfair
Figure 3Fairness of the Electoral System by Age Group

of the 18-27 group concur. It seems younger Canadians are as committed to the ideathat political parties play a key role in democracy as older Canadians, and they aremore likely to believe political parties offer effective choices during federal elections.
ReferendumsIt is commonly accepted that one legacy of the Charlottetown Accord is a
weakened willingness among Canadians to concede final decision-makingauthority over constitutional, and perhaps additional political questions, to elect-ed officials alone. That younger Canadians have come of age and been political-ly socialized during such a heightened period of participatory politics may havetranslated into greater expectations regarding referendums as tools of democrat-ic decision-making. Younger Canadians may be more prone to believes it is theirright to have a say in political questions, at least through referendums.
As shown in Table 9, however, when asked if they think referendums are“good things, bad things or that they don’t make much difference” a majority inevery age group considers referendums to be a good thing. Opinion is onlyslightly less positive among the oldest age group, with 51 percent providing apositive evaluation of referendums, although more than one in three respondentsin this age group believe referendums do not make much difference.
22 Enjeux publics Octobre 2001 Vol. 2, no. 5
Brenda O’Neill
18-27 28-37 38-47 48-57 over 57
Without political parties, not atrue democracy 71 78 76 75 74
All federal parties are basically the same 48 58 61 56 58
Table 8Political Parties by Age Group
Note: Entries are percentages of respondents agreeing strongly or somewhat with each statement.
18-27 28-37 38-47 48-57 over 57
Good things 62 63 65 64 51Bad things 6 8 7 14 10Don’t make much difference 33 29 28 22 39
Table 9Referendums by Age Group
Note: Entries are percentages. Columns may not add to 100 due to rounding.
23Policy Matters October 2001 Vol. 2, no. 5
This pattern varies somewhat in the responses given to four separate sur-vey questions regarding the use of referendums on specific policy issues.Respondents were asked whether referendums would be appropriate for deci-sions on constitutional changes, tax increases, for cuts to social spending and onland claims agreements with Aboriginal peoples (Table 10).18 The trend acrossthese questions is for younger age groups to be more supportive of the use of ref-erendums than those in older age groups. If Charlottetown has a legacy, it lingersin younger Canadians’ greater demand to be included in decision-making.
When respondents are asked about referendums on moral issues, however,the pattern of support changes. Respondents in the survey were randomly assignedone of two questions dealing with referendums on the moral issues of abortion andcapital punishment. Table 10 provides the breakdown of responses to these twoquestions by age group. The pattern of weaker support for referendums amongolder age groups is not repeated when the issues in question are moral ones.
A majority of Canadians in all age groups supports the use of referendumson the issue of capital punishment. This support is strongest among the threemiddle age groups (respondents aged 28 through 57) ranging from 74 to 78 per-cent. The lowest level of support on this issue appears in the 18-27 group, withonly 62 percent of respondents believing referendums should always or some-times be employed. On the question of employing referendums to decide abor-tion policy, opinion is more divided. Among the oldest age group, only 30 per-cent of respondents believe referendums should always or sometimes be used onthe issue.19 Forty-six percent of respondents in the youngest age group give asimilar response. The use of referendums for abortion policy receives majoritysupport, however, in the three middle age groups. Thus, younger Canadians aremore willing to employ referendums for policy-making except when the issuesin question are moral ones.
RepresentationThere has been some media discussion of “mirror” legislative representa-
tion, given Jean Chrétien’s decisions in 1993 and 1997 to directly nominate sev-eral women candidates, thereby overriding the authority of local constituencyassociations in an effort to increase female representation among MPs.20 The legit-imacy of such acts rests squarely on the perceived need to alleviate the weakpolitical representation of certain groups. To gauge opinion on this issue, half ofthe respondents to the survey were randomly selected and asked about theunder-representation of women in the House of Commons; the remainingrespondents were asked their opinion on the lack of visible minorities. Table 11reports these opinions.
Generational Patterns in the Political Opinions and Behaviour of Canadians

24 Enjeux publics Octobre 2001 Vol. 2, no. 5
Brenda O’Neill
18-2
728
-37
38-4
748
-57
over
57
On
cons
titu
tion
al c
hang
esA
lway
s /
som
etim
es75
7173
7071
On
tax
incr
ease
sA
lway
s /
som
etim
es67
6764
5451
On
cuts
to
soci
al s
pend
ing
Alw
ays
/ so
met
imes
7172
7062
51O
n la
nd c
laim
s ag
reem
ents
wit
hA
bori
gina
l Peo
ples
Alw
ays
/ so
met
imes
7068
6664
56A
bort
ion
Alw
ays
/ so
met
imes
4661
6657
30C
apit
al p
unis
hmen
tA
lway
s /
som
etim
es62
7478
7865
Tabl
e 10
Use
of
Ref
eren
dum
s on
Con
stitu
tiona
l, Po
licy
and
Mor
al Is
sues
by
Age
Gro
up
Not
e: E
ntri
es a
re p
erce
ntag
es. R
espo
nses
hav
e be
en c
olla
psed
. Que
stio
n w
ordi
ng: “
Do
you
thin
k C
anad
a sh
ould
alw
ays,
som
etim
es, r
arel
y or
nev
er h
ave
refe
rend
ums
on [
inse
rt p
arti
cula
r is
sue]
?” a
nd “
Do
you
thin
k C
anad
a sh
ould
alw
ays,
som
etim
es,
rare
ly,
or n
ever
hav
e re
fere
ndum
s on
mor
al i
ssue
s lik
e[i
nser
t is
sue]
?”

25Policy Matters October 2001 Vol. 2, no. 5
An examination of opinion on women’s under-representation provides ini-tial support for the existence of generational differences in support of this “post-materialist” issue. A minority in every age group responds that the low numberof women MPs is a very serious or serious problem. Equally clear, however, isthat the post-materialist impulse is not strongest among younger Canadians.While 44 percent of respondents in the 48-57 group considers the lack of womenin the House of Commons a problem, this share falls to 28 percent among the18-27 group. The pattern, then, is that the youngest and oldest age groups areleast concerned with the legislative under-representation of women.
On the question of the under-representation of visible minorities, howev-er, the pattern changes. Although a majority in each age group remains uncon-cerned, the two youngest age groups do reveal higher levels of concern. Just 28percent of respondents in the youngest age group suggested that the under-rep-resentation of women was a very serious or serious problem; this figure jumps to46 percent when the under-represented group is visible minorities. If youngerCanadians are more likely to consider the political “gender battle” won, they aremuch more likely to consider the “visible minority war” as just beginning.
Multinational CorporationsA significant amount of attention has recently been directed at multination-
al corporations (MNCs), given their privileged position within the global economyand changing world economic structures. Coverage of recent protests, includingAPEC, World Trade Organization and FTAA demonstrations, might give theimpression that vocal, organized protest against such organizations is dominated byyounger rather than older citizens. As shown in Figure 4, however, Canadians ofall ages agree overwhelmingly that MNCs are too powerful. When read the follow-ing statement – “Multinational corporations have become so powerful that the gov-ernment no longer has very much control over how things are done in Canada” –between 73 percent and 81 percent of respondents in every age group agree.
Generational Patterns in the Political Opinions and Behaviour of Canadians
18-27 28-37 38-47 48-57 over 57
Women: Very serious or seriousproblem 28 32 38 44 27
Visible minorities: Very seriousor serious problem 46 40 35 43 26
Table 11Under-Representation in House of Commons by Age Group
Note: Entries are percentages of respondents.

Modifying Political Processes – Election Timing A number of questions in the SCD Survey addressed the willingness of
respondents to modify traditional political institutions and practices. Here thefindings are more consistent with the lower levels of political interest and dem-ocratic participation described above – younger Canadians appear far less com-mitted to existing processes and conventions than older Canadians. One ques-tion addressed the timing of elections. Canadian governments are free to set thedate of elections subject only to a maximum government tenure of five years;some have suggested that governments use this flexibility to their advantage bytiming elections when their popularity among the public is highest. In somecountries, most notably the United States, the timing of elections is fixed. Itcould be argued that importing the practice to Canada would increase the per-ceived fairness of the process. Respondents were asked “Do you think we shouldhave set dates for elections, or that the government should decide when electionsare held, or do you not have an opinion on this?”21 (Figure 5).
Although a majority in every age group prefers fixed dates for elections, sup-port (ranging from 76 to 82 percent) is somewhat higher among the three youngestage groups than it is among the two oldest groups (between 62 percent and 63 per-cent). Older Canadians are less willing to tinker with this long-standing practice.
26 Enjeux publics Octobre 2001 Vol. 2, no. 5
Brenda O’Neill
18-27 28-37 38-47 48-57 Over 570
20
40
60
80
100
Perc
enta
ge
76
24
73
27
80
20
81
19
77
23
MNCs too powerful
MNCs not too powerful
Figure 4Multinational Corporations by Age Group

27Policy Matters October 2001 Vol. 2, no. 5
Legislative Representation A second question dealing with changes to political practices asked one
half of the respondents whether political parties should be required to increasethe number of female candidates they select to run in elections.22 Responses tothis question appear in Table 12.
The results for this question are less than straightforward. At least a plu-rality of every group – in three of five groups, a majority – favours a gender par-ity policy for political parties. The highest level of support exists among theyoungest age group, which is somewhat counter-intuitive given that this groupwas not particularly convinced that gender under-representation was a problem.
The remaining respondents were asked if they would support measuresrequiring parties to select more members of visible minorities as candidates.23
These results reinforce the conclusion that younger Canadians are much morewilling to impose candidate selection requirements on parties than are olderCanadians. While 68 percent of respondents in the youngest group would sup-port such measures, only 44 percent of respondents in the oldest age groupwould as well.
When all respondents were asked if they would support the designationof Aboriginal seats in the House of Commons, a similar pattern of response isfound across the age groups (see Table 12). Respondents in the two youngest age
Generational Patterns in the Political Opinions and Behaviour of Canadians
18-27 28-37 38-47 48-57 Over 570
20
40
60
80
100
Perc
enta
ge
20
80
18
82
24
76
37
63
38
62
Government Decides Fixed Dates
Figure 5Election Timing Preference by Age Group

groups were more likely to support setting aside parliamentary seats forAboriginal representatives than respondents in the three oldest groups. Althougha majority in every group favoured the policy, support ranged from a high of 70percent among the 18-27 group to a low of 58 percent among the over-57s. Ingeneral, then, younger Canadians appear to be more willing to adopt measuresto counter representational weaknesses in legislative institutions, especially forvisible minorities and Aboriginal peoples.
Party DisciplineRepeated calls for the loosening of parliamentary conventions that require
legislators to vote along party lines have been heard in recent times. ManyCanadians question what appears to be the self-interest of MPs winning out overthe interests of their constituents. The SCD Survey asked respondents three dis-tinctly worded versions of a question on free votes in the House of Commons,each to a randomly selected third of the respondents. Responses to these threeversions have been merged and the results appear in Figure 6.24
The results suggest that, unlike opinion on some suggested reforms, agedoes not significantly demarcate opinion on the question of party discipline.Instead, consistently strong support for relaxing party discipline exists across allage groups and appears to vary little with question wording: agreement that lawswould be better if party discipline were loosened never falls below 82 percent inany age group.
Respondents who agreed that free votes would lead to better laws thenhad their opinions challenged by providing them with a counter-argument:“What if this means that after an election it is more difficult for the government
28 Enjeux publics Octobre 2001 Vol. 2, no. 5
Brenda O’Neill
18-27 28-37 38-47 48-57 over 57
Require parties to increase number of female candidates 57 47 50 51 44
Require parties to increasenumber of visible minoritiescandidates 68 59 48 48 44
Set aside small number of seats in the Parliament forAboriginal peoples 70 65 60 61 58
Table 12Adopt Measures to Improve Legislative Representation by Age Group
Note: Entries are percentages supporting the stated measure.

29Policy Matters October 2001 Vol. 2, no. 5
to do the things they said they were going to do?” Despite the challenge, agree-ment never falls below 81 percent of respondents in any age group on any of thethree questions (results not shown). Canadians of all ages are committed to theirdislike of party discipline.
Institutional PowerA further set of questions in the SCD Survey dealt with the relative power of
institutions within or connected to the Canadian political system. The first address-es the balance of power within the federal system. Respondents were askedwhether they believed “the provinces should have more say over the way things aredone in Canada.” The results suggest there is relatively little variation across agegroups in willingness to side with the provinces in the federalism game (Figure 7).A significant majority in each age group agrees the provinces deserve a greater say.
A second question deals with the division of power between the courtsand the legislature. The Charter of Rights affords significant power to thecourts, particularly the Supreme Court, in that government legislation can beoverturned in court challenges based on the argument that the legislation com-promises the protection of basic rights enshrined in the Charter. RecentSupreme Court decisions have led to criticism of the Supreme Court’s author-
Generational Patterns in the Political Opinions and Behaviour of Canadians
18-27 28-37 38-47 48-57 Over 570
20
40
60
80
100Pe
rcen
tage
82
1888
13
90
10
89
12
86
14
SupportOppose
Figure 6Support for Relaxing Party Discipline by Age Group

ity, since it, unlike Parliament, is a non-elected body that is not directlyaccountable to anyone. Younger Canadians, however, have come of age at atime when considerable effort has been expended to generate support for theCharter, only recently enshrined in the Constitution Act, 1982. Consequently,they may be more willing to grant the Supreme Court the independence nec-essary to protect Charter rights and less willing to allow governments to over-ride the Court’s decisions.
To assess opinion on this issue, respondents were randomly divided intotwo groups and asked one of two related survey questions. Responses to thesequestions were merged and the results appear in Figure 8.25
Although a plurality in every age group sides with the courts in Charterdisputes, a pattern across the age groups nevertheless appears: youngerCanadians are more likely to support the courts over the government/legisla-ture, with 14 percentage points separating the youngest and oldest age groupsin their support for the judicial branch. It appears that younger Canadians,having grown up with the Charter and more likely to have been formally edu-cated about its benefits, are more willing to cede power to the courts in inter-preting it.
In summary, the results in this first section reveal a mix of generational pat-terns in opinion across a number of issues. On a few questions, such as the use
30 Enjeux publics Octobre 2001 Vol. 2, no. 5
Brenda O’Neill
18-27 28-37 38-47 48-57 Over 570
20
40
60
80
100
Perc
enta
ge87
13
85
15
86
14
83
17
81
19
SupportOppose
Figure 7Increasing Provincial Power by Age Group

31Policy Matters October 2001 Vol. 2, no. 5
of free votes in the House of Commons and in levels of populist sentiment, littledifferentiation in opinion exists across age groups. On a number of questions,however, a linear pattern exists, in which support or agreement consistently fallsor increases with age.
• Younger Canadians are less likely to follow politics, be politically knowl-edgeable or participate politically by either voting or joining a party.
• Younger Canadians reveal higher levels of satisfaction with a number ofinstitutions, including democracy and elections generally, and they holdhealthier opinions on the federal government, in that they are more like-ly to see it as fair and effective. They also feel somewhat less ineffective intheir relationship with government and are less likely to believe moneyaccords certain individuals an unfair political advantage.
• Younger Canadians are somewhat less likely to see political parties asessential to democracy but are more likely to believe the existing mix ofpolitical parties offers an effective choice to voters.
• The proportion that doesn’t hold an opinion on elections generally and thefirst-past-the-post system specifically is highest among youngerCanadians.
Generational Patterns in the Political Opinions and Behaviour of Canadians
18-27 28-37 38-47 48-57 Over 570
20
40
60
80
100
Perc
enta
ge
25
75
33
67
29
71
31
69
39
61
Legislature has final say
Courts have the final say
Figure 8Parliamentary Supremacy by Age Group
• Younger Canadians are more willing to change the political system, in thatthey desire a greater role for referendums (except when the issues in ques-tion are moral ones), are more supportive of fixed election dates, are morewilling to impose requirements on parties in the selection of local con-stituency candidates and are more willing to designate House ofCommons seats for Aboriginal representatives.
• Younger Canadians also are more likely to see the courts as the properforum for ruling on Charter challenges.
On a few questions, attitudes in the 48-57 group stood out. This groupevinced:
• the greatest concern for women’s under-representation and the second-highest concern for the representation of visible minorities;
• the lowest levels of satisfaction with government, politics and federalelections;
• the lowest level of perceived political efficacy;• limited support for the suggestion that government is fair and gets things
done effectively; and • greater agreement that money provides an unfair advantage in Canadian
politics.
This group came of age during the 1960s and their expectations for thepolitical system might be higher than for other groups. The consequence of high-er expectations is that they are harder to meet, something that very likely influ-ences the distinctive opinions expressed by this group.
Nevertheless, a fairly consistent trend in political opinion exists. OlderCanadians seem less satisfied with a range of political institutions, organizationsand processes than younger Canadians and they appear to hold stronger viewson a number of questions. Yet they are often less likely to want to experimentwith traditional practices and conventions. Younger Canadians appear moreopen to placing restrictions on groups and processes with which they have littleinvolvement, particularly political parties and elections.
If the health of Canadian democracy is in jeopardy, the challenge appearsto come predominantly from the political attitudes of older Canadians and fromthe weak political engagement of those who more recently came of age. In otherwords, although younger Canadians appear to be less politically engaged, thisdisengagement appears less a conscious decision to turn away from politics thana failure to see the importance of political participation, combined perhaps with
32 Enjeux publics Octobre 2001 Vol. 2, no. 5
Brenda O’Neill

33Policy Matters October 2001 Vol. 2, no. 5
a belief that traditional politics may not be providing effective mechanisms fortranslating desire into action. Older Canadians, on the other hand, may be par-ticipating at higher levels, but they are doing so in spite of greater dissatisfactionwith the system overall.
Life Cycle, Generation and Period Effects
This section attempts to determine to what extent three distinct forces – life cycleeffects, generational effects and period effects – may account for the differencesin attitudes and behaviours revealed in the first section of this report.
Life cycle effects consist in differences that stem from the process of aging.As individuals age, their values and life experiences lead them to alter their opin-ions and behaviour so that at any given point in time, a cross-sectional survey ofattitudes will reveal differences across age groups. If older Canadians are less sat-isfied with democracy it may be due simply to the fact that experience breeds dis-satisfaction.
The second force, generational effects, consists in differences in attitudesand behaviours that are due to the sharing of unique common experiences with-in a generational group (or cohort) during youth and early adulthood. Ingleharthas pointed out that post-material (post-war) generations within industrialdemocracies have not experienced war in the same manner as previous genera-tions, and this has translated into enduring, inter-generational differences in polit-ical values, opinions and behaviour. Differences in attitudes across age groups,then, can be the result of changes in the formative experiences of each generation.
The final force, period effects, identifies the possibility that attitudinalchange can occur as a result of shared experiences across all age groups. Wemight expect that all adults in a population, regardless of age, would experiencea similar shift in their attitudes in response to a highly salient political event. Inrecent Canadian history, the passage of the Goods and Services Tax legislation bythe Mulroney government might be one example. The appointment of eightConservative senators based on an obscure provision in the Constitution ensuredthe smooth passage of the legislation through the upper house but met with a sig-nificant level of disapproval among the public; the result might have been anincreased level of cynicism among Canadians of all ages.
In order to distinguish between these three forces, data from two separateperiods are required. The SCD Survey repeated several questions from earliersurveys to allow for just such a comparison. Most are from the 1990 Lortie sur-vey,26 undertaken for the Royal Commission on Electoral Reform and Party
Generational Patterns in the Political Opinions and Behaviour of Canadians

Financing, although an additional item comes from the 1993 Canadian ElectionStudy. Attitudinal and behavioural change over the ten-year period was exam-ined in an effort to disentangle life cycle, generational and period effects. Theresults for those questions that revealed significant attitudinal or behaviouralchange within birth cohorts over the period appear below.
In each case the distribution of responses within a birth cohort is com-pared between the SCD Survey and the earlier survey. Although the labels in thetables for the 2000 data have changed, the categories are nevertheless compara-ble; where the first section broke the 2000 sample into age groups, this sectionreports the same groups by their years of birth, that is, by birth cohort.Respondents from previous surveys are broken down into the same birthcohorts. The 1990 and 2000 survey responses within each birth cohort are thencompared, thus revealing any changes in opinion that may have occurred overthe ten-year period.27 If significant differences in attitudes within each cohort areapparent between the two surveys, the possibility of period and/or life cycleeffects exists. On the other hand, if there is stability within the cohorts, genera-tional effects may be at play.28
Political Interest and ParticipationTable 13 allows for the assessment of the relative influence of life cycle,
generational and period effects on political interest, voting and party member-ship. On the first question, political interest, there exists relatively little changeat the aggregate level between 1990 and 2000: roughly half of all respondents inboth surveys reveal some level of political interest. An assessment of changewithin each birth cohort suggests, however, that life cycle effects are at play onthe question: each cohort reveals an increase in political interest over the 10-yearperiod. As Canadians age, they become more politically interested.
The SCD Survey revealed that younger Canadians were much less likely tovote in federal elections than older Canadians. An examination of responses fromthe 1990 survey suggests the same pattern in voting behaviour across age groupsten years earlier. But something has clearly been changing, as there was a seven per-centage point aggregate drop in reported vote, to 81 percent in 2000 from 88 per-cent in 1990. Closer inspection suggests that this drop is largely the result of gen-erational effects. Every birth cohort but one – 1963-1972 – reveals relative stabili-ty in their voting behaviour. The significant drop in reported voting among theyoungest cohort in 1990 (from 74 percent in 1990 to 69 percent in 2000), com-bined with a drop in the level of voting reported among the incoming generation(74 percent in 1990 compared to only 66 percent in 2000), suggests that the weak-er voter turnout among younger Canadians is not likely to change as they age.
34 Enjeux publics Octobre 2001 Vol. 2, no. 5
Brenda O’Neill

35Policy Matters October 2001 Vol. 2, no. 5
It was also true that younger Canadians in the SCD Survey were less like-ly to have ever joined a political party. Comparing 1990 and 2000 party mem-bership rates reveals a similar trend existed in 1990. The examination of birthcohorts, however, points to considerable increases in the share having been aparty member only among the two oldest generations (1943-1952, and before1943). The incidence of party membership among those born before 1943, forexample, increases by 10 percentage points over the ten-year period. There are,then, life cycle effects at play; as Canadians age, particularly beyond a certain age,they are increasingly likely to have joined a political party. But there is some evi-dence that party membership figures will nevertheless drop over time: the lackof intracohort movement among the youngest cohorts, combined with a sizabledrop in party membership rates in the 2000 data among the entering cohort(1973-1982) suggests that membership numbers will not completely recoverover time. The effects are less apparent now, given the offsetting effects ofincreased participation among the oldest birth cohort. Thus, although moreCanadians are likely to join political parties as they age, the overall rate of par-ticipation may nevertheless decrease over time.
Political Attitudes and BeliefsThe comparison of surveys also allows for an assessment of generational,
life cycle and period effects on a number of political opinions and beliefs held byCanadians. Table 14 compares satisfaction with democracy expressed in the1993 Canadian Election Survey with that expressed in the SCD Survey. This tablediffers from the previous table in that birth cohorts appear in seven-year rather
Generational Patterns in the Political Opinions and Behaviour of Canadians
Political Interest Voting Party Member
Birth Cohort 1990 2000 1990 2000 1990 2000
1973-1982 — 41 — 66 — 21963-1972 45 59 74 69 8 91953-1962 50 58 85 85 15 151943-1952 63 64 93 92 21 26Before 1943 60 68 93 91 23 33Total 56 57 88 81 18 16
Table 13Reported Political Interest, Voting and Party Membership, 1990 to 2000
Note: Entries are percentages of respondents: that follow politics very or fairly closely; that reported having votedin the previous election among eligible voters and having been a member of a political party. The youngest birthgroup in both surveys for reported voting includes only those respondents of voting age at the time of the election(for 2000, N=173 and for 1990, N=437).

than ten-year intervals in order to allow for direct birth cohort comparisonsbetween the two surveys.
An examination of attitudes in the 1993 study reveals little difference insatisfaction with democracy across the cohorts. As such, the existence of anincreased level of satisfaction within almost every birth cohort over the seven-year period, especially within the younger cohorts, suggests a period effect onthis question. Canadians at large have become more satisfied with democracyover the past seven years. Additionally, generational effects may account for partof the pattern revealed in Table 14: members of the older cohorts reveal less inthe way of attitudinal change than do younger cohorts. Moreover, the incominggeneration of Canadians (1976-1982) in 2000 are significantly more satisfiedwith democracy than the incoming generation (1969-1975) was in 1993.
It was reported earlier that some differentiation appears across age groupsin reported levels of political efficacy, cynicism and populism. Table 15 comparessurvey data from 1990 and 2000 on these three attitudinal dimensions. The com-parison of levels of efficacy exhibited at the aggregate level in 1990 and 2000 (the
36 Enjeux publics Octobre 2001 Vol. 2, no. 5
Brenda O’Neill
Satisfaction with Democracy
Birth Cohort 1993 2000
1976-1982 — 82(172)
1969-1975 67 77(461) (191)
1962-1968 66 76(470) (191)
1955-1961 65 72(646) (198)
1948-1954 66 70(519) (164)
Before 1948 68 68(1,178) (307)
Total 67 74(3,274) (1,223)
Table 14Percentage of Respondents ReportingSatisfaction with Democracy, 1993 to 2000
Note: Question wording: “On the whole, are you very satisfied, fairly satis-fied, not very satisfied or not satisfied at all with the way democracy worksin Canada?”; Sample sizes appear in parentheses; the 1993 CES data isweighted by CPSNWGT1.

37Policy Matters October 2001 Vol. 2, no. 5
first two columns) suggests that Canadians’ sense of powerlessness vis-à-vis thegovernment has increased. The comparison across birth cohorts in each periodsuggests that older Canadians feel less efficacious than younger Canadians,although the trend is not strong and not consistent. An examination of intra-cohort change over the ten-year period reveals that three cohorts possessed sig-nificantly lower levels of political efficacy in 2000 than in 1990, that is, a greatershare of respondents agreed in 2000 with the statement “People like me do nothave much say over what the government does.” Such intracohort change is con-sistent with life cycle effects – as respondents age they are less convinced theycan effect change in government policies – but the magnitude of change is greaterthan would be expected for life cycle effects alone. Hence, period effects – a slightdecline in efficacy across all cohorts – also are likely at play.
The SCD Survey suggests that higher levels of cynicism exist among mid-dle-aged rather than among older or younger Canadians (see column 4 in Table15). Such differentiation does not, however, appear in the 1990 survey data (col-umn 3). A comparison of intracohort change suggests that minor period effectslikely account for the aggregate change in attitudes recorded between the twosurveys. Most cohorts report a significant drop in the share agreeing with thestatement “Those elected to Parliament soon lose touch with the people,” coun-tering the idea that cynicism increases between youth and middle age and thendecreases. Canadians appear to have become less cynical about politicians overthe ten-year period.
The last four columns in Table 15 compare populist attitudes expressed in1990 with those in 2000. On the first question, there is only a relatively minorchange at the aggregate level in the share of respondents agreeing with the state-ment, “The major issues of the day are too complicated for most voters.”Relatively consistent attitudes within each cohort suggest little change betweenthe two surveys except within the oldest cohort: while 64 percent of respondentsagreed with the statement in 1990, only 51 percent did so in 2000. It seems olderCanadians have become more populist. Intracohort movement comparisonsbetween the two surveys on the second populism question reveals a similarresult: Canadians in every cohort reveal relatively consistent populist attitudes,except for a modest increase in sentiment within one cohort (1953-1962).
Evidence from the SCD Survey suggested a decreasing level of satisfactionwith elections among older age groups, a trend repeated in the 1990 Lortie data(Table 16). An examination of intracohort change suggests, however, that more isgoing on than simple life cycle effects: every cohort exhibits an increase in satisfac-tion with federal elections, particularly the 1963-1972 and pre-1943 cohorts.Thus, while Canadians do appear to become less satisfied with elections over their
Generational Patterns in the Political Opinions and Behaviour of Canadians

38 Enjeux publics Octobre 2001 Vol. 2, no. 5
Brenda O’Neill
Th
ose
elec
ted
to
Not
mu
ch s
ay o
ver
wh
atP
arli
amen
t so
onIs
sues
too
com
pli
cate
dSo
lve
big
pro
blem
sgo
vern
men
t d
oes
lose
tou
chfo
r m
ost
vote
rsat
th
e gr
assr
oots
lev
el
Bir
th C
ohor
t19
9020
0019
9020
0019
9020
0019
9920
00
1973
-198
2—
58—
71—
52—
7819
63-1
972
5565
7975
5349
7882
1953
-196
257
6779
8153
4868
7719
43-1
952
5669
7870
4953
7075
Bef
ore
1943
6561
8067
6451
7776
Tota
l59
6479
7356
5073
78
Tabl
e 15
Eff
icac
y, C
ynic
ism
and
Pop
ulis
m, 1
990
to 2
000
Not
e: E
ntri
es a
re p
erce
ntag
es o
f re
spon
dent
s w
ho s
tron
gly
or s
omew
hat
agre
ed (
2000
) or
bas
ical
ly a
gree
d (1
990)
to
the
follo
win
g st
atem
ents
: “T
he m
ajor
iss
ues
of t
he d
ay a
re t
oo c
om-
plic
ated
for
mos
t vot
ers,
” “W
e co
uld
prob
ably
sol
ve m
ost o
f our
big
nat
iona
l pro
blem
s if
deci
sion
s co
uld
be b
roug
ht b
ack
to th
e pe
ople
at t
he g
rass
root
s le
vel,”
“T
hose
ele
cted
to P
arlia
men
tso
on lo
se t
ouch
wit
h th
e pe
ople
,” a
nd “
Peop
le li
ke m
e do
not
hav
e m
uch
say
over
wha
t th
e go
vern
men
t do
es.”

39Policy Matters October 2001 Vol. 2, no. 5
life cycle, this effect was offset by an overall increase in Canadians’ satisfaction overthe ten-year period. This period effect is evident in the nine-percentage-point jumpin satisfaction recorded at the aggregate level between 1990 and 2000.
Asking Canadians to render an opinion on the first-past-the-post electoralsystem, however, presents somewhat more troubling results. There are few age-relat-ed differences on this item in either the 1990 or the 2000 survey. But an examina-tion of intracohort change suggests the existence of a strong period effect: each birthcohort shows a significant drop in the share of respondents agreeing that the elec-toral system’s distortion of the seats-to-votes ratio is acceptable. This result is rein-forced by the shift in opinion among the incoming generation in each survey: in1990, 43 percent of the youngest generation saw the system as acceptable; in 2000,only 35 percent did. Thus, Canadians have become more satisfied with electionsoverall, but they have become less convinced of the electoral system’s legitimacy.
Both the belief that those with money unfairly influence government andthe belief that winning elections is partly determined by the amount of money aparty spends were found to increase slightly with age in the SCD Survey. Table 17compares these survey results with data from the 1990 Lortie survey. The first twocolumns in the table report results for attitudes on the influence of money overgovernment; the last two columns report results for the influence of money overelections. On the first question, there is little in the way of age differences in the1990 data. But an examination of intracohort change reveals the existence of aslight period effect: between 1990 and 2000, an increase is recorded within eachcohort in the share of respondents agreeing with the statement, “People withmoney have a lot of influence over the government,” although the size of the
Generational Patterns in the Political Opinions and Behaviour of Canadians
Satisfaction with elections Fairness of electoral system
Birth Cohort 1990 2000 1990 2000
1973-1982 — 81 — 351963-1972 69 79 43 291953-1962 67 68 40 261943-1952 62 66 40 30Before 1943 60 72 42 32Total 64 73 41 30
Table 16Satisfaction with Elections and the Fairness of the Electoral System,1999 to 2000
Note: Entries are percentages reporting that they are very or fairly satisfied with the way federal elections work inCanada and those that reported that the electoral systems distortion of seats to votes ratio was acceptable.

changes varies significantly. Canadians of all ages have become increasingly cyni-cal about the unfair advantage accorded those with money in Canadian politics.
A much stronger period effect is suggested by intracohort change on thesecond question. The comparison suggests that while minor life cycle effects existon this question in both surveys (agreement increases slightly with age group),these are swamped by the substantially increased share of respondents withineach cohort agreeing that campaign spending provides an unfair advantage tosome parties. Thus, although Canadians become somewhat more cynical on thiselement of democracy over the life cycle, events between these two surveysappear to have led all Canadians to become significantly more skeptical.
Table 18 reports on changes in attitudes toward federal parties over the ten-year period. An examination of responses in each survey reveals a slight increase inagreement with the statement, “All parties are basically the same; there really isn’ta choice,” across older age groups. Intracohort comparison suggests that life cycleeffects do indeed exist: every cohort reveals an increase in the share agreeing withthe statement over the ten-year period, a change that brings each cohort closer inattitude to the equivalent age group ten years earlier. Yet the changes in attitudeswithin each cohort are much larger than would be predicted by life cycle effectsalone. While only 10 percentage points separate the attitudes of the youngest andoldest birth cohorts in 2000, the 1963-1972 cohort alone experiences a 17-per-centage-point increase in the share agreeing with the statement. Thus, as they age,Canadians appear to become more cynical about the effective choice afforded bypolitical parties, and Canadians of all ages are becoming more cynical.
40 Enjeux publics Octobre 2001 Vol. 2, no. 5
Brenda O’Neill
Money and Government Money and Elections
Birth Cohort 1990 2000 1990 2000
1973-1982 — 86 — 611963-1972 83 93 35 661953-1962 88 91 38 631943-1952 87 96 37 68Before 1943 83 90 41 67Total 85 91 38 65
Table 17Money’s Influence over Government and Elections, 1990 to 2000
Note: Entries are percentages of respondents who strongly or somewhat agreed (2000) or basically agreed (1990)to the following statements: “People with money have a lot of influence over the government” and “The party thatspends the most during the election is almost sure to win the election.”

41Policy Matters October 2001 Vol. 2, no. 5
Conclusion
Comparing changes in behaviour and opinion between 1990 and 2000 suggests amix of effects working on the subset of attitudinal and behavioural measures avail-able for comparison. Among the findings, the more marked include the following:
• Over the life cycle, Canadians develop a greater interest in politics andbecome increasingly likely to participate in political parties, but this isaccompanied by a host of increasingly negative political evaluations,including a greater sense of political inefficacy, increased cynicism regard-ing political parties and the role of money in elections, and less satisfac-tion with democracy, elections and the electoral system in particular.
• Substantial period effects between 1990 and 2000 include an overallincrease in satisfaction with democracy, federal elections and in populistsentiment, a decrease in political cynicism and political efficacy, a decreasedwillingness to accept the electoral system’s distorting effects, increased cyn-icism regarding the influence of money in politics, and heightened dissatis-faction with the effective choice provided by existing political parties.
• Generational effects are evident, suggesting that today’s youngerCanadians are participating at lower levels than previously recorded bothin elections and with political parties.
What do these results portend for the future of Canadian democracy? Themost worrying trend is the increased political disengagement apparent among
Generational Patterns in the Political Opinions and Behaviour of Canadians
All federal parties are basically the same
Birth Cohort 1990 2000
1973-1982 — 481963-1972 41 581953-1962 48 611943-1952 48 56Before 1943 50 58Total 47 56
Table 18Attitudes Toward Federal Political Parties, 1990 to 2000
Note: Entries are percentage of respondents who strongly or somewhat agreed(2000) or basically agreed (1990) to the following statements: “All federal parties arebasically the same; there really isn’t a choice.”

younger Canadians, a trend unlikely to be overcome as they age because it isrooted in generational effects. If the legitimacy of a democratic political systemrests on the number of citizens who participate in its elections, then Canadiandemocracy is in some danger. And although less central perhaps to the successof the democratic enterprise, decreasing involvement with political partiesamong younger Canadians should similarly raise concerns. There is some evi-dence, however, that younger Canadians are turning instead to alternative polit-ical groups and organizations, which cushions these conclusions somewhat.While we lack a 1990-2000 comparison on this measure, we do know from theSCD Survey that the relative propensity to participate in interest groups versuspolitical parties is much higher among younger Canadians.
Evidence that the more negative opinions expressed by older Canadians ona number of issues is due partly to life cycle effects suggests a natural cycle ofopinion that Canadians of all generations move through as they age. But thesefindings are greatly overshadowed by the findings of changing opinion andbehaviour among all Canadians over the period, evidence that points toincreased cynicism on several political questions. Most notable here are attitudeson the electoral system, political parties and the influence of money in politics.
Canadian governments would do well to address these findings, both byincreasing dialogue with Canadians generally and by implementing measuresdesigned to increase political participation among Canadian youth. The lattermight prove more difficult, inasmuch as withdrawal from politics amongyounger Canadians seems to originate more in political apathy than in politicaldisaffection; it will require the federal and provincial governments to make a con-certed effort to convince young Canadians of the importance and the necessity oftheir participation in the democratic process. It is a significant undertaking, butone that is crucial to maintaining the vitality of Canadian democracy.
42 Enjeux publics Octobre 2001 Vol. 2, no. 5
Brenda O’Neill

43Policy Matters October 2001 Vol. 2, no. 5
1 See David Foot, Boom, Bust and Echo:
How to Profit from the Coming
Demographic Shift (Toronto: Macfarlane
Walter & Ross, 1996) and Michael
Adams, Sex in the Snow: Canadian Social
Values at the End of the Millennium
(Toronto: Penguin Group, 1997).
2 See Ronald Ingelhart, Culture Shift in
Advanced Industrial Society (Princeton:
Princeton University Press, 1990) and
more recently, Neil Nevitte, The Decline
of Deference (Peterborough: Broadview
Press, 1996).
3 See Robert D. Putnam, Bowling Alone:
The Collapse and Revival of American
Community (New York: Simon and
Schuster, 2000).
4 The response rate for the survey was 60
percent. Using standard methods of calcu-
lation, results for the full sample of 1,278
respondents are considered accurate with-
in 2.7 percent nineteen times out of twen-
ty; for sub-samples, the margin of error is
greater. Full technical details can be found
in Appendix A of Paul Howe and David
Northrup, “Strengthening Canadian
Democracy: The Views of Canadians,”
Policy Matters, Vol. 1, no. 5 (July 2000).
5 Among marketers, for example, the birth
years that make up Baby Boomers,
Generation X and Y groups differ
depending on the source.
6 The minimum age for respondents in the
SCD Survey is 18 (born before 1982) given
that 18 is the minimum age for voting.
7 The sample size for each age group is: 18-
27: N=273, 28-37: N=275, 38-47: N=285,
48-57: N=228, and over 57: N=212.
Group sample sizes vary slightly by ques-
tion due to missing values; tables will indi-
cate when this deviation in substantial.
8 See A Survey of Attitudes Towards Electoral
Reform (1990) [hereinafter Lortie
Commission survey]. Principal investiga-
tors: André Blais and Elisabeth Gidengil.
Funded by Royal Commission on
Electoral Reform and Party Financing,
carried out by Institute for Social
Research. A comprehensive analysis of the
results of this survey can be found in
André Blais and Elisabeth Gidengil,
Making Representative Democracy Work:
The Views of Canadians, Vol. 17 of the
research studies commissioned by the
Royal Commission on Electoral Reform
and Party Financing (Toronto: Dundurn
Press, 1991). The 1993 Canadian
Election Study Team included Richard
Johnston, André Blais, Henry Brady,
Elisabeth Gidengil and Neil Nevitte. The
survey was funded by the Social Sciences
and Humanities Research Council of
Canada and carried out by the Institute
for Social Research, York University. None
of the above are responsible for the analy-
ses and interpretations presented here.
9 Change in the turnout rate at the aggre-
gate level could nevertheless occur as a
result of changes in age distribution
resulting from differences in the total
population within each cohort over time.
10 The percentages in every table are based
on the sample size for each age group
with all Don’t Know and Refused
responses excluded. Instances in which
significant variation in these two
response categories appears across age
groups will be identified for the reader.
11 The Pearson correlation for voting and
the importance a respondent assigns to
voting is a moderate 0.30.
12 A similar pattern appears when respon-
dents are asked about their satisfaction
with “government” and “politics” rather
than with “democracy,” although the
share expressing some level of satisfac-
tion falls in every age category with each
subsequent replacement.
13 The Pearson correlation between the two
questions is 0.02.
14 This issue was addressed by the Lortie
Commission in 1990, and the recent
leadership contest within the Canadian
Alliance has maintained interest in the
Notes

subject in light of concerns over the
bulk purchase and distribution of party
memberships and significant differences
between candidates’ campaign budgets.
15 This pessimism is combined with a
belief that there is little hope that any-
thing can be done about it within elec-
tion campaigns. The Pearson correlation
between beliefs on campaign spending’s
influence and the ability to control par-
ties’ expenditures is 0.30.
16 For this question the SCD Survey
employed two question and response
wording experiments to assess the effect
of wording on opinion for this issue.
These changes had relatively little effect
on the distribution of responses.
Combined with the fact that the already
small sample sizes for each of the varia-
tions became increasingly small when
broken down by age group, the minimal
effect of question rewording justified the
collapsing of results for the question ver-
sions shown in Figure 4. See Paul Howe
and David Northrup, “Strengthening
Canadian Democracy: The Views of
Canadians,” Policy Matters, Vol. 1, no. 5
(July 2000).
17 The non-response rate appears some-
what related to age: the highest non-
response rate, 39 percent, appears
among the youngest age group and
decreases steadily to a low of 15 percent
among the 48-57 group. The pattern
ends there, however, as the over-57
group records a non-response rate of 27
percent on this question.
18 A slight age pattern in non-response was
evident in responses to the referendums
on tax increases, social spending and
land claims agreement questions. In each
of these cases, the rate of non-response
increased slightly with age.
19 The pattern of non-responses found in
the previous referendum question is
replicated on moral issues; while only
three percent of respondents in the 18-
27 group did not respond to the abor-
tion question, 14 percent of the over-57
group failed to respond.
20 Mirror representation exists in the legis-
lature if the descriptive characteristics of
its members closely match those of the
public from which they were drawn. See
Anne Phillips, Engendering Democracy
(University Park, PA: Pennsylvania State
University Press, 1991). For an example
of the debate surrounding Chrétien’s
decision to appoint women candidates in
the 1997 election see Allan Chambers,
“Alberta Liberals meet Chrétien’s quota
for women,” Edmonton Journal, March
18, 1997, p. A3.
21 Like the question on general satisfaction
with elections, a significant proportion
within each age group does not render
an opinion on the issue (between 24 and
27 per cent) although there exists little
in the way of a generational pattern in
non-responses.
22 Respondents to the under-representation
of women question (half the survey sam-
ple) were then randomly divided into
two groups to receive one of two follow-
up questions on this issue. The first
group was asked whether they would
support or oppose the requirement that
parties choose as many female as male
candidates during elections. The second
group was asked their opinion on a
weaker option of requiring parties to
choose more female candidates than they
do now. Given the small sample sizes for
the breakdown by age group, responses
to these two questions were combined.
23 A slight pattern in non-response exists
on this question: slightly more than one
in ten respondents in the 18-27 group
did not offer an opinion on this ques-
tion; this share increased steadily with
age to almost one in five in the over-57
group.
24 Merging the responses to the three ques-
tions runs the risk of concealing varia-
44 Enjeux publics Octobre 2001 Vol. 2, no. 5
Notes

45Policy Matters October 2001 Vol. 2, no. 5
tions in responses within each, but this
is more than offset by the statistical con-
fidence gained in the results by the
increased sample size for each age
group.
25 A significant number in each age group
offer no response to this question and
there is a pattern of non-response across
the groups. While eight percent of
respondents in the 18-27 group did not
respond, this share increases to 22 per-
cent in the over-57 group.
26 The sample sizes for the birth cohorts in
the Lortie data are as follows: 1963-1972
N=523; 1953-1962 N=727; 1943-1952
N=637; Before 1943 N=992. The data
are weighted by the National Household
Weight included in the data set. Tables
will identify when sample sizes deviate
significantly from those reported here.
27 Panel data, in which the same respon-
dents are interviewed at different points
in time, would be preferable to compar-
ing different samples from the same pop-
ulation over time. Unfortunately such
data are unavailable.
28 For a discussion of the difficulties in try-
ing to disentangle cohort, life cycle and
period effects see Norval D. Glenn,
Cohort Analysis (Beverly Hills: Sage
Publications, 1977).
Notes

46 Enjeux publics Octobre 2001 Vol. 2, no. 5
Notes
IRPP Research StaffHugh Segal (president)Geneviève BouchardSarah FortinDaniel SchwanenFrance St-Hilaire
Vice-President, OperationsSuzanne Ostiguy McIntyre
Research AssistantBrian Fitzgerald
ProductionChantal Létourneau
DesignSchumacher Design
PrintingAGMV Marquis
IRPP1470 Peel Street, Suite 200Montreal, Québec H3A 1T1Telephone: 514-985-2461Fax: 514-985-2559E-mail: [email protected] site: www.irpp.org

47Policy Matters October 2001 Vol. 2, no. 5
Other Related Publications from IRPP:
Jennifer Smith and Herman Bakvis, “Changing Dynamics in Election CampaignFinance: Critical Issues in Canada and United States,” Policy Matters, Vol. 1,no. 4 (July 2000).
Paul Howe and David Northrup, “Strengthening Canadian Democray: TheViews of Canadians,” Policy Matters, Vol. 1, no. 5 (July 2000).
Richard Johnston, “Canadian Elections at the Millennium,” Choices, Vol. 6, no. 6 (September 2000).
Peter Dobell, “What Could Canadians Expect from a Minority Government?”Policy Matters, Vol. 1, no. 6 (November 2000).
Peter Dobell, « À quoi les Canadiens peuvent-ils s’attendre advenant un gouvernement minoritaire ? », Enjeux publics, Vol. 1, no 6 (f), novembre 2000.
Peter Dobell, “Reforming Parliamentary Practice: The Views of MPs,” PolicyMatters, Vol. 1, no. 9 (December 2000).
Peter Dobell, « La réforme de la procédure parlementaire : Le point de vue desdéputés », Enjeux publics, vol. 1, no 9 (f), décembre 2000.
Jerome H. Black, “The National Register of Electors: Raising Questions Aboutthe New Approach to Voter Registration in Canada,” Policy Matters, Vol. 1, no. 10 (December 2000).
Louis Massicotte, “Changing the Canadian Electoral System,” Choices, Vol. 7,no. 1 (February 2001).
Louis Massicotte, « Pour une réforme du système électoral canadien », Choix,vol. 7, no 1 (f), février 2001.
Donald E. Blake, “Electoral Democracy in the Provinces,“ Choices, Vol. 7, no. 2(March 2001).
Matthew Mendelsohn and Andrew Parkin, “Introducing Direct Democracy inCanada,” Choices, Vol. 7, no. 5 (June 2001).
Henry Milner, “Civic Literacy in Comparative Context: Why Canadians ShouldBe Concerned,” Policy Matters, Vol. 2, no. 2 (July 2001).
Peter Dobell, “Parliamentary Secretaries: The Consequences of ConstantRotation,” Policy Matters, Vol. 2, no. 4 (September 2001).

48 Enjeux publics Octobre 2001 Vol. 2, no. 5
Founded in 1972, the Institute for Research on Public Policy is anindependent, national, nonprofit organization.
IRPP seeks to improve public policy in Canada by generating research,providing insight and sparking debate that will contribute to the publicpolicy decision-making process and strengthen the quality of the publicpolicy decisions made by Canadian governments, citizens, institutions and organizations.
IRPP's independence is assured by an endowment fund, to which federaland provincial governments and the private sector have contributed.
••••••
F ondé en 1972, l’Institut de recherche en politiques publiques (IRPP)est un organisme canadien, indépendant et sans but lucratif.
L’IRPP cherche à améliorer les politiques publiques canadiennes en encou-rageant la recherche, en mettant de l’avant de nouvelles perspectives et ensuscitant des débats qui contribueront au processus décisionnel en matièrede politiques publiques et qui rehausseront la qualité des décisions queprennent les gouvernements, les citoyens, les institutions et les organismescanadiens.
L’indépendance de l’IRPP est assurée par un fonds de dotation, auquel ontsouscrit le gouvernement fédéral, les gouvernements provinciaux et lesecteur privé.