bridge foundation piles in varved glaciolacustrine
TRANSCRIPT

Missouri University of Science and Technology Missouri University of Science and Technology
Scholars' Mine Scholars' Mine
International Conference on Case Histories in Geotechnical Engineering
(2013) - Seventh International Conference on Case Histories in Geotechnical Engineering
02 May 2013, 2:00 pm - 3:30 pm
Bridge Foundation Piles in Varved Glaciolacustrine Deposits Bridge Foundation Piles in Varved Glaciolacustrine Deposits
Exhibiting Very High Soil Setup Exhibiting Very High Soil Setup
Gregory R. Reuter American Consulting Services, Inc., St. Paul, MN
Follow this and additional works at: https://scholarsmine.mst.edu/icchge
Part of the Geotechnical Engineering Commons
Recommended Citation Recommended Citation Reuter, Gregory R., "Bridge Foundation Piles in Varved Glaciolacustrine Deposits Exhibiting Very High Soil Setup" (2013). International Conference on Case Histories in Geotechnical Engineering. 6. https://scholarsmine.mst.edu/icchge/7icchge/session02/6
This work is licensed under a Creative Commons Attribution-Noncommercial-No Derivative Works 4.0 License.
This Article - Conference proceedings is brought to you for free and open access by Scholars' Mine. It has been accepted for inclusion in International Conference on Case Histories in Geotechnical Engineering by an authorized administrator of Scholars' Mine. This work is protected by U. S. Copyright Law. Unauthorized use including reproduction for redistribution requires the permission of the copyright holder. For more information, please contact [email protected].

Paper No. 2.32 1
BRIDGE FOUNDATION PILES IN VARVED GLACIOLACUSTRINE DEPOSITS EXHIBITING VERY HIGH SOIL SETUP
Gregory R. Reuter, PE, PG, D.GE American Consulting Services, Inc., St. Paul, Minnesota, 55114, USA ABSTRACT A pile-supported bridge was to be constructed at a site in Vadnais Heights, Minnesota, located north of St. Paul, in an area underlain by a significant deposit of glaciolacustrine sand, silt, and clay, which extended to a depth of about 39 m. For the geotechnical analysis, the conventional soil borings were supplemented by performing seismic piezocone (SCPTu) soundings. At the beginning of bridge construction, test piles were driven which experienced unusually easy driving to the termination depths of 38.4 to 40.2 m. High strain dynamic testing was used during pile installation and during restrike. After only a 2-day waiting period, the pile resistance increased over 300% through soil setup. The SCPTu data were used to evaluate the pile resistance, and the total pile capacity was evaluated by various CPT/CPTu methods. The predicted results are compared to the test pile results.
INTRODUCTION A portion of County State Aid Highway 6 was to be realigned in the city of Vadnais Heights, Minnesota, about 14 km north of downtown St. Paul. The realignment followed the shoreline of Vadnais Lake where up to 8.2 m of fill was to be placed with the intent of constructing a mechanically stabilized earth (MSE) wall to retain the fill. Stability analyses indicated, however, that due to the presence of soft underlying soils, staged construction would be required to strengthen the foundation soils or the foundation soils would require strengthening by artificial ground improvement methods. Another option would have been to incorporate a substantial amount of lightweight fill in the embankment construction. After many discussions with the client, it was decided to abandon the MSE embankment scheme, and support the roadway through the problematic soils by the construction of a land bridge supported on driven piles, which would shorten the construction schedule and considerably reduce the risk for post-construction settlement and stability problems. The bridge is a five-span, pre-stressed concrete beam structure, consisting of two, pile-supported abutments and four, pile bent piers. The bridge has an out to out length of 114.25 m. The piers are supported on five to seven- 406 mm diameter steel pipe piles. The abutments are supported on 305 mm diameter steel pipe piles.
GEOLOGY AND SOIL CONDITIONS Geologic Setting The project site is underlain by soils that were deposited primarily by glacial ice and meltwater during the last glaciation (the Wisconsinan Stage) of the Pleistocene Epoch. The last ice sheet, the Grantsburg Sublobe, advanced into the area about 16,000 to 12,000 years ago (Patterson, 1992). Meltwater from the wasting of the ice sheet inundated the landscape forming outwash plains and broad, shallow lakes.
Fig. 1. SCPTu testing at the project site.

Paper No. 2.32 2
Fig. 2. SCPTu sounding results showing tip resistance, qt, sleeve friction, fs, penetration pore pressure, u2, along with the hydrostatic pressure (dashed line), and seismic shear wave velocity, Vs.
Subsurface Exploration The subsurface exploration at the site consisted of conventional soil borings and seismic piezocone penetration tests (SCPTu). Soil sampling in the borings was performed with a split-barrel sampler by the Standard Penetration Test. Thin-walled tube samples were also obtained for laboratory consolidation and direct simple shear testing. The piezocone soundings were conducted using a 15-cm2 conical tip penetrometer, which was advanced by a dedicated 200 kN SCPTu truck (Fig.1). Figure 2 presents measured SCPTu values of tip resistance, qt, sleeve friction, fs, and penetration pore pressure, u2. Down hole seismic shear wave velocities, Vs, were also measured at regular depth intervals during advancement of the piezocone. The borings and SCPTu testing found that the site is overlain by a deep deposit of glaciolacustrine soil which extended to a depth of about 39 m. These soils were composed of an upper 7.5 m of glacial lake sand overlying about 17 m of rhythmically deposited, varved sand, silt, and lean clay. The tested clay samples had liquid limits ranging from 23% to 33%, with moisture contents 1 to 11 percentage points higher than the liquid limit. Liquidity indices ranged from 1.06 to 1.83, suggesting that some of these soils are sensitive. Laboratory consolidation tests found the clay to be normally to slightly overconsolidated. Below a depth of 24.5 m a deposit of varved glaciolacustrine lean to fat clay and silt was present that extended to a depth of 38 m. These soils were underlain by an approximately 1 m thick sand stratum which was in turn underlain by clayey glacial till. Bedrock was not encountered
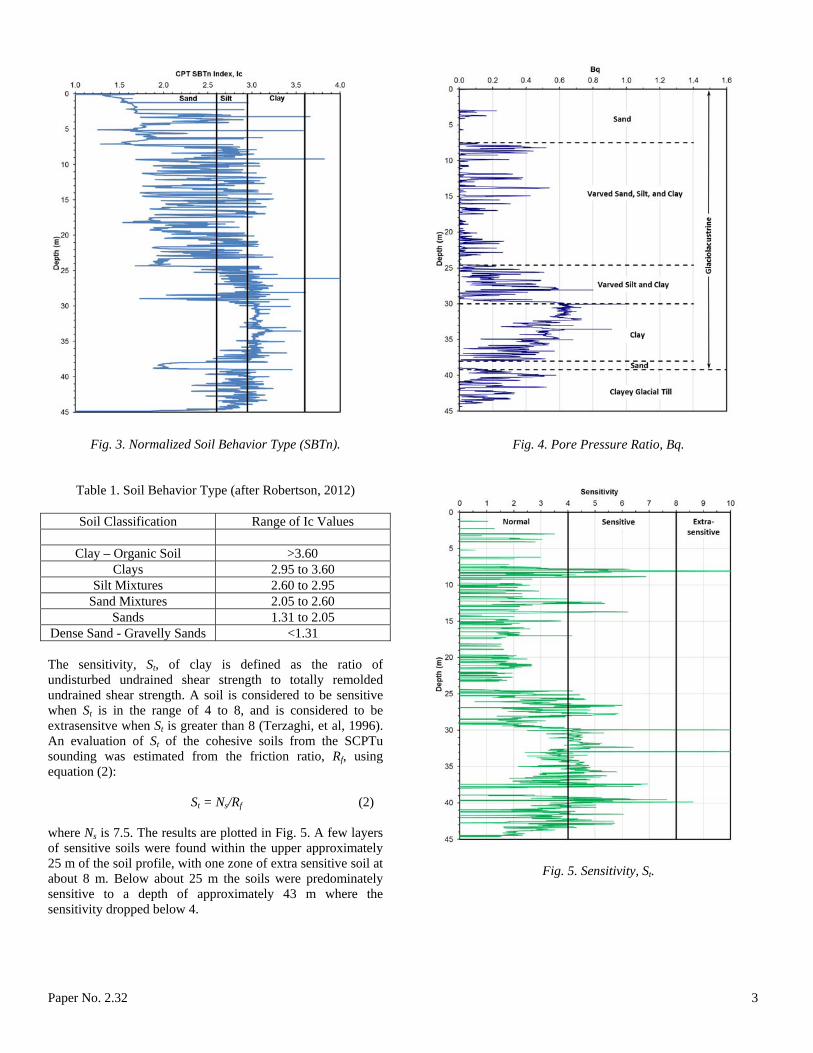
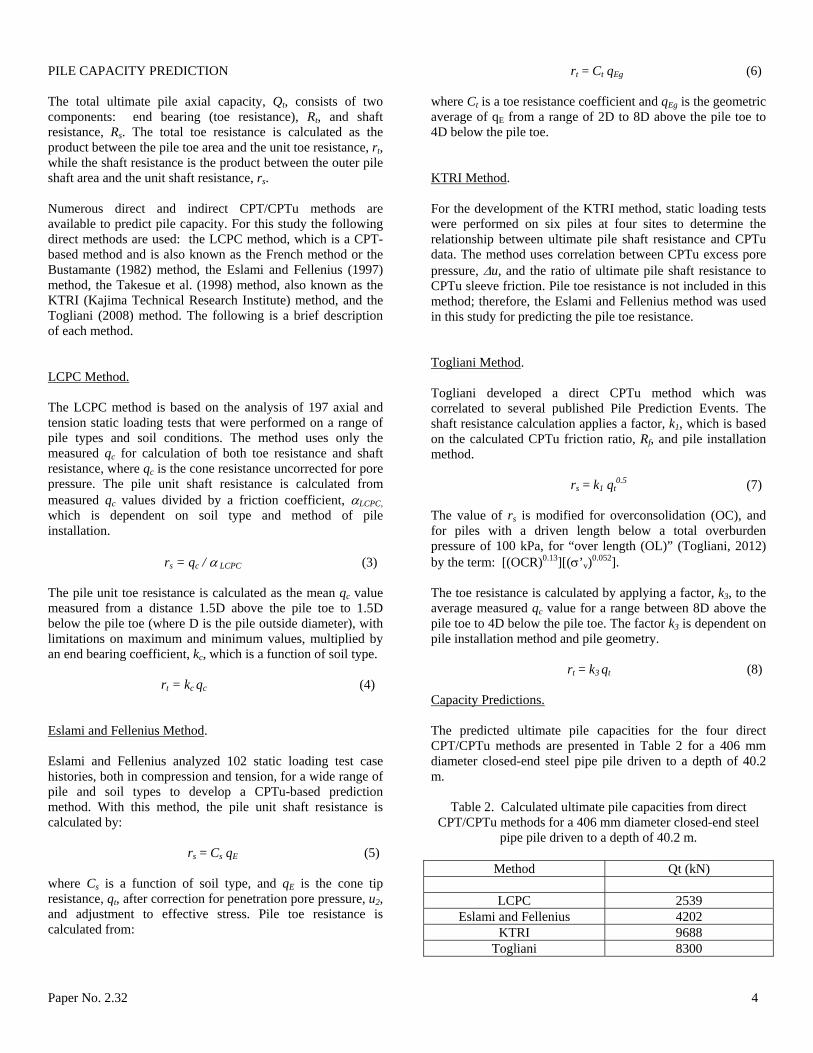
during the subsurface explorations, but is believed to be Early Ordovician Age sedimentary dolostone and sandstone of the Prairie du Chien Formation present at a depth in excess of 60 m below grade. SCPTu Data Interpretation The SCPTu data, particularly qt and u2, clearly show the varved nature of the glaciolacustrine soils at this site. Vs varied slightly, between 200 and 300 m/s, within the glaciolacustrine soils, but increased to about 400 m/s in the underlying glacial till. Piezocone testing does not collect soil samples for visual classification. Soil classification is based on the response of the cone to the in-situ mechanical behavior of the soil, producing a Soil Behavior Type (SBT). There are numerous methods to describe SBT. The Normalized SBT index, Ic, for the soils at this site, using a method proposed by Robertson and Wride (1998), is presented in Fig. 3. Empirical correlations between soil type and Ic are presented in Table 1. Fig. 3 further shows the varved nature of the glaciolacustrine soils. To further aid in delineating the various soil strata, a plot of the pore pressure parameter ratio, Bq, with depth is presented in Fig. 4, in which Bq is defined as: Bq = (u2 – u0) / (qt – vo) (1) where u0 is the in-situ equilibrium water pressure and vo is the in-situ total vertical stress. The measured penetration pore pressure generated during advancement of the cone was high, particularly within the lower glaciolacustrine soils.
Paper No. 2.32 3
Fig. 3. Normalized Soil Behavior Type (SBTn).
Table 1. Soil Behavior Type (after Robertson, 2012)
Soil Classification Range of Ic Values
Clay – Organic Soil >3.60 Clays 2.95 to 3.60
Silt Mixtures 2.60 to 2.95 Sand Mixtures 2.05 to 2.60
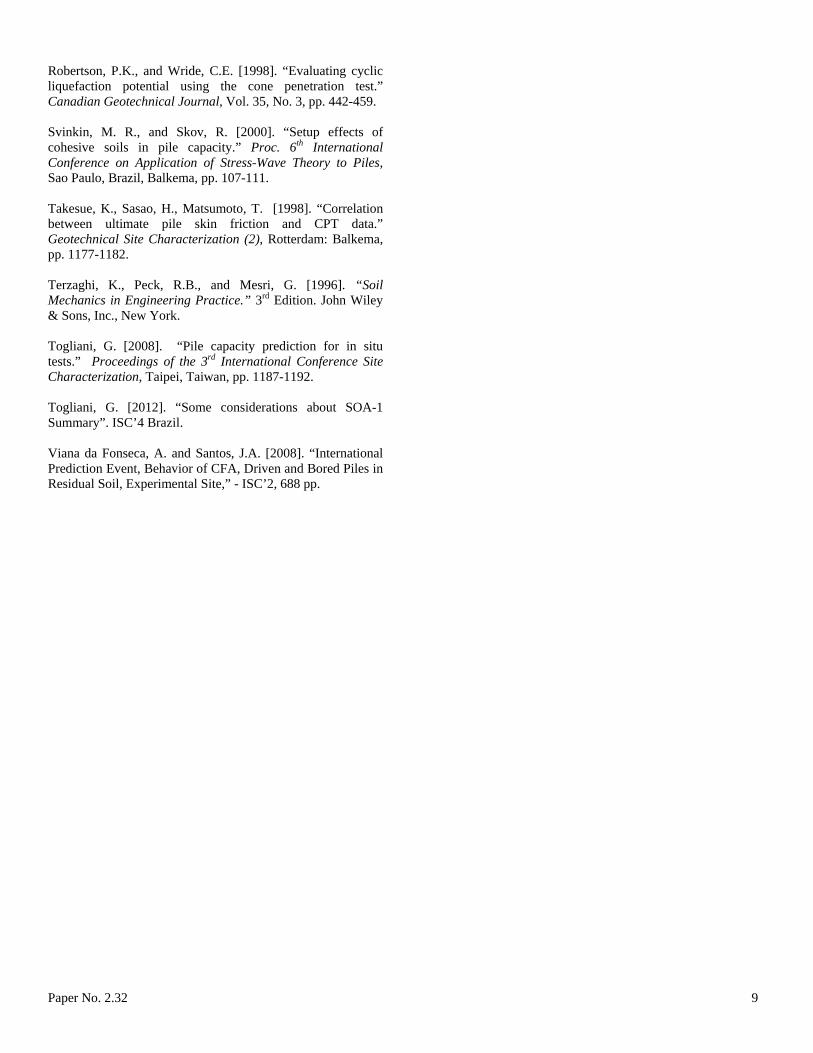
Sands 1.31 to 2.05 Dense Sand - Gravelly Sands <1.31 The sensitivity, St, of clay is defined as the ratio of undisturbed undrained shear strength to totally remolded undrained shear strength. A soil is considered to be sensitive when St is in the range of 4 to 8, and is considered to be extrasensitve when St is greater than 8 (Terzaghi, et al, 1996). An evaluation of St of the cohesive soils from the SCPTu sounding was estimated from the friction ratio, Rf, using equation (2): St = Ns/Rf (2) where Ns is 7.5. The results are plotted in Fig. 5. A few layers of sensitive soils were found within the upper approximately 25 m of the soil profile, with one zone of extra sensitive soil at about 8 m. Below about 25 m the soils were predominately sensitive to a depth of approximately 43 m where the sensitivity dropped below 4.
Fig. 4. Pore Pressure Ratio, Bq.
Fig. 5. Sensitivity, St.
Paper No. 2.32 4
PILE CAPACITY PREDICTION The total ultimate pile axial capacity, Qt, consists of two components: end bearing (toe resistance), Rt, and shaft resistance, Rs. The total toe resistance is calculated as the product between the pile toe area and the unit toe resistance, rt, while the shaft resistance is the product between the outer pile shaft area and the unit shaft resistance, rs. Numerous direct and indirect CPT/CPTu methods are available to predict pile capacity. For this study the following direct methods are used: the LCPC method, which is a CPT-based method and is also known as the French method or the Bustamante (1982) method, the Eslami and Fellenius (1997) method, the Takesue et al. (1998) method, also known as the KTRI (Kajima Technical Research Institute) method, and the Togliani (2008) method. The following is a brief description of each method. LCPC Method. The LCPC method is based on the analysis of 197 axial and tension static loading tests that were performed on a range of pile types and soil conditions. The method uses only the measured qc for calculation of both toe resistance and shaft resistance, where qc is the cone resistance uncorrected for pore pressure. The pile unit shaft resistance is calculated from measured qc values divided by a friction coefficient, LCPC, which is dependent on soil type and method of pile installation. rs = qc / LCPC (3) The pile unit toe resistance is calculated as the mean qc value measured from a distance 1.5D above the pile toe to 1.5D below the pile toe (where D is the pile outside diameter), with limitations on maximum and minimum values, multiplied by an end bearing coefficient, kc, which is a function of soil type. rt = kc qc (4) Eslami and Fellenius Method. Eslami and Fellenius analyzed 102 static loading test case histories, both in compression and tension, for a wide range of pile and soil types to develop a CPTu-based prediction method. With this method, the pile unit shaft resistance is calculated by: rs = Cs qE (5) where Cs is a function of soil type, and qE is the cone tip resistance, qt, after correction for penetration pore pressure, u2, and adjustment to effective stress. Pile toe resistance is calculated from:
rt = Ct qEg (6) where Ct is a toe resistance coefficient and qEg is the geometric average of qE from a range of 2D to 8D above the pile toe to 4D below the pile toe. KTRI Method. For the development of the KTRI method, static loading tests were performed on six piles at four sites to determine the relationship between ultimate pile shaft resistance and CPTu data. The method uses correlation between CPTu excess pore pressure, u, and the ratio of ultimate pile shaft resistance to CPTu sleeve friction. Pile toe resistance is not included in this method; therefore, the Eslami and Fellenius method was used in this study for predicting the pile toe resistance. Togliani Method. Togliani developed a direct CPTu method which was correlated to several published Pile Prediction Events. The shaft resistance calculation applies a factor, k1, which is based on the calculated CPTu friction ratio, Rf, and pile installation method. rs = k1 qt
0.5 (7) The value of rs is modified for overconsolidation (OC), and for piles with a driven length below a total overburden pressure of 100 kPa, for “over length (OL)” (Togliani, 2012) by the term: [(OCR)0.13][(’v)
0.052]. The toe resistance is calculated by applying a factor, k3, to the average measured qc value for a range between 8D above the pile toe to 4D below the pile toe. The factor k3 is dependent on pile installation method and pile geometry. rt = k3 qt (8) Capacity Predictions. The predicted ultimate pile capacities for the four direct CPT/CPTu methods are presented in Table 2 for a 406 mm diameter closed-end steel pipe pile driven to a depth of 40.2 m.
Table 2. Calculated ultimate pile capacities from direct CPT/CPTu methods for a 406 mm diameter closed-end steel
pipe pile driven to a depth of 40.2 m.
Method Qt (kN)
LCPC 2539 Eslami and Fellenius 4202
KTRI 9688 Togliani 8300

Paper No. 2.32 5
The predicted capacities varied greatly and ranged from 2539 kN to 9688 kN. The lowest predicted capacity was from the LCPC method. The Eslami and Fellenius, KTRI, and Togliani CPTu methods predicted capacities in a range of 4202 kN to 9688 kN. The highest predicted capacity is by the KTRI method. The average ultimate pile capacity by these later three methods is 7397 kN. The fact that there is a variation in predicted capacities between the four methods is not surprising. Variation is seen with most pile capacity prediction methods, not just at this site, and not just with CPT/CPTu-based methods, as is evident by the many published pile prediction events at other sites (for example, Viana da Fonseca and Santos, 2008). Therefore, local site experience is valuable. An understanding of the difference in results between the four methods at this site can be seen by Table 3 which presents the mean unit shaft resistance and the contribution of the CPTu parameters to the calculated results. Table 3. Contribution of CPTu parameters to shaft resistance
calculations for the four referenced methods.
Method Mean rs
(kPa) CPTu parameter and contribution
LCPC 45 qc (100%) Eslami 67 qE and fs(100%)
Togliani 184 qt (57%), Rf (11%), OCR (11%), OL (21%)
KTRI 142 fs (79%), u2 (21%) The LCPC method is based solely on the measured qc parameter. The Eslami and Fellenius method is based on the calculated qE parameter, and by soil type determined from fs and qE. The Togliani method is largely based on the calculated qt parameter. In contrast, the tip resistance is not used in the KTRI method. The KTRI method is predominantly based on the measured fs, while being strongly influenced by the measured u2. Pore pressure is also utilized in both the Eslami and Fellenius method and the Togliani method, but only for the calculation of qt and qE. The plots of u2 (Fig. 2) and Bq (Fig. 4) show high pore pressures measured during advancement of the cone below depths of about 20 to 25 m into the lower glaciolacustrine soil and upper glacial till. In addition, qt decreases considerably in these soils below a depth of about 24 m. The influence of the large penetration pore water pressures and lower tip resistance in this zone on the capacity calculations is evident by an examination of Fig. 6 which presents the calculated shaft resistance distribution with depth for each of the CPT/CPTu capacity prediction methods. All four methods predicted a similar toe resistance, as presented in Fig. 6, therefore the total capacity differences lie with the predicted shaft resistance. As can be seen, the curvature of the resistance distribution for the LCPC, Eslami and Fellenius, and Togliani methods changes noticeably below about 20 to 25 m, corresponding to the
depths where the lower qt and the high u2 values were measured. The KTRI method, which does not consider qt and is based on fs and u2, shows a larger and more uniform resistance distribution through this zone. PILE TESTING PROGRAM The test piles, which were also production piles, consisted of 406-mm diameter, closed-end steel pipe piles. The test piles were driven with a 103 kJ rated open-end diesel hammer to depths of 38.4 m to 40.2 m below grade.
Fig. 6. Calculated shaft resistance distribution for the four referenced CPT/CPTu methods.
High strain dynamic testing (HSDT) was performed with a Pile Driving Analyzer (PDA) on the test piles driven at the site. Signal matching analyses by the Case Pile Wave Analysis Program (CAPWAP) were performed on the high strain dynamic test data. HSDT was performed during initial driving, and again during restrike approximately 2 days later to evaluate any time dependent change in pile capacity due to soil setup. Soil setup can occur in most soil types, but is most predominant in cohesive soils. During pile installation, the soil surrounding the pile experiences plastic deformations, remolding, and pore pressure changes. With time, pore pressures return to equilibrium. Where positive pore pressures are generated, there is a reduction in effective stress. As the pore pressures return to equilibrium, the effective stress

Paper No. 2.32 6
increases, and in cohesive soils consolidation occurs around the pile shaft resulting in strength gain. In low permeability cohesive soils that lack any lensing of more permeable soils, the time for pore pressure equilibrium can be many days; however, soil setup typically tends to begin almost immediately upon completion of initial pile installation. On most piling projects where construction time is critical, restrike waiting periods are usually only about one to three days. On this project, a longer set time for the restrike was not possible without incurring unwarranted construction time delay and expense to the owner. As was typical practice at the time for bridge construction in Minnesota, the piles were also evaluated during installation and restrike by the Minnesota Department of Transportation (Mn/DOT) Nominal Resistance Pile Driving Formula. This dynamic formula is defined as:
Rn = (867xE/S+5) x {[(W+(CxM)]/(W+M)} (9) Where: Rn = Nominal Pile Bearing Resistance (N) W = Mass of the striking part of the hammer (kg) E = Energy per blow (N-m) M = Total mass of pile plus mass of driving cap (kg) C = 0.1 for steel pipe piles S = Penetration per blow (mm) Figure 7 presents a graphical representation of the driving logs of Test Piles (TP) 2 through 5. These piles were driven one at each of the four piers. Test Piles 1 and 6 were driven at the abutments and were smaller diameter steel pipe piles, driven to shallower depths. The analysis of these two test piles is not part of this study. ANALYSIS OF RESULTS Pile Testing Results The piles were driven in one day each and were driven in 3 pile sections, requiring that the pile driving cease temporarily while the new pile section was welded to the lower section. The approximate splice depths are shown on Fig. 7. A small amount of setup occurred after the addition of the second pile section at the first splice depth, as evidence by the small increase in the penetration resistance immediately following the splice, but a much larger setup occurred after the second splice was performed, as can be seen in Fig. 7. This gave the first indication that very large soil setup could occur at this site. The down time to weld the splices was short, averaging about 30 minutes for the first splice and 50 minutes for the second splice. Apart from the soil setup that occurred during the time of splicing, the test piles experienced very easy driving for their full installation depth, and ended at penetration resistances (PRES) of 10 to 18 blows per 0.3 m, with a 2.0 to 2.1 m hammer stroke. The piles drove much more easily than expected.
The pile test results at the end of initial driving (EOD) are presented in Table 3. The dynamic testing showed that the test piles had CAPWAP-predicted EOD ultimate total resistances, REOD, ranging from 645 kN to 1183 kN. The Mn/DOT driving formula gave very similar predicted capacities.
Fig. 7. Driving log summary for Test Piles 2 through 5 showing also the approximate depth of the two splices.
Table 3. Test pile results of predicted total pile capacity at the
end of initial driving. Test Pile
Driven Depth (m)
PRES (blow/ 0.3 m)
Stroke (m)
CAPWAP REOD (kN)
Mn/DOT Rn
(kN)
TP-2 40.2 11 2.0 952 952 TP-3 40.2 11 2.0 872 836 TP-4 38.4 10 2.0 645 792 TP-5 39.9 18 2.1 1183 1450
Table 4 presents the results of the dynamic testing during pile restrike (RST) 1.9 to 2.2 days after EOD. The same hammer was used during initial driving and restrike testing. The set shown in Table 4 is the average penetration for 10 hammer blows. The CAPWAP predicted mobilized capacity, RRST(MOB), was 2553 kN to 4093 kN; however, the average set per blow was very small. A set of at least 2.5 mm per blow is generally required to fully mobilize the pile capacity. Therefore, the full

Paper No. 2.32 7
capacity was probably not realized and the CAPWAP predicted capacities likely represent a lower-bound estimate. A larger hammer, which was not economically available, would have been required to mobilize higher capacities. Table 4. Test pile results of predicted total pile capacity during
restrike.
Test Pile
Setup Period (days)
Set (mm/ blow)
Stroke (m)
CAPWAP RRST(MOB)
(kN)
Mn/DOT Rn
(kN)
TP-2 2.0 0.64 3.1 4093 7126 TP-3 1.9 0.95 3.1 2669 6806 TP-4 2.2 1.11 3.2 2736 6477 TP-5 2.0 1.91 3.1 2553 5730
The Mn/DOT driving formula predicts much higher capacities, ranging from 5730 kN to 7126 kN. There can be some uncertainty, however, in using pile driving formulas, particularly in restrike applications, where the hammer stroke and applied energy may not be uniform. With this in mind, the calculated hammer stroke by the PDA was compared with that used in the driving formula as a check. Even with the potential uncertainties with the driving formula, the very large increase in penetration resistance, along with both the HSDT and the driving formula results, indicate that the piles experienced a significant amount of soil setup during the short, 2-day waiting period. The predicted CAPWAP capacities show a likely lower-bound setup of about 116% to 324%, while the Mn/DOT driving formula shows a setup capacity increase of approximately 295% to 718%. To establish a relationship between pile capacity and elapsed time after EOD for this site, the methodology recommended by Svinkin and Skov (2000), using equation 10 was used. [Ru(t) / REOD] - 1 = B [log10(t) + 1] (10) One of the advantages of this equation over other setup equations is that it provides an estimation of soil setup independent of the time of the first restrike. This method considers the actual time elapsed after pile installation, and establishes the EOD time, t0, as 0.1 days in order to use a logarithmic time scale where restrike data is lacking in the time frame prior to 1 day. The total, or whole, pile capacity is considered at this site. Figures 8 and 9 present the relationship between normalized pile capacity and time for the HSDT results and the Mn/DOT driving formula results, respectively. Following Eq. 10, the calculated B setup factor predicted by HSDT ranged from 0.89 to 2.54, while the B factor predicted by the Mn/DOT driving formula ranged from 2.27 to 5.58. TP-2 and TP-4 showed a comparably consistent amount of setup. TP-5, which was
driven to a higher penetration resistance and EOD capacity, showed the least amount of setup. Following the LRFD (Load and Resistance Factor Design) methodology, the required Nominal Pile Bearing Resistance, Rn, for the pile bent piers ranged from 2469 kN to 2558 kN per pile while using the PDA as the field control measure, and 4012 kN to 4159 kN per pile when the Mn/DOT driving formula is employed. The results indicate that the required Rn was not achieved during initial driving for either method, but was achieved for both methods after sufficient soil setup occurred during the 2-day restrike testing. Therefore, further testing was not performed.
Fig. 8. Relationship between the normalized pile capacity
determined by HSDT with time.
Fig. 9. Relationship between the normalized pile capacity determined by the Mn/DOT driving formula with time.

Paper No. 2.32 8
Comparing the results of the pile testing program to the results of the SCPTu and laboratory data, it is concluded that pile driving into the sensitive soils at this site temporarily remolded the soils and increased the pore water pressures in the vicinity of the pile, thus significantly reducing the soil shear strength and allowing the piles to penetrate with very little resistance. The varved nature of the soils greatly reduced the drainage paths for the generated excess pore pressures, allowing them to quickly dissipate, resulting in very large soil setup over a very short period of time. Evaluation of CPT/CPTu Capacity Prediction Results When comparing the results of various CPT/CPTu pile capacity prediction methods to actual pile test results, it is important to consider the time-dependent effects of soil setup. The pile test results are based only on a 2-day setup period. It is the authors experience with the glacially-derived soils in Minnesota that pile capacity would continue to increase with time after the short 2-day waiting period. An example of this is presented in Fig. 10 which shows a relationship between pile capacity with time for the EOD and RST capacities of the test piles as predicted by the Mn/DOT driving formula.
Fig. 10. An example of the relationship between pile capacity
increase with time for the test piles based on the Mn/DOT driving formula results, with comparison to the results of the
various CPTu pile capacity prediction methods. Assuming a constant setup factor B, the average capacity is projected beyond the 2-day restrike for an evaluation of potential long-term capacity. Although CPT/CPTu capacity methods are typically based on long-term capacities (typically 30 to 100 days), Fig. 10 shows that setup was very fast at this site resulting in the Togliani method predicting a capacity at about 5 days after EOD, and the KTRI method predicting a capacity at about 10 days after EOD. Based on this, it is
probable that had more time been available for additional testing, either dynamically or statically, the higher capacities predicted by the KTRI and Togliani methods would have been realized. CONCLUSIONS A large amount of data can be obtained by performing SCPTu soundings, which are directly applicable to pile foundation design. SCPTu testing is fast and relatively inexpensive when compared to conventional soil borings and laboratory testing. The SCPTu soundings performed at this site were valuable in characterizing the subsurface conditions, and the results clearly indicated the presence of the sensitive, varved soils. The piles for the bridge foundations drove very easily to depths of about 40 m into the glaciolacustrine soils due to high pore pressures generated by the pile driving, along with the remolding of the sensitive clays at this site. The very large soil setup that occurred after the short, 2-day waiting period was unexpected, and is due primarily to the many drainage paths provided by the varved soils which allowed the excess pore water pressures generated by the pile driving to quickly dissipate. The CPT/CPTu predictive methods produced variable results. The fact that there is a variation in predicted capacities between the four methods is not surprising. Variation is seen with most pile capacity prediction methods, not just at this site, and not just with CPT/CPTu-based methods; therefore, local site experience is valuable. In the sensitive and varved soils at this site, the LCPC method, which does not include pore pressure in the capacity calculation, had the lowest predicted capacity and was closest to the end of drive capacity. The highest capacity prediction was from the KTRI method, which is largely based on the change in pore water pressure. REFERENCES Bustamante, M. and Gianeselli, L. [1982]. “Pile bearing capacity prediction by means of static penetrometer CPT.” Proc. of the 2nd European Symposium on Penetration Testing, ESOPT-II, Amsterdam, Vol. 2, Rotterdam: Balkema, pp. 493-500. Eslami, A.E. and Fellenius, B.H. [1997]. “Pile capacity by direct CPT and CPTu methods applied to 102 case histories.” Canadian Geotechnical Journal, Vol. 34, No. 6, pp. 886-904. Patterson, C.J. [1992] “Surficial Geology - Geologic Atlas of Ramsey County.” University of Minnesota, Minnesota Geological Survey, Plate 3. Robertson, P.K. [2012]. “Interpretation of in-situ tests – some insights.” Mitchell Lecture, ISC’4 Brazil
Paper No. 2.32 9
Robertson, P.K., and Wride, C.E. [1998]. “Evaluating cyclic liquefaction potential using the cone penetration test.” Canadian Geotechnical Journal, Vol. 35, No. 3, pp. 442-459. Svinkin, M. R., and Skov, R. [2000]. “Setup effects of cohesive soils in pile capacity.” Proc. 6th International Conference on Application of Stress-Wave Theory to Piles, Sao Paulo, Brazil, Balkema, pp. 107-111. Takesue, K., Sasao, H., Matsumoto, T. [1998]. “Correlation between ultimate pile skin friction and CPT data.” Geotechnical Site Characterization (2), Rotterdam: Balkema, pp. 1177-1182. Terzaghi, K., Peck, R.B., and Mesri, G. [1996]. “Soil Mechanics in Engineering Practice.” 3rd Edition. John Wiley & Sons, Inc., New York. Togliani, G. [2008]. “Pile capacity prediction for in situ tests.” Proceedings of the 3rd International Conference Site Characterization, Taipei, Taiwan, pp. 1187-1192. Togliani, G. [2012]. “Some considerations about SOA-1 Summary”. ISC’4 Brazil. Viana da Fonseca, A. and Santos, J.A. [2008]. “International Prediction Event, Behavior of CFA, Driven and Bored Piles in Residual Soil, Experimental Site,” - ISC’2, 688 pp.