briefing book march’2014 - pmgsy home pagepmgsy.nic.in/e_briefing_book.pdf · 4 briefing book 1....
TRANSCRIPT
PMGSY
Briefing Book
MARCH’2014 ****

Para Subject Page No.
Summary 1
1 Programme Objectives …………………………………………………………… 4
2 Cabinet decisions ………………………………….………………………………. 4
3 National Common Minimum Programme (NCMP) ………………………….. 5
4 Magnitude of the Programme…………………………………………………… 5
5 Requirement of funds for PMGSY ……………………………………………… 5
6 Bharat Nirman ………………………………………………………………………. 7
7 Financial Outlays and Outcome Budget ………………………………………. 8
8 Raising of Additional Financial Resources ………………………………….. 10
9 Physical and Financial Target during 11th Plan………………… 16
10 Clearance of Project Proposals ………………………………………………… 18
11 Review of Programme Implementation ……………………………………… 20
12 Amendment in PMGSY Guidelines ………………………………… 23
13 Executing Machinery ……………………………………………………………… 26
14 Special interventions for States where State implementation capacity is inadequate 27
15 Measures takens to ensure quality and transparency…………………… 29
16 Sound Technical Base for PMGSY ……………………………………………. 33
17 Principal & State Technical Agencies …………………………………………. 34
18 IEC Activites 34
19 Training and HRD …………………………………………………………………… 34
20 Maintenance of Rural Roads ……………………………………………………. 39
21 Research and Development …………………………………………………….. 40
22 Consideration of Proposals of Members of Parliament …………………. 42
23 Initiatives under PMGSY …………………………………………………………. 43
24 National Rural Roads Development Agency …………………………………. 46
25 Impact Assessment ……………………………………………………………… 47
26 Finance and Accounts of Project 48
27 Formulation Pradhan Mantri Gram Sadak Yojana –II Scheme…………… 50
(RC Division)
MARCH, 2014
BRIEFING BOOK

Annexures
Item Page No.No.
I Number of eligible Unconnected Habitations to be covered (Technical) 51
II-A Bharat Nirman-Habitation connectivity 52
II-B Bharat Nirman- New Connectivity Length 53
II-C Bharat Nirman - Upgradation and Renewal 54
III-A Year-wise release to States under PMGSY since inception, expenditure reported and length completed under PMGSY 55-59
III-B Year-wise release to States under PMGSY since inception 60
IV Status of projects under Special Allocation (Border/Extremist Areas) (Technical ) 61-63
V-A Physical & Financial Progress (WB assisted projects) 64
V-B Physical & Financial Progress (ADB assisted projects) 65
V-C Physical & Financial Progress (Phase I to XI + ADB/WB) 66
V-D Outcome Targets & Achievement 2013-14 upto Mar'14 67
V-E Status of New Connectivity Length (Eligible,Cleared & Connected) upto Mar'14 68
V-F Status of Upgradatio Length (Eligible,Cleared & Connected) upto Mar'14 69
V (1-28) Statewise Profile upto upto Mar'14 70-97
VI-A Year-wise progress (Phy & Fin) duirng 2005-06 to 2009-10 98
VI-B Year-wise progress (Phy & Fin) duirng 2010-11 to 2013-14 99
VI-C State wise Opening balance of funds,Releases ,Expenditure & Closing Balance during 11thPlan (Progress) 100
VI-D State wise Opening balance of Programme funds,Releases ,Expenditure & Closing Balanceduring 2013-14 upto Mar'14 101
VII-A Details of cleared proposals 2010-11,2011-12, 2012-13 & 2013-14 upto Mar'14 (Technical) 102
VII-B Pre-Empowered Committee meetings held from 2012-13 onward (Technical) 103-04
VII-C Empowered Committee meetings held during 2012-13 (Technical) 105-06
VII-D Empowered Committee meetings held during 2013-14 (Technical) 107-08
VIII E-procurement Status under PMGSY (Progress) 109
IX Status of Execution Capacity of the State under PMGSY 110
X A State-wise abstract of SQM grading for works inspected (Quality) 111-15
X-B State-wise abstract of NQM grading for works inspected (Quality) 116-20
X-C Abstract of Inspection details (SQMs) (Quality) 121
X- D Abstract of Inspection details (NQMs) (Quality) 122
XI-A List of State Technical Agencies (STAs) (Technical) 123-26
XI-B List of Principal Technical Agencies (PTAs) & States allotted to them (Technical) 127
XII Statement showing releases and expenditure on Maintenance upto Mar'14 128-31
XIII PCI Abstract for Core Network 132
XIV-A Details of Road work executed using Jute Geo textiles under PMGSY (Technical) 133
XIV-B R&D Initiatives taken up under PMGSY (Technical) 134-35
XV EC & GB Meeting of NRRDA during 2011-12, 2012-13 & 2013-14 (Finance) 136
XVI Statement showing the Status submission of Balance Sheet (Finance) 137
XVII Interest accrued on Programme / Administrative Expenses funds by NRRDA 138
XVIII Status of Implementation of OMMAS in the States (Finance) 139-40
XIX NEAs Details 141
Summary
Introduction As a central intervention and part of poverty reduction strategy, government of India launched the Pradhan Mantri Gram Sadak Yojana (Prime Minister’s Rural Roads Programme) on 25th December, 2000. Programme Objectives The primary objective of the programme is to provide good all weather connectivity to all eligible unconnected habitations in the core network with a population of 500 and above. In respect of the Hill States (North-East, Sikkim, Himachal Pradesh, Jammu & Kashmir and Uttarakhand), desert areas (as identified in the Desert Development Programme), and Tribal (Schedule V) Areas and selected Tribal and Backward Districts (as identified by the Ministry of Home Affairs and Planning Commission), the objective is to connect habitations with a population of 250 and above. The programme envisages single all weather connectivity. Physical and Financial Progress As on 31st March, 2014, project proposals for providing connectivity to 1,44,717 eligible habitations have been sanctioned (Total Eligible Habitations 1,78,184). The total cost of sanctioned projects, including the projects for upgradation of roads under PMGSY is Rs.1,82,560 crore. Against this, Rs.1,11,141 crore has been released till 31st March, 2014 including releases to the States, administrative costs etc. As reported by the States, till 31st March, 2014, a total of 3,99,979 km roads including upgradation have been constructed and All-weather connectivity has been provided to 97,838 eligible habitations.
Total fund Released till 31st March 2014 = Rs. 1,09,639 Crore. Total Expenditure incurred till 31st March, 2014 = Rs. 1,12,980 Crore (Central share) = Rs. 1,080 Crore (State share)
2
Standards and Specification Separate specifications for the low volume / rural roads were not available prior to launching of PMGSY, therefore, a variety of standards and specifications have been developed with the help of Indian Roads Congress and other institutions of repute. These publications enabled the executing agencies to implement the programme with confidence on technical parameters. Quality Assurance A three tier quality assurance mechanism has been put in place to ensure quality of road works during construction. In the first tier of this mechanism, the quality standards are enforced through in-house mechanism by establishing field laboratories and carrying out mandatory tests. The NRRDA has developed Quality Assurance Handbooks to help the field staff in ensuring proper field and laboratory testing. Quality Control Registers have been prescribed to ensure systematic recording of test results under this tier. The independent monitoring of quality at the State level has been prescribed under the second tier, wherein the states are required to monitor the quality of works by deployment of quality monitors, independent of the existing machinery. The works are required to be inspected at three stages of construction. The Third tier of the quality mechanism is an independent monitoring mechanism at the central level. Under this tier, the retired senior engineers termed as National Quality Monitors (NQMs) are engaged for inspections of road works. The works for inspection are selected at random. The basic objective of this tier is to identify quality issues and at-site guidance to field staff for better understanding of specifications and good construction practices. The independent monitors at the second and the third tier are required to take atleast 10 digital photographs including one of the field laboratories, for each work and upload it on OMMAS website to facilitate public viewing of quality of road works executed under the programme. On-line Management, Monitoring and Accounting System A web-based online management, monitoring and accounting system has been developed under the programme. This online system is being used as decision support tool for the various levels of functionaries and adequate information about the programme is readily available in the citizen domain which is providing clear transparency in programme implementation. Transparency and Citizen Monitoring With a view to provide full information about the work, Citizen Information Board displaying work information in local language is provided at every work site. This board contains information about length of road, cost etc., including details of executing agency.
3
Information about work involved in each layer of construction is also presented in understandable format. The programme provides for joint inspection of works by the implementing agency and public representatives. Maintenance All PMGSY roads (including associated Main Rural Links / Through Routes of PMGSY link routes) will be covered by 5-year maintenance contracts, to be entered into alongwith the construction contract, with the same contractor, in accordance with the Standard Bidding Document. Maintenance funds to service the contract will be budgeted by the State Government and placed at the disposal of the SRRDA in a separate Maintenance Account. Pavement Condition Index (PCI) Road Condition Survey is an integral part to analyze the health of road network, therefore, PCI data is an integral part of the OMMAS and the data will be included in the “Road Master” for each kilometer. The PCI data collected will be entered in the OMMAS data base by the PIU. The States shall get the PCI survey of the core network conducted once in 2 years immediately after the rainy season. The PCI survey will be repeated every 2 years and prioritization of roads for upgradation and or maintenance shall be redrawn accordingly.
*****************

4
BRIEFING BOOK
1. Programme Objectives 1.1 Pradhan Mantri Gram Sadak Yojana (PMGSY) was launched on 25th December 2000 as a fully funded Centrally Sponsored Scheme to provide All- weather road connectivity in rural areas of the country. The programme envisages connecting all habitations with a population of 500 or more in plain areas and habitations with a Population of 250 persons and above in Hill States (North East, Sikkim, Himachal Pradesh, Jammu & Kashmir and Uttarakhand), the desert areas (as identified in Desert Development Programme), the tribal areas and in 88 Left-Wing Extremists (LWE) affected / Integrated Action Plan (IAP) Districts as identified by the Ministry of Home Affairs and Planning Commission. 1.2 The PMGSY permits the Upgradation (to prescribed standards) of the existing roads in those districts where all the eligible unconnected habitations of the designated population size (refer Para 1.1 above) have been provided all-weather road connectivity. However, it must be noted that Upgradation is not central to the Programme. In Upgradation works, priority should be given to Through Routes of the Rural Core Network, which carry more traffic. 2. Cabinet decisions of 7th August, 2001 The main decisions of the Cabinet for the Pradhan Mantri Gram Sadak Yojana (PMGSY) are as follows:- (i) PMGSY will be a 100% Centrally Sponsored Scheme executed through State Government Agencies. (ii) The primary objective of the Programme will be to provide connectivity by way of an All-weather road to all unconnected habitations with a population of 500 persons and above by the end of the 10th Plan Period (250 persons and above in case of Hill States and Desert areas). Upgradation, though not central to the Programme, would be allowed in cases where connectivity is complete. (iii) The total requirement of funds for the Programme is of the order of Rs. 60, 000 crore. The available source of funds, i.e. 50% share of the cess on High Speed Diesel (HSD), as per the Central Road Fund Act, being inadequate to finance a Programme of this magnitude, the Ministry of Rural Development is authorized to take appropriate steps in coordination with the Ministry of Finance to generate additional financial resources including by way of borrowings from, inter alia, the External Funding Agencies such as the World Bank and the Asian Development Bank. (iv) Execution of the Programme will be in project mode through setting up of National Rural Road Development Agency (NRRDA) to extend support to the Programme.
5
3. National Common Minimum Programme (NCMP) The National Common Minimum Programme (NCMP) of the UPA states that UPA will pay special attention to augmenting and modernizing rural infrastructure consisting of roads, irrigation, electrification, cold-chain and marketing outlets. ‘Augmentation’ would mean ‘new connectivity’ and ‘Modernisation’ would mean ‘upgradation and maintenance’ in the context of PMGSY. In the Budget of 2005-06 the Finance Minister announced UPA Government’s goal to connect all villages that have a population of 1000 persons and above (500 persons and above in hilly/tribal areas) with a road as part of Bharat Nirman. 4. Magnitude of the Programme PMGSY is being implemented since 2000-01. It was estimated that about 1,72,772 habitations would require connectivity to be provided under the programme. Thereafter, based upon requests from the State Governments for reconciliation, coverage of left out habitations by some States that had proposed rectification to consider habitation as unit of connectivity (instead of Revenue Village taken earlier), accounting for habitations connected under other Schemes, deletion of non-feasible habitations, dropped out habitations, relaxation accorded by the Empowered Group of Officers and habitations connected under other Schemes, the revised number of total eligible unconnected habitations has become 1,78,184. As on 31st March, 2014, project proposals for providing connectivity to 1,44,717 eligible habitations have been sanctioned. The total cost of sanctioned projects, including the projects for upgradation of roads under PMGSY is Rs.1,82,560 crore i/c State Share. Against this, Rs.1,09,639 crore has been released till 31st March, 2014 . As reported by the States, till 31st March, 2014, a total of 3,99,979 km roads including upgradation have been constructed and All-weather connectivity has been provided to 97,838 eligible habitations. The Statement showing number of eligible unconnected habitations under PMGSY may be seen at Annexure-I. 5. Requirement of funds for PMGSY 5.1 As per the current price levels, the following is the requirement of funds for completion of
works sanctioned and in progress:
- Value of proposal cleared as on 1st April 2011 -Rs. 1,18,949 crore
- Amount released in Programme Fund upto March 2011 - Rs. 84,731crore
- Funds required for completion of works already sanctioned - Rs. 34,218crore
5.2 Assessment of funds required for works yet to be sanctioned on 1st April 2011 and due to
new additions of habitations and relaxations under PMGSY is given below in Table.

6
Table (Rs. In crore- at 2010-11 prices)
S. No.
Activity (ies) Funds required
Funds required for balance works
(i) Funds required for works yet to be sanctioned on 1st April 2011 and due to new additions of habitations and relaxations
79,539
(ii) Outstanding NABARD Loan (Principal) and interest as on 01-04-11 21,117
(iii) Left-out bridges on already sanctioned roads 8,000
(iv) Impact of left out Habitations in Rajasthan, Bihar and Manipur due to Revision of their core network permitting to take habitations (as per guidelines) instead of revenue villages as units of connectivity
18,362
(v) Funds for New habitations of 250+ in 60 IAP districts a. For new connectivity of habitations having population of 250-499 persons in non-Sch V areas – Rs. 9,497 crore b. Upgradation of selected roads – Rs. 1,000 crore
10,497
(vi) Impact of increase in length of bridges to 75m in IAP districts 250
(vii) Impact due to snow fall/ landslides in Hill States 5,000
(viii) Administrative Expenditure including for States, Quality Monitoring etc. 1,000
Funds required for the Proposed Relaxations for IAP districts, Special Category States, Schedule-V areas and Desert areas
a) Impact of relaxation in the eligibility norm for the State of Assam to provide connectivity (including bridges) to habitations of population 250 to 499 (2001 census)
5,650 (ix)
b) Funds required for additional length of bridges in Special Category States, Tribal (Schedule V areas) and States having Desert districts (as identified in the Desert Development Programme)
1,800
I Funds required for providing connectivity to left-out habitations (as per 2001 census) and for upgradation of some selected roads in 60 IAP districts
10,000
(d) Funds required for providing connectivity to eligible habitations having population of 100 to 249 persons (as per 2001 census) including bridges in 60 IAP districts
21,100
PMGSY-II
(x) Funds required for launching of PMGSY-II from the first year of 12th Five Year Plan on sharing basis as under:
- For Plain areas – 70:30 (Centre:State) - For Hill States, Desert Areas, Tribal (Schedule V areas) and LWE/ 60
IAP districts – 80:20 (Centre:State) For International Border Blocks in Hilly States – 90:10 (Centre:State)
15,000
Funds needed 1,97,313

7
5.3 Net funds required for completion of balance PMGSY projects including projection
of PMGSY-II –
Funds required for completion of works already sanctioned as on 1st April 2011
Rs. 34,218 crore
funds required for works yet to be sanctioned on 1st April 2011 and due to new additions of habitations and relaxations under PMGSY
Rs. 1,97,313 crore
Total funds needed Rs. 2,31,531 Funds available in year 2011-12 Rs 20,000 crore
Net fund required during 12th FYP (at 2010-11 prices) Rs.2,11,531 crore
Say Rs. 2,12,000 crore 6. Bharat Nirman 6.1 Targets under Bharat Nirman (Rural Roads component) :- The President of India, in his address to Parliament on 25th February, 2005, announced a major business plan for rebuilding rural India called ‘Bharat Nirman’. The Finance Minister, in his Budget Speech of 28th February, 2005, identified Rural Roads as one of the six components of Bharat Nirman and has set a goal to provide connectivity to all villages with a population of 1000 persons and above (500 persons and above in the case of hilly or tribal areas) with an All-weather road by 2012. 6.2 Based on ground verification by States, 63,940 habitations were targeted (Core Network of Bihar and Rajasthan is under scrutiny so this figure may likely to be increased) to be connected under the programme. The physical target under the programme is as under:- a. New connectivity component:- • Habitations to be connected: - 63,940 nos. • Road length to be constructed: - 1,89,987 km. b. Upgradation component:
Road length to be upgraded/renewed: 1, 94,130 km. 6.3 Overall Progress under Bharat Nirman (rural roads component) during the period
2005-12:- Overall Progress of habitation coverage and construction of road (both for new connectivity as well as upgradation) up to the end of March 2014 under Bharat Nirman is as under:

8
51,253 habitations (80%) have been connected upto March 2014, by constructing 1,72,916 km. rural roads. Projects for connecting 11,623 habitations (18%) are at different stages of completion. The details of achievements, State-wise, under Bharat Nirman (rural roads component) for the period 2005-12 have been given in Annexures II (A) to II (C). 6.4 Projected Time Frame for achieving the residual New connectivity targets:- Projected Time Frame for achieving the residual targets is indicated below:-
Projected Timeframe Target 63,940 DPRs (Detailed Project Reports) cleared 62,876 Habitations connected upto March 2014 51,253 Balance in progress 11,623 Spillover to 2014-15 12,687
7. Financial Outlays and Outcome Budget
7.1 Allocation and Expenditure The year wise allocation of funds and the expenditure is as under:
Year Allocation (Rs. in crore)
Expenditure incurred
(Rs. in crore)
Remarks
2000-01 2500.00 2001-02 2500.00 2002-03 2500.00 2003-04 2325.00
6,529.93 Separate year wise information not available
2004-05 2148.00 + 320.00* 3,077.45 2005-06 3809.50 + 410.50* 4,100.39 2006-07 3725.62 + 1500* + 798
(Supplementary) + 250 (RE) 7,304.27
2007-08 3900.00 + 2600.00* + 10,618.69
* Assistance from ADB/WB. **From RIDF Window of NABARD.
S.No Component Overall Target
(2005-12)
Achievement upto March 2014
% achievement against target
1. No. of habitations to be connected.
63,940 51,253 80%
2. New connectivity (road length in kms.)
1,89,987 1,72,916 91%
3. Upgradation of through-routes (road length in kms.) including renewal.
1,94,130 2,51,758 130 %
9
4500.00** 2008-09 5530.15 + 2250.00*+
7500.00** 15,161.98
2009-10 17840.00 (including NABARD loan)
18,832.92
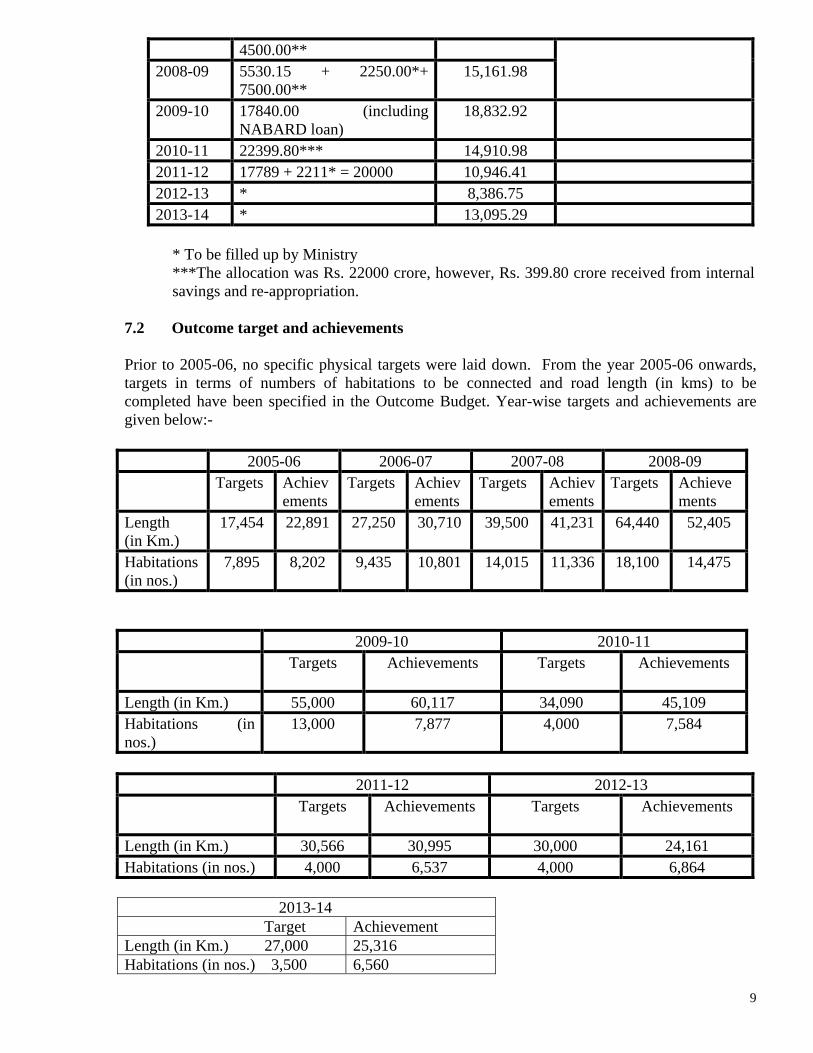
2010-11 22399.80*** 14,910.98 2011-12 17789 + 2211* = 20000 10,946.41 2012-13 * 8,386.75 2013-14 * 13,095.29
* To be filled up by Ministry ***The allocation was Rs. 22000 crore, however, Rs. 399.80 crore received from internal savings and re-appropriation.
7.2 Outcome target and achievements Prior to 2005-06, no specific physical targets were laid down. From the year 2005-06 onwards, targets in terms of numbers of habitations to be connected and road length (in kms) to be completed have been specified in the Outcome Budget. Year-wise targets and achievements are given below:- 2005-06 2006-07 2007-08 2008-09 Targets Achiev
ements Targets Achiev
ements Targets Achiev
ements Targets Achieve
ments Length (in Km.)
17,454 22,891 27,250 30,710 39,500 41,231 64,440 52,405
Habitations (in nos.)
7,895 8,202 9,435 10,801 14,015 11,336 18,100 14,475
2009-10 2010-11 Targets Achievements
Targets Achievements
Length (in Km.) 55,000 60,117 34,090 45,109 Habitations (in nos.)
13,000 7,877 4,000 7,584
2011-12 2012-13 Targets Achievements
Targets Achievements
Length (in Km.) 30,566 30,995 30,000 24,161 Habitations (in nos.) 4,000 6,537 4,000 6,864
2013-14 Target Achievement Length (in Km.) 27,000 25,316 Habitations (in nos.) 3,500 6,560
10
State-wise detail of outcome target and achievements for the year 2013-14 upto Mar’14 has been given in Annexure V(D). 8. Raising of Additional Financial Resources 8.1 Assistance from Asian Development Bank (ADB) Assistance from Asian Development Bank (ADB)
ADB has been providing the assistance to PMGSY programme in the States of Assam, Chhattisgarh, Madhya Pradesh, Odisha and West Bengal. The assistance under Rural Road Sector I Project in the States of Chhattisgarh and Madhya Pradesh has been completed and the assistance under Rural Roads Sector II Investment Program is in progress.
The assistance under Rural Connectivity Investment Program for USD 800 Million in the States of Assam, Chhattisgarh, Madhya Pradesh, Odisha and West Bengal under 4 tranches has been approved on 17th May 2012. (i ) Rural Roads Sector I Project (RRSIP) Loan No. 2018IND: ADB had approved the loan of US$ 400 million under Rural Road Sector I Project (RRSIP) to assist the implementation of the PMGSY projects in the State of Madhya Pradesh and Chhattisgarh. A total of 9,574.7 km of All‐weather rural roads connecting 3,207 habitations was constructed. Project was successfully completed in June 2009. Project completion report has been submitted to ADB as per the requirement of the loan agreement. (ii) Rural Roads Sector II Investment Program
Project 1 (Loan No. 2248IND): ADB had approved the loan of US$ 180 million under Multi Tranche Financing Facility (MFF) to finance the sub projects in the State of Assam, Odisha and West Bengal. The total length of 2,507 km connecting 1,497 habitations was constructed under this project. The project was successfully completed in June, 2009. Project completion report has been submitted to ADB as per the requirement of the loan agreement.
Project 2 (Loan No. 2414IND): ADB had approved the loan of US$ 77.65 million for the Batch II Project in Odisha under Multi‐Tranche Financing Facility (MFF). The project had provided the connectivity of 1,013 km in Odisha connecting 231 habitations. The loan was closed on 31st December, 2010. Project completion report has been submitted to ADB as per the requirement of the loan agreement.
Project 3 (Loan No. 2445IND): A loan of US$ 130 million under Multi‐Tranche
Financing Facility has been taken to finance the sub project of Batch II in Assam and West Bengal. The loan was made effective by ADB on 5th January 2009. The project will provide the connectivity to 607 habitations with 985 km in Assam and 718 habitations with 843 km in West Bengal. The Loan was closed on 30th June 2013.
Project 4 (Loan No. 2535): A loan of US$ 185 million under Multi‐Tranche Financing

11
Facility was taken to finance the sub projects of Batch III in Assam, Odisha and West Bengal. ADB has made effective this loan on 26th November 2009. This project has provided the connectivity for 397 habitations with 871 km in Assam, 517 habitations with 1,287 km in Odisha and 704 habitations with 660 km in West Bengal. The loan was closed on 31st December, 2012.
Project 5 (Loan No. 2651): A loan of US$ 222.22 million under Multi‐Tranche
Financing Facility has been taken to finance the sub projects of Batch IV in Odisha, Batch V in Madhya Pradesh, Batch III (lot II) in West Bengal and Batch IV in Chhattisgarh. The loan was made effective on 29th October, 2010. This project will provide connectivity of rural roads with 142 habitations for 325 km in Chhattisgarh, 895 habitations with 2,535 km in Madhya Pradesh, 428 habitations with 1,512 km in Odisha and 257 habitations with 443 km in West Bengal. Loan will be closed on 30th June, 2014.
(iii) Rural Connectivity Investment Program (RCIP): Multitranche Financing Facility (MFF) for USD 800 Million has been signed on 17th
May 2012 by ADB, DEA, MoRD and States. ADB financial support for the Investment Program to be extended through Multitranche Financing Facility. Program will construct or upgrade to all weather standards about 9,000 km rural roads connecting 4,200 habitations in the States of Assam, Chhattisgarh, Madhya Pradesh, Odisha and West Bengal. Program will also focus on improvement of the Institutional Arrangements, Business Processes and Associated Capacity Building especially in relation to design, operation, safeguards, financial, road safety and assets management matter.
Financing Plan of the Investment Program is given below:‐
S.No Source Amount 1 Asian Development Bank USD 800 M 2 India and States USD 425.30 M Total USD 1225.30 M
Multitranche Financing Facility (MFF) will finance four projects time which has been
converted into three projects slicing of the long term contract packages for the consulting services including the services of Technical Support Consultant and Rural Connectivity Training and Research Centres (RCTRC) Consultant will be used.
Indicative amount and schedule of 1st and subsequent tranches is given below:‐
Financing Tranche 1 (in US$ M)
Tranche 2 (in US$ M)
Tranche 3 (in US$ M)
ADB 252 275 273 Government 89 81.06 255 Total 341 366.06 528
Rural Connectivity Investment Programme also contains institutional development component involving: A Construction of field offices(including laboratories and other facilities required
to perform functions for the pilot Rural Road Network Management Units (RRNMUs) and providing all necessary equipment, system and tools for the
12
rural road network management. According to the tentative schedule, it is anticipated that one RRNMU facility in each State will be constructed in the second year and are around 5 more in each State by the fourth year of the investment Programme.
B Construction and equipping of 5 Rural Connectivity Training and research
Centers (RCTRCs) in each State. C Rolling out systematic and large scale training and targeted rural roads research
programs by the established RCTRCs and with assistance of related consultancy services.
D The land for the construction of the RRNMU and RCTRC has been identified by all
the States ADB had engaged the international architect for the preparation of concept drawings of RRNMU and RCTRC . The international architect has finalized the concept drawings for these units State of Madhya Pradesh, Chhattisgarh, Assam and West Bengal has appointed the local architect. The Architectural Drawings of the buildings of RRNMU and RCTRC has been finalised by the States of Assam, Chhattisgarh, Madhya Pradesh & West Bengal. Cost estimate has been prepared by the Architect’s of the respective States. Sanctions for the construction of buildings of RRNMU and RCTRC has been issued by MoRD. Bidding process is to be started by the States.
(iv) Loan no. 2881IND (Tranche 1) Loan for Tranche‐I under Rural Connectivity Investment Programme for
252.00 Million US$ has been signed on 17th May, 2012. This loan will provide connectivity to all habitations with population of atleast 500 persons (250 or more) in hilly or desert area. Sub projects will cover about 3461 KM in total (compromising the about 342 KM in Assam 1008 in Chhattisgarh, 1187 KM in Madhya Pradesh, 757 KM in Odisha and 167 KM in West Bengal). The procurement of the sub project is nearly in a completion stage in these States. The project will be completed by 30th June, 2015. (v) Loan No. 3065IND (Tranche 2)
The Loan for USD 275.00 Million containing the component of Rural Connectivity and Institutional development was signed on 8th November 2013 and has effective from 31st March 2014.
The project under Tranche 2 under Rural Connectivity Investment Program will
comprise of following components:‐
(a) Road Infrastructure Development : This comprises construction to an all‐weather standard of rural roads that are part of the PMGSY with the aim of providing connection to all habitations – with population of at least 500 persons (250 or more in hilly or desert Areas, or Scheduled Tribe areas). Subprojects will cover about 3,693 km in total (comprising about 496 km in Assam, 429 km in Chhattisgarh, 654 km in Madhya Pradesh, 1184 km in Odisha and 930 km in West Bengal)

13
(b) Institutional Strengthening : This component will support: (i) establishment of Rural Connectivity Training and Research Centers (RCTRCs) and Rural Road Network Management Units (RRNMUs) in each participating state which are financed under Tranche 1 (Loan 2881‐IND), by providing all necessary state‐of‐the art equipment, system, software and tools, 1and (ii) a Project Implementation Consultant (PIC) will be engaged and financed by Government of India to assist MORD/NRRDA and state governments in complying the administrative requirements inherent to ADB‐assisted projects, and provide additional support in operation, monitoring, evaluation and risk management.
Rural Connectivity Investment Program (Supplementary): Rural connectivity investment programme (supplementary) of US$ 500 Million aims
to construct or upgrade all weather 7,000 km of Rural roads connecting the unconnected eligible habitations and upgrading the already constructed roads to all weather connectivity, in the States of Assam, Bihar, Chhattisgarh, Madhya Pradesh, Odisha and West Bengal.
In order to fulfill these aims, Government of India is considering additional financing
of 500M US$ from Asian Development Bank under the Rural Connectivity Investment Programme to assist portion of the PMGSY in Assam, Bihar, Chhattisgarh, Madhya Pradesh, Odisha and West Bengal. MoRD has established strategic criteria to give priority to habitations with a larger population first and gradually expanding to cover the smaller populations.
Under the rural connectivity programme, ADB is already providing financial
assistance of 800M US$ for the construction of roads in the States of Assam, Chhattisgarh, Madhya Pradesh, West Bengal and Odisha. The proposed rural connectivity investment programme (supplementary) is in continuity to RSSIP and RSSIIP; this loan will be 500M$US supplementing to Rural Connectivity Investment Programme.
The proposal and the Concept Document for the Rural Connectivity Investment
Program (Supplementary) for US$ 500 M has been submitted to Department of Economic Affairs. Project is being pursued with Department of Economic Affairs for active consideration.
8.2 World Bank assisted Projects:
Loan under Rural Roads Project-II (RRP-II)
RRP-II has been negotiated with the World Bank. This Programme is based on sector-wise approach. Project Period is 5 years from 2011 upto 2016. The Project has two components:
- Programme Financing-US $1340 million 1 One RCTRC and around 6 RRNMUs will be established in each state under the investment program.

14
• 8 States –Himachal Pradesh, Jharkhand, Meghalaya, Punjab, Rajasthan, Uttarakhand , Uttar Pradesh and Bihar covered.
• Total 8,323 habitations to be covered, 24,174 Km length to be built.
- Institutional Strengthening – US $ 60 million. The loan of US $ 1.5 billion from World Bank was signed on 14th January, 2011. Brief description of the Project including GoI share is given below in Table-6 :
Total Projects sanctioned till 31st March, 2014
Sl No.
State Revised Allocation US $ million Habitations Length in
Km. Value (Rs. in crore)
Length (in Km.)
1. Himachal Pradesh
112 819 2,724 762 2,238
2. Jharkhand 223 2,209 4,133 1,910 4,338 3. Meghalaya 100 515 1,625 810 1,113 4. Punjab 136 - 1,062 1,055 2,121 5. Rajasthan 358 2,734 8,651 3,227 11,499 6. Uttar Pradesh 247 1,590 2,401 1,919 4,709 7. Uttarakhand 167 0,456 3,578 1,001 2,166 8. Bihar 244 - - 1,655 2,292
Total 1,587 8,323 24,174 12,339 30,476 8.2 Funding from NABARD:- (i) The requirement of funds for Bharat Nirman was estimated at Rs.48, 000 crore. However, the availability of funds was estimated as under:- Cess Rs. 16,000 crore. Assistance from ADB/World Bank Rs. 9,000 crore Loan from NABARD Rs. 16,500 crore Unfunded gap Rs. 6500 crore (ii) The matter was discussed in the National Rural Infrastructure Committee (NRIC) chaired by Hon’ble Prime Minister on 16.5.2005. The Planning Commission and the Finance Ministry were advised to locate the additional funds for the programme. The matter was again discussed in the second and third meeting of NRIC, held on 21.6.2005 and 5.10.2005 respectively when a suggestion was made that separate window on Bharat Nirman may be created in NABARD to fund the rural roads component of Bharat Nirman. Subsequently, the Cabinet in its meeting held 24.9.2006 decided as under.
• borrow funds from National Bank for Agriculture and Rural Development (NABARD) for achieving the rural roads targets of Bharat Nirman.
• allow National Rural Roads Development Agency to act as the agency for borrowing funds from the separate window under NABARD.
15
• amend the Central Road Fund Act, 2000 to enable borrowing and repayment of loan for development of rural roads and for this purpose to introduce in Parliament the Central Road Fund (Amendment) Bill 2006.
(iii) A separate window was created under RIDF in NABARD with the allocation of Rs. 4,000 Crore during 2006-07 to augment funding for rural roads under ‘Bharat Nirman’. However, funds could not be drawn during 2006-07 from this window in the absence of enabling amendment to the Central Road Fund Act, 2000. This window continued during 2007-08 with an additional allocation of Rs. 4,500 crore. The Central Road Fund (Amendment) Act, 2007 (28 of 2007) was notified on 21.08.2007. Thereafter, a Tripartite Agreement for the loan of Rs. 16,000 crore was signed on 27-09-2007 between Ministry of Rural Development (MoRD), National Rural Roads Development Agency (NRRDA) and National Bank for Agriculture and Rural Development (NABARD). Subsequently addenda were issued for enhancing the loan amount first by Rs. 500 crore on 20.11.2009 and second by Rs. 2000 crore on 31.3.2010. Thus, the tripartite agreement with NABARD is for a total amount of Rs. 18,500 crore. Tripartite Agreement provides that:
NRRDA shall make the payment of interest to NABARD on quarterly basis at the end of
each quarter i.e. 31st March, 30th June, 30th September and 31st December every year. The first interest payment shall be made on the aforesaid dates occurring immediately after the loan not with standing that such period may be less than 3 months. The interest shall be paid by NRRDA on the first day of the succeeding English calendar month immediately succeeding the quarter. However, if the first day of the succeeding quarter is a Saturday/Sunday/Holiday, NRRDA shall pay the installment on the last working day of the same quarter (March, June, September and December, as the case may be).
NRRDA shall repay the loan in 5 equal annual installments within 7 years from the date of
each drawal. The first installment shall be paid on the first day of the succeeding English calendar month immediately on the expiry of 36 months form the date of drawal and each subsequent installment is to be paid at intervals of 12 months there from. However, if the first day of the succeeding English calendar month is a Saturday/ Sunday/ Holiday, NRRDA shall repay the installment on the last working day of the preceding month.
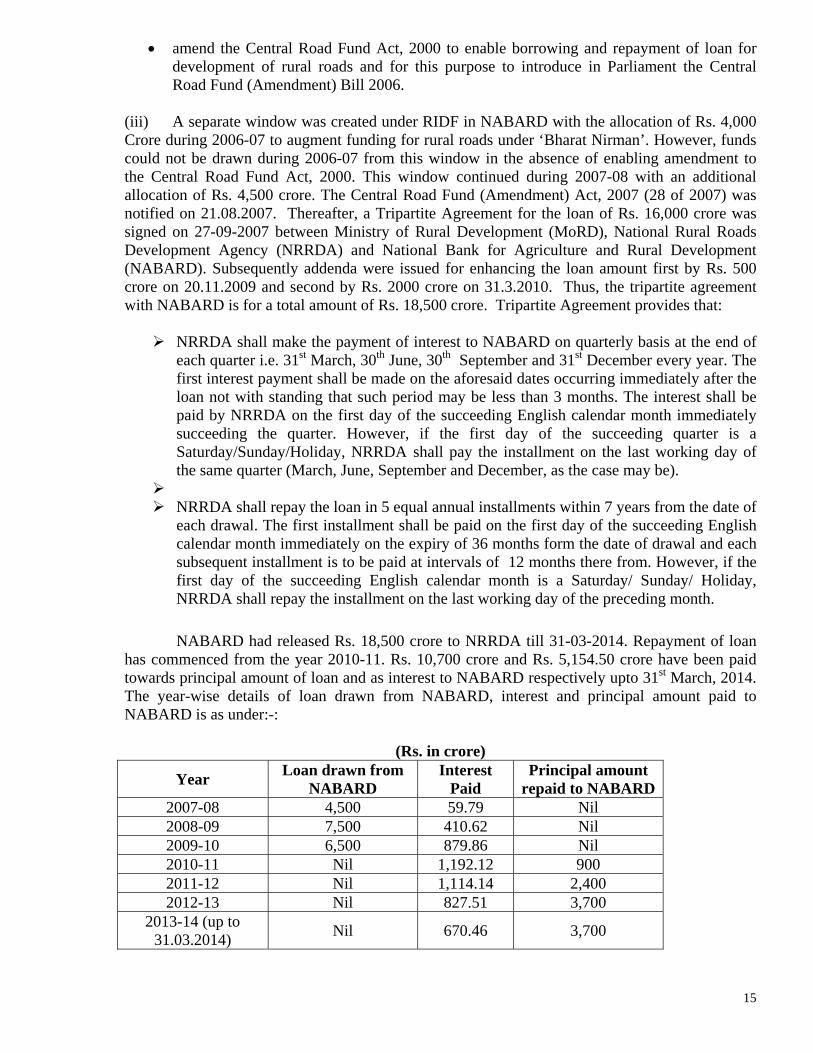
NABARD had released Rs. 18,500 crore to NRRDA till 31-03-2014. Repayment of loan
has commenced from the year 2010-11. Rs. 10,700 crore and Rs. 5,154.50 crore have been paid towards principal amount of loan and as interest to NABARD respectively upto 31st March, 2014. The year-wise details of loan drawn from NABARD, interest and principal amount paid to NABARD is as under:-:
(Rs. in crore)
Year Loan drawn from NABARD
Interest Paid
Principal amount repaid to NABARD
2007-08 4,500 59.79 Nil 2008-09 7,500 410.62 Nil 2009-10 6,500 879.86 Nil 2010-11 Nil 1,192.12 900 2011-12 Nil 1,114.14 2,400 2012-13 Nil 827.51 3,700
2013-14 (up to 31.03.2014) Nil 670.46 3,700
16
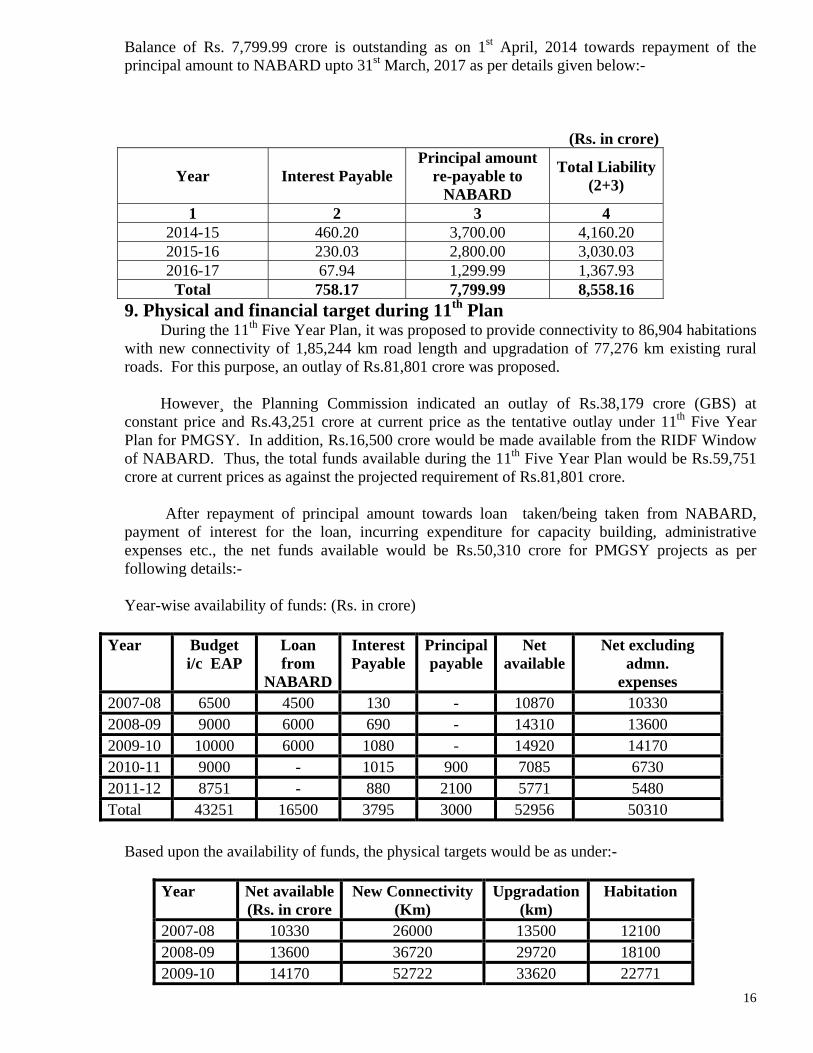
Balance of Rs. 7,799.99 crore is outstanding as on 1st April, 2014 towards repayment of the principal amount to NABARD upto 31st March, 2017 as per details given below:-
(Rs. in crore)
Year Interest Payable Principal amount
re-payable to NABARD
Total Liability(2+3)
1 2 3 4 2014-15 460.20 3,700.00 4,160.20 2015-16 230.03 2,800.00 3,030.03 2016-17 67.94 1,299.99 1,367.93
Total 758.17 7,799.99 8,558.16 9. Physical and financial target during 11th Plan
During the 11th Five Year Plan, it was proposed to provide connectivity to 86,904 habitations with new connectivity of 1,85,244 km road length and upgradation of 77,276 km existing rural roads. For this purpose, an outlay of Rs.81,801 crore was proposed.
However¸ the Planning Commission indicated an outlay of Rs.38,179 crore (GBS) at
constant price and Rs.43,251 crore at current price as the tentative outlay under 11th Five Year Plan for PMGSY. In addition, Rs.16,500 crore would be made available from the RIDF Window of NABARD. Thus, the total funds available during the 11th Five Year Plan would be Rs.59,751 crore at current prices as against the projected requirement of Rs.81,801 crore.
After repayment of principal amount towards loan taken/being taken from NABARD,
payment of interest for the loan, incurring expenditure for capacity building, administrative expenses etc., the net funds available would be Rs.50,310 crore for PMGSY projects as per following details:- Year-wise availability of funds: (Rs. in crore)
Year Budget i/c EAP
Loan from
NABARD
Interest Payable
Principal payable
Net available
Net excluding admn.
expenses 2007-08 6500 4500 130 - 10870 10330 2008-09 9000 6000 690 - 14310 13600 2009-10 10000 6000 1080 - 14920 14170 2010-11 9000 - 1015 900 7085 6730 2011-12 8751 - 880 2100 5771 5480 Total 43251 16500 3795 3000 52956 50310
Based upon the availability of funds, the physical targets would be as under:-
Year Net available
(Rs. in crore New Connectivity
(Km) Upgradation
(km) Habitation
2007-08 10330 26000 13500 12100 2008-09 13600 36720 29720 18100 2009-10 14170 52722 33620 22771

17
2010-11 6730 11545 12900 5000 2011-12 5480 2720 11000 2667 Total 50310 129707 100740 60638
Thus, the estimated targets for the 11th Five Year Plan would be as under:-
Period No. of Habitation to be covered
Length for new connectivity (Kms)
Length for upgradation (Kms) (funded under PMGSY)
Length (km) for renewal (to be borne by the State Government)
Targets up to the year 2009 as per Bharat Nirman
30200 62720 43220 51227
Target for 2010-12 30438 66987 57520 25759
Overall for the 11th Plan
60638 129707 100740 76986
Physical and financial target for 2008-09 Allocation for 2008-09 under PMGSY was Rs. 14,530 crore which included external aid (from World Bank and Asian Development Bank) of Rs. 3000 crore and Rs. 7000 crore to be drawn as loan from Rural Infrastructure Development Fund (RIDF) window of National Bank for Agriculture and Rural Development (NABARD). The budgetary outlay for the year 2008-09 was subsequently revised. The revised allocation for the year 2008-09 under PMGSY was Rs. 15,280.15 crore which included Rs. 4046.25 crore from cess, external budgetary support of Rs.2,250 crore, budgetary support of Rs. 1483.90 crore and Rs. 7,500 crore from the RIDF window of NABARD. It was targeted to provide all weather connectivity to 18100 habitations and to complete 64440 km of rural roads (New Connectivity-36720 km and Upgradation–27720 km) under PMGSY.
Physical and financial target for 2009-10 Allocation for the year 2009-10 under PMGSY is Rs. 14,000 crore which includes external aid (from World Bank and Asian Development Bank) of Rs. 1350 crore and Rs. 4000 crore to be drawn as loan from Rural Infrastructure Development Fund (RIDF) window of National Bank for Agriculture and Rural Development (NABARD). The budgetary outlay for the year 2009-10 was subsequently revised and Rs. 6500 crore was available from the RIDF window of NABARD. During 2009-10, it is proposed to provide all weather road connectivity to 13,000 habitations under Bharat Nirman with 24,000 km. of the new connectivity road length. In addition, 16,000 km. of existing rural roads is proposed to be upgraded for improving farm to market connectivity.

18
Physical and financial target for 2010-11 Allocation for the year 2010-11 under PMGSY is Rs. 22,000 crore which includes external aid (from World Bank and Asian Development Bank) of Rs. 890 crore and re-payment of Interest to NABARD, it is proposed to provide all weather road connectivity to 3,000 habitations under Bharat Nirman with 14,320 km. of the new connectivity road length. In addition, 12,500 km. of existing rural roads is proposed to be upgraded for improving farm to market connectivity.
Physical and financial target for 2011-12 Allocation for the year 2011-12 under PMGSY is Rs. 20,000 crore which includes external aid (from World Bank and Asian Development Bank) of Rs. 2211 crore and re-payment of Interest to NABARD, it is proposed to provide all weather road connectivity to 3,000 habitations under Bharat Nirman with 12,000 km. of the new connectivity road length. In addition, 12,750 km. of existing rural roads is proposed to be upgraded for improving farm to market connectivity. Physical and financial target for 2012-13 Allocation for the year 2012-13 under PMGSY is Rs. 8,884.69 Crore which includes external aide (from WB and ADB) of Rs. 1,000 Crore and re-payment of Interest to NABARD, it is proposed to provide all weather road connectivity to 4,000 habitations under PMGSY and a length of 30,000 km under new connectivity and upgradation. Physical and financial target for 2013-14 Allocation for the year 2013-14 under PMGSY is Rs. 21,700 Crore which includes external aide (from WB and ADB) of Rs. 1,000 Crore and re-payment of Interest to NABARD, it is proposed to provide all weather road connectivity to 3,500 habitations under PMGSY and a length of 27,000 km under new connectivity and upgradation. The year wise release to States and expenditure incurred since inception has been given in Annexure III (A) and III (B). 10. Clearance of Project Proposals (After dropping)
10.1 Phase-wise Progress;
So far, upto March 2014, project proposals for 1,43,834, road works including bridges measuring 5,44,462.39 kms. and valued at Rs. 1,82,559.96 crore including State share have been cleared by this Ministry. The phase wise details have been given in Annexure V (A) to V (C),Statewise progess of New Connectivity & Upgradation length required, cleared & connected upto March 2014 given in Annexure V(E) & V(F) and State-wise State profile are as per Annexure V (1-28) The year-wise physical and financial progress may be seen Annexure VI (A) & VI (B). State wise Opening balance of funds, Releases ,Expenditure & Closing Balance during 11th Plan may be seen Annexure VI (C) and State wise Opening balance of Programme funds, Releases ,Expenditure & Closing Balance during 2013-14 upto March 2014 may be seen Annexure VI (D)
10.2 Projects cleared in 2010-11, 2011-12, 2012-13 and 2013-14 :
For achieving the Bharat Nirman goals, level of utilisation of funds needs to be stepped up 4-5 times. Recognising the fact that expenditure on projects can also be increased by sanctioning

19
more projects, projects valued at Rs. 21688.62 crore, proposed by 23 States, to cover 71342.82 Km of road length were cleared during the year 2007-08. During the year 2008-09, the Ministry has cleared proposals of 25 States and one UT to cover a length of 90280.81 km at an estimated cost of Rs. 36806.55 crore.
The Ministry, vide DO No. H-12013/1/2009-RC dated 12th June, 2009 advised the States to submit project proposals falling only in the following four categories.
Residual new connectivity coverage envisaged under Phase-I of Bharat Nirman Projects to be taken up with the assistance of World Bank and Asian Development Bank New habitation connectivity in the 33 identified LWE affected districts Special road connectivity packages announced for the border areas.
Proposals falling under the above four categories were considered and cleared by the Ministry. During the year 2010-11, the Ministry has cleared proposals of 12 States to cover a length of 14708.51 km at an estimated cost of Rs.6532.97 crore. During 2011-12, project proposals for Rs 9188.46 crores covering a road length of 23884.35 km were cleared. Project proposals amounting to Rs 27013.94 crores (including bridges) covering a length of 56630.79 km were cleared during 2012-13.Project proposals to the tune of Rs 31,746.74 crores (including bridges) covering a length of 53,732.16 km have been cleared during 2013-14. The State-wise details are at Annexure VII (A). Details of Pre-Empowered Committee meeting are at Annexure VII (B) and details of Empowered Committee meeting at Annexure VII (C) & (D).
The status of proposals pertaining to districts sharing international borders and left wing
extremist affected districts is at Annexure – IV.
10.3 Time period allowed for completion of projects:- PMGSY is being implemented in accordance with the programme guidelines. In plain areas, the projects are to be completed within a period of 9 working months from the date of issue of the Work order. In case the period for execution is likely to be adversely affected by monsoon or other seasonal factors, the time period for execution is extended up to 12 calendar months. Where a package comprises more than one roadwork, the total time given for completion of the package is 12 months. In respect of hilly States where the work is executed in two stages, this time period will apply separately in respect of each stage. Time period for completion of projects (Stage I and CD works) under PMGSY has recently been modified. The time limit up to 18 calendar months has been permitted for completion of Stage-I works of hill roads (in hill States). Similarly, time period of 18-24 months has been permitted for completion of cross drainage works exceeding 25 meter length, depending on site conditions. 10.4 Recourse against delay Since time is the essence of the contract, action is required to be taken against the contractor in cases of delay, as per the contract provisions. Standard bidding document provides

20
for two courses of action against delay i.e. (i) Levying of liquidated damages if specified milestones are not achieved within the given time frame and (ii) In case of persistent delay, the contract is liable to be terminated. 10.5 Reasons for delay in implementation:- Some of the reasons for delay in implementation of the PMGSY projects are:-
Non-availability of qualified engineers Administrative delay including late award of projects Inadequate capacity of the PIUs due to the smaller work load handled by them earlier. At Nodal department or the SRRDA’s level also lack of capacity by way of man power is a
constraint. A very long rainy reason. Most of the construction materials such as cement, steel, bitumen, machinery, personnel to
handle machinery etc. are not locally available. Lack of contracting capacity as well as non availability of basic road making equipment such
as road roller, crushing plants, dumper/dipper and trucks. Non availability of land or the land falling under forest areas.
10.6 Measures taken for increasing contracting capacity
An expert Committee was constituted to review the Standard Bidding Document. On the basis of the recommendations of the Expert Committee, the following amendments have been made in the Standard Bidding Document:-
Standard Bidding Document amended in September 2006 & package sizes from Rs.50 lakh - Rs. 2 crore & Rs. 2 crore – Rs.10 crore allowed with differential qualification criteria to enable more contractors to participate.
Flexibility given to States in September 2006 to float packages above Rs.10 crore to induce participation by big contractors.
Joint ventures between big and small contractors permitted. For building capacity of the small and medium contractors, an interaction between contractors,
equipment manufactures, equipment leasing firms and financial institutions was held in Madhya Pradesh and Orissa. One more interaction is planned in West Bengal.
Performance incentive for timely completion introduced in September 2006 through higher weightage in qualification assessment in future contracts.
10.7 Recent amendment in the Standard Bidding Document:-
As per the existing provision, performance security of 5% is obtained from contractors at the time of execution of the agreement and another 5% is deducted from their running bills The Standard Bidding Document has been amended and upfront performance security amount to be obtained from the contractor has been reduced to 2.5%. The balance amount of 7.5% would be deducted from the running bills of the contractor. The revision is expected to enhance the pool of eligible contractors and thereby augment contracting capacity in the States.
11. Review of Programme Implementation

21
Regional Review Meetings and Workshops are regularly conducted to sensitize the Implementing Agencies in the States on how to implement PMGSY in a better way, with focus on project formulation and quality monitoring. In these meetings, State level implementing agencies, State Technical Agencies, Principal Technical Agencies and National Quality Monitors of all the States are covered. The main issues covered in the Regional Review Meetings are – Planning & Core Network, Capacity development, Progress of works, Quality management, Maintenance management, On-line Management, Monitoring and Accounting System (OMMAS), Training, Works accounting etc. Details of Review Meetings held during Financial Year 2010-11, 2011-12, 2012-13 and 2013-14 is as below:- Financial Year – 2010-11 S.No. Date Venue State(s) covered 01 22 July, 10 Bhubaneswar Bihar, Jharkhand, West Bengal,
Odisha and Chhattisgarh 02 23 July, 10 Bhubneshwar Odisha PIU review 03 12August, 10 Pune Maharashtra, Andhra Pradesh, Kerala,
Karnataka, Tamil Nadu and Gujarat 04 13 August,10 Pune Maharashtra PIU review 05 31 August.10 Dehradun Uttarakhand, Himachal Pradesh and
Jammu Kashmir 06 10 September.10 Delhi Madhya Pradesh, Rajasthan, Punjab,
Haryana and Uttar Pradesh 07 21 October, 10 Tawang All NE States 08 22 October, 10 Tawang Arunachal Pradesh PIU Review 09 12 November, 10 Dehradun Uttarakhand 10 8 February, 11 Shillong Meghalaya PIU review 11 10 February. 11 Kaziranga All NE States 12 24 February.11 |Jammu J&K, Himachal Pradesh, Uttarakhand,
Punjab, Haryana and Rajasthan Financial Year – 2011-12 S.No. Date Venue State(s) covered 01 21 June, 11 Mussoorie Uttarakhand 02 23 June, 11 Shimla Himachal Pradesh, Haryana and
Punjab 03 5 July, 11 Trivandrum Kerala, Karnataka and Tamil Nadu 04 11 October, 11 Lucknow Uttar Pradesh 05 26 - 27 Oct, 11 Patna Bihar and Jharkhand 06 30 Dec. 11 Bhubneswar Odisha and West Bengal 07 13 January, 12 Guwahati Assam, Arunachal Pradesh, Nagaland
and Sikkim 08 16 January, 12 Shillong Meghalaya, Manipur, Mizoram and
Tripura 09 19 January, 12 Bhopal Madhya Pradesh and Chhattisgarh 10 24 January, 12 Hyderabad Andhra Pradesh and Maharashtra 11 10 February, 12 Jaipur Rajasthan and Gujarat 12 2nd March, 12 Srinagar Jammu & Kashmir

22
PIU-wise review in the States of Assam, Chhattisgarh, Maharashtra, Orissa, Uttarakhand and West Bengal was also carried out. Financial Year 2012-13 Region
Date Venue State(s) covered
Eastern Apr 10-11, 2012 Bhubaneswar Odisha, West Bengal, Bihar, Jharkhand.
Northern May 22-23, 2012 Shimla J&K, Punjab, Haryana, Himachal Pradesh, Uttarakhand, Uttar Pradesh.
Southern Jul 10-11, 2012 Bengaluru Andhra Pradesh, Karnataka, Kerala, Tamil Nadu, Goa.
Central Aug 02-03, 2012 Bhopal Madhya Pradesh, Chhattisgarh
Western Sep 13-14, 2012 Jaipur Rajasthan, Gujarat, Maharashtra
North East Oct 10-11, 2012 Guwahati All North Eastern States
Northern 23-24 Nov. 12 Chandigarh J&K, Punjab, Haryana, Himachal Pradesh, Uttarakhand, Uttar Pradesh
Western 26-27 Dec. 12 Pune Rajasthan, Gujarat, Maharashtra
Southern 3-4 Jan. 13 Bengaluru Andhra Pradesh, Karnataka, Kerala, Tamil Nadu, Goa
Eastern 29-30 Jan. 13 Kolkata Odisha, West Bengal, Bihar, Jharkhand
Central 14 Feb. 13 Raipur Madhya Pradesh, Chhattisgarh North East 8-9 Mar. 13 Gangtok, Sikkim All North Eastern States Financial Year 2013-14 (Targeted Seven no.) For the period April 2013- March 2014 Region Date Venue State(s) covered
Northern 10-11 June, 2013 Srinagar, J&K J&K, Punjab, Haryana, Himachal Pradesh, Uttarakhand, Uttar Pradesh
Central 20-21 June, 2013 Lucknow, Uttar Pradesh
Madhya Pradesh, Chhattisgarh and Uttar Pradesh
Southern 1 -2 July, 2013 Thiruvananthapuram, Kerala
Andhra Pradesh, Karnataka, Kerala, Tamil Nadu, Goa
North East 30- 31 August, 2013 Agartala, Tripura All North Eastern States
Eastern 29-30 Nov. 2013 Ranchi Odisha, West Bengal, Bihar, Jharkhand
Western 5-6 Feb. 2014 Ahmedabad Rajasthan, Gujarat, Maharashtra North East 12-13 March 2014 Guwahati All North Eastern States
23
11.2 Review of Focus States: Keeping in view the time frame of Bharat Nirman and slow pace of achievement of set targets by some major States, it was decided to closely monitor this component. In this context, Review Meetings for stepping up the pace of implementation of Bharat Nirman were carried out in Focus States viz. Assam, Bihar, Jharkhand, Madhya Pradesh, Orissa and West Bengal. Review meetings with PIUs and State officials were carried out by the Directors of NRRDA/Ministry and the progress and status of implementation of the Bharat Nirman component was reviewed in the above States. 12. Amendment in PMGSY Programme Guidelines 12.1 Consolidated Guidelines of 1st Nov. 2004
Government had last issued the Guidelines of the Pradhan Mantri Gram Sadak Yojana
(PMGSY) on 7th January, 2003. As a result of close interaction with the State Governments, including Regional Reviews with the State Nodal Departments, Empowered Committee Meetings, and Reviews at the Minister’s level, it was felt necessary to further clarify some issues in the Guidelines relating to methodology of selecting roads, implementation through dedicated PIUs, quality assurance and execution of works. Consequently, supplementary guidelines/clarifications were issued on 5.3.04, 30.4.04, 5.7.04, 6.7.04, 16.7.04 and 25.8.04. All these clarifications and details have been consolidated along with the decision to allow upgradation of associated through Routes along with New Constructions, and the consolidated Guidelines have been circulated to States on 1st Nov. 2004. Further, incorporating all the circulars issued by Ministry / NRRDA regarding clarifications / amendments under PMGSY, Guidelines have been updated during April, 2012, which has been already circulated to all the States. 12.2 Amendment to Para 2.1 of the guidelines:- Para 2.1 of the PMGSY Programme Guidelines has been amended by the Ministry vide letter No. P-17025/6/2010-RC dated 11th October, 2013. The said Para stands substituted as under:- The primary objective of the PMGSY is to provide connectivity, by way of an All-Weather Road (with necessary culverts and cross-drainage structures, which is operable throughout the year), to the eligible unconnected Habitations in the rural areas with a population of 500 persons and above (Census 2001) in plain areas. In respect of ‘Special Category States’ (i.e. Arunachal Pradesh, Assam, Manipur, Meghalaya, Mizoram, Nagaland, Sikkim, Tripura, Himachal Pradesh, Jammu & Kashmir and Uttarakhand), the Desert Areas (as identified in the Desert Development Programme), the Tribal (Schedule V) areas and Selected Tribal and Backward districts (as identified by the Ministry of Home Affairs and Planning Commission*), the objective would be to connect eligible unconnected habitations with a population of 250 persons and above (Census 2001)”. 12.3 Amendment to Para 3.4 of the guidelines:-
Para 3.4 of the PMGSY Programme Guidelines has been amended by the Ministry vide letter No. P-17017/5/2011-RC(Part) dated 22.2.2013. The said Para stands substituted as under:-
”3.4 Para 2.1 above refers to Population size of Habitations. The population, as recorded in the Census 2001, shall be the basis for determining the population size of the habitation. The

24
population of all Habitations within a radius of 500 metre (1.5 km of path distance in case of Hills) may be clubbed together for the purpose of determining the population size. In the blocks bordering international boundaries in the hill States (as identified by the Ministry of Home Affairs), however, all habitations within a path distance of 10 km may be treated as a cluster for this purpose@ (@Substituted vide MoRD letter No. P-17023/38/2005-RC dated 29th February, 2008). This cluster approach would enable provision of connectivity to a larger number of Habitations, particularly in the Hill/ mountainous areas. Further, the Cluster approach in respect of Arunachal Pradesh State has been extended from International border blocks to International border districts of the State by clubbing population within a path distance of 10 km and treating as a Cluster for eligibility”. 12.4 Guidelines/ Norms for Pradhan Mantri Gram Sadak Yojana (PMGSY) –
Implementation in 82 Integrated Action Plan (IAP) Districts identified by Planning Commission.
(i) All habitations in Integrated Action Plan (IAP) districts, whether in Schedule V areas or
not, with a population of 250 and above (in 2001 Census) will be eligible for coverage under PMGSY.
(ii) In Integrated Action Plan (IAP) districts, cost of bridges upto 75 meters under PMGSY will be borne by the Government of India as against 50 meters for other areas. For longer bridges, pro rata costs beyond 75 meters and changes, if any, would be borne by the State Government. Cost of causeways, however, irrespective of their length, will be fully borne by the Government of India.
(iii)In case of LWE/ IAP districts, the minimum tender package amount is reduced to Rs. 50 lakhs.
12.5 Amendment in para 8.5 of the Programme Guidelines for Pradhan Mantri Gram Sadak Yojana
Vide Ministry’s letter no. P-12015/8/201-RC (pt) dated 17.12.2008, the existing para 8.5 (v)
of the Programme Guidelines has been substituted as under: 8.5 (v): “Rural Roads constructed under PMGSY must have proper embankment and drainage. Adequate number and type of Cross Drainage (CD) works, including causeways, where appropriate, must be provided based on site requirements ascertained through necessary investigations. Minor bridges (of single lane specifications only) may be provided where necessary. In case the length of an individual bridge exceeds 15m, a separate DPR will be prepared after site inspection jointly by the Superintending Engineer and the State Technical Agency. In case the length exceeds 25m, the project will be separately executed by the engineering division of the State Government having jurisdiction and the pro rata costs beyond 50m and agency charges, if any, will be borne by the State Government. Cost of causeways, however, irrespective of their length, will be fully borne by the Government of India. Vide letter No. P-17025/39/2010-RC dated 7-10-2010 the existing para 8.5 (v) of the Programme Guidelines has been substituted as under: In LWE districts (as identified by the Ministry of Home Affairs, Government of India), further amending para 8.5 of program guidelines amended on 17th December, 2008, cost of bridges up to 75m under PMGSY will be borne by the Government of India. For long span bridges, pro rata costs beyond 50m and agency charges, if any, will be borne by the State Government. Cost

25
of causeways, however, irrespective of their length, will be fully borne by the Government of India.
12.6 Amendment in para 11.5 of the Programme Guidelines for Pradhan Mantri Gram sadak Yojana
With the use of annual State Schedule of Rates it is expected that on average the tendered value would approximate the estimated value. All costs due to time over run, arbitration / judicial award shall be borne by the State Government. In case the value of tenders received is above the estimate that has been cleared by the Ministry, the difference (tender premium) pooled for the entire State for works cleared in a phase / batch will be borne by the State Government. Corresponding data changes in OMMAS should be endorsed by the SRRDA.
In case there is material change in the scope of work or quantities, prior approval of NRRDA shall be obtained and difference absorbed in the District level surplus failing which net savings at State level will be used for the purpose. Data change in OMMS in such cases would be made with NRRDA authorisation. 12.7 Amendment to Para 18.4 of the PMGSY - Regulation of the Programme, Administrative and Maintenance expenditure – sub-para
“(ix) in addition to the existing system of bank authorization, State Rural road Development Agency (SRRDA) may adopt an alternative system in which each PIU will prepare an authorization statement on the basis of bills passed by it every fortnight and send to the SRRDA. The authorization statement shall contain the details of the payment namely name of work and package number, name of authorized payee and his bank account number, sanctioned amount of the project, expenditure on the project upto previous fortnight and amount payable to him during the current fortnight for each package. Based on the authorization statement, the SRRDA shall issue an authority letter/ online payment instructions to the bank to credit the amounts in the accounts of the payees mentioned in the authorization statement under intimation to the PIU for making necessary entries in the Cash Book”. 12.8 Relaxations in the PMGSY Guidelines for IAP district
(i) All habitations in Integrated Action Plan (IAP) districts, whether in schedule-V areas or not, with a population of 250 and above (in 2001 census) will be eligible for coverage under PMGSY as against the population of 500 in other areas.
(ii) In Integrated Action Plan (IAP) districts, cost of bridges upto 75 metres under PMGSY will be borne by the Government of India as against 50 metres for other areas.
(iii) In case of LWE/IAP districts, the minimum tender package amount is reduced to 50 lakh.
(iv) The time limit upto 24 calendar months would be allowed for completion of work. However, no extra liability, if any, on account of cost escalation shall be met from the programme fund provided by the Ministry of Rural Development, Government of India.
(v) While formulating estimates and preparing DPRs, cost of insurance premium against risks such as damaging or burning of plants and machinery etc. of contractors can also be included.
26
(vi) The difference in cost between CC road and bituminous road would be shared by Centre and States concerned in the ratio of 90:10 instead of 50:50 in the case of other States. Proposals of such CC roads up to 20% of the total newly proposed roads in the highly affected blocks can be accepted as against 10% in respect of other States.
(vii) General approval under Section 2 of Forest (Conservation) Act, 1980 for diversion of forest land up to 5 ha for selected public infrastructure projects in IAP districts has been given and orders have been issued.
Relaxation for districts under IAP to revise their Core Network for inclusion of left-out habitations (as per 2001 census).
At the time of preparation of Core Network in the districts affected by Left Wing Extremism proper survey could not be carried out due to law and order problems or inaccessibility of terrain. Therefore, some habitations were left out from inclusion in the Core Network, hence, depriving these habitations of connectivity. At the time of preparation of Core Network, the assessment of surface condition of the already existing roads could not be properly carried out in such areas and some of the habitations have been shown as connected though the surface condition of these roads is not in conformity with the specifications of PMGSY. The concerned States requested for considering these roads under New Connectivity/ Up-gradation. The issue was also placed in the 14th meeting of the Empowered Group of Officers held on 2nd December 2011, Chaired by Member Secretary, Planning Commission which accorded in-principle approval. Thus taking into consideration that inclusion of such left out/wrongly shown as connected habitations for providing connectivity would help in inclusive growth of these remote areas, Cabinet approved the following on 17th May, 2012:
(i) to revise the Core Network for inclusion of 6,000 left-out unconnected habitations (as per 2001 census) in 78 (now 82) Selected Tribal and Backward Districts in the 9 States under Integrated Action Plan (IAP) and to provide new connectivity to these habitations, at an estimated cost of Rs.7,500 crore; and to allow upgradation of some selected roads out of the roads, the assessment of surface condition of which could not be carried out properly at an estimated cost of Rs.1,000 crore.
12.9 Addition to Para 19.3 of the PMGSY Programme guidelines 2004 regarding submission of documents for release of funds to the SRRDAs. 13. Executing Machinery
States have been advised to make the following institutional arrangements:
(i) A State Rural Roads Development Agency (SRRDA) or similar body with distinct legal status, to receive PMGSY funds and act as nodal point for rural road sector policy and management.
(ii) Executional arrangements overseen at State Level by officers of the SRRDA including State Quality Coordinator (SQC), Financial Controller, Empowered Officer, IT Nodal Officer etc.
(iii) Programme Implementation Units (PIUs) at Division/District Level for managing the programme, accountable to the SRRDA.

27
(iv) Arrangements for efficient management, including :- - Online Management, Monitoring and Accounting System (OMMAS)
- 3 tier quality control - Transparent tendering using Standard Bidding Document
(v) Separate Bank Accounts for ‘Programme’, ‘Administrative’ and ‘Maintenance’ funds, centrally managed by the Agency and operated by the PIUs.
(vi) Each State Government shall set up a State-level Standing Committee (headed by the chief Secretary or Additional chief Secretary) including all the main stakeholders of the programme viz; Secretaries of the Departments of Rural Developments, Panchayats, PWD, Forests, Finance, Revenue and Transport. The State Technical Agencies and State Informatics Officer (NIC) may also be invited to participate.
The Committee shall vet the Core Network, the CNCPL and CUPL and shall clear the annual project proposals. The Committee shall also
(a) monitor progress and quality control. (b) resolve issues relating to land availability and forest/environment clearance. (c) oversee maintenance funding arrangements for the Core Network. (d) review capacity at SRRDA and PIU levels including financial management and on-line
monitoring; and (e) ensure convergence of development programmes including transport facilities on the
constructed roads.
14. Special interventions for States where State implementation capacity is inadequate
(a) Bihar: - Tie-up with Central Executing Agencies
The Government of Bihar intimated the Ministry of Rural Development the consent on 28th June 2004 vide State Government’s Resolution that it would like to engage, on its behalf, Central Agencies for implementation of PMGSY projects in the State. Accordingly, Tripartite Agreements were executed with Central PSUs - NHPC, NBCC, NPCC and IRCON –, the State Government and the Ministry on 31st August, 2004 for execution of PMGSY projects in Bihar. 33 of the 37 districts of the State (Araria included in Purnea) have been assigned to these Agencies. The remaining 4 districts have been assigned to CPWD. These Agencies have mobilised their organisational resources and have commenced the implementation process.
Functioning of NEAs in Bihar
The Progress of implementation of PMGSY projects in Bihar was reviewed in the meeting held on 15.06.2004 in Patna. It was informed in the meeting that out of 299 road works sanctioned under Phase-I (2000-01), only 127 works were completed and out of 668 road works sanctioned under Phase-II (2001-02), only 45 works were completed. In order to accelerate the pace of implementation of PMGSY projects in Bihar, it was agreed on the request of State Government to entrust implementation of the scheme from Phase-III onwards to selected Central Agencies. Pursuant to this, a resolution was issued by the State Government vide letter dated June 28, 2004, conveying the formal concurrence of the State

28
Government for entrusting execution of PMGSY projects to Central Agencies. Thereafter, a Tripartite Agreement was signed on 31.8.2004 by the State Government, the Ministry of Rural Development and the following Central Agencies:
(i) M/s IRCON International Limited. (ii) M/s National Buildings Construction Corporation Limited. (iii) M/s National Projects Construction Corporation Limited (iv) M/s National Hydro-electric Power Corporation Limited. (v) CPWD
Since then, PMGSY projects of Phase-III onwards were being implemented in Bihar by the Central Agencies till Phase-VII. The NEAs were entrusted total 3,591 road-works i/c Bridges measuring 18,904 Kms valuing Rs. 8,345 cr. After de-sanctioning of some works, net sanction is for 2,872 road-works i/c Brides measuring 15,616 kms valuing Rs. 6739 cr. The NEAs have completed 2,671 road-works i/c bridges (93%) measuring 14,582 km valuing Rs. 5728 cr. The detailed status is at Annexure-XIX.
(b) North East/Hill States: - Tie-up with BRO & NBCC
The issue of slow progress of PMGSY in a few States figured in the Consultative Committee Meeting on 10.4.2003. Visits of a Team of National Quality Monitors (NQMs) also indicated that there were serious problems in North Eastern States including lack of security, inadequate technical expertise, organisational deficiencies etc. and it was decided to explore whether, with the concurrence of the State Governments concerned, outside Technical Agencies could be inducted to impart the requisite professionalism to the execution of the Programme. After prolonged negotiations, tripartite agreement was signed by M/s. NBCC Ltd., Government of Tripura and Ministry of Rural Development by which M/s. NBCC Ltd. will execute PMGSY work in West Tripura and South Tripura. Similar agreement has also been signed with M/s Hindustan Steelworks Construction Limited for implementation of PMGSY works in North Tripura and Dhalai districts of Tripura.
(c ) Jharkhand
The Principal Secretary, Rural Development Department, Jharkhand vide letter dated 20th June, 2007, informed that the Government of Jharkhand has given their consent for execution of PMGSY works through three Central Agencies, viz., M/s. National Buildings Construction Corporation Ltd. (NBCC), M/s. National Projects Construction Corporation Ltd (NPCC) and M/s. Hindustan Steel Works Construction Ltd (HSCL).
Tripartite Agreements have since been signed between the State Government of Jharkhand,
the Executing Agency and the Ministry of Rural Development. The details are given below:-
Tripartite Agreement with
Date of signing the agreement
Districts where the agency will implement the programme
M/s. NBCC Ltd. 5.12.2007 Gumla, Lohardaga, and Garhwa districts.
M/s. NPCC Ltd. 11.12.2007 East Singhbhum, West Singhbhum and Latehar districts.
29
M/s. HSC Ltd. 20.12.2007 Bokaro, Hazaribagh, Ramgarh, Chatra, Dhanbad, Koderma, Giridih and Palamu districts.
(d) Uttarakhand
In order to overcome the capacity constraints in the State, the State Government has been advised in June 2005 that they may engage Project Implementation Consultants by outsourcing the tasks to assist PIUs.
The State Government has also been advised in December 2005 that they may chalk out a detailed work plan, also indicating any special efforts required for achieving the Bharat Nirman goals. The Ministry has conveyed its willingness to consider all such options and extend all possible support to the State Government, upon receipt of a detailed proposal from the State. (e) Dispensation to NE States
i. With an aim to provide connectivity to a larger number of habitations in the blocks bordering international boundary in the 7 North Eastern States namely Arunachal Pradesh, Manipur, Meghalaya, Mizoram, Nagaland, Sikkim, Tripura, a special dispensation has been made that all habitations within a path distance of 10 km in the blocks bordering international boundary in the hill States (as identified by the Ministry of Home Affairs), which include aforesaid States may be treated as a cluster for this purpose. This cluster approach would enable provision of connectivity to a large number of habitations.
ii. A special dispensation has been allowed to Arunachal Pradesh under PMGSY by
extending the Cluster approach to all International border districts in the State by clubbing population within the path distance of 10 km and treating as a Cluster, which would make about 126 more unconnected habitations (tentative) eligible for connectivity.
iii. Under PMGSY-II, the pattern of assistance is 90:10, ie. 90% as Central Share and 10%
as State Share in the 7 North Eastern States namely Arunachal Pradesh, Manipur, Meghalaya, Mizoram, Nagaland, Sikkim, Tripura.
15 Measures taken to ensure quality and transparency 15.1 On-line Management, Monitoring and Accounting System (OMMAS) On-line Management, Monitoring and Accounting System (OMMAS) for the PMGSY is in place to effectively monitor the entire Programme and bring about greater efficiency, accountability and transparency in implementation. The OMMAS facilitates the operational requirements of planning, scheduling, monitoring, tracking and execution in implementing the PMGSY scheme. OMMAS is intended to serve the requirement of decision-making authorities at various levels, quality monitors, DPIU’s, NRRDA and MoRD. Considering the period as well as usage of the OMMAS application and based on the user inputs including the changes in the level of operations and in view of the latest developments in terms of technology, OMMAS is re-designed and re-developed.

30
Features of OMMAS 2 Generic Design To maintain accounts of funds of different types (Programme Fund, Administrative Expenses Fund,
Maintenance). Cash Book can be maintained Agency Wise and Stream Wise. The system can be easily extended to maintain the accounts of similar schemes.
Monitor PMGSY II Works Extended to monitor the works sanctioned under PMGSY II with a provision for scrutiny by Principal Technical Agency after scrutiny by State Technical Agency.
Post 5 year Maintenance Works completed and which are in maintenance can be monitored after capturing the
agreements details for maintenance.
Quality Monitoring Mobile application based quality monitoring of works is extended to other hand held devices and extended from National level Quality Monitors to the State level Quality Monitors of all the states.
Role based Dashboards OMMAS presents the module wise data in a readable and easy to analyze format for the user
based on his role.
In-Page Functionality with easy Navigation All modules are designed for operational ease by providing all the required details within the page; no need to move out of the page to view details of other records. The menus are available to the user as per the assigned roles and responsibilities enabling the user to traverse between modules with ease
15.2 Standard Bidding Document
31
A Standard Bidding Document has been developed for the Programme after the study of good procurement systems and best national and international practices. The work of development of Standard Bidding Document was given to the experts of the field. The procurement process and Standard Bidding Documents of various States, MoRTH, World Bank and ADB etc. were studied and the development of draft documents was completed. The draft was subjected to the process of thorough review and consultation by experts and the State Governments. The document has been prescribed for use by the Executing Agencies of the State Governments with effect from 2003-04. The Standard Bidding Document has the following main provisions:- (i) The tender will be invited for construction as well as maintenance of the road work for five
years. (ii) The technical qualification of the contractor in terms of the bidding capacity, the experience
of civil engineering works and in relevant field, possession of requisite machinery and equipments and financial capacity etc. will be evaluated before opening of the financial offer.
(iii) The responsibility of establishment of Quality Control laboratory and mandatory testing will be of the contractor and the contractor will be required to employ requisite engineering and technical staff.
(iv) The funds for the construction will be provided through the Pradhan Mantri Gram Sadak Yojana and the funds for maintenance of the road work for five years will be provided by the State Governments.
Based on the experiences of the States by using the document and feedback from other stakeholders, 11 amendments have been made in SBD. 15.3 e-Procurement under PMGSY
As per the PMGSY Guidelines, a well established procedure for tendering through competition is required to be followed for selection of agencies to execute the projects sanctioned under the Scheme. Keeping in view the comparative advantage of e-Tendering, the Ministry of Rural Development had decided for eTendering w.e.f April, 2009 and presently all States are procuring the works under PMGSY through e-Tendering. Details of e-Procurement made by the States are enclosed as Annexure-VIII. 15.4 Execution Capacity Execution of PMGSY is being done by the State Government. States are required to get the PMGSY works executed within the given time frame and with the requisite quality. The analysis of execution capacity of the State is calculated on the following parameters.
(i) Dedicated no. of PIUs for execution. (ii) No. of SQMs in place with the State for second tier quality monitoring. (iii) Last three years expenditure made by the State to analyze the contracting
capacity.
Based on the above three parameters, the minimum capacity is taken as a capacity of the State.

32
This capacity is again divided in three parts and each part multiplied by the factor based on
(a) Expenditure of the State (b) Maintenance Expenditure in last three years (c) No. of Inspection carried out by the Second Tier Quality Monitoring system.
These three are again added which gives the capacity of the State for execution of work. Based on these capacities, States are advised to enhance their capacity. State-wise execution capacity as on 1.4.2013 is given as per Annexure IX 15.5 Quality Assurance Mechanism under Pradhan Mantri Gram Sadak Yojana PMGSY Guidelines emphasize upon quality centered implementation strategies and recognize quality as essence of the Programme. To bring execution of the Programme to the desired high quality standards, a three tier quality management mechanism has been institutionalized under PMGSY. The first tier of this mechanism is in-house quality control at Programme Implementation Unit (PIU) level. Objective of this tier is process control through mandatory tests on material and workmanship at field laboratory. A Quality Assurance Handbook (in 4 volumes) has been developed and provided to field functionaries to facilitate better understanding of the quality control requirements, equipment and testing procedures, management systems and also to rationalize the frequency tests. The concept of stage passing through prescription of testing by various levels of field functionaries has also been introduced in order to ensure clear accountability. Establishment of field laboratory has been linked with first payment. The second tier is a structured independent quality monitoring at the State level in which provision of regular inspection of works has been envisaged for product control. In this tier, every work is to be inspected at three stages, i.e. initial stage, middle stage and final stage of construction. In order to have uniform and structured inspections at the second tier, Technical Guidelines have been prescribed to the States in August, 2010. These guidelines contain detailed instructions for inspections and frequency of tests to be carried out. Under these guidelines, the State Quality Monitors (SQMs) are also required to upload abstracts of inspections and 10 digital photographs of each inspection on OMMAS. In view of limited availability of monitors in the States, a standard document for outsourcing of State Quality monitoring has also been prescribed. The statement Showing quality grading of works inspected by SQMs in various States from November 2010 to March,2014 (the date from which the uploading of SQM reports was made mandatory on OMMS) are at Annexure X (A)1 - Annexure X (A)5. Under the third tier, independent National Quality Monitors (NQMs) are deployed by NRRDA for inspection of road works at random not only to monitor quality but also to provide guidance of senior professionals to the field functionaries. The National Quality Monitors are senior engineers retired from the State Governments or Government of India organizations, empanelled on the basis of the criteria fixed by NRRDA. The NQMs are required to inspect the works and record observations as per the prescribed guidelines. The guidelines for NQM inspections have been made objective and based on defined methods of observation including clarity on actionable points. Guidelines for photographic recording of inspections by NQMs have also been prescribed. To ensure effective and uniform reporting of the quality issues, orientation programmes are organized for NQMs in coordination with the Indian Academy of Highway Engineers (IAHE).

33
The observations of NQMs are sent for action to the State Governments and Action Taken Reports (ATRs) are monitored at NRRDA. In order to bring more transparency in the process, States have been advised to widely publicize the NQM inspections.
An independent Selection Committee comprising Secretary General (IRC), Chairman, Director (IAHE), Director General (Retd.) – Shri S. C Sharma, MoRTH, Dr. Praveen Kumar, PTA Coordinator , Dr. CSRK Prasad, PTA Coordinator , representative of CRRI – Head Flexible pavement Division, members and Director P-III ,NRRDA, convener, considers the C.Vs of fresh candidates and makes recommendations for the empanelment of new NQMs. The Executive Committee of NRRDA approves the empanelment of new NQMs. Similarly, performance evaluation of existing NQMs is also carried out by an independent Performance Evaluation Committee comprising officers from STAs/PTAs. The proceedings of the independent Performance Evaluation Committee are placed before the Selection Committee for its recommendation. Year wise statement showing quality grading of works inspected by NQMs in various States from November,2010 to March,2014 (the date from which the uploading of NQM reports was made mandatory on OMMS) are at Annexure X (B)1 - Annexure X (B)5 . Statements showing Abstract of SQM/NQM inspection with reference to ongoing/completed works in various States from January 2011 to March, 2014 are at Annexure X (C) & Annexure X (D). 15.6 Citizen information boards
Citizen information boards are displayed in local language at prominent locations in the benefited habitations indicating the volume of materials used in each layer of the pavement.
15.7 Inspection of PMGSY works by public representatives
State Governments have been advised to arrange joint inspection of ongoing as well as completed works under PMGSY by Hon’ble MPs, Hon’ble MLAs and functionaries of Panchayati Raj Institutions. The arrangements of joint inspection are as under:-
• The Superintending Engineer concerned of the zone/region will request Hon’ble MP and Zilla
Pramukh representing that zone/region once in six months to select any PMGSY project(s) for joint inspection. The schedule of joint inspection will be fixed as per the convenience of Hon’ble MP/Zilla Pramukh.
• The Executive Engineer in-charge of a division will request Hon’ble MLA/Chairperson of the Intermediate Panchayat concerned once in three months for joint inspection of any PMGSY project(s) as per their choice and according to their convenience.
• Similarly, the Assistant Engineer in charge of the sub-division will request the concerned
Sarpanch of the Gram Panchayat once in two months to select any PMGSY project(s) for joint inspection. Joint inspection of the project(s) may be arranged as per their convenience.
16. Sound Technical Base for PMGSY

34
The Rural Roads Manual has been approved and printed by the Indian Roads Congress (IRC) as a Special Publication (IRC:SP-20:2002). This Manual provides a firm technical base for the road works that are being taken up under the PMGSY. In order to streamline the process of estimation and to standardise contracts, a separate Book of Specification, Procurement & Contract Management Manual and a Standard Data Book have been published in the IRC.
17. Principal & State Technical Agencies The Ministry have identified 60 State Technical Agencies (STAs), which are National Institutes of Technology and Government Engineering Colleges of repute, in consultation with the State Governments and the Central Road Research Institute, New Delhi, to advise and assist the Executing Agencies, on behalf of the Ministry, on technical matters relating to PMGSY. The STAs are expected to scrutinise the project proposals prepared by the State Governments, provide requisite technical support to the State Governments, undertake Quality Control tests for the State Governments and undertake Training Programmes and Research Projects at NRRDA’s instance. The NRRDA has also identified 7 Principal Technical Agencies (PTAs), generally IITs, to act as the Regional Coordinators of the STAs as well as the extended arms of NRRDA in the pursuit of its objectives. The role and responsibilities of the PTAs include overseeing the activities of the STAs in the region, training, R&D, quality audit etc. The list of STAs and PTAs is at Annexure XI-A and XI-B. The Principal Technical Agencies have now been advised to check 2-3% of the number of Detailed Project Reports cleared by the State Technical Agencies. Projected traffic volume, being an important design parameter, has a significant bearing on cost of the road works. Similarly, recognising the need to test the assumptions underlying traffic projections, the STAs/PTAs have also been requested to conduct traffic volume studies on the roads constructed/improved under PMGSY upto December, 2003. 18. IEC Activities
Rural Connectivity becomes a critical component in the socio-economic development of rural people by providing access to amenities like education, health, marketing etc. It has been established that investments in rural roads lifts rural people above the poverty line. The evidence also indicates that as the rural connectivity improves, the rural poverty levels come down. Various studies undertaken by the Ministry reveals the scheme has made positive impact on Agriculture, Health, Education etc., which significantly contribute in building the rural economy. RC Division has produced a short film on PMGSY (‘Chalte Rahe Zindagi’) projecting the success stories and impact of PMGSY, through National Film Development Co-operation (NFDC). The film has been made in both English and Hindi for the State of Himachal Pradesh and Rajasthan 19. Training and HRD 19.1 Training Training of Engineers and personnel involved in implementation of PMGSY at PIU and SRRDA level has been one of the interventions determining the quality of project outcomes.

35
The training of PMGSY officials are conducted through SIRDs located in each State. These training are funded by grant to SIRD as per training rules. Specific courses to the requirement of States have also been conducted through National Level training institutes. Such trainings are funded by NRRDA and are conducted as per Standard 2,3 and 6 days modules for training of PMGSY Engineers developed by NRRDA. Various training programme have been organized by NRRDA at National Level Institutes such as Central Road Research Institute (CSIR), New Delhi and Indian Academy of Highway Engineers (MoRTH, GOI), Noida, Uttar Pradesh for senior officers and at State Level at various states institutes of Rural Development for Junior Officers. During the year 2011-12, 1930 officers have been provided training on the basis of training module developed by NRRDA for 2, 3 and 6 days by expert faculty recommended by NRRDA for respective topics During the year 2012-13, 1908 officers have been provided training. Further, during 2013-14 (upto Mar’14) 2085 officers have been provided training.
S.No Programme 2011-12 2012-13 2013-14
1 SIRD Training Programme(State Level)
590 149 658
2 NIRD Training Programme (State Level)
498 210 23
3 IAHE Training Programme (National Level)
557 387 624
4 CRRI Training Programme (National Level)
217 295 217
5 World Bank Training (National Level)
68 374 282
6 Training & Workshop (National Level)
- 493 281
1930 1908 2085 19.2 National Conference and Exposition on Rural Roads (a) National Conference on Asset Management on Rural Roads Rural roads constructed under PMGSY or any other programme requires regular and timely maintenance to keep them at least at minimum acceptable serviceability levels. However, as of now, this is not happening as desired due to several reasons including constraints of resources and lack of organized institutional arrangements. Realizing the fact that the assets created are to be preserved through appropriate asset management strategy, a national conference on "Asset Management on Rural Roads" was organized during 28th and 29th April, 2009 at Hyderabad jointly by NRRDA and APSRRDA. During the conference, three technical sessions, one group discussions and an experience sharing

36
session were scheduled, where administrators, state engineers, other senior engineers, subject domain experts and representatives of multilateral organizations like, World Bank and ILO, participated. Several issues were discussed during the conference and many key issues for effective asset management were identified and deliberated upon. (b) Interactive Workshop on performance of NQMs and STAs An interactive workshop on performance of STA/PTAs and the NQMs was held at Bhubneshwar during 12th - 13th Aug, 09. STAs from the States of Arunachal Pradesh, Assam, Bihar, Chhattisgarh, Jharkhand, Manipur, Meghalaya, Mizoram, Nagaland, Orissa, Sikkim, Tripura and West Bengal and NQMs and SQCs having their Head quarters in the States of Andhra Pradesh, Arunachal Pradesh, Assam, Bihar, Chhattisgarh, Jharkhand, Karnataka, Kerala, Manipur, Meghalaya, Mizoram, Nagaland, Orissa, Sikkim, Tamil Nadu, Tripura and West Bengal participated in the Workshop. Newly empanelled NQMs also attended the workshop. The workshop was held in two parallel sessions. In one session, the performance of STAs and project scrutiny issues were discussed and in the other, the performance of existing NQMs along with the training programme for the newly empanelled NQMs was carried out. (c) Workshop on Government e-Procurement Project (GePNIC) for States dealing with
PMGSY.
Ministry of Rural Development has decided to procure PMGSY works through eTendering. In this direction, a workshop on Government e-Procurement Project (GePNIC) for States dealing with PMGSY Programme was organized during 15-16 September, 2009 wherein experts from NIC, officials of NRRDA and MoRD and representatives of State Governments were present. NIC and States of Orissa, Tamil Nadu and West Bengal made presentation on their e-tendering systems during the workshop. Hands on training on GePNIC Software were also a part of the workshop. As an outcome of the workshop, training on GePNIC software is being imparted in the States covered under first phase of implementation of e-Procurement.
19.3 PIARC (World Road Association) Seminar:
Keeping in view importance of maintenance, PIARC International Seminar on Sustainable Maintenance of Rural Roads was held during 21-23rd January, 2010 at Hyderabad. The objective of the seminar was to provide a common platform for practitioners to share experiences and deliberate the issues and challenges associated with the planning, provision and maintenance of rural roads in a sustainable way. Innovations with respect to involving local communities throughout the process also formed a part of the overall objective of the Seminar. The Seminar was focused on the Indian experience of dedicated National Programme on Rural Accessibility PMGSY, Sustainable Accessibility and Planning the Development of Rural Road Network, Implementing Sustainable Maintenance, Community Participation and the way forward
Exposition on Prime Minister's Rural Roads Programme (PMGSY) Alongside the Seminar, a small photo exposition was organized showing the details of PMGS'Y, India's national programme of rural connectivity. Participants viewed and discussed the valued

37
information on PMGSY and practices for construction of low volume roads shown in this exposition. Inauguration of Seminar and Exposition Shri Pradeep Jain, Hon'ble Union Minister of State for Rural Development and Shri B. Satyanarayana, Hon'ble Minister of Panchayat Raj, Andhra Pradesh inaugurated the Seminar and Exposition on 21st January, 2010. The occasion was graced by the presence of many other dignitaries. Participation The Seminar was attended by about 500 participants from India and 20 international participants including delegates from Bolivia, Burkina Faso, France, Finland, Italy, Mexico, Nepal, Norway, Sri Lanka, Switzerland, Thailand and USA. Themes and Presentations during the Seminar The Seminar covered the four themes related to maintenance of rural roads and experts of eminence from various International and national organizations made presentations on the topics and technical sessions were attended by stakeholders from organizations over the globe. Details are as follows: Theme I: PMGSY in India Theme II: Sustainable Accessibility and Planning the Development of Rural Road Network. Theme III: Implementing Sustainable Maintenance Theme IV: Community Participation 19.4 International Seminar on Rural Roads Seminar on Sustainable Maintenance of Rural Roads : Second International Seminar on Sustainable Maintenance of Rural Roads was organized at Santa Cruz, Bolivia during 10th -12th March, 2011 followed by the seventh and the last meeting of TC- A4 Committee of PIARC for cycle 2008-2011 on the 13th March, 2011. The seminar was organized by Bolivian Highways Administration called ABC supported by PIARC. The International seminar was seen as an opportunity to understand the scenario of development of rural infrastructure in Latin American countries. Since the socio-economic parameters and geo-climatic conditions of Bolivia have considerable similarities to those in India, it was felt that the exposure to Bolivia and projection of achievements in PMGSY implementation of India would be helpful. A delegation of 4 members was deputed to attend the Seminar. The delegation was headed by Shri. Prabha Kant Katare, former Director, NRRDA. The other members of the delegation are:
• Shri. K.C. Dhimole, CEO, Arunachal Pradesh Rural Roads Development Agency,
Arunachal Pradesh • Dr. I.K. Pateriya, Joint Director (Technical), NRRDA • Shri. S.R. Mehar, Under Secretary, MoRD
Socio climatic conditions of Bolivia are quite similar to those in India. About 70% of the
population of Bolivia lives in 3 cities and rest of the population lives in rural areas and this was the difference when compared to India. The scenario of road development in Bolivia is relatively

38
weaker compared to India in general. It was a matter of great satisfaction that implementation of PMGSY in India was presented before almost all the Latin American countries and it was taken as one of the most successful programme in the world on providing rural accessibility.
International Seminar on “Performance Based Road Maintenance Contracting” at Orlando, Florida, USA.
The International Road Federation had invited officers of National Rural Development Agency as extended invitation for participation in the latest addition of his Projective Seminar series five day programme of presentation with two days field exposure and discussion about performance based road maintenance contracting and preservation held from 30th October to 8th November, 2011. In Orlando, Florida, USA upon international experts representing his field of maintenance contract management, finance of sustainable policies development have presented best practices and case studies in maintenance contracting and preservation. Participants had been engaged in working groups with experts who are actively involved in Maintenance Contracting and Asset Management to discuss application of best practices under different country conditions on following agenda:-
• Lessons and Principles of Output and Performance Based Road Maintenance Contracting. • Trends in Private Participation in Roads. • Financing Road Maintenance Programmes. • Model Contract Documents. • Output and Performance Based Contracting. • Maintenance Management issues and Requirements. • Best Practices & Sustainability in Maintenance. • Outsourcing Maintenance in Developing Countries. • Innovative Financing & Risk Issues (PPP). • Environmental Benefits of Road Maintenance. A delegation of 7 members was deputed to attend the Seminar. The delegation was headed by
Shri Rohit Kumar, Director (RC), MoRD. The other members of the delegation are: (i) Shri N.C. Solanki, Director (Projects-I), NRRDA (ii) Shri K.K. Srivastava, Chief Engineer, PWD, Uttarakhand. (iii)Shri M.M. Sun, Chief Engineer, PWD, Meghalaya (iv) Smt. Anjana Devi, Technical Advisor, Govt. of Jharkhand. (v) Shri Anurag Asthana, Senior Engineer, UPRRDA, Uttar Pradesh (vi) Shri S.S. Bhatia, Assistant Director (Projects-I), NRRDA Orlando, Florida (USA) is a city in the Central region of United States of Florida. According
to 2010 census, the city having area of 101 square mile with land area of 93.5 sq mile and having water 7.5 square mile and had a population of 238,300 making Orlando the 79th largest city in the United States.
Summary and Key Issues to Success Asset Maintenance a crucial aspect. Asset Maintenance Contract types: Corridor, Geographic, Facilities, Bridge. Incorporating existing resources into contracts. Selection of Contractor on Price and Technical proposal. Determination of ultimate customers i.e. Department or Traveling Public or anyone dealt
with.

39
Long term success requires, building a constructive relationship with the Asset Maintenance Contractor including Employee Development.
Coordination of scope with industry. Use of clear & comprehensive defined Standard & Scope of Services against well
established performance measures to maximize programme success and consistency. Use of established procedures and policies scope for dynamic changes.
19.5 Interactive session for faster preparation/formulation of proposals to obtain
clearance of PMGSY projects under Forest (conservation) Act:- More and more habitations in remote areas are being taken up now for road connectivity under PMGSY. In order to provide road connectivity to habitations in remote areas, it is sometimes required to construct/upgrade roads or portion thereof through forest areas which necessitates clearance under the Forest (conservation) Act, 1980 and its subsequent amendments. It takes much time at the State level to process and prepare the required documents for sending to the regional office of the Ministry of Environment and Forest in order to obtain the clearance under Forest (conservation) Act. Process simplification for faster preparation/formulation of proposal is required for timely implementation of PMGSY projects. For identification of the problems and working out suggestions for process simplification, a meeting was held with the officers of the MoEF, MoRD and the State Govt. of Himachal Pradesh and Uttrakhand on 27.02.09 in NRRDA. It was decided in the meeting to organise interactive sessions with the officials of State Rural Road Development Agency (SRRDA)/ Programme Implementation Units (PIUs), implementing the programme (PMGSY) in the State and the forest department of the State Governments. The first inter-active session was held at Shimla on 29.05.09. 20. Maintenance of Rural Roads
PMGSY is a huge Central investment in the State sector as part of a poverty reduction strategy. This investment, in essentially the ‘last mile’ connectivity, is likely to be useful only if the main rural road network, particularly the rural Core Network is maintained in good condition. In the context of a farm-to-market connectivity, proper maintenance is essential if risks of long term investments, on-farm as well as off-farm, are to be taken by the rural entrepreneur. Accordingly, the institutional measures to ensure systematic maintenance and providing adequate funding for maintenance of the rural core network, particularly the Through Routes, will be key to the continuance of the PMGSY programme in the State. To this end, State Governments need to take steps to build up capacity in the District Panchayats and endeavour to devolve the funds and functionaries onto these Panchayats in order to enable them to manage maintenance contracts for rural roads.
All PMGSY roads (including associated Main Rural Links / Through Routes of PMGSY
link routes) will be covered by 5-year maintenance contracts, to be entered into along with the construction contract, with the same contractor, in accordance with the Standard Bidding Document. Maintenance funds to service the contract will be budgeted by the State Government and placed at the disposal of the SRRDA in a separate Maintenance Account. Since rural Through Routes / Main Rural Links carry comparatively larger traffic and keeping them in good condition is particularly important, Through Routes (whether upgraded under PMGSY or subjected to maintenance contract as an associated Through Route of a PMGSY link route) on expiry of 5-year post-construction maintenance shall be placed under Zonal
40
maintenance contracts consisting of 5-year maintenance including renewal. The State Government will make the necessary budget provision and place the funds to service the zonal maintenance contracts at the disposal of the SRRDA in the Maintenance Account. Maintenance funds- Commitment, Release, Expenditure for all years State-wise as per Annexure –XII. 20.1 Pavement Condition Index (PCI)
The PCI data is an integral part of the OMMAS and the data will be included in the “Road Master” for each kilometer. The PCI data collected will be entered in the OMMAS data base by the PIU. The States shall get the PCI survey of the core network conducted once in 2 years immediately after the rainy season. The PCI survey will be repeated every 2 years and prioritization of roads for upgradation and or maintenance shall be redrawn accordingly. The measurement of the condition rating of Rural Roads can be done by several methods such as (i) Measurement based on visual Inspection only (ii) based on Riding Comfort and (iii) based on comfortable Driving Speed possible. In order to get the PCI of the road, the arithmetic means of the condition assessed for each km is taken if the kilometer-wise PCI is varying within a small range. However, if the variation of PCI is large from section to section of the road under consideration, the road is to be divided into homogeneous sections and the arithmetic means of PCI is taken for each section. State-wise PCI abstract for Core Network (For PCI data of last 3-years is given as per Annexure XIII. 21. Research and Development At present following is the normal procedure followed in funding the R&D projects by Ministry of Rural Development under PMGSY.
1. The product proposed to be used and the technology shall get accreditation from Indian Roads Congress (IRC).
2. After getting the accreditation, the material supplier shall contact one or more state SRRDAs and convince them about the efficacy of the product and its application in their state.
3. The material supplier should engage a technical consultant and involve the state Engineers, where the pilot project is proposed, in preparing a DPR supported by data through appropriate investigations.
4. While preparing the DPR, the cost of the proposed road with new technology and conventional technology are to be worked out and compared to prove the economic viability and cost effectiveness.
5. While submitting the proposal through SRRDA, the Product manufactures/ Agents should give undertaking to the following effect:
a. The product required for the pilot project road shall be given as a free sample,
while the cost involved in the construction of other components will be given by Ministry of Rural Development.
b. The material suppliers shall engage any competent technical agency to help the field engineers and the contractor’s engineers in the construction of road with their product and build capacity through formal and on-spot training.
41
c. The company should agree to carryout post construction performance monitoring for a minimum period of 18 months, in association with the Technical Advisor.
Indian Roads Congress has accredited more than 48 materials/ technologies for use on Pilot Basis for a period of 2 years. A list of these Materials/ Technologies is available on their website: www.irc.org.in The following R&D initiatives have so far been taken in association with the concerned agencies:-
(i) Use of Jute Geo Textiles in Rural Roads: – Cost of road construction being higher in poor soil, R&D findings on the benefits of using Jute to improve soil strength is being further investigated. In order to prove the efficacy of the use of Jute Geo Textiles in Rural Road Construction at field level, a Pilot Project has been initiated and the Jute Manufactures Development Council (JMDC), an Agency of Ministry of Textiles was identified as the nodal agency for the Pilot Project which in turn has retained Central Road Research Institute (CRRI), New Delhi as Technical Consultant. An MOU was signed between NRRDA and JMDC. 10 Road works for the Pilot Project were selected in the States of Assam, Chhattisgarh, Madhya Pradesh, Orissa and West Bengal, taking two roads in each state.
The Detailed Project Reports for the selected road works, prepared by JMDC under
the guidance of CRRI, were cleared by Empowered Committee. The SRRDAs tendered, awarded and executed the works following the provisions of SBD with necessary special conditions.
Nine road works have been completed and performance evaluation of these roads is
being carried out by CRRI. One road work could not be started due to local unfavorable conditions and has been dropped from the pilot project. Performance report is yet to be received from CRRI.
Details of these road works executed are available in Annexure XIV (A).
(ii) Rural Roads Pavement Performance Study: – Rural Roads Pavement Performance Study was initiated on the recommendations of the Workshop conducted for PTAs/ STAs, in order to enable the evaluation of the following: (i). Efficacy of the current design procedures for sustainability. (ii). Trends in the growth pattern of the traffic plying on the roads under different socio-
economic environments. (iii). The progression of deterioration of the pavements over a period of time under
different field conditions. 15 institutions for carrying out Rural Roads Pavement Performance Study were identified and MoU were signed. Final Report has been received from most of the Institutes. IIT, Chennai has been nominated to carry out analysis and modeling at local and global level with the data of all institutes.

42
(iii) Technology Demonstration Projects:-
States are encouraged to submit Technology Demonstration Projects along with regular proposals. Projects received from States are scrutinized and submitted to Empowered Committee for recommendation and approval from Ministry of Rural Development.
States were requested vide letter No. P-17012/2/2004-Tech. to adopt soil stabilization
techniques where CBR is below 3 and STAs will ensure that appropriate soil stabilization techniques have been proposed.
A Pilot Project using Cold Mix Technology for 500 km in the State of Assam was
sanctioned in 2010. The State has informed that it has already completed 500 km road length using Cold Mix Technology.
Letters have been circulated to all the States to take up Pilot Projects using any of the materials/ technologies accredited by IRC in their annual proposals.
Technology Demonstration Projects for 24 road works using Cement Concrete (Cell filled and interlocking concrete block), Gravel, Lime Stabilized, Slag Stabilized, Coir and RBI-811 were considered under PMGSY in the State of Karnataka.
Letters have been circulated to the States of Andhra Pradesh, Assam, Chhattisgarh, Jharkhand, Karnataka, Madhya Pradesh, Orissa and Tamil Nadu to take up Rural Road Projects with Coir Geo Textiles covering a length of about 50 Km in each State either under New Connectivity or Upgradation.
Letters have been circulated to all the States to take up Rural Road Projects, for about 100 Km on pilot basis, using Cold Mix Technology in the construction of surface layer of Rural Roads under PMGSY, if so allowed in the State.
List of road works taken up under R & D is placed at Annexure – XIV (B). A Workshop was organized on 18th February, 2012 at Central Road Research Institute, New Delhi on Non Conventional Materials/ Technologies in order to create awareness among the field engineers, to bridge the gap between laboratory and the field construction techniques and to demonstrate the use of locally available materials, new materials and waste materials. The Workshop was attended by representatives of more than 20 States. 22. Consideration of Proposals of Members of Parliament
Following are the main provisions in the PMGSY Guidelines for consultation with Members of Parliament: - (i) The Core Network and District Rural Roads Plan is finalized by District Panchayat after
giving full consideration to suggestions of MPs (Para 4.6). (ii) The Comprehensive New Connectivity Priority List (CNCPL) and Comprehensive
Upgradation Priority List (CUPL) will be prepared after consultation with MPs and taking their suggestions. (Para 6.4).

43
(iii) Lok Sabha Members will be consulted in respect of their constituencies and Rajya Sabha Members in respect of that district of the State they represent for which they have been nominated as Vice-Chairman of the District Vigilance & Monitoring Committee of the Ministry of Rural Development. (Para 6.10).
(iv) In preparing Annual proposals for road works, the proposals of MPs will be given full
consideration as follows.
• The Block or District CNCPL / CUPL should be sent to each MP with the request that their proposals on the selection of works out of the CNCPL / CUPL should be sent to the District Panchayat. It is suggested that at least 15 clear days may be given for the purpose.
(Para 6.9 (i)). • In order to ensure that the prioritisation has some reference to the funding available, the
size of proposals expected may also be indicated to the Members of Parliament while forwarding them the CNCP / CUPL list. District / Block-wise allocation may be indicated to enable choice with the requisite geographical spread. It is expected that such proposals of Members of Parliament which adhere to the order of Priority would be invariably accepted subject to considerations of equitable allocation of funds. (Para 6.9 (ii)).
• The proposals received from the Members of Parliament by the stipulated date should be
given full consideration in the District Panchayat which should record the reason in each case of non-inclusion, and the Members of Parliament should be informed of the inclusion / non-inclusion of their proposals along with the reasons in each case in the event of non-inclusion. It would be preferable if the communication is issued from the Nodal Department at a senior level. (Para 6.9 (iii)).
23. Initiatives under PMGSY
The Rural Road Programme has taken many new initiatives and established several new standards in its endeavour to construct roads of the highest possible quality. The new initiatives taken as part of the PMGSY programme include the following. 23.1 Development of Rural Roads in 82 Selected Tribal and Backward Districts under IAP
For inclusive growth a number of initiatives have been taken.
Special Dispensation accorded to 82 Selected Tribal and Backward Districts under IAP by Ministry of Rural development:
(i) All habitations in 82 Selected Tribal and Backward Districts under IAP, whether in Schedule V areas or not, with a population of 250 persons and above (in 2001 Census) will be eligible for coverage under PMGSY.
(ii) In 82 IAP districts, cost of bridges up to 75 meters under PMGSY will be borne by Government of India as against 50 meters for other areas.
(iii) In case of 82 IAP districts, the minimum tender package amount has been reduced to Rs. 50 lakh to attract more response to bids.
44
Special Dispensation accorded to 82 Selected Tribal and Backward Districts under IAP by Ministry of Environment and Forest:
General approval under Section 2 of Forest (Conservation) Act 1980 for diversion of forest land up to 5 ha for creation of critical public infrastructure projects in 60 IAP districts has been given and orders have been issued, which covers rural roads.
Workshop on “Appropriate Development Strategies for effective implementation of the schemes of Rural Development in 60 IAP Districts”
A Workshop on “Appropriate Development Strategies for effective implementation of the schemes of Rural Development in 60 IAP Districts” was also held by the Ministry of Rural Development and the Planning Commission on 13th September, 2011 in which Principal Secretaries / Secretaries dealing with Rural Development Programmes of all the nine IAP States and District Collectors / CEO Zila Panchayats/PD DRDAs of all the 60 IAP Districts were invited in addition to the Secretaries of various Ministries / Departments of Government of India and Experts from various fields.
Recommendations of the Workshop on PMGSY
The workshop on “Appropriate Development Strategies for effective implementation of the schemes of Rural Development in 60 IAP Districts” held on 13.9.2011, after detailed deliberations, made the following recommendations vis-à-vis 60 IAP districts:
(i) Construction of critical Cement-Concrete (CC) Roads in highly affected blocks in 60 IAP districts may be permitted
(ii) Manual tendering may be allowed in some highly-affected blocks of such districts for a limited period of one year.
(iii) Clustering of PMGSY roads for creating greater synergy may be considered in such districts.
(iv) Assessment criteria of bid capacity of contractors may be relaxed in such districts so that smaller contractors can also participate in PMGSY works.
(v) The time period of execution of road works in these districts may be enhanced from the existing 18 months to 24 months.
(vi) National Rural Roads Development Agency (NRRDA) may examine use of modern ground improvement techniques and use of pre-fabricated bridges to expedite construction in such districts.
23.2 Formulation of District Rural Roads Plan For the first time systematic District Rural Roads Plans have been prepared listing out the complete network of all roads in the district i.e., Village Roads, Major District Roads, State Roads and National Highways. 23.3 Implementation of concept of Core Network The concept of Core Network has been operationalised for the first time in order to focus on the set of roads which are considered essential to provide connectivity to all habitations of the desired
45
size. The Core Network is the basic instrumentality for prioritisation of construction and allocation of funds for maintenance. The order of priority and the Comprehensive New Connectivity Priority List (CNCPL) / Comprehensive Upgradation Priority List (CNCPL) are the twin basis for taking up Annual proposals.
Further, during Feb’2013, cabinet approved for updation of PMGSY for revision of Core
Network to include 1278 no.s of left out unconnected habitations in Schedule-V areas & BADP (other than 82 IAP districts), 1410 no.s left out unconnected habitations of 250+ in hill states and dessert areas, 9112 no.s of Left out unconnected habitations from inclusion in original Core Network with 500 above population and 126 no.s of additional unconnected habitations of 250+ in Arunachal Pradesh for International Border districts. 23.4 Consultation with public representatives The PMGSY has an inbuilt mechanism for consultation with public representatives from Panchayat to Parliament at various points of the programme. Consultation with Members of Parliament is held at both the Core Network finalisation and Annual Proposals stages. In addition, at the stage of preparing DPRs, the DPIU conducts a transect walk along the road alignment, involving the local panchayat. 23.5 Rural Roads Manuals The original Manual, called Manual on Route Location, Design, Construction and Maintenance of Rural Roads was brought out by the Indian Roads Congress as a publication in 1979 (IRC: SP:20-1979). Following the launch of the PMGSY, the Ministry of Rural Development constituted 3 Committees in January 2001 to go into various aspects of rural road construction and the manuals on these different aspects brought out by the committees were combined into a separate ‘Rural Roads Manual’ and published as an IRC publication (IRC:SP 20-2002) in supersession of earlier manual. Subsequently, IRC has prepared and published the following codes, which will help in design of low volume rural roads. IRC:SP:62-2004 (Guidelines for the design and construction of cement concrete pavements for rural roads), IRC:SP:63-2004 (Guidelines for the use of Interlocking concrete block pavement), IRC:SP:68-2005 (Guidelines for construction of roller compacted concrete pavements), IRC:SP: 72-2007 (Guidelines for the design of flexible pavements for low volume rural roads), and IRC:SP:77-2008 (Manual for design, construction and maintenance of Gravel roads). Revision of the Chapters on CD Works is being taken up for achieving cost effectiveness and is at approval stage by IRC council. 23.6 Review of Geometric design parameters.
An Expert Committee to review the Standards, Specifications and Design of rural Roads for achieving economy in the cost of construction under Pradhan Mantri Gram Sadak Yojana (PMGSY) was constituted. Subsequently the committee held consultative meetings with the State Representatives. Based on the deliberations, recommendations on road Geometrics in hill states as well as plain and rolling terrains have been finalized and communicated to all the states concerned.

46
The recommendations made help to reduce the cost of construction and also facilitate Rural Road construction in the areas of land constraints. 23.7 Use of new technology and materials The focus given to Rural Roads through the PMGSY is now enabling the channelization of R&D efforts to this sector. Use of cement concrete, modified bitumen, jute Geotextile, fly ash as well as soil stabilisation techniques and other new methodologies, including waste plastic are all being pursued. 23.8 Outsourcing of technical inputs In order to manage the programme at the national level and yet ensure that adequate technical inputs are locally available for planning and execution of rural roads programme, an elaborate structure consisting of Principal Technical Agencies (national level technical institutions) as well as State Technical Agencies (regional level technical institutions) has been successfully brought into the framework of the programme planning and execution through a Government – academia partnership.
24. National Rural Roads Development Agency
The National Rural Roads Development Agency (NRRDA) has been set up as a society under the Societies Registration Act on 14th January, 2002 to provide technical support to the programme. The NRRDA provides support on the following:-
1. To provide inputs to Ministry of Rural Development for framing appropriate Action
Plan for effective and optimum result oriented implementation of PMGSY keeping in view the broad policies/guidelines and the budgetary resources made available by the Ministry of Rural Development.
2. Scrutiny of the proposals received from States and Union Territories for consideration by the Ministry of Rural Development.
3. To deal with matters relating to State Rural Roads Development Agencies (SRRDAs),
monitor their progress in respect of the road-works with particular reference to time frame for completion, Technical Specifications, Project Appraisal and Quality Control methods, expenditure incurred by the State / Union Territories, planning for and plantation of other suitable trees on both sides of the rural roads. To hold meetings of the Performance Review Committee/ Regional Review Committee for periodic review of progress of PMGSY and send periodic reports to the Ministry on the progress of implementation of road works by the States or Union Territories.
4. To interact with State Governments, other Ministries/ Departments, national and
international Bodies (ADB, WB, PIARC etc.) with a view to take concerted action for effective and meaningful implementation of PMGSY in a convergent manner.
5. To seek sufficient budgetary support for PMGSY from Ministry.
6. To undertake study, research activities, Pilot Projects, etc. and evaluate different
technologies in respect of Rural Roads, and advise on appropriate design and

47
specifications of rural roads including bridges and culverts, measures to improve the Quality and Cost-norms of the Rural Roads.
7. To appoint reputed Technical Institutions as Principal Technical Agencies and State
Technical Agencies to perform the tasks to be entrusted to them and Independent Monitors from among serving or retired Engineers, Academicians, Administrators and other Agencies, with experience in Rural Roads and to review their performance.
8. To oversee and inspect through Independent Monitors, the execution of the road-works
cleared by the Ministry and being implemented by States or Union Territories through their Executing Agencies.
9. To arrange suitable Training Programmes for functionaries involved in the
implementation of the Rural Roads Programme; organise or sponsor to Workshops and Seminars in respect of Rural Roads and publish books, literature, print, audio-visual, publicity material in respect of the PMGSY.
10. To provide guidance to States in the matter relating to accounts and financial
management of PMGSY, to monitor and follow up for compilation and audit of Accounts by the SRRDAs and review their Action Taken Reports on Audit observations.
11. Timely re-payment of principal amount of loan and payment of Interest to NABARD.
12. To maintain and upgrade OMMAS through an engaged agency (C-DAC) and monitor
the progress made by SRRDAs in respect of updation of OMMAS including On-line generation of Accounts and submission of proposals for release of funds to Ministry of Rural Development.
General Body
As per Clause 11 of Rules and Regulations – Bye Laws of NRRDA the number of Members of the General Body shall not exceed 21. The Members of the Agency shall be nominated by the President. The General Body shall meet normally once in 6 months but at least once every year, on such date, time and place as may be determined by the President.
Executive Committee
As per Clause 18 of Rules and Regulations – Bye Laws of NRRDA there shall bean Executive Committee of the Agency and shall comprising the Director General- Ex-officio Chairman, 5 Members to be appointed by the President, of which one shall be Finance Member and the remaining 4 shall be from among the Principal Technical Agencies. The Executive Committee shall meet as often as is necessary but at least once in two months.
The details of meetings of General Body and Executive Committee held in 2011-12 and 2012-13 are enclosed at Annexure XV.. 25. Impact Assessment 25.1 Impact Assessment of PMGSY was conducted during January – February 2004 in 9 States.

48
25.2 M/s. Lea Associates South Asia Pvt. Ltd. was engaged (on 29th June, 2005) as a National Consultant to conduct a poverty-impact survey of Pradhan Mantri Gram Sadak Yojana on the rural population and also to study the satisfaction level of road-users. The study covers ten States, namely, Assam, Bihar, Himachal Pradesh, Karnataka, Mizoram, Madhya Pradesh, Orissa, Rajasthan, Uttar Pradesh and West Bengal.
25.3 Nationwide impact assessment study of PMGSY was organized with the help of independent research agencies with CMI Social Research Centre, New Delhi as Nodal Agency. Report was submitted in March 2011. The study has covered 17 States, 50 districts and 748 habitations and 18655 households interviewed. The major findings of study include:
Impact on Agriculture:- Easier access to markets and improved flow of
information attributed to improvements in agricultural production and incomes of the farmers
Impact on employment generation:- 35% households reported increase in no of days of employment in principal occupation.
Impact on income and poverty alleviation: - 63% households reported an increase in the average annual income in their principal occupation and 65% reported increase in average annual in all occupations.
Impact on health aspects:- In 87% habitations their has been a reduction in travel time to reach nearest health facility.
Impact on education:- Provision of all whether road facilitated creation of infrastructure, institutions, increase in manpower and other improvements in educational aspects.
26. Finance and Accounts of Project
The State level autonomous agency designated as State Rural Development Agency (SRRDA) for each State receives Funds for the PMGSY Works from MoRD/NRRDA. Funds receive for construction of New Roads, up gradation of Existing Roads, sign board and such other activities that MoRD specify are kept by SRRDA in Programme Fund Account. Funds received for various Administrative Expense for the items specified in the charts of Accounts of PMGSY Administrative Expense Fund are kept in Administrative Expense Account. In the state of Bihar besides SRRDA, nominated executing agencies namely NBCC, NHPC, NPCC, IRCON and CPWD have also been entrusted the construction of PMGSY Roads in selected districts are related directly to them.
The SRRDA’s and NEA’s are responsible for rendering their accounts audited from a Chartered Accountant selected from a panel approved by the C&AG of India, within six months from closure of the Financial Year. This account is supported by a statement of Bank Reconciliation, utilization certificate. Banker certificate indicating the balance amount on date of issue of the certificate and interest credited is submitted to sate Nodal Department and the MoRD. NRRDA also provide the Training on OMMAS (R&P) Module and Accounts.
26.1. Status of Audited Accounts Audited Financial Statements furnished by SRRDA/NEA are reviewed by NRRDA and
shortcomings, if any, communicated to the concerned SRRDA/NEA under intimation to MoRD.
49
However, CPWD, executing PMGSY work in the State of Bihar, sends the income and
expenditure account directly to MoRD.
There are 28 SRRDAs and 5 NEAs in the State of Bihar and 1 NEA in Jharkhand State.
The State of Andhra Pradesh, Arunachal Pradesh, Assam, Chhattisgarh, Gujarat, Himachal
Pradesh, Jharkhand, Madhya Pradesh, Maharashtra, Nagaland, Odisha, Punjab, Rajasthan, Sikkim,
Uttar Pradesh and Uttarkhand have prepared the Balance Sheets for the year 2012-13 based on
OMMAS.
The status of submission of Balance Sheet to MoRD/ NRRDA is given in Annexure-XVI
26.2 Interest accrued on Programme/Administrative Expenses funds by SRRDA
As per Para 18.8 of PMGSY Programme Guidelines, money accruing as interest credited
in the Programme Fund Account will be credited to the same account. The expenditure out of this
interest amount will be guided by the instructions / guidelines to be issued by the Ministry of
Rural Development/NRRDA from time to time. The Bank shall intimate to the State-level Agency
the interest amount credited by it to the Account on quarterly basis.
The progressive amount of Interest on Programme fund as well as Administrative
Expenses Fund:-
Interest accrued on Programme Fund by all the States except Goa up to 31.3.2012 is Rs.
1963 crore and up to 2012-13 is Rs. 3148 crore respectively, out of which Rs. 1055 crore pertain
to FY 2012-13 (which is un-audited). Similarly, interest accrued on Administrative Expense Fund
by all the States except Goa up to 31.3.2012 is Rs. 35 crore and up to 2012-13 is Rs. 43 crore
respectively, out of which Rs. 8 crore pertain to FY 2012-13,(which is un-audited).
State-wise details are as per Annexure XVII. 26.3. OMMAS
The Online Management, Monitoring and Accounting system (OMMAS) has been designed as an Online web based system with centralized database. The OMMAS consist of 9 Modules namely Master Data, Rural Road Plan, Proposal, Tendering, Execution, Quality monitoring, Accounting & Fund Flow, Maintenance and Security & Administration. Detailed procedure for making data Entry in the respective Modules is given in OMMAS User manual version 2.0. One of the parameter (Para 19.3(e) of PMGSY Programme Guidelines) for release of second installment of Programme Fund in a year to SRRDA is that the output of the relevant Modules of OMMAS has been certified by the concerned SRRDA as correct. Further, as Para 12.1(ix) of PMGSY Programme Guidelines, the release of Administrative Expense Fund is dependent on continuous updation of

50
OMMAS Module. The status of data entry in the Receipt & Payment module is given in the Annexure-XVIII.
27. Formulation Pradhan Mantri Gram Sadak Yojana –II (PMGSY-II) Scheme
At the start of 12th Five Year Plan, many States have substantially completed New connectivity and Upgradation under PMGSY and many other States are likely to be in the same position within a year or two. 2. Keeping in view the asset value of the road network, it is increasingly essential to ensure that assets already created are maintained and yield services as originally envisaged before going on undertaking commitments for creating more assets. Hence, a programme, called PMGSY-II, is being conceived on sharing basis to consolidate existing rural road network by upgradation, renewal and maintenance of the vast network already created. In order to formulate the draft policy for the PMGSY-II, discussions were also held with experts in Rural Roads sector on 24th April, 2012. Also the discussions were held with some of the States. 3. Based on above discussions, a draft “Concept Paper” has been prepared to obtain the comments and suggestions of all the States and UTs. 4. Need for Consolidation of Rural Road Assets- Justification of the Scheme: It is proposed that PMGSY-II consolidates the existing rural road network. It would cover Upgradation of existing selected rural roads based on a criterion to make the road-network vibrant. The selection of routes would be with the objective of identification of rural growth centres and other critical rural hubs, rural places of importance (connectivity to other growth poles, market, rural hub, tourist places etc.). Development of Rural Hubs & growth centres are crucial to the overall strategy of facilitating poverty reduction through creating rural infrastructures. Growth centres/rural hubs provide markets, banking and other service facilities enabling and enhancing self employment and livelihood facilities. They also help ensure raw materials and labour inputs for off-farm activities. They will also help bring the benefits of economic growth to the rural hinterland, including white goods, automobiles etc. PMGSY-II, by recognising growth centres/rural hubs and facilitating their connectivity to the hinterland will catalyse livelihood based programmes, including the Nation Rural Livelihoods Mission (NRLM) launched in the 12th FYP.
*********

Annexure ‐ I
DescriptionNumber of eligible
unconnected habitations
Total target as per Cabinet Note of September, 2006 1,72,772
Target after reconciliation of Core Network data 1,68,268
Non feasible habitations, habitations reported as connected underState Schemes and dropped out habitations 32,798
Balance target of eligible unconnected habitations 1,35,470
Left out Habitations in Bihar, Manipur and Rajasthan due torevision of their core network as a result of permitting them to takehabitations (as per guidelines) instead of revenue villages as unitof connectivity in 2010
14,369
Additional habitations having population 250-499 persons in 82Selected Tribal and Backward Districts in 9 States underIntegrated Action Plan (IAP)
9,010
Total target of eligible unconnected habitations at present 1,58,849
Left out habitations in 60 selected Tribal and Backward Districts in9 States under Integrated Action Plan (IAP) 6,000
Number of habitations which have been sanctioned under PMGSYtill Oct’2013 144717
Balance Eligible unconnected habitations to be sanctionedincluding additional habitations 33,467
Total proposed target of eligible unconnected habitations afterupdation of PMGSY for revision of Core Network to include 1278no.s of left out unconnected habitations in Schedule-V areas &BADP (other than 82 IAP districts), 1410 no.s left out unconnectedhabitations of 250+ in hill states and dessert areas, 9112 no.s ofLeft out unconnected habitations from inclusion in original CoreNetwork with 500 above population and 126 no.s of additionalunconnected habitations of 250+ in Arunachal Pradesh forInternational Border districts, as per approval of cabinet duringFeb’2013.
1,78,184
Statement showing number of eligible unconnected habitations under PMGSY

1000+ 500+ Total 1000+ 500+ Total 1000+ 500+ Total1 2 3 4 5 6 7 8 9 10 11 12 13
1 Andhra Pradesh 159 77 236 151 70 221 0 0 0 221 94%2 Arunachal Pradesh 32 71 103 28 65 93 1 3 4 97 94%3 Assam 5940 0 5940 5092 0 5092 241 0 241 5333 90%4 Bihar 16578 0 16578 8369 0 8369 919 0 919 9288 56%5 Chhattisgarh 1453 2378 3831 1156 2000 3156 17 145 162 3318 87%6 Goa ** 0 2 2 0 2 2 0 0 0 2 100%7 Gujarat 417 915 1332 396 861 1257 2 12 14 1271 95%8 Haryana 0 0 0 0 0 0 0 0 0 0 NR9 Himachal Pradesh 149 773 922 122 528 650 0 0 0 650 70%
10 Jammu & Kashmir 614 854 1468 379 551 930 34 76 110 1040 71%11 Jharkhand 1280 1711 2991 1036 859 1895 53 63 116 2011 67%12 Karnataka 6 11 17 6 11 17 0 0 0 17 100%13 Kerala 73 0 73 70 0 70 0 0 0 70 96%14 Madhya Pradesh 4640 2150 6790 4524 2205 6729 13 47 60 6789 100%15 Maharashtra 121 174 295 116 174 290 0 0 0 290 98%16 Manipur 80 311 391 69 133 202 6 29 35 237 61%17 Meghalaya 9 119 128 7 38 45 0 8 8 53 41%18 Mizoram 31 99 130 31 79 110 0 14 14 124 95%19 Nagaland 7 30 37 7 29 36 0 0 0 36 97%20 Odisha 3596 2076 5672 3510 1574 5084 8 25 33 5117 90%21 Punjab 8 42 50 8 42 50 0 0 0 50 100%22 Rajasthan 734 3350 4084 678 2892 3570 33 310 343 3913 96%23 Sikkim 16 138 154 15 110 125 1 5 6 131 85%24 Tamil Nadu 83 0 83 82 0 82 0 0 0 82 99%25 Tripura 175 635 810 161 518 679 1 9 10 689 85%26 Uttar Pradesh 4097 0 4097 4080 0 4080 0 0 0 4080 100%27 Uttarakhand 134 638 772 89 351 440 1 13 14 454 59%28 West Bengal 6954 0 6954 5505 0 5505 385 0 385 5890 85%
Total 47386 16554 63940 35687 13092 48779 1715 759 2474 51253 80%29.04.2014
**No Report after Mar09. Data from MPR # No target fixed for UTs
Total connected
upto Mar14
* Cumulative achievement is the achievement up to 'Mar'14 against the overall target for 2005-12.
% Connected
Annexure - II (A)Bharat Nirman-Habitation connectivity
Fig. upto Mar'14
Sl. No. State Nos.of Habitation to be connected as
per BN Tgt Hab connected upto Mar'13 Habitations connected during 2013-14
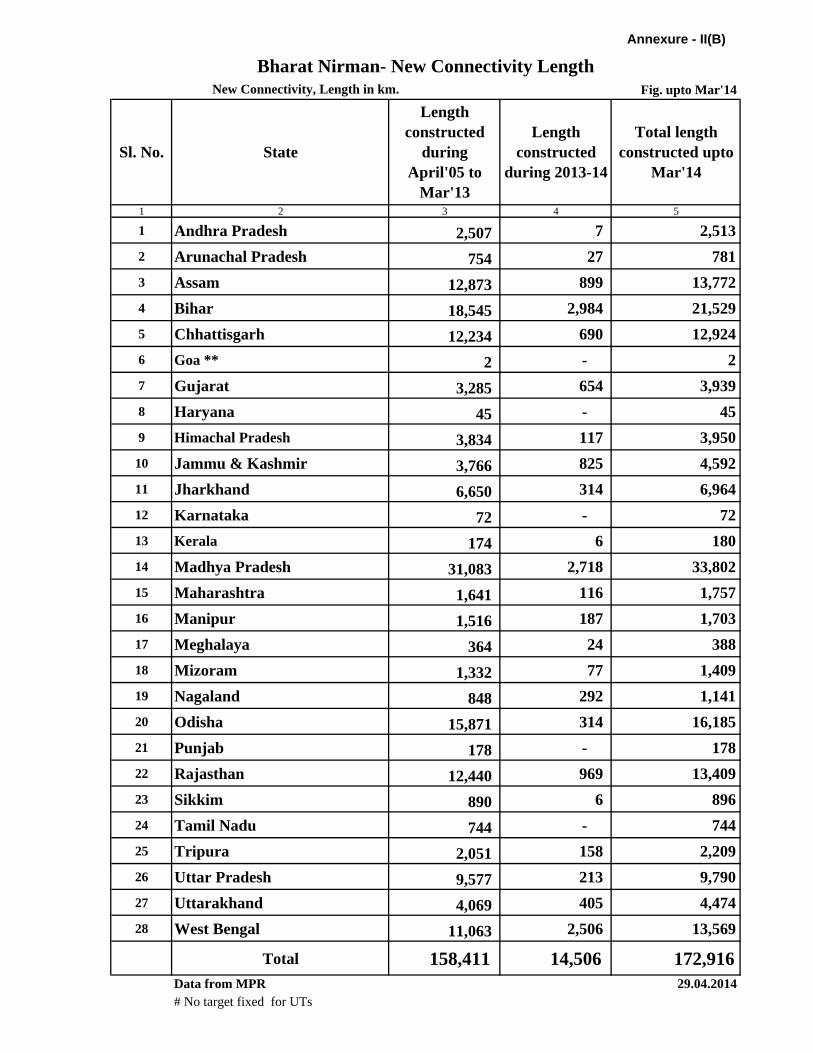
Annexure - II(B)
Fig. upto Mar'14
1 2 3 4 5
1 Andhra Pradesh 2,507 7 2,513 2 Arunachal Pradesh 754 27 781 3 Assam 12,873 899 13,772 4 Bihar 18,545 2,984 21,529 5 Chhattisgarh 12,234 690 12,924 6 Goa ** 2 - 2 7 Gujarat 3,285 654 3,939 8 Haryana 45 - 45 9 Himachal Pradesh 3,834 117 3,950
10 Jammu & Kashmir 3,766 825 4,592 11 Jharkhand 6,650 314 6,964 12 Karnataka 72 - 72 13 Kerala 174 6 180 14 Madhya Pradesh 31,083 2,718 33,802 15 Maharashtra 1,641 116 1,757 16 Manipur 1,516 187 1,703 17 Meghalaya 364 24 388 18 Mizoram 1,332 77 1,409 19 Nagaland 848 292 1,141 20 Odisha 15,871 314 16,185 21 Punjab 178 - 178 22 Rajasthan 12,440 969 13,409 23 Sikkim 890 6 896 24 Tamil Nadu 744 - 744 25 Tripura 2,051 158 2,209 26 Uttar Pradesh 9,577 213 9,790 27 Uttarakhand 4,069 405 4,474 28 West Bengal 11,063 2,506 13,569
Total 158,411 14,506 172,916 Data from MPR 29.04.2014# No target fixed for UTs
Length constructed
during 2013-14
Total length constructed upto
Mar'14
Bharat Nirman- New Connectivity LengthNew Connectivity, Length in km.
Sl. No. State
Length constructed
during April'05 to
Mar'13

Length ( in Km)
Upgradation Renewal Total Upgradation Renewal Total Upgradation Renewal Total1 2 3 4 5 6 8 9 10 11 12 13
1 Andhra Pradesh 8,597 11,033 2,900 13,933 - - - 11,033 2,900 13,933 2 Arunachal Pradesh - - - - - - - - - - 3 Assam 6,495 34 600 634 3 - 3 37 600 637 4 Bihar(RWD) 544 - 544 30 - 30 573 - 573
Bihar(NEA) 3,397 - 3,397 78 - 78 3,475 - 3,475 5 Chhattisgarh 8,449 1,562 2,085 3,647 237 - 237 1,799 2,085 3,883 6 Goa * 760 - - - - - - - - - 7 Gujarat 4,529 2,717 13,524 16,241 - 775 775 2,717 14,299 17,016 8 Haryana 3,761 3,230 2,833 6,063 - 8 8 3,230 2,841 6,071 9 Himachal Pradesh 4,713 2,398 5,519 7,916 18 - 18 2,416 5,519 7,934 10 Jammu & Kashmir 2,936 429 953 1,382 66 - 66 495 953 1,448 11 Jharkhand 6,220 - 476 476 - - - - 476 476 12 Karnataka 10,294 9,376 3,694 13,070 - - - 9,376 3,694 13,070 13 Kerala 2,201 657 1,372 2,029 187 125 311 844 1,496 2,340 14 Madhya Pradesh 18,627 13,826 5,580 19,407 288 - 288 14,114 5,580 19,695 15 Maharashtra 17,337 11,030 8,489 19,519 - 77 77 11,030 8,566 19,596 16 Manipur - 392 - 392 - - - 392 - 392 17 Meghalaya 1,840 13 - 13 - - - 13 - 13 18 Mizoram 733 - - - - - - - - - 19 Nagaland 864 379 201 580 - 97 97 379 298 677 20 Odisha 14,161 6,519 6,153 12,672 156 308 464 6,675 6,461 13,137 21 Punjab 5,071 2,841 2,017 4,858 - - - 2,841 2,017 4,858 22 Rajasthan 13,075 11,852 19,330 31,182 - 3,532 3,532 11,852 22,862 34,714 23 Sikkim 433 26 - 26 - - - 26 - 26 24 Tamil Nadu 11,115 6,217 12,589 18,807 490 - 490 6,707 12,589 19,296 25 Tripura 1,172 90 204 294 117 112 229 207 316 523 26 Uttar Pradesh 28,523 17,771 48,453 66,224 57 - 57 17,828 48,453 66,281 27 Uttarakhand 3,443 35 1,353 1,387 - - - 35 1,353 1,387 28 West Bengal 9,483 289 - 289 19 - 19 308 - 308
Total 194,131 106,656 138,323 244,979 1,746 5,033 6,779 108,401 143,357 251,758 Data from MPR # No target fixed for UTs 29.04.2014* No Report after Mar09.
Annexure - II(C)
S.no. State Target
(2005-12)Achievement upto Mar'13 Achievement dg 2013-14 Cumulative Achievement upto
Mar'14
Bharat Nirman - Upgradation and Renewal
Upgradation (Km)
9,295
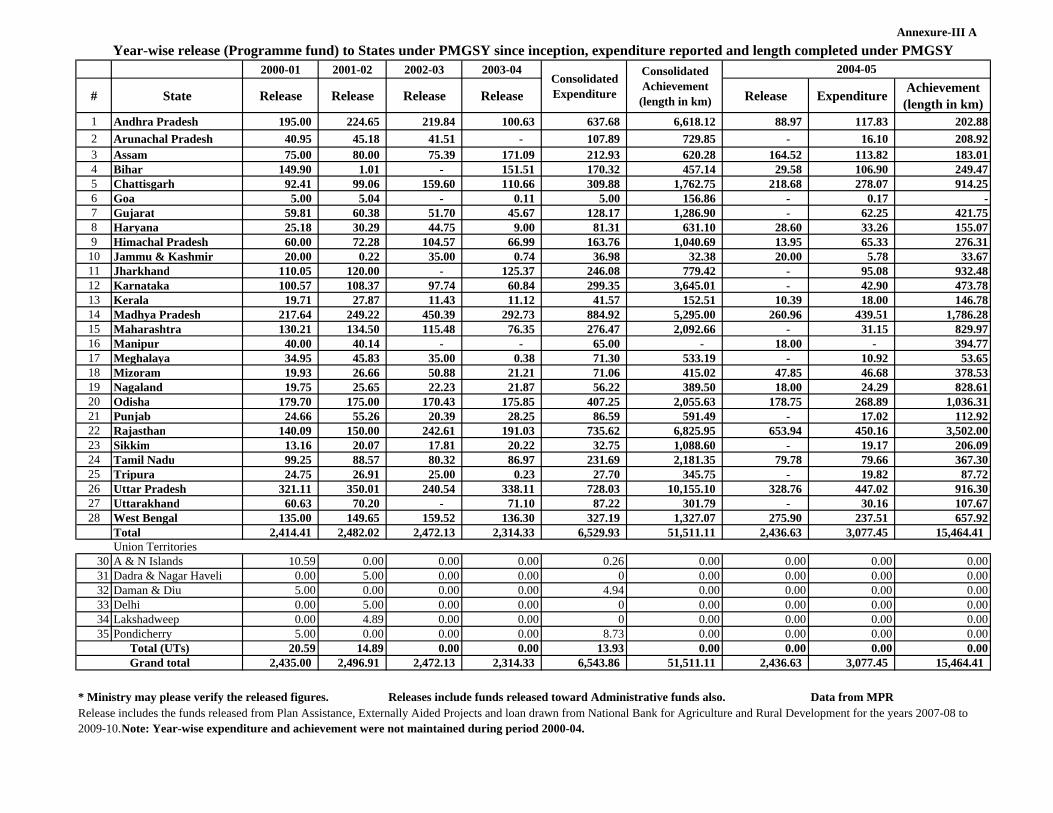
Annexure-III A
2000-01 2001-02 2002-03 2003-04
# State Release Release Release Release Release Expenditure Achievement (length in km)
1 Andhra Pradesh 195.00 224.65 219.84 100.63 637.68 6,618.12 88.97 117.83 202.88 2 Arunachal Pradesh 40.95 45.18 41.51 - 107.89 729.85 - 16.10 208.92 3 Assam 75.00 80.00 75.39 171.09 212.93 620.28 164.52 113.82 183.01 4 Bihar 149.90 1.01 - 151.51 170.32 457.14 29.58 106.90 249.47 5 Chattisgarh 92.41 99.06 159.60 110.66 309.88 1,762.75 218.68 278.07 914.25 6 Goa 5.00 5.04 - 0.11 5.00 156.86 - 0.17 - 7 Gujarat 59.81 60.38 51.70 45.67 128.17 1,286.90 - 62.25 421.75 8 Haryana 25.18 30.29 44.75 9.00 81.31 631.10 28.60 33.26 155.07 9 Himachal Pradesh 60.00 72.28 104.57 66.99 163.76 1,040.69 13.95 65.33 276.31
10 Jammu & Kashmir 20.00 0.22 35.00 0.74 36.98 32.38 20.00 5.78 33.67 11 Jharkhand 110.05 120.00 - 125.37 246.08 779.42 - 95.08 932.48 12 Karnataka 100.57 108.37 97.74 60.84 299.35 3,645.01 - 42.90 473.78 13 Kerala 19.71 27.87 11.43 11.12 41.57 152.51 10.39 18.00 146.78 14 Madhya Pradesh 217.64 249.22 450.39 292.73 884.92 5,295.00 260.96 439.51 1,786.28 15 Maharashtra 130.21 134.50 115.48 76.35 276.47 2,092.66 - 31.15 829.97 16 Manipur 40.00 40.14 - - 65.00 - 18.00 - 394.77 17 Meghalaya 34.95 45.83 35.00 0.38 71.30 533.19 - 10.92 53.65 18 Mizoram 19.93 26.66 50.88 21.21 71.06 415.02 47.85 46.68 378.53 19 Nagaland 19.75 25.65 22.23 21.87 56.22 389.50 18.00 24.29 828.61 20 Odisha 179.70 175.00 170.43 175.85 407.25 2,055.63 178.75 268.89 1,036.31 21 Punjab 24.66 55.26 20.39 28.25 86.59 591.49 - 17.02 112.92 22 Rajasthan 140.09 150.00 242.61 191.03 735.62 6,825.95 653.94 450.16 3,502.00 23 Sikkim 13.16 20.07 17.81 20.22 32.75 1,088.60 - 19.17 206.09 24 Tamil Nadu 99.25 88.57 80.32 86.97 231.69 2,181.35 79.78 79.66 367.30 25 Tripura 24.75 26.91 25.00 0.23 27.70 345.75 - 19.82 87.72 26 Uttar Pradesh 321.11 350.01 240.54 338.11 728.03 10,155.10 328.76 447.02 916.30 27 Uttarakhand 60.63 70.20 - 71.10 87.22 301.79 - 30.16 107.67 28 West Bengal 135.00 149.65 159.52 136.30 327.19 1,327.07 275.90 237.51 657.92
Total 2,414.41 2,482.02 2,472.13 2,314.33 6,529.93 51,511.11 2,436.63 3,077.45 15,464.41 Union Territories
30 A & N Islands 10.59 0.00 0.00 0.00 0.26 0.00 0.00 0.00 0.0031 Dadra & Nagar Haveli 0.00 5.00 0.00 0.00 0 0.00 0.00 0.00 0.0032 Daman & Diu 5.00 0.00 0.00 0.00 4.94 0.00 0.00 0.00 0.0033 Delhi 0.00 5.00 0.00 0.00 0 0.00 0.00 0.00 0.0034 Lakshadweep 0.00 4.89 0.00 0.00 0 0.00 0.00 0.00 0.0035 Pondicherry 5.00 0.00 0.00 0.00 8.73 0.00 0.00 0.00 0.00
20.59 14.89 0.00 0.00 13.93 0.00 0.00 0.00 0.002,435.00 2,496.91 2,472.13 2,314.33 6,543.86 51,511.11 2,436.63 3,077.45 15,464.41
Releases include funds released toward Administrative funds also. Data from MPRRelease includes the funds released from Plan Assistance, Externally Aided Projects and loan drawn from National Bank for Agriculture and Rural Development for the years 2007-08 to 2009-10.Note: Year-wise expenditure and achievement were not maintained during period 2000-04.
Year-wise release (Programme fund) to States under PMGSY since inception, expenditure reported and length completed under PMGSY
Consolidated Expenditure
Consolidated Achievement
(length in km)
2004-05
* Ministry may please verify the released figures.
Total (UTs)Grand total
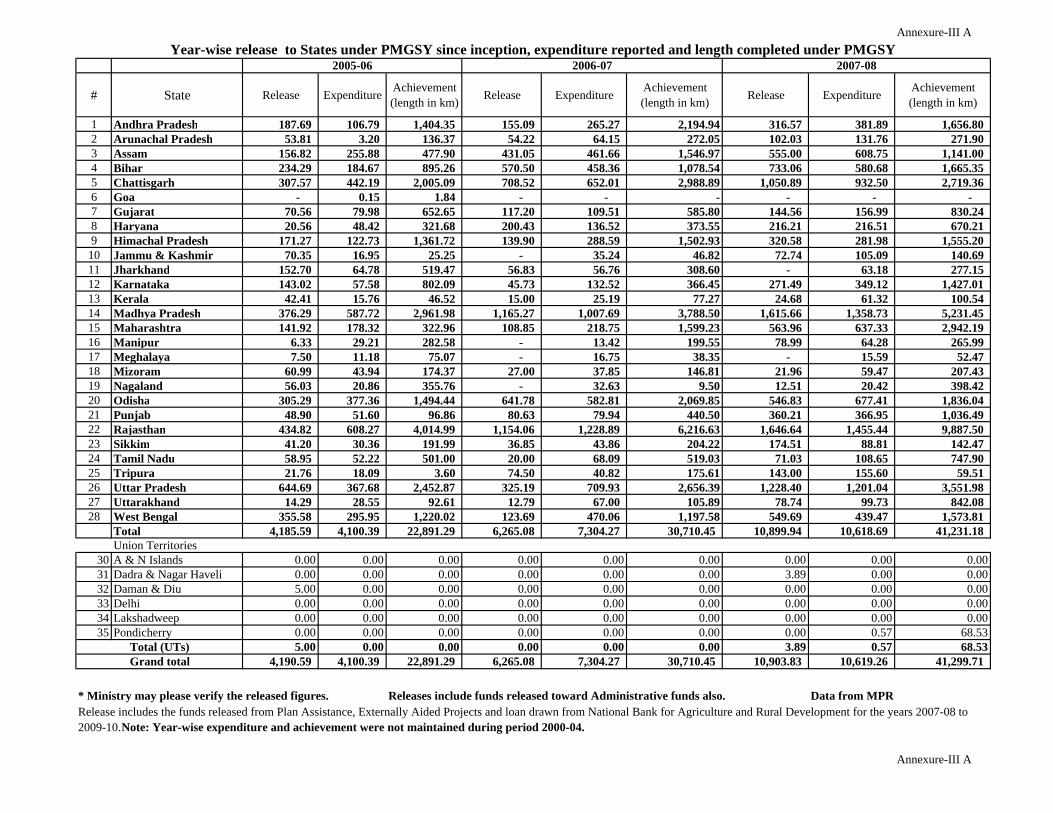
Annexure-III A
# State Release Expenditure Achievement (length in km) Release Expenditure Achievement
(length in km) Release Expenditure Achievement (length in km)
1 Andhra Pradesh 187.69 106.79 1,404.35 155.09 265.27 2,194.94 316.57 381.89 1,656.80 2 Arunachal Pradesh 53.81 3.20 136.37 54.22 64.15 272.05 102.03 131.76 271.90 3 Assam 156.82 255.88 477.90 431.05 461.66 1,546.97 555.00 608.75 1,141.00 4 Bihar 234.29 184.67 895.26 570.50 458.36 1,078.54 733.06 580.68 1,665.35 5 Chattisgarh 307.57 442.19 2,005.09 708.52 652.01 2,988.89 1,050.89 932.50 2,719.36 6 Goa - 0.15 1.84 - - - - - - 7 Gujarat 70.56 79.98 652.65 117.20 109.51 585.80 144.56 156.99 830.24 8 Haryana 20.56 48.42 321.68 200.43 136.52 373.55 216.21 216.51 670.21 9 Himachal Pradesh 171.27 122.73 1,361.72 139.90 288.59 1,502.93 320.58 281.98 1,555.20
10 Jammu & Kashmir 70.35 16.95 25.25 - 35.24 46.82 72.74 105.09 140.69 11 Jharkhand 152.70 64.78 519.47 56.83 56.76 308.60 - 63.18 277.15 12 Karnataka 143.02 57.58 802.09 45.73 132.52 366.45 271.49 349.12 1,427.01 13 Kerala 42.41 15.76 46.52 15.00 25.19 77.27 24.68 61.32 100.54 14 Madhya Pradesh 376.29 587.72 2,961.98 1,165.27 1,007.69 3,788.50 1,615.66 1,358.73 5,231.45 15 Maharashtra 141.92 178.32 322.96 108.85 218.75 1,599.23 563.96 637.33 2,942.19 16 Manipur 6.33 29.21 282.58 - 13.42 199.55 78.99 64.28 265.99 17 Meghalaya 7.50 11.18 75.07 - 16.75 38.35 - 15.59 52.47 18 Mizoram 60.99 43.94 174.37 27.00 37.85 146.81 21.96 59.47 207.43 19 Nagaland 56.03 20.86 355.76 - 32.63 9.50 12.51 20.42 398.42 20 Odisha 305.29 377.36 1,494.44 641.78 582.81 2,069.85 546.83 677.41 1,836.04 21 Punjab 48.90 51.60 96.86 80.63 79.94 440.50 360.21 366.95 1,036.49 22 Rajasthan 434.82 608.27 4,014.99 1,154.06 1,228.89 6,216.63 1,646.64 1,455.44 9,887.50 23 Sikkim 41.20 30.36 191.99 36.85 43.86 204.22 174.51 88.81 142.47 24 Tamil Nadu 58.95 52.22 501.00 20.00 68.09 519.03 71.03 108.65 747.90 25 Tripura 21.76 18.09 3.60 74.50 40.82 175.61 143.00 155.60 59.51 26 Uttar Pradesh 644.69 367.68 2,452.87 325.19 709.93 2,656.39 1,228.40 1,201.04 3,551.98 27 Uttarakhand 14.29 28.55 92.61 12.79 67.00 105.89 78.74 99.73 842.08 28 West Bengal 355.58 295.95 1,220.02 123.69 470.06 1,197.58 549.69 439.47 1,573.81
Total 4,185.59 4,100.39 22,891.29 6,265.08 7,304.27 30,710.45 10,899.94 10,618.69 41,231.18 Union Territories
30 A & N Islands 0.00 0.00 0.00 0.00 0.00 0.00 0.00 0.00 0.0031 Dadra & Nagar Haveli 0.00 0.00 0.00 0.00 0.00 0.00 3.89 0.00 0.0032 Daman & Diu 5.00 0.00 0.00 0.00 0.00 0.00 0.00 0.00 0.0033 Delhi 0.00 0.00 0.00 0.00 0.00 0.00 0.00 0.00 0.0034 Lakshadweep 0.00 0.00 0.00 0.00 0.00 0.00 0.00 0.00 0.0035 Pondicherry 0.00 0.00 0.00 0.00 0.00 0.00 0.00 0.57 68.53
5.00 0.00 0.00 0.00 0.00 0.00 3.89 0.57 68.534,190.59 4,100.39 22,891.29 6,265.08 7,304.27 30,710.45 10,903.83 10,619.26 41,299.71
Releases include funds released toward Administrative funds also. Data from MPR
Annexure-III A
Year-wise release to States under PMGSY since inception, expenditure reported and length completed under PMGSY2005-06 2006-07
Grand totalTotal (UTs)
2007-08
* Ministry may please verify the released figures.Release includes the funds released from Plan Assistance, Externally Aided Projects and loan drawn from National Bank for Agriculture and Rural Development for the years 2007-08 to 2009-10.Note: Year-wise expenditure and achievement were not maintained during period 2000-04.

# State Release Expenditure Achievement (length in km) Release Expenditure Achievement
(length in km) Release Expenditure Achievement (length in km)
1 Andhra Pradesh 470.60 494.47 1,885.00 877.46 886.37 3,092.00 672.15 473.94 2,121.48 2 Arunachal Pradesh 107.98 152.01 317.43 282.52 247.61 622.55 371.87 348.85 366.87 3 Assam 982.12 1,007.05 1,985.11 1,179.00 1,412.91 2,095.88 1,900.67 1,300.79 2,057.11 4 Bihar 1,065.20 1,067.54 2,532.20 1,750.73 1,874.51 2,843.27 3,477.06 2,694.91 2,515.13 5 Chattisgarh 976.12 863.34 2,427.08 540.03 805.06 4,020.44 678.58 304.16 1,570.66 6 Goa - - - - - - - - - 7 Gujarat 229.67 255.26 1,262.07 193.80 190.46 1,511.02 322.43 243.84 605.97 8 Haryana 272.02 313.09 969.87 255.49 277.16 785.35 157.75 108.03 389.24 9 Himachal Pradesh 268.90 240.51 1,360.10 124.95 220.10 1,505.61 199.30 142.67 661.82
10 Jammu & Kashmir 191.74 190.71 469.80 372.60 359.42 661.54 366.09 297.40 474.00 11 Jharkhand 210.67 211.47 214.97 417.74 457.79 1,530.90 843.81 538.44 1,599.25 12 Karnataka 640.46 550.37 2,099.13 764.87 883.97 3,019.75 927.68 634.80 1,848.93 13 Kerala 84.02 84.41 240.22 100.11 113.77 264.10 146.27 146.14 245.87 14 Madhya Pradesh 1,895.10 2,198.06 7,893.72 2,135.65 2,234.83 10,398.01 1,966.12 1,409.49 9,163.26 15 Maharashtra 1,030.00 929.98 4,138.65 949.18 994.60 3,111.50 1,242.55 1,012.48 3,718.27 16 Manipur 20.00 37.97 78.95 149.16 145.13 879.68 144.98 122.34 487.42 17 Meghalaya 35.95 12.64 30.80 - 20.38 97.92 64.55 36.39 83.31 18 Mizoram 65.00 54.55 195.18 44.58 66.86 202.71 95.59 82.24 252.13 19 Nagaland 85.71 87.31 298.53 65.02 71.61 273.66 25.13 29.67 86.00 20 Odisha 1,251.38 1,163.01 2,641.00 1,594.35 1,895.25 3,838.43 2,477.36 1,924.25 4,941.90 21 Punjab 243.42 269.02 751.62 348.42 322.64 710.00 196.43 155.34 622.72 22 Rajasthan 1,771.32 1,695.54 10,349.93 603.41 795.03 4,350.11 886.22 686.39 3,019.47 23 Sikkim 55.00 103.99 308.57 71.80 80.17 98.82 79.38 85.53 85.72 24 Tamil Nadu 88.68 127.87 609.59 525.00 560.20 1,940.49 469.54 304.81 2,229.01 25 Tripura 379.99 315.77 361.27 168.49 253.74 519.93 285.76 237.51 432.11 26 Uttar Pradesh 1,675.78 2,000.07 6,461.02 2,844.51 2,914.96 9,526.81 1,308.83 868.54 3,593.79 27 Uttarakhand 116.66 152.79 645.60 165.95 172.57 764.49 240.26 191.74 551.88 28 West Bengal 635.48 583.18 1,877.11 375.00 575.82 1,452.04 819.68 530.29 1,385.20
Total 14,848.97 15,161.98 52,404.52 16,899.82 18,832.92 60,116.99 20,366.04 14,910.98 45,108.53 Union Territories
30 A & N Islands 0.00 0.00 0.00 0.00 0.00 0.00 0.00 0.00 0.0031 Dadra & Nagar Haveli 4.95 0.00 0.00 0.00 0.00 0.00 0.00 0.00 0.0032 Daman & Diu 0.00 0.00 0.00 0.00 0.00 0.00 0.00 0.00 0.0033 Delhi 0.00 0.00 0.00 0.00 0.00 0.00 0.00 0.00 0.0034 Lakshadweep 0.00 0.00 0.00 0.00 0.00 0.00 0.00 0.00 0.0035 Pondicherry 0.00 0.00 0.00 0.00 0.00 0.00 0.00 0.00 0.00
4.95 0 0.00 0.00 0.00 0.00 0.00 0.00 0.0014,853.92 15,161.98 52,404.52 16,899.82 18,832.92 60,116.99 20,366.04 14,910.98 45,108.53
Releases include funds released toward Administrative funds also. Data from MPR
Annexure-III A
Year-wise release to States under PMGSY since inception, expenditure reported and length completed under PMGSY2008-09 2009-10 2010-11
Grand total
* Ministry may please verify the released figures.Release includes the funds released from Plan Assistance, Externally Aided Projects and loan drawn from National Bank for Agriculture and Rural Development for the years 2007-08 to 2009-10.Note: Year-wise expenditure and achievement were not maintained during period 2000-04.
Total (UTs)

# State Release (upto 30.03.2012) Expenditure Achievement
(length in km)Release (upto 31.03.2013) Expenditure Achievement
(length in km) Total release * Total Expenditure
Total length (in km.)
1 Andhra Pradesh 607.48 291.75 932.14 - 205.66 400.35 5.00 152.56 191.58 2 Arunachal Pradesh 214.27 173.37 419.21 455.18 310.54 393.67 8.00 249.36 489.04 3 Assam 1,682.84 1,312.18 2,131.43 154.27 522.78 1,456.16 240.49 699.01 957.96 4 Bihar 3,374.25 2,847.08 7,539.82 1,326.58 1,992.21 6,341.63 848.20 1,844.95 3,163.86 5 Chattisgarh 801.51 244.35 1,053.69 - 281.41 1,024.08 - 713.58 1,292.05 6 Goa - - - - - - - - - 7 Gujarat 66.59 150.55 431.44 125.74 99.54 180.47 519.24 477.40 896.29 8 Haryana 60.00 60.80 188.31 - 36.53 69.26 - 8.19 3.28 9 Himachal Pradesh 310.30 119.17 761.09 - 55.19 - - 148.13 134.49
10 Jammu & Kashmir 762.10 508.43 999.62 266.33 459.69 1,411.10 523.24 534.01 891.79 11 Jharkhand 860.74 323.23 1,123.03 105.96 325.61 1,236.74 21.86 539.55 1,030.73 12 Karnataka - 256.62 1,858.64 24.60 16.63 386.02 5.00 7.68 211.43 13 Kerala 200.00 58.07 214.14 1.50 57.30 108.71 1.50 121.15 192.46 14 Madhya Pradesh 1,138.05 894.17 2,926.66 242.88 741.11 2,754.18 615.00 1,393.07 3,006.27 15 Maharashtra 796.01 546.05 2,592.46 - 153.40 649.54 - 383.50 448.88 16 Manipur 177.53 166.52 374.61 186.14 92.66 424.48 4.03 139.67 533.12 17 Meghalaya 38.00 27.68 44.67 50.00 32.46 22.77 - 37.70 23.68 18 Mizoram 93.63 85.47 130.90 71.82 41.95 93.20 - 26.60 77.28 19 Nagaland 11.00 12.26 24.89 194.88 109.83 93.50 - 77.45 293.20 20 Odisha 1,969.95 1,235.78 3,167.06 87.25 1,188.92 2,401.26 758.92 1,605.72 3,063.22 21 Punjab 164.61 61.49 71.76 169.66 238.16 325.54 117.68 295.61 730.38 22 Rajasthan 667.76 247.63 450.78 151.90 573.85 2,140.00 427.06 718.35 2,290.31 23 Sikkim 80.00 13.93 74.98 193.62 86.73 48.44 1.97 90.57 99.36 24 Tamil Nadu 160.00 211.36 814.10 77.72 21.13 42.39 343.48 383.39 747.94 25 Tripura 229.79 230.22 352.17 338.59 189.79 241.92 98.83 232.76 291.46 26 Uttar Pradesh 213.77 194.84 522.53 10.00 98.00 269.78 511.93 824.25 1,109.79 27 Uttarakhand 300.32 255.48 639.58 151.24 32.39 474.43 - 260.64 405.16 28 West Bengal 828.90 417.93 1,154.79 3.08 423.28 1,171.67 306.17 1,130.44 2,741.38
Total 15,809.38 10,946.41 30,994.50 4,388.91 8,386.75 24,161.29 5,357.60 13,095.29 25,316.40 Union Territories
30 A & N Islands 0.00 0.00 0.00 0.00 0.00 0.00 0.00 0.00 0.0031 Dadra & Nagar Haveli 0.00 0.00 0.00 0.00 0.00 0.00 0.00 0.00 0.0032 Daman & Diu 0.00 0.00 0.00 0.00 0.00 0.00 0.00 0.00 0.0033 Delhi 0.00 0.00 0.00 0.00 0.00 0.00 0.00 0.00 0.0034 Lakshadweep 0.00 0.00 0.00 0.00 0.00 0.00 0.00 0.00 0.0035 Pondicherry 0.00 0.00 0.00 0.00 0.00 0.00 0.00 0.00 0.00
0.00 0.00 0.00 0.00 0.00 0.00 0.00 0.00 0.0015,809.38 10,946.41 30,994.50 4,388.91 8,386.75 24,161.29 5,357.60 13,095.29 25,316.40
Releases include funds released toward Administrative funds also. Data from MPR
Year-wise release to States under PMGSY since inception, expenditure reported and length completed under PMGSY2011-12 2012-13
Release includes the funds released from Plan Assistance, Externally Aided Projects and loan drawn from National Bank for Agriculture and Rural Development for the years 2007-08 to 2009-10.Note: Year-wise expenditure and achievement were not maintained during period 2000-04.
2013-14
Total (UTs)Grand total
* Ministry may please verify the released figures.
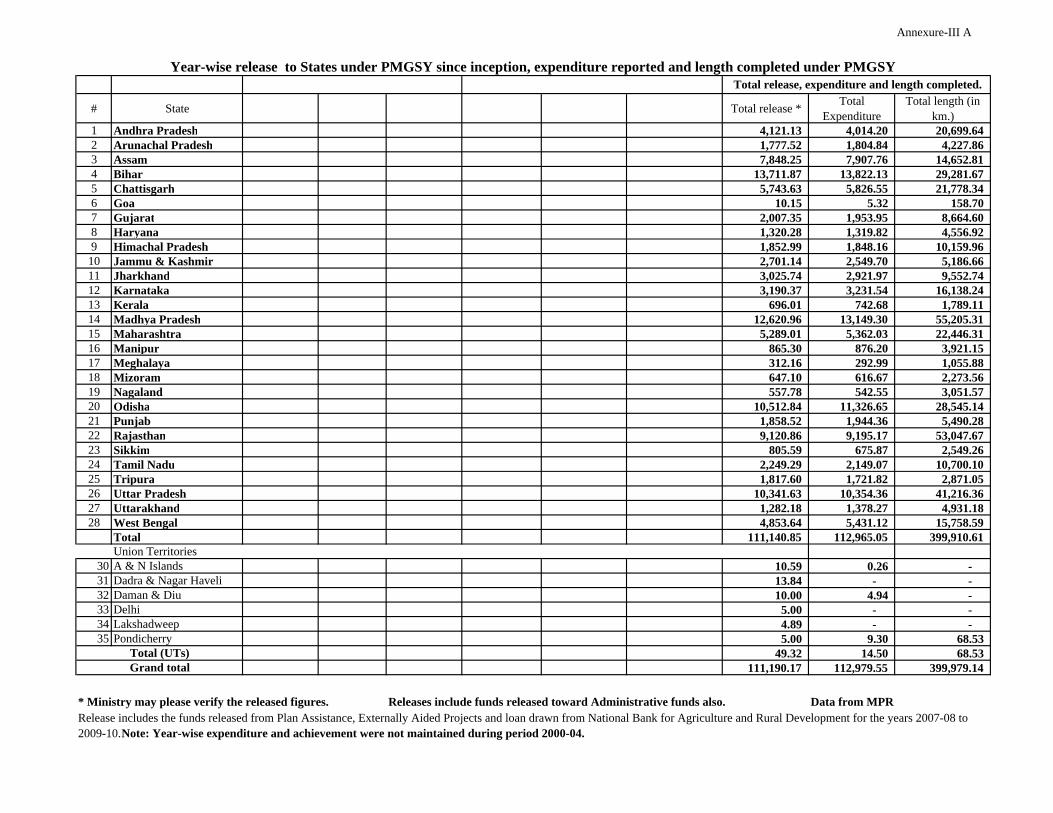
Annexure-III A
# State Total release * Total Expenditure
Total length (in km.)
1 Andhra Pradesh 4,121.13 4,014.20 20,699.64 2 Arunachal Pradesh 1,777.52 1,804.84 4,227.86 3 Assam 7,848.25 7,907.76 14,652.81 4 Bihar 13,711.87 13,822.13 29,281.67 5 Chattisgarh 5,743.63 5,826.55 21,778.34 6 Goa 10.15 5.32 158.70 7 Gujarat 2,007.35 1,953.95 8,664.60 8 Haryana 1,320.28 1,319.82 4,556.92 9 Himachal Pradesh 1,852.99 1,848.16 10,159.96
10 Jammu & Kashmir 2,701.14 2,549.70 5,186.66 11 Jharkhand 3,025.74 2,921.97 9,552.74 12 Karnataka 3,190.37 3,231.54 16,138.24 13 Kerala 696.01 742.68 1,789.11 14 Madhya Pradesh 12,620.96 13,149.30 55,205.31 15 Maharashtra 5,289.01 5,362.03 22,446.31 16 Manipur 865.30 876.20 3,921.15 17 Meghalaya 312.16 292.99 1,055.88 18 Mizoram 647.10 616.67 2,273.56 19 Nagaland 557.78 542.55 3,051.57 20 Odisha 10,512.84 11,326.65 28,545.14 21 Punjab 1,858.52 1,944.36 5,490.28 22 Rajasthan 9,120.86 9,195.17 53,047.67 23 Sikkim 805.59 675.87 2,549.26 24 Tamil Nadu 2,249.29 2,149.07 10,700.10 25 Tripura 1,817.60 1,721.82 2,871.05 26 Uttar Pradesh 10,341.63 10,354.36 41,216.36 27 Uttarakhand 1,282.18 1,378.27 4,931.18 28 West Bengal 4,853.64 5,431.12 15,758.59
Total 111,140.85 112,965.05 399,910.61 Union Territories
30 A & N Islands 10.59 0.26 - 31 Dadra & Nagar Haveli 13.84 - - 32 Daman & Diu 10.00 4.94 - 33 Delhi 5.00 - - 34 Lakshadweep 4.89 - - 35 Pondicherry 5.00 9.30 68.53
49.32 14.50 68.53 111,190.17 112,979.55 399,979.14
Releases include funds released toward Administrative funds also. Data from MPR
Grand total
* Ministry may please verify the released figures.Release includes the funds released from Plan Assistance, Externally Aided Projects and loan drawn from National Bank for Agriculture and Rural Development for the years 2007-08 to 2009-10.Note: Year-wise expenditure and achievement were not maintained during period 2000-04.
Total (UTs)
Year-wise release to States under PMGSY since inception, expenditure reported and length completed under PMGSYTotal release, expenditure and length completed.

2000‐01 2001‐02 2002‐03 2003‐04 2004‐05 2005‐06 2006‐07 2007‐08 2008‐09 2009‐10 2010‐11 2011‐12 2012‐13 2013‐14# State Release Release Release Release Release Release Release Release Release Release Release Release Release Release
1 Andhra Pradesh 195.00 224.65 219.29 100.00 88.97 183.56 155.09 316.57 470.60 872.46 667.15 607.48 4,100.82 2 Arunachal Pradesh 40.95 45.00 41.51 ‐ ‐ 52.00 54.22 102.03 104.49 282.51 369.87 213.27 453.18 1,759.03 3 Assam 75.00 80.00 74.92 170.02 164.52 156.82 431.05 555.00 967.32 1,179.00 1,900.67 1,682.84 154.27 235.49 7,826.91 4 Bihar 149.90 ‐ ‐ 150.00 15.59 223.01 524.48 701.15 1,022.64 1,692.88 3,366.43 3,336.32 1,278.16 804.68 13,265.24 5 Chattisgarh 92.41 98.62 159.60 110.00 214.92 302.71 708.52 1,050.89 931.12 510.12 678.58 801.51 ‐ 5,659.00 6 Goa 5.00 5.00 ‐ ‐ ‐ ‐ ‐ ‐ ‐ ‐ ‐ ‐ ‐ 10.00 7 Gujarat 59.81 60.00 51.70 44.35 ‐ 69.01 117.20 144.56 229.67 193.80 322.43 66.59 125.74 509.24 1,994.10 8 Haryana 25.18 30.00 44.75 7.99 28.04 20.11 200.43 216.21 272.02 255.49 157.75 60.00 ‐ 1,317.97 9 Himachal Pradesh 60.00 72.09 104.57 66.35 13.95 171.27 139.90 313.08 268.90 124.96 199.30 305.30 ‐ 1,839.67
10 Jammu & Kashmir 20.00 ‐ 35.00 ‐ 20.00 70.35 ‐ 72.20 190.66 369.61 366.09 757.10 261.70 300.24 2,462.95 11 Jharkhand 110.05 120.00 ‐ 123.87 ‐ 152.70 56.83 ‐ 208.67 417.74 838.81 843.08 100.96 ‐ 2,972.71 12 Karnataka 100.57 108.37 97.74 59.00 ‐ 140.55 45.73 271.49 634.63 764.87 917.68 ‐ 14.60 ‐ 3,155.23 13 Kerala 19.71 27.65 11.43 10.38 10.39 42.41 15.00 24.68 82.29 100.11 144.27 200.00 ‐ 688.32 14 Madhya Pradesh 217.64 248.00 450.39 290.90 256.45 370.14 1,150.00 1,615.66 1,843.70 2,111.21 1,966.12 1,138.05 237.88 600.00 12,496.14 15 Maharashtra 130.21 134.50 114.58 75.00 ‐ 141.92 103.42 563.96 1,030.00 944.18 1,237.55 791.01 ‐ 5,266.33 16 Manipur 40.00 40.00 ‐ ‐ 18.00 6.33 ‐ 76.17 20.00 149.16 144.98 175.53 184.14 ‐ 854.31 17 Meghalaya 34.95 45.72 35.00 ‐ ‐ 7.50 ‐ ‐ 35.70 ‐ 64.27 37.00 50.00 ‐ 310.14 18 Mizoram 19.93 26.53 50.88 20.78 46.40 60.99 27.00 19.39 65.00 44.58 95.59 93.63 70.32 ‐ 641.01 19 Nagaland 19.75 25.53 22.23 21.44 18.00 54.61 ‐ 12.51 85.71 65.02 25.13 10.00 194.88 ‐ 554.81 20 Odisha 179.70 175.00 170.09 175.00 175.00 305.29 624.59 546.83 1,251.38 1,594.35 2,467.36 1,964.95 82.25 748.92 10,460.71 21 Punjab 24.66 55.00 20.39 27.35 ‐ 48.90 80.63 360.21 243.42 348.42 194.43 164.61 169.66 117.68 1,855.36 22 Rajasthan 140.09 150.00 241.74 190.16 648.55 434.82 1,141.67 1,646.64 1,771.32 583.41 886.22 667.76 146.90 416.69 9,065.97 23 Sikkim 13.16 20.00 17.81 20.00 ‐ 40.29 36.26 170.46 55.00 70.00 76.77 80.00 192.62 ‐ 792.37 24 Tamil Nadu 99.25 88.57 80.32 85.00 79.78 58.95 20.00 71.03 88.68 520.00 469.54 160.00 73.60 343.48 2,238.20 25 Tripura 24.75 26.85 25.00 ‐ ‐ 19.79 71.43 130.00 359.98 152.50 257.91 206.39 323.16 73.83 1,671.58 26 Uttar Pradesh 321.11 348.11 240.54 335.27 317.47 632.20 325.19 1,219.20 1,649.82 2,837.62 1,308.83 203.77 501.93 10,241.06 27 Uttarakhand 60.63 70.00 ‐ 70.41 ‐ 14.29 12.79 78.74 114.89 164.95 237.96 295.32 149.24 ‐ 1,269.22 28 West Bengal 135.00 149.65 159.52 135.00 270.00 354.28 123.69 544.69 623.44 375.00 819.68 823.90 306.17 4,820.02
Total 2,414.41 2,474.84 2,469.00 2,288.27 2,386.03 4,134.80 6,165.12 10,823.35 14,621.05 16,723.94 20,181.37 15,685.40 4,263.24 4,958.35 109,589.15 Union Territories ‐
29 A & N Islands 10.59 ‐ ‐ ‐ ‐ ‐ ‐ ‐ ‐ ‐ ‐ ‐ ‐ ‐ 10.59 30 D & N Haveli ‐ 5.00 ‐ ‐ ‐ ‐ ‐ 3.89 4.95 ‐ ‐ ‐ ‐ ‐ 13.84 31 Daman & Diu 5.00 ‐ ‐ ‐ ‐ 5.00 ‐ ‐ ‐ ‐ ‐ ‐ ‐ ‐ 10.00 32 Delhi ‐ 5.00 ‐ ‐ ‐ ‐ ‐ ‐ ‐ ‐ ‐ ‐ ‐ ‐ 5.00 33 Lakshadweep ‐ 4.89 ‐ ‐ ‐ ‐ ‐ ‐ ‐ ‐ ‐ ‐ ‐ ‐ 4.89 34 Pondicherry 5.00 ‐ ‐ ‐ ‐ ‐ ‐ ‐ ‐ ‐ ‐ ‐ ‐ ‐ 5.00
Total (UTs) 20.59 14.89 ‐ ‐ ‐ 5.00 ‐ 3.89 4.95 ‐ ‐ ‐ ‐ ‐ 49.32 Grand Total 2,435.00 2,489.73 2,469.00 2,288.27 2,386.03 4,139.80 6,165.12 10,827.24 14,626.00 16,723.94 20,181.37 15,685.40 4,263.24 4,958.35 109,638.47
* Ministry may please verify the released figures.
Year‐wise release (Programme fund) to States under PMGSY since inception Total
Released
Annexure III‐B

Value in Crores
No. of Roads
Length in Km
Value in Crores
No. of Roads
Length in Km
1 Andhra Pradesh 3.82 6 25.15 30-Nov-03
2 Andhra Pradesh 29.422 22 140.00 13-Feb-07
3 Andhra Pradesh 36.76 26 104.97 20-Aug-08
4 Andhra Pradesh 197.25 187 639.01 09-Sep-10
5 Andhra Pradesh 398.09 266 802.41 17-Sep-12
6 Andhra Pradesh 452.31 154 roads 34 bridges 735.16 0-Mar-2013
7 Arunachal Pradesh 12.07 4 26.29 12-Feb-07
8 Arunachal Pradesh 66.61 7 93.56 04-Aug-08
9 Arunachal Pradesh 292.97 35 412.74 28-Oct-09
10 Arunachal Pradesh 382.35 37 622.75 19-Oct-10
11 Arunachal Pradesh 238.19 9 roads11 bridges 272.00 22-Feb-13
12 Arunachal Pradesh 43.28 3 roads3 bridges 61.00 26-Jul-13
Arunachal Pradesh 16.62 2 27.00 04-Nov-13
Arunachal Pradesh 231.17 13 242.93 10-Dec-13
13 Bihar-RWD 915.07 647 1899.06 25-Nov-11
14 Chattisgarh 905.37 869 3101.63 13-Aug-08
15 Chattisgarh 1.753 1 5.84 23-Jan-12
16 Chattisgarh 221.06 217 517.37 27-Aug-12
#
BORDER BLOCKS and LWE / IAP districts - STATUS OF PROPOSALS FOR CONSTRUCTION OF RURAL ROADS UNDER PMGSY
Annexure IV
As on Mar'2014
Clearance DateLWE / IAP districts Border Blocks
State
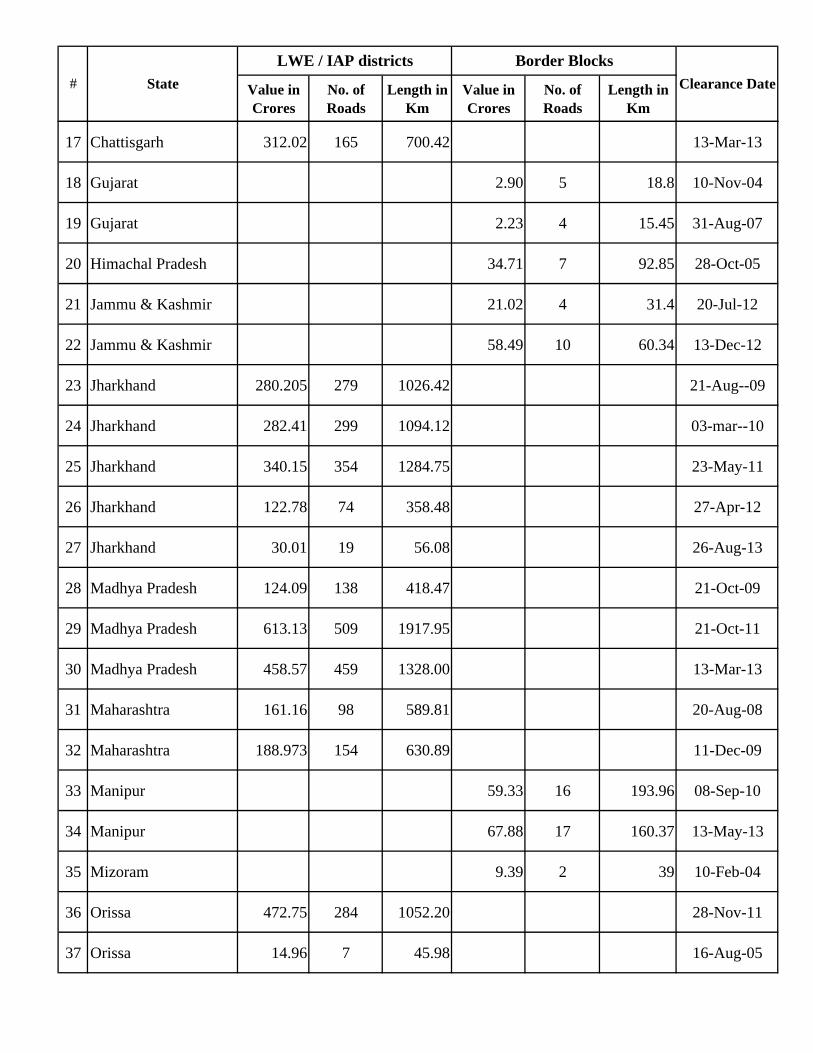
Value in Crores
No. of Roads
Length in Km
Value in Crores
No. of Roads
Length in Km
# Clearance DateLWE / IAP districts Border Blocks
State
17 Chattisgarh 312.02 165 700.42 13-Mar-13
18 Gujarat 2.90 5 18.8 10-Nov-04
19 Gujarat 2.23 4 15.45 31-Aug-07
20 Himachal Pradesh 34.71 7 92.85 28-Oct-05
21 Jammu & Kashmir 21.02 4 31.4 20-Jul-12
22 Jammu & Kashmir 58.49 10 60.34 13-Dec-12
23 Jharkhand 280.205 279 1026.42 21-Aug--09
24 Jharkhand 282.41 299 1094.12 03-mar--10
25 Jharkhand 340.15 354 1284.75 23-May-11
26 Jharkhand 122.78 74 358.48 27-Apr-12
27 Jharkhand 30.01 19 56.08 26-Aug-13
28 Madhya Pradesh 124.09 138 418.47 21-Oct-09
29 Madhya Pradesh 613.13 509 1917.95 21-Oct-11
30 Madhya Pradesh 458.57 459 1328.00 13-Mar-13
31 Maharashtra 161.16 98 589.81 20-Aug-08
32 Maharashtra 188.973 154 630.89 11-Dec-09
33 Manipur 59.33 16 193.96 08-Sep-10
34 Manipur 67.88 17 160.37 13-May-13
35 Mizoram 9.39 2 39 10-Feb-04
36 Orissa 472.75 284 1052.20 28-Nov-11
37 Orissa 14.96 7 45.98 16-Aug-05

Value in Crores
No. of Roads
Length in Km
Value in Crores
No. of Roads
Length in Km
# Clearance DateLWE / IAP districts Border Blocks
State
38 Orissa 236.97 122 585.68 11-Mar-11
39 Orissa 993.8 602 2497.97 15-Nov-11
40 Orissa 439.69 278 1016.41 21-Sep-12
41 Orissa 947.89 511 2046.31 19-Feb-13
42 Punjab 9.46 29 54.2 16-Jul-04
43 Uttar Pradesh 3.25 9 13.84 05-Oct-05
44 Uttar Pradesh 87.67 38 272.53 12-Jan-10
45 Uttar Pradesh 54.74 41 144.25 08-Sep-11
46 Uttar Pradesh 40.35 62 96.17 02-Nov-12
47 West Bengal 1491.2 582 2607.70 07-Dec-12

#
StatesValue of
proposals cleared
State Share
Amount Released
(Upto 31.03.2014)
No. of road
works i/c Bridges
Length of road works
No. of road works
completed (upto Mar'14)
Length of road works
completed (upto Mar'14)
% completed road works
(upto Mar'14)
% Length Completed
(upto Mar'14)
Exp. (upto Mar'14)
Exp. -State Share (upto
Mar'14)
% Exp. to Amount released
(upto Mar'14)
1 2 3 4 5 6 7 8 9 10 11 12 13 141 Bihar (RRP-II) Tr-I $ 1472.31 84.21 956 2287.252 H P (RRP-I) Ph - I 70.41 80.28 113 602.37 110 579.35 97.35% 96.18% 70.41 14.50 87.71%
Ph - II ( Tr-I & II) 116.01 117.39 65 420.86 55 327.61 84.62% 77.84% 70.89 60.39%Ph - III 67.47 54.66 37 305.10 33 264.64 89.19% 86.74% 57.84 105.82%
H P (RRP-II) Tr - I 156.22 35.00 112 601.17 26 196.80 23.21% 32.74% 87.81 250.89%(RRP-II) Tr - I (Bt-II) 74.24 64 288.05 0 26.62 0.00% 9.24% 17.48
* (RRP-II) Tr - I (Bt-III) 285.60 0.15 144 800.373 Jharkhand (WB) Tr-I 29.15 31.36 26 130.07 26 125.56 100.00% 96.53% 30.95 98.69%
Jhar. (RRP-II) Tr-I 201.93 100.96 177 721.45 19 167.96 10.73% 23.28% 100.26 99.31% (RRP-II) Tr-2 255.23 7.13 217 750.68 10 71.33 4.61% 9.50% 64.80Jhar. (RRP-II) Pt-I 696.67 37.04 521 1232.40 0 98.75 0.00% 8.01% 199.02Jhar. (RRP-II) Pt-II 493.65 8.49 360 1195.74 0 0.00 0.00% 0.00% 6.27
4 Meghalaya RRP-II (Tr-1) 94.81 37.00 18 105.88 3 21.38 16.67% 20.19% 31.47 85.05%** RRP-II (Tr-2) 229.28 1.30 78 266.94 0 0 0.00% 0.00% 4.18*** RRP-II (Tr-2)2013-14 481.97 3.05 229 739.75
5 Punjab RRP-II (Tr-1) 149.22 184.22 20 311.32 15 300.95 75.00% 96.67% 135.22 73.40%Punjab RRP-II (Tr-2) 339.31 134.66 61 717.06 42 544.55 68.85% 75.94% 245.12 182.03%Punjab RRP-II (Tr-3) 319.21 124 637.64 3 51.75 2.42% 8.12% 88.05Punjab RRP-II (13-14) 224.96 22.20 46 455.24 0 0.00 0.00% 0.00% 3.42
6 Rajasthan (RRP-1)Tr- I 293.67 307.42 610 2242.68 608 2219.01 99.67% 98.94% 278.43 90.57%Tranche - II 127.95 130.18 252 791.49 250 748.84 99.21% 94.61% 117.56 90.31%Tranche - III 294.44 299.12 435 1565.46 428 1518.23 98.39% 96.98% 271.04 90.61%W.B.(BN) 160.41 160.41 37 589.18 37 561.07 100.00% 95.23% 149.18 93.00%W.B.(T-V) 307.08 273.54 112 1237.19 108 1169.67 96.43% 94.54% 228.47 83.52%W.B.(T-VI) 28.65 14.33 9 91.53 8 79.88 88.89% 87.27% 23.06 160.98%Rajasthan (RRP-II)Tr- I 885.82 859.60 1076 3602.76 944 3009.24 87.73% 83.53% 712.15 82.85%Rajasthan (RRP-II)Tr- II 549.68 687 1892.04 315 1027.86 45.85% 54.33% 335.67Raj.(RRP-II)Tr- III 483.32 84.07 569 1672.13 61 269.93 10.72% 16.14% 160.96 191.46%Raj.(RRP-II)Tr- IV 510.18 571 1714.97 0 0.00 0.00% 0.00% 12.18Raj.(RRP-II)Tr- V 796.18 864 2617.30
7 U.P. (RRP-1) Tr-1 343.94 313.10 585 1317.00 465 1146.35 79.49% 87.04% 299.83 95.76%Phase II (Batch -I & II ) 276.31 276.3 447 935.06 321 726.84 71.81% 77.73% 215.80 78.10%W.B.(BN) 147.15 103.57 43 413.88 38 367.47 88.37% 88.79% 131.30 126.77%WB Tr-IV 162.25 212 370.52 129 242.08 60.85% 65.34% 94.69U.P.(RRP-II) Tr-1 370.14 184.07 514 812.64 183 275.15 35.60% 33.86% 186.92 101.55%U.P.(RRP-II) Pt-II 533.35 671 1126.79 51 70.99 7.60% 6.30% 138.07U.P.(RRP-II) Pt-III 1013.68 151.93 399 2769.98 9 35.77 2.26% 1.29% 172.23 113.36%
8 U.K (RRP-II)Tr- I # 43.23 0.89 35.32 29 34.74 0 14.75 0.00% 42.46% 16.31 46.18%U.K (RRP-II)Tr- II # 470.37 0.99 149.24 126 1139.78 2 175.50 1.59% 15.40% 186.90 125.23%U.K (RRP-II)Tr- III ## 335.01 0.53 109 674.85 0 37.20 0.00% 5.51% 46.61U.K (RRP-II)Tr- II 151.00 34 317.31
14041.46 165.98 4117.72 11759 40498.61 4299 16473.07 36.56% 40.68% 4990.55 14.50 121.20%17/04/2014Figures upto Mar'14 (In Bold letter) # includes 24 Bridges., * includes 3 Bridges , ** includes 3 Bridges , ## includes 27 Bridges, $ includes 71 Bridges.*** includes 32 Bridges
Statement showing Physical & Financial progress under PMGSY (WB) Annexure -V-A(Rs. in crore, Length in Km)
Grand Total

#
StatesValue of proposals cleared
State Share
Amount Released
(Upto 31.03.2014)
No. of road
works i/c Bridges
Length of road works
No. of road works
completed (upto Mar'14)
Length of road works
completed (upto Mar'14)
% completed road works
(upto Mar'14)
% Length Completed
(upto Mar'14)
Exp. (upto Mar'14)
Exp. -State Share (upto
Mar'14)
% Exp. to Amount released
(upto Mar'14)
1 2 3 4 5 6 7 8 9 10 11 12 13 14
1 Assam Batch-I 501.42 441.01 196 999.24 187 991.54 95.41% 99.23% 482.45 109.40%Batch-II 495.63 74.49 495.63 139 984.27 97 883.65 69.78% 89.78% 495.63 19.24 100.00%Batch-III 579.34 579.34 274 916.77 234 853.23 85.40% 93.07% 549.84 94.91%RCIP-I 308.54 1.94 154.27 172 426.43 2 18.20 1.16% 4.27% 83.18 53.92%
RCIP-I (2013-14) 255.53 0.54 205 499.57RCIP-II (2013-14) 325.17 0.93 257 499.32
2 Chattisgarh Part -I 98.24 98.24 70 513.41 68 445.37 97.14% 86.75% 98.24 3.66 100.00%Part - II 585.45 587.11 565 2508.28 541 2375.94 95.75% 94.72% 572.91 97.58%
Batch-III 596.29 594.62 564 2135.08 556 2028.39 98.58% 95.00% 509.96 85.76%Batch-IV 100.39 50.20 101 325.77 88 270.07 87.13% 82.90% 82.98 165.32%
ADB-RSS-III-P 400.37 200.19 302 1008.63 51 150.38 16.89% 14.91% 218.19 108.99%ADB RCIP Tr-II 186.85 137 429.06 0 0.00 0.00% 0.00% 3.38ADB RCIP Tr-III 448.14 0.03 320 1055.88
3 M.P. (ADB)-Ph -I 99.40 99.40 95 507.99 95 524.22 100.00% 103.19% 91.10 91.65%Ph - I (Part - II) 114.37 119.25 119 577.15 118 578.00 99.16% 100.15% 107.58 90.21%
Phase - II 453.05 456.81 479 2295.55 475 2285.00 99.16% 99.54% 414.87 90.82%Phase - III 551.11 560.71 535 2457.32 526 2451.00 98.32% 99.74% 545.46 97.28%Batch-V 524.23 375.79 384 1799.41 352 1698.88 91.67% 94.41% 410.74 109.30%Batch-VI 199.13 2.50 100.75 99 642.75 81 556.76 81.82% 86.62% 141.40 140.35%
ADB-RSS-III-P 422.48 7.08 458.86 234 1187.25 27 317.00 11.54% 26.70% 182.85 39.85%RCIP-Tr-II 244.23 9.59 254 654.04 11 32.00 4.33% 4.89% 32.32ADB-Tr-III 781.89 15.98 613 1736.68
Odisha Phase I * 349.46 349.46 257 1189.17 246 1084.33 95.72% 91.18% 349.46 23.76 100.00% Phase II 513.81 513.81 400 1612.22 369 1371.57 92.25% 85.07% 462.10 89.94%Phase III 611.40 393.36 310 1498.57 270 1273.85 87.10% 85.00% 531.17 135.03%Phase IV 522.58 530.58 334 1512.01 273 1155.61 81.74% 76.43% 439.05 82.75%
RRS-III-P(Tr-I) IAP 472.75 236.38 284 1052.20 10 159.85 3.52% 15.19% 146.43 61.95%RCIP Tr-II (13-14) 573.99 10.65 343 1184.06
RCIP Tr-III (13-14) # 1376.17 9.50 805 2740.615 West Bengal (ADB) 255.28 313.71 104 822.14 104 783.19 100.00% 95.26% 218.21 69.56%
Batch-II 329.71 329.71 109 908.10 100 807.58 91.74% 88.93% 274.50 83.25%Batch-III 302.10 302.10 127 696.27 117 628.18 92.13% 90.22% 256.85 85.02%
Batch - III (Lot-2) 214.84 214.84 76 443.49 69 385.26 90.79% 86.87% 163.28 76.00%(RRS-III-P) 40.02 20.01 16 82.27 0 0.00 0.00% 0.00% 1.81 9.05%
(RRS-III-P)-Bt-I 51.97 14 84.18 9 56.87 64.29% 67.56% 23.78RCIP Tr-II (13-14) 493.46 130 930.08 6 18.07 4.62% 1.94% 14.31
14378.79 133.23 8576.11 9423 38915.21 5082 24183.99 53.93% 62.15% 7904.03 46.66 92.16%17/04/2014
Grand TotalFigures upto Mar'14 (In Bold letter) * Actual Expenditure shown is 360.68 restricted to value cleared., # i/c 17 LSBs
Statement showing Physical & Financial progress under PMGSY (ADB) Annexure -V-B(Rs. in crore, Length in Km)
4

#
StatesValue of
proposals cleared
State Share
Total Value cleared
Amount Released
(Upto 31.03.2014)
No. of road
works i/c Bridges
Length of road works
cleared
No. of road
works completed
(upto Mar'14)
Length of road works completed
(upto Mar'14)
% completed
road works (upto
Mar'14)
% Length Complete
d (upto Mar'14)
Exp. (upto Mar'14)
Exp. -State Share (upto
Mar'14)
% Exp. to Amount released
(upto Mar'14)
1 2 3 4 5 6 7 8 9 10 11 12 13 141 Andhra Pradesh $ 6378.35 423.45 6801.79 4100.82 7609 25416.16 6503 20699.64 85.46 81.44 4014.20 80.91 97.892 Arunachal Pradesh * 3564.77 1.78 3566.55 1759.03 1003 6205.23 738 4227.86 73.58 68.13 1804.84 0.00 102.603 Assam ++ 9898.57 305.90 10204.46 7826.93 5658 17597.26 3859 14652.81 68.20 83.27 7907.76 202.67 101.034 Bihar (RWD) $$ 19864.87 276.30 20141.17 7522.23 13323 36157.55 4723 14592.63 35.45 40.36 8052.42 6.96 107.055 Bihar (NEA) 6842.73 0.00 6842.73 5743.01 2925 15861.32 2701 14689.03 92.34 92.61 5769.71 0.00 100.466 Chattisgarh 8427.95 58.09 8486.04 5658.99 6828 29537.29 4820 21778.34 70.59 73.73 5826.55 3.66 102.967 Goa x 9.72 0.00 9.72 10.00 90 178.16 72 158.70 80.00 89.08 5.32 0.00 53.208 Gujarat 3316.27 166.53 3482.80 1994.10 4529 12654.83 3486 8664.60 76.97 68.47 1953.95 100.72 97.999 Haryana 2160.87 290.75 2451.62 1317.97 522 5582.73 419 4556.92 80.27 81.63 1319.82 54.53 100.14
10 Himachal Pradesh 2754.53 0.15 2754.68 1839.68 2288 13147.40 1715 10159.95 74.96 77.28 1848.16 14.50 100.4611 Jammu & Kashmir 5269.61 3.17 5272.78 2462.95 1984 10154.80 962 5186.66 48.49 51.08 2549.70 4.75 103.5212 Jharkhand ~~ 6634.37 236.47 6870.83 2972.71 5237 19672.32 2043 9552.74 39.01 48.56 2921.97 13.81 98.2913 Karnataka 4066.68 254.41 4321.09 3155.23 3584 18588.88 3228 16138.24 90.07 86.82 3231.54 426.23 102.4214 Kerala 1512.89 3.71 1516.60 688.32 1430 3357.91 809 1789.10 56.57 53.28 742.68 3.50 107.9015 Madhya Pradesh ! 18334.66 360.43 18695.08 12496.13 16222 67877.97 12132 55205.31 74.79 81.33 13149.30 48.27 105.2316 Maharashtra 7675.59 321.02 7996.61 5266.33 6597 26628.07 5234 22446.31 79.34 84.30 5362.03 0.00 101.8217 Manipur 1714.15 0.00 1714.15 854.31 1318 5390.34 1019 3921.15 77.31 72.74 876.20 4.87 102.5618 Meghalaya 1110.49 4.35 1114.84 310.14 721 2202.73 378 1055.88 52.43 47.94 292.99 0.00 94.4719 Mizoram 973.11 0.00 973.11 641.00 217 2851.88 172 2273.56 79.26 79.72 616.67 1.59 96.2020 Nagaland 732.73 0.00 732.73 554.81 305 3629.63 258 3051.57 84.59 84.07 542.55 1.28 97.7921 Odisha # 17404.57 415.35 17819.92 10460.71 11935 45188.79 7408 28545.14 62.07 63.17 11326.65 24.74 108.2822 Punjab 2645.19 52.13 2697.32 1855.37 996 6765.76 797 5490.28 80.02 81.15 1944.36 0.08 104.8023 Rajasthan 12125.18 0.00 12125.18 9065.96 15448 62281.56 12891 53047.67 83.45 85.17 9195.17 0.00 101.4324 Sikkim ## 1083.00 0.00 1083.00 792.37 731 3423.36 500 2549.26 68.40 74.47 675.87 0.00 85.3025 Tamil Nadu 3041.36 108.95 3150.31 2238.20 6289 13074.20 5213 10700.09 82.89 81.84 2149.07 0.00 96.0226 Tripura ~ 2994.80 15.17 3009.98 1671.59 1420 4793.45 955 2871.04 67.25 59.90 1721.82 12.54 103.0127 Uttar Pradesh 14592.80 283.63 14876.43 10241.07 18341 52604.73 15474 41216.36 84.37 78.35 10354.36 0.00 101.1128 Uttarakhand + 3002.02 5.17 3007.19 1269.22 1125 8611.56 536 4931.18 47.64 57.26 1378.27 74.24 108.5929 West Bengal 10740.59 0.00 10740.59 4820.02 4906 24756.64 2954 15758.59 60.21 63.65 5431.12 0.00 112.68
178872.43 3586.90 182459.32 109589.19 143581 544192.50 101999 399910.61 71.04 73.49 112965.05 1079.85 103.08Union Territories
30 A & N Islands 32.39 0.00 32.39 10.59 18 0.00 0 0.26 2.4631 Dadra & Nagar Haveli 36.78 0.00 36.78 13.84 156 181.97 0 0 0.0032 Daman & Diu 10.00 0.00 10.00 10.00 0 0.00 0 4.94 49.4033 Delhi 5.00 0.00 5.00 5.00 1 0.00 0 0 0.0034 Lakshadweep 4.89 0.00 4.89 4.89 0 0.00 0 0 0.0035 Pondicherry 11.58 0.00 11.58 5.00 78 87.92 77 68.53 98.72 77.95 9.30 186.00
100.64 0.00 100.64 49.32 253 269.89 77 68.53 30.43 25.39 14.50 29.40178973.07 3586.90 182559.96 109638.51 143834 544462.39 102076 399979.14 70.97 73.46 112979.55 1079.85 103.05
X No report after Mar'09. 17/04/2014$ includes 298 LSB,* excludes 50 LSB,# includes 134 LSB,** includes 29 LSB,$$ includes 23 Missing bridges, ! includes 96 LSB,~ includes 87 LSB, + includes 53 LSB. ## includes 15 LSB,** includes 49 LSB,++ includes 513 LSB, ~~ includes 54 LSB
Statement showing Physical & Financial progress under PMGSY (Phase - I to XIII+ ADB/WB & PMGSY-2) Annexure -V-C(Rs. In crore, Length in Km)
Grand Total
Total (UTs)Grand total
Figures upto Mar'14 (In Bold letter)

Target for 2013-
14
Length completed
upto Mar'14
Target for 2013-
14
Habitations connected
upto Mar'14
Target for 2013-
14
Expenditure upto Mar'14 (GOI Share)
Expenditure upto Mar'14 (State Share)
1 2 3 4 5 6 7 8 9
1 Andhra Pradesh 475 191.58 34 0 152.56 13.962 Arunachal Pradesh 340 489.04 4 16 249.36 0.003 Assam 650 957.96 160 257 699.01 35.354 Bihar (RWD) 2800 2636.60 730 901 1685.37 6.965 Bihar (NEA) 1040 527.26 200 324 159.58 0.006 Chattisgarh 1900 1292.05 235 896 713.58 1.857 Goa * 0 0.00 0 0 0.00 0.008 Gujarat 200 896.29 42 375 477.40 4.359 Haryana 30 3.28 0 0 8.19 3.30
10 Himachal Pradesh 550 134.49 40 0 148.13 14.5011 Jammu & Kashmir 1285 891.79 100 143 534.01 0.1612 Jharkhand 1880 1030.73 340 362 539.55 0.3313 Karnataka 90 211.43 0 0 7.68 48.2914 Kerala 240 192.46 6 5 121.15 0.0015 Madhya Pradesh 3350 3006.27 400 411 1393.07 -44.2216 Maharashtra 440 448.88 15 0 383.50 0.0017 Manipur 160 533.12 15 67 139.67 0.0018 Meghalaya 40 23.68 5 14 37.70 0.0019 Mizoram 50 77.28 2 18 26.60 0.0020 Nagaland 190 293.20 1 0 77.45 0.3421 Odisha 3460 3063.22 400 700 1605.72 9.8622 Punjab 340 730.38 2 6 295.61 0.0823 Rajasthan 1580 2290.31 184 579 718.35 0.0024 Sikkim 175 99.36 10 19 90.57 0.0025 Tamil Nadu 685 747.94 5 0 383.39 0.0026 Tripura 170 291.46 20 85 232.76 0.0027 Uttar Pradesh 2320 1109.79 130 0 824.25 0.0028 Uttarakhand 500 405.16 30 26 260.64 -7.3929 West Bengal 2010 2741.38 390 1356 1130.44 0.00
26950 25316.39 3500 6560 13095.29 87.72Union Territories
30 A & N Islands 0 0 0 0 0 031 Dadra & Nagar Haveli 40 0 0 0 0 032 Daman & Diu 0 0 0 0 0 033 Delhi 0 0 0 0 0 034 Lakshadweep 0 0 0 0 0 035 Pondicherry 10 0 0 0 0 0
50 0 0 0 0 027000 25316.39 3500 6560 13095.29 87.72
Total (UTs)Grand total
Outcome Targets & Achievement 2013-14
s.no State
Length (Km) No. of Habitations Expenditure(Rs.in Cr)
Annexure -V-D
Grand Total

Annexure -V-E
Total required length
Length cleared upto Mar'14
Length completed upto
Mar'141 2 3 4 71 Andhra Pradesh 3326 6124 38692 Arunachal Pradesh 6095 6147 41963 Assam 14571 17550 146134 Bihar (RWD) 34811 13788
Bihar (NEA) 13038 99675 Chattisgarh 37556 26121 183646 Goa * 40 26 27 Gujarat 7453 5418 49928 Haryana 26 2 29 Himachal Pradesh 12832 10782 761710 Jammu & Kashmir 8412 9899 467611 Jharkhand 21445 18140 898012 Karnataka 500 505 50113 Kerala 439 789 61314 Madhya Pradesh 60264 49996 3847515 Maharashtra 4654 4520 344516 Manipur 2131 4576 314817 Meghalaya 2662 2196 105518 Mizoram 2021 2902 220019 Nagaland 1789 2047 217920 Odisha 29374 37247 2152521 Punjab 979 825 83322 Rajasthan 36472 46717 3789923 Sikkim 1107 2118 112824 Tamil Nadu 4978 3538 338125 Tripura 2980 3446 244126 Uttar Pradesh 38600 17774 1964427 Uttarakhand 10429 8914 462728 West Bengal 22995 22245 14759
367673 358411 24891917/04/2014Figures upto Mar'14 (In Bold letter)
Status of Physical Progress of PMGSY (as on 31st Mar'14)
# State(s)
New Connectivity (KM)
33544
Grand Total
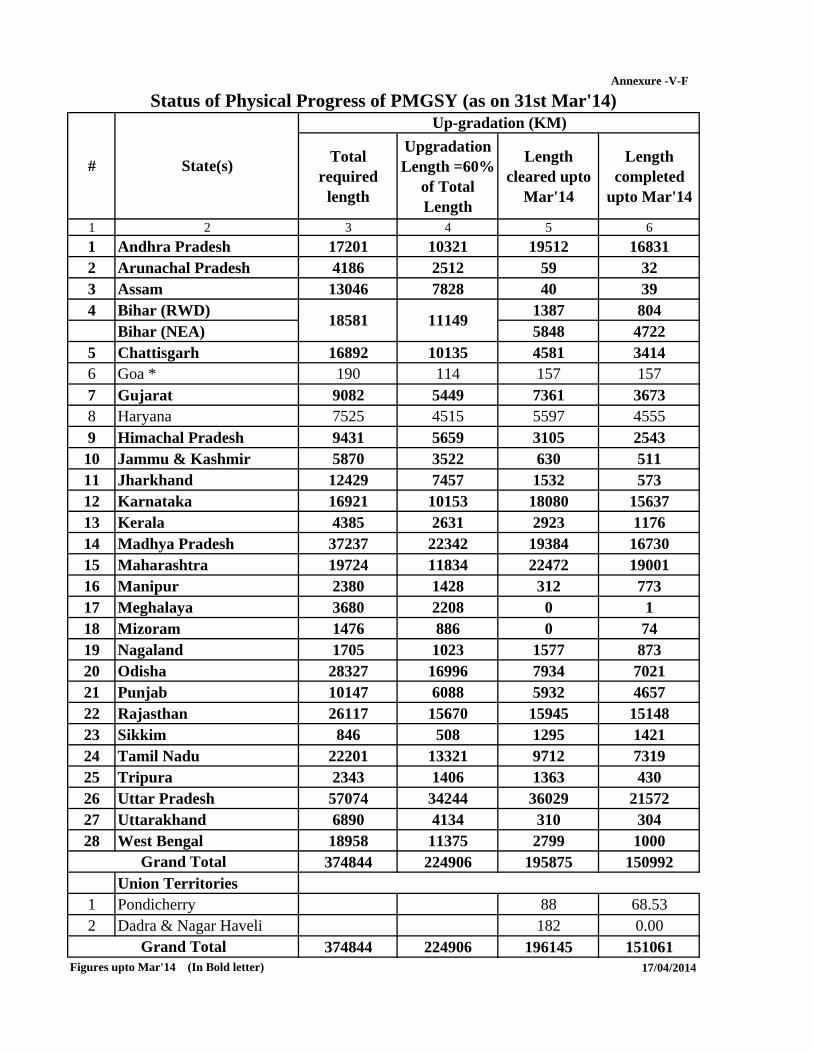
Annexure -V-F
Total required
length
Upgradation Length =60%
of Total Length
Length cleared upto
Mar'14
Length completed
upto Mar'14
1 2 3 4 5 61 Andhra Pradesh 17201 10321 19512 168312 Arunachal Pradesh 4186 2512 59 323 Assam 13046 7828 40 394 Bihar (RWD) 1387 804
Bihar (NEA) 5848 47225 Chattisgarh 16892 10135 4581 34146 Goa * 190 114 157 1577 Gujarat 9082 5449 7361 36738 Haryana 7525 4515 5597 45559 Himachal Pradesh 9431 5659 3105 254310 Jammu & Kashmir 5870 3522 630 51111 Jharkhand 12429 7457 1532 57312 Karnataka 16921 10153 18080 1563713 Kerala 4385 2631 2923 117614 Madhya Pradesh 37237 22342 19384 1673015 Maharashtra 19724 11834 22472 1900116 Manipur 2380 1428 312 77317 Meghalaya 3680 2208 0 118 Mizoram 1476 886 0 7419 Nagaland 1705 1023 1577 87320 Odisha 28327 16996 7934 702121 Punjab 10147 6088 5932 465722 Rajasthan 26117 15670 15945 1514823 Sikkim 846 508 1295 142124 Tamil Nadu 22201 13321 9712 731925 Tripura 2343 1406 1363 43026 Uttar Pradesh 57074 34244 36029 2157227 Uttarakhand 6890 4134 310 30428 West Bengal 18958 11375 2799 1000
374844 224906 195875 150992Union Territories
1 Pondicherry 88 68.532 Dadra & Nagar Haveli 182 0.00
374844 224906 196145 15106117/04/2014
Grand Total
Grand TotalFigures upto Mar'14 (In Bold letter)
Status of Physical Progress of PMGSY (as on 31st Mar'14)
# State(s)
Up-gradation (KM)
18581 11149

Phase-I Phase-II Phase-III Phase-IV Phase V Phase-VI Phase-VII Phase-VIII Phase-IX Phase -X Phase-XI Phase -XII PMGSY- II
Year of Sanction 2000-01 2001-02 2003-04 2004-05 2005-06 2006-07 2007-08 2008-09 2010-11 2012-13
No. of Road works approved 1479 1570 584 597 318 388 829 431 485 454 162 1 311 7609
No. of Road works completed 1479 1569 584 597 314 375 825 402 354 4 6503
Balance 0 1 0 0 4 13 4 29 131 450 162 1 311 1106
Length of Road works approved (in km.) 3384.33 3488.76 2077.97 2558.74 1689.35 2211.63 3368.13 1702.52 654.45 1537.57 456.76 2285.95 25416.16
Length of Road works completed (in km.) 3384.33 3483.76 2074.19 2561.60 1660.93 2101.69 3334.06 1551.24 541.32 6.52 20699.64
Balance 0.00 5.00 3.78 -2.86 28.42 109.94 34.07 151.28 113.13 1531.05 456.76 0.00 2285.95 4716.52
Value of Projects 251.96 420.50 239.28 356.95 320.79 556.99 1177.81 579.16 415.67 840.19 138.19 4.87 1075.98 6378.34
State Share 210.73 10.21 6.91 8.63 186.97 423.45
Amount Released 248.62 409.29 253.56 369.24 289.23 527.55 1175.19 275.52 552.63 4100.83
Expenditure 251.96 419.69 227.92 356.95 320.79 522.49 1048.40 486.36 320.42 59.22 4014.20
Excess expenditure by State 1.80 9.08 37.29 32.74 80.91
Name of the State - Andhra Pradesh
2013-14
Physical Progress : (Rs. In Crore)
Figures upto March'14
Total
Financial Progress (Rs. In Crore)
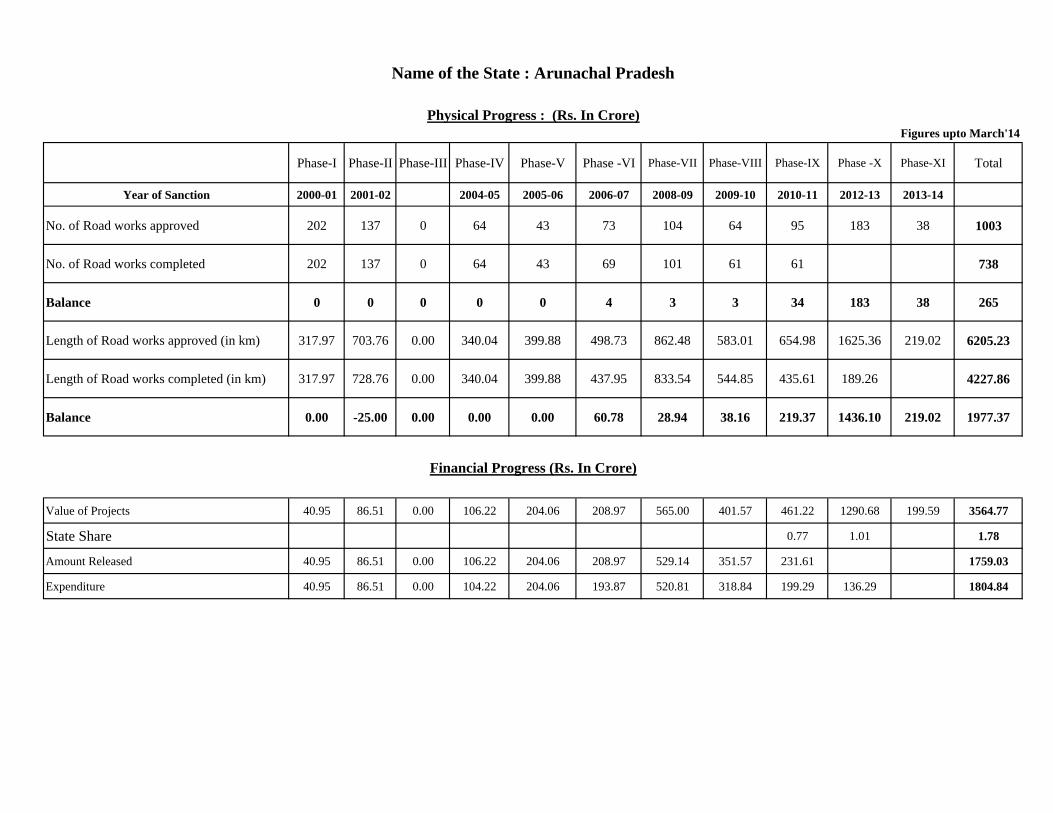
Phase-I Phase-II Phase-III Phase-IV Phase-V Phase -VI Phase-VII Phase-VIII Phase-IX Phase -X Phase-XI Total
Year of Sanction 2000-01 2001-02 2004-05 2005-06 2006-07 2008-09 2009-10 2010-11 2012-13 2013-14
No. of Road works approved 202 137 0 64 43 73 104 64 95 183 38 1003
No. of Road works completed 202 137 0 64 43 69 101 61 61 738
Balance 0 0 0 0 0 4 3 3 34 183 38 265
Length of Road works approved (in km) 317.97 703.76 0.00 340.04 399.88 498.73 862.48 583.01 654.98 1625.36 219.02 6205.23
Length of Road works completed (in km) 317.97 728.76 0.00 340.04 399.88 437.95 833.54 544.85 435.61 189.26 4227.86
Balance 0.00 -25.00 0.00 0.00 0.00 60.78 28.94 38.16 219.37 1436.10 219.02 1977.37
Value of Projects 40.95 86.51 0.00 106.22 204.06 208.97 565.00 401.57 461.22 1290.68 199.59 3564.77
State Share 0.77 1.01 1.78
Amount Released 40.95 86.51 0.00 106.22 204.06 208.97 529.14 351.57 231.61 1759.03
Expenditure 40.95 86.51 0.00 104.22 204.06 193.87 520.81 318.84 199.29 136.29 1804.84
Figures upto March'14Physical Progress : (Rs. In Crore)
Financial Progress (Rs. In Crore)
Name of the State : Arunachal Pradesh
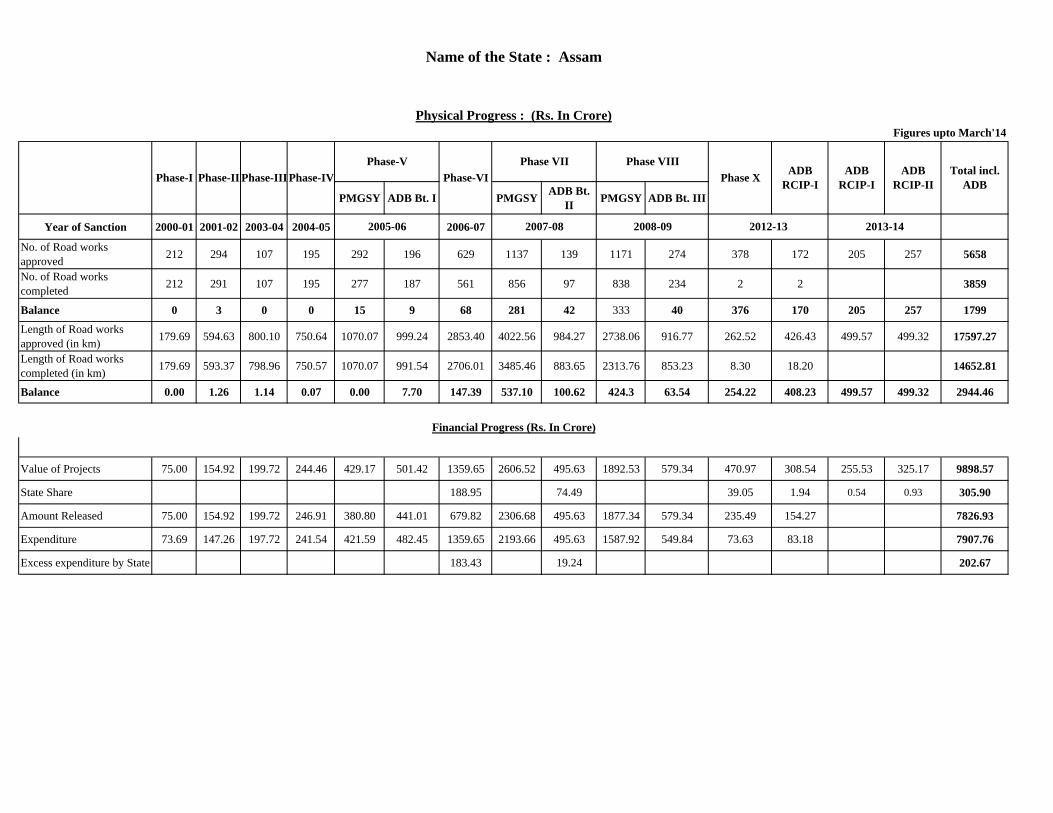
PMGSY ADB Bt. I PMGSY ADB Bt. II PMGSY ADB Bt. III
Year of Sanction 2000-01 2001-02 2003-04 2004-05 2006-07
No. of Road works approved 212 294 107 195 292 196 629 1137 139 1171 274 378 172 205 257 5658
No. of Road works completed 212 291 107 195 277 187 561 856 97 838 234 2 2 3859
Balance 0 3 0 0 15 9 68 281 42 333 40 376 170 205 257 1799
Length of Road works approved (in km) 179.69 594.63 800.10 750.64 1070.07 999.24 2853.40 4022.56 984.27 2738.06 916.77 262.52 426.43 499.57 499.32 17597.27
Length of Road works completed (in km) 179.69 593.37 798.96 750.57 1070.07 991.54 2706.01 3485.46 883.65 2313.76 853.23 8.30 18.20 14652.81
Balance 0.00 1.26 1.14 0.07 0.00 7.70 147.39 537.10 100.62 424.3 63.54 254.22 408.23 499.57 499.32 2944.46
Value of Projects 75.00 154.92 199.72 244.46 429.17 501.42 1359.65 2606.52 495.63 1892.53 579.34 470.97 308.54 255.53 325.17 9898.57
State Share 188.95 74.49 39.05 1.94 0.54 0.93 305.90
Amount Released 75.00 154.92 199.72 246.91 380.80 441.01 679.82 2306.68 495.63 1877.34 579.34 235.49 154.27 7826.93
Expenditure 73.69 147.26 197.72 241.54 421.59 482.45 1359.65 2193.66 495.63 1587.92 549.84 73.63 83.18 7907.76
Excess expenditure by State 183.43 19.24 202.67
ADB RCIP-I
ADB RCIP-II
Total incl. ADBPhase X
Financial Progress (Rs. In Crore)
2005-06
Phase VIIIPhase VII
2007-08 2008-09
ADB RCIP-IPhase-I
2012-13 2013-14
Name of the State : Assam
Physical Progress : (Rs. In Crore)
Phase-VIPhase-V
Figures upto March'14
Phase-II Phase-IIIPhase-IV
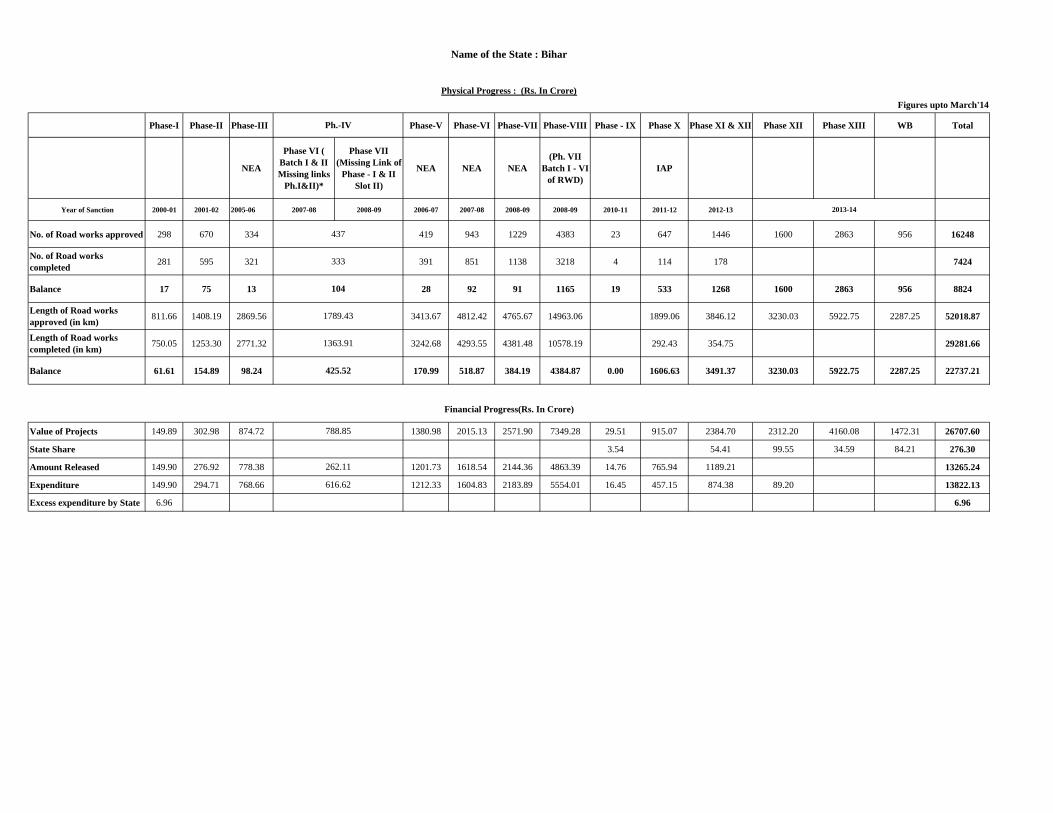
Phase-I Phase-II Phase-III Phase-V Phase-VI Phase-VII Phase-VIII Phase - IX Phase X Phase XI & XII Phase XII Phase XIII WB Total
NEA
Phase VI ( Batch I & II Missing links
Ph.I&II)*
Phase VII (Missing Link of
Phase - I & II Slot II)
NEA NEA NEA (Ph. VII
Batch I - VI of RWD)
IAP
Year of Sanction 2000-01 2001-02 2005-06 2007-08 2008-09 2006-07 2007-08 2008-09 2008-09 2010-11 2011-12 2012-13
No. of Road works approved 298 670 334 419 943 1229 4383 23 647 1446 1600 2863 956 16248
No. of Road works completed 281 595 321 391 851 1138 3218 4 114 178 7424
Balance 17 75 13 28 92 91 1165 19 533 1268 1600 2863 956 8824
Length of Road works approved (in km) 811.66 1408.19 2869.56 3413.67 4812.42 4765.67 14963.06 1899.06 3846.12 3230.03 5922.75 2287.25 52018.87
Length of Road works completed (in km) 750.05 1253.30 2771.32 3242.68 4293.55 4381.48 10578.19 292.43 354.75 29281.66
Balance 61.61 154.89 98.24 170.99 518.87 384.19 4384.87 0.00 1606.63 3491.37 3230.03 5922.75 2287.25 22737.21
Value of Projects 149.89 302.98 874.72 1380.98 2015.13 2571.90 7349.28 29.51 915.07 2384.70 2312.20 4160.08 1472.31 26707.60
State Share 3.54 54.41 99.55 34.59 84.21 276.30
Amount Released 149.90 276.92 778.38 1201.73 1618.54 2144.36 4863.39 14.76 765.94 1189.21 13265.24
Expenditure 149.90 294.71 768.66 1212.33 1604.83 2183.89 5554.01 16.45 457.15 874.38 89.20 13822.13
Excess expenditure by State 6.96 6.96
104
1789.43
788.85
262.11
616.62
1363.91
Name of the State : Bihar
Financial Progress(Rs. In Crore)
Figures upto March'14Physical Progress : (Rs. In Crore)
Ph.-IV
425.52
2013-14
437
333
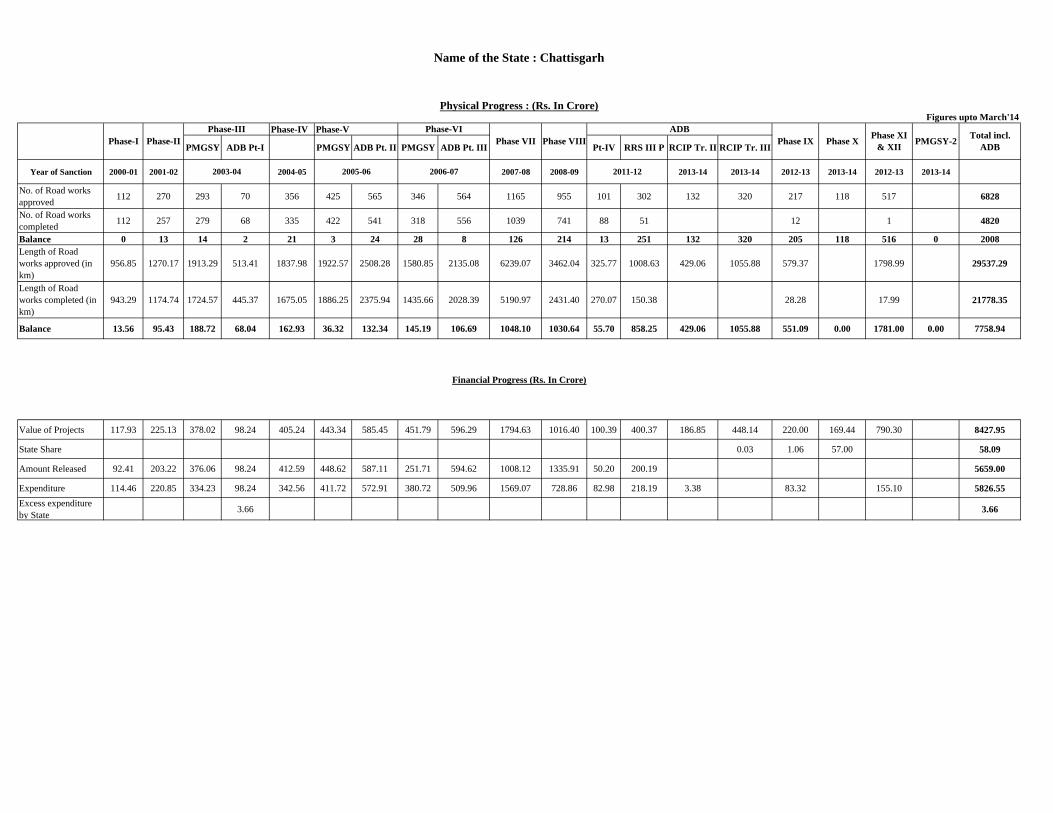
Phase-IV Phase-V
PMGSY ADB Pt-I PMGSY ADB Pt. II PMGSY ADB Pt. III Pt-IV RRS III P RCIP Tr. II RCIP Tr. III
Year of Sanction 2000-01 2001-02 2004-05 2007-08 2008-09 2013-14 2013-14 2012-13 2013-14 2012-13 2013-14
No. of Road works approved 112 270 293 70 356 425 565 346 564 1165 955 101 302 132 320 217 118 517 6828
No. of Road works completed 112 257 279 68 335 422 541 318 556 1039 741 88 51 12 1 4820
Balance 0 13 14 2 21 3 24 28 8 126 214 13 251 132 320 205 118 516 0 2008Length of Road works approved (in km)
956.85 1270.17 1913.29 513.41 1837.98 1922.57 2508.28 1580.85 2135.08 6239.07 3462.04 325.77 1008.63 429.06 1055.88 579.37 1798.99 29537.29
Length of Road works completed (in km)
943.29 1174.74 1724.57 445.37 1675.05 1886.25 2375.94 1435.66 2028.39 5190.97 2431.40 270.07 150.38 28.28 17.99 21778.35
Balance 13.56 95.43 188.72 68.04 162.93 36.32 132.34 145.19 106.69 1048.10 1030.64 55.70 858.25 429.06 1055.88 551.09 0.00 1781.00 0.00 7758.94
Value of Projects 117.93 225.13 378.02 98.24 405.24 443.34 585.45 451.79 596.29 1794.63 1016.40 100.39 400.37 186.85 448.14 220.00 169.44 790.30 8427.95
State Share 0.03 1.06 57.00 58.09
Amount Released 92.41 203.22 376.06 98.24 412.59 448.62 587.11 251.71 594.62 1008.12 1335.91 50.20 200.19 5659.00
Expenditure 114.46 220.85 334.23 98.24 342.56 411.72 572.91 380.72 509.96 1569.07 728.86 82.98 218.19 3.38 83.32 155.10 5826.55Excess expenditure by State 3.66 3.66
Financial Progress (Rs. In Crore)
Physical Progress : (Rs. In Crore)
Name of the State : Chattisgarh
2005-06 2006-07
Phase-III Phase-VIPhase VII
2003-04 2011-12
ADBPhase VIII
Figures upto March'14
Phase-IIPhase-I Total incl. ADBPhase IX Phase XI
& XIIPhase X PMGSY-2
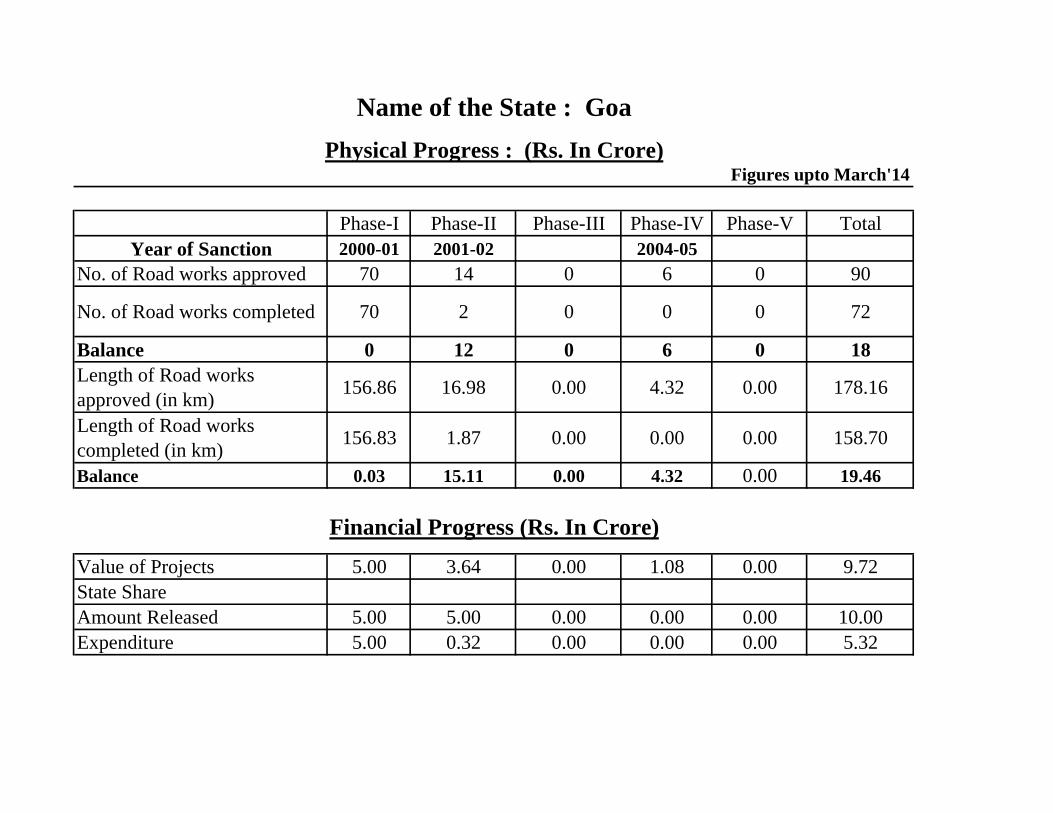
Phase-I Phase-II Phase-III Phase-IV Phase-V Total Year of Sanction 2000-01 2001-02 2004-05
No. of Road works approved 70 14 0 6 0 90
No. of Road works completed 70 2 0 0 0 72
Balance 0 12 0 6 0 18Length of Road works approved (in km) 156.86 16.98 0.00 4.32 0.00 178.16
Length of Road works completed (in km) 156.83 1.87 0.00 0.00 0.00 158.70
Balance 0.03 15.11 0.00 4.32 0.00 19.46
Value of Projects 5.00 3.64 0.00 1.08 0.00 9.72State ShareAmount Released 5.00 5.00 0.00 0.00 0.00 10.00Expenditure 5.00 0.32 0.00 0.00 0.00 5.32
Name of the State : GoaPhysical Progress : (Rs. In Crore)
Financial Progress (Rs. In Crore)
Figures upto March'14

Phase-I Phase-II Phase-III Phase-IV Phase-V Phase-VI Phase VII Phase VIII Phase IX Phase X Phase XI Phase XII Phase XIII PMGSY-2 Total
Year of Sanction 2000-01 2001-02 2003-04 2004-05 2005-06 2006-07 2007-08 2008-09 2009-10 2011-12 2012-13
No. of Road works approved 165 562 292 140 371 441 387 463 217 45 409 919 9 109 4529
No. of Road works completed 165 562 293 140 370 441 387 463 216 32 353 64 3486
Balance 0 0 -1 0 1 0 0 0 1 13 56 855 9 109 1043
Length of Road works approved (in km) 468.77 1057.29 621.21 284.52 757.53 1245.93 1358.28 1542.24 425.76 134.89 775.11 2802.99 1180.31 12654.83
Length of Road works completed (in km) 467.83 1036.70 628.19 285.79 739.41 1264.33 1351.42 1487.34 415.89 71.63 672.39 243.68 8664.60
Balance 0.94 20.59 -6.98 -1.27 18.12 -18.40 6.86 54.90 9.87 63.26 102.72 2559.31 0.00 1180.31 3990.23
Value of Projects 44.38 127.66 86.43 48.76 121.84 220.32 234.88 388.62 127.14 52.85 345.31 970.40 10.89 536.79 3316.27
State Share 1.65 0.07 21.81 2.78 140.22 166.53
Amount Released 49.81 121.70 88.70 49.31 125.10 224.02 235.46 383.79 130.38 53.18 172.66 360.00 1994.11
Expenditure 41.91 112.08 86.43 46.68 121.84 220.32 234.88 388.62 117.25 33.79 307.30 236.36 6.49 1953.95
Excess expenditure by States 0.36 4.92 11.00 45.44 39.00 100.72
Physical Progress : (Rs. In Crore)
Financial Progress (Rs. In Crore)
Figures upto March'14
Name of the State :Gujarat
2013-14
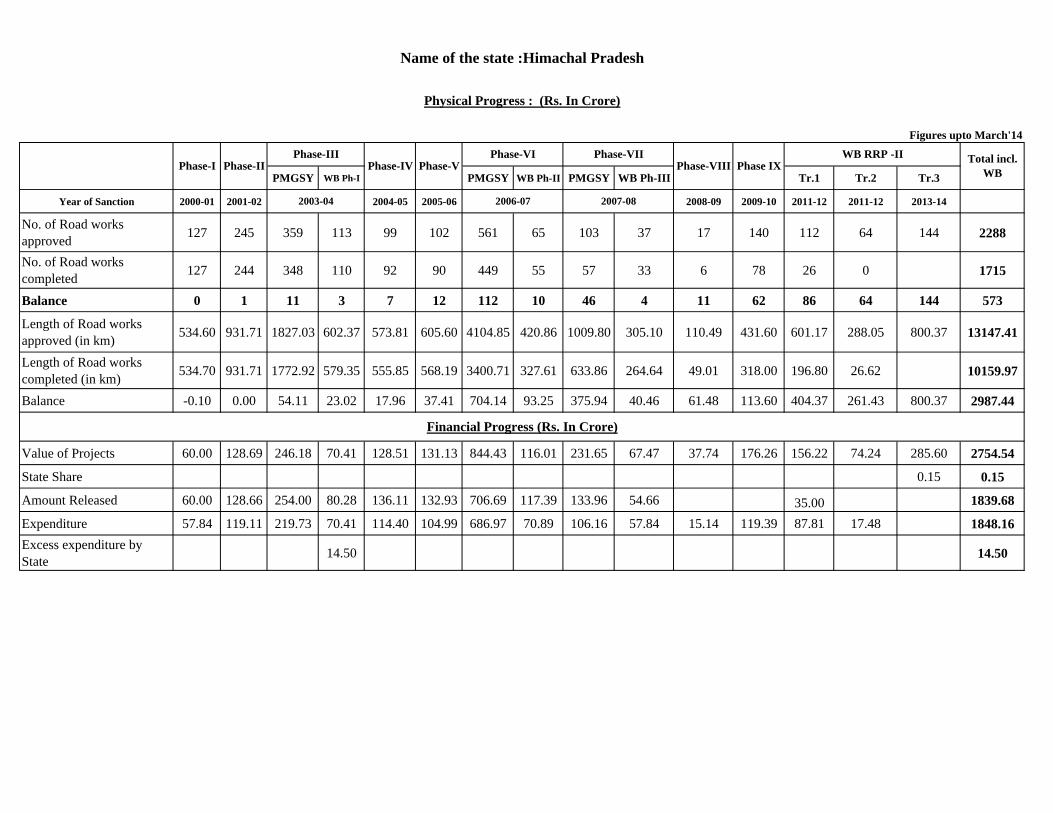
PMGSY WB Ph-I PMGSY WB Ph-II PMGSY WB Ph-III Tr.1 Tr.2 Tr.3
Year of Sanction 2000-01 2001-02 2004-05 2005-06 2008-09 2009-10 2011-12 2011-12 2013-14
No. of Road works approved 127 245 359 113 99 102 561 65 103 37 17 140 112 64 144 2288
No. of Road works completed 127 244 348 110 92 90 449 55 57 33 6 78 26 0 1715
Balance 0 1 11 3 7 12 112 10 46 4 11 62 86 64 144 573
Length of Road works approved (in km) 534.60 931.71 1827.03 602.37 573.81 605.60 4104.85 420.86 1009.80 305.10 110.49 431.60 601.17 288.05 800.37 13147.41
Length of Road works completed (in km) 534.70 931.71 1772.92 579.35 555.85 568.19 3400.71 327.61 633.86 264.64 49.01 318.00 196.80 26.62 10159.97
Balance -0.10 0.00 54.11 23.02 17.96 37.41 704.14 93.25 375.94 40.46 61.48 113.60 404.37 261.43 800.37 2987.44
Value of Projects 60.00 128.69 246.18 70.41 128.51 131.13 844.43 116.01 231.65 67.47 37.74 176.26 156.22 74.24 285.60 2754.54
State Share 0.15 0.15
Amount Released 60.00 128.66 254.00 80.28 136.11 132.93 706.69 117.39 133.96 54.66 35.00 1839.68
Expenditure 57.84 119.11 219.73 70.41 114.40 104.99 686.97 70.89 106.16 57.84 15.14 119.39 87.81 17.48 1848.16Excess expenditure by State 14.50 14.50
Financial Progress (Rs. In Crore)
Name of the state :Himachal Pradesh
2003-04
Phase-III
2006-07
Phase-VI
2007-08
Phase-VIIPhase-VPhase-IV
Figures upto March'14
Physical Progress : (Rs. In Crore)
Phase IXPhase-VIII Total incl. WBPhase-IIPhase-I
WB RRP -II
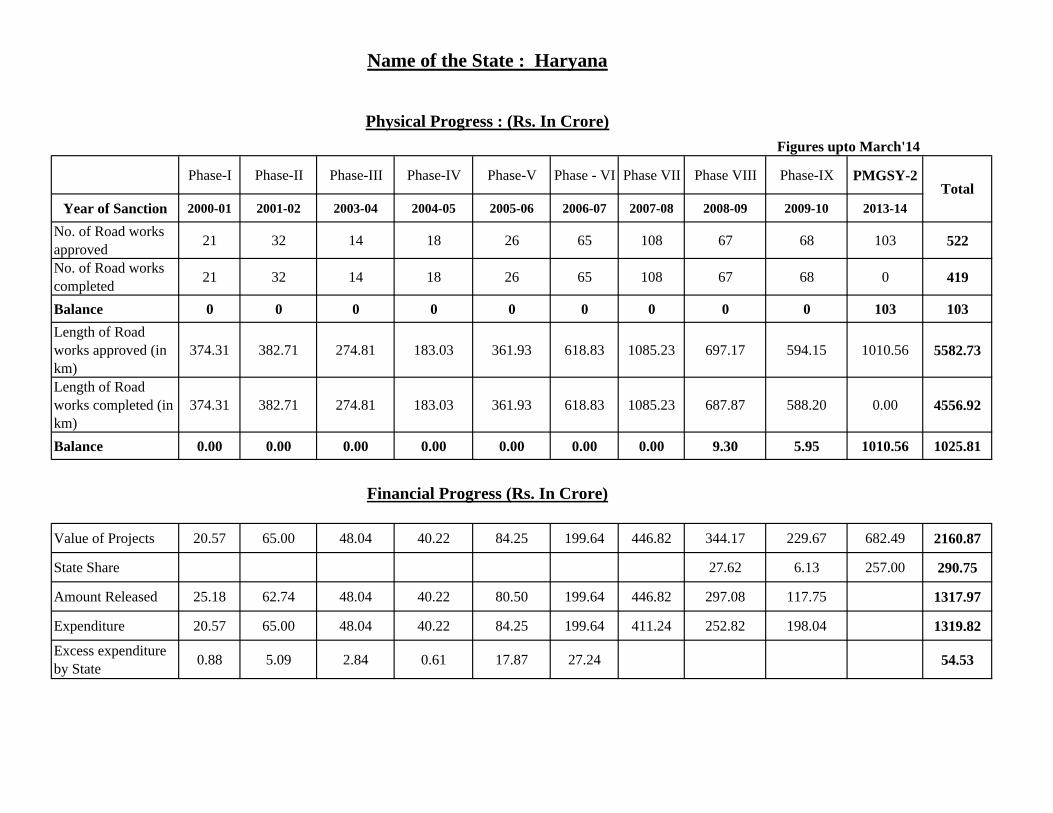
Phase-I Phase-II Phase-III Phase-IV Phase-V Phase - VI Phase VII Phase VIII Phase-IX PMGSY-2
Year of Sanction 2000-01 2001-02 2003-04 2004-05 2005-06 2006-07 2007-08 2008-09 2009-10 2013-14
No. of Road works approved 21 32 14 18 26 65 108 67 68 103 522
No. of Road works completed 21 32 14 18 26 65 108 67 68 0 419
Balance 0 0 0 0 0 0 0 0 0 103 103Length of Road works approved (in km)
374.31 382.71 274.81 183.03 361.93 618.83 1085.23 697.17 594.15 1010.56 5582.73
Length of Road works completed (in km)
374.31 382.71 274.81 183.03 361.93 618.83 1085.23 687.87 588.20 0.00 4556.92
Balance 0.00 0.00 0.00 0.00 0.00 0.00 0.00 9.30 5.95 1010.56 1025.81
Value of Projects 20.57 65.00 48.04 40.22 84.25 199.64 446.82 344.17 229.67 682.49 2160.87
State Share 27.62 6.13 257.00 290.75
Amount Released 25.18 62.74 48.04 40.22 80.50 199.64 446.82 297.08 117.75 1317.97
Expenditure 20.57 65.00 48.04 40.22 84.25 199.64 411.24 252.82 198.04 1319.82
Excess expenditure by State 0.88 5.09 2.84 0.61 17.87 27.24 54.53
Total
Figures upto March'14
Financial Progress (Rs. In Crore)
Physical Progress : (Rs. In Crore)
Name of the State : Haryana
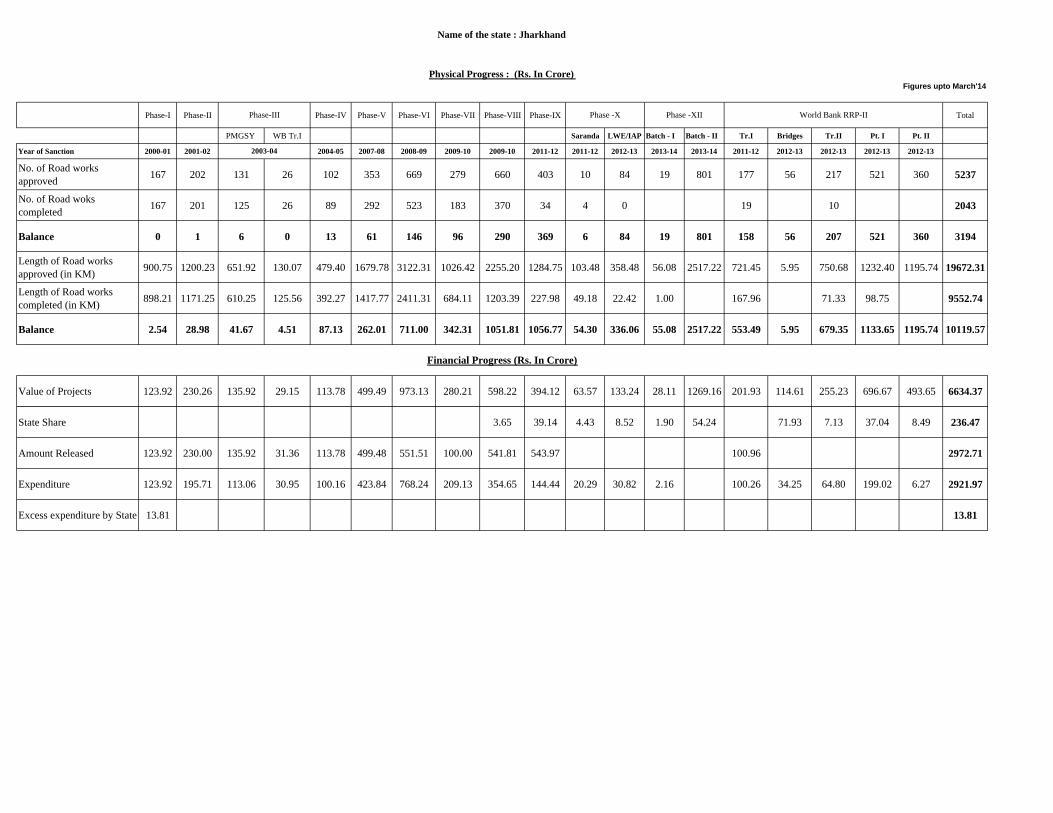
Phase-I Phase-II Phase-IV Phase-V Phase-VI Phase-VII Phase-VIII Phase-IX Total
PMGSY WB Tr.I Saranda LWE/IAP Batch - I Batch - II Tr.I Bridges Tr.II Pt. I Pt. II
Year of Sanction 2000-01 2001-02 2004-05 2007-08 2008-09 2009-10 2009-10 2011-12 2011-12 2012-13 2013-14 2013-14 2011-12 2012-13 2012-13 2012-13 2012-13
No. of Road works approved 167 202 131 26 102 353 669 279 660 403 10 84 19 801 177 56 217 521 360 5237
No. of Road woks completed 167 201 125 26 89 292 523 183 370 34 4 0 19 10 2043
Balance 0 1 6 0 13 61 146 96 290 369 6 84 19 801 158 56 207 521 360 3194
Length of Road works approved (in KM) 900.75 1200.23 651.92 130.07 479.40 1679.78 3122.31 1026.42 2255.20 1284.75 103.48 358.48 56.08 2517.22 721.45 5.95 750.68 1232.40 1195.74 19672.31
Length of Road works completed (in KM) 898.21 1171.25 610.25 125.56 392.27 1417.77 2411.31 684.11 1203.39 227.98 49.18 22.42 1.00 167.96 71.33 98.75 9552.74
Balance 2.54 28.98 41.67 4.51 87.13 262.01 711.00 342.31 1051.81 1056.77 54.30 336.06 55.08 2517.22 553.49 5.95 679.35 1133.65 1195.74 10119.57
Value of Projects 123.92 230.26 135.92 29.15 113.78 499.49 973.13 280.21 598.22 394.12 63.57 133.24 28.11 1269.16 201.93 114.61 255.23 696.67 493.65 6634.37
State Share 3.65 39.14 4.43 8.52 1.90 54.24 71.93 7.13 37.04 8.49 236.47
Amount Released 123.92 230.00 135.92 31.36 113.78 499.48 551.51 100.00 541.81 543.97 100.96 2972.71
Expenditure 123.92 195.71 113.06 30.95 100.16 423.84 768.24 209.13 354.65 144.44 20.29 30.82 2.16 100.26 34.25 64.80 199.02 6.27 2921.97
Excess expenditure by State 13.81 13.81
Name of the state : Jharkhand
Phase -XIIPhase -X
Figures upto March'14
2003-04
Phase-III
Financial Progress (Rs. In Crore)
Physical Progress : (Rs. In Crore)
World Bank RRP-II

Phase-I Phase-II Phase-III Phase-IV Phase-V Phase-VI Phase-VII Phase-VIII Phase -IX Total Year of Sanction 2000-01 2001-02 2004-05 2006-07 2007-08 2008-09 2010-11 2012-13 2012-13
No. of Road works approved 36 66 63 104 140 431 486 534 124 1984No. of Roadworks completed 36 54 53 98 75 337 255 51 3 962Balance 0 12 10 6 65 94 231 483 121 1022Length of Road works approved (in km) 96.98 219.53 285.67 406.50 1139.75 2303.74 2207.88 2651.23 843.52 10154.80
Length of Road works completed (in km) 96.95 170.10 251.32 394.12 663.97 1869.71 1341.60 379.15 19.74 5186.66
Balance 0.03 49.43 34.35 12.38 475.78 434.03 866.28 2272.08 823.78 1872.28
Value of Projects 20.09 56.63 88.06 142.42 516.46 1232.77 1440.57 1246.24 526.37 5269.61State Share 1.26 1.91 3.17Amount Released 20.09 52.44 91.27 144.41 523.40 600.13 1031.21 2462.95Expenditure 20.09 56.63 76.51 118.66 300.55 1000.75 741.12 198.07 37.32 2549.70Excess expenditure by State 1.46 3.29 4.75
Financial Progress (Rs. In Crore)
Name of the State :Jammu & Kashmir
Physical Progress : (Rs. In Crore)Figures upto March'14

Phase-I Phase-II Phase-III Phase-IV Phase-V Phase VI Phase VII Phase VIII Phase-IX Phase-X Total
Year of Sanction 2000-01 2001-02 2003-04 2004-05 2005-06 2007-08 2008-09 2010-11 2013-14 2013-14 2013-14
No. of Road works approved 33 178 52 91 74 295 292 320 51 44 1430No. of Road works completed 33 173 44 66 47 264 182 809Balance 0 5 8 25 27 31 110 320 51 44 621Length of Road works approved (in km) 113.25 282.44 97.96 172.61 152.78 678.14 849.02 745.94 161.51 104.26 3357.91
Length of Road works completed (in km) 106.61 273.78 84.03 124.58 94.50 592.69 512.91 1789.10
Balance 6.64 8.66 13.93 48.03 58.28 85.45 336.11 745.94 161.51 104.26 1568.81
Value of Projects 19.90 56.48 20.54 50.58 45.75 270.65 359.09 457.04 152.07 80.79 1512.89State Share 1.38 2.33 3.71Amount Released 19.90 56.30 20.77 52.76 44.38 294.21 200.00 688.32Expenditure 19.90 54.53 17.70 40.02 35.93 254.20 317.89 2.51 742.68Excess expenditure by State 3.50 3.50
Physical Progress : (Rs. In Crore)Figures upto March'14
Financial Progress (Rs. In Crore)
Name of the State : Kerala
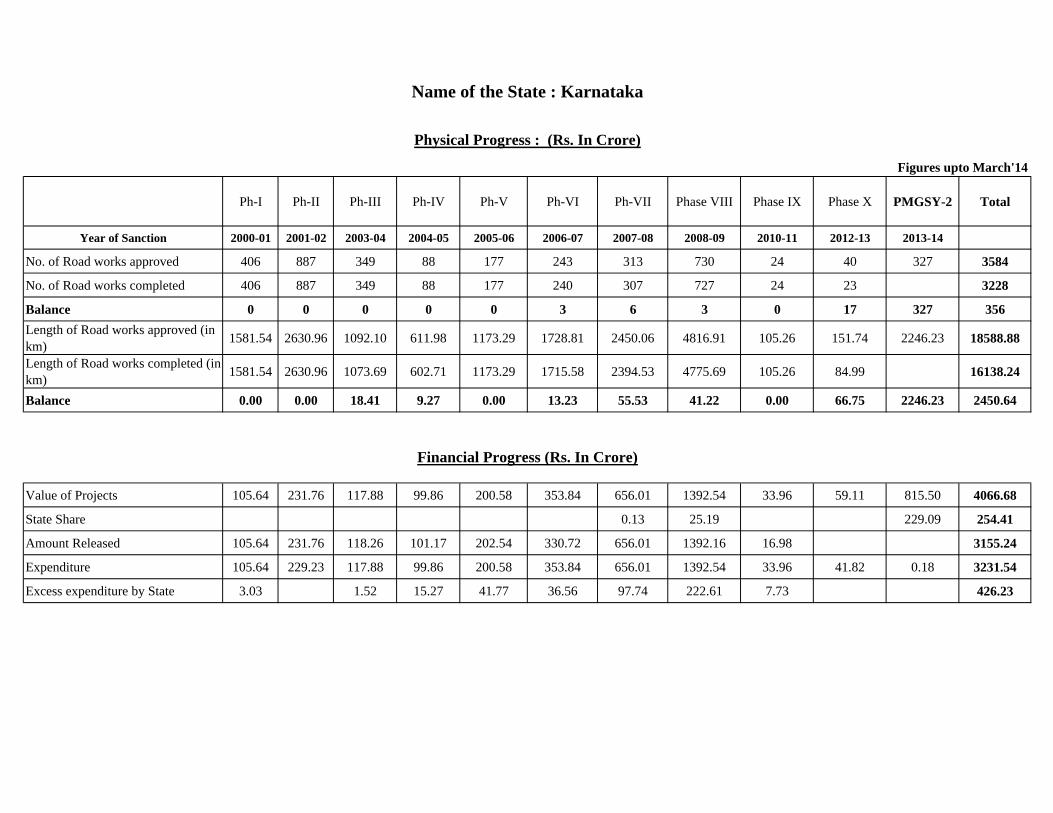
Ph-I Ph-II Ph-III Ph-IV Ph-V Ph-VI Ph-VII Phase VIII Phase IX Phase X PMGSY-2 Total
Year of Sanction 2000-01 2001-02 2003-04 2004-05 2005-06 2006-07 2007-08 2008-09 2010-11 2012-13 2013-14
No. of Road works approved 406 887 349 88 177 243 313 730 24 40 327 3584
No. of Road works completed 406 887 349 88 177 240 307 727 24 23 3228
Balance 0 0 0 0 0 3 6 3 0 17 327 356Length of Road works approved (in km) 1581.54 2630.96 1092.10 611.98 1173.29 1728.81 2450.06 4816.91 105.26 151.74 2246.23 18588.88
Length of Road works completed (in km) 1581.54 2630.96 1073.69 602.71 1173.29 1715.58 2394.53 4775.69 105.26 84.99 16138.24
Balance 0.00 0.00 18.41 9.27 0.00 13.23 55.53 41.22 0.00 66.75 2246.23 2450.64
Value of Projects 105.64 231.76 117.88 99.86 200.58 353.84 656.01 1392.54 33.96 59.11 815.50 4066.68
State Share 0.13 25.19 229.09 254.41
Amount Released 105.64 231.76 118.26 101.17 202.54 330.72 656.01 1392.16 16.98 3155.24
Expenditure 105.64 229.23 117.88 99.86 200.58 353.84 656.01 1392.54 33.96 41.82 0.18 3231.54
Excess expenditure by State 3.03 1.52 15.27 41.77 36.56 97.74 222.61 7.73 426.23
Financial Progress (Rs. In Crore)
Physical Progress : (Rs. In Crore)
Figures upto March'14
Name of the State : Karnataka

Phase-I Phase-II Phase-III Phase-IV Phase-V WB RRP-II Tr.-1
WB RRP-II Tr.II
WB RRP-IITr.II Total
Year of Sanction 2000-01 2001-02 2005-06 2006-07 2008-09 2011-12 2013-14 2013-14
No. of Road works approved 208 98 28 26 36 18 78 229 721
No. of Road works completed 208 96 27 23 21 3 378
Balance 0 2 1 3 15 15 78 229 343Length of Road works approved (in km) 454.56 259.37 87.10 105.59 183.54 105.88 266.94 739.75 2202.73
Length of Road works completed (in km) 468.81 252.91 87.10 108.75 116.93 21.38 1055.88
Balance -14.25 6.46 0.00 -3.16 66.61 84.50 266.94 739.75 1146.85
Value of Projects 34.95 75.02 26.30 39.62 128.54 94.81 229.28 481.97 1110.49
State Share 1.30 3.05 4.35
Amount Released 34.95 80.72 23.40 19.80 114.27 37.00 310.14
Expenditure 34.95 68.52 25.93 36.65 91.29 31.47 4.18 292.99
Financial Progress (Rs. In Crore)
Name of the State : Meghalaya
Physical Progress : (Rs. In Crore)Figures upto March'14

Phase-I Phase-II Phase-III Phase-IV Phase-V Phase-VI Phase-VII Phase-VIII Phase-IX Phase- X Phase -XI Phase -XII Total
Year of Sanction 2000-01 2001-02 2003-04 2004-05 2006-07 2007-08 2008-09 2010-11 2009-10 2012-13 2012-13
No. of Road works approved 800 690 295 216 1527 439 120 1041 154 461 356 134 98 266 6597
No. of Road works completed 800 690 295 216 1525 437 111 1023 105 21 11 5234
Balance 0 0 0 0 2 2 9 18 49 440 345 134 98 266 1363
Length of Road works approved (in km) 1518.63 1681.26 909.92 790.41 5984.26 4618.40 738.65 6229.47 630.89 92.13 707.88 638.02 636.71 1451.44 26628.07
Length of Road works completed (in km) 1518.10 1679.86 893.30 791.23 5977.96 4519.32 593.47 6045.90 368.11 10.00 42.86 6.20 22446.31
Balance 0.53 1.40 16.62 -0.82 6.30 99.08 145.18 183.57 262.78 82.13 665.02 631.82 636.71 1451.44 4181.76
Value of Projects 130.54 241.90 144.84 129.92 1091.15 1472.97 240.83 1710.52 188.97 418.85 570.99 352.14 284.85 697.12 7675.59
State Share 31.47 56.56 1.48 68.15 163.36 321.02
Amount Released 130.21 249.08 145.34 135.00 1063.73 1475.48 268.36 1715.67 83.46 5266.33
Expenditure 127.07 233.77 144.88 124.56 1082.45 1389.62 233.63 1610.57 104.79 141.66 163.12 5.91 5362.03
Financial Progress (Rs. In Crore)
Figures upto March'14Physical Progress : (Rs. In Crore)
Name of the State : Maharashtra
PMGSY-2
2013-14

Phase-I Phase-II Phase-III Phase-IV Phase-V Phase-VI Phase-VII Phase -VIII Phase -IX Total
Year of Sanction 2000-01 2001-02 2006-07 2008-09 2010-11 2012-13 2013-14
No. of Road works approved 642 127 59 131 69 90 200 1318
No. of Road works completed 642 127 59 131 58 2 1019
Balance 0 0 0 0 11 88 200 299Length of Road works approved (in km) 425.60 710.64 556.20 1157.37 736.57 501.98 1301.98 5390.34
Length of Road works completed (in km) 425.60 710.91 556.24 1155.18 723.75 349.47 3921.15
Balance 0.00 -0.27 -0.04 2.19 12.82 273.68 1301.98 1469.19
Value of Projects 40.00 80.71 152.33 368.28 240.83 254.25 577.75 1714.15
State Share 0.00
Amount Released 40.00 64.33 154.33 363.97 231.68 854.31
Expenditure 29.99 80.71 148.61 337.78 208.07 71.04 876.20
Excess expenditure by State 2.09 2.78 4.87
Financial Progress (Rs. In Crore)
Name of the State : Manipur
Physical Progress : (Rs. In Crore)Figures upto March'14

ADB ADB Ph-XIII ADB
PMGSY Batch-I PMGSYBatch-
II ADB Bt.III PMGSY ADB
Bt.IV LWE Bridges PMGSY (LWE)
ADB Bt.V
ADB Bt.VI
RSS-III-P
Bt. I & II
Bt. III & IV
RCIP Tr. II Regular Tr-III
Year of Sanction 2000-01 2001-02 2003-04 2007-082007-08 & 2008-
092009-10 2010-11 2011-12
No. of Road works approved 386 793 568 723 95 575 119 479 1228 535 1140 1313 3391 137 57 458 384 99 234 1237 1214 254 190 613 16222
No. of Road works completed 386 793 568 726 95 575 118 475 1210 526 1115 1277 3234 109 215 352 81 27 176 63 11 12132
Balance 0 0 0 -3 0 0 1 4 18 9 25 36 157 28 57 243 32 18 207 1061 1151 243 190 613 4090Length of Road works approved (in km)
1725.54 4016.48 2916.65 3485.46 507.99 2677.58 577.15 2295.55 5611.19 2457.32 4664.45 5050.59 14865.68 416.57 0.00 1665.71 1799.41 642.75 1187.25 4876.69 3842.66 654.04 204.58 1736.68 67877.97Length of Road works completed (in km)
1725.77 3976.25 2917.00 3483.00 524.22 2675.24 578.00 2285.00 5538.00 2451.00 4489.00 4922.70 14338.00 343.00 0.00 915.00 1698.88 556.76 317.00 1204.49 235.00 32.00 55205.31
Balance -0.23 40.23 -0.35 2.46 -16.23 2.34 -0.85 10.55 73.19 6.32 175.45 127.89 527.68 73.57 0.00 750.71 100.53 85.99 870.25 3672.20 3607.66 622.04 204.58 1736.68 12672.66
Value of Projects 188.84 563.69 592.56 719.49 99.40 533.43 114.37 453.05 1285.97 551.11 1229.11 1300.11 4352.90 123.48 48.75 530.41 524.23 199.13 422.48 1839.27 1407.42 244.23 229.33 781.89 18334.65
State Share 37.32 0.00 53.77 2.42 2.50 7.08 33.92 39.20 9.59 158.65 15.98 360.43
Amount Released 207.65 562.48 583.00 723.87 99.40 537.96 119.25 456.81 1296.10 560.71 1134.53 1161.12 3221.09 14.70 232.07 375.79 100.75 458.86 650.00 12496.14
Expenditure 188.84 563.78 491.13 644.54 91.10 492.23 107.58 414.87 1285.97 545.46 1064.97 1300.11 3802.00 99.17 70.78 336.86 410.74 141.40 182.85 655.38 227.22 32.32 13149.30
Excess expenditure by State 0.21 4.66 20.48 22.92 48.27
2013-142012-13
Physical Progress : (Rs. In Crore)
Figures upto March'14
Financial Progress (Rs. In Crore)
Phase-I Ph-VIII
Phase-XIPhase-IV
2004-05
Ph-IX
2006-07
Ph-IX -Bt.I,II,III & Pt.I
Name of the State : Madhya Pradesh
2005-06 2009-10
Phase-X Ph-VIPhase-
IITotal incl.
ADBPh-VIIPhase-III
Phase-V
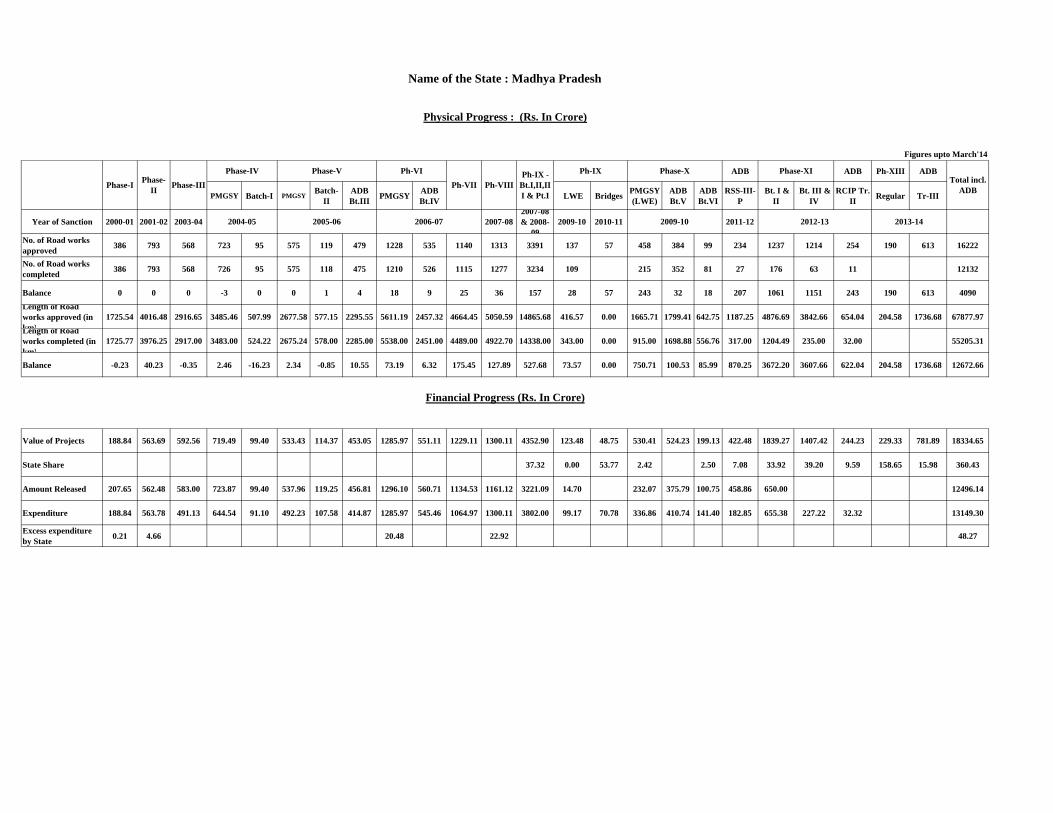

Phase-I Phase-II Phase-III* Phase-IV Phase-V Phase VI Phase VI (Stage-II) Phase VII Phase VII
(Stage-II) Total
Year of Sanction 2000-01 2001-02 2003-04 2004-05 2005-06 2006-07 2008-09 2008-09 2013-14No. of Road works approved 19 26 21 14 33 30 7 38 29 217No. of Road works completed 19 26 21 14 31 26 2 33 0 172Balance 0 0 0 0 2 4 5 5 29 45Length of Road works approved (in km) 180.43 265.50 291.94 294.63 483.13 399.49 96.40 425.44 414.92 2851.88
Length of Road works completed (in km) 180.43 265.50 291.94 294.63 460.59 335.07 56.82 388.58 0.00 2273.56
Balance 0 0 0.00 0.00 22.54 64.42 39.58 36.86 414.92 578.32
Value of Projects 23.12 46.53 48.80 92.79 118.44 147.15 34.82 176.89 284.57 973.11State Share 0.00Amount Released 19.93 49.38 48.80 92.79 121.99 147.15 160.96 0.00 641.00Expenditure 19.95 48.20 48.80 91.27 109.87 129.83 29.51 139.24 0.00 616.67Excess expenditure by State 1.59 1.59
*Actual expenditure Rs.50.39 restricted to value cleared.
Name of the State : Mizoram
Physical Progress : (Rs. In Crore)Figures upto March'14
Financial Progress (Rs. In Crore)

Phase-I Phase-II Phase-III Phase-IV Phase-V Phase-VI Phase-VII Phase-VIII Total Year of Sanction 2000-01 2001-02 2003-04 2004-05 2005-06 2006-07 2008-09 2011-12
No. of Road works approved 127 28 22 9 23 29 11 56 305No. of Road works completed 127 28 22 9 23 28 11 10 258Balance 0 0 0 0 0 1 0 46 47Length of Road works approved (in km) 870.00 324.37 193.42 224.50 390.38 467.00 205.20 954.76 3629.63
Length of Road works completed (in km) 870.00 324.37 193.42 224.50 390.38 463.00 205.20 380.70 3051.57
Balance 0.00 0.00 0.00 0.00 0.00 4.00 0.00 574.06 578.06
Value of Projects 19.75 47.76 21.44 37.51 70.20 126.26 54.04 355.77 732.73State Share 0.00Amount Released 19.75 47.76 21.44 37.51 70.19 126.26 54.04 177.86 554.81Expenditure 19.75 47.76 21.44 37.51 70.20 122.86 52.63 170.40 542.55Excess expenditure by State 0.37 0.70 0.21 1.28
Name of the state : Nagaland
Figures upto March'14Physical Progress (Rs. In Crore)
Financial Progress (Rs. In Crore)

PMGSY ADB Ph.I PMGSY ADB Ph-
II PMGSY ADB Ph. III
ADB Ph. IV
Year of Sanction 2000-01 2001-02 2003-04 2004-05 2007-08 2010-11 2010-11 2011-12
No. of Road works approved 521 571 630 418 485 257 443 400 1720 1475 310 334 182 1283 284 823 511 140 343 805 11935
No. of Road woks completed 519 571 615 401 457 246 406 369 1523 1268 270 273 105 297 10 78 0 7408
Balance 2 0 15 17 28 11 37 31 197 207 40 61 77 986 274 745 511 140 343 805 3722
Length of Road works approved (in KM) 1068.41 1692.47 2011.92 1645.12 1917.14 1189.17 1412.65 1612.22 6617.05 7116.60 1498.57 1512.01 585.68 5143.54 1052.20 3143.07 2046.31 0.00 1184.06 2740.61 45188.80
Length of Road works completed (in KM) 1049.99 1645.26 1898.50 1535.60 1710.64 1084.33 1275.15 1371.57 5619.64 5853.26 1273.85 1155.61 360.73 1836.28 159.85 659.57 55.31 28545.14
Balance 18.42 47.21 113.42 109.52 206.50 104.84 137.50 240.65 997.41 1263.34 224.72 356.40 224.95 3307.26 892.35 2483.50 1991.00 0.00 1184.06 2740.61 13903.05
Value of Projects 170.88 350.00 440.93 398.72 535.05 349.46 579.84 513.81 2698.01 2784.25 611.40 522.58 309.00 2001.35 472.75 1497.83 947.89 270.66 573.99 1376.17 17404.57
State Share 57.46 31.53 93.56 212.65 10.65 9.50 415.35
Amount Released 179.70 345.09 440.93 398.72 530.96 349.46 579.84 513.81 2234.86 2121.12 393.36 530.58 209.00 648.00 236.38 219.85 529.07 10460.73
Expenditure 167.21 342.57 438.59 378.78 521.99 349.46 579.84 462.10 2529.08 2572.84 531.17 439.05 252.34 977.71 146.43 533.81 98.66 5.02 11326.65
Excess expenditure by State 23.76 0.98 24.74
Name of the State : Odisha
Physical Progress : (Rs. In Crore)Figures upto March'14
Phase IXPhase-IIPhase-VI
Phase-IIIADB RCIP Tr.II
ADB RCIP Tr.III
Financial Progress (Rs. in Cr.)
Phase X (IAP)
ADB RRS III-P(Tr. I) (IAP)
Total Phase-I Phase XI Batch -I & Batch -II
Phase VIIIPhase-IV Phase XII
2013-142006-072005-06
Phase-VPhase-VII
2008-09 2012-13
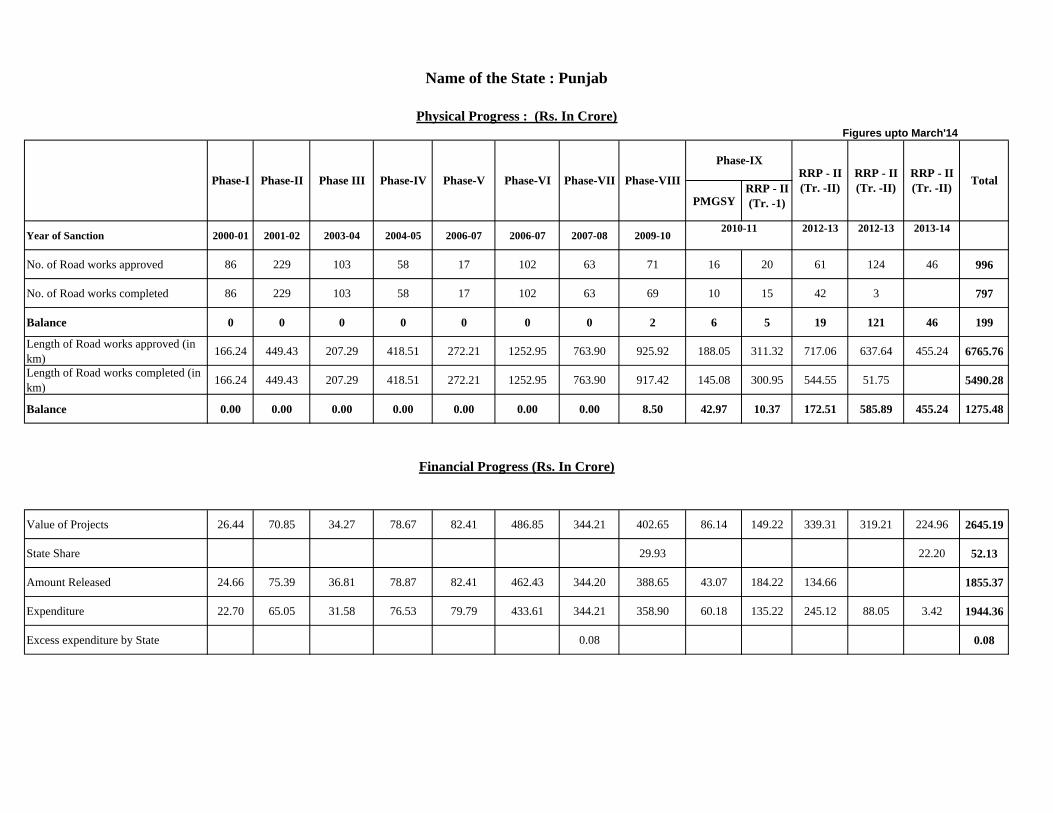
PMGSYRRP - II (Tr. -1)
Year of Sanction 2000-01 2001-02 2003-04 2004-05 2006-07 2006-07 2007-08 2009-102012-13 2012-13 2013-14
No. of Road works approved 86 229 103 58 17 102 63 71 16 20 61 124 46 996
No. of Road works completed 86 229 103 58 17 102 63 69 10 15 42 3 797
Balance 0 0 0 0 0 0 0 2 6 5 19 121 46 199
Length of Road works approved (in km) 166.24 449.43 207.29 418.51 272.21 1252.95 763.90 925.92 188.05 311.32 717.06 637.64 455.24 6765.76
Length of Road works completed (in km) 166.24 449.43 207.29 418.51 272.21 1252.95 763.90 917.42 145.08 300.95 544.55 51.75 5490.28
Balance 0.00 0.00 0.00 0.00 0.00 0.00 0.00 8.50 42.97 10.37 172.51 585.89 455.24 1275.48
Value of Projects 26.44 70.85 34.27 78.67 82.41 486.85 344.21 402.65 86.14 149.22 339.31 319.21 224.96 2645.19
State Share 29.93 22.20 52.13
Amount Released 24.66 75.39 36.81 78.87 82.41 462.43 344.20 388.65 43.07 184.22 134.66 1855.37
Expenditure 22.70 65.05 31.58 76.53 79.79 433.61 344.21 358.90 60.18 135.22 245.12 88.05 3.42 1944.36
Excess expenditure by State 0.08 0.08
Name of the State : Punjab
Financial Progress (Rs. In Crore)
Physical Progress : (Rs. In Crore)
Total Phase-VIIIPhase-VIIPhase-VIPhase-VPhase-IV RRP - II (Tr. -II)
Phase-IX
2010-11
RRP - II (Tr. -II)Phase IIIPhase-IIPhase-I
Figures upto March'14
RRP - II (Tr. -II)

Phase I Phase-II Phase-IV Phase-VI Total
PMGSY WB Tr. I PMGSY WB Tr. II PMGSY WB Tr. III W.B (BN) PMGSY WB V PMGSY WB Tr.VI Tr.I Tr.II Tr. III Tr. IV Tr. V
Year of Sanction 2000-01 2001-02 2004-05 2006-07 2011-12
No. of Road works approved 524 662 1505 610 577 880 252 3359 2274 435 37 225 112 220 9 1076 687 569 571 864 15448
No. of Road works completed 522 662 1504 608 577 865 250 3300 2274 428 37 223 108 205 8 944 315 61 12891
Balance 2 0 1 2 0 15 2 59 0 7 0 2 4 15 1 132 372 508 571 864 2557
Length of Road works approved (in km.) 1557.78 2440.26 5462.57 2242.68 2207.86 3062.83 791.49 10713.36 13925.04 1565.46 589.18 2259.68 1237.19 2635.45 91.53 3602.76 1892.04 1672.13 1714.97 2617.30 62281.56
Length of Road works completed (in km.) 1541.24 2429.21 5407.63 2219.01 2180.98 2927.88 748.84 10160.69 13153.44 1518.23 561.07 2200.90 1169.67 2441.97 79.88 3009.24 1027.86 269.93 53047.67
Balance 16.54 11.05 54.94 23.67 26.88 134.95 42.65 552.67 771.60 47.23 28.11 58.78 67.52 193.48 11.65 593.52 864.18 1402.20 1714.97 2617.30 9233.89
Value of Projects 139.73 315.53 677.60 293.67 299.36 549.41 127.95 1821.45 2750.40 294.44 160.41 497.89 307.08 636.43 28.65 885.82 549.68 483.32 510.18 796.18 12125.18
State Share 0.00
Amount Released 140.09 290.64 591.26 307.42 302.81 550.59 130.18 1821.15 2751.55 299.12 160.41 489.21 273.54 14.33 859.60 84.07 9065.97
Expenditure 102.13 257.53 611.39 278.43 270.24 465.84 117.56 1726.42 2534.46 271.04 149.18 395.73 228.47 542.73 23.06 712.15 335.67 160.96 12.18 9195.17
Financial Progress (Rs. In Crore)
RRP-II
2003-04
Phase-V
2005-06
Phase- VII
Name of the state : Rajasthan
Figures upto March'14
Physical Progress : (Rs. In Crore)
2008-09
Phase- VIII
2009-10
Phase- IX
2007-08 2012-13
Phase-III

Phase-I Phase-II Phase-III Phase-IV Phase-V Phase VI Phase VII Phase VIII Phase-IX Total
Year of Sanction 2000-01 2001-02 2003-04 2004-05 2006-07 2007-08 2008-09 2011-12 2013-14
No. of Road works approved 245 31 21 34 67 93 105 95 40 731
No. of Road woks completed 245 31 21 33 60 61 45 4 500
Balance 0 0 0 1 7 32 60 91 40 231
Length of Road works approved (in km.) 1089.00 260.31 105.95 144.49 323.27 482.26 488.69 351.91 177.49 3423.37
Length of Road works completed (in km.) 1089.00 260.31 105.95 139.90 308.37 387.89 247.30 10.54 2549.26
Balance 0.00 0.00 0.00 4.59 14.90 94.37 241.39 341.37 177.49 874.11
Value of Projects 13.16 37.81 35.30 63.10 149.00 211.92 254.56 206.04 112.11 1083.00
State Share 0.00
Amount Released 13.16 37.81 35.29 51.26 149.00 211.92 190.91 103.02 792.37
Expenditure 13.16 37.17 34.88 61.01 137.88 167.56 175.94 43.67 4.60 675.87
Name of the State : Sikkim
Physical Progress : (Rs. In Crore)
Financial Progress (Rs. In Crore)
Figures upto March'14
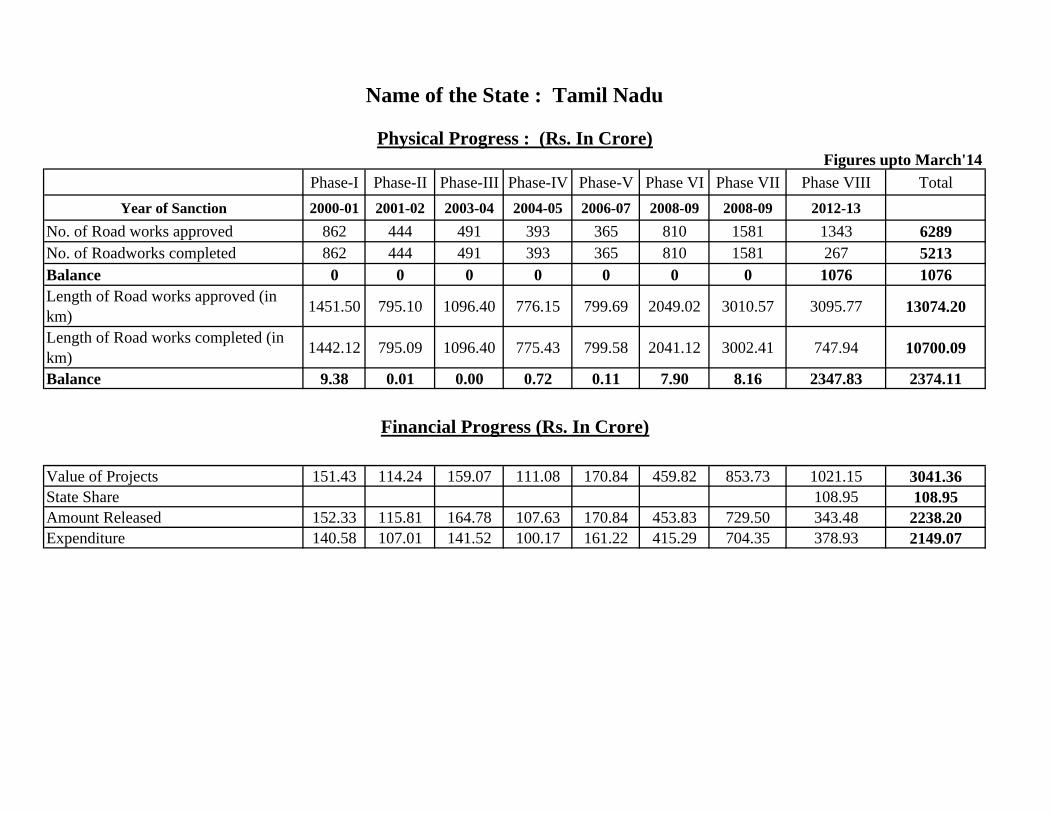
Phase-I Phase-II Phase-III Phase-IV Phase-V Phase VI Phase VII Phase VIII Total Year of Sanction 2000-01 2001-02 2003-04 2004-05 2006-07 2008-09 2008-09 2012-13
No. of Road works approved 862 444 491 393 365 810 1581 1343 6289No. of Roadworks completed 862 444 491 393 365 810 1581 267 5213Balance 0 0 0 0 0 0 0 1076 1076Length of Road works approved (in km) 1451.50 795.10 1096.40 776.15 799.69 2049.02 3010.57 3095.77 13074.20
Length of Road works completed (in km) 1442.12 795.09 1096.40 775.43 799.58 2041.12 3002.41 747.94 10700.09
Balance 9.38 0.01 0.00 0.72 0.11 7.90 8.16 2347.83 2374.11
Value of Projects 151.43 114.24 159.07 111.08 170.84 459.82 853.73 1021.15 3041.36State Share 108.95 108.95Amount Released 152.33 115.81 164.78 107.63 170.84 453.83 729.50 343.48 2238.20Expenditure 140.58 107.01 141.52 100.17 161.22 415.29 704.35 378.93 2149.07
Financial Progress (Rs. In Crore)
Physical Progress : (Rs. In Crore)Figures upto March'14
Name of the State : Tamil Nadu

Phase-I Phase-II Phase-III Phase-IV Phase-V Phase-VI Phase-VII Phase-VIII Phase-IX Phase-X Total
Year of Sanction 2000-01 2001-02 2005-06 2006-07 2006-07 2007-08 2008-09 2011-12No. of Road works approved 194 42 34 38 227 323 78 109 204 93 78 1420No. of Road works completed 193 42 34 43 222 305 65 41 10 955Balance 1 0 0 -5 5 18 13 68 194 93 78 465Length of Road works approved (in km) 413.61 174.05 79.27 140.78 718.51 1134.98 340.31 369.50 579.27 527.33 315.84 4793.45
Length of Road works completed (in km) 391.75 158.44 77.56 135.26 676.28 1012.55 270.70 126.88 21.62 2871.04
Balance 21.86 15.61 1.71 5.52 42.23 122.43 69.61 242.62 557.65 527.33 315.84 1922.41
Value of Projects 24.75 42.95 38.48 79.22 444.89 688.90 223.16 347.67 462.36 402.68 239.76 2994.81State Share 6.12 0.11 8.89 0.05 15.17Amount Released 24.75 42.68 39.58 60.81 418.98 687.80 223.16 173.83 1671.59Expenditure 24.75 42.95 35.94 73.26 397.43 658.13 199.48 215.56 74.32 1721.82Excess expenditure by State 8.43 4.11 12.54
Figures upto March'14
Name of the State : Tripura
Physical Progress : (Rs. In Crore)
Financial Progress (Rs. In Crore)
2013-14

PMGSY WB RRP -I Tr.I PMGSY WB RRP -
I Tr.IIW.B.(BN)
W.B Tr.(IV) PMGSY WB RRP-
II Pt.I PMGSY WB RRP-II Pt.II PMGSY WB RRP-
II Pt.III
Year of Sanction 2000-01 2001-02 2004-05 2005-06 2007-08 2009-10 2010-11 2013-14
No. of Road works approved 5133 1304 1507 585 2123 2213 761 447 43 1310 50 212 41 514 62 671 714 399 252 18341
No. of Road works completed 5046 1332 1554 465 2110 2162 758 321 38 1255 31 129 4 183 0 51 26 9 15474
Balance 87 -28 -47 120 13 51 3 126 5 55 19 83 37 331 62 620 688 390 252 2867
Length of Road works approved (in km)
8246.00 2422.04 2913.13 1317.00 3929.57 6760.51 5880.17 935.06 413.88 8011.26 305.28 370.52 144.25 812.64 96.17 1126.79 4237.18 2769.98 1913.33 52604.76
Length of Road works completed (in km)
8212.54 2482.73 2941.08 1146.35 3901.49 6875.49 5897.57 726.84 367.47 7703.91 219.75 242.08 7.35 275.15 0.00 70.99 109.80 35.77 41216.36
Balance 33.46 -60.69 -27.95 170.65 28.08 -114.98 -17.40 208.22 46.41 307.35 85.53 128.44 136.90 537.49 96.17 1055.80 4127.38 2734.21 1913.33 11388.40
Value of Projects 324.22 504.05 628.44 343.94 938.78 1904.43 2012.57 276.31 147.15 2821.78 105.37 162.25 54.74 370.14 40.35 533.35 1560.34 1013.68 850.91 14592.80
State Share 283.63 283.63
Amount Released 321.11 588.65 650.27 313.10 803.88 2013.46 2010.31 276.30 103.57 2410.89 63.53 184.07 350.00 151.93 10241.07
Expenditure 314.97 487.20 624.79 299.83 896.64 1787.13 1909.83 215.80 131.30 2665.50 65.01 94.69 5.76 186.92 3.93 138.07 354.76 172.23 10354.36
2012-132011-12
Phase XPhase-VIII (IAP)
Financial Progress (Rs. In Crore)
2003-04 2006-07
Phase-VI
Total incl. WBPhase-V*
Phase-IXPhase-III * Phase X
PMGSY-2
Name of the state : Uttar Pradesh
Figures upto March'14Physical Progress (Rs. In Crore)
Phase-I Phase-II* Phase-VIIPhase-IV *

Year of Sanction 2000-01 2001-02 2003-04 2004-05 2005-06 2007-08 2009-10 2010-11 2013-14 2011-12 2012-13
No. of Road works approved 68 95 46 79 101 88 117 101 132 29 126 109 34 1125No. of Road works completed 68 95 44 79 87 67 52 33 536
Balance 0 0 2 0 14 21 65 68 132 29 126 109 34 589Length of Road works approved (in km) 298.96 472.76 394.55 595.47 888.31 727.81 1051.00 711.40 1304.62 34.74 1139.78 674.85 317.31 8611.56
Length of Road works completed (in km) 298.96 471.19 394.55 589.89 867.33 669.09 821.07 591.65 14.75 175.50 37.20 4931.18
Balance 0.00 1.57 0.00 5.58 20.98 58.72 229.93 119.75 1304.62 19.99 964.28 637.65 317.31 3680.38
Value of Projects 60.33 135.60 54.15 102.87 200.57 219.92 363.52 245.38 620.07 43.23 470.37 335.01 151 3002.02
State Share 0.47 2.29 0.89 0.99 0.53 5.17
Amount Released 60.63 140.41 54.15 98.53 168.42 197.70 209.60 155.22 35.32 149.24 1269.22
Expenditure 57.60 135.60 54.16 102.87 200.57 203.24 219.89 154.52 16.31 186.90 46.61 1378.27
Excess expenditure by State 6.82 31.58 17.92 17.92 74.24
Financial Progress (Rs. In Crore)
Name of the State : Uttarakhand
RRP-II (Tr.I)
Phase-VIIIPhase-VIIPhase-IVPhase-IIIPhase-IIPhase-I
Phase II works include 4 bridges
RRP-II (Tr.II)
RRP-II (Tr.III)Phase-V Phase-VI Phase-XII
2013-14
Total
Figures upto March'14Physical Progress : (Rs. In Crore)
RRP-II (Tr.-II)
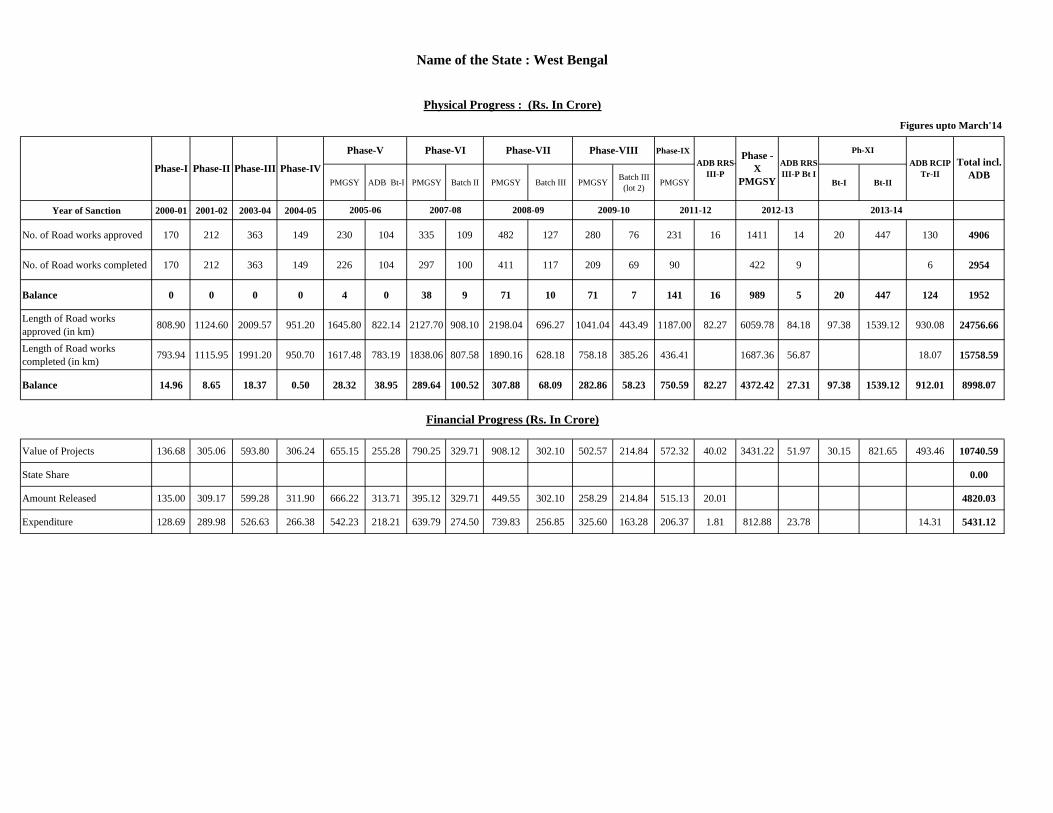
Phase-IX
PMGSY ADB Bt-I PMGSY Batch II PMGSY Batch III PMGSY Batch III (lot 2) PMGSY Bt-I Bt-II
Year of Sanction 2000-01 2001-02 2003-04 2004-05
No. of Road works approved 170 212 363 149 230 104 335 109 482 127 280 76 231 16 1411 14 20 447 130 4906
No. of Road works completed 170 212 363 149 226 104 297 100 411 117 209 69 90 422 9 6 2954
Balance 0 0 0 0 4 0 38 9 71 10 71 7 141 16 989 5 20 447 124 1952
Length of Road works approved (in km) 808.90 1124.60 2009.57 951.20 1645.80 822.14 2127.70 908.10 2198.04 696.27 1041.04 443.49 1187.00 82.27 6059.78 84.18 97.38 1539.12 930.08 24756.66
Length of Road works completed (in km) 793.94 1115.95 1991.20 950.70 1617.48 783.19 1838.06 807.58 1890.16 628.18 758.18 385.26 436.41 1687.36 56.87 18.07 15758.59
Balance 14.96 8.65 18.37 0.50 28.32 38.95 289.64 100.52 307.88 68.09 282.86 58.23 750.59 82.27 4372.42 27.31 97.38 1539.12 912.01 8998.07
Value of Projects 136.68 305.06 593.80 306.24 655.15 255.28 790.25 329.71 908.12 302.10 502.57 214.84 572.32 40.02 3431.22 51.97 30.15 821.65 493.46 10740.59
State Share 0.00
Amount Released 135.00 309.17 599.28 311.90 666.22 313.71 395.12 329.71 449.55 302.10 258.29 214.84 515.13 20.01 4820.03
Expenditure 128.69 289.98 526.63 266.38 542.23 218.21 639.79 274.50 739.83 256.85 325.60 163.28 206.37 1.81 812.88 23.78 14.31 5431.12
Financial Progress (Rs. In Crore)
Phase-VII Phase-VIIITotal incl.
ADB
Phase -X
PMGSY
2012-13
ADB RRS-III-P Bt IPhase-I Phase-II
2013-14
Ph-XIADB RCIP
Tr-IIADB RRS-
III-P
2005-06 2008-09 2009-10 2011-122007-08
Name of the State : West Bengal
Physical Progress : (Rs. In Crore)
Phase-IV
Phase-V
Figures upto March'14
Phase-VI
Phase-III

No. of Road works
completed
Length of road works completed
(Km)
Expenditure reported (Rs.
crore)
Hab. Connected dg the year
No. of Road works
completed
Length of road works completed
(Km)
Expenditure reported (Rs.
crore)
Hab. Connected dg the year
No. of Road works completed
Length of road works completed
(Km)
Expenditure reported
(Rs. crore)
Hab. Connected dg the year
No. of Road works completed
Length of road works completed
(Km)
Expenditure reported (Rs.
crore)
Hab. Connected dg the year
No. of Road works
completed
Length of road works completed
(Km)
Expenditure reported (Rs.
crore)
Hab. Connected dg
the year
1 2 3 4 5 6 7 8 9 10 11 12 13 14 15 16 17 18 19 20 21 22
1 Andhra Pradesh 465 1,404 107 262 479 2,195 265 21 332 1,657 382 1 383 1,885 494 1 807 3092 886 802 Arunachal Pradesh 16 136 3 - 13 272 64 16 33 272 132 36 31 317 152 29 37 623 248 193 Assam 90 478 256 228 270 1,547 462 826 129 1,141 609 843 293 1,985 1,007 1,642 387 2096 1413 10464 Bihar (RWD) 353 814 59 - 85 142 31 1,029 25 61 4 59 21 45 187 30 138 412 779 148
Bihar (NEA) 9 82 126 - 109 936 428 44 174 1,604 577 170 288 2,487 881 938 486 2431 1096 7545 Chhattisgarh 328 2,005 442 601 518 2,989 652 902 603 2,719 933 1,097 721 2,427 863 1,037 1003 4020 805 12006 Goa 2 2 0 2 - - - - - - - - - - - - 0 0 0 07 Gujarat 321 653 80 343 293 586 110 280 334 830 157 255 375 1,262 255 315 451 1511 190 2438 Haryana 22 322 48 - 14 374 137 - 64 670 217 - 99 970 313 - 71 785 277 19 Himachal Pradesh 159 1,362 123 302 141 1,503 289 307 197 1,555 282 295 307 1,360 241 330 224 1506 220 66
10 Jammu & Kashmir 10 25 17 12 22 47 35 - 52 141 105 49 48 470 191 220 119 662 359 36611 Jharkhand 112 519 65 149 59 309 57 139 63 277 63 130 44 215 211 173 170 1531 458 40812 Karnataka 243 802 58 3 114 366 133 - 268 1,427 349 12 301 2,099 550 - 444 3020 884 013 Kerala 30 47 16 7 44 77 25 57 53 101 61 24 111 240 84 63 119 264 114 3514 Madhya Pradesh 653 2,962 588 1,010 857 3,788 1,008 1,427 939 5,231 1,359 2,032 2,068 7,894 2,198 2,414 2235 10398 2235 102715 Maharashtra 118 323 178 93 459 1,599 219 332 695 2,942 637 41 818 4,139 930 82 457 3112 995 3016 Manipur 101 283 29 40 6 200 13 - - 266 64 - 59 79 38 54 68 880 145 2917 Meghalaya 30 75 11 35 12 38 17 13 17 52 16 9 8 31 13 10 25 98 20 2318 Mizoram 12 174 44 13 1 147 38 1 17 207 59 14 11 195 55 9 13 203 67 1619 Nagaland 14 356 21 14 1 10 33 - 13 398 20 5 19 299 87 24 16 274 72 1520 Odisha 301 1,494 377 568 491 2,070 583 543 432 1,836 677 490 685 2,641 1,163 1,644 596 3838 1895 36721 Punjab 52 97 52 52 64 441 80 23 64 1,036 367 - 54 752 269 - 62 710 323 022 Rajasthan 1,116 4,015 608 1,398 1,824 6,217 1,229 1,998 3,005 9,888 1,455 3,055 1,694 10,350 1,696 1,400 382 4350 795 7923 Sikkim 13 192 30 44 30 204 44 11 7 142 89 10 22 309 104 32 41 99 80 2724 Tamil Nadu 270 501 52 220 214 519 68 147 379 748 109 185 241 610 128 96 1026 1940 560 625 Tripura 6 4 18 12 36 176 41 80 40 60 156 75 119 361 316 301 170 520 254 38326 Uttar Pradesh 1,366 2,453 368 1,499 1,366 2,656 710 1,497 1,649 3,552 1,201 1,268 1,423 6,461 2,000 2,002 1697 9527 2915 43627 Uttarakhand 21 93 29 20 18 106 67 21 67 842 100 72 25 646 153 132 101 764 173 15928 West Bengal 230 1,220 296 1,275 192 1,198 470 1,087 227 1,574 439 1,109 268 1,877 583 1,497 238 1452 576 914
6,463 22,891 4,100 8,202 7,732 30,710 7,304 10,801 9,878 41,231 10,619 11,336 10,536 52,405 15,162 14,475 11583 60117 18833 7877Union Territories
29 A & N Islands 30 Dadra & Nagar
Haveli31 Daman & Diu 32 Delhi 33 Lakshadweep 34 Pondicherry 11 69 1
Grand total 6,463 22,891 4,100 8,202 7,732 30,710 7,304 10,801 9,889 41,300 10,619 11,336 10,536 52,405 15,162 14,475 11583 60117 18833 7877
2006-07 ( April to March) 2007-08 ( April to March)
Annexure VI (A)
2009-10 ( April to March)Year-wise Progress ( Physical & Financial) during 2005-06, 2006-07, 2007-08, 2008-09 & 2009-10
No Reports are being received from UTs Data from MPR
2008-09 ( April to March)
Total
# State
2005-06 ( April to March)
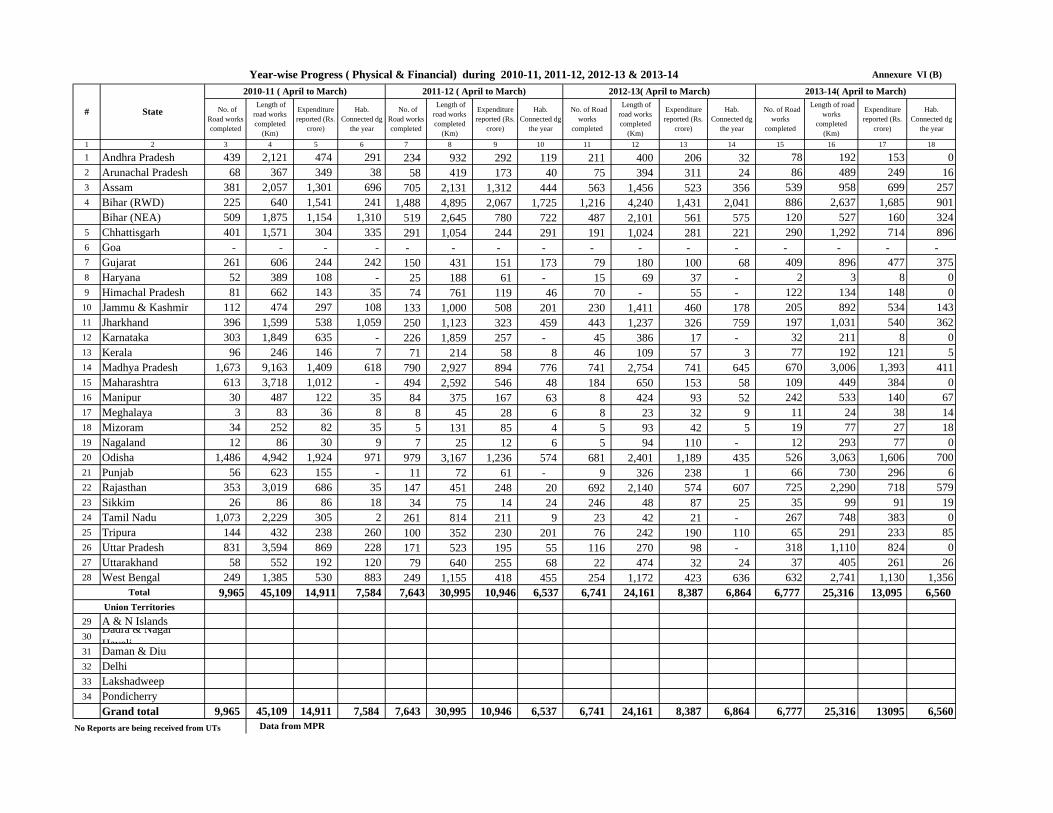
No. of Road works completed
Length of road works completed
(Km)
Expenditure reported (Rs.
crore)
Hab. Connected dg
the year
No. of Road works completed
Length of road works completed
(Km)
Expenditure reported (Rs.
crore)
Hab. Connected dg
the year
No. of Road works
completed
Length of road works completed
(Km)
Expenditure reported (Rs.
crore)
Hab. Connected dg
the year
No. of Road works
completed
Length of road works
completed (Km)
Expenditure reported (Rs.
crore)
Hab. Connected dg
the year
1 2 3 4 5 6 7 8 9 10 11 12 13 14 15 16 17 18
1 Andhra Pradesh 439 2,121 474 291 234 932 292 119 211 400 206 32 78 192 153 02 Arunachal Pradesh 68 367 349 38 58 419 173 40 75 394 311 24 86 489 249 163 Assam 381 2,057 1,301 696 705 2,131 1,312 444 563 1,456 523 356 539 958 699 2574 Bihar (RWD) 225 640 1,541 241 1,488 4,895 2,067 1,725 1,216 4,240 1,431 2,041 886 2,637 1,685 901
Bihar (NEA) 509 1,875 1,154 1,310 519 2,645 780 722 487 2,101 561 575 120 527 160 3245 Chhattisgarh 401 1,571 304 335 291 1,054 244 291 191 1,024 281 221 290 1,292 714 8966 Goa - - - - - - - - - - - - - - - - 7 Gujarat 261 606 244 242 150 431 151 173 79 180 100 68 409 896 477 3758 Haryana 52 389 108 - 25 188 61 - 15 69 37 - 2 3 8 09 Himachal Pradesh 81 662 143 35 74 761 119 46 70 - 55 - 122 134 148 0
10 Jammu & Kashmir 112 474 297 108 133 1,000 508 201 230 1,411 460 178 205 892 534 14311 Jharkhand 396 1,599 538 1,059 250 1,123 323 459 443 1,237 326 759 197 1,031 540 36212 Karnataka 303 1,849 635 - 226 1,859 257 - 45 386 17 - 32 211 8 013 Kerala 96 246 146 7 71 214 58 8 46 109 57 3 77 192 121 514 Madhya Pradesh 1,673 9,163 1,409 618 790 2,927 894 776 741 2,754 741 645 670 3,006 1,393 41115 Maharashtra 613 3,718 1,012 - 494 2,592 546 48 184 650 153 58 109 449 384 016 Manipur 30 487 122 35 84 375 167 63 8 424 93 52 242 533 140 6717 Meghalaya 3 83 36 8 8 45 28 6 8 23 32 9 11 24 38 1418 Mizoram 34 252 82 35 5 131 85 4 5 93 42 5 19 77 27 1819 Nagaland 12 86 30 9 7 25 12 6 5 94 110 - 12 293 77 020 Odisha 1,486 4,942 1,924 971 979 3,167 1,236 574 681 2,401 1,189 435 526 3,063 1,606 70021 Punjab 56 623 155 - 11 72 61 - 9 326 238 1 66 730 296 622 Rajasthan 353 3,019 686 35 147 451 248 20 692 2,140 574 607 725 2,290 718 57923 Sikkim 26 86 86 18 34 75 14 24 246 48 87 25 35 99 91 1924 Tamil Nadu 1,073 2,229 305 2 261 814 211 9 23 42 21 - 267 748 383 025 Tripura 144 432 238 260 100 352 230 201 76 242 190 110 65 291 233 8526 Uttar Pradesh 831 3,594 869 228 171 523 195 55 116 270 98 - 318 1,110 824 027 Uttarakhand 58 552 192 120 79 640 255 68 22 474 32 24 37 405 261 2628 West Bengal 249 1,385 530 883 249 1,155 418 455 254 1,172 423 636 632 2,741 1,130 1,356
9,965 45,109 14,911 7,584 7,643 30,995 10,946 6,537 6,741 24,161 8,387 6,864 6,777 25,316 13,095 6,560
29 A & N Islands 30
Dadra & Nagar Haveli
31 Daman & Diu 32 Delhi 33 Lakshadweep 34 Pondicherry
Grand total 9,965 45,109 14,911 7,584 7,643 30,995 10,946 6,537 6,741 24,161 8,387 6,864 6,777 25,316 13095 6,560No Reports are being received from UTs
2013-14( April to March)
Annexure VI (B)Year-wise Progress ( Physical & Financial) during 2010-11, 2011-12, 2012-13 & 2013-14
Data from MPR
2012-13( April to March)
Union Territories
2010-11 ( April to March)
Total
# State
2011-12 ( April to March)

Annexure-VI(C)
(Rs. in Crores)
# States
Closing Balance as
on 31.03.2007
Closing Balance as
on 31.03.2008
Closing Balance as
on 31.03.2009
Closing Balance as
on 31.03.2010
Closing Balance as
on 31.03.2011
Release dg 11th Plan
Exp. Dg 11th Plan
Closing Balance as on
31.03.2012
1 2 3 4 5 6 7 8 9 10
1 Andhra Pradesh 39 (26) (50) (64) 129 2,934 2,528 445 2 Arunachal Pradesh 42 13 (35) (0) 21 1,072 1,054 61 3 Assam 108 54 15 (219) 381 6,285 5,642 751 4 Bihar (RWD) 68 64 136 131 514 5,556 4,577 1,047 5 Bihar (NEA) 75 224 82 (94) 194 4,564 4,487 151 6 Chattisgarh 5 123 191 (104) 270 3,972 3,149 827 7 Goa 5 5 5 5 5 - - 5 8 Gujarat 22 10 (16) (13) 66 957 997 (18) 9 Haryana 57 57 16 (6) 44 961 976 43
10 Himachal Pradesh (12) 19 47 (48) 9 1,212 1,004 195 11 Jammu & Kashmir 50 18 17 28 96 1,756 1,461 345 12 Jharkhand 101 38 35 (5) 295 2,308 1,594 815 13 Karnataka 20 (58) 26 (93) 190 2,589 2,675 (67) 14 Kerala 36 (0) (2) (16) (18) 551 464 124 15 Madhya Pradesh 64 321 (34) (157) 399 8,675 8,095 643 16 Maharashtra (5) (78) 22 (29) 196 4,567 4,120 441 17 Manipur (3) 9 (9) (5) 17 566 536 26 18 Meghalaya 13 (3) 20 0 28 137 113 37 19 Mizoram 53 13 23 1 14 318 349 23 20 Nagaland 28 20 18 11 7 198 221 5 21 Odisha' 168 38 126 (175) 368 7,825 6,896 1,098 22 Punjab 22 15 (11) 15 54 1,311 1,175 157 23 Rajasthan (76) 115 191 (21) 179 5,555 4,880 599 24 Sikkim 21 104 55 44 35 452 372 101 25 Tamil Nadu 80 43 3 (37) 128 1,309 1,313 77 26 Tripura 61 39 83 (18) (1) 1,107 1,193 (25) 27 Uttar Pradesh 267 285 (65) (142) 298 7,219 7,179 307 28 Uttarakhand 15 (6) (44) (51) (5) 892 872 35 29 West Bengal (4) 102 142 (59) 230 3,187 2,547 636
1,320 1,554 988 (1,121) 4,146 78,035 70,471 8,885 Union Territories
30 A & N Islands 10 10 10 10 10 - - 10
31 Dadra & Nagar Haveli 5 9 14 14 14 9 - 14
32 Daman & Diu 5 5 5 5 5 - - 5 33 Delhi 5 5 5 5 5 - - 5 34 Lakshadweep 5 5 5 5 5 - - 5 35 Pondicherry (4) 1 1 1 (4) - 1 (4)
27 35 40 40 35 9 1 35 1,347 1,589 1,028 (1,081) 4,180 78,044 70,472 8,919
Figures in bracket are minus figures.Data from MPR
Department of Rural Development State wise Opening balance of funds,Releases ,Expenditure & Closing Balance during 11th Plan
Scheme : Pradhan Mantri Gram Sadak Yojana (PMGSY)
Grand Total
Total (UTs)Grand total
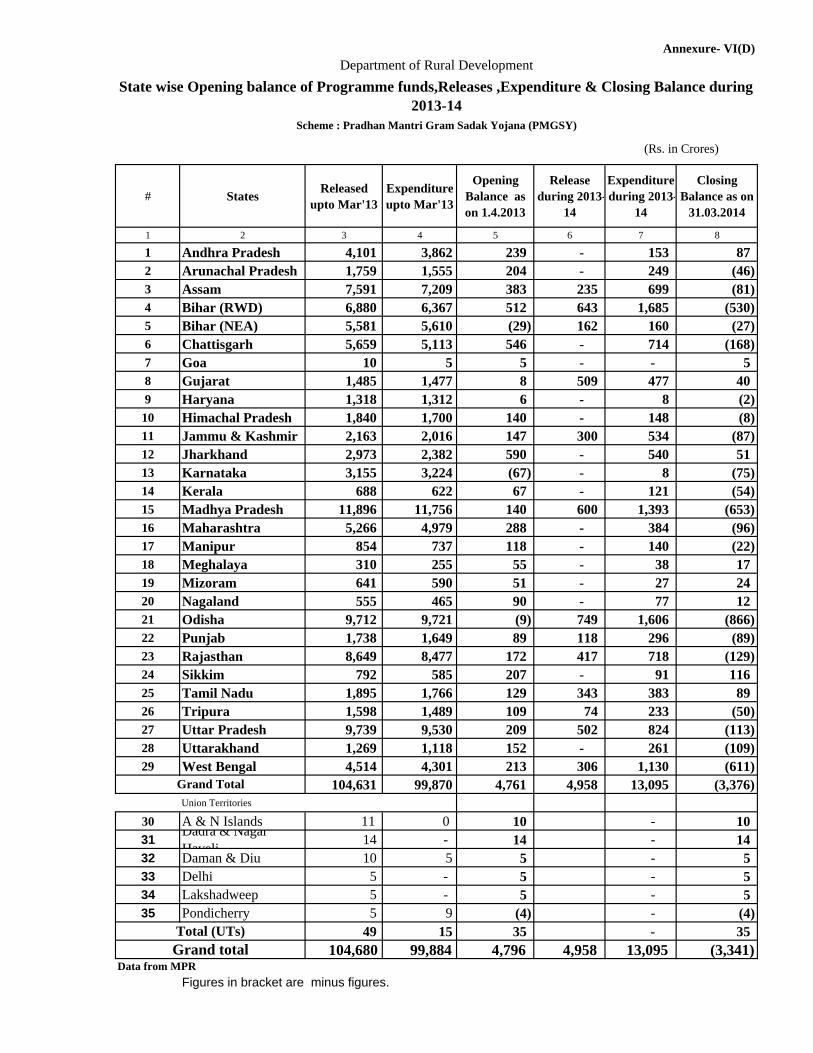
# States Released upto Mar'13
Expenditure upto Mar'13
Opening Balance as on 1.4.2013
Release during 2013-
14
Expenditure during 2013-
14
Closing Balance as on
31.03.2014
1 2 3 4 5 6 7 8
1 Andhra Pradesh 4,101 3,862 239 - 153 87 2 Arunachal Pradesh 1,759 1,555 204 - 249 (46) 3 Assam 7,591 7,209 383 235 699 (81) 4 Bihar (RWD) 6,880 6,367 512 643 1,685 (530) 5 Bihar (NEA) 5,581 5,610 (29) 162 160 (27) 6 Chattisgarh 5,659 5,113 546 - 714 (168) 7 Goa 10 5 5 - - 5 8 Gujarat 1,485 1,477 8 509 477 40 9 Haryana 1,318 1,312 6 - 8 (2)
10 Himachal Pradesh 1,840 1,700 140 - 148 (8) 11 Jammu & Kashmir 2,163 2,016 147 300 534 (87) 12 Jharkhand 2,973 2,382 590 - 540 51 13 Karnataka 3,155 3,224 (67) - 8 (75) 14 Kerala 688 622 67 - 121 (54) 15 Madhya Pradesh 11,896 11,756 140 600 1,393 (653) 16 Maharashtra 5,266 4,979 288 - 384 (96) 17 Manipur 854 737 118 - 140 (22) 18 Meghalaya 310 255 55 - 38 17 19 Mizoram 641 590 51 - 27 24 20 Nagaland 555 465 90 - 77 12 21 Odisha 9,712 9,721 (9) 749 1,606 (866) 22 Punjab 1,738 1,649 89 118 296 (89) 23 Rajasthan 8,649 8,477 172 417 718 (129) 24 Sikkim 792 585 207 - 91 116 25 Tamil Nadu 1,895 1,766 129 343 383 89 26 Tripura 1,598 1,489 109 74 233 (50) 27 Uttar Pradesh 9,739 9,530 209 502 824 (113) 28 Uttarakhand 1,269 1,118 152 - 261 (109) 29 West Bengal 4,514 4,301 213 306 1,130 (611)
104,631 99,870 4,761 4,958 13,095 (3,376) Union Territories
30 A & N Islands 11 0 10 - 10 31 Dadra & Nagar
Haveli 14 - 14 - 14 32 Daman & Diu 10 5 5 - 5 33 Delhi 5 - 5 - 5 34 Lakshadweep 5 - 5 - 5 35 Pondicherry 5 9 (4) - (4)
49 15 35 - 35 104,680 99,884 4,796 4,958 13,095 (3,341)
Figures in bracket are minus figures.
Grand totalData from MPR
(Rs. in Crores)
Annexure- VI(D)Department of Rural Development
State wise Opening balance of Programme funds,Releases ,Expenditure & Closing Balance during 2013-14
Scheme : Pradhan Mantri Gram Sadak Yojana (PMGSY)
Grand Total
Total (UTs)

Annexure‐VII‐A
Value in Crores
No of roads / bridges
Length in Km
No. of Habs
Value in Crores
No of roads / bridges
Length in Km
No. of Habs
RemarksValue in Crores
No of roads / bridges
Length in Km
No. of Habs
RemarksValue in Crores
No of roads / bridges
Length in KmNo. of Habs
Remarks
1 Andhra Pradesh 626.40187 roads+298 bridges
639.01 26 850.40420 roads +34 bridges
1537.57 213 1421.55454 roads20 bridges
2742.71 170Including PMGSY‐II
2 Arunachal Pradesh 461.9944 roads +51
bridges654.98 6 610.80
78 roads +14 bridges
901.56 15Habs for State‐I &II only
1613.5263 roads
66 bridges943.38 46 Habs in cluster
3 Assam 820.50293 roads+257 briges
688.94 426 582.17404 roads58 briges
1000.51 451
4 Bihar 948.12647 roads + 23 bridges
1899.06 647 2439.111350 roads +96 bridges
3846.12 3617 8162.945163 roads 256 bridges
11457.77 6290
5 Chattisgarh 502.51 404 1340.24 590 1011.36 734 2378.36 817 861.46452 roads
118 bridges1484.94 333
6 Goa
7 Gujarat 53.17 46 136.89 49 345.38 409 775.11 443 1669.22 1028 roads 3983.31 57Including PMGSY‐II
8 Haryana 917.4583 roads
18 bridges989.32 PMGSY‐II
9 Himachal Pradesh 230.46 176 889.22 26Habs for State‐I / I & II
285.75141 roads3 bridges
800.37 19Habs only for stage‐I & II
10 Jammu & Kashmir 1463.21470 roads + 24 bridges
2239.01 487 1774.52603 roads +55 bridges
3494.75 150Habs for Stage‐I & II
only
11 Jharkhand 703.19540 roads + 50 bridges
2109.68 889 1826.511064 roads +174 bridges
3537.29 1711 1353.14729 roads91 bridges
2578.78 586New connmectivityupgradation
12 Karnataka 33.96 24 105.26 0 60.00 41 154.68 All Upgradation 1044.59 315 roads 2246.23 PMGSY‐II
13 Kerala 256.27 220 621.46 0 693.61 415 roads 1011.71 Upgradation works
14 Madhya Pradesh 102.53 57 bridges 1042.69 743 3105.20 925 3573.63 2705 9373.11 3460 1185.85691 roads
112 bridges1952.57 703
15 Maharashtra 1717.98 1057 6252.72 105 1077.87158 roads +659 bridges
800.01 179 1567.10414 roads84 bridges
2726.17 25 PMGSY‐II
16 Manipur 231.68 69 736.57 106 254.2546 roads+44 bridges
425.42 139 577.75194 roads6 bridges
1301.98 58Habs only for stage‐I & II
17 Meghalaya 94.81 18 105.88 26 715.60272 roads36 bridges
1007.52 75Habs only for stage‐I & II
18 Mizoram 284.57 29 roads 414.92 0 All stage‐II works
19 Nagaland 355.77 56 954.76 0
20 Orissa 402.56122 roads + 60 bridges
590.43 2474.10 1567 6195.74 1842 2445.72 1334 5189.38 1684 2453.601137 roads157 bridges
3925.78 1244
21 Punjab 235.36 36 499.36Upgradation road works
658.52 182 1354.70 7New Connectivity & Upgradation
247.16 46 roads 455.24 Upgradation
22 Rajasthan 885.81 1076 3602.77 1076 1033.00 1256 3564.17 1265 1306.36 1435 roads 4332.30 1455
23 Sikkim 206.0480 roads + 15 bridges
351.89 0 State‐II works 112.11 40 roads 177.49 State‐II works
24 Tamil Nadu 1130.101298 roads45 bridges
3095.77 55New Connectivity &Upgradation
25 Tripura 347.6769 roads + 40 bridges
369.50 186 1104.84338 roads37 bridges
1422.44 266
26 Uttar Pradesh 179.95 224 403.27 224 424.88 555 956.88 568 3147.721845 roads
1 bridge8230.12 756
New Connectivity &Upgradation
1134.54 252 roads 1913.33 PMGSY‐II
27 Uttarakhand 339.04100 roads + 26 bridges
981.27 121 71.5412 roads + 24 bridges
98.11 16 471.36118 roads8 bridges
1139.78 37Habs for State‐ I &II only
1106.61248 roads27 briges
2296.78 205
28 West Bengal 717.41 356 1484.53 867 612.34 247 1269.27 514 3483.19 1425 6143.96 2361 1345.26 597 roads 2566.60 519
6532.972873 roads516 bridges
14708.51 1942 9188.466272 roads 152 bridges
23884.45 7354 27013.9415359 roads1387 bridges
56630.79 17335 31746.7414934 road
1101 bridges53732.16 12502Total
2010‐11
# State
Details of cleared proposals during 2010‐11, 2011‐12, 2012‐13 & 2013‐142013‐14 2012‐132011‐12

Annexure VII (B)
S.No. State Date of Pre‐EC1 Bihar 8th April, 2012
2 Madhya Pradesh 9th April, 2012
3 Maharashtra, 3rd May, 2012
4 Jammu & Kashmir 3rd May, 2012
5 Andhra Pradesh: 3rd July, 2012
6 Madhya Pradesh: 4th July, 2012
7 Chattisgarh 6th July 2012
8 Gujarat 6th July 2012
9 Uttar Pradesh: 14th July, 2012
10 Orissa 16th August, 2012
11 Himachal Pradesh 6th Sept., 2012
12 Punjab 18th Sep., 2012
13 West Bengal 27th Sep., 2012
14 Rajasthan 18th October, 2012
15 Arunachal Pradesh 8th October, 2012
16 Uttarakhand 21st October, 2012
17 Tamil Nadu 15th November, 2012
18 Chattisgarh 5th December, 2012
19 Assam 10th December, 2012
20 Madhya Pradesh 28th December, 2012
21 Andhra Pradesh 7th January, 2013
22 Jharkhand 12th January, 2013
23 Mizoram 12th January, 2013
24 Kerala 20th February, 2013
25 Tripura 21st February, 2013
26 Meghalaya 6th March, 2013
27 Sikkim 6th March, 2013
28 Uttarakhand 18th March, 2013
29 Manipur 20th March, 2013
30 West Bengal 4th April, 2013
Details of Pre‐Empowered Committee Meetings of PMGSY

31 Assam 27th June, 2013
32 Odisha 3rd July, 2013
33 Chhattisgarh 4th July, 2013
34 Gujarat 5th July, 2013
35 Rajasthan 12th July, 2013
36 Jharkhand 25th July, 2013
37 Tripura 30th August, 2013
38 Maharashtra 17th September, 2013
39 Madhya Pradesh 18th September, 2013
40 Odisha 7th October, 2013
41 Tripura 17th October, 2013
42 Meghalaya 18th October, 2013
43 Arunachal Pradesh 18th October, 2013
44 Punjab 19th November, 2013
45 Rajasthan 26th Novemebr,2013
46 Bihar 20th December, 2013
47 Kerala 10th January 2014
48 Himachal Pradesh 13th January 2014
49 Chhattisgarh 17th January 204
50 Assam 17th January 204
51 Jharkhand 22nd January 2014
52 Jharkhand (Ircon) 21st February 2014
1 Gujarat 29th October,2013
2 Karnataka 31st October 2013
3 Andhra Pradesh 14th Novemebr,2013
4 Maharashtra 27th Novemebr,2013
5 Haryana 3rd December,2013
6 Uttar Pradesh 13th December,2013
7 Uttar Pradesh 29th January ,2014
8 Maharashtra 19th February, 2014
PMGSY II

Annexure‐VII‐C
#Date of ECM
State Phase / Batch OutcomeValue in Crores
No. of roads / Bridges
Length in Km
Remarks
1 12‐Apr‐12Madhya Pradesh
Phase‐XII (Batch‐I) Cleared 634.3076 426 1722.32
25‐Apr‐13 Punjab Phase‐X Cleared 339.31 426 1722.32
J & K
Phase‐XIi) Bharat Nirmanii) Border Blocksiii) Long Span Bridges
Cleared 526.37119 roads5 bridges
843.52
Maharashtra
Phase‐IXi) Missing Bridgesii) New Connectivity for 800‐999 group iii) New Connectivity for 250‐499 group
Cleared 627.55149 roads
207 bridges707.88
3 17‐May‐12 Bihari) New Connectivityii) Long Span Bridges
Cleared 2439.111350 roads96 bridges
3846.12
Chattisgarh IAP districts Cleared 221.06 217 579.37
GujaratBharat NirmanNormal PMGSY
Cleared 345.38 409 775.11
5 13‐Jul‐12Madhya Pradesh
Phase‐XII (Batch‐II) Cleared 1238.88 811 3154.37
Andhra Pradesh
Phase‐X (IAP districts) Cleared 398.09 266 802.41
Uttar PradeshWB RRP‐II (Part‐II)IAP districts
Cleared 579.93 739 1235.73
7 19‐Sep‐12 OrissaPhase‐XIIIAP & non IAP
Cleared 1497.00 823 3143.07
8 2‐Nov‐12 West BengalPhase‐XNormal & IAP
Cleared 3483.19 1425 6143.96
9 16‐Nov‐12 Uttar PradeshRRP‐IINormalLSB
Cleared 2574.021112 roads
1 bridge7007.15
10 TamilnaduPhase‐IXNormal & LSB
Cleared 1130.101298 roads45 bridges
3095.77
11 PunjabPhase‐XI (RRP‐II)Upgradation
Cleared 319.21 121 637.64
12 24‐Dec‐12 Uttarakhand
Phase‐X (RRP‐II)New ConnectivityUpgradationLSBs
Cleared 471.36118 roads8 bridges
1139.78
13 02‐Jan‐13 Rajasthan Phase‐X (IV) Cleared 483.32 569 1672.13
14 14‐Jan‐13Arunachal Pradesh
Phase‐X Cleared 610.8078 roads
14 bridges901.56
26‐Jul‐12
4
6
6‐Dec‐12
10‐May‐12
12‐Jul‐12
Destails of Empowered Committee meetings held during 2012‐13 for PMGSYUpto Mar'13
2
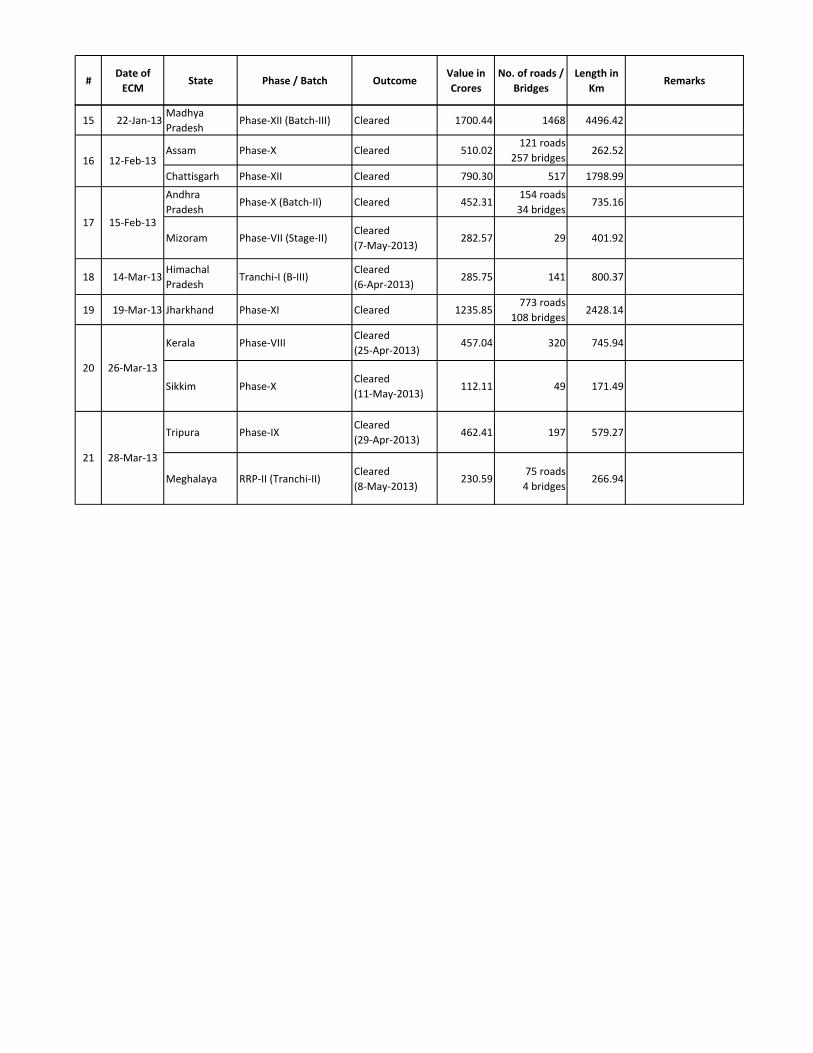
#Date of ECM
State Phase / Batch OutcomeValue in Crores
No. of roads / Bridges
Length in Km
Remarks
15 22‐Jan‐13Madhya Pradesh
Phase‐XII (Batch‐III) Cleared 1700.44 1468 4496.42
Assam Phase‐X Cleared 510.02121 roads
257 bridges262.52
Chattisgarh Phase‐XII Cleared 790.30 517 1798.99
Andhra Pradesh
Phase‐X (Batch‐II) Cleared 452.31154 roads34 bridges
735.16
Mizoram Phase‐VII (Stage‐II)Cleared (7‐May‐2013)
282.57 29 401.92
18 14‐Mar‐13Himachal Pradesh
Tranchi‐I (B‐III)Cleared (6‐Apr‐2013)
285.75 141 800.37
19 19‐Mar‐13 Jharkhand Phase‐XI Cleared 1235.85773 roads
108 bridges2428.14
Kerala Phase‐VIIICleared (25‐Apr‐2013)
457.04 320 745.94
Sikkim Phase‐XCleared (11‐May‐2013)
112.11 49 171.49
Tripura Phase‐IXCleared(29‐Apr‐2013)
462.41 197 579.27
Meghalaya RRP‐II (Tranchi‐II)Cleared (8‐May‐2013)
230.5975 roads4 bridges
266.94
21
17
16 12‐Feb‐13
26‐Mar‐13
28‐Mar‐13
15‐Feb‐13
20

#Date of ECM
State Phase / Batch OutcomeValue in Crores
No. of roads / Bridges
Length in Km
Remarks
Manipur Phase‐IX Cleared 577.75194 roads6 bridges
1301.98
West Bengal Phase‐XI Batch‐I Cleared 523.61 150 1027.47
2 12‐Jun‐13 Andhra Pradesh Phase‐XI Cleared 145.10 162 456.76
3 13‐Jun‐13 West Bengal Phase‐XI Batch‐II Cleared 821.65 447 1539.13
4 14‐Jun‐13Arunachal Pradesh
Phase‐X (batch‐III) Cleared 43.283 roads3 bridges
61.00
5 27‐Jun‐13 Uttarakhand Phase‐XI Cleared 335.5482 roads27 bridges
674.85
6 04‐Jul‐13 Bihar‐RWDPhase‐XIIWB RRPII Tranche‐I
Cleared 3968.272367 roads189 bridges
5517.28
7 01‐Aug‐13 Gujarat Phase‐XIII Cleared 992.21 919 2803.00
8 Assam Phase‐XI Cleared 256.07202 roads3 bridges
499.57
9 ChattisgarhPhase‐XIIIRRS‐IIIP‐Batch‐2 Cleared 413.29
132 roads118 bridges
429.06
10 05‐Aug‐13 OrissaPhase‐XII (Batch‐III)RRSP Tranche‐II Cleared 1067.95
343 roads140 bridges
1184.06
11 08‐Aug‐13 Jharkhand Phase‐XII Cleared 30.01 19 56.08
12 19‐Aug‐13 Rajasthan Phase‐XII Cleared 510.18 571 1714.97
13 26‐Sep‐13 Maharashtra Phase‐XII Cleared 353.62105 roads29 bridges
638.02
Andhra Pradesh LSB Cleared 13.50 1 bridge 0.00
Tripura Phase‐X Cleared 1104.84338 roads37 bridges
1422.44
15 18‐Nov‐13Arunachal Pradesh
Phase‐X (batch‐II) Cleared 399.9526 roads29 bridges
407.43
16 26‐Nov‐13 Rajasthan Tranchi‐V Cleared 796.18 864 roads 2617.33
Upto Mar'2014
1 29‐Apr‐13
02‐Aug‐13
Annexure‐VII‐D
14 17‐Oct‐13
Destails of Empowered Committee meetings held during 2013‐14 for PMGSY

Orissa Phase‐XII (Batch‐III) Cleared 1385.65788 roads17 bridges
2741.72
Karnataka PMGSY‐II Cleared 1044.59315 roadas12 bridges
2246.23
Gujarat PMGSY‐II Cleared 677.01 109 roads 1180.31
Andhra Pradesh PMGSY‐II Cleared 1262.95292 rodas19 bridgges
2285.95
Haryana PMGSY‐II Cleared 917.4583 roads18 bridgas
989.32
19‐Dec‐13 Madhya Pradesh Phase‐XIII (Batch‐I) Cleared 1185.85691 roads112 bridges
1952.57
19‐Dec‐13 Meghalaya Tranchi‐II Cleared 485.02197 roads32 bridges
740.58
20 27‐Dec‐13 Maharashtra PMGSY‐II Cleared 353.50 98 roads 636.71
21 09‐Jan‐14 Uttarakhand Phase‐XII Cleared 771.07 166 roads 1621.93
22 13‐Jan‐14 Uttar Pradesh PMGSY‐II Cleared 1134.54 252 roads 1913.33
23 15‐Jan‐14 Bihar‐RWD Phase‐IX Cleared 4194.672797 roads67 bridges
5926.67
24 29‐Jan‐14 Kerala Phase‐VIII (Part‐II) Cleared 153.46 51 roads 161.51
25 31‐Jan‐14 Chattisgarh RRS‐IIIP‐Batch‐3 Cleared 448.17 320 roads 1055.88
07‐Feb‐14 Assam Phase‐XII Cleared 326.10202 roads55 bridges
500.94
07‐Feb‐14 Jharkhand Phase‐XII Batch‐II Cleared 1323.13710 roads91 bridges
2522.70
27 18‐Feb‐14Arunachal Pradesh
Phase‐X (batch‐III) Cleared 932.6418 roads20 bridges
219.58
18‐Feb‐14 Uttar Pradesh PMGSY‐IIRecommended by EC
666.11 134 roads 1108.28Compliance yet to be received
28 21‐Feb‐14 Kerala Phase‐VIII (Part‐III) Cleared 83.11 44 roads 104.26
29 9‐Jan_2014 Maharashtra PMGSY‐II Cleared 860.48211 roads55 bidges
1451.44
30 05‐Mar‐14 Maharashtra PMGSY‐II Cleared 359.1076 roads53 bridges
1913.33
26
05‐Dec‐13
16‐Dec‐13
17
18
19

Annexure‐VIII
# StatePresent Arrangement(NIC / Other Agency)
1 Andhra Pradesh Other Agency
2 Arunachal Pradesh NIC
3 Assam NIC
4 Bihar NIC
5 Chattisgarh Other Agency
6 Goa *
7 Gujrat Other Agency
8 Haryana Other Agency
9 Himachal Pradesh NIC
10 Jammu & Kashmir NIC
11 Jharkhand NIC
12 Karnataka Other Agency
13 Kerala NIC
14 Madhya Pradesh Other Agency
15 Maharashtra NIC
16 Manipur NIC
17 Meghalaya NIC
18 Mizoram NIC
19 Nagaland NIC
20 Odisha NIC
21 Punjab NIC
22 Rajasthan NIC
23 Sikkim NIC
24 Tamil Nadu NIC
25 Tripura NIC.
26 Uttar Pradesh NIC
27 Uttrakhand NIC
28 West Bengal NIC
E-procurement Status under PMGSY

Annexure IX
PIUs SQMs Expenditure
1 2 3 4 5 6 7 8 9 10
1 Andhra Pradesh 44 70 2625 10290 1893 1893 1394 2350
2 Arunachal Pradesh 24 46 1800 14490 1395 1395 1395 1757
3 Assam 56 40 2800 5040 4761 2800 2222 1964
4 Bihar 108 85 6100 10710 7503 6100 4310 11812
5 Chhattisgarh 50 46 3175 5244 1215 1215 875 2598
6 Goa - - - - - - -
7 Gujarat 26 13 1300 1755 975 975 787 1342
8 Haryana 31 17 1550 1989 432 432 250 841
9 Himachal Pradesh 55 16 4125 2016 570 570 306 882
10 Jammu & Kashmir 30 15 1500 4500 1845 1500 610 2720
11 Jharkhand 48 23 3375 2415 2148 2148 1268 3689
12 Karnataka 29 26 1450 2964 2535 1450 1362 835
13 Kerala 14 14 700 1722 585 585 291 767
14 Madhya Pradesh 90 52 5125 6084 5625 5125 3827 5108
15 Maharashtra 33 36 1650 5940 4041 1650 1381 2297
16 Manipur 25 15 1875 2550 606 606 523 838
17 Meghalaya 26 17 1950 4386 144 144 87 818
18 Mizoram 16 7 1200 1554 309 309 214 356
19 Nagaland 16 9 1200 999 363 363 246 190
20 Odisha 50 35 3125 5040 7683 3125 2438 6070
21 Punjab 58 6 2900 1800 786 786 670 631
22 Rajasthan 125 33 6250 2970 2739 2739 2365 2739
23 Sikkim 8 12 600 1872 288 288 209 406
24 Tamil Nadu 39 15 1950 1890 1218 1218 775 791
25 Tripura 16 32 1200 6624 951 951 682 1273
26 Uttar Pradesh 107 79 5500 11139 3471 3471 2406 4208
27 Uttarakhand 27 25 2025 3825 927 927 850 1621
28 West Bengal 28 33 1550 5643 2115 1550 1096 5165
1179 817 68600 125451 57123 44315 32839 64068
Balance works in Hand i/c
Savings
Total:
Status of Execution Capacity of the State under PMGSY as on March 2014(Figures in Rs. Crore)
# State(s) No. of PIUs
No. of SQMs
Capacity based onLowest of
three parameters
Capacity as per Index
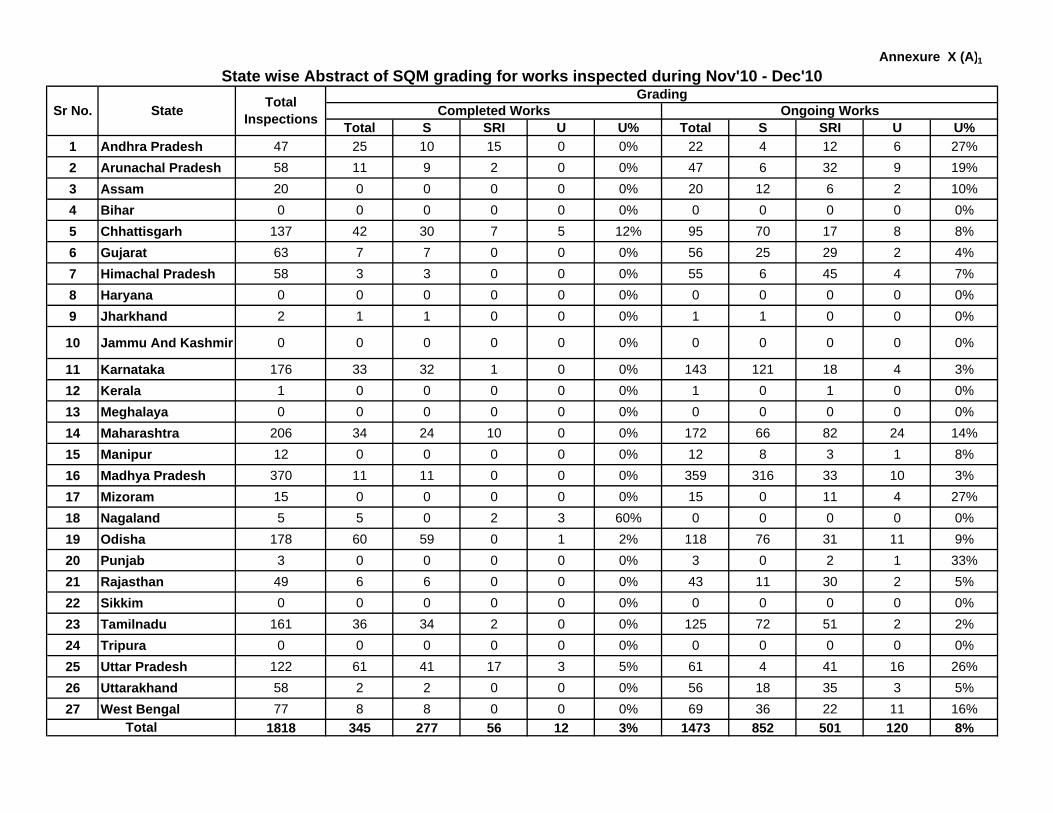
Total S SRI U U% Total S SRI U U%1 Andhra Pradesh 47 25 10 15 0 0% 22 4 12 6 27%2 Arunachal Pradesh 58 11 9 2 0 0% 47 6 32 9 19%3 Assam 20 0 0 0 0 0% 20 12 6 2 10%4 Bihar 0 0 0 0 0 0% 0 0 0 0 0%5 Chhattisgarh 137 42 30 7 5 12% 95 70 17 8 8%6 Gujarat 63 7 7 0 0 0% 56 25 29 2 4%7 Himachal Pradesh 58 3 3 0 0 0% 55 6 45 4 7%8 Haryana 0 0 0 0 0 0% 0 0 0 0 0%9 Jharkhand 2 1 1 0 0 0% 1 1 0 0 0%
10 Jammu And Kashmir 0 0 0 0 0 0% 0 0 0 0 0%
11 Karnataka 176 33 32 1 0 0% 143 121 18 4 3%12 Kerala 1 0 0 0 0 0% 1 0 1 0 0%13 Meghalaya 0 0 0 0 0 0% 0 0 0 0 0%14 Maharashtra 206 34 24 10 0 0% 172 66 82 24 14%15 Manipur 12 0 0 0 0 0% 12 8 3 1 8%16 Madhya Pradesh 370 11 11 0 0 0% 359 316 33 10 3%17 Mizoram 15 0 0 0 0 0% 15 0 11 4 27%18 Nagaland 5 5 0 2 3 60% 0 0 0 0 0%19 Odisha 178 60 59 0 1 2% 118 76 31 11 9%20 Punjab 3 0 0 0 0 0% 3 0 2 1 33%21 Rajasthan 49 6 6 0 0 0% 43 11 30 2 5%22 Sikkim 0 0 0 0 0 0% 0 0 0 0 0%23 Tamilnadu 161 36 34 2 0 0% 125 72 51 2 2%24 Tripura 0 0 0 0 0 0% 0 0 0 0 0%25 Uttar Pradesh 122 61 41 17 3 5% 61 4 41 16 26%26 Uttarakhand 58 2 2 0 0 0% 56 18 35 3 5%27 West Bengal 77 8 8 0 0 0% 69 36 22 11 16%
1818 345 277 56 12 3% 1473 852 501 120 8%Total
Annexure X (A)1State wise Abstract of SQM grading for works inspected during Nov'10 - Dec'10
Sr No. State Total Inspections
GradingCompleted Works Ongoing Works

Total S SRI U U% Total S SRI U U%1 Andhra Pradesh 373 216 159 56 1 0% 157 28 111 18 11%
2 Arunachal Pradesh 197 42 23 16 3 7% 155 62 71 22 14%
3 Assam 1056 42 42 0 0 0% 1014 855 143 16 2%
4 Bihar 781 8 7 1 0 0% 773 155 500 118 15%
5 Chhattisgarh 814 133 120 8 5 4% 681 517 100 64 9%
6 Gujarat 91 50 50 0 0 0% 41 28 12 1 2%
7 Himachal Pradesh 376 19 18 1 0 0% 357 107 213 37 10%
8 Haryana 61 5 5 0 0 0% 56 47 8 1 2%
9 Jharkhand 1255 139 127 10 2 1% 1116 933 168 15 1%
10 Jammu And Kashmir 497 40 34 4 2 5% 457 219 234 4 1%
11 Karnataka 596 303 295 7 1 0% 293 250 31 12 4%
12 Kerala 5 0 0 0 0 0% 5 2 1 2 40%
13 Meghalaya 8 0 0 0 0 0% 8 6 2 0 0%
14 Maharashtra 875 254 237 14 3 1% 621 305 273 43 7%
15 Manipur 131 15 15 0 0 0% 116 84 29 3 3%
16 Madhya Pradesh 2260 243 241 1 1 0% 2017 1898 101 18 1%
17 Mizoram 63 2 1 0 1 50% 61 0 41 20 33%
18 Nagaland 27 17 6 5 6 35% 10 2 7 1 10%
19 Odisha 2156 852 794 47 11 1% 1304 843 285 176 14%
20 Punjab 21 1 1 0 0 0% 20 8 12 0 0%
21 Rajasthan 185 55 53 1 1 2% 130 60 56 14 11%
22 Sikkim 95 23 15 8 0 0% 72 10 33 29 40%
23 Tamilnadu 422 211 200 6 5 2% 211 176 32 3 1%
24 Tripura 364 147 66 41 40 27% 217 45 67 105 48%
25 Uttar Pradesh 272 201 122 68 11 5% 71 9 43 19 27%
26 Uttarakhand 262 19 19 0 0 0% 243 79 147 17 7%
27 West Bengal 482 140 136 2 2 1% 342 223 94 25 7%
13725 3177 2786 296 95 2% 10548 6951 2814 783 7%Total
Annexure X (A)2
State wise Abstract of SQM grading for works inspected during Jan'11 - Dec'11
S.No. State Total Inspections
GradingCompleted Works Ongoing Works

Total S SRI U U% Total S SRI U U%1 Andhra Pradesh 508 327 262 59 6 2% 181 61 106 14 8%
2 Arunachal Pradesh 185 27 15 9 3 11% 158 61 82 15 9%
3 Assam 1381 337 219 45 73 22% 1044 398 358 288 28%
4 Bihar 1104 81 51 23 7 9% 1023 218 655 150 15%
5 Chhattisgarh 399 45 39 4 2 4% 354 286 39 29 8%
6 Gujarat 601 554 487 64 3 1% 47 45 2 0 0%
7 Himachal Pradesh 249 38 36 2 0 0% 211 87 107 17 8%
8 Haryana 41 14 14 0 0 0% 27 27 0 0 0%
9 Jharkhand 935 173 162 4 7 4% 762 651 98 13 2%
10 Jammu And Kashmir 562 53 40 11 2 4% 509 297 207 5 1%
11 Karnataka 182 115 113 2 0 0% 67 58 7 2 3%
12 Kerala 18 2 2 0 0 0% 16 5 7 4 25%
13 Meghalaya 33 4 2 2 0 0% 29 5 20 4 14%
14 Maharashtra 397 112 111 0 1 1% 285 191 74 20 7%
15 Manipur 242 108 108 0 0 0% 134 124 9 1 1%
16 Madhya Pradesh 1585 132 125 5 2 2% 1453 1382 56 15 1%
17 Mizoram 0 0 0 0 0 0% 0 0 0 0 0%
18 Nagaland 20 7 1 5 1 14% 13 0 8 5 38%
19 Odisha 1594 665 592 59 14 2% 929 639 204 86 9%
20 Punjab 86 2 2 0 0 0% 84 49 35 0 0%
21 Rajasthan 793 13 6 7 0 0% 780 643 128 9 1%
22 Sikkim 0 0 0 0 0 0% 0 0 0 0 0%
23 Tamilnadu 66 44 44 0 0 0% 22 21 1 0 0%
24 Tripura 201 83 64 13 6 7% 118 36 49 33 28%
25 Uttar Pradesh 234 64 47 16 1 2% 170 85 66 19 11%
26 Uttarakhand 114 28 25 3 0 0% 86 28 51 7 8%
27 West Bengal 543 130 127 2 1 1% 413 255 122 36 9%
12073 3158 2694 335 129 4% 8915 5652 2491 772 8%Total
State wise Abstract of SQM grading for works inspected during Jan'12- Dec.'12Annexure X (A)3
Grading
Completed Works Ongoing WorksTotal InspectionsState Sr.No.
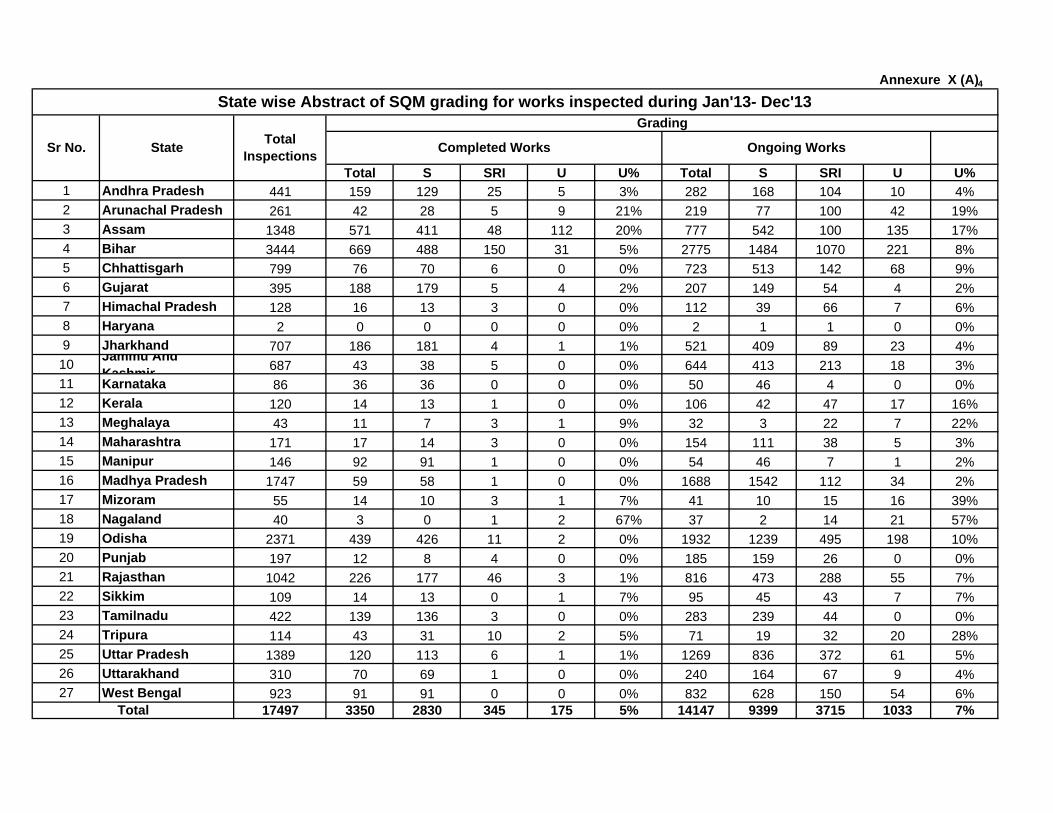
Total S SRI U U% Total S SRI U U%1 Andhra Pradesh 441 159 129 25 5 3% 282 168 104 10 4%2 Arunachal Pradesh 261 42 28 5 9 21% 219 77 100 42 19%3 Assam 1348 571 411 48 112 20% 777 542 100 135 17%4 Bihar 3444 669 488 150 31 5% 2775 1484 1070 221 8%5 Chhattisgarh 799 76 70 6 0 0% 723 513 142 68 9%6 Gujarat 395 188 179 5 4 2% 207 149 54 4 2%7 Himachal Pradesh 128 16 13 3 0 0% 112 39 66 7 6%8 Haryana 2 0 0 0 0 0% 2 1 1 0 0%9 Jharkhand 707 186 181 4 1 1% 521 409 89 23 4%10 Jammu And
Kashmir 687 43 38 5 0 0% 644 413 213 18 3%11 Karnataka 86 36 36 0 0 0% 50 46 4 0 0%12 Kerala 120 14 13 1 0 0% 106 42 47 17 16%13 Meghalaya 43 11 7 3 1 9% 32 3 22 7 22%14 Maharashtra 171 17 14 3 0 0% 154 111 38 5 3%15 Manipur 146 92 91 1 0 0% 54 46 7 1 2%16 Madhya Pradesh 1747 59 58 1 0 0% 1688 1542 112 34 2%17 Mizoram 55 14 10 3 1 7% 41 10 15 16 39%18 Nagaland 40 3 0 1 2 67% 37 2 14 21 57%19 Odisha 2371 439 426 11 2 0% 1932 1239 495 198 10%20 Punjab 197 12 8 4 0 0% 185 159 26 0 0%21 Rajasthan 1042 226 177 46 3 1% 816 473 288 55 7%22 Sikkim 109 14 13 0 1 7% 95 45 43 7 7%23 Tamilnadu 422 139 136 3 0 0% 283 239 44 0 0%24 Tripura 114 43 31 10 2 5% 71 19 32 20 28%25 Uttar Pradesh 1389 120 113 6 1 1% 1269 836 372 61 5%26 Uttarakhand 310 70 69 1 0 0% 240 164 67 9 4%27 West Bengal 923 91 91 0 0 0% 832 628 150 54 6%
17497 3350 2830 345 175 5% 14147 9399 3715 1033 7%
Annexure X (A)4State wise Abstract of SQM grading for works inspected during Jan'13- Dec'13
Total
Completed Works Ongoing Works
GradingTotal
InspectionsState Sr No.

Total S SRI U U% Total S SRI U U%1 Andhra Pradesh 245 32 32 0 0 0% 213 184 26 3 1%2 Arunachal Pradesh 27 0 0 0 0 0% 27 0 22 5 19%3 Assam 147 28 23 0 5 18% 119 72 35 12 10%4 Bihar 1470 460 305 125 30 7% 1010 589 323 98 10%5 Chhattisgarh 512 7 3 0 4 57% 505 417 68 20 4%6 Gujarat 301 56 56 0 0 0% 245 216 21 8 3%7 Himachal Pradesh 91 3 3 0 0 0% 88 21 52 15 17%8 Haryana 0 0 0 0 0 0% 0 0 0 0 0%9 Jharkhand 354 29 19 7 3 10% 325 165 143 17 5%10 Jammu And
Kashmir 16 2 1 0 1 50% 14 11 3 0 0%11 Karnataka 13 4 4 0 0 0% 9 6 3 0 0%12 Kerala 37 1 1 0 0 0% 36 24 9 3 8%13 Meghalaya 30 12 5 1 6 50% 18 1 12 5 28%14 Maharashtra 48 2 2 0 0 0% 46 41 4 1 2%15 Manipur 46 20 20 0 0 0% 26 26 0 0 0%16 Madhya Pradesh 913 47 45 2 0 0% 866 731 90 45 5%17 Mizoram 5 0 0 0 0 0% 5 0 5 0 0%18 Nagaland 13 5 4 0 1 20% 8 0 3 5 63%19 Odisha 598 116 109 7 0 0% 482 301 106 75 16%20 Punjab 57 0 0 0 0 0% 57 50 3 4 7%21 Rajasthan 147 40 34 5 1 3% 107 82 21 4 4%22 Sikkim 26 8 8 0 0 0% 18 18 0 0 0%23 Tamilnadu 264 43 43 0 0 0% 221 201 18 2 1%24 Tripura 48 5 2 1 2 40% 43 13 19 11 26%25 Uttar Pradesh 982 63 57 6 0 0% 919 740 151 28 3%26 Uttarakhand 85 2 1 1 0 0% 83 41 28 14 17%27 West Bengal 418 69 68 1 0 0% 349 280 54 15 4%
6893 1054 845 156 53 5% 5839 4230 1219 390 6%Total
Annexure X (A)5State wise Abstract of SQM grading for works inspected during Jan'14 - Mar'14
Sr No. State Total Inspections
Grading
Completed Works Ongoing Works

Total S U U% Total S U U% ATRS Reqd.
ATRs Recvd
1 Andhra Pradesh 32 20 12 8 40% 12 10 2 17% 18 172 Arunachal Pradesh 10 3 3 0 0% 7 4 3 43% 9 93 Assam 8 1 0 1 100% 7 5 2 29% 4 04 Bihar 13 1 1 0 0% 12 11 1 8% 7 75 Chathisgarh 20 5 5 0 0% 15 12 3 20% 6 66 Gujarat 36 22 22 0 0% 14 13 1 7% 18 177 Haryana 9 2 2 0 0% 7 7 0 0% 0 08 Himachal Pradesh 11 8 8 0 0% 3 3 0 0% 1 09 Jammu and Kashmir 14 4 3 1 25% 10 10 0 0% 8 810 Jharkand 0 0 0 0 0% 0 0 0 0% 0 011 Karnataka 57 33 32 1 3% 24 24 0 0% 1 112 Kerala 10 5 5 0 0% 5 5 0 0% 0 013 Madhya Pradesh 66 13 13 0 0% 53 50 3 6% 8 814 Maharashtra 36 13 12 1 8% 23 22 1 4% 8 815 Manipur 11 3 2 1 33% 8 7 1 12% 8 716 Meghalaya 0 0 0 0 0% 0 0 0 0% 0 017 Mizoram 0 0 0 0 0% 0 0 0 0% 0 018 Nagaland 0 0 0 0 0% 0 0 0 0% 0 019 Odisha 10 5 4 1 20% 5 3 2 40% 3 120 Punjab 11 2 2 0 0% 9 9 0 0% 5 521 Rajasthan 0 0 0 0 0% 0 0 0 0% 0 022 Sikkim 11 0 0 0 0% 11 11 0 0% 7 723 Tamilnadu 64 39 32 7 18% 25 22 3 12% 40 4024 Tripura 15 6 4 2 33% 9 9 0 0% 9 525 Uttar Pradesh 33 27 25 2 7% 6 6 0 0% 7 626 Uttarakand 11 7 7 0 0% 4 4 0 0% 5 427 West Bengal 20 7 7 0 0% 13 13 0 0% 6 2
508 226 201 25 11% 282 260 22 8% 178 158
Total Inspections
Annexure X(B)1
State wise Abstract of NQM grading for works inspected during Nov,10-Dec,10
*S=S+SRI
Grading ATRs Position Ongoing WorksCompleted Works
Total
Sr No. State

1 Andhra Pradesh 159 111 96 15 14% 48 37 11 23% 57 56
2 Arunachal Pradesh 54 16 16 0 0% 38 32 6 16% 22 22
3 Assam 195 24 16 8 33% 171 123 48 28% 84 43
4 Bihar 387 32 19 13 41% 355 267 88 25% 175 109
5 Chattisgarh 153 43 38 5 12% 110 86 24 22% 49 49
6 Gujarat 72 55 45 10 18% 17 11 6 35% 43 43
7 Haryana 6 3 3 0 0% 3 3 0 0% 0 0
8 Himachal Pradesh 101 33 31 2 6% 68 60 8 12% 38 31
9 Jammu & Kashmir 84 11 7 4 36% 65 8 11% 37 36
10 Jharkhand 102 13 7 6 46% 89 59 30 34% 60 44
11 Karnataka 98 41 40 1 2% 57 51 6 11% 1 1
12 Kerala 41 4 3 1 25% 37 19 18 49% 16 15
13 Madhya Pradesh 291 48 44 4 8% 243 221 22 9% 31 31
14 Maharashtra 219 56 47 9 16% 163 127 36 22% 27 27
15 Manipur 12 0 0 0 0% 12 7 5 42% 8 8
16 Meghalaya 5 1 1 0 0% 4 2 2 50% 4 4
17 Mizoram 0 0 0 0 0% 0 0 0 0% 0 0
18 Nagaland 3 2 0 2 100% 1 1 0 0% 3 3
19 Orissa 234 51 44 7 14% 183 157 26 14% 99 84
20 Punjab 29 16 16 0 0% 13 13 0 0% 0 0
21 Rajasthan 59 50 37 13 26% 9 7 2 22% 27 25
22 Sikkim 19 2 1 1 50% 17 14 3 18% 19 18
23 Tamil Nadu 143 94 74 20 21% 49 24 25 51% 92 92
24 Tripua 27 9 6 3 33% 18 12 6 33% 19 9
25 Uttar Pradesh 159 96 90 6 6% 63 53 10 16% 51 47
26 Uttarakhand 60 5 5 0 0% 55 45 10 18% 22 21
27 West Bengal 195 34 28 6 18% 161 126 35 22% 55 462907 850 714 136 16% 2057 1622 435 21% 1039 864
ATR Recd.S* UOngoing Works
Total U% ATR Reqd.Total
TOTAL
Annexure X(B)2
State wise Abstract of NQM grading for works inspected during Jan'11- Dec'11
S. No. State Total Inspections
Grading ATRs Position
Completed Works
S* - S+SRI
S* U U%
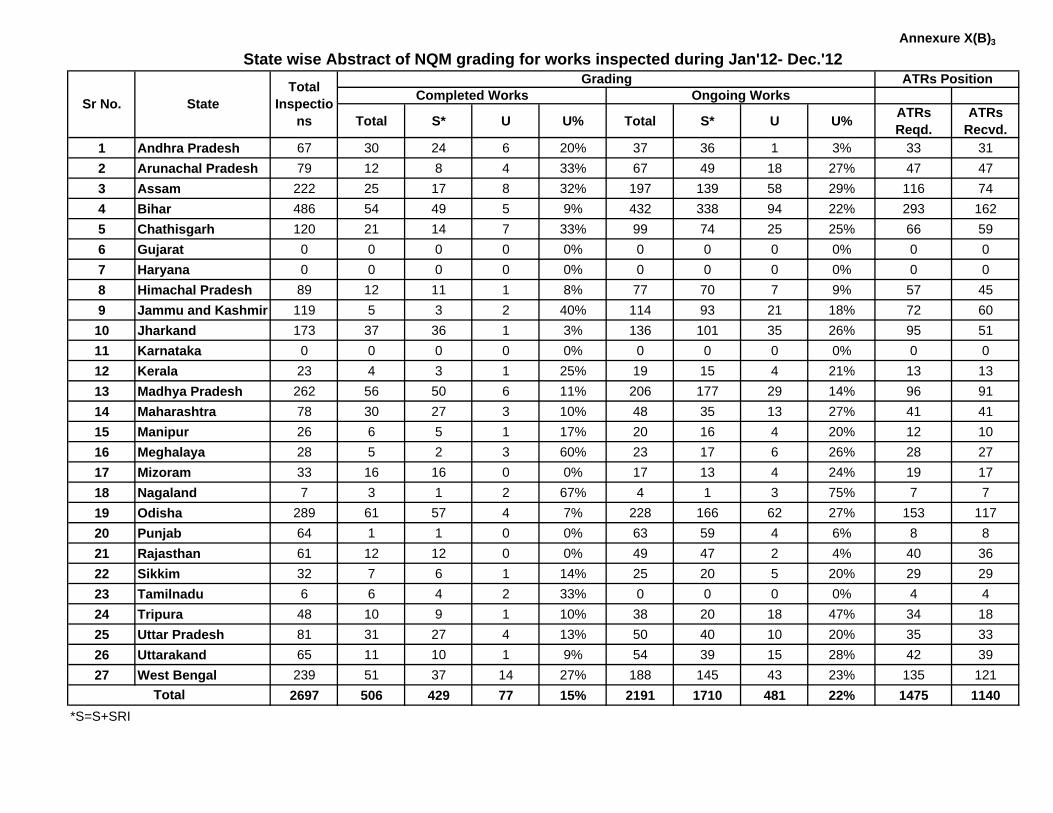
Total S* U U% Total S* U U% ATRs Reqd.
ATRs Recvd.
1 Andhra Pradesh 67 30 24 6 20% 37 36 1 3% 33 312 Arunachal Pradesh 79 12 8 4 33% 67 49 18 27% 47 473 Assam 222 25 17 8 32% 197 139 58 29% 116 744 Bihar 486 54 49 5 9% 432 338 94 22% 293 1625 Chathisgarh 120 21 14 7 33% 99 74 25 25% 66 596 Gujarat 0 0 0 0 0% 0 0 0 0% 0 07 Haryana 0 0 0 0 0% 0 0 0 0% 0 08 Himachal Pradesh 89 12 11 1 8% 77 70 7 9% 57 459 Jammu and Kashmir 119 5 3 2 40% 114 93 21 18% 72 6010 Jharkand 173 37 36 1 3% 136 101 35 26% 95 5111 Karnataka 0 0 0 0 0% 0 0 0 0% 0 012 Kerala 23 4 3 1 25% 19 15 4 21% 13 1313 Madhya Pradesh 262 56 50 6 11% 206 177 29 14% 96 9114 Maharashtra 78 30 27 3 10% 48 35 13 27% 41 4115 Manipur 26 6 5 1 17% 20 16 4 20% 12 1016 Meghalaya 28 5 2 3 60% 23 17 6 26% 28 2717 Mizoram 33 16 16 0 0% 17 13 4 24% 19 1718 Nagaland 7 3 1 2 67% 4 1 3 75% 7 719 Odisha 289 61 57 4 7% 228 166 62 27% 153 11720 Punjab 64 1 1 0 0% 63 59 4 6% 8 821 Rajasthan 61 12 12 0 0% 49 47 2 4% 40 3622 Sikkim 32 7 6 1 14% 25 20 5 20% 29 2923 Tamilnadu 6 6 4 2 33% 0 0 0 0% 4 424 Tripura 48 10 9 1 10% 38 20 18 47% 34 1825 Uttar Pradesh 81 31 27 4 13% 50 40 10 20% 35 3326 Uttarakand 65 11 10 1 9% 54 39 15 28% 42 3927 West Bengal 239 51 37 14 27% 188 145 43 23% 135 121
2697 506 429 77 15% 2191 1710 481 22% 1475 1140
Ongoing Works
Total*S=S+SRI
Annexure X(B)3
State wise Abstract of NQM grading for works inspected during Jan'12- Dec.'12
Sr No. StateTotal
Inspections
Grading ATRs PositionCompleted Works

Total Inspections Total S* U U% Total S* U U% ATRs
Reqd.ATRs
Recvd.1 Andhra Pradesh 24 5 4 1 20% 19 15 4 21% 20 132 Arunachal Pradesh 57 3 3 0 0% 54 37 17 31% 39 153 Assam 232 26 23 3 12% 206 159 47 23% 107 124 Bihar 257 31 18 13 42% 226 146 80 35% 153 1065 Chathisgarh 127 12 9 3 25% 115 87 28 24% 76 456 Gujarat 61 15 15 0 0% 46 41 5 11% 17 147 Haryana 0 0 0 0 0% 0 0 0 0% 0 08 Himachal Pradesh 70 12 12 0 0% 58 48 10 17% 37 169 Jammu and Kashmir 91 8 8 0 0% 83 76 7 8% 46 1610 Jharkand 148 17 14 3 18% 131 94 37 28% 95 3011 Karnataka 22 3 3 0 0% 19 17 2 11% 13 1312 Kerala 15 4 4 0 0% 11 11 0 0% 4 413 Madhya Pradesh 297 14 14 0 0% 283 265 18 6% 86 7214 Maharashtra 43 4 4 0 0% 39 34 5 13% 17 1515 Manipur 0 0 0 0 0% 0 0 0 0% 0 016 Meghalaya 22 4 3 1 25% 18 10 8 44% 19 017 Mizoram 17 5 4 1 20% 12 1 11 92% 16 018 Nagaland 21 3 3 0 0% 18 9 9 50% 21 2019 Odisha 232 33 30 3 9% 199 163 36 18% 104 5720 Punjab 223 28 28 0 0% 195 188 7 4% 30 2921 Rajasthan 301 118 96 22 19% 183 155 28 15% 133 10322 Sikkim 33 3 3 0 0% 30 20 10 33% 30 2823 Tamilnadu 89 14 14 0 0% 75 72 3 4% 29 1624 Tripura 33 3 1 2 67% 30 11 19 63% 24 125 Uttar Pradesh 188 23 18 5 22% 165 136 29 18% 87 6626 Uttarakand 16 4 4 0 0% 12 9 3 25% 12 1127 West Bengal 192 18 15 3 17% 174 142 32 18% 105 72
2811 410 350 60 15% 2401 1946 455 19% 1320 774
S* - S+SRI
Total
Annexure X(B)4
State wise Abstract of NQM grading for works inspected during Jan'13- Dec '13ATRs PositionCompleted Works Ongoing Works
Grading
State S.No

Total Inspections Total S* U U% Total S* U U% ATRs
Reqd.ATRs
Recvd.1 Andhra Pradesh 11 0 0 0 0% 11 6 5 45% 11 02 Arunachal Pradesh 0 0 0 0 0% 0 0 0 0% 0 03 Assam 55 10 9 1 10% 45 38 7 16% 19 04 Bihar 66 1 1 0 0% 65 53 12 18% 37 55 Chathisgarh 70 2 1 1 50% 68 55 13 19% 19 06 Gujarat 17 4 2 2 50% 13 11 2 15% 10 07 Haryana 0 0 0 0 0% 0 0 0 0% 0 08 Himachal Pradesh 25 4 3 1 25% 21 16 5 24% 15 09 Jammu and Kashmir 0 0 0 0 0% 0 0 0 0% 0 010 Jharkand 41 1 0 1 100% 40 30 10 25% 30 011 Karnataka 0 0 0 0 0% 0 0 0 0% 0 012 Kerala 29 3 3 0 0% 26 23 3 12% 10 013 Madhya Pradesh 110 11 11 0 0% 99 89 10 10% 29 014 Maharashtra 18 1 1 0 0% 17 14 3 18% 7 015 Manipur 0 0 0 0 0% 0 0 0 0% 0 016 Meghalaya 5 1 1 0 0% 4 2 2 50% 5 017 Mizoram 15 11 11 0 0% 4 3 1 25% 14 018 Nagaland 0 0 0 0 0% 0 0 0 0% 0 019 Odisha 98 5 3 2 40% 93 85 8 9% 40 020 Punjab 76 6 6 0 0% 70 69 1 1% 16 021 Rajasthan 66 13 12 1 8% 53 43 10 19% 28 022 Sikkim 11 0 0 0 0% 11 10 1 9% 4 023 Tamilnadu 95 27 22 5 19% 68 64 4 6% 41 924 Tripura 11 0 0 0 0% 11 8 3 27% 5 025 Uttar Pradesh 68 7 7 0 0% 61 48 13 21% 29 326 Uttarakand 0 0 0 0 0% 0 0 0 0% 0 027 West Bengal 69 3 3 0 0% 66 58 8 12% 24 5
956 110 96 14 13% 846 725 121 14% 393 22Total
S* - S+SRI
Annexure X(B)5
State wise Abstract of NQM grading for works inspected during Jan'14- Mar '14
S.No State
Grading ATRs PositionCompleted Works Ongoing Works

Total No Of Work
Total No Of Work
Inspected
Total No Of Work
Inspected Once
Total No Of Work
Inspected Twice.
Total No Of Work
Inspected More Than
Twice
Total No Of Work
Total No Of Work
Inspected
Total No Of Work
Inspected Once
Total No Of Work
Inspected Twice.
Total No Of Work
Inspected More Than
Twice1 Andhra Pradesh 6512 559 413 120 26 773 554 352 144 582 Arunachal Pradesh 715 78 57 13 8 256 215 98 38 793 Assam 3797 737 557 133 47 1851 1737 975 488 2744 Bihar 6729 1089 967 114 8 7842 4373 2581 1268 5245 Chhattisgarh 4754 239 227 6 6 1652 1581 1076 363 1426 Goa 70 0 0 0 0 14 0 0 0 07 Gujarat 3578 652 553 50 49 931 394 286 81 278 Haryana 426 16 13 3 0 0 36 10 17 99 Himachal Pradesh 1727 74 72 2 0 641 498 295 150 5310 Jammu And Kashmir 907 119 102 13 4 1040 920 438 313 16911 Jharkhand 2055 480 415 48 17 2373 1743 985 547 21112 Karnataka 3449 419 386 33 0 90 274 177 72 2513 Kerala 790 18 18 0 0 639 121 84 28 914 Madhya Pradesh 11959 413 363 40 10 4327 3558 2130 894 53415 Maharashtra 5203 338 297 37 4 1028 706 454 172 8016 Manipur 1029 113 60 15 38 468 150 79 29 4217 Meghalaya 377 21 14 7 0 344 47 26 11 1018 Mizoram 172 28 27 1 0 16 66 38 18 1019 Nagaland 255 29 26 3 0 50 49 37 7 520 Odisha 7286 2009 1950 52 7 3158 3122 2027 797 29821 Punjab 803 15 15 0 0 199 219 128 56 3522 Rajasthan 12436 290 251 33 6 2143 1229 750 369 11023 Sikkim 500 42 39 3 0 277 144 115 24 524 Tamilnadu 5483 418 399 18 1 1194 611 507 82 2225 Tripura 949 266 253 13 0 452 309 195 91 2326 Uttar Pradesh 15817 435 426 6 3 2983 1715 1123 476 11627 Uttarakhand 545 114 108 6 0 627 331 134 116 8128 West Bengal 2803 405 383 20 2 2101 1320 898 293 129
101126 9416 8391 789 236 37469 26022 15998 6944 3080Total
Annexure X ( C )
Completed On GoingAbstract of SQM Inspection Detail (January,2011- March,2014)
Sr.No. State
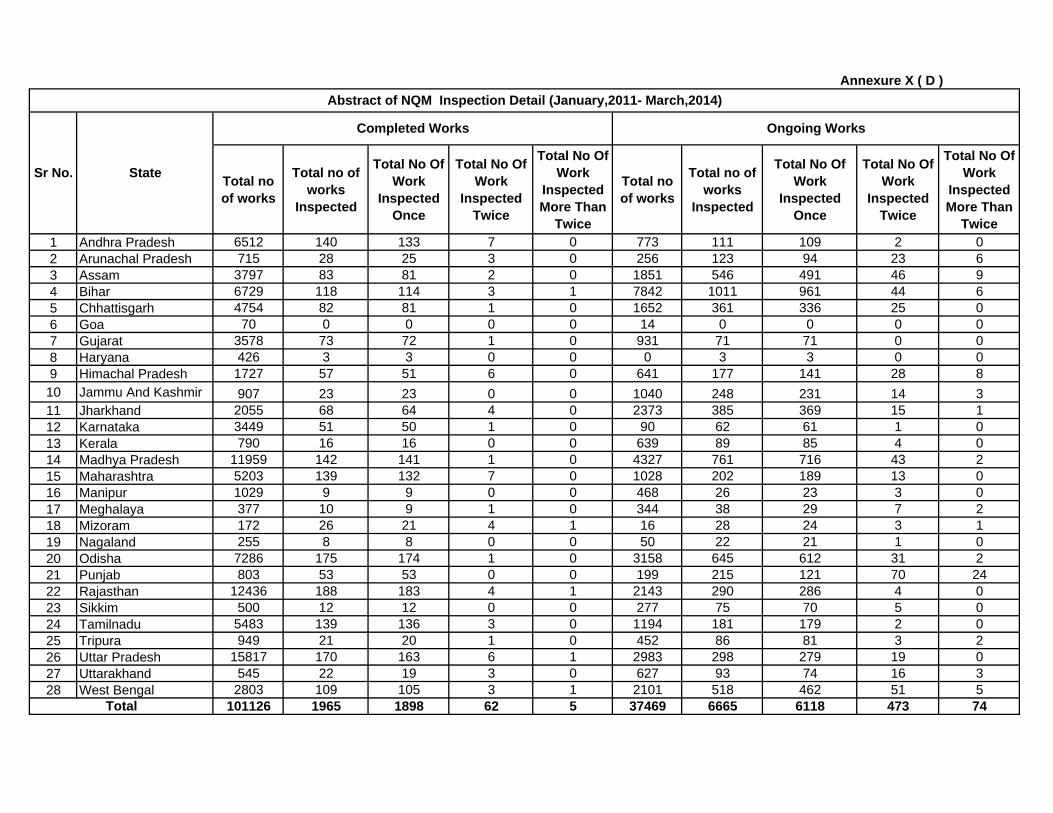
Total no of works
Total no of works
Inspected
Total No Of Work
Inspected Once
Total No Of Work
Inspected Twice
Total No Of Work
Inspected More Than
Twice
Total no of works
Total no of works
Inspected
Total No Of Work
Inspected Once
Total No Of Work
Inspected Twice
Total No Of Work
Inspected More Than
Twice1 Andhra Pradesh 6512 140 133 7 0 773 111 109 2 02 Arunachal Pradesh 715 28 25 3 0 256 123 94 23 63 Assam 3797 83 81 2 0 1851 546 491 46 94 Bihar 6729 118 114 3 1 7842 1011 961 44 65 Chhattisgarh 4754 82 81 1 0 1652 361 336 25 06 Goa 70 0 0 0 0 14 0 0 0 07 Gujarat 3578 73 72 1 0 931 71 71 0 08 Haryana 426 3 3 0 0 0 3 3 0 09 Himachal Pradesh 1727 57 51 6 0 641 177 141 28 810 Jammu And Kashmir 907 23 23 0 0 1040 248 231 14 311 Jharkhand 2055 68 64 4 0 2373 385 369 15 112 Karnataka 3449 51 50 1 0 90 62 61 1 013 Kerala 790 16 16 0 0 639 89 85 4 014 Madhya Pradesh 11959 142 141 1 0 4327 761 716 43 215 Maharashtra 5203 139 132 7 0 1028 202 189 13 016 Manipur 1029 9 9 0 0 468 26 23 3 017 Meghalaya 377 10 9 1 0 344 38 29 7 218 Mizoram 172 26 21 4 1 16 28 24 3 119 Nagaland 255 8 8 0 0 50 22 21 1 020 Odisha 7286 175 174 1 0 3158 645 612 31 221 Punjab 803 53 53 0 0 199 215 121 70 2422 Rajasthan 12436 188 183 4 1 2143 290 286 4 023 Sikkim 500 12 12 0 0 277 75 70 5 024 Tamilnadu 5483 139 136 3 0 1194 181 179 2 025 Tripura 949 21 20 1 0 452 86 81 3 226 Uttar Pradesh 15817 170 163 6 1 2983 298 279 19 027 Uttarakhand 545 22 19 3 0 627 93 74 16 328 West Bengal 2803 109 105 3 1 2101 518 462 51 5
101126 1965 1898 62 5 37469 6665 6118 473 74Total
Annexure X ( D )Abstract of NQM Inspection Detail (January,2011- March,2014)
Completed Works Ongoing Works
StateSr No.

Annexure XI-A
S.No State(i) National Institute of Technology Warrangal-506004
(ii) J.N.T. University, Kukatpalli Hyderabad-500072
(iii) University College ofEngineering, Osmania University Hyderabad-500007
(iv) Andhra University college ofEngineering
Visakhapatnam-530 003
(v) University College ofEngineering, JNTU
Kakinada- 533003
(i) North-Eastern Regional Inst. of Science & Technology Nirjuli-791109(ii) Jorhat Engineering College
Jorhat-785007(i) Indian Institute of Technology Guwahati- 781039
(ii) Assam Engineering College, Jalukbari
Guwahati-781013
(iii) Jorhat Engineering College Jorhat-785007
(iv) National Institute of Technology Silchar-788010
(i) National Institute of Technology Patna -800005
(ii) Muzaffarpur Institute of Technology
Muzaffarpur-842003
(iii) Bhagalpur College of Engineering
Bhagalpur-813210
(i) National Institute of Technology, GE Road
Raipur-492010
(ii) Bhilai Institute of Technology Durg
6 Goa Goa College of Engineering Farmagudi, Ponda-403401
5 Chattisgarh
List of State Technical Agencies (STAs)
Andhra Pradesh
Assam
Bihar
STAs
1
2 Arunachal Pradesh
3
4

7 Gujarat S.V. National Institute of Technology Ichchhanath, Surat-395007
(i) National Institute of Technology Kurukshetra-136119
(ii) Punjab Engineering College, Sector-12, Chandigarh-160012
9 Himachal Pradesh National Institute of Technology Hamirpur-177005
(i) NIT Srinagar-190006 Srinagar, J&K
(ii) Govt. College of Engineering & Technology, Jammu
Jammu-181122
(i) Birla Institute of Technology Mesra-835215 (Ranchi)
(ii) National Institute of Technology, Jamshedpur
P.O. -R.I.T. Jamshedpur Pin Code- 831014
(iii) B.I.T, Sindri Dhanbad-828123
(i) Bangalore University Jnanabharathi, Bangalore-560056
(ii) National Institute of Technology, Surathkal
P.O. Srinivasnagar, Mangalore-575025
(iii) P.D.A. College of Engineering Gulbarga-585102
(iv) IR Rasta, Road Institute Bangalore-560058, Karnataka
(v) P.E.S. College of Engineering, Mandya-571401
(vi) Government SKSJ Technological Institute
K.R. Circle, Bangalore- 560001
(i) College of Engineering Trivandrum-695016
(ii) National Institute of Technology,
Calicut- 673601
(i) Maulana Azad National Institute of Technology
Bhopal-462051
(ii) Jabalpur Engineering College Jabalpur-482011
(iii) Shri G.S. Institute of Technology & Science
Indore- 452003
Madhya Pradesh
10 Jammu & Kashmir
8 Haryana
14
11 Jharkhand
12 Karnataka
13 Kerala

(i) Visvesvaraya National Institute of Technology.
South Ambazariwad, Nagpur-440011
(ii) Indian Institute of Technology Powai, Mumbai
(iii) Govt College of Engineering, Aurangabad
Aurangabad-431005
(iv) Govt. College of Engineering, Shivajinagar.
Pune-05
(i) National Institute of Technology
Silchar-788010
(ii) Manipur Institute of Technology
Takyelpat, Imphal
(i) Indian Institute of Technology Guwahati
(ii) Jorhat Engineering College Jorhat- 785007
18 Mizoram Indian Institute of Technology Kharagpur-721303
19 Nagaland Jorhat Engineering College Jorhat-785007
(i) National Institute of Technology Rourkela-769008
(ii) College of Engg. & Technology Bhubaneshwar
(iii) Veer Surendra Sai University of Technology
Burla-768018
(iv) Indira Gandhi Institute of Technology, Sarang
Sarang-759146 Dist- Dhenkanal (Orissa)
(v) Indian Institute of Technology Bhubaneswar
(i) PEC University of Technology Chandigarh-160012
(ii) Punjab Technical University, Giani Zail Singh Campus
Dabwali Road, Bathinda-151001
(iii) Thapar Institute ofEngineering & Tech.
Patiala-147004
21
20 Odisha
Punjab
17 Meghalaya
16 Manipur
Maharashtra15
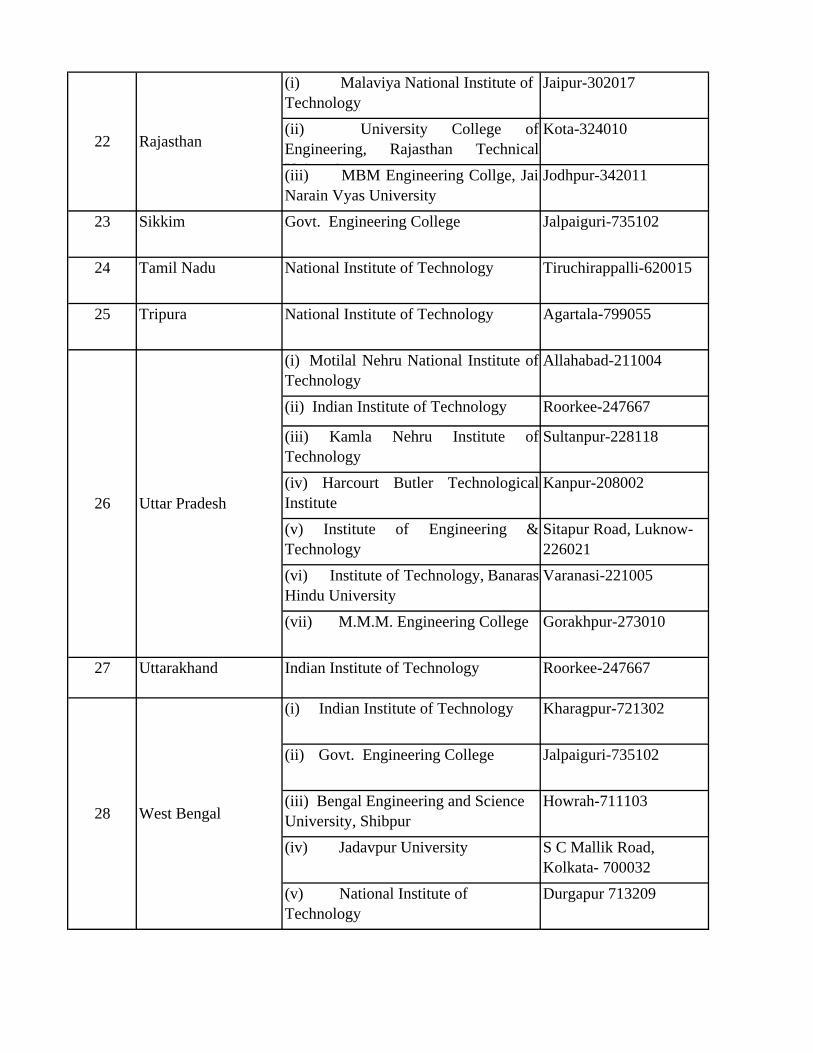
(i) Malaviya National Institute of Technology
Jaipur-302017
(ii) University College ofEngineering, Rajasthan TechnicalU i i
Kota-324010
(iii) MBM Engineering Collge, JaiNarain Vyas University
Jodhpur-342011
23 Sikkim Govt. Engineering College Jalpaiguri-735102
24 Tamil Nadu National Institute of Technology Tiruchirappalli-620015
25 Tripura National Institute of Technology Agartala-799055
(i) Motilal Nehru National Institute ofTechnology
Allahabad-211004
(ii) Indian Institute of Technology Roorkee-247667
(iii) Kamla Nehru Institute ofTechnology
Sultanpur-228118
(iv) Harcourt Butler TechnologicalInstitute
Kanpur-208002
(v) Institute of Engineering &Technology
Sitapur Road, Luknow-226021
(vi) Institute of Technology, BanarasHindu University
Varanasi-221005
(vii) M.M.M. Engineering College Gorakhpur-273010
27 Uttarakhand Indian Institute of Technology Roorkee-247667
(i) Indian Institute of Technology Kharagpur-721302
(ii) Govt. Engineering College Jalpaiguri-735102
(iii) Bengal Engineering and Science University, Shibpur
Howrah-711103
(iv) Jadavpur University S C Mallik Road, Kolkata- 700032
(v) National Institute of Technology
Durgapur 713209
West Bengal28
26
22 Rajasthan
Uttar Pradesh
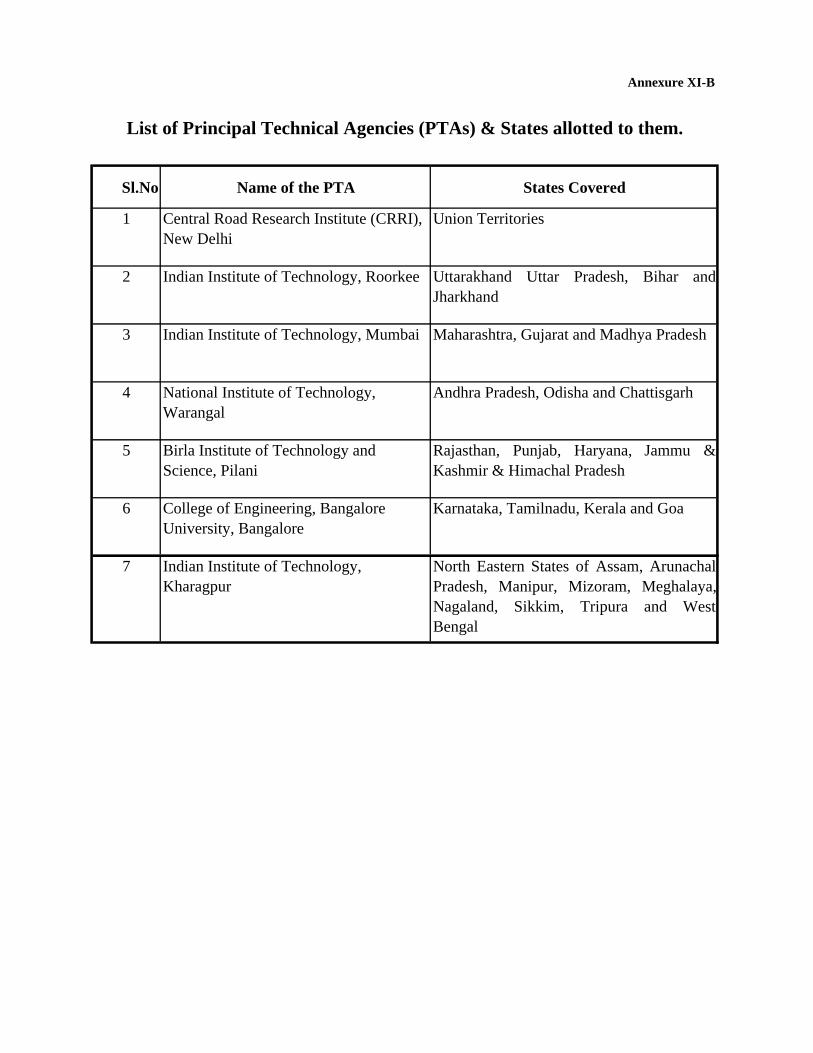
Annexure XI-B
Sl.No Name of the PTA States Covered
1 Central Road Research Institute (CRRI), New Delhi
Union Territories
2 Indian Institute of Technology, Roorkee Uttarakhand Uttar Pradesh, Bihar andJharkhand
3 Indian Institute of Technology, Mumbai Maharashtra, Gujarat and Madhya Pradesh
4 National Institute of Technology, Warangal
Andhra Pradesh, Odisha and Chattisgarh
5 Birla Institute of Technology and Science, Pilani
Rajasthan, Punjab, Haryana, Jammu &Kashmir & Himachal Pradesh
6 College of Engineering, Bangalore University, Bangalore
Karnataka, Tamilnadu, Kerala and Goa
7 Indian Institute of Technology, Kharagpur
North Eastern States of Assam, ArunachalPradesh, Manipur, Mizoram, Meghalaya,Nagaland, Sikkim, Tripura and WestBengal
List of Principal Technical Agencies (PTAs) & States allotted to them.

STATE(S) FINANCIAL YEAR
MAINTENANCE FUNDS REQUIRED
(AS PER CONTRACTS )
ACTUAL RELEASE TO
SRRDA
EXPENDITURE BY SRRDA DURING THE FINANCIAL YEAR
% release
2010‐11 20.77 39.23 2.55 7%
2011‐12 30.00 0.00 4.60 #DIV/0!
2012‐13 27.91 48.68 12.96 27%
2013‐14 31.41 0.00 17.19 #DIV/0!
Total: 110.09 87.91 37.30 42%
2010‐11 1.13 8.45 0.14 2%
2011‐12 1.91 0.00 0.46 #DIV/0!
2012‐13 3.61 2.50 6.92 277%
2013‐14 5.00 5.00 18.84 377%
Total: 11.65 15.95 26.36 165%
2010‐11 11.99 11.99 5.17 43%
2011‐12 15.00 13.40 3.18 24%
2012‐13 18.00 18.00 9.40 52%
2013‐14 22.00 11.00 12.42 113%
Total: 66.99 54.39 30.17 55%
2010‐11 52.66 0.00 7.63 ‐
2011‐12 62.22 33.00 22.39 68%
2012‐13 94.33 56.25 91.60 163%
2013‐14 121.23 121.23 102.92 85%
Total: 330.44 210.48 224.54 107%
2010‐11 20.85 20.85 16.95 81%
2011‐12 24.90 24.90 14.81 59%
2012‐13 34.01 34.01 20.30 60%
2013‐14 24.24 24.48 24.48 100%
Total: 104.00 104.24 76.54 73%
2010‐11 7.08 10.30 1.63 16%
2011‐12 7.71 11.24 7.34 65%
2012‐13 8.61 22.62 18.96 84%
2013‐14 11.82 11.82 11.41 97%
Total: 35.22 55.98 39.34 70%
Annexure‐XII
Statement Showing Maintenance Funds Required/ Received and Expenditure incurred under PMGSY (Upto Mar'14)
ANDHRA PRADESH
ARUNACHAL PRADESH
ASSAM
BIHAR
CHHATISGARH
GUJARAT
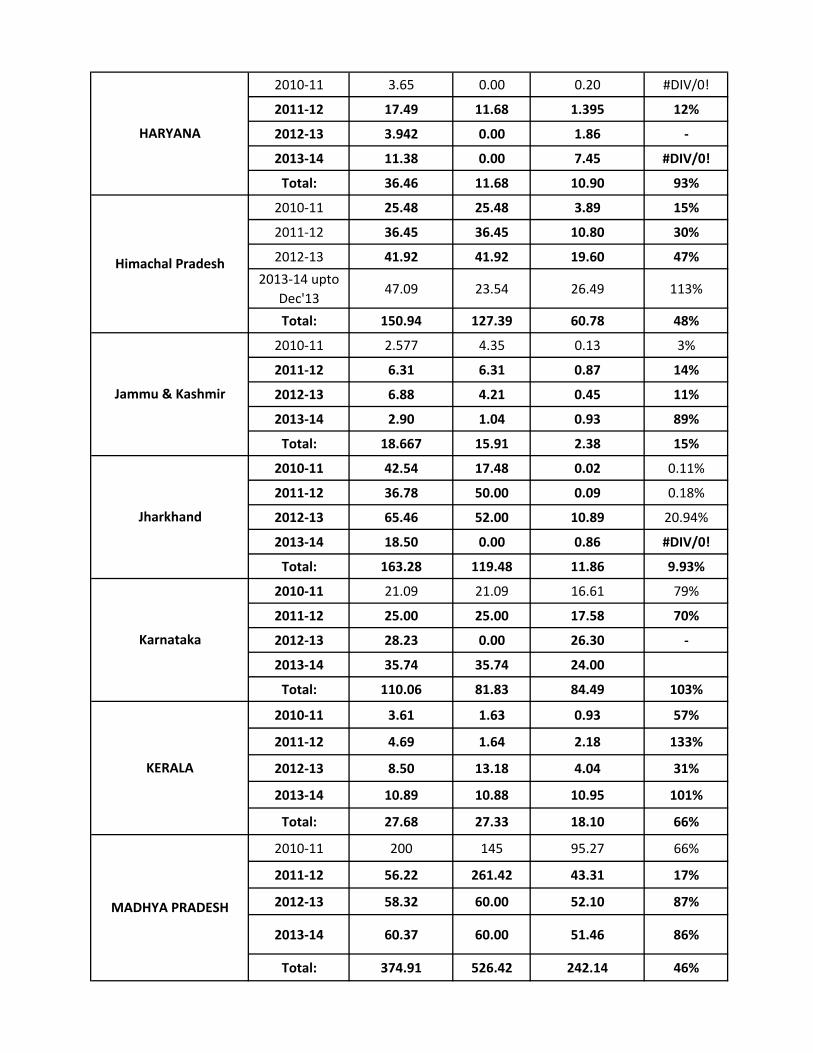
2010‐11 3.65 0.00 0.20 #DIV/0!
2011‐12 17.49 11.68 1.395 12%
2012‐13 3.942 0.00 1.86 ‐
2013‐14 11.38 0.00 7.45 #DIV/0!
Total: 36.46 11.68 10.90 93%
2010‐11 25.48 25.48 3.89 15%
2011‐12 36.45 36.45 10.80 30%
2012‐13 41.92 41.92 19.60 47%
2013‐14 upto Dec'13
47.09 23.54 26.49 113%
Total: 150.94 127.39 60.78 48%
2010‐11 2.577 4.35 0.13 3%
2011‐12 6.31 6.31 0.87 14%
2012‐13 6.88 4.21 0.45 11%
2013‐14 2.90 1.04 0.93 89%
Total: 18.667 15.91 2.38 15%
2010‐11 42.54 17.48 0.02 0.11%
2011‐12 36.78 50.00 0.09 0.18%
2012‐13 65.46 52.00 10.89 20.94%
2013‐14 18.50 0.00 0.86 #DIV/0!
Total: 163.28 119.48 11.86 9.93%
2010‐11 21.09 21.09 16.61 79%
2011‐12 25.00 25.00 17.58 70%
2012‐13 28.23 0.00 26.30 ‐
2013‐14 35.74 35.74 24.00
Total: 110.06 81.83 84.49 103%
2010‐11 3.61 1.63 0.93 57%
2011‐12 4.69 1.64 2.18 133%
2012‐13 8.50 13.18 4.04 31%
2013‐14 10.89 10.88 10.95 101%
Total: 27.68 27.33 18.10 66%
2010‐11 200 145 95.27 66%
2011‐12 56.22 261.42 43.31 17%
2012‐13 58.32 60.00 52.10 87%
2013‐14 60.37 60.00 51.46 86%
Total: 374.91 526.42 242.14 46%
KERALA
MADHYA PRADESH
Himachal Pradesh
Jammu & Kashmir
Jharkhand
Karnataka
HARYANA

2010‐11 13.43 68.20 14.52 21%
2011‐12 68.20 68.20 68.20 100%
2012‐13 33.40 33.40 33.40 100%
2013‐14 31.02 30.95 30.95 100%
Total: 146.05 200.75 147.07 73%
2010‐11 0.32 1.00 0.08 8%
2011‐12 0.91 1.00 0.59 59%
2012‐13 2.07 5.00 1.16 23%
2013‐14 3.78 4.00 6.21 155%
Total: 7.08 11.00 8.04 73%
2010‐11 3.30 3.30 1.85 56%
2011‐12 3.64 3.64 0.00 0%
2012‐13 1.58 1.58 1.39 88%
2013‐14 0.41 0.00 2.68 #DIV/0!
Total: 8.93 8.52 5.92 69%
2010‐11 0.23 0.23 0.043 19%
2011‐12 0.27 0.27 0.27 100%
2012‐13 0.28 0.33 0.4 121%
2013‐14 upto Dec'13
0.32 0 0
Total: 0.78 0.83 0.713 86%
2010‐11 5.00 4.90 2.05 42%
2011‐12 5.00 3.85 5.43 141%
2012‐13 3.00 2.59 2.40 93%
2013‐14 3.00 2.04 1.14 56%
Total: 16.00 13.38 11.02 82%
2010‐11 20.68 25.00 32.16 129%
2011‐12 30.00 30.00 27.80 93%
2012‐13 40.00 40.00 35.48 89%
2013‐14 59.61 41.40 37.15 90%
Total: 150.29 136.40 132.59 97%
2010‐11 8.00 6.00 1.85 31%
2011‐12 8.00 2.00 4.10 205%
2012‐13 9.03 2.90 7.73 267%
2013‐14 9.56 3.85 5.99 156%
Total: 34.59 14.75 19.67 133%
MAHARASHTRA
MANIPUR
MEGHALAYA
MIZORAM
NAGALAND
ODISHA
PUNJAB
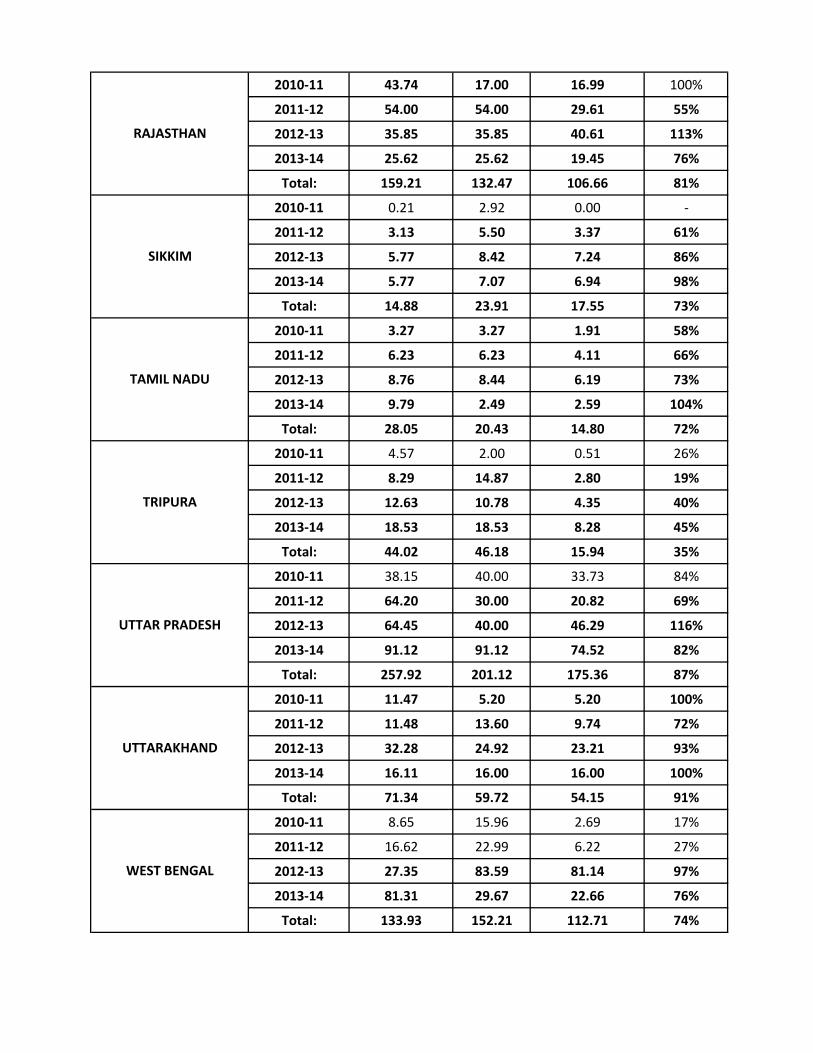
2010‐11 43.74 17.00 16.99 100%
2011‐12 54.00 54.00 29.61 55%
2012‐13 35.85 35.85 40.61 113%
2013‐14 25.62 25.62 19.45 76%
Total: 159.21 132.47 106.66 81%
2010‐11 0.21 2.92 0.00 ‐
2011‐12 3.13 5.50 3.37 61%
2012‐13 5.77 8.42 7.24 86%
2013‐14 5.77 7.07 6.94 98%
Total: 14.88 23.91 17.55 73%
2010‐11 3.27 3.27 1.91 58%
2011‐12 6.23 6.23 4.11 66%
2012‐13 8.76 8.44 6.19 73%
2013‐14 9.79 2.49 2.59 104%
Total: 28.05 20.43 14.80 72%
2010‐11 4.57 2.00 0.51 26%
2011‐12 8.29 14.87 2.80 19%
2012‐13 12.63 10.78 4.35 40%
2013‐14 18.53 18.53 8.28 45%
Total: 44.02 46.18 15.94 35%
2010‐11 38.15 40.00 33.73 84%
2011‐12 64.20 30.00 20.82 69%
2012‐13 64.45 40.00 46.29 116%
2013‐14 91.12 91.12 74.52 82%
Total: 257.92 201.12 175.36 87%
2010‐11 11.47 5.20 5.20 100%
2011‐12 11.48 13.60 9.74 72%
2012‐13 32.28 24.92 23.21 93%
2013‐14 16.11 16.00 16.00 100%
Total: 71.34 59.72 54.15 91%
2010‐11 8.65 15.96 2.69 17%
2011‐12 16.62 22.99 6.22 27%
2012‐13 27.35 83.59 81.14 97%
2013‐14 81.31 29.67 22.66 76%
Total: 133.93 152.21 112.71 74%
UTTAR PRADESH
UTTARAKHAND
WEST BENGAL
TAMIL NADU
TRIPURA
RAJASTHAN
SIKKIM

# State District Block/Tehsil Name of the Road Road Length (in Km)
Sanctioned Cost
(in Rs.)
1 Orissa Kendrapada Mahakalpara Jadhupur-Mahanangal Road 5.50 246.09
2 Orissa Jajpur Bari MDR 14- Chatumary 4.00 162.29
3 Madhya Pradesh Bhopal Berasia Berasia to Semrakalan Approach Road 5.10 139.51
4 Madhya Pradesh Raisen Udaipura Gehlawan Village to PMGSY Road 3.14 73.98
5 Chattisgarh Bilaspur Mungli Kodavabani to Khursi 4.80 193.06
6 Chattisgarh Kawardha Kawardha Khairjhiti to Ghirghosa Road 5.50 171.36
7 West Bengal Paschim Midnapore
Ghatal and Chandrakona-I Notuk to Dingal 4.80 188.38
8 Assam Nagaon Batadrava Rampur Satara to Dumdumia 4.20 156.63
9 Assam DarrangUdalguri Developmental Block
UT Road to Jarabari/Barnagaon 4.60 192.52
38.50 1523.82
Details of Road works executed using Jute Geo Textiles under PMGSY
Annexure XIV (A)
Grand Total

Annexure-XIV-(B)
S.No. State Technology No.Roads
1 Andhra Pradesh RBI-81 Technology 6
2 Jammu & Kashmir RBI-81 Technology 4
3 Karnataka Coir and Jute Geotextiles 41
Tamilnadu Coir Geotextile and RBI-81 44
4 Uttarakhand Cold Mix / CRMB 58
5 Maharashtra
CRMB, RCCP, RBI-81, Cell filled concrete, Fibre Reinforcement in CC Pavement, Waste Plastic, Stabulization using Cement, Lime, Flyash, Geogrid, Geotextiles
19
Details of New Initiatives taken up under PMGSY during 2012

Annexure-XIV-(B)
# State Type of Technology No of roads
1 Andhra Pradesh Fly ash, Cold Mix, RCCP, Lime stabilization, RBI-81, Iron slag 27
2 Assam Jute Geotextiles, Cold mix All districts
3 Bihar RCCP, Lime / Cement stabilization, Flyash, Cold Mix, Silicon aggrigate 422
4 Chattisgarh Jute geo textile, Bailly Bridges, RCCP, Iron slag, Cold mix. Polymer based soil stabilization technique 45
5 GujaratLime stabiliation, Flyash stabilization, Modified Bitumen, Interlocking Concrete block pavement, CONSOLID 444 organic Chemical and SOLIDRY Powder
26
7 Jharkhand RCCP, RBI-81 30
8 KarnatakaRCCP, Lime stabilization, fly ash stabilization, RBI-81, Nano Technology, Waste Plastic, Geo cell, Iron slag, Terrazyme, White topping, Jute Geotextiles, Coir geotextiles, cold tar
116
9 Kerala Coir Geotextiles, Modified Bitumen 100
10 Madhya Pradesh Jute Geotextile, Lime stabilization, RCCP, Cellfilled, Coir Geotextile, CCBP 20
11 MaharashtraSoil stabilization using lime / cement / fly ash, RBI Grade-81, RCCP Antistripping agent, CRMB, Plastic waste, Geotextile, Cold mix, use of Geo grid
103
12 Manipur Cold Mix 23
13 Mizoram RBI-81, Liquid polymer, cell filled concrete 19
14 Orissa Jute Geotextiles, Fly ash, RCCP, Blast furnace slag 52
15 Punjab Cold Mix 11
16 Rajashtan RBI-81, Cellfilled, Marble Slurry, Plastic waste 51
17 Sikkim Cold mix 26
18 Tamilnadu Coir Geotextiles, RBI-81 26
19 Tripura Coldmix, RBI-81, Jute geotextiles 23
20 Uttarakhand CRMB, RBI-81, Emusion 65
21 Uttar Pradesh RCCP, Inter block pavement 186
Details of New Initiatives taken up under PMGSY during 2013

Annexure‐XV
1 26th Meeting 5th July 2012
2 27th Meeting 27th Nov. 2012
3 28th Meeting 19th Dec. 2012
4 29th Meeting 14th March 2013
1 30th Meeting 24th June 2013
2 31st Meeting 24th July 2013
3 32nd Meeting 29th October 2013
4 33rd Meeting 10th January 2014
5 34th Meeting 28th March 2014
1 16th Meeting 30th July 2012
2 17th Meeting 1st Feb.' 2013
1 18th Meeting 26th July 2013
2 19th Meeting 4th February 2014
2013‐14
Executive Committee Meeting of NRRDA
2012‐13
2013‐14
General Body meeting of NRRDA
2012‐13

Annexure‐XVI
Submission of Balance Sheet for the year 2012-13 (All States) S.No. State Prog. Fund Admin Fund
OMMAS Based as on 31.03.2013
1 Andhra Pradesh Received Received Yes
2 Arunāchal Pradesh Received Received Yes
3 Assam Received Received Yes(PF,AF)
4 Bihār Received Received No
NHPC Received No
NPCC Received No
NBCC Not on format No
IRCON Received No
5 Chhattisgarh Received Received Yes
6 Goa Not on format
7 Gujarāt Received Received Yes(PF), AF(No)
8 Haryāna Received Received No
9 Himāchal Pradesh Receivd Received Yes(PF) AF (No)
10 J&K Receivd Received NO
11 Jharkhand Received Received Yes(PF,AF)
12 Karnātaka Received Received No
13 Kerala Received Received No
14 Madhya Pradesh Received Received Yes
15 Mahārāshtra Received Received Yes
16 Manipur Received Received No
17 Meghālaya Received Received No
18 Mizoram Not Recieved Not Received
19 Nagaland Receivd Received No
20 Orissa Reveived Received Yes(PF) AF (No)
21 Punjab Received Received Yes(PF) AF (No)
22 Rājasthān Received Recived Yes(PF) AF (No)
23 Sikkim Received Received Yes
24 Tamil Nādu Received Received No
25 Tripura Received Received No
26 Uttaranchal Received Received Yes
27 Uttar Pradesh Received Received Yes(PF) AF (No)
28 West Bengal Received Received No
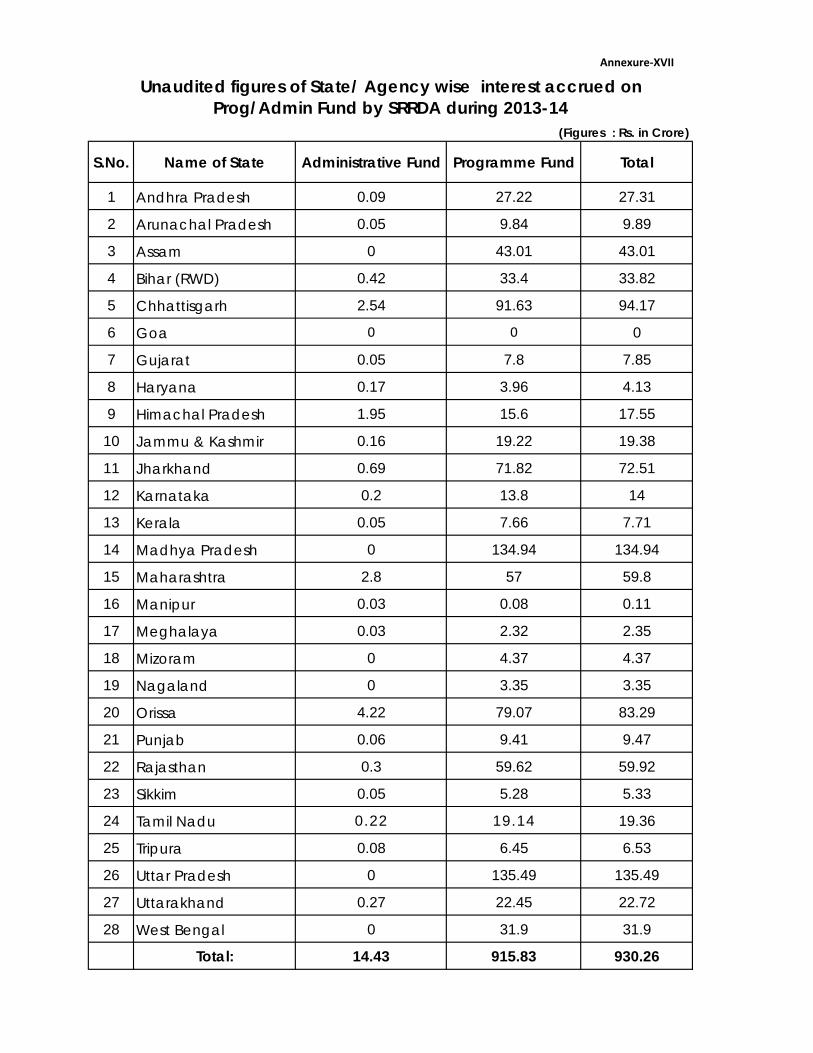
Annexure‐XVII
S.No. Name of State Administrative Fund Programme Fund Total
1 Andhra Pradesh 0.09 27.22 27.31
2 Arunachal Pradesh 0.05 9.84 9.89
3 Assam 0 43.01 43.01
4 Bihar (RWD) 0.42 33.4 33.82
5 Chhattisgarh 2.54 91.63 94.17
6 Goa 0 0 0
7 Gujarat 0.05 7.8 7.85
8 Haryana 0.17 3.96 4.13
9 Himachal Pradesh 1.95 15.6 17.55
10 Jammu & Kashmir 0.16 19.22 19.38
11 Jharkhand 0.69 71.82 72.51
12 Karnataka 0.2 13.8 14
13 Kerala 0.05 7.66 7.71
14 Madhya Pradesh 0 134.94 134.94
15 Maharashtra 2.8 57 59.8
16 Manipur 0.03 0.08 0.11
17 Meghalaya 0.03 2.32 2.35
18 Mizoram 0 4.37 4.37
19 Nagaland 0 3.35 3.35
20 Orissa 4.22 79.07 83.29
21 Punjab 0.06 9.41 9.47
22 Rajasthan 0.3 59.62 59.92
23 Sikkim 0.05 5.28 5.33
24 Tamil Nadu 0.22 19.14 19.36
25 Tripura 0.08 6.45 6.53
26 Uttar Pradesh 0 135.49 135.49
27 Uttarakhand 0.27 22.45 22.72
28 West Bengal 0 31.9 31.9
Total: 14.43 915.83 930.26
Unaudited figures of State/ Agency wise interest accrued on Prog/Admin Fund by SRRDA during 2013-14
(Figures : Rs. in Crore)

Annexure-XVIII
Last Month for which date entries
made.
Last Month for which data
entries completed.
Last Month for which date entries
made.
Last Month for which data
entries completed.
1 Andhra Pradesh Mar-14 Mar-13 Mar-14 Mar-13
2 Arunāchal Pradesh Mar-14 Dec-13 Jan-14 Nov-13
3 Assam Mar-13 - Mar-13 Mar-11
4 Bihar Jun-13 - Opening balances Not entered -
NHPC Opening balances Not entered -
NPCC Opening balances Not entered -
NBCC Opening balances Not entered -
IRCON Opening balances Not entered -
5 Chhattisgarh Mar-14 Mar-13 Mar-14 Mar-13
6 Goa Opening balances Not entered - Opening balances
Not entered -
7 Gujarāt Apr-14 Feb-14 Mar-14 May-12
8 Haryāna Jan-14 Mar-13 Mar-14 Mar-14
9 Himāchal Pradesh Apr-14 Mar-14 Mar-14 Mar-14
10 J&K Feb-14 Opening balances Not entered -
11 Jharkhand Mar-14 Mar-14 Mar-14 Mar-14
12 Karnātaka Apr-14 Apr-07 Mar-14 May. 2005
13 Kerala Feb-14 Mar-12 Nov-13 Mar-13
Not Applicable
Status of implementation of OMMAS in the States.
S. No. Sate
Programme Fund Admin fund

14 Madhya Pradesh Mar-14 Mar-13 Mar-14 Mar-13
15 Mahārāshtra Nov-13 - Mar-13 -
16 Manipur Apr-12 Mar-12 Mar-12 Mar-10
17 Meghālaya Mar-14 Mar-14 Feb-14 Oct-12
18 Mizoram Mar-14 - Mar-14 -
19 Nagaland Mar-13 - Mar-13 Mar-13
20 Orissa Mar-14 Aug-13 Mar-14 Oct-13
21 Punjab Jan-14 Mar-14 Mar-14 Feb-14
22 Rājasthān Mar-14 Mar-14 Mar-14 Mar-14
23 Sikkim Mar-13 - Mar-14 -
24 Tamil Nādu Opening balances Not entered - Opening balances
Not entered -
25 Tripura Sep-13 - Aug-13 -
26 Uttaranchal Mar-14 Mar-14 Mar-14 Jan-14
27 Uttar Pradesh Apr-14 Feb-14 Apr-14 Feb-14
28 West Bengal May-13 Mar-13 Nov-13 Mar-13
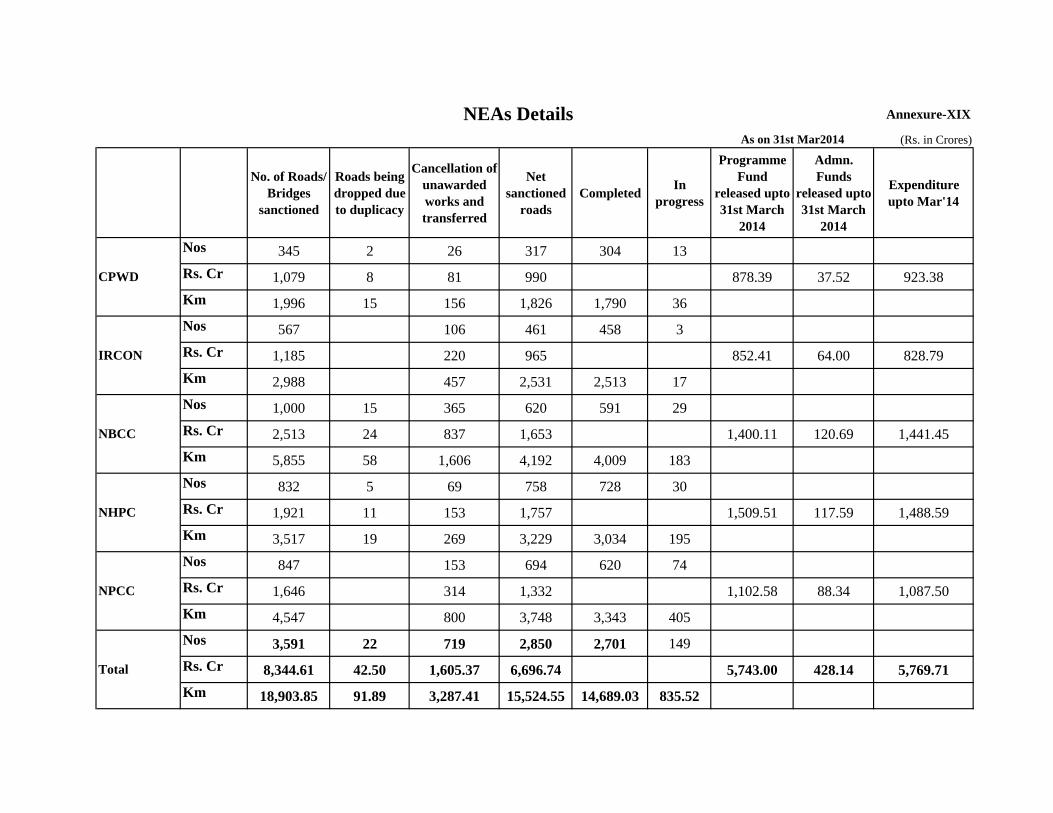
Annexure-XIX
(Rs. in Crores)
No. of Roads/ Bridges
sanctioned
Roads being dropped due to duplicacy
Cancellation of unawarded works and transferred
Net sanctioned
roadsCompleted In
progress
Programme Fund
released upto 31st March
2014
Admn. Funds
released upto 31st March
2014
Expenditure upto Mar'14
Nos 345 2 26 317 304 13Rs. Cr 1,079 8 81 990 878.39 37.52 923.38Km 1,996 15 156 1,826 1,790 36Nos 567 106 461 458 3Rs. Cr 1,185 220 965 852.41 64.00 828.79Km 2,988 457 2,531 2,513 17Nos 1,000 15 365 620 591 29Rs. Cr 2,513 24 837 1,653 1,400.11 120.69 1,441.45Km 5,855 58 1,606 4,192 4,009 183Nos 832 5 69 758 728 30Rs. Cr 1,921 11 153 1,757 1,509.51 117.59 1,488.59Km 3,517 19 269 3,229 3,034 195Nos 847 153 694 620 74Rs. Cr 1,646 314 1,332 1,102.58 88.34 1,087.50Km 4,547 800 3,748 3,343 405Nos 3,591 22 719 2,850 2,701 149Rs. Cr 8,344.61 42.50 1,605.37 6,696.74 5,743.00 428.14 5,769.71Km 18,903.85 91.89 3,287.41 15,524.55 14,689.03 835.52
As on 31st Mar2014
Total
NEAs Details
CPWD
IRCON
NBCC
NHPC
NPCC
National Rural Roads Development Agency Ministry of Rural Development, Government of India
5th Floor, 15 NBCC Tower, Bhikaji Cama Place, New Delhi – 110066 Ph: 91‐11‐26716930/33, Fax: 91‐11‐26179555, E‐mail: [email protected]
Web: www.pmgsy.org www.pmgsy.nic.in