bringing gis to a small community water system · bringing gis to a small community water system by...
TRANSCRIPT
Bringing GIS to a Small Community Water System
by
Cian Michael Reger
A Thesis Presented to the
Faculty of the USC Graduate School
University of Southern California
In Partial Fulfillment of the
Requirements for the Degree
Master of Science
(Geographic Information Science and Technology)
May 2017

Copyright ® 2016 by Cian Reger

To my wife, Krista Reger, and mother, Eithne Scelzi
iv
Table of Contents
List of Figures ........................................................................................................................... vi
List of Tables ........................................................................................................................... vii
Acknowledgements ................................................................................................................. viii
List of Abbreviations................................................................................................................. ix
Abstract ......................................................................................................................................x
Chapter 1 Introduction ................................................................................................................1
1.1 Public Water Systems ...................................................................................................... 1
1.2 Motivation ....................................................................................................................... 2
1.3 Project Objective ............................................................................................................. 3
1.4 Project Area ..................................................................................................................... 5
1.5 Thesis Organization ......................................................................................................... 5
Chapter 2 Literature Review........................................................................................................7
2.1 GIS in Utilities ................................................................................................................ 8
2.2 Spatial Data Collection Methods from Previous Studies................................................... 9
2.3 Open Source GIS ........................................................................................................... 11
2.4 GIS Training and Evaluation Methods from Previous Studies ........................................ 13
Chapter 3 Case Study: Development of a GIS for the Descanso CWD ....................................... 14
3.1 User Needs Assessment ................................................................................................. 14
3.2 Source Data Evaluation ................................................................................................. 15
3.3 Data Collection and Preparation..................................................................................... 17
3.3.1. Data Dictionary Creation ..................................................................................... 18
3.3.2. Field Data Collection ........................................................................................... 18
3.4 Creation of a Water System GIS for the Descanso CWD ............................................... 20
3.4.1. Use of Shapefiles Versus Geodatabase ................................................................. 21
3.4.2. Background Data ................................................................................................. 22
3.4.3. Digitizing Data .................................................................................................... 22
3.5 Map Output ................................................................................................................... 27
3.5.1. Styles and Labeling of Features ............................................................................ 27
3.5.2. Atlas .................................................................................................................... 29
3.5.3. Wall Map ............................................................................................................. 32
v
3.6 Employee GIS Training ................................................................................................. 32
3.7 Time Accounting ........................................................................................................... 33
Chapter 4 Generalized Workflow for Creating a Community Water System GIS ....................... 34
4.1 User Needs Assessment ................................................................................................. 34
4.2 Source Data Evaluation ................................................................................................. 35
4.3 Field Data Collection ..................................................................................................... 37
4.4 Design and Implementation of a Water System GIS ....................................................... 38
4.4.1. Selecting GIS Software ........................................................................................ 39
4.4.2. Digitizing Data .................................................................................................... 40
4.5 Design of Map Output Products ..................................................................................... 42
4.5.1. Map Elements ...................................................................................................... 43
4.5.2. Typography.......................................................................................................... 44
4.5.3. Map Creation ....................................................................................................... 45
4.6 Training Requirements .................................................................................................. 45
Chapter 5 Discussion................................................................................................................. 47
5.1 Successes ....................................................................................................................... 48
5.2 Failures .......................................................................................................................... 49
5.3 Areas for Improvement .................................................................................................. 49
5.4 Future Possibilities ........................................................................................................ 50
References ................................................................................................................................ 54
vi
List of Figures
Figure 1 The location of the Descanso Community Water District...............................................6
Figure 2 Example of a lost feature in the CWDs existing maps .................................................. 17
Figure 3 An example of the features and attribute data in the data dictionary ............................. 19
Figure 4 Map of the Descanso Community Water District ......................................................... 20
Figure 5 Example of digitizing water lines in ArcMap............................................................... 24
Figure 6 An example of attribute data entered into GIS ............................................................. 26
Figure 7 QGIS metadata assistant .............................................................................................. 26
Figure 8 Style elements for each feature .................................................................................... 28
Figure 9 Final grid used for atlas creation .................................................................................. 29
Figure 10 Selected settings on the ‘Atlas Generation’ tab .......................................................... 30
Figure 11 The inset map with grid and overview box ................................................................ 31

vii
List of Tables
Table 1 Features and data to be collected in the field ........................................................... 15-16
Table 2 Chapters and topics of the QGIS Training Manual ........................................................ 33
viii
Acknowledgements
I am grateful to the Descanso Community Water District for allowing me to disrupt their daily
operations and use their system for my thesis project. I would also like to thank Dr. Elizabeth
Sedano, Dr. Vanessa Griffith Osborne, Dr. Darren Ruddell, and Dr. Karen Kemp for their input
and guidance in the preparation of this thesis document.
ix
List of Abbreviations
AM/FM Automated Mapping/Facilities Management
CAD Computer Aided Design
CWS Community Water System
CWD Community Water District
Esri Environmental Systems Research Institute
GIS Geographic information system
NTNCWS Non-Transient Non-Community Water System
TNCWS Transient Non-Community Water System
x
Abstract
Community Water Systems (CWS) are public or private water systems that supply water
to the same population year-round, and they provide drinking water to over 300 million people in
the United States each year. While the majority of the population is served by larger CWSs,
where populations range from 10,000 to 100,000+, there are three times as many small water
systems, where populations are less than 10,000, and these water systems generally have smaller
budgets for maintaining or improving their systems. Many of these small CWSs rely on outdated
maps or have no maps at all, and may not have the budget for a GIS. The goal of this study is to
develop inexpensive geospatial solutions that can be implemented in small rural CWSs.
As a case study, a geographic information system (GIS) was created and implemented at
the Descanso Community Water District in San Diego County, California using open source GIS
software. The Descanso CWD relied on outdated paper CAD maps and has no spatial data of
their infrastructure. Locations of all features found in the water system were collected using high
accuracy GPS. The locations of pipes were digitized with the aid of Descanso CWD employees
using Esri’s ArcMap. The datasets were added in QGIS, an open source GIS software, and
displayed over aerial photographs and other background data. A detailed map atlas of the water
system and a small-scale wall map were created. Metadata for all data was created in XML
format. A system employee was trained on the functions of the GIS software that are necessary
to update the data as needed, which will allow the Descanso CWD to operate and maintain their
GIS in-house instead of relying on a contractor to perform the work for them. A workflow for
implementing a GIS at a small CWS was then created based on the findings of the case study.
1
Chapter 1 Introduction
The use of geographic information systems (GIS) in the utility industry has become
commonplace, as GIS allows not only for the accurate mapping of infrastructure features, but
also the ability to add attribute data to those features. When a utility stores their data in spatial
format, they can also use GIS software to query and analyze specific attributes of their data.
Water utilities in particular utilize GIS for the mapping of system infrastructure to replace
existing paper maps or to create maps when none were had before. This project will be a case
study in the implementation of a GIS at a small rural community water system using open source
GIS software.
1.1 Public Water Systems
As of 2011, there are 152,713 water systems in the United States that serve 318 million
people (EPA, 2013). This number includes Transient Non-Community Water Systems
(TNCWS), Non-Transient Non-Community Water Systems (NTNCWS), and CWSs (EPA,
2012). TNCWSs provide water in a place such as a gas station or campground where people do
not remain for long periods of time. TNCWSs served 12.6 million people in 2011. NTNCWSs
regularly supply water to at least 25 of the same people at least six months per year, but not year-
round, such as hospitals, schools, or office complexes. In 2011 NTNCWSs served 6.2 million
people. Community Water Systems (CWS) supply water to the same population year-round, and
in 2011 served 299.2 million people (EPA, 2013). Examples of CWSs are municipalities,
community service districts, or mutual water companies. This study will focus on CWSs as they
serve the majority of the population of the United States.
Based on the population that each CWS serves, the EPA reclassifies them into five
categories. Very Small systems serve 25-500 people, Small systems serve 501-3,300 people,
2
Medium systems serve 3,301-10,000 people, Large systems serve 10,001-100,000 people, and
Very Large systems serve 100,001+ people (EPA, 2012). 15.6% of CWSs are Very Large, Large,
or Medium, serving 91% of the population that gets its water from a CWS, and 84.2% are Small
or Very Small, serving only 9% of those that get their water from a CWS (EPA, 2013). This
statistic means that 4,108 Very Large, Large, or Medium CWSs provide water to 275 million
people and 47,248 Small or Very Small CWSs provide water to only 27 million people. This
averages to 66,282 people per Very Large, Large, or Medium CWS, and 569 people per Very
Small or Small CWS. When it comes to funding infrastructure improvements or technology
changes for CWSs it is obvious that the larger systems will have a significantly higher income
than the smaller systems. For this reason, this study will focus on the smaller systems. From here
on, Very Small and Small CWSs will be referred to as small systems.
1.2 Motivation
Most of the larger systems utilize GIS in their daily activities, while the majority of
smaller systems do not. Many of these systems believe GIS to be cost-prohibitive and do not
understand what they could achieve with a well-designed GIS. These systems rely on dated as-
built maps of their infrastructure that may or may not be accurate, and some systems do not have
any maps of their infrastructure at all. In my six years of working for the California Rural Water
Association, a non-profit organization that helps small rural water communities, I have
personally visited over 400 small systems in the State of California, very few of which utilize
GIS. The majority of these systems rely on engineering firms to create and maintain their maps,
at a high cost to the system. By creating and maintaining a GIS of their infrastructure, these
CWSs will have the ability to create maps on their own.
3
The utility industry has relied on computer aided design (CAD) systems in the mapping
of its water systems. Many large CWDs have found that GIS works not only as a mapping
system, but also as a database system. Information about all parts of the water system can be
stored in a GIS, such as information on hydrants, valves, or pipe (Goubert, 1992). Customer use
data can also be stored in a GIS, which can be analyzed to find trends in usage or even leaks.
The Environmental Systems Research Institute (Esri) is the most well-known GIS
software company and provides a very robust program, ArcGIS. ArcGIS is capable of
performing any spatial task a water utility may need, but it comes at a high cost. As of this
writing, the cost of the most basic single user license is a one-time cost $1,500 (Esri 2016-1),
which may make it unattainable for many small water systems.
There are, however, other options for these systems in the form of open source GIS
software. Open source refers to software that the developer has made the source code available to
anyone and can be modified by anyone, which is made possible under the GNU General Public
License, and allows for the developer to release the software for free (IMT 2010). There are
numerous options, but the most mature and robust options are GRASS GIS, SAGA GIS, gvSIG,
and QGIS (GIS Geography 2016).
1.3 Project Objective
This purpose of this study is to develop inexpensive geospatial solutions that can be
implemented in small CWSs. To develop these solutions, a case study will be performed to show
that low cost open source GIS is as effective in the creation, manipulation, and presentation of
spatial data as proprietary GIS software when implemented at a small CWS. A generalized
workflow for implementing a GIS at a small CWS will be created based on this case study.
Studies on the implementation of a GIS in a CWS have been conducted before (Rayburn, 2004,
4
Crawford, 2012, and Fellers, 2013). However, these previous studies were conducted in larger
systems with large budgets, not small systems with small budgets.
The systems that I am interested in helping are small systems with modest budgets. A
large budget would not be necessary to implement a GIS in one of these CWSs. This can be
accomplished by using a low-cost GPS unit or renting a high cost GPS unit, installing open
source GIS software, such as QGIS, and teaching a system employee how to manipulate the GIS
software themselves. The result of this case study will be a generalized workflow for the
implementation of a GIS in other communities that can be used by other GIS professionals in the
water industry. This workflow will include all of the basic steps necessary to collect, manipulate,
and display spatial data for small water systems.
Each of the above mentioned open source GIS software options has strengths and
weaknesses. The U.S. Army Corps of Engineers originally developed GRASS GIS and later
released the software as open source. It offers the user to perform image processing analysis,
digital terrain manipulation and statistics but falls short in cartographic design. SAGA GIS was
originally created for terrain analysis and has particularly helpful tools for working with rasters.
However, like GRASS GIS, it is not useful when it comes to cartography. gvSIG is a software
package that is as capable as any commercial software and has extensive CAD tools. QGIS,
formerly Quantum GIS, has the most user-friendly interface, is capable of data manipulation like
all of the other software, but is the best at cartographic design (GIS Geography 2016). Iowa’s
Department of Natural Resources recommended QGIS to small water systems and provided free
trainings on its use (SmallWaterSupply.org 2012). Also, the Institute for Mapping Technology
selected QGIS as their preferred software (2010). For these reasons, QGIS was selected as the
software to be used in this project.
5
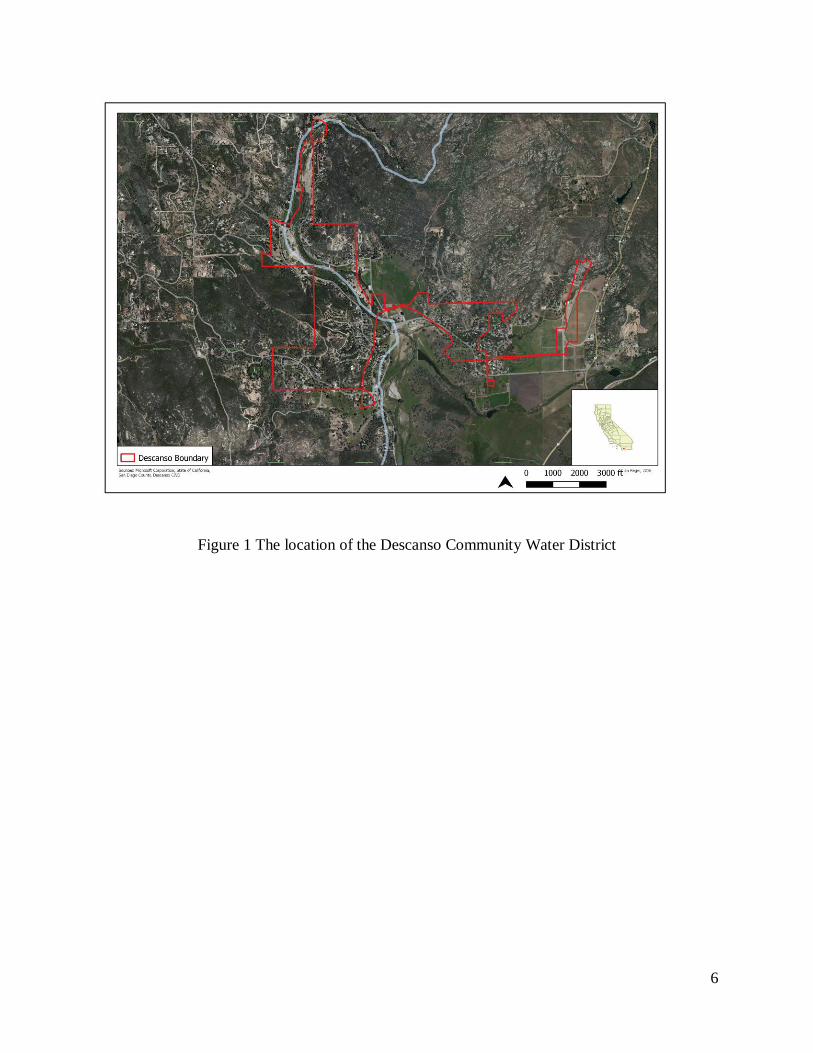
1.4 Project Area
The Descanso Community Water District (CWD) is a CWS located in Descanso, a small
census-designated place in the Cuyamaca Mountains, within the Mountain Empire area of
southeastern San Diego County, California. They are located at 32.855174°, -116.616322° at an
elevation of 3,450 feet. The service area covers approximately 19 square miles, all land. Figure 1
displays the location of the Descanso CWD. The Descanso CWD provides potable drinking
water to a population of 870 residents via 307 residential and 15 commercial service
connections. The Descanso CWD does not utilize GIS and currently relies on engineering
drawings that are not inaccurate, but do not accurately display updates to the system, which are
drawn in by hand by employees. The Descanso CWD hopes to utilize GIS to replace their
outdated maps but does not have the expertise to accomplish this in-house or the funds to hire a
consultant to perform the work.
1.5 Thesis Organization
This thesis is comprised of five chapters. Chapter Two focuses on the background
research necessary to give credence to the project, such as why particular software elements were
chosen and how the methodology was determined. Chapter Three describes the steps taken to
locate, obtain, and display the data necessary for case study in , particularly the use of GPS to
locate field data and QGIS software in map production. Chapter Four provides the generalized
workflow for the implementation of a GIS in a small CWS. Chapter Five discusses the positive
aspects of the project and where it could be improved. This chapter also describes how this
project could be furthered by continued research.
6
Figure 1 The location of the Descanso Community Water District
7
Chapter 2 Literature Review
What sets GIS apart from other mapping technologies the ability to relate data to a
location. In a water utility, a large majority of the utility’s data is tied to location. It is important
that a utility know where their infrastructure is located, which a well-designed GIS allows. A
GIS also allows for the utility to relate attribute data to these locations. How this data is
collected, stored, and manipulated is different for each utility. Data can be created by digitization
from existing maps or collected in the field using a GPS receiver. Many different software
packages exist to view, manipulate, and display the data, but they all fall into two categories:
open source or closed source software. Proprietary GIS software, especially Esri’s ArcMap, is
most commonly used in GIS implementation projects, and there no records of open source
(commonly known as freeware) GIS software being used for the same task. A utility’s data can
be stored in various formats, but the most common are shapefiles and databases. Storing spatial
data in a shapefile was once the industry standard, but relational databases have proven to be a
more efficient method. However, shapefiles are what this thesis project is going to use because
of their simplicity. Simplicity is necessary for this project as the finished product will be handed
over to an employee of the Descanso CWD, who will be trained to use the GIS software. To
ensure the employee is capable of maintaining the data, their proficiency in the use of the GIS
software will be evaluated.
Literature in the realm of GIS implementation for utilities can be found in various forms,
such as peer reviewed journal articles, student theses, technical manuals, and GIS textbooks. Of
the four studies of GIS implementation located, only one involves small systems, which is
considerably larger than the Descanso Community Water District. Literature pertinent to why
and how GIS is used in water utilities, open source GIS options for water utilities, data storage,
8
and GPS data collection are included in this chapter. This chapter also includes case studies
centered on GIS implementation in water utilities.
2.1 GIS in Utilities
In 1999, Cannistra wrote that most utilities throughout the United States are currently
employing or planning to implement a GIS. While there are no available statistics to prove it, it
is arguable that most large utilities use GIS in one form or another. However, from my own
experience in California, this does not hold true for small CWSs, where many rely on paper as-
built maps. Digital mapping software has been in use in the utility industry since the late 1970s.
The effort to digitize a utility’s infrastructure first focused on computer-aided design/drafting
(CAD) software (Longley et al. 2005). This system became known as Automated
Mapping/Facilities Management (AM/FM), which remains an industry standard. However, the
limitations of the system became apparent when users attempted to link graphical features to
databases. The result was a push towards GIS, which was made popular in the early 1980’s by
land and natural resource management users (Coppock and Rhind 1991). By the late 1980’s
AM/FM users began using GIS because of its ability to spatially relate features to a database, as
well as map infrastructure. As GIS technology improved, it became more of an information
system rather than a mapping system and is now used in conjunction with AM/FM (Longley et
al. 2005). GIS allows utilities to create features with attribute data, enforce a topology, and create
printable maps.
Implementing a GIS is no simple task, as numerous steps must be taken to ensure that it
is done properly. Huxhold and Levinsohn (1995) identify six properties that ensure success in a
GIS implementation: planning, application driven, organization, end-user participation,
measurable objectives, and effective documentation. While Tomlinson (2007) further describes
9
ten stages for implementing GIS in small and large systems, Fellers (2013) noted in his writing
that not all ten steps are necessary for a small system, as the size and the nature of the water
system dictate which stages are the most necessary for the implementation. The stages that
benefit small systems are conducting a technology seminar, describing the information products
through a needs assessment, creating a data design, determining system requirements, and
planning the implementation.
GIS implementation can be cost prohibitive to small systems. As such, small systems
often rely on engineering consulting firms to create maps for them at a high cost. Because of the
cost, maps are not updated regularly and can become outdated. In many cases, paper maps are
updated by hand by utility personnel (Crawford 2012). Lyon and Clifford (2008) documented
this at the Hardin County Water District No. 1 (HCWD 1). HCWD 1 only had two paper maps of
the entire system, which did not show any improvements or updates. Because of this, HCWD 1
was out of compliance with the mapping requirements of the Kentucky Division of Water. Many
small water systems could benefit from a GIS as it could replace their outdated maps, or in the
case of systems with no maps, become their mapping system, as well as create a database for the
water systems infrastructure. (Fellers 2013).
2.2 Spatial Data Collection Methods from Previous Studies
To properly determine the best methods of collecting data, previous studies similar to this
should be looked at to see how other utilities collected data. Rayburn (2004) implemented a GIS
for the City of Lufkin, Texas, which maintains water utilities to both residential and commercial
users through nearly 674 miles of water main. Before the implementation, the city already
maintained an extensive GIS database of its wastewater facilities, but had no data for the
majority of its water infrastructure. The Four Season Subdivision was new construction, so data
10
on valves and hydrants had been collected for the area. This area was chosen as a pilot project
for the city to build its water GIS. Meter location data was collected using a sub-meter accuracy
Trimble GPS unit, and water mains were digitized by referencing as-built maps and existing
CAD files, and connecting valve locations (Rayburn 2004).
Lyon and Clifford (2008) documented the implementation of a GIS for the Hardin
County Water District No. 1 (HCWD 1). HCWD 1 maintains water, wastewater, and stormwater
utilities in Hardin County, Kentucky. In order to get back into compliance with the Kentucky
Division of Water, HCWD 1 began the process of creating a GIS. In the first phase, HCWD1
utilized sub-meter accuracy GPS units and field staff collected the infrastructure data. Post
processing of the data and shapefile creation was completed by a contractor, who then sent the
data back to HCWD 1 to use the data to digitize water mains. Later, in HCWD 1 began
upgrading its GIS and purchased more accurate sub-foot GPS units, similar to what will be used
in this project, to collect any new data (Lyon and Clifford 2008).
Crawford (2012) also documented the implementation of a GIS for the City of Calhoun,
Georgia. This utility maintains water, wastewater, and electric utilities and provides water to
nearly 20,000 customers through over 800 miles of water main. The City of Calhoun utilized
existing data collected by a sub-foot RTK GPS, which included valves and fire hydrants. Meter
location data was collected using a sub-meter accuracy GPS unit, which was post processed to
ensure a higher accuracy. The valve locations were used as reference points to aid in the
migration of water line data from CAD to GIS. For background data in the GIS, the city utilized
aerial drawings as well as a hillshade raster (Crawford 2012).
Common field data collection methods exist between all of these GIS implementation
projects. High accuracy GPS was used to collect field data, which included the locations of
11
hydrants and valves. These locations were imported into a GPS and used as reference points to
aid in the digitization of water lines. The majority of the attribute data, when it was discussed,
was also common among the implementation projects.
2.3 Open Source GIS
Before there can be any talk of what implementing a GIS, the term “open source” must
first be discussed. It is important to know the difference between the terms freeware and free, or
open source, software because they can sometimes be misused. Freeware is a computer software
that is offered for use at no cost, while open source software can be “used, copied, studied,
modified, distributed and redistributed in a modified or unmodified form, without any
restriction” (Kepoglu 2011). The distinction between open and closed source software must also
be made. A software’s source code instructs the computer to carry out certain functions, and by
altering this code, programmers can modify, fix, or add other functions to the software. Closed
source, or proprietary, software code is made unavailable to the consumer as it is considered
proprietary. Open source software, however, is made freely available to the consumer and can
lead to a collaboration that results in software that is constantly updated, fixed, or improved (ITG
215).
The history of open source GIS extends back to the late 1970s with the advent of GRASS
by the U.S. Army Corps of Engineers (McKee 2012). Now there are numerous open source GIS
software options available, such as SAGA GIS, gvSIG, and QGIS, which was selected for this
thesis project. After an exhaustive search for literature involving the use of open source GIS
software in the implementation of a GIS in a utility. There are, however, numerous examples of
QGIS being used effectively to create thematic maps of user collected data. Skoglund and
Matsuoka (2013) of the Norwegian Polar Institute created the “Quantarctica” database, a
12
collection of Antarctic geographic datasets, using QGIS. They used QGIS because it was low
cost and easy to use, and have examined geographic data at all scales, layered scientific data over
base maps, and prepared maps for publication. The most similar example project was performed
by Jarrett Totton (2013), a volunteer with the Fundy Hiking Trail Association Inc. (FHTA).
Totton used a GPS receiver to map the Fundy Footpath in New Brunswick, Canada, as well as
point features, such as campsite locations. He imported the data into QGIS and created thematic
maps of the trail system. Although QGIS may not be as popular as its closed source counterparts,
these projects highlight its ability to create high quality maps.
The two software types are sometimes perceived very differently; open source is seen as
flexibility, and proprietary is seen as usability (Optimus Information 2015). Open source
software consumers are often seen as an “open, collaborative community of like-minded
professionals who come together to crowd-source ideas and build great things” (Backaitis 2013).
There are many pros to open source software, such as the ability to try the software before
deciding which will be used, support is generally free, usually in the form of detailed
documentation, forums, wikis, newsgroups, email lists, and live chat, and vendor lock-in is
avoided. Also, because the source code is open, more people will be looking through it, so there
is better chance that more bugs are exposed compared to the code from a proprietary vendor that
most likely has a smaller development staff (Optimus Information 2015). However, the main
drawback to open source software is usability. Most open source software packages are aimed at
skilled end users and may require coding knowledge to use them.
Similarly, there are many pros to proprietary software, such as product stability and a
sense of ownership. While open source software support is usually community based, proprietary
software support is specifically designed and honed for their product. Since the support is in-
13
house, training for support is more complete and accessible. Unlike open source software,
proprietary software’s biggest pro is usability. Proprietary software packages are focused on a
smaller group of end users, so they are generally more user friendly. The biggest drawback to
proprietary software is that the source code is closed. The end user of this software cannot make
any changes or customizations to it to suit the user better (Optimus Information 2015).
2.4 GIS Training and Evaluation Methods from Previous Studies
To ensure a GIS is being maintained properly, a trained GIS professional would be the
obvious choice to perform the work. However, this is not a possibility at many small utilities
because of budgetary constraints, so an employee may need to be trained to perform the
necessary tasks in maintaining the GIS. Michelle Lin (2016) aided in the implementation of a
GIS at the Pacific Symphony to locate potential performance locations based on heat maps of
their customer base. Lin created step-by-step guides for teams of employees of the Pacific
Symphony on how to use Esri’s GIS Online and Business Analyst Online. She also held
webcasts for specialized training, where she guided the teams step-by-step through exercises. To
ensure their comfort with each task, Lin had each team leader perform the exercise alone before
the webcast was over. After the training was completed, she provided a questionnaire to each
employee to gauge the success of the training. The feedback provided from these questionnaires
pushed Lin to expand her training guides as the users felt the software was not intuitive and
needed more guidance. In the end, the necessary analysis was performed by only two of the
employees, as the others did not have enough time due to other work, or did not feel comfortable
performing the work. (Lin 2016). For this thesis project, instead of creating a step-by-step guide,
existing QGIS training materials will be utilized by the Descanso CWD employee.
14
Chapter 3 Case Study: Development of a GIS for the Descanso CWD
A case study must first be completed in order to develop the generalized workflow for the
creation of spatial data sets for rural water communities. The first step in any data collection
process is to determine what the end user wants and how they will use the data. After that a
desktop evaluation of the water system must be completed, to determine what features will be
collected, through the examination of existing maps and discussion with the CWD employees.
Field data can then be collected and imported into a GIS, so then the rest of the data can be
digitized. After all of the datasets are complete maps can be created.
3.1 User Needs Assessment
A meeting was held with the Lead Operator of the Descanso CWD, Julie Seevers, and the
Lead Field Tech, Travis Creamer, in June 2016 to determine what the CWS wanted out of the
GIS. Many options for how the GIS could be prepared and used were presented to them. Being a
small system, they decided that using a GIS to create their maps and provide a database aspect
was all that was needed since they did not have the expertise or funding to continually update it.
This led to the idea that one of the Descanso CWD employees learn to use the GIS software.
Julie decided to move forward with the idea and Travis Creamer volunteered to learn how to use
the software. During this meeting the existing map of the system looked over and which features
would be surveyed were selected, including sources, storage tanks, valves, hydrants, meters, and
other minor features, such as air vacs and blow offs. It was also decided that an atlas and a wall
map of the system would be created. The staff of the Descanso CWD expressed excitement for
the project at the conclusion of the meeting and were looking forward to beginning the project.
15
3.2 Source Data Evaluation
In designing the methods for this case study, it was important to determine what data
would be collected in the field and what would be created at the desktop. This information will
be used to identify the best survey route as well as what attribute data is available for each
feature. A desktop investigation performed first to identify what infrastructure records the
Descanso CWD has. The previous operators had created a set of CAD maps in April 2008 which
displayed the locations of residential meters, valves, hydrants, water sources, storage tanks, and
other minor features, such as blow off valves and air vac devices. Based on these maps and input
from the Descanso CWD employees, a list was created that contained features, and their
associated attribute data, which were to be included in the GIS. Table 1 displays the features and
attribute data to be collected during the field data collection.
Table 1 Features and data to be collected in the field
Feature Attribute Data
Water Sources Source ID
GPS Location
GPS Date
Source Type
Depth (if applicable)
Water Storage Facilities ID
GPS Location
GPS Date
Capacity
Construction Material
Date Constructed
Condition
Valves ID
GPS Location
GPS Date
Size
Manufacturer
Type
Valve Position

16
Date Installed
Notes
Fire Hydrants ID
GPS Location
GPS Date
Color
Manufacturer
Type
Size
Date Installed
Notes
Water Meters ID
GPS Location
GPS Date
Construction Material
Manufacturer
Type
Size
Date Installed
Notes
Water Lines Type
Material
Size
Date Installed
Other Features Type
GPS Location
GPS Date
Color
Manufacturer
Size
Date Installed
Notes
During the examination of Descanso CWDs existing maps, it was observed that several
point features were considered “Lost” by the previous survey. Figure 2 displays an example of a
lost feature in the existing maps. The CWDs employees were aware of the issue and had located
several lost features and when the possibility arose, they would spend time attempting to locate
them. It was determined that during the survey, attempts would be made to locate lost features. It
was also noted that CWD employees had drawn in changes made to the system on their own
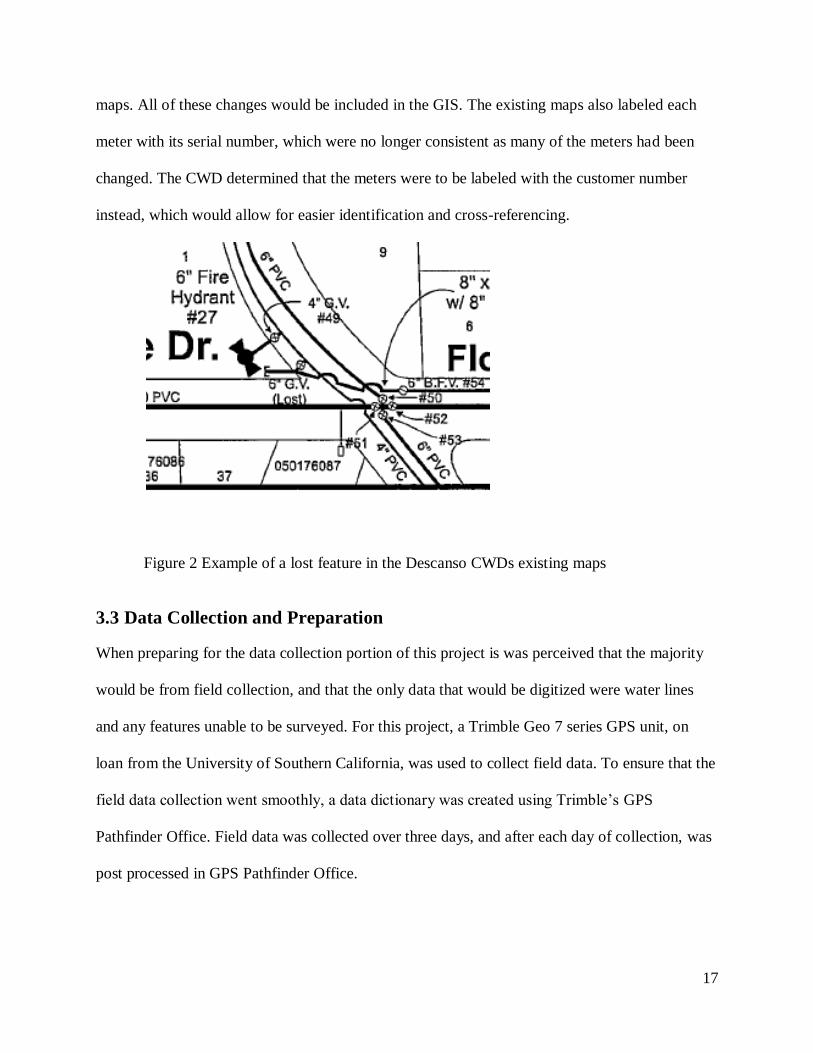
17
maps. All of these changes would be included in the GIS. The existing maps also labeled each
meter with its serial number, which were no longer consistent as many of the meters had been
changed. The CWD determined that the meters were to be labeled with the customer number
instead, which would allow for easier identification and cross-referencing.
Figure 2 Example of a lost feature in the Descanso CWDs existing maps
3.3 Data Collection and Preparation
When preparing for the data collection portion of this project is was perceived that the majority
would be from field collection, and that the only data that would be digitized were water lines
and any features unable to be surveyed. For this project, a Trimble Geo 7 series GPS unit, on
loan from the University of Southern California, was used to collect field data. To ensure that the
field data collection went smoothly, a data dictionary was created using Trimble’s GPS
Pathfinder Office. Field data was collected over three days, and after each day of collection, was
post processed in GPS Pathfinder Office.
18
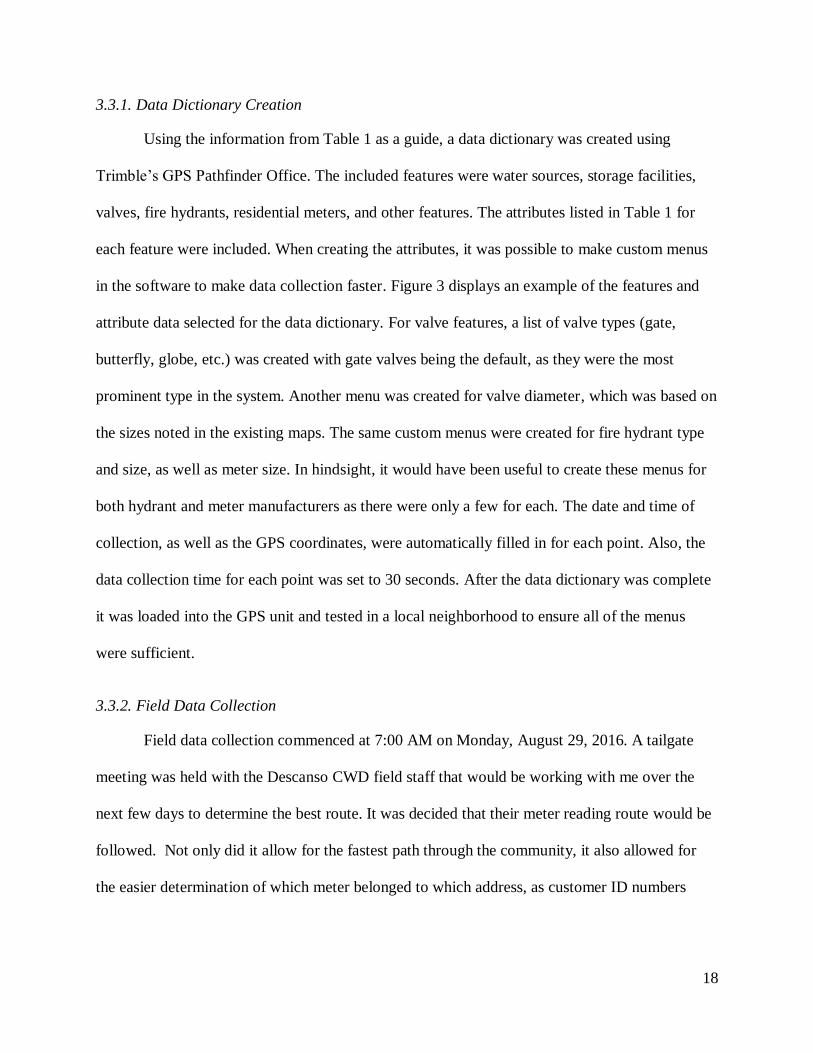
3.3.1. Data Dictionary Creation
Using the information from Table 1 as a guide, a data dictionary was created using
Trimble’s GPS Pathfinder Office. The included features were water sources, storage facilities,
valves, fire hydrants, residential meters, and other features. The attributes listed in Table 1 for
each feature were included. When creating the attributes, it was possible to make custom menus
in the software to make data collection faster. Figure 3 displays an example of the features and
attribute data selected for the data dictionary. For valve features, a list of valve types (gate,
butterfly, globe, etc.) was created with gate valves being the default, as they were the most
prominent type in the system. Another menu was created for valve diameter, which was based on
the sizes noted in the existing maps. The same custom menus were created for fire hydrant type
and size, as well as meter size. In hindsight, it would have been useful to create these menus for
both hydrant and meter manufacturers as there were only a few for each. The date and time of
collection, as well as the GPS coordinates, were automatically filled in for each point. Also, the
data collection time for each point was set to 30 seconds. After the data dictionary was complete
it was loaded into the GPS unit and tested in a local neighborhood to ensure all of the menus
were sufficient.
3.3.2. Field Data Collection
Field data collection commenced at 7:00 AM on Monday, August 29, 2016. A tailgate
meeting was held with the Descanso CWD field staff that would be working with me over the
next few days to determine the best route. It was decided that their meter reading route would be
followed. Not only did it allow for the fastest path through the community, it also allowed for
the easier determination of which meter belonged to which address, as customer ID numbers
19
were arranged in their database according to their meter reading schedule. This database was
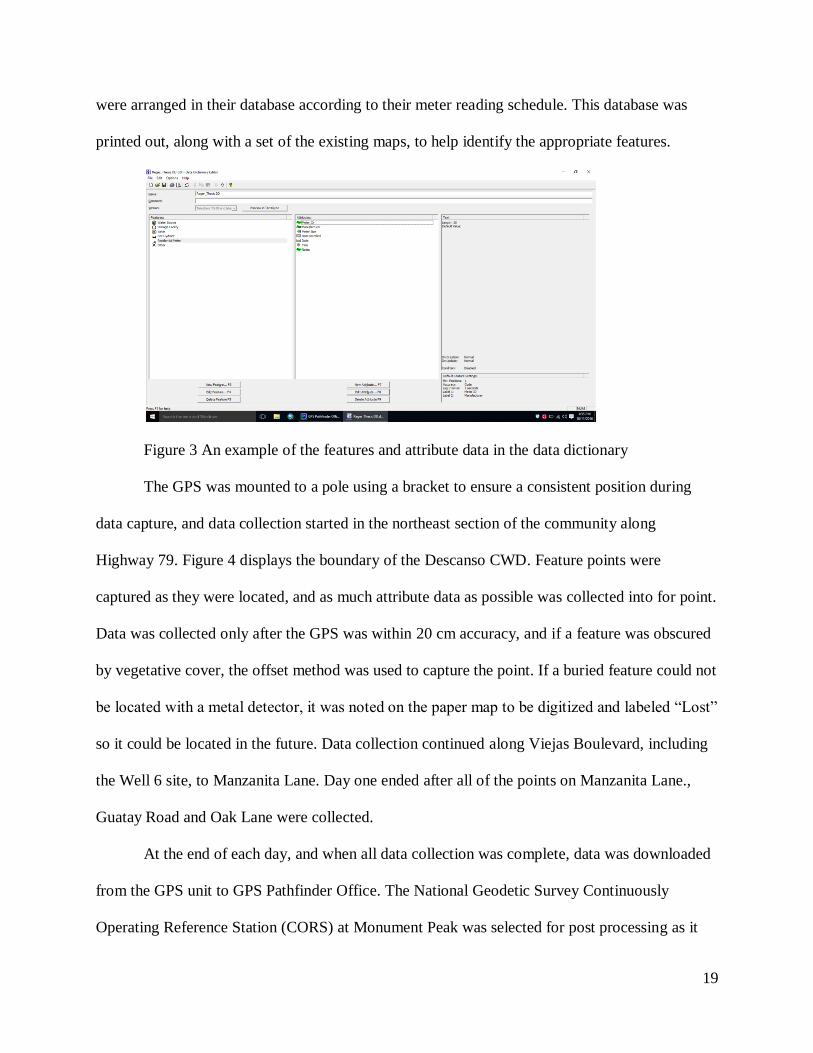
printed out, along with a set of the existing maps, to help identify the appropriate features.
Figure 3 An example of the features and attribute data in the data dictionary
The GPS was mounted to a pole using a bracket to ensure a consistent position during
data capture, and data collection started in the northeast section of the community along
Highway 79. Figure 4 displays the boundary of the Descanso CWD. Feature points were
captured as they were located, and as much attribute data as possible was collected into for point.
Data was collected only after the GPS was within 20 cm accuracy, and if a feature was obscured
by vegetative cover, the offset method was used to capture the point. If a buried feature could not
be located with a metal detector, it was noted on the paper map to be digitized and labeled “Lost”
so it could be located in the future. Data collection continued along Viejas Boulevard, including
the Well 6 site, to Manzanita Lane. Day one ended after all of the points on Manzanita Lane.,
Guatay Road and Oak Lane were collected.
At the end of each day, and when all data collection was complete, data was downloaded
from the GPS unit to GPS Pathfinder Office. The National Geodetic Survey Continuously
Operating Reference Station (CORS) at Monument Peak was selected for post processing as it
20
was the nearest station at 16 kilometers away. Although it was some distance away, it maintained
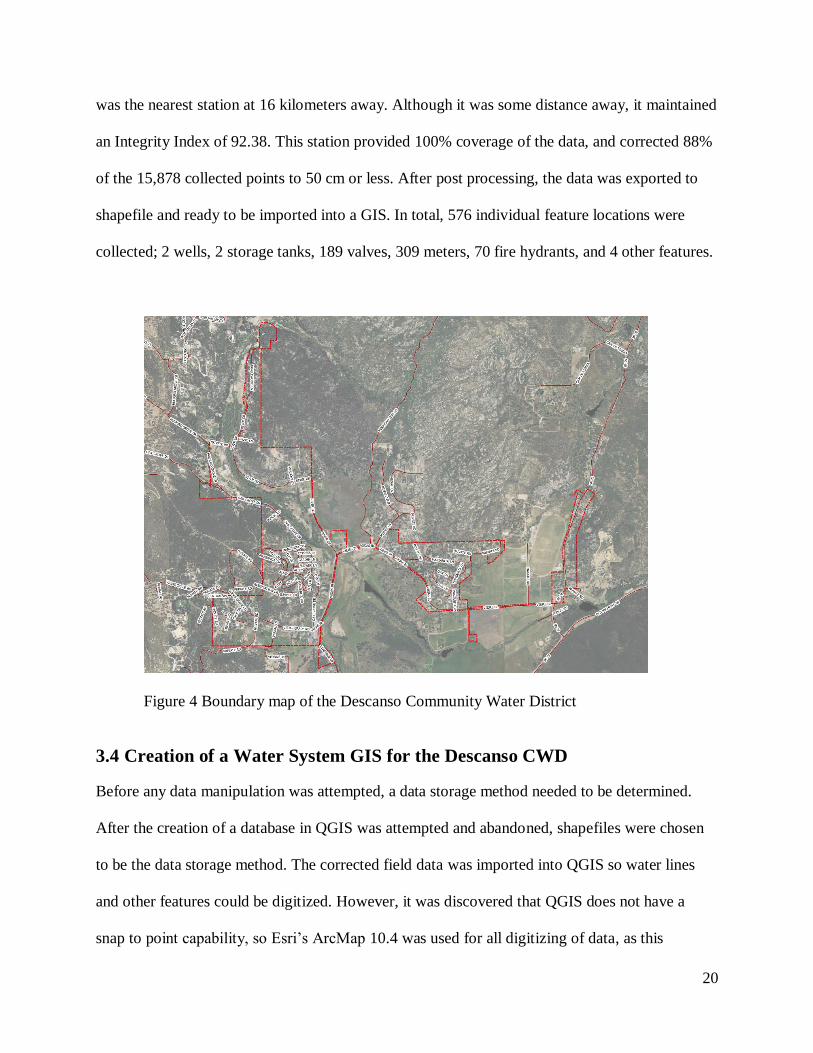
an Integrity Index of 92.38. This station provided 100% coverage of the data, and corrected 88%
of the 15,878 collected points to 50 cm or less. After post processing, the data was exported to
shapefile and ready to be imported into a GIS. In total, 576 individual feature locations were
collected; 2 wells, 2 storage tanks, 189 valves, 309 meters, 70 fire hydrants, and 4 other features.
Figure 4 Boundary map of the Descanso Community Water District
3.4 Creation of a Water System GIS for the Descanso CWD
Before any data manipulation was attempted, a data storage method needed to be determined.
After the creation of a database in QGIS was attempted and abandoned, shapefiles were chosen
to be the data storage method. The corrected field data was imported into QGIS so water lines
and other features could be digitized. However, it was discovered that QGIS does not have a
snap to point capability, so Esri’s ArcMap 10.4 was used for all digitizing of data, as this
21
software allowed for snapping to points. After all digitizing was completed a quality control
check was performed on all of the data to ensure that no points or lines were missed.
3.4.1. Use of Shapefiles Versus Geodatabase
In QGIS there are two primary methods of storing spatial data, Esri shapefiles and
databases, and for this thesis project, data will be stored in shapefiles. A shapefile is a storage
format created by Esri that stores the shape, location, and attribute data of a feature. This format
requires multiple file types to store all of the data. It is important to note that a database file for a
shapefile cannot exceed 2 gigabytes, so large datasets may not be saved in one shapefile (Esri
2016-2). QGIS utilizes a database plugin, an individual feature that can be added after the initial
software installation, that connects a user’s relational database to the GIS software, creating a
spatial database. Multiple rasters and vector features, including their shape, location, and
attribute data, can be stored within the database. Database options for QGIS are PostgreSQL,
PostGIS, and spatialite databases (QGIS 2013). All of these database software function similarly,
but require the user to be knowledgeable in the creation and management of relational databases,
as well as how to query these databases. Although a spatial database is a more efficient method
of storing spatial data, shapefiles are not inefficient and are a simpler method of storing data.
While most studies of implementation of GIS in utilities involve storing data in databases
(Rayburn, 2004; Lyon and Clifford 2008, Vega 2009, Crawford 2012, and Fellers 2013), these
were large entities with budgets available for in-house technicians or contractors. An attempt was
made to create a PostGIS database for the storage of this project’s data, but the implementation
required an extensive background in database management, so it was abandoned. A novice, such
as the Descanso CWD employee, would not be able to complete this task. So, for this project
22
shapefiles were used as the data storage method. The employee from Descanso CWD that was
trained to maintain the GIS was not a GIS or database professional, so simplicity is paramount.
3.4.2. Background Data
Background data was collected before any data manipulation commenced. There are
many potential sources for background imagery, either through QGIS or from online
repositories. In QGIS, Open Street Map, Google imagery, and Bing imagery are available
through the “OpenLayers” plugin. However, the Bing and Google imagery could not be printed
due to copyright restrictions and the Open Street Map imagery was not an aerial. The State of
California hosts the USDA National Agriculture Imagery Program (NAIP) data, which provides
one meter resolution aerial imagery (Farm Services Administration 2016). Each county image is
broken up into quadrangles, which can be downloaded individually. The appropriate quadrangles
from 2014 were identified and downloaded, imported into QGIS, and merged into one raster file
(CalAtlas 2016 - 1).
Other datasets were also sourced to provide further background information, such as the
Descanso CWD service boundary, parcel information, and road locations. The service boundary
was sourced from the CalAtlas geoportal (CalAtlas 2016 - 2), and the parcel and road datasets
were obtained from the SanGIS/SANDAG GIS Data Warehouse and imported into QGIS
(SANDAG, 2016)
3.4.3. Digitizing Data
It was intended that QGIS version 2.16 would be used to perform all of the GIS work for
this project. It was selected because it is user-friendly, has a well-made and easy to follow
tutorial, and is free. This software was thought to have the ability to create and modify all of the
necessary vector features and attributes that were created during this project as well as produce
23
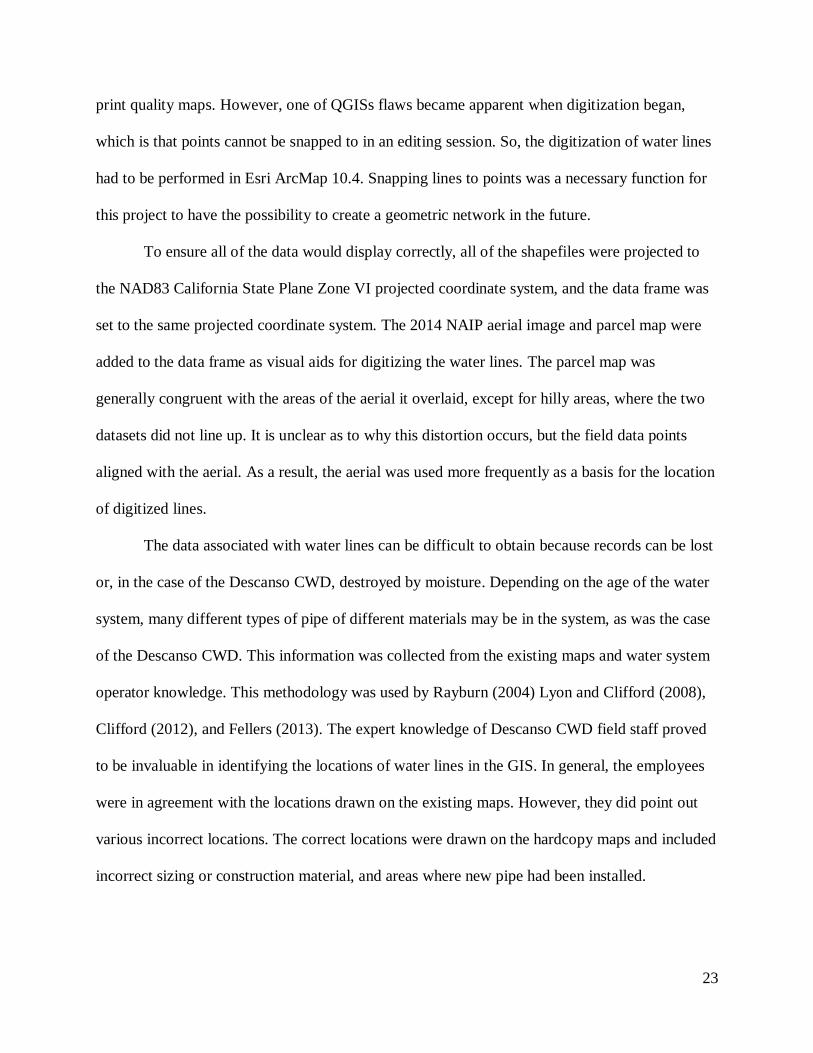
print quality maps. However, one of QGISs flaws became apparent when digitization began,
which is that points cannot be snapped to in an editing session. So, the digitization of water lines
had to be performed in Esri ArcMap 10.4. Snapping lines to points was a necessary function for
this project to have the possibility to create a geometric network in the future.
To ensure all of the data would display correctly, all of the shapefiles were projected to
the NAD83 California State Plane Zone VI projected coordinate system, and the data frame was
set to the same projected coordinate system. The 2014 NAIP aerial image and parcel map were
added to the data frame as visual aids for digitizing the water lines. The parcel map was
generally congruent with the areas of the aerial it overlaid, except for hilly areas, where the two
datasets did not line up. It is unclear as to why this distortion occurs, but the field data points
aligned with the aerial. As a result, the aerial was used more frequently as a basis for the location
of digitized lines.
The data associated with water lines can be difficult to obtain because records can be lost
or, in the case of the Descanso CWD, destroyed by moisture. Depending on the age of the water
system, many different types of pipe of different materials may be in the system, as was the case
of the Descanso CWD. This information was collected from the existing maps and water system
operator knowledge. This methodology was used by Rayburn (2004) Lyon and Clifford (2008),
Clifford (2012), and Fellers (2013). The expert knowledge of Descanso CWD field staff proved
to be invaluable in identifying the locations of water lines in the GIS. In general, the employees
were in agreement with the locations drawn on the existing maps. However, they did point out
various incorrect locations. The correct locations were drawn on the hardcopy maps and included
incorrect sizing or construction material, and areas where new pipe had been installed.
24
There are three types of water distribution systems: looped, grid, and branched. Looped
and grid systems are the optimal layouts as they provide better water flow for fire protection and
minimize dead-end lines. Branched systems are not optimal as they result in dead-ends on every
line, which can result in bacteriological, taster, and odor problems. Frequent flushing of these
dead-ends is required to minimize these problems, which results in extra work for system
employees and wasted water. The Descanso CWD is a combination of a looped and branched
system, where the large mains are looped and the laterals running to service connections are
branched.
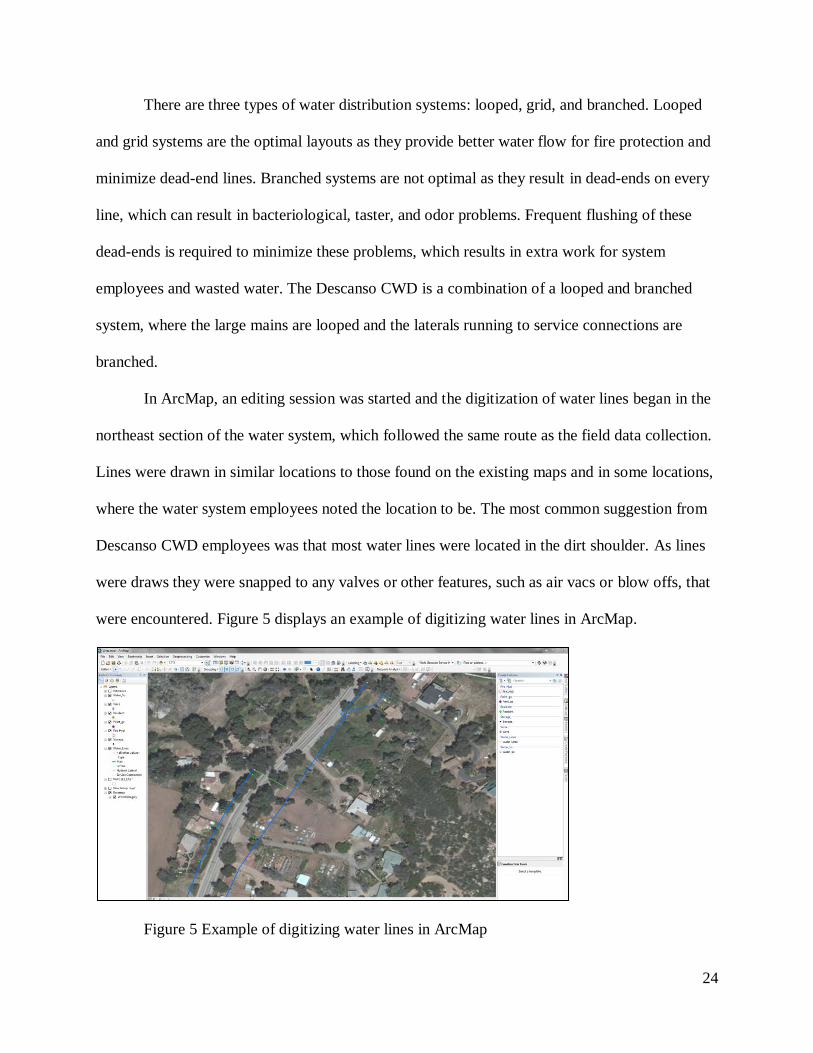
In ArcMap, an editing session was started and the digitization of water lines began in the
northeast section of the water system, which followed the same route as the field data collection.
Lines were drawn in similar locations to those found on the existing maps and in some locations,
where the water system employees noted the location to be. The most common suggestion from
Descanso CWD employees was that most water lines were located in the dirt shoulder. As lines
were draws they were snapped to any valves or other features, such as air vacs or blow offs, that
were encountered. Figure 5 displays an example of digitizing water lines in ArcMap.
Figure 5 Example of digitizing water lines in ArcMap
25
The attributes for water line features follow those in Table 1. Water line segments were
digitized by size, type, and construction material. After a line segment was digitized the size was
input as well as the type and construction material. The ‘Type’ attribute was broken down into 5
different water line types: main, high line, lateral, hydrant lateral, and service connection. Main
lines are the larger lines (6” – 8”) that run down the main streets in the water system and provide
the bulk water flow. A high line is a temporary main that runs above ground and provides water
flow during construction. Laterals are smaller lines (2” – 4”) than the mains that serve as arteries
to the service connections. Hydrant laterals are water lines, usually the same size as the fire
hydrant, that connect fire hydrants and their control valves to mains or laterals. Service
connections are small water lines (1/2” – 1”) that connect mains, laterals, or hydrant laterals to
residential water meters. Water lines were also classified by construction material, such as iron,
steel, asbestos concrete, and PVC. In total, 477 water line segments were digitized; 54 mains, 1
high line, 51 laterals, 63 hydrant laterals, and 308 service connections.
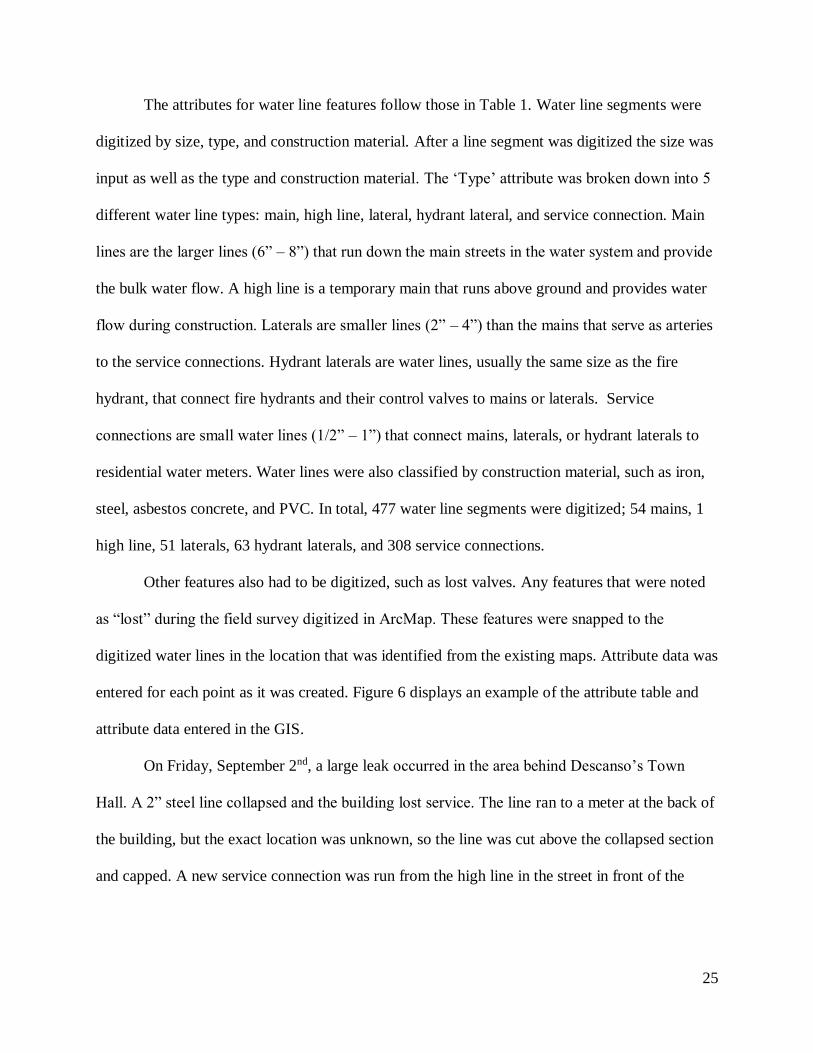
Other features also had to be digitized, such as lost valves. Any features that were noted
as “lost” during the field survey digitized in ArcMap. These features were snapped to the
digitized water lines in the location that was identified from the existing maps. Attribute data was
entered for each point as it was created. Figure 6 displays an example of the attribute table and
attribute data entered in the GIS.
On Friday, September 2nd, a large leak occurred in the area behind Descanso’s Town
Hall. A 2” steel line collapsed and the building lost service. The line ran to a meter at the back of
the building, but the exact location was unknown, so the line was cut above the collapsed section
and capped. A new service connection was run from the high line in the street in front of the
26
Town Hall to a new water meter at the curb. The exact location of the service connection and
meter were unknown, but were digitized based off of modified drawings of the existing maps.
Figure 6 An example of attribute data entered into GIS
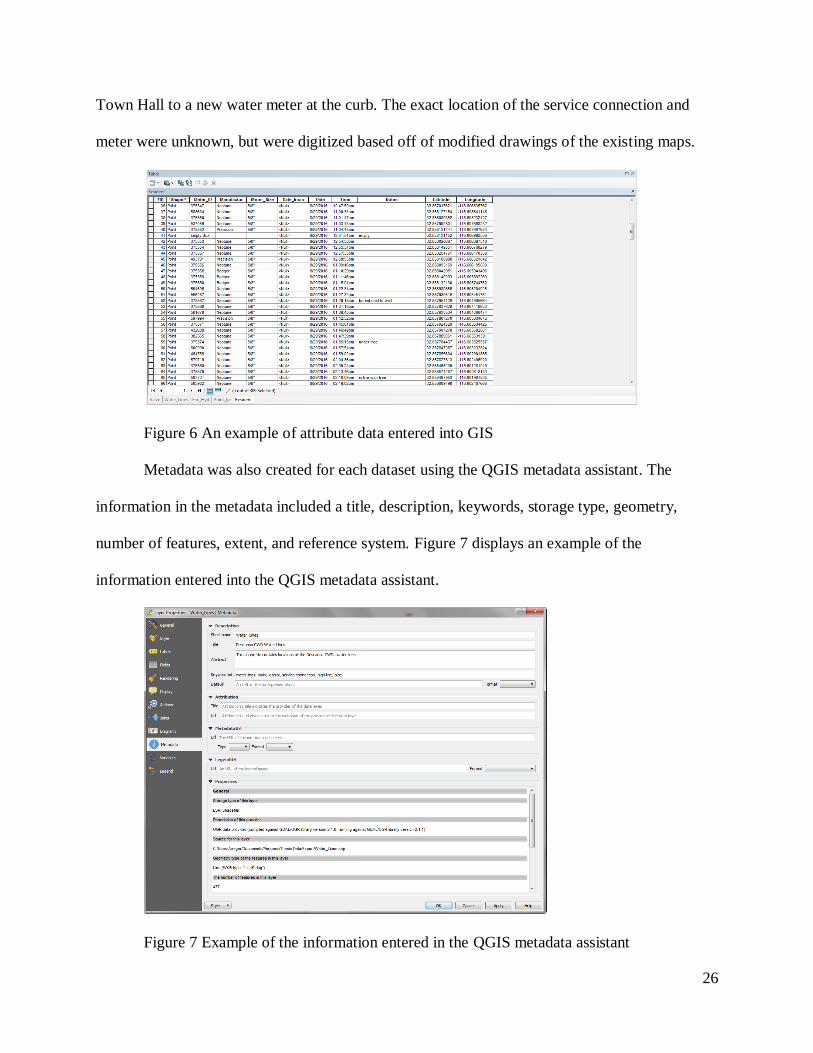
Metadata was also created for each dataset using the QGIS metadata assistant. The
information in the metadata included a title, description, keywords, storage type, geometry,
number of features, extent, and reference system. Figure 7 displays an example of the
information entered into the QGIS metadata assistant.
Figure 7 Example of the information entered in the QGIS metadata assistant
27
3.5 Map Output
After the features and associated attribute data were collected and post processed, a data
storage method was selected, and water lines had been digitized, maps were created. Two types
of maps were created for the Descanso CWD using the background, collected, and digitized data
described above. A large scale atlas comprised of twenty-three 11” x 17” pages was created to
allow the field staff to easily identify individual system components. A single page 3’ x 5’ map
was also created to be hung on the CWD’s office wall. This is a common practice in water
systems as it allows for daily planning of work activities and is an excellent quick reference map.
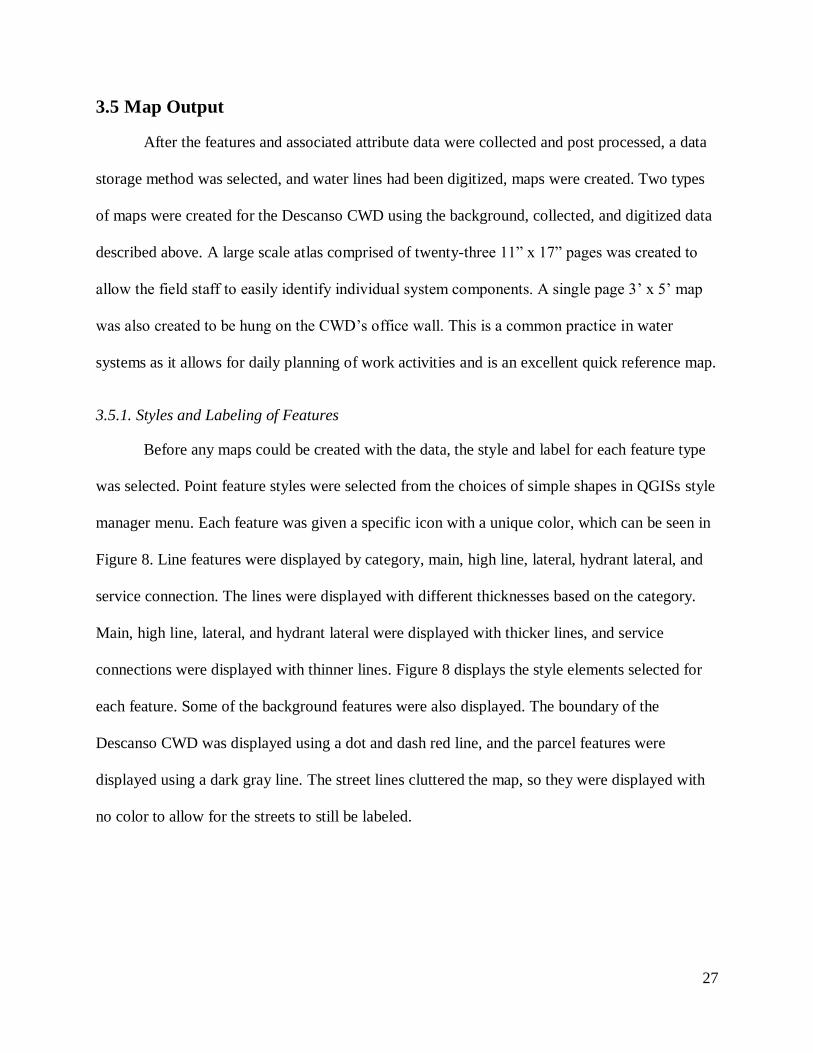
3.5.1. Styles and Labeling of Features
Before any maps could be created with the data, the style and label for each feature type
was selected. Point feature styles were selected from the choices of simple shapes in QGISs style
manager menu. Each feature was given a specific icon with a unique color, which can be seen in
Figure 8. Line features were displayed by category, main, high line, lateral, hydrant lateral, and
service connection. The lines were displayed with different thicknesses based on the category.
Main, high line, lateral, and hydrant lateral were displayed with thicker lines, and service
connections were displayed with thinner lines. Figure 8 displays the style elements selected for
each feature. Some of the background features were also displayed. The boundary of the
Descanso CWD was displayed using a dot and dash red line, and the parcel features were
displayed using a dark gray line. The street lines cluttered the map, so they were displayed with
no color to allow for the streets to still be labeled.
28
Figure 8 Style elements for each feature
The Descanso CWD requested that each feature be labeled for easy identification in the
field. Because some features were spaced so tightly together, small fonts had to be used to ensure
their placement. The point features were displayed using a six-point font and were placed around
the point with a 1.5 millimeter offset. The line feature labels were also displayed using a six-
point font, but were placed on the line. To make each label more easily identifiable over the
aerial imagery, all of the labels were created using a white halo.
The text used for the labels was derived from the attribute data. Some of the feature
labels only required information from one column of attribute data, while others required several.
The well features were labeled using the ‘Source _ID’ data, the storage tank features were
labeled using the ‘Facility_ID” data, the meter features were labeled using the ‘Meter_ID” data,
the other features were labeled using the ‘Comment” data, and the road features were labeled
using ‘RD20FULL’ data. The valve features were labeled using the expression “Valve_ID || '\n'
|| "Valve_Diam" || "Valve_Type"” so the identification number, diameter, and type would all be
displayed. Hydrants were labeled using the expression “Hydrant_ID || '\n' || "Hydrant_Size" ||
"Hydrant_Type"” to the identification number, size, and type would all be displayed. The water
line features were labeled using the expression “Size || Material” so size and construction
material would be displayed. The parcel features were labeled using the conditional expression

29
“if( ADDRNO > 0, ADDRNO, " ")” so that parcels with no address numbers, which have a ‘0’
entered in the attribute table, would not be displayed.
3.5.2. Atlas
The purpose of an atlas is to break up a large area into smaller, more detailed maps. This
is a multi-step process in QGIS. A grid that overlays the area of interest must first be made. This
grid will be used to generate the detail maps, one map for every feature in the grid. The grid was
created in the QGIS map view by selecting the ‘Vector Grid’ function under ‘Vector > Research
Tools’. The grid extent was based on the ‘Boundary’ shapefile and all of the defaults were
accepted. The output was a 28 square grid, however, five of the points contained no features, so
they were deleted. Figure 9 displays the grid used for the creation of the atlas. These boxes were
then numbered sequentially in the data attribute table.
Figure 9 Final grid used for atlas creation
In QGIS, creating a printable map is done in a ‘Print Composer’ window. A new
composer was created and given a name, in this case ‘Atlas’. The page size was determined
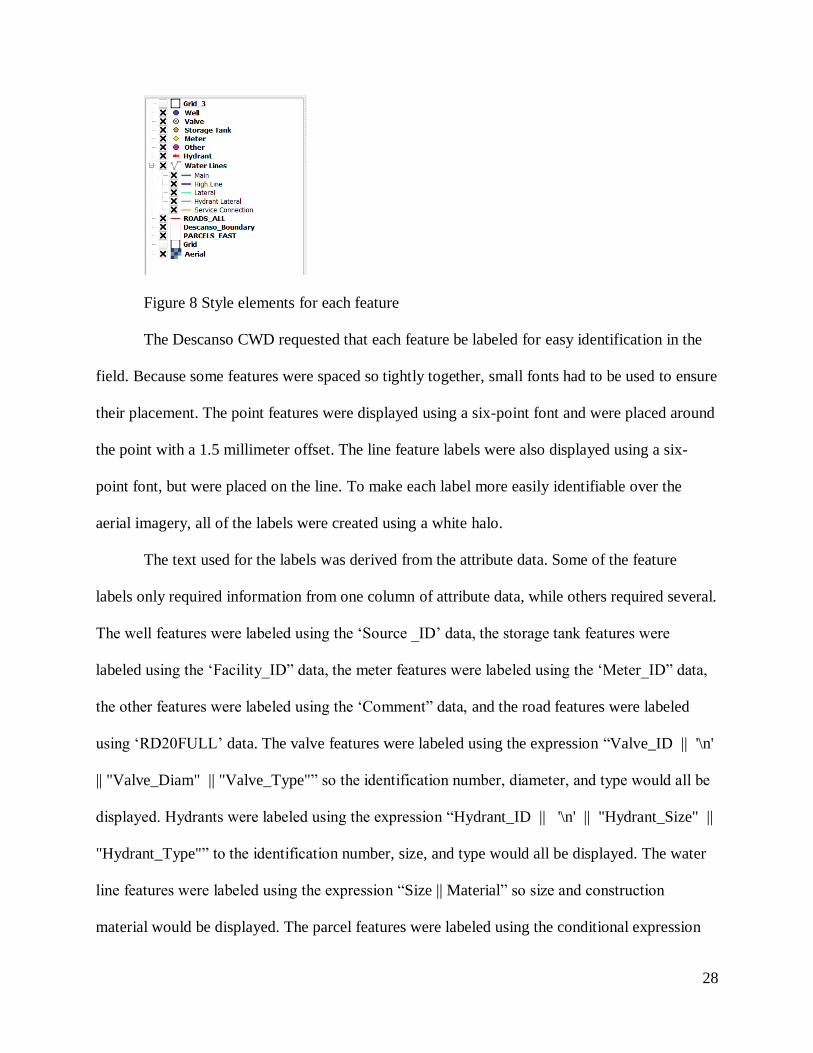
30
before any components were added to the composer. The Descanso CWD wanted the maps
printed on 11” x 17” paper to be large enough to read in the field. Paper size was selected in the
‘Composition’ tab and the orientation was set to landscape. The first component added to the
composer was the map. The ‘Grids for Atlas’ plug-in allows for the creation of grid layers that
can cover the extent of the coverage layer (Chaussat 2015), and by selecting the ‘Snap to Grid’
setting in ‘View’ the map was snapped to a point in the upper left corner and sized to fit the
page. The map only took up two-thirds of the page to allow space for the other map components.
In order for the atlas to be created, ‘Controlled by Atlas’ was checked in the ‘Item Properties’
tab, and the margins around each feature was set to 10%. This created a 10% overlap between
each map page. Under the ‘Atlas Generation’ tab, the grid created before was selected as the
‘Coverage Layer’ and it was set as a ‘Hidden Coverage Layer’. The ‘Page Name’ was set to the
‘Page’ column of the grid’s attribute table, which allowed for each atlas page to have a
corresponding page number. Figure 10 displays the selected settings in the ‘Atlas Generation’
tab.
Figure 10 Selected settings on the ‘Atlas Generation’ tab
31
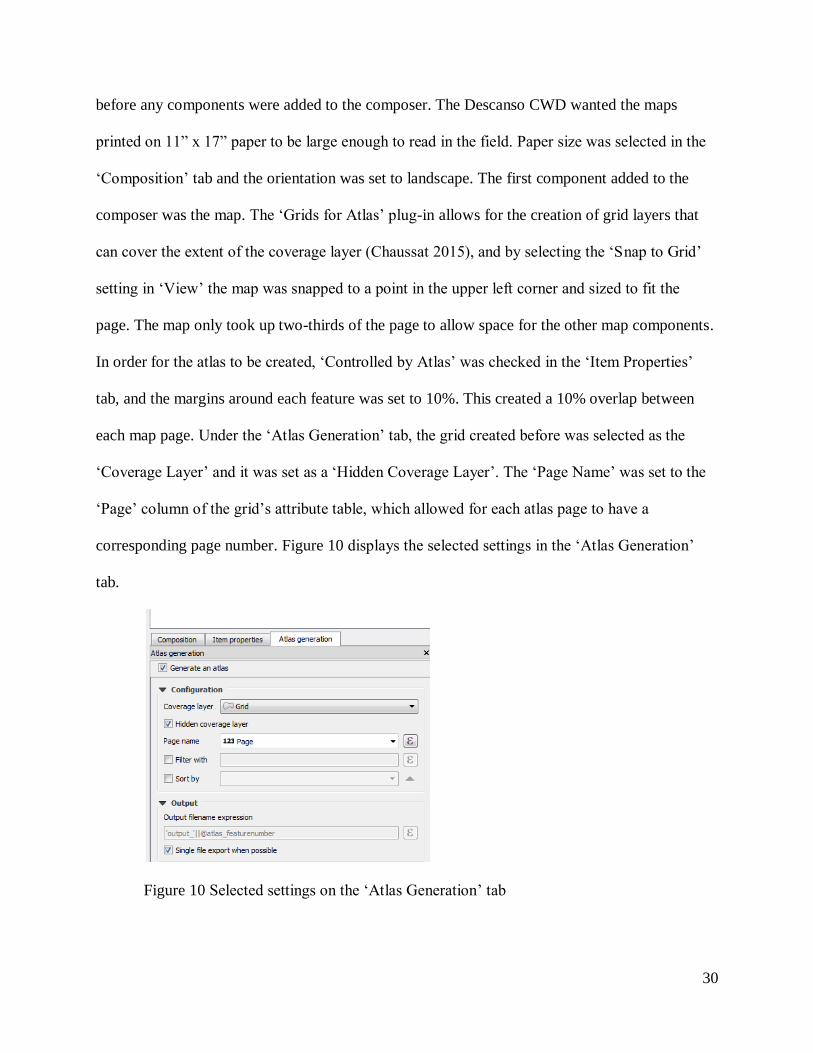
Before the atlas was created, all of the required map components were placed on the map
canvas. This included a title, legend, scale bar, north arrow, source data and author text, page
number, neat line, and inset map. The inset map was created to act as a reference to what atlas
page was being viewed. In the ‘Item Properties’ tab, under ‘Overviews’, a new overview was
created and the defaults were accepted. This created a colored box in the inset map that would
correspond to the atlas page being viewed. Figure 11 displays the inset map containing the grid
with the overview box.
After the map components were placed in their optimal locations, the ‘Preview Atlas’
button was selected to ensure that all of the grid placement was appropriate and the overview box
moved to the correct corresponding grid. The final step was to export the atlas, which could be
saved as individual images, or a single .pdf file. The Descanso CWD requested a .pdf file, so that
method was selected, which resulted in twenty-three atlas pages in one .pdf file.
Figure 11 The inset map with grid and overview box
The atlas was presented to the staff of the Descanso CWD who looked it over to see if
any changes were necessary. They decided that only names, no lines, were needed for the street
layer as it crowded the map. The change was made in the map window, and the main map was
32
updated in the print composer by selecting ‘Update Preview’ in the ‘Item Properties’ tab. The
atlas was then exported again as a final product and sent to the Descanso CWD.
3.5.3. Wall Map
The Descanso CWD also requested one 3’x 5’ small scale map be created to hang on its
office wall to use as a reference map. This map was created in QGIS using methods similar to
those used to create the atlas. A new print composer was created and labeled ‘Atlas’. The page
size was set to 3’x 5’ in landscape orientation. A new map window was added to the composer
window and set to fit the entire window using the snap to grid function. The layers included in
the map were the system boundary, streets, water sources, storage facilities, valves, hydrants,
meters, water lines, and other features.
The necessary map components were added to the composer window, including a title,
legend, scale bar, north arrow, source data and author text, and neat line. Each component was
optimally located so as not to obscure the data. The map was exported as a .pdf file, as requested
by the Descanso CWD, and presented to the employees for approval. The map was approved, so
no changes were required.
3.6 Employee GIS Training
One of the goals of this project was to have a Descanso CWD employee learn how to use
the QGIS software to update and/or create new datasets for the CWS in house. Travis Creamer
volunteered to complete chapters one through six of the QGIS Training Manual (QGIS 2016).
Table 2 displays the chapter topics covered in the training manual.
33
Table 2 Chapters and topics of the QGIS Training Manual
Chapter Topic
One Course Introduction
Two The Interface
Three Creating a Basic Map
Four Classifying Vector Data
Five Creating Maps
Six Creating Vector Data
3.7 Time Accounting
A result of this case study was to create a generalized workflow for the implementation
of a GIS in other communities that can be used by other GIS professionals in the water industry.
In order to determine how long future projects may take, the time needed to complete this project
was documented. This will allow for the extrapolation of time to determine how long similar
projects would take for larger or smaller systems. The user needs assessment took three hours,
and examining the existing maps and creating the data dictionary took six hours. Field data
collection spanned three days. Each field day was comprised of nine hours surveying and one
hour validating the data. Importing, correcting, and exporting the data took two hours. Sourcing
and preparing the background data took four hours. Data digitization took 3 days, with each day
lasting eight hours, and map making took four hours. Final edits to the maps took 2 hours. In all,
this case study took 75 hours to complete.
This accounting of time will be used to gauge the length of time needed for future GIS
implementations at small CWDs. However, this case study was a best-case scenario. The
Descanso CWD had existing maps that were relatively accurate and new compared to other
CWSs. Also, the field staff of the Descanso CWD were extremely knowledgeable about their
system layout and features. Other potential project systems may not have any existing maps or a
good working knowledge of the system, and may take longer to complete.
34
Chapter 4 Generalized Workflow for Creating a Community Water System
GIS
Many community water systems (CWSs) rely on outdated maps of their infrastructure or have no
maps at all. These systems would benefit the greatest from low cost GIS solutions, however they
may not know the steps necessary to complete this themselves. The purpose of this workflow is
to provide a framework for creating a GIS for these systems. This workflow describes the steps
necessary to implement a low-cost GIS: user needs assessment, source data evaluation, field data
collection, implementing a GIS, and map production. The intended audience for this workflow is
water professionals working in or for small CWSs that may or may not have a background in
GIS.
4.1 User Needs Assessment
To determine what data will be collected and how it will be displayed, a discussion must
be had with all of the parties of the CWS involved in the GIS. Shamsi (2005) identified eight
steps to this user needs assessment: identify stakeholders, talk to stakeholders, inventory
resources, establish need priorities, create system design, create pilot test, prepare an
implementation plan, and conduct the final presentation. Depending on the size of the system,
not all of these steps may be necessary. For most small water systems, the most important steps
would be to talk to the stakeholders to establish need priorities, inventory resources, and create a
system design.
During the user needs assessment meeting, many questions will need to be answered in
order to design an appropriate GIS. Every aspect of the project must be determined before it
begins to ensure a smooth implementation. First, who will perform all of the work must be
determined, whether it is will be in-house or outsourced. Next, any existing maps or spatial data

35
needs to be located and examined to determine the depth of the project. Examining the maps, or
if a CWS has no maps, speaking to an employee who knows the system well, will help determine
what features and attribute data will be collected and imported into the GIS. Field data collection
methods, including the accuracy of the GPS, will be determined. GIS software choice, and who
will perform the work is of vast importance. The choice between proprietary and open source
GIS software can be a difficult one as it severely impacts the budget of the project. This choice
also impacts how the data is stored. After these decisions have been made, what data will need to
be digitized can be determined, as well as what types of maps the CWS wants.
4.2 Source Data Evaluation
In order to accurately locate and identify the underground features in a CWS, any
existing maps and the expert knowledge of field staff need to be evaluated. Four possible
scenarios exist when it comes to evaluating a CWSs existing data. A CWS may have no existing
maps or spatial data, and may rely solely on the memory of the system employees to locate the
various underground features. The second scenario is that a CWS has old paper maps that do not
reflect all of the underground features currently in the system. The third scenario is that a CWS
has newer maps but no spatial data. The final scenario is that a CWS has paper maps and spatial
data that need to be updated.
The most difficult scenario for both field data collection and data digitizing will be when
a system has no existing maps. Field data collection planning will have to rely on discussions
with the CWS field staff to dictate the locations of the underground features. The field staff will
also have to accompany the surveyor to aid in the location and identification of the features. Aid
from system employees will also be needed in the identification of the attribute data of each
36
feature. A suggestion would be to have the CWS field staff draw a map identifying the locations
of the underground features and include any attribute data they may want to include.
Data collection and digitization will also be difficult when a system has maps that are old
and do not reflect updates to the system. Field data collection planning will rely on a
combination of locating features on the existing maps as well as having field staff identify and
updates to the system on the maps. Attribute data should be identified by field staff and included
on the maps, which will allow for the GIS specialist to digitize data independently. If this step is
omitted, then data digitization will most likely need to involve the aid of CWS field staff.
Both field data collection and digitization will be less difficult when a CWS has maps
that reflect updates to the system, as was the case with the Descanso CWD. Field data collection
planning could solely be completed by examining the existing maps, but including the CWS staff
in the identification of features is still recommended. GIS digitization could also be completed
without the help of CWS staff, but including them is recommended.
The final, and not necessarily best case, scenario is when a CWS has both updated maps
as well as spatial data for the features in their system. The metadata of spatial data needs to be
looked through first to identify when it was created and at what accuracy, as the steps necessary
to complete the project are dependent on them. If the accuracy is sufficient for the CWS, then
surveying digitizing only the updated parts of the system could be a solution. If the accuracy is
not sufficient, then a full system survey, followed by digitizing all of the water lines, may be
necessary. If no metadata is included with the spatial data, then it would not be recommended to
use the data.
37
4.3 Field Data Collection
The majority of data needed for a GIS implementation will be collected in the field, so a
GPS unit will be used to collect the data. For projects with a modest budget, higher accuracy
GPS units can be used to collect data, although sub-centimeter accuracies are not necessary in
water asset management due to the lack of emphasis on exact elevation (Rayburn, 2004). A low
accuracy recreational unit can be used to collect GPS locations to keep costs low, but the best
accuracy that can be achieved with these units is nine feet. This will most likely not be sufficient
for water system data collection.
A high accuracy GPS unit could be purchased; however, these units can be very
expensive. A Trimble Geo Series GPS unit could be rented for $540 per week from Duncan
Parnell (2016) to keep the budget low while maintaining high accuracy. This unit has a 10 cm
accuracy that will allow for accurate locations at about the same cost as a high-end Garmin
handheld unit that only achieves 9 ft. accuracy. Although 10 cm accuracy is not necessary for all
aspects of the survey, in certain locations of a water system, like T intersections where valves are
clustered, a high accuracy GPS allows for high resolution data.
A high accuracy unit is also recommended because they can record both spatial and
attribute data at the same time. This is done through the use of data dictionaries, which are
created using special software included with the GPS unit. Trimble’s GPS Pathfinder Office
allows a user to create data dictionaries that contain features and attribute data. When imported
into the GPS unit, the user can select which type of feature point is being collected as well as any
attribute data for each point.
Before data collection begins, talk through the process with the CWSs field staff, as they
know the system best. If possible, follow the staff’s meter reading route, as this is usually the
38
fastest route through the system. If this is not possible, use mapping software (Google Maps,
Bing Maps, etc.) to plan out the field data collection route.
What GPS type is selected will determine how data is collected. If a recreational GPS
unit is used, a field notebook should be used to record the data, including latitude, longitude, and
any attribute data associated with each point. If a high-end unit is selected, then the data will be
stored in the unit and exported later. When collecting data with a recreational unit, ensure the
WAAS option is selected, and allow the GPS to sit in a stationary location to obtain the most
accurate reading. If a high-end unit is being used, a location collection timer can be set so that
locations can be collected every second for a specified amount of time. In water applications, 30
seconds is sufficient. If possible, mount the GPS unit to a pole to help maintain an accurate
position, and remember to position the unit over the feature when collecting data. How features
are collected should also be determined before commencing field data collection. Regardless of
what type of GPS unit is being used, it is recommended that feature locations be recorded as they
are encountered to optimize the data collection time.
After each day of data collection, it is a good practice to import the data from the high-
end GPS units to a computer. This is to ensure that the day’s data has been saved if there is any
failure of the GPS unit’s memory. Depending on the manufacturer, the data may be able to be
post-processed to improve its accuracy. Trimble’s GPS Pathfinder Office allows the user to post-
process the data using known local reference stations. Once post processed, the data must be
converted to a file type that is usable in a GIS, such as a shapefile or geodatabase.
4.4 Design and Implementation of a Water System GIS
Choosing the GIS software that will be used for digitizing data and creating maps should
be the priority for this part of the project. The requirements set by the CWD during the user

39
needs assessment will dictate what software will be used. The field collected data can be
imported into the GIS and water lines, and any data not able to be collected during the survey,
can be digitized. The appropriate attribute data should be entered while data is being digitized.
All of the data should then be put through a quality assurance process to ensure the validity of
the data.
4.4.1. Selecting GIS Software
The task of selecting a GIS software package to use for the implementation is not a
simple one. Several factors need to be taken into account during the selection process, including
cost, usability, technical support, and the intended use. There are several choices for each type of
software, such as QGIS, GRASS GIS, and gvSIG for open source software, and Esri and
MapInfo for proprietary software.
The most obvious, but not necessarily most important, factor is the cost of the software.
Open source software is free to the end user, and proprietary software must be purchased. As of
this writing, Esri’s ArcGIS for Desktop costs $1,500 for the basic software. However, if a CWS
is a 501c3 non-profit company, Esri has a program that offers the software free of charge, and
only charges an administration fee to the company. In many cases, companies that have chosen
to adopt an open source software package do so because they believe it is superior to the
proprietary options. To these companies, cost is a secondary factor (Optimus Information 2015).
Generally, the intended user of open source software is someone with a strong computer
background that has a knowledge of code writing (Optimus Information 2015). This may limit
the number of CWSs that would use open source as they may not have a full-time technology
professional on staff. Proprietary software companies, such as Esri or MapInfo, create software
40
for users of all levels that do not require knowledge of coding, although it may help. Usability
may play a limiting role in the selection of open source GIS software for some CWSs.
The availability of technical support may also play a limiting role in using open source
software in a CWS. These software producers are seen as more of a community than a company.
So, technical support is usually provided through user forums, blogs, and wikis (Backaitis 2013).
A user may get the help they need, but most likely in a longer timeframe. Proprietary software
companies generally have a much more robust technical support capability, as their customers
have to pay a fee for the product (Optimus Information 2015). An excellent example of this is
Esri’s technical support network. Consumers have the ability to call a technical support line or
chat via text during normal business hours, or for an extra fee, twenty-four hours a day, seven
days a week, all year round.
What may be the most important factor in determining which software type to choose is
what ultimate goal the CWS wants to achieve. If the CWS is only interested in creating a basic
GIS database and design maps for printing, then open source software may be sufficient.
However, if CWS intends wants to create a robust database for utility network flow analysis or
incorporate their GIS into an asset management program they would need to choose a proprietary
software package.
4.4.2. Digitizing Data
Any data that was not collected in the field but is required to be in the GIS needs to be
digitized using GIS software. Which particular data this includes will be decided in the needs
assessment. There are various methods of data digitization, but for small systems heads-up
digitizing and freehand drawing seem to be sufficient.
41
Heads-up digitizing is commonly known as rubber sheeting. This method of digitizing
relies on a scanned image of the area being digitized. This image is lined up over the area of
interest, the method of which varies by software, and the features are traced in an edit session
and saved to the GIS. Freehand drawing is as exactly as it sounds: features are drawn in a GIS
software using a map as a visual reference or from memory. This method benefits greatly from
an accurate and up to date background image and help from the water system.
When digitizing data, it is important to create data that can be used for other purposes
than map making. When drawing lines or locating point features, it is important to snap, or
connect, the features being digitized to existing features. For example, when digitizing water
lines, a node of that drawn feature should be connected, or snapped, to in-line valves or hydrants.
Similarly, any digitized valves or hydrants should be snapped to water lines in their correct
location. This creates a continuous water system, which would allow the data to be used to create
a GIS utility network in the future.
One of the greatest benefits of using a GIS is the ability to store attribute data with spatial
features. Any type of spatial data storage method, whether it is a shapefile or geodatabase, allows
the user to store attribute data. Some of this data was collected during the field data collection.
During digitization, this data should also be collected and entered when a new feature is created.
It is recommended that the attribute table for the data being digitized be open during an editing
session so that the attribute data can be entered when the feature is created. This limits any
possible error that may occur from entering the data at a later point.
After all of the data is entered, it is good practice to perform some type of quality
assurance or quality control check of the data. If the dataset size is small, all of the data could be
checked. If the dataset is large, then checking a random sample may be sufficient. This check is
42
done to ensure that the entered data is correct and free from errors. A simple quality control
check for hydrants is to compare the number of hydrant entries in that dataset’s attribute table to
the number of entries of hydrant laterals in that dataset’s attribute table. The same can be done
for meters and service connections. If a further check is required, then a topology can be run.
How a topology is carried out varies by GIS software, but the basics are the same. A set of rules
are created for individual data types, such as all points must be snapped to a line. These rules are
tested on each feature in the GIS, and errors are tabulated, which the user can go through
individually and correct.
It is also good practice to include metadata for each dataset. Metadata provides future
users all of the basic information about a dataset, such as when the data was created, who created
the data, how the data was created, what format the data is in, and what the data is. There are
standards by which to create metadata, such as the Content Standard for Digital Geospatial
Metadata (CSDGM) or the International Standards Organization (ISO) geographic metadata
standard (19115). Which standard to select should be determined during the needs assessment.
How this data is entered is dependent upon the GIS software, as each has their own methods.
4.5 Design of Map Output Products
To create a print quality map, several key map elements must be considered and
implemented appropriately. These map elements include the frame and neat line, mapped area,
inset map, title and subtitle, legend, data source, authorship, scale, and north arrow. There is an
art to making all of these elements work together in a map, and it takes practice in order to do so.
Typography must also be implemented properly to ensure a quality map. This includes selecting
the proper typeface, type size, word spacing, and word orientation. After these elements are
determined, maps can be created to the CWSs specifications.
43
4.5.1. Map Elements
The first map element added is the mapped area, which will be sized as large as possible
without cramping the other map elements. Thematic symbols, such as water lines, valves, and
hydrants should be centered in the mapped area, and base data should be easily identifiable, but
not have as much visual weight as the thematic symbols. This can be accomplished by adjusting
the transparency of the symbol or using lighter colors in the symbolism.
If an inset, a smaller map that represents a smaller scale view of the project area, is
required, it should be added so as not to cover any of the necessary thematic symbols. An inset is
a useful method to display a city in a state, a neighborhood in a city, or, in the case of an atlas,
which section of the atlas a page represents.
The title should succinctly identify the theme of the map, and if needed, the subtitle
should identify the geographic region and date. Neither of these elements should cover any of the
thematic symbols, but should be placed to catch the reader’s eye. The placement of the legend
follows the same map element guidelines. The legend contains definitions of the thematic
symbols used in the map, and may contain base data at the user’s discretion. The legend’s
placement and size should make it easily visible, but no so much that it draws the reader’s eye
from the map.
The data source displays where the thematic data were obtained. It should be formatted in
a similar format to a bibliographic reference, but, as often is the case, it can be much more
concise. This data can often be combined into the same text box as the authorship information,
which includes the name of the author and the date that the map was created.
Two elements that are also usually found together are the scale bar and north arrow. The
scale bar represents a ruler that can be used to measure distances on a map and the north arrow
indicates to the reader which direction is north on the page. In every GIS software, there are
44
many choices for both elements. Regardless of the selected style, both elements should be sized
appropriately and placed out of the way so as not to attract undue attention.
The final map element added is the frame line as it establishes the available space for
map elements. The frame line’s size is determined by the size of the intended printed page as
well as any other map elements’ placement on the page.
4.5.2. Typography
The differentiation of individual features on a map is done through the use of labels. The
type size selected for the labels mapped area should be large enough to be easily read, but not so
large as to crowd the map. It is recommended to not select a type size smaller than five point as
the labels may become unreadable. Labels should also be placed so as not to overprint other
features or labels. If possible, symbols should be placed on the left and labeled on the right. If an
aerial image or dark colored background is used, a halo, an extended outline of the letters, should
be employed to make the label more visible. Depending on the GIS software, label placement
can be dictated by rule-based location settings, or even be placed manually, such as through
annotation feature sets in ArcMap.
The title will have the largest type on the map, followed by the subtitle. To increase
readability, word and letter spacing can be increased. The legend heading should be smaller than
the subtitle and the definitions should be smaller than the heading. The data source and
authorship type should be of the smallest readable type possible so as not to draw attention from
the thematic symbols.
This was a very general walkthrough of the necessary elements of map creation. For a
more in-depth discussion of each element, it is recommended to read the chapter on map
45
elements and typography from Thematic Cartography and Visualization by Slocum, McMaster,
Kessler, and Howard (2014).
4.5.3. Map Creation
After all of the map elements are placed properly and the appropriate typeface and sizes
are set, maps can be created. The types of maps will be decided during the user needs assessment
by the CWS. The most commonly found map in the field is an atlas that displays small sections
of the water system in a large scale. These are useful to the field staff because they allow for the
easy identification of individual system features. Atlases can be created in both open source and
proprietary GIS software with relative ease. QGIS uses a feature embedded into its print
composer window to prepare and create atlases. While it is not an intuitive process, it can be
performed by reading through a tutorial found on QGISs website, which will be discussed further
below.
A myriad of other types of maps can also be created, including boundary maps,
watershed maps, and wall maps. All of these maps can be created using the same data and
methods described above. The final step is to export the maps to a file type that can be printed,
such as .pdf, .png, or.jpg. Saving in one of these file types will allow for easy dissemination of
the maps to the printer or other users.
4.6 Training Requirements
As previously stated, the intended audience of this workflow is water professionals
working in or for small CWSs that may or may not have a background in GIS. This section of the
workflow benefits those who have never used GIS software before or those who have, but may
have let their skills lapse. The goal is to minimize cost by training an employee of the CWS to
46
use the selected GIS software. This is so the CWS has someone in-house to implement and
maintain the GIS. How the employee will be trained depends on which GIS software is selected.
As stated above, there are definite differences between open source and proprietary GIS
software, and this includes training. An example of open source training options is the training
manual created by QGIS that is available on their website. Like the software, the training manual
is free, and is comprised of eighteen learning modules. These modules walk a new user through
the basics of GIS all the way through spatial analysis. If the CWS selects QGIS as its GIS
software, it is recommended that the student work through at least the sixth module, ‘Creating
Vector Data’.
In the past, Esri includes a very robust basic training manual with the purchase of their
software. While this manual is no longer included, it is available from several schools online for
free. This training manual relates to older versions of Esri products but can still teach the student
the basic tools needed to create and edit data in a GIS. Esri now hosts their own training
academy online in both free and fee based training modules. These modules are either self-taught
or instructor led web courses.
47
Chapter 5 Discussion
The purpose of this thesis project was to develop inexpensive geospatial solutions that could be
implemented in small rural CWSs. This was to be accomplished by performing a case study in a
small rural water, where a GIS would be implemented using open source GIS software. After
completing this case study, a generalized workflow for implementing a GIS in a small CWS
would be created. The Descanso CWD proved to be an excellent case study for this project, and
the project can be considered a success. Spatially accurate data was collected and created, and
multiple maps were created, including an atlas and a large wall map. Based on the methods used
in the case study, a comprehensive workflow for the creation of similar implementation projects
was produced. However, the case study did have its issues. The project was not completed using
open source GIS software as intended because lines could not be snapped to point features in
QGIS, which led to the use of ArcMap to complete the data digitization process. A key area for
improvement was the training of a Descanso CWD employee in the use of GIS software, where
things did not go as planned, but were still successful.
Many future possibilities can come of this thesis project, not only for the Descanso CWD,
but for new projects as well. For the Descanso CWD, all of the future work could be completed
using ArcMap. The data could be migrated to a geodatabase, and a network can be created, thus
expanding the role of GIS in the water system. The GIS could also be combined with other types
of software, including asset management, maintenance scheduling, or water quality sample
scheduling. If the CWS chooses to, the data can also be hosted online through several different
avenues.
The workflow for the implementation of a GIS can be used for any CWS that wants to go
through this process. These CWSs will see several benefits from using the workflow for GIS
48
implementation, such as cost savings, the beginnings of an asset management system, and the
ability to update their infrastructure maps themselves when changes are made to the system.
5.1 Successes
The areas of success of this thesis project are the field data collection and map creation
portions of the Descanso CWD case study, and the creation of the GIS implementation
workflow. The field data collection process was conducted quickly and with almost no issues.
This success was due in large part to the information provided by the field staff of the Descanso
CWD in the form of existing maps and their intimate knowledge of their water system. This
made it possible to plan a route based on the existing locations of features, and being able to
identify any potential problem areas for data collection. The use of a high accuracy GPS with the
capability of importing a data dictionary also added to the efficiency of the data collection. In all,
over 15,000 points were collected as 30 points were collected at each feature location to achieve
the highest accuracy. 88% of these points were within a 50 cm accuracy, which was deemed
highly acceptable by the Descanso CWD.
The map creation process also went smoothly, due in large part to QGISs online training
manual. The manual provided very clear step by step instructions on creating an atlas in the print
composer. While not a completely intuitive process due to the need of selecting multiple options
in separate tabs, the process was similar to creating an atlas in ArcMap using data driven pages.
The tutorial provided tips on creating the inset map with a moving page indicator and unique text
for each page of the atlas. The Descanso CWD was happy with the outcome and will be printing
out multiple sets of the atlas for their field staff. The feature that impressed them the most was
the aerial imagery background, as their previous maps were set on a white background.
49
The most rewarding process of this project was the creation of the workflow for
implementing a GIS in a small water system (Chapter 4). This workflow was generated from a
combination of personal experience, experience of others in the water industry, examples from
previous studies, and knowledge from text books. This workflow is geared toward individuals in
the water industry, who may or may not have GIS experience, that would like to implement a
GIS in a small CWS. The workflow takes the user through a step by step process in creating a
basic GIS using either open source or proprietary GIS software. The final output of the workflow
is multiple datasets of features in the water system, a large scale atlas, and a small scale map of
the CWS.
5.2 Failures
A key tenet of this thesis project was to complete all of the GIS work in QGIS, an open
source GIS software. As stated above, there was an issue with snapping new line segments to
point features in an editing session in QGIS. As of QGIS version 2.16, which was released on
July 22, 2016, there is no provision for performing this snapping method. Because of this, the
water lines for the case study on the Descanso CWD were digitized using ArcMap, which allows
for the snapping lines to point features. Although this could have been performed in QGIS, the
created data would have been subpar, as the lines would never truly intersect with the points. A
way of remedying this would be to contact the developers at QGIS to see if there is a possibility
of including this snapping method in a future release of the software. This would enable GIS
users to complete a similar project to this completely in QGIS.
5.3 Areas for Improvement
One of the goals of this thesis project was to leave the GIS in the capable hands of an
employee at the Descanso CWD, so they could perform any future updates in-house. While the
50
Descanso CWD had no in-house GIS specialist, Travis Creamer volunteered to learn the basic
processes necessary to maintain their GIS using QGIS. Travis was tasked with working through
the first six modules of the QGIS online training manual. While he is working on the training
manual, the process has been slow-going. This is mostly due to the Descanso CWD being a small
water district, and only three people work for the CWD, so spare time to spend working on
training is not common. Travis spends most of his time in the field reading meters, fixing leaks,
and doing his daily rounds. However, he is committed in his desire to learn how to use the QGIS
software, and I will continue working with him on any problems he encounters after this thesis
has been finalized.
There are a few ways in which the training process can be improved for future projects,
such as requiring the employee to work on the training on their own time or during their lunch
break. The best choice, however, would be to select an employee that does not spend most of
their time in the field. Although office staff are similarly busy to field staff, they have the
advantage of being in front of a computer for the majority of their day, and would have more
opportunities to work through the training manual.
5.4 Future Possibilities
As the Descanso CWD continues to grow, so will its GIS. The direction in which this
growth continues, however, is based upon which type of GIS software is used, open source or
proprietary. Proprietary software, such as ArcMap, is very powerful, but that does not mean open
source software is not. In its current state, the Descanso CWDs GIS consists of several
shapefiles, which contain minimal amounts of attribute data. If they wanted to, the CWD could
continue using QGIS and create and import their data to a database, such as PostgreSQL,
PostGIS, and spatialite databases. This allows for the storage of all of their data in one location
51
and increases the amount of attribute data storage capability. The CWD could also begin entering
attribute data into the feature datasets where it is missing, include new types of attribute data, and
update existing attribute data when new features are installed. The CWD could also make their
data and maps available online via the QGIS web client. This, however, requires the CWD host
its own website, which requires more resources, and use QGIS Server, which would require
extensive further training.
Another option for the Descanso CWD would be to purchase a license for Esri’s ArcMap,
which can perform all of the tasks mentioned above in a more user friendly and timely manner.
The creation of a geodatabase in ArcMap can be completed in a few mouse-clicks, while you
need an extensive background in database management to create one for QGIS. In ArcMap, a
user can create either a personal or file geodatabase depending on their needs. The personal
geodatabase is the original file format for Esri geodatabases, and allows the user to store up to
two gigabytes of data in various formats (Esri 2016 – 3). A file geodatabase takes this concept
one step further and allows the user to store up to one terabyte of data in a file system, unlike the
personal geodatabase, which uses Access to store its data.
With all of the data stored in a geodatabase, the Descanso CWD, or any other CWS
implementing a GIS, will have a host of spatial tools available to them. A very specific example
would be if a CWS uses SEMS Technologies software to manage their water quality sampling
data. The SEMS Integrated Add-on for ArcMap allows a CWS to spatially relate their water
quality data that is entered through the SEMS software (SEMS 2014). CWSs will also be able to
maintain an asset management system through their geodatabase. There are numerous software
options available that integrate with ArcMap that allows the user to keep the asset data in sync
between the two systems, and have a spatial view of their assets and work orders.
52
Similar to QGIS, ArcMap gives its users the option to host their data online. However,
users with an ArcMap license or an ArcGIS Online subscription can host their data on an Esri
server. If a user’s data is stored as shapefiles or feature classes, the data is best added as a layer
file that can be created in ArcMap. Data stored as delimited text files, such as .txt or .xls files,
can be imported directly into an online map. This data can then be used to create maps that can
either be publicly or privately shared. Alternatively, a finished map can be created in ArcMap
and saved as a map document, .mxd, file. This file can then be uploaded to ArcGIS Online, along
with the map data, and shared to other users.
The most powerful group of tools in ArcMap for CWSs are the geometric network tools.
These tools can be used to model and analyze water flows moving through a CWSs water
system. A geometric network is created from existing data, which all has to be saved to the same
feature dataset. A network is built using the Build Geometric Network wizard which promotes
feature classes from points and lines to edges and junctions. Connectivity is then set for the
network through the creation of rules. These rules dictate what type of features can be connected
to one another and how the features interact. The process of creating the network works best with
data that is considered clean, meaning all of the data was snapped during its creation. If the data
was not snapped during its creation, it can be during the network creation process. This is done
by setting rules for snapping. Several different analyses can be run once the network is created,
including: calculating the shortest path between two points, finding all (dis)connected network
features, finding network loops or circuits, determining flow direction when sources and sinks
are set, tracing network features up- or downstream from a point, calculating the shortest path
upstream from on point to another, and finding all network features upstream from many points
and determine with features are common to them all (Esri 2016 – 4). The analyses would allow a
53
CWS to determine several flow related issues, such as flow directions in their system and how to
bypass certain parts of the system during emergencies.
If a new CWS decides to begin a GIS implementation project they can use the workflow
created for this thesis project. The most important aspect of the workflow is its ability to be used
for GIS implementation projects of any size. Since it provides a simple framework and does not
apply specifics, it can be adapted to projects both large and small. The one exception would be
that the user needs assessment process may need to be expanded for larger entities as they tend to
be more complex systems than smaller CWSs.
By utilizing this workflow, CWSs will see several benefits over having a consultant do
the work for them. The most obvious benefit would be cost savings. Rates for creating a GIS by
a consultant can range from $50 to $200 per hour. By completing the work in-house, a CWS can
potentially save thousands of dollars. This would be dependent on the project, however. The
more information the CWS can provide during the source data evaluation, the faster the project
can be completed. The cost savings would be even more if a CWS utilized open source GIS
software, such as QGIS, in the creating and implementation of their GIS. By creating a GIS in-
house, a CWS would also benefit from being able to update their infrastructure maps when they
make improvements or additions. Because they control their own data, they could print out a new
set of maps whenever they wanted to. Also, because they could control their own data, they
could use it as a basic asset management system. By adding the installation dates for the pieces
of their infrastructure the CWS could keep track of each asset to calculate when its replacement
should be.
54
References
Backaitis, V. 2013. Open Source vs. Proprietary Software: There is No Clear Winner.
http://www.cmswire.com/cms/information-management/open-source-vs-proprietary-
software-there-is-no-clear-winner-021752.php. [Accessed: 11/15/2016]
CalAtlas. 2016. 2014 NAIP DOQQ.
http://www.atlas.ca.gov/download.html#/casil/imageryBaseMapsLandCover/imagery/nai
p/naip2014/NAIP_2014_DOQQ/Data/TIFF. [Accessed: 10/7/2016]
Caltatlas. 2016. Private Water Districts.
http://www.atlas.ca.gov/download.html#/casil/boundaries/Private_Water_Districts.
[Accessed: 10/7/2016]
Cannistra, J. R. 1999. Converting utility data for a GIS. American Water Works Association
Journal, 91(2), 55-64.
Chaussat, B. 2015. Grids for Atlas. http://hub.qgis.org/projects/synoptiquesatlas. [Accessed:
8/2/2016]
Coppock J. T., Rhind D. W. 1991. The History of GIS. In Maguire D J, Goodchild M F, Rhind D
W (eds) Geographical information systems: principles and applications. Harlow,
Longman/New York, John Wiley & Sons Inc. 1: 21–43
Crawford, D., 2012. Implementing a Utility Geographic Information System for Water, Sewer,
and Electric. Master’s Thesis. Northwest Missouri State University.
Esri. 2016. Buy ArcGIS for Desktop. http://www.esri.com/software/arcgis/arcgis-for-
desktop/pricing. [Accessed: 7/12/2016]
Esri. 2016. Types of Geodatabases. http://desktop.arcgis.com/en/arcmap/latest/manage-
data/geodatabases/types-of-geodatabases.htm. [Accessed: 11/12/2016]
Esri. 2016. What are Geometric Networks? http://desktop.arcgis.com/en/arcmap/latest/manage-
data/geometric-networks/what-are-geometric-networks-.htm. [Accessed: 11/13/2016]
Esri. 2016. What is a shapefile? http://desktop.arcgis.com/en/arcmap/latest/manage-
data/shapefiles/what-is-a-shapefile.htm. [Accessed: 7/12/2016]
Farm Services Administration. 2016. NAIP Imagery. https://www.fsa.usda.gov/programs-and-
services/aerial-photography/imagery-programs/naip-imagery/. [Accessed: 10/7/2016]
Fellers, J. 2013. Implementing a Geographic Information System for a Rural Water and Sewer
Company: A Case Study of the Newberry County Water and Sewer Authority. Master’s
Thesis. Northwest Missouri State University.
55
GIS Geography. 2016. 13 Free GIS Software Options: Map the World in Open Source.
http://gisgeography.com/free-gis-software/. [Accessed: 7/12/2016]
Huxhold, William E. and Levinsohn, Allan G. (1995). Managing Geographic Information
System Projects, New York, Oxford University Press
Information Technology Group. 2015. What’s the Difference Between Open Source and Closed
Source Software? https://www.itgct.com/whats-the-difference-between-open-source-and-
closed-source-software/./ [Accessed: 8/8/2016]
Kepoglu, V.O. 2011. Development of Free/Libre and Open Source Spatial Data Analysis System
Fully Coupled with Geographic Information System. Ph.D. Dissertation. The Graduate
School of Natural and Applied Sciences of Middle East Technical University.
Lin, M. 2016. Implementing Spatial Thinking with Web GIS in the Non-Profit Sector: A Case
Study of ArcGIS Online in the Pacific Symphony. Master’s Thesis. University of
Southern California.
Longley, P.A, Goodchild, M.F, Maguire, D.J., and Rhind, D.W. 2005. Geographical Information
Systems: Principles, Techniques, Management and Applications, 2nd Edition, Abridged.
http://www.geos.ed.ac.uk/~gisteac/gis_book_abridged/ . [Accessed: 7/12/2016]
Lyon, T. and Clifford, D. 2008. From deficient to efficient many benefits flow from water
district’s GIS [Online]. http://www.esri.com/news/arcuser/0708/metamorphosis.html
[Accessed: 7/13/2016]
McKee, L. 2012. OGC History (detailed). http://www.opengeospatial.org/ogc/historylong.
[Accessed: 8/8/2016]
Optimus Information. 2015. Open-Source vs. Proprietary Software Pros and Cons.
http://www.optimusinfo.com/downloads/white-paper/open-source-vs-proprietary-
software-pros-and-cons.pdf. [Accessed: 11/15/2016]
Totton, J. 2013. Creating the Fundy Footpath Trail Map with QGIS.
https://www.qgis.org/en/site/about/case_studies/canada_brunswick.html. [Accessed:
8/8/2016]
QGIS. 2013. QGIS Training Manual.
http://docs.qgis.org/2.0/en/docs/training_manual/index.html. [Accessed: 7/12/2016]
Rayburn, S. R. 2004. The Use of GIS in Water Utility Asset Management, Four Seasons
Subdivision of Lufkin, Texas. Master’s Thesis. Stephen F. Austin State University.
SANDAG. 2016. Regional GIS Data Warehouse.
http://www.sandag.org/index.asp?subclassid=100&fuseaction=home.subclasshome.
[Accessed: 10/7/2016]

56
SEMS Technologies. 2014. Integrated Add-Ons.
http://www2.semstechnologies.com/product/integrated-add-ons/ (Accessed: April 12,
2015)
Slocum, T., McMaster, R., Kessler, F., and Howard, H. 2014. Thematic Cartography and
Geovisualization. Upper Saddle River, NJ. Pearson Prentice Hall
SmallWaterSupply.org. 2012. Using Quantum GIS – free open source GIS tool for the water
industry.
http://smallwatersupply.org/Blog/tabid/38/ctl/ArticleView/mid/390/articleId/205/Using-
Quantum-GIS-free-open-source-GIS-tool-for-the-water-industry.aspx. [Accessed:
7/12/2016]
The Institute for Mapping Technology. 2010. Open Source Vs Commercial.
http://learninggis.com/open-source-vs-commerical. [Accessed: 7/12/2016]
Tomlinson, R. 2007. Thinking About GIS Geographic Information System Planning for
Managers. 3rd ed. Redlands, California: Esri Press.
Vega, R. 2009. Managing Water Utilities with Geographic Information Systems: The Case of the
City of Tampa Florida. Master Thesis. Northwest Missouri State University.