britain’s economic problem: too small a public sector?hirm/downloadpapers/middleton (1997... ·...
TRANSCRIPT
Britain’s economic problem:
too small a public sector?*
Roger Middleton (University of Bristol)
* This paper draws upon the results of a larger project published as Government versus the market
(Middleton 1996b). It also develops the long-run public finance dataset there reported and the reader is referred to ch.3 and app. I of this earlier work for full details of all of the estimates of public sector growth here discussed. I should like to thank the University of Bristol research fund for financial assistance, Professors George Peden and Bernard Alford, and participants in the ICBH ‘British history 1945-95’ conference and the All Souls Seminar in Economic and Social History for their helpful comments on earlier drafts of this paper. Any remaining errors of fact, analysis or interpretation are, of course, entirely my own.
This paper was completed with knowledge of the latest edition of Bacon and Eltis’s Britain’s economic problem (Bacon and Eltis 1996), but without the benefit of having read the full text. I am grateful to Walter Eltis for discussing the substance of this new edition..
The following conventions are used. The prewar, interwar and postwar periods refer to the pre-First World War, interwar and post-Second World War periods respectively; EC-9 to the nine European Community states at first (1973) enlargement (EC-9** as EC-9 but excluding Ireland and Luxembourg) and EC-12 at second/third enlargement (1981, 1986), G-7 to the seven leading industrial economies (G-7** as G-7 but excluding Canada and Italy), and the OECD to the members of the Organization for Economic Cooperation and Development. Unless otherwise stated GDP is measured at current market prices and all growth rates are annual average compound percentage rates.
This text is the 1997 version save that where papers cited were originally produced as working
papers and are now published the later reference has been substituted. ©Middleton 1997/2005

Middleton (1997) ‘Britain’s economic problem’ 2/40 __________________________________________________________________________________
1 Introduction The British economy has been in relative decline since the late nineteenth century with the reasons for this phenomenon and how it might be abated or even reversed a concurrent but variable preoccupation of governments, economists and commentators ever since. However, in the 1970s the coincidence of long-run decline with the more immediate problems generated by OPEC I, the collapse of the Heath government and the difficulties of the Wilson-Callaghan administrations in sustaining Keynesian social democracy, created an entirely new situation, what Samuel Brittan (1978, p. 245) called ‘an orgy of pessimism and self-doubt amongst British leaders’ about economic prospects. Relative economic decline (RED) now became an obsession, the central political issue of the 1970s; even, according to Wiener’s (1981, p. 3) influential tale, the ‘leading problem of modern British history’. Unsurprisingly, there was a marked dissonance between popular and academic accounts of the so-called British disease (Warwick 1985; Budge 1993; Supple 1994), though there was a common ground in the search for something distinctive, some British peculiarity which might explain the loss of early dynamism. Thus the more popular accounts of Britain’s economic problem tended to favour monocausal or easily identifiable explanations such as the burden of the welfare state, the decline in entrepreneurial spirit and/or the recalcitrance of the trade unions. Amongst academic and more considered opinion there was far less certainty, not so much about the constituent elements of Britain’s economic problem, but about the remedies, though there were a few, such as Bacon and Eltis, who were prepared to offer straightforward diagnoses with immediately obvious remedies. What united popular and academic accounts, however, and what gave to the RED debate a much enhanced presence in the 1970s, was the frequency with which government itself was identified as playing the central role in the British disease (Ridley 1982; Parsons 1982; Coates 1994; see also Coates and Hillard (1986; 1995) for extracts from the works of many of the principal protagonists). Debate over the appropriate role of government, and of its size in terms of the balance between the market and non-market sectors, has always been central to the preoccupation with RED. However, hitherto those seeking to restrain the growth of the public sector had always been on the political defensive and with the tide of intellectual debate clearly promoting bigger government as a means of improving economic performance and social cohesiveness, as in tariff/social reform before the First World War, deficit-financing between the wars, and, once the managed-mixed economy/welfare state had been accepted, in the various supply-side experiments from the time of Macmillan onwards. The primary objective of this paper is to discuss with what justification an excess bias in the public sector was rightly identified by the middle 1970s as the principal source, or at least a major part of the explanation, for the crisis of the British economy. This paper is thus not concerned with why there was a reaction against big government in the 1970s, a topic considered in depth in my larger study, Government versus the market, but with the objective facts of Britain’s public sector. For a number of reasons the major part of the analysis will be founded upon comparative public finance data. First, while the expansion of the public sector and the growth of big government have been common features of all twentieth-century economies and political systems, with the British case conforming broadly to the experience of other advanced capitalist countries (ACCs), there are important differences. This is particularly true in respect of the comparative size of Britain’s public sector, the composition of public expenditure and revenue and the timing of its critical phases of growth. As a consequence, the British case has been frequently misunderstood. In particular, the focus upon aggregate measures of state activity has

Middleton (1997) ‘Britain’s economic problem’ 3/40 __________________________________________________________________________________
resulted in insufficient attention being paid to the composition of public expenditure and the implications of this for equity and efficiency in the British economy and the underlying objectives of public policy-makers. Secondly, this paper follows the tradition, which runs from the early twentieth-century German fiscal sociologists through to modern public choice theory, that public finance, by representing the ‘hard, naked facts’, offers ‘one of the best starting points for an investigation of society’ (Schumpeter 1918, pp. 6–7). Indeed, this is an appropriate point to make the plea that historians become interested once more in public finance for it has a massive, perhaps unique, capacity to illuminate power relationships and the distribution of the burdens and benefits of modern government. Admittedly, recently there has been some revival of interest in the tax side of the account (for example, Cronin 1991 and Steinmo 1993), but public expenditure has somewhat languished. Thirdly, and most obviously, for the first Thatcher government the excessive growth of the public sector lay centre stage in its account of Britain’s economic decline. Its first public expenditure white paper opened with the strong statement that ‘Public expenditure is at the heart of Britain’s present economic difficulties’ and that unless the growth of expenditure could be checked the ‘economy would be threatened with endemic inflation and economic decline’ (HMSO 1979, para 1). Since 1979 issues of public finance have continued to polarise political opinion, indeed probably more so than at any time since the prewar Liberal governments sought to introduce progressive taxation to finance the nascent welfare expenditure programmes. This paper is explicitly directed at a text which was central in the attack upon big government in the 1970s, that of Bacon and Eltis’s Britain’s economic problem: too few producers. Implicit within this work, and the popular and political support that it engendered, was a counterfactual that Britain’s economic problem would have been lessened had there been a smaller public (or non-market) sector. The publication of a third edition of this work,1 together with the continued commitment of the right in Britain to the implicit counterfactual, provides strong grounds for returning to the topic. In addition, as a Times Higher Education Supplement leader noted just before the ICBH conference for which this paper was originally prepared: The relationship between government, finance and industry, that between
taxation and level of services, the role of the state and the balance between planning and the market all deserve more serious treatment than the mix of soundbite, xenophobic rhetoric and taxation Dutch auction currently passing for debate in the Conservative Party. (Anon 1995)
The discussion is organized as follows. The second section presents key long-run public finance series in order to make clear that the significant growth of the public sector in Britain predates the Second World War, so that the postwar period is best characterized as the consolidation, not the advent, of big government. The issue of timing is of some significance. Until very recently, those who tended to implicate government as the root cause of economic failure concentrated on postwar economic policies and the growth of the public sector, whilst those who looked further back tended to identify forces more deeply rooted in Britain’s social and political structure. Accordingly, by viewing government growth as a longer-run process it is possible to adopt a more balanced perspective on RED, one which escapes from the economist’s simple dichotomy of government versus market failure. A more detailed investigation of postwar public finance trends and their possible connection with RED is then
1 Originally published as three articles on the general theme ‘Declining Britain’ in the Sunday
Times, 1, 8 and 15 November 1975, and timed to coincide with significant Cabinet discussions on public expenditure: see Eltis (1993, pp. xviii-xx).

Middleton (1997) ‘Britain’s economic problem’ 4/40 __________________________________________________________________________________
conducted in the third section, from which we identify the defining characteristic of the British case as the slow growth of the public sector and its below average size by 1979. Finally, some conclusions are drawn about public finance trends and economic performance since 1979, here taken as a watershed representing the end of the era of Keynesian social democracy though not necessarily the peak for many measures of the size of the public sector. 2. The long-run growth of the public sector The public sector is traditionally measured in terms of the share of public expenditure or taxation in national income (hereafter, the expenditure and receipts ratios).2 Such an approach, of measuring what is most easily identifiable and quantifiable, is subject to certain well-known difficulties, in particular that it cannot capture one of the most important features of public sector growth this century: the development of government regulation of the private sector which imposes public and private economic costs which do not show up as public expenditures (Larkey et al. 1981; Peters and Heisler 1983, p. 179; Cullis and Jones 1987, pp. 73–5; see also Rose 1983 for attempts to develop wider non-financial measures of state growth). Thus the conventional indicators of public sector size provide but partial coverage of the channels through which the public sector impinges on the private sector, a problem particularly magnified with cross-country studies: for example, in both France and Germany the expenditure ratio (for general government) averaged 42.3 per cent of GDP between 1960–85 but the former was a much more dirigiste economy than the latter. These reservations are important but do not invalidate the traditional approach, especially in the British case where so much of the critique of big government that had developed by the 1970s was in terms of identifiable quantitative indicators (the expenditure ratio, tax rates and public employment). In the following we concentrate upon issues of timing, cross-country comparisons and the role of partisanship in public sector growth. The transformation in the economic significance of government is clearly evident from Figure 1 which charts the long-run course of the expenditure ratio and the overall composition of total public expenditure (TPE) as between goods and services (PACE), gross capital formation (GCF) and transfer payments (items 3–6 of Table 1). It should be viewed in conjunction with Table 1 which details TPE by economic category and functional classification. TPE is here defined according to the CSO’s pre-1977 conventions, ones which differ slightly from those employed since 1979 where the emphasis has been more on financial control than on resource use. It is introduced here to permit long-run comparisons, but where required estimates using
2 It should be noted that both ratios are much affected by varying practices in definitions and
calculation. Thus, for the expenditure ratio, the numerator will vary according to the definition of public expenditure employed (whether current or total expenditures, general government or the public sector), while the denominator may use GDP or GNP at market prices or factor cost. For Britain, in the crisis year of 1976, a wide (narrow) definition of the numerator (denominator) yielded a public expenditure ratio of 60 per cent, prompting Milton Friedman’s (1976, p. 9) dire warning that ‘the odds are at least 50-50 that within the next five years British freedom and democracy, as we have seen it, will be destroyed’; this undoubtedly contributed to the loss of overseas confidence in sterling later that summer: see Pliatzky, (1984) and Burk and Cairncross (1992). On the SNA definition employed by the OECD-UN as a standardised measure the 1976 ratio was 46.1 per cent, with averages for the EC-9 of 47.1 per cent, G-7 of 40.1 per cent and OECD of 37.7 per cent (calculated from Heald 1983, p. 15, table 2.3).
Figure 1 Total public expenditure economic classification as a % of GDP at current market prices, 1900–93

Middleton (1997) ‘Britain’s economic problem’ 5/40 __________________________________________________________________________________
Notes: For this and successive figures and tables, Southern Ireland is included for 1900–19; from
1920 onwards it is excluded. Sources: 1900–79: Middleton (1996b, figure 3.3); 1980–: calculated from CSO (1987a, tables 1.2,
6.2, 9.1; 1994a, tables 1.2, 6.2, 9.1; 1995, table 1.8). current definitions of TPE are employed in sections three and four of this paper. Over the period as a whole the expenditure ratio rose by just over three and a half times, though it should be noted that the public sector’s direct claim upon resources (items 1–2 of Table 1) increased by far less: from 11.1 per cent to 26.3 per cent of GDP. It was thus transfer payments which fuelled the growth of public expenditure, especially current grants to the personal sector which rose from 0.5 per cent to 15.1 per cent of GDP. It is clear also, given the major peaks associated with the two world wars and the minor peaks of the Boer (1899–1902) and Korean (1951–2) Wars, that war has played an important part in this process. However, since the expenditure ratio continued its upward course after both world wars Peacock and Wiseman’s thesis of the ‘displacement effect’ is not a sufficient explanation for long-run public expenditure growth (Peacock and Wiseman 1967). Table 1 shows a transformation in the functional classification of TPE over the course of the century. Before the First World War defence was the largest budget item, with social expenditures second in rank and growing. Thereafter, social expenditures become the dominant budgetary item, experiencing sharp upward shifts during both trans-war periods and during peacetime with the interwar period, the 1960s and the period since 1979 being particularly significant. Figure 2 charts the receipts ratio since 1900 with Table 2 providing a breakdown by category. The upward trend which prevailed through to the mid-1980s resulted from increased rates on existing taxes and a widening of the tax base. Of these developments, the most important concerned the income tax which ‘changed out of all recognition’ as a consequence of the First World War (Sabine 1966, p. 154). If the proportion of the population subject to taxes on income be accepted as a proxy for

Table 1 TPE as % of GDP at current market prices, by economic category and functional classification, selected years, 1900–93a,b 1900 1903 1907 1913 1920 1924 1929 1937 1948 1951 1955 1960 1964 1968 1973 1979 1984 1989 1993
A. Economic category:
1. Current goods and services 9.3 8.5 7.6 8.1 8.2 9.0 9.2 11.7 15.0 16.8 16.6 16.3 16.4 17.8 18.3 19.9 22.0 20.0 22.2
2. Gross capital formation 1.8 1.9 1.3 1.2 1.7 2.2 2.6 3.3 5.7 6.9 7.6 7.3 9.0 10.8 9.3 6.6 5.6 3.9 4.1
3. Current grants to personal sector 0.5 0.4 0.3 0.9 2.7 3.9 4.4 5.0 6.0 5.4 5.8 6.5 7.2 8.5 8.8 10.9 13.8 11.3 15.1
4. Subsidies 0.0 0.0 0.0 0.0 2.1 0.3 0.5 0.6 4.9 3.2 1.8 1.9 1.6 2.1 2.0 2.3 2.4 1.2 1.2
5. Current grants paid abroad 0.1 0.2 0.0 0.0 0.2 0.2 0.1 0.1 0.3 0.5 0.4 0.4 0.5 0.4 0.5 1.1 0.7 0.9 0.8
6. Debt interest 1.6 2.0 1.8 1.7 5.7 7.9 7.7 5.4 5.1 4.7 4.8 4.6 4.2 4.4 4.1 5.1 5.5 4.1 3.2
7. Total 13.3 12.9 10.9 11.9 20.5 23.6 24.5 26.0 37.0 37.5 37.0 37.1 38.9 43.9 42.9 45.9 49.9 41.4 46.8
B. Functional classification:
8. Public administration and other 0.7 0.9 0.8 0.8 0.8 1.1 1.0 1.0 1.2 1.2 1.0 1.0 0.9 0.9 0.9 0.9 1.2 1.3 1.4
9. Debt interest 1.6 2.0 1.8 1.7 5.7 7.9 7.7 5.4 5.1 4.7 4.8 4.6 4.2 4.4 4.1 5.1 5.5 4.1 3.2
10. Law and order 0.4 0.5 0.6 0.6 0.2 0.5 0.6 0.5 0.5 0.6 0.7 0.7 0.8 0.9 1.0 1.2 1.9 1.9 2.3
11. External services 0.0 0.1 0.1 0.0 0.0 0.1 0.0 0.0 0.2 0.6 0.4 0.5 0.8 0.7 0.9 1.2 1.1 1.1 1.2
12. Defence 6.0 4.0 2.7 3.1 6.1 2.9 2.6 4.9 6.3 7.6 8.0 6.3 6.1 5.6 4.8 4.7 5.4 4.2 3.8
13. Social services 2.3 3.0 3.1 3.7 4.9 8.0 9.2 10.5 17.6 14.1 13.9 15.1 16.5 20.2 21.2 23.9 27.1 23.1 28.8
14. Economic services 1.6 1.9 1.4 1.4 2.4 2.4 2.7 2.7 4.8 7.1 6.2 6.9 7.1 7.8 6.5 5.7 5.0 3.4 3.9
15. Environmental services 0.5 0.6 0.5 0.6 0.3 0.7 0.7 0.9 1.3 1.7 1.9 1.9 2.5 3.4 3.6 3.1 2.7 2.3 2.2
16. Total 13.3 12.9 10.9 11.9 20.5 23.6 24.5 26.0 37.0 37.5 37.0 37.1 38.9 43.9 42.9 45.9 49.9 41.4 46.8Notes: a Full details of the calculation of these series are given in Middleton (1996b, app. I). b The distribution by economic classification is more accurate than that by function for the years to 1948; thereafter they use identical sources. Sources: 1900–79: Middleton (1996b, figures 1.1, 3.1, 3.3, table 3.2); 1984–: as Figure 1 and CSO (1994a, table 9.4; 1995, table 1.2).

Middleton (1997) ‘Britain’s economic problem’ 7/40 __________________________________________________________________________________
Figure 2 Public sector receipts by category as % of GDP at current market prices, 1900–93
Sources: 1900–79: Middleton (1996b, figure 3.5); 1980–: CSO (1987a, tables 1.2, 6.2, 9.1; 1994,
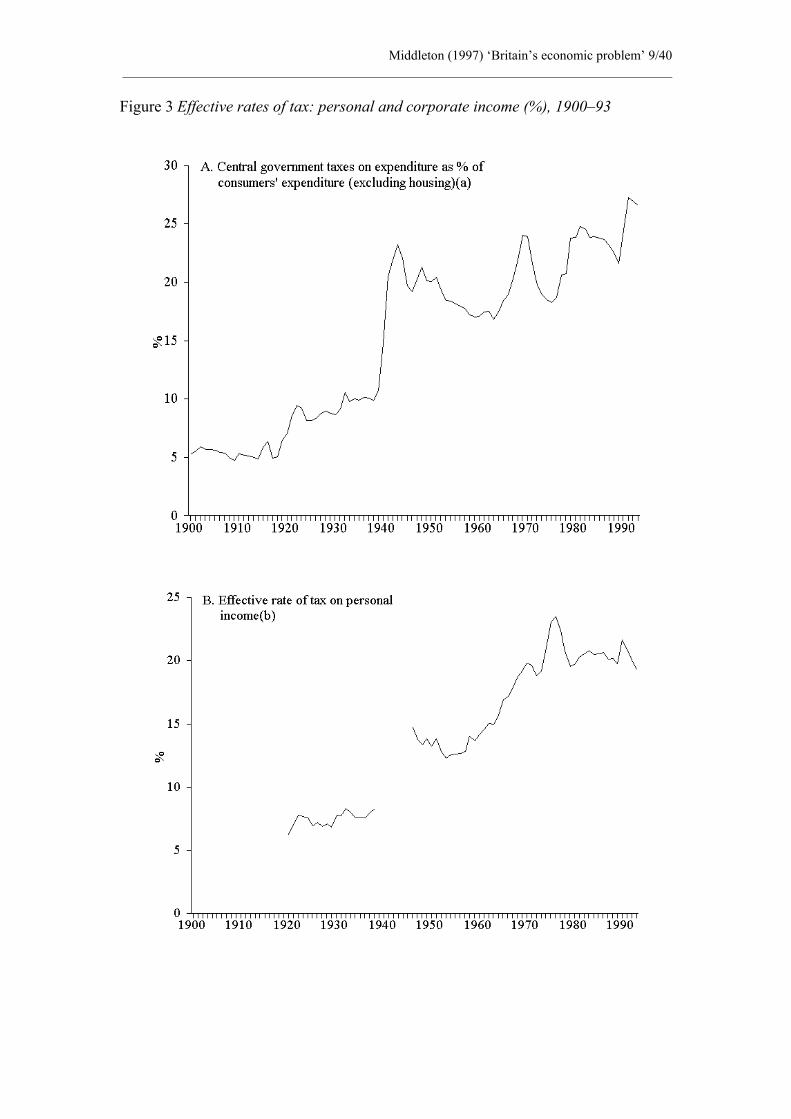
tables 1.2, 6.2, 9.1). state growth then Britain’s public finance system was quite underdeveloped on the eve of the First World War when there were about one million income tax payers. As Cronin states, payment of income tax was ‘virtually a badge of class status’, whereas by the early 1980s there were 25 million taxpayers (Cronin 1991, p. 8; and Dilnot et al. 1985, p. 66). The rise to prominence of the income tax and the development of national insurance determined the shift in the tax mix over the course of the century. Taxes on expenditure provided nearly 77 per cent of total tax revenue in 1900 but thereafter were gradually eroded down to a low point of 36.7 per cent in 1975, before recovering up to 46.8 per cent by 1993 as part of a stated policy, pursued by Conservative governments since 1979, of reversing the trend towards increased reliance on direct taxation. Figures 3A-C provide long-run estimates of the effective rates of tax on expenditure, personal and corporate income, all of which have been transformed over the course of the century, though since 1979 the taxation of profits has returned to levels little higher than those prevailing between the wars. If we take as given that the two world wars had a displacement effect on taxable capacity the long-run data for the expenditure and receipts ratios suggests that it is also possible to identify two significant periods for the permanent growth of the public sector and one very short phase of temporary growth. In respect of the former category, we identify the period between the wars and the decade after 1958, while in the case of the latter we will need to discuss – in section three – the years 1973–5 when it was widely considered that public expenditure was growing out of control. In

Table 2 Public sector receipts as % of GDP at current market prices, selected years, 1900–93
1900 1903 1907 1913 1920 1924 1929 1937 1948 1951 1955 1960 1964 1968 1973 1979 1984 1989 1993
1. Taxes on income 1.0 1.9 1.5 1.8 10.2 7.9 6.2 6.2 13.7 13.4 12.1 10.7 10.7 12.9 12.5 13.0 14.9 14.3 12.2
2. Taxes on expenditure 6.6 7.3 7.2 7.0 8.3 10.0 10.6 11.6 17.2 15.7 13.9 13.3 13.6 15.7 13.9 15.7 17.1 16.5 16.7
3. Taxes on capital 1.0 0.9 0.9 1.1 0.8 1.4 1.7 1.8 1.8 1.3 1.0 0.9 0.9 1.0 1.2 0.6 0.6 0.8 0.4
4. National insurance contributions 0.0 0.0 0.0 0.8 0.5 1.4 1.7 2.0 2.9 3.1 3.1 3.6 4.4 5.0 5.4 6.0 7.1 6.7 6.4
5. Gross trading surplus 0.4 0.6 0.7 0.8 0.3 0.9 1.1 1.3 1.9 2.6 2.2 2.8 3.1 3.4 3.0 3.0 2.6 1.3 0.6
6. Rent, interest & dividends 0.7 0.9 1.0 1.0 0.7 1.4 2.0 1.7 1.3 1.5 1.9 2.6 3.1 2.7 3.8 3.8 3.9 2.8 2.3
7. Current grants from abroad 0.0 0.0 0.0 0.0 0.1 0.2 0.5 0.0 0.0 0.0 0.2 0.0 0.0 0.0 0.0 0.0 0.0 0.0 0.0
8. Total 9.7 11.5 11.2 12.4 20.9 23.3 23.8 24.5 38.7 37.8 34.5 34.0 35.8 40.7 39.8 42.1 46.1 42.4 38.4 Source: As Figure 2.
Middleton (1997) ‘Britain’s economic problem’ 9/40 __________________________________________________________________________________
Figure 3 Effective rates of tax: personal and corporate income (%), 1900–93

Middleton (1997) ‘Britain’s economic problem’ 10/40 __________________________________________________________________________________
Notes: a Expenditure on housing is excluded from the tax base because it was liable to domestic rates.
There are no long-run data on the indirect allocation to consumption of taxes on industrial inputs and these have therefore not been excluded.
b Taxes on income paid by the personal sector includes addition to reserves and national insurance contributions, while the tax base includes current grants from public authorities.
c UK corporate and overseas taxes are on an payments basis, with corporate income, the tax base, net of interest payments.
Sources: A: Middleton (1996b, figure 3.13A) and CSO (1987a, tables 4.7, 7.1; 1994a, tables 4.7, 7.1); B: Middleton (1996b, figure 13.3B) and CSO (1987a, table 4.1; 1994a, table 4.1); C: Middleton (1996b, figure 13.3C) and CSO (1987a, table 5.1, 5.3; 1994a, table 5.1, 5.3).
terms of permanent growth it was social expenditures which led the way, with – in respective order – mass unemployment and political competition being the decisive factors. The latter deserves further comment as there is general agreement that, for the postwar period, there was no simple relationship between partisanship and public expenditure growth; rather there had been a steady acceleration under all governments until Labour was forced into severe retrenchment between 1976–7 (Judge 1982, p.29; see also Castles 1982, pp. 21–96 and Hogwood 1992, pp. 40–4). The beginnings of this process may be dated as 1957–8. Until that point Conservative governments had been able to contain pressures for increased public expenditure through the benefits of the peace dividend made available by the ending of the Korean War. As Figure 4 shows, real TPE growth begins in 1958, the year in which the Chancellor of the Exchequer and his Treasury team resigned after failing to secure Cabinet backing for a substantial deceleration in the rate of growth of welfare expenditure (Lowe 1989). Figure 4 also includes an extrapolation of the 1958–64 growth of real TPE forward to 1979, at which point it would have been some 16 per cent above the actual figure (or 8.3 per cent above the figure that might have been expected if the last Labour government had maintained the growth rate of TPE experienced between 1974–6). This leads directly to the next observation, that all incoming Labour governments had formed ambitious public expenditure plans whilst in opposition but within two

Middleton (1997) ‘Britain’s economic problem’ 11/40 __________________________________________________________________________________
Figure 4 Real TPE (£ millions, 1975 prices), actual and projection, 1948–79a
Note: a Adjusted by GDP deflator. Source: Middleton (1996b, figure 11.1). years of taking office were forced into subsequent cutbacks (Whiteley 1983, p. 140; see also Clarke 1978 and Pliatzky 1984). The coincidence of rising real TPE (and the expenditure ratio) before the elections of 1955, 1959, 1964, 1966 and 1974 (but not 1970) are consistent with some sort of political business cycle, though this has proved very difficult to specify in practice (Middleton 1996b, pp. 482–3, 576–7). Public expenditure thus appears to have been a central ingredient of the postwar political contest, with the process beginning in the 1950s under the Conservatives. However, as Klein (1976, p. 418) observed, ‘the British evidence suggests that the competition between the parties is in terms of their rival claims to effectiveness in managing the economy as a whole, not in terms of increasing the benefits of public expenditure.’ Some ideological and electoral impact on the short-term course of public expenditure was clearly evident, but against this should be placed the clear finding from electoral studies that changes in political allegiance were more performance-related than issue-related, with ‘Voters simplify[ing] the problems of choice by shifting attention from policies to consequences’ with ‘beliefs about the latter ... formed by “simple inferences from who is or was in power”‘ (Brittan 1975, p. 135). Some long-run, cross-country data on the expenditure and receipts ratios is given in Tables 3–5. Unfortunately, there is insufficient data from which to compile tax ratios before 1950 but it is clear that in terms of the expenditure ratio Britain’s public sector was not unduly large relative to its principal European competitor, Germany, on the eve of either the First or the Second World Wars (Middleton 1992). It should be noted that the public sector grew in all ACCs between the wars, but that for Britain the period of significant growth came in the 1920s, whereas other G-7 economies experience their critical phases of growth in the 1930s. The explanation is most likely

Middleton (1997) ‘Britain’s economic problem’ 12/40 __________________________________________________________________________________
Table 3 G-7** and Netherlands: total government expenditure as % of GDP at current prices, selected years, 1880–1950
1880 1913 1929 1938 1950 France 11.2 8.9 12.4 23.2 27.6 Germany 10.0 17.7 30.6 42.4 30.4 Japan 9.0 14.2 18.8 30.3 19.8 Netherlands .. 8.2 11.2 21.7 26.8 UK 9.9 13.3 23.8 28.8 34.2 US .. 8.0 10.0 19.8 21.4 Average 10.0 11.7 17.8 27.7 26.7
Sources: Middleton (1996b, table 3.3); derived from Maddison (1984, table 1; 1991, table 3.17). Table 4 OECD: general government expenditure as % of GDP at current prices, selected years, 1950–90
1950a 1960 1968 1974 1980 1985 1990 G-7: Canada 24.4 28.6 32.4 36.8 40.5 47.1 46.9 France 36.0 34.6 40.3 39.3 46.1 52.2 49.9 Germany 32.0 32.4 39.1 44.6 48.5 47.6 46.0 Italy 22.2 30.1 34.7 37.9 41.7 50.9 53.0 Japan 17.5 19.2 24.5 32.6 32.3 32.3 UK 32.1 32.2 39.3 44.8 44.8 46.2 42.1 USb 24.4 27.0 30.7 32.2 33.7 36.7 36.1 Other OECD: Australiab 18.8 21.2 24.1 31.6 33.8 38.7 34.8 Austria 18.0 35.7 40.6 41.9 48.9 51.7 49.6 Belgium 22.6 30.3 36.3 39.4 59.0 62.5 55.2 Denmark 19.0 24.8 36.3 45.9 56.2 59.3 58.4 Finland 28.6 26.6 32.8 32.0 36.6 41.6 41.2 Greece 17.4 23.5 25.0 30.5 43.7 50.9 Iceland 28.2 33.8 37.8 32.2 34.5 37.9 Irelandb 32.1 28.0 35.2 43.0 50.8 54.8 43.1 Luxembourg 25.0 30.5 37.3 35.6 36.1 48.6 52.5 Netherlands 26.5 33.7 43.9 47.9 57.5 59.7 55.6 New Zealand Norwayb 27.6 29.9 37.9 44.6 48.3 45.6 54.6 Portugalb 17.0 20.9 24.7 25.9 43.4 41.7 Spainb 21.3 23.1 32.9 42.2 40.5 Sweden 16.2 31.0 42.8 48.1 61.6 64.7 61.4 Switzerland 19.8 17.2 20.7 25.5 29.3 31.0 30.7 Turkey 21.9 Averages: EC-9 27.5 30.7 38.0 42.0 49.0 53.5 50.6 G-7 28.5 28.9 33.7 37.2 41.1 44.7 43.8 OECD 25.0 27.1 32.9 36.6 42.2 47.0 46.1 Coefficient EC-9 0.20 0.09 0.07 0.09 0.15 0.10 0.11 of G-7 0.18 0.18 0.20 0.18 0.14 0.15 0.16 variation: OECD 0.22 0.21 0.23 0.22 0.25 0.20 0.18
Notes: a Because of the different source used for the 1950 and 1960–90 estimates, the 1950 and 1960
figures are not strictly comparable. The average difference amounts to less than half a percentage point of GDP and there are no significant differences for either the EC or G-7 groups.
b Closest available date to 1990. Sources: Middleton (1996b, table 3.4); derived from Peters (1991, table 3.1) and OECD (1992, table
6.5).

Middleton (1997) ‘Britain’s economic problem’ 13/40 __________________________________________________________________________________
Table 5 OECD: government current receipts as % of GDP at current prices, selected years, 1950–90
1950 a 1960 1968 1974 1980 1985 1990 G-7: Canada 25.7 31.5 37.2 36.2 38.7 41.6 France 20.6 34.9 38.8 38.4 44.5 47.6 46.5 Germany 29.3 35.0 37.8 42.8 44.9 45.8 43.4 Italy 17.2 28.8 31.6 30.6 33.0 38.1 42.1 Japan 18.8 19.6 24.5 27.6 30.8 34.6 UK 31.1 29.9 37.7 39.6 39.9 42.2 40.0 US b , c 22.8 26.3 28.7 30.4 30.8 31.3 31.8 Other OECD: Australia c 24.4 25.7 28.5 30.7 34.0 29.4 Austria 16.6 34.4 38.9 42.5 46.4 48.5 46.7 Belgium 27.5 33.8 37.7 49.3 53.2 49.5 Denmark 27.3 36.9 48.4 52.2 56.5 56.1 Finland 29.7 34.8 35.7 35.8 40.5 41.2 Greece 21.1 27.3 27.0 30.5 34.6 34.7 Iceland 36.4 33.5 34.1 33.3 32.5 34.9 Ireland c 24.8 31.0 35.2 38.8 43.3 40.1 Luxembourg 32.5 34.5 40.2 53.3 55.9 Netherlands 21.8 33.9 42.4 47.0 52.8 54.3 49.5 New Zealand Norway c 16.6 33.1 41.1 48.5 53.2 55.1 54.9 Portugal c 17.6 21.5 23.0 31.4 35.9 38.7 Spain c 18.1 21.2 22.8 29.7 34.2 36.2 Sweden 22.0 32.1 45.7 48.8 56.3 59.5 63.9 Switzerland 23.3 25.3 29.7 32.8 34.4 34.2 Turkey 21.8 20.8 Averages: EC-9 24.0 30.5 36.1 40.0 45.4 48.5 45.9 G-7 24.2 28.5 32.2 34.8 36.7 39.2 40.0 OECD 22.0 28.1 32.3 36.0 40.3 43.2 41.4
Notes: a Because of the different sources used for the 1950 and 1960–90 estimates, the 1950 and 1960
figures are not strictly comparable. b The 1950 US estimate (12.8), recorded in Peters (1991, table 2.2) is assumed to be an error
and 22.8 has been substituted. c Closest available date to 1990. Sources: Middleton (1996b, table 3.8); derived from Peters (1991, table 2.2) and OECD (1992, table
6.5). the differential experiences of unemployment as between Britain and other OECD states, with the 1920s being relatively worse than the 1930s in the case of the former, and the British downturn beginning in 1929 being far less severe than was the case with most ACCs (Middleton 1996b, p. 93). In terms of public sector size the interwar period can be characterized as exhibiting a process of catch-up and convergence – to borrow the terminology now applied routinely to describe postwar economic growth in the OECD (Feinstein 1990) – with a lower coefficient of variation3 for the expenditure ratios in 1938 in relation to both 1929 and 1913. Fortunately, the data are much fuller and of better quality for the postwar period. Table 4 shows the overall position for Britain in relation to the EC-9, G-7 and OECD states using the SNA definition. Whilst Britain’s expenditure ratio was consistently above that for the G-7 and OECD, it remained around the EC-9 3 This statistical measure is defined as the standard deviation divided by the arithmetic mean,
where the standard deviation is a measure of dispersion around the mean.

Middleton (1997) ‘Britain’s economic problem’ 14/40 __________________________________________________________________________________
average, so that ‘If increases in the public expenditure/GDP ratio count as evidence of sin, there are many sinners.’ (Heald 1983, p.32; see also Hadjimatheou 1987) Indeed, by 1979, when the expenditure ratio stood at 42.9 per cent and exceeded both the G-7 (40.7 per cent) and OECD (42.5 per cent) averages, it was well below the average for EC-9 states (48.8 per cent). Britain’s public sector, by this measure, was thus not out of step with suitable comparators. Furthermore, Britain’s relative position had changed markedly over the preceding thirty years. In 1950 Britain had one of the largest public sectors in Europe (32.1 per cent of GDP as against the EC-9 average of 27.5 per cent), so that over the intervening years it had the slowest rate of growth of the public sector by this measure of the EC countries. The data in Table 4 suggests an approximate inverse relationship between the expenditure ratio in 1950 and the rate of growth of this ratio to the mid- to late-1970s. Clearly there was a process of catch-up and convergence in the 1950s as the coefficient of variation is reduced for the G-7 and EC-9 though not for the OECD grouping (Middleton 1996b, p. 94). Thereafter, the experience of individual countries is more diverse (Lane and Ersson 1990, table 6.5) with the British case being distinctive in that there was a very marked reduction in the expenditure ratio between 1975–9 after an equally marked rise in the years 1973–5, the initial years of the OPEC I price shock. Trends in the receipts ratio broadly mirror those in the expenditure ratio. Thus, from a tax burden considerably above the average for all comparators at the beginning of the postwar period Britain’s public finance system had been transformed to one below the EC-9 and OECD averages by 1979. We will note in the next section that there are good grounds for arguing that the weight of personal taxation was high by international standards in 1979 but at this point we can conclude that the aggregate tax burden was still very much lower than that born by many other much more successful economies. Some additional indicators of the long-run growth of the public sector are given in Figures 5–8 and Table 6. Looking first at public sector employment (Figure5) we observe a near fivefold rise in its share of the total working population between 1900 and 1979, a development which was accompanied by a marked shift from the production of non-market services (defence and general government) to an almost equal balance between non-market services and market and non-market production of goods (the nationalized industries). By this indicator, the process of public sector growth was well-established before the First World War, though evident mainly at the local level. Thereafter, and through to the late 1970s, employment growth was more equally shared between central and local government, while, of course, the period immediately after the Second World War saw a substantial nationalization programme which brought new productive activities (such as coal and railways) into the public sector for the first time and transferred functions previously exercised by public corporations and/or local government. In contrast to the course of the expenditure and receipts ratios, the period after 1979 does mark a very significant turning-point for public sector employment. By 1992 this had fallen below even the 1950 figure, a consequence of sustained de-nationalization and a slight reduction in central government employment, though many of the activities of government were transferred to agencies which were private sector only in name and not funding: a blurring of the boundaries between the public and private sectors which very likely will have important unintended long-term effects.4
4 For Britain and many other ACCs, the period since 1979 can be characterised less as a retreat of the
state than as a redefinition of its core functions; Painter (1991); Wright (1994) and Wallace (1994).

Middleton (1997) ‘Britain’s economic problem’ 15/40 __________________________________________________________________________________
Figure 5 Public sector employment by category as % of total working population, selected years, 1891–1992
Sources: 1891–1979: Middleton (1996b, figure 3.7); 1992–: CSO (1995, table 3.4). Figure 6 GDFCF by sector as % of total GDFCF, 1890–1993a
Note: a It is not possible to decompose public sector investment during the Second World War. Sources: 1890–1979: Middleton (1996b, figure 3.8); 1980–: CSO (1995, table 1.8).

Middleton (1997) ‘Britain’s economic problem’ 16/40 __________________________________________________________________________________
Figure 7 Public sector financial balances as a % of GDP at current market prices, current and capital account, 1900–1993
Sources: As figures 1–2. Figure 8 Ratio of outstanding national debt to GDP, financial years, 1900/1–91/2
Sources: 1900–79: Middleton (1996b, figure 3.9); 1980– CSO (1987b, table 16.3; 1994b, table 16.3;
1995, table 1.2).
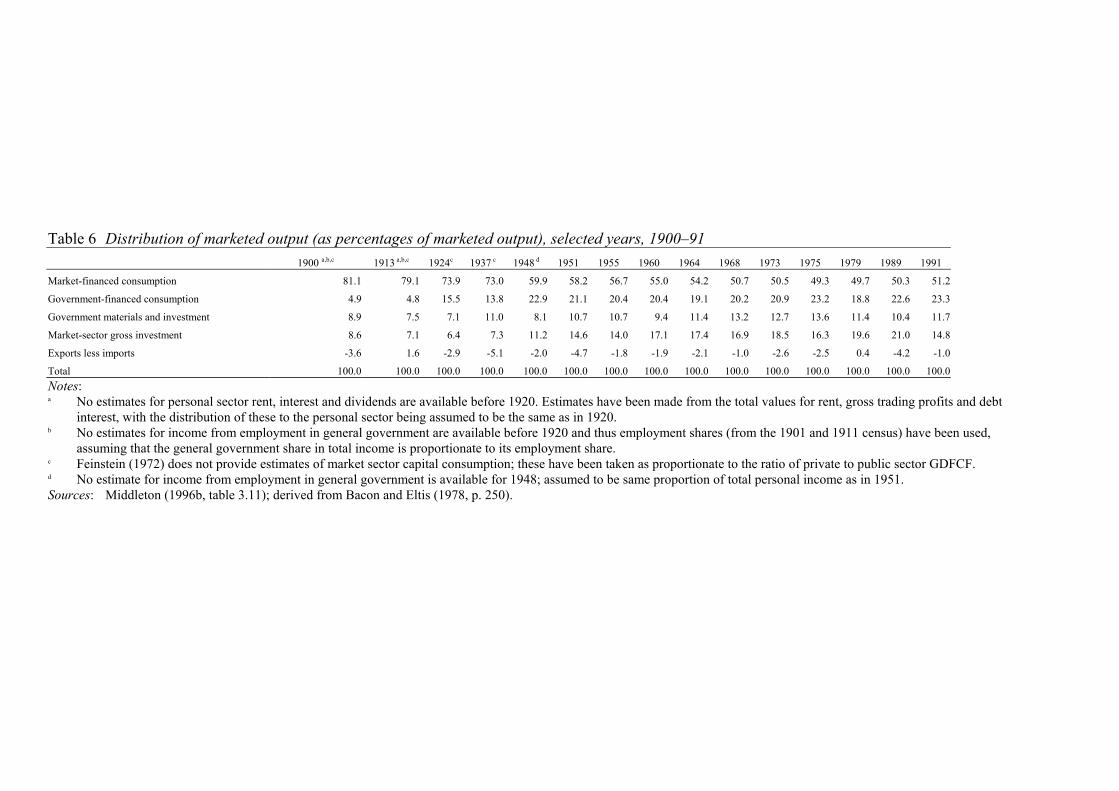
Table 6 Distribution of marketed output (as percentages of marketed output), selected years, 1900–91 1900 a,b,c 1913 a,b,c 1924c 1937 c 1948 d 1951 1955 1960 1964 1968 1973 1975 1979 1989 1991
Market-financed consumption 81.1 79.1 73.9 73.0 59.9 58.2 56.7 55.0 54.2 50.7 50.5 49.3 49.7 50.3 51.2
Government-financed consumption 4.9 4.8 15.5 13.8 22.9 21.1 20.4 20.4 19.1 20.2 20.9 23.2 18.8 22.6 23.3
Government materials and investment 8.9 7.5 7.1 11.0 8.1 10.7 10.7
9.4 11.4 13.2 12.7 13.6 11.4 10.4 11.7
Market-sector gross investment 8.6 7.1 6.4 7.3 11.2 14.6 14.0 17.1 17.4 16.9 18.5 16.3 19.6 21.0 14.8
Exports less imports -3.6 1.6 -2.9 -5.1 -2.0 -4.7 -1.8 -1.9 -2.1 -1.0 -2.6 -2.5 0.4 -4.2 -1.0
Total 100.0 100.0 100.0 100.0 100.0 100.0 100.0 100.0 100.0 100.0 100.0 100.0 100.0 100.0 100.0Notes: a No estimates for personal sector rent, interest and dividends are available before 1920. Estimates have been made from the total values for rent, gross trading profits and debt
interest, with the distribution of these to the personal sector being assumed to be the same as in 1920. b No estimates for income from employment in general government are available before 1920 and thus employment shares (from the 1901 and 1911 census) have been used,
assuming that the general government share in total income is proportionate to its employment share. c Feinstein (1972) does not provide estimates of market sector capital consumption; these have been taken as proportionate to the ratio of private to public sector GDFCF. d No estimate for income from employment in general government is available for 1948; assumed to be same proportion of total personal income as in 1951. Sources: Middleton (1996b, table 3.11); derived from Bacon and Eltis (1978, p. 250).

Middleton (1997) ‘Britain’s economic problem’ 18/40 __________________________________________________________________________________
The respective shares of the private and public sectors in gross domestic fixed capital formation (GDFCF) comprise another suitable indicator of the growth of government (Figure 6), though here we observe that the phase of government growth which had begun with the First World War was exhausted by the early 1950s with the completion of the Attlee governments’ nationalization programme. Thereafter, the private sector share rose, in part because high levels of capital formation were integral to the rapid – by historical standards – growth of the British economy through to OPEC I, but also because from the late 1960s onwards successive governments squeezed public sector investment programmes, an unsurprising result given the natural bias towards the short-term and the stronger political constituencies associated with current expenditure programmes. Thus Mullard (1987, pp. 48–50) has demonstrated that between 1951–67 movements in current and capital expenditure were positively correlated, whereas this relationship was reversed from 1968 onwards so that the continued growth of current expenditure were partially accommodated by relative cuts in capital programmes. Once initiated, the downward course of public investment in GDP was then intensified by growing financial stringency. As a consequence by 1979 Britain was spending only 0.5 per cent of GDP on roads and railways, the lowest of the EC-9**, with the result that Britain’s road network compared unfavourably with its European competitors (Simon 1986, tables IV-V). Widespread backlogs of replacement investment and maintenance had been identified for the late 1970s, particularly in sectors which were later to be privatized or subjected to new forms of administration (water and sewerage, housing, education and hospitals). Such has been the contraction in public investment that by 1992 the share of the private sector in GDFCF now approximated to that prevailing in 1913. It has been suggested that as the crisis in economic policy developed during the 1970s there resulted a more macroeconomic approach towards public expenditure, one in which current and capital programmes were aggregated with less regard for their differential impacts upon economic activity than for their total effects upon the PSBR. As the size of the PSBR became more and more the focus for adverse comment, and the critique of big government gathered force, public expenditure becoming an anathema with a consequent erosion of the distinctive rationale for capital programmes (Mullard 1987, pp 197–8). Since the current account of the public sector was in surplus throughout the whole of the postwar period until 1992 (see Figure 7), so that any PSBR derived from state capital formation, a different system of budgetary accounting and a greater understanding of the public finances might have resulted in a less extreme reaction against state activity and public expenditure after 1979. Soon after the war, John Hicks (1948) had indeed identified the problem that the traditional system of budgetary accounts did not easily accommodate the much increased level of state trading, and would provide misleading signals through the budget balance, and while the budget accounts were eventually brought closer to national income accounting conventions, difficulties remained to haunt both the investment programmes of the nationalized industries and government budgetary polices. On this theme one further point should be made here which is pertinent to both the actual course of Britain’s public sector and the implicit counterfactual. There is evidence for the postwar OECD states that public non-military capital formation is positively correlated with private sector total factor productivity (TFP) growth, and the suggestion has been made that the productivity slowdown after OPEC I followed in part from the lower rates of public investment exhibited after 1973 (Aschauer 1989). Given the fiscal stress experienced by all OECD states at this time, and the political biases working to cut capital more than current expenditure programmes, it

Middleton (1997) ‘Britain’s economic problem’ 19/40 __________________________________________________________________________________
may well be that fiscal policies intensified the productivity slowdown, especially in Britain between 1976–7 when the Labour government made deep cuts in investment programmes (Wright 1977; Thain and Wright 1990). Recent econometric research for Britain suggests that had public infrastructure investment in the 1980s been maintained at the same proportion of GDP as was the case between 1966–79 then labour productivity growth in Britain would have risen from 4 to 4.5 per cent per annum (Lynde and Richmond 1993). Thus, in this case a larger public sector might have reaped dividends for overall economic growth. The relationship between outstanding national debt and national productive capacity detailed in Figure 8 also illustrate the growth of the public sector and the different demands placed upon it, principally by war. The burden of the national debt has also exercised an important, but variable, influence upon twentieth-century British public policy by shaping perceptions of the economically acceptable boundaries of the public sector (Middleton 1996a, pp. 119–22). The downward trend in the debt burden established after the ending of the Napoleonic Wars was brought to an abrupt end by the First World War which saw a fivefold rise in the ratio of debt to GDP, followed by a further slight rise to the eve of the Second World War, a negative inflation tax (Weale 1994). The Second World War then resulted in a further rise, but proportionately much less than in the earlier conflict. Finally, the postwar period was characterized by a declining ratio, the effects of the inflation tax more than compensating for the growth of deficit-financing under the new regime of Keynesian economic management. One effect of the new policy regime was to cast the national debt in a new light, since debt expansion was a necessary by-product of the commitment to full employment and the debt would pose no serious subsequent problems since public and private debt could be conceived quite differently, namely through the doctrine of ‘we owe it to ourselves’ (Musgrave 1985, p. 51). With the demise of the Keynesian system in the 1970s, which in part followed from the very marked deterioration in Britain’s public finances, especially between 1973–5, the issue of the sustainability of the national debt reappeared once more with a renewed emphasis on the effects of the debt burden on the supply of capital and labour, and thus crowding-out (see Boskin et al. 1987 and Cavanna 1988); issues which had exercised public policy before the Second World War. A long run view of the balance, and composition, of the public sector budget is given in Figure 7. The sharp deterioration in the combined balance during the two world wars is a concomitant of the behaviour of the national debt. However, it should also be observed that, during the years before Keynesian deficit-financing was permissible, public sector deficits were more the rule than the exception: of the thirty peacetime years between 1900–38, the combined balance was in deficit on eighteen occasions, with the current account in deficit in seven of these years. Clearly, pre-Keynesian budgetary orthodoxy was more an aspiration than a reality, though the desire for fiscal balance dominated policy (Middleton 1985, chs 5–6). After the Second World War, the public sector was in deficit for all but seven years, but the current account was always in surplus, even during the years of fiscal stress of the 1974–9 Wilson-Callaghan administration. Thus, under the Keynesian policy regime, but not the previous period of budgetary orthodoxy, current receipts always covered current expenditure and deficits reflected public sector fixed capital formation. The more recent deterioration in the public finances, with current receipts falling short of current expenditure from 1992/3, which was occasioned by the erosion of the tax base in the mid-late 1980s and the effect of automatic stabilizers with the business cycle depression of 1989–92, is thus a clear a clear break with postwar trends, as has been observed by a number of commentators (Kelly 1992). Finally, given the central role played by Bacon and Eltis in the attack on big

Middleton (1997) ‘Britain’s economic problem’ 20/40 __________________________________________________________________________________
government we report in Table 6 some long-run estimates of the share of marketed output absorbed by the government sector. Since its inception the Bacon and Eltis thesis has attracted much critical comment, both conceptual and empirical (Middleton 1996b, p. 528), but it is clear from Table 6 that, in general to 1979, the growth of non-marketed output was at the expense of market-sector consumption rather than market-sector investment. Since then, and rather paradoxically given the objective of rolling back the frontiers of the state, government-financed consumption has continued to rise, a consequence largely of mass unemployment. In rejecting the thesis that in the long-run the growth of the public sector was at the expense of private sector investment we also make appeal to the very long period over which the investment ratio in Britain has been significantly below that of comparators (Maddison 1991, table 2.3). This suggests that there were other structural forces in operation, and given the long-run relative decline of the British economy, it is essential not to conflate excess burden and deficiencies in economic performance. This will become clearer as we turn to look in more detail at the postwar period, but first we should note the relative price effect (RPE) and how this distorts the growth of TPE. Figure 9 Relative price of government final consumption expenditure (1979=100), 1890–1993a
Note: a Defined as general government final consumption expenditure price deflator divided
by GDP (market prices) deflator. Sources: 1900–79: Middleton (1996b, figure 3.1); 1980–: CSO (1994a, table 1.7). A long-term perspective on the RPE is provided by Figure 9 which shows the upward trend in the price of government goods and services relative to the general price level. It is important to distinguish between the various channels through which the RPE operates. For national income accountants the RPE is a consequence of the relative price of public sector inputs rising faster than the relative price of private sector final outputs, a phenomenon in turn due to the convention that no productivity benefits are imputed to the activities of general government. In other words, the RPE is a measurement problem: it tells us nothing of substance about the relative efficiency of market-sector versus non-market-sector activities. However, the RPE

Middleton (1997) ‘Britain’s economic problem’ 21/40 __________________________________________________________________________________
can also be invoked to make stronger statements about non-market efficiency. Thus, for example, in the Baumol (1967) model the relative price of non-market services rises because they are more labour-intensive and technologically less progressive than those in the market sector (for example, some 60 per cent of NHS expenditure is labour costs – Cullis and Jones 1987, p. 85), while Peacock and Wiseman (1979) and many others have gone further to argue that non-market sector inefficiency stems from institutional barriers made possible by the absence of competitive disciplines, i.e. X-inefficiency. Figure 10 TPE as a % of current and constant price GDP, 1950–80
Source: Derived from Parry (1987, table 1). The consequence of the RPE is that, as Parry (1986, p. 164) concluded in his survey of postwar British public expenditure, ‘Public sector relative growth largely disappears when the measure is in constant prices.’ His data, which uses a slightly different definition of TPE than that employed earlier, is reproduced in Figure 10. We have already seen that when the British public sector is measured by the conventional indicators, the expenditure and tax ratios and public employment share, there is a pattern of an initially high starting point, as immediate postwar changes consolidated developments of the interwar period in the provision of public, semi-public and merit goods, followed by low and uneven growth. In current prices the expenditure ratio increased by just short of 20 percentage points over the period 1937–79, a rise of three-quarters, but with the greater part of this being concentrated over the trans-war period 1937–51, so that there was only a rise of 8.4 percentage points of GDP since 1951. Moreover, when measured in constant prices, even this growth largely disappears. Thus Parry’s estimate of the expenditure ratio at current prices grows from 37.1 to 44.9 per cent between 1951–79, but only from 44.1 to 46.2 per cent at constant 1975 prices. Our long-run series for the tax ratio also shows how slight has been the increase in the state’s absorption of resources: a rise of 17.6 percentage

Middleton (1997) ‘Britain’s economic problem’ 22/40 __________________________________________________________________________________
points of GDP over 1937–79, of which only 4.3 percentage points occurred since 1951. The RPE has added significance because all public finance systems are subject to its operation, being particularly evident in public health and education in all G-7 countries. However, it is extremely difficult to say whether it was stronger in Britain, although Klein and Scrivens (1985, table 2) estimate the RPE for these two programmes to be less evident between 1960–75 in Britain than in Germany and Japan. Our concern here is not to deny that public sector outputs in Britain were subject to technical and productive inefficiencies, but rather to highlight the lack of cross-country evidence that such characteristics were stronger in Britain than in other ACCs and can therefore be linked directly to broader economic failure (for assessments of the RPE in Britain, see Price 1979 and Levitt and Joyce 1987). It is, therefore, no exaggeration to conclude that the attack on big government launched by agencies such as the IEA rested on very flimsy empirical foundations and a insularity all too typical of public policy debate in Britain. 5 3 Public finance and economic performance since 1945 Our starting point is that economists have never been able to identify a clear relationship between public finance systems and economic performance. There have been many attempts to do so (for balanced surveys, see Cameron 1982 and Saunders 1985), and in particular to set supply-side limits to economies beyond which lies degeneration into inflation and/or stagnant output (Shoup 1981), as for example in Clark’s (1945) proposition that the maximum sustainable tax ratio in a capitalist country was about 25 per cent or, more recently, Friedman’s (1976) warning that an expenditure ratio beyond 60 per cent of GDP was the line that we dare not cross. Figure 11 portrays a typical aggregate approach to this issue by charting the growth of the expenditure ratio against the GDP growth rate for 1950–93 for the principal OECD countries. This yields a correlation coefficient of -0.27 which,6 while of the right sign for those of the Leviathan public choice school, indicates more what is lacking from such an approach than what it captures. In particular, there is too much noise here from catch-up and convergence, while the empirical work on public finance systems and economic growth is typically bedevilled by problems of multicollinearity as fiscal variables tend to be highly correlated with the level of income as well as with each other (Easterly and Rebelo 1993, p. 419). Moreover, what is distinctive here about the British case is the low growth of both its public sector and real GDP. However, one possible avenue for future research is to seek escape from such essentially static exercises by considering whether the adverse effects of a large public sector are only revealed over time, as for example in delayed adjustments by private economic agents to the potential disincentive effects of welfare policies (Lindbeck 1995). In such a dynamic world there may well be statistically robust relationships between economic growth, public sector size and the duration of big government beyond some watershed expenditure/tax ratio.
5 For example, the two IEA (1979; 1980) volumes of readings on excess bias were almost wholly
literary in approach and contained no empirical research of substance. 6 The correlation coefficient (r) measures the strength of the linear association between two
variables, the higher the value the greater the association, and where a negative value denotes an inverse relationship.

Middleton (1997) ‘Britain’s economic problem’ 23/40 __________________________________________________________________________________
Figure 11 Ratio of 1993 to 1950 general government expenditure as % of GDP and annual average growth rate of real GDP, 1950–93
Sources: Expenditure ratio: 1950: as table 4; 1993: OECD (1994, table 27); GDP growth rate
calculated from Maddison (1991, table A.8) and OECD (1994, table 1). Recent developments in economics, in particular endogenous or new growth theory, offer the prospect of richer explanations of long-run economic growth.7 This diverse body of theoretical and empirical work emphasises that economic growth is not an exogenous process, principally determined by technological change manifest as the residual or TFP in the neo-classical growth accounting framework, but an endogenous outcome of the economic system and that economists must seek to ‘uncover the private and public sector choices that cause the rate of growth of the residual to vary across countries’ (Romer 1994, p. 3). Accordingly, there has been a renewal of interest in capital formation, both human and physical, in market and non-market sector institutions and in government policies. More particularly, whilst there remain enormous problems in using cross-country multiple regression techniques to explore empirical relationships between long-run growth and economic, social and political variables (Levine and Renelt 1992), there is now a flurry of interest in the role of both government macroeconomic (public finance) and microeconomic (commercial policies and property rights) policies. Much of this work remains provisional, but already there appears to be the important preliminary conclusion that ‘small differences in policy regimes can easily make the difference between growth and stagnation’ (Rebelo 1991, p. 520; see also Barro 1991, pp. 430–4). Beyond this the very latest work, which uses cross-sectional and panel regressions on the Summers and Heston (1991) dataset of 130 countries, 7 For literature surveys and general introductions, see the special issue of Oxford Review of
Economic Policy, vol. 8.4 (1992) and the symposium in Journal of Economic Perspectives, vol. 8.1 (1994). The potential of endogenous growth theory to offer new insights into Britain’s RED has been explored by Crafts (1995a; b) and Bean and Crafts (1996).

Middleton (1997) ‘Britain’s economic problem’ 24/40 __________________________________________________________________________________
suggests that economic growth is negatively correlated with inflation and budget deficits with a direction of causation running from ‘good’ macroeconomic policy to economic growth (Fischer 1993; Easterly and Rebelo 1993). The effects of taxation have proved very difficult to isolate empirically, but there are more robust findings that growth is positively correlated with government investment in the material infrastructure and in human capital (Barro 1990; . van der Ploeg and Tang 1992). In short a premium is placed on fiscal conduct and on policy stability, with the structure of public finance systems being important as well as the size of the public sector. It should be remembered, however, that such findings all derive from statistical tests in which some countries have high growth but do not conform to the broad correlates, and thus robust policy conclusions do not necessarily follow for any particular country. Indeed, as Lane and Ersson’s (1990, tables 6.11–6.12) detailed cross-country work on postwar OECD public finance systems makes clear there has been considerable diversity of experience, with the British case clearly an outlier in terms of the correlates of public expenditure growth. Thus econometric work suggests that ‘politics matters’ more in the British case, with party instability and the partisanship of government being especially significant. This conclusion needs to be related to one drawn earlier: that recent research suggests that even small differences in policy regimes can have significant effects on growth potential. In the remainder of this section we explore further the notion of whether Britain’s postwar public finance system was distinctively different from the EC or OECD norm and then progress to consider in more detail the case made in the 1970s that Britain’s economy was being debilitated by fiscal imprudence, high taxation and overly generous welfare payments, three key elements of the burgeoning New Right’s attack on big government. In the following, which draws upon a wide range of OECD and other studies,8 the statistical matter has been highly condensed so that we can concentrate on identifying the principal conclusions that follow from a comparative examination of trends in public finance systems. Beginning with the expenditure side of the account, and with spending by economic category, there were a number of distinctive features of Britain’s postwar public finance system. First, the weight of final consumption in TPE was high relative to comparators, and in particular defence expenditures which, as a proportion of GDP, were second only to the US (see Table 7 for a longer-term perspective). Secondly, for much of the period from the mid-1950s to the mid-1970s, debt interest exercised an above average influence on the budget, one of the legacies of war in the first instance and fiscal policies in the second. Thirdly, and conversely, British transfers and subsidies, which have been consistently below the average, are distinctive in terms of the importance of producers as against households, one lending credence to the proposition that are actually two ‘welfare states’ in most ACCs – one supporting the incomes of households and the other the profitability of firms (Friedland and Sanders 1985). Fourthly and finally, capital formation was consistently above average and particularly in the 1960s. A more detailed breakdown of expenditure by programme reveals five significant characteristics of the British case. First, total expenditure on education was typical for the OECD, but was, in particular, higher than in Germany. Secondly, whilst total expenditure on health was again close to the system average, most European states relied much more heavily on subsidising private health systems through insurance than in Britain where there was very substantial direct public output of health care services funded from general taxation (Heidenheimer et al. 1990, table 3.2). Thirdly, and with
8 In particular, OECD (1978; 1981); for a fuller discussion, see Middleton (1996b, chs. 3, 11).

Middleton (1997) ‘Britain’s economic problem’ 25/40 __________________________________________________________________________________
the exception of France, the major European economies provided a significantly higher level of support for income maintenance (unemployment and other benefits). Fourthly, it appears that there was a stronger commitment to investment in public housing than elsewhere in Europe. In 1970, 48.6 per cent of dwellings completed were constructed by public authorities as against 0.7 and 2.3 per cent respectively in France and Germany, where there were much more substantial non-profit constructors such as housing associations (Heidenheimer et al. 1990, table 4.1). Finally, Britain was an above average spender on trade and industry, mirroring the commitment to the other welfare state. Table 7 G-7: defence expenditure as % of GDP, selected years, 1950–93
1950 1955 1960 1965 1970 1975 1980 1985 1990 1993 Canada 2.6 6.3 4.2 2.9 2.4 1.9 1.8 2.2 2.0 1.9 France 5.5 6.4 6.5 5.2 4.2 3.8 4.0 4.0 3.6 3.4 Germany 4.4 4.1 4.0 4.3 3.3 3.6 3.3 3.2 2.8 2.6 Italy 4.3 3.7 3.3 3.3 2.7 2.5 2.4 2.2 2.1 2.0 Japan n.a. 1.8 1.1 0.9 0.8 1.0 1.0 1.0 1.0 1.0 UK 6.6 8.2 6.5 5.9 4.8 4.9 5.1 5.1 4.1 3.8 US 5.1 10.2 9.0 7.6 8.0 5.9 5.6 6.4 5.5 4.8 G-7 average 4.8 5.8 4.9 4.3 3.7 3.4 3.3 3.4 3.0 2.8
Sources: 1950–80: derived from Chalmers (1985, table 10); 1985–93: SIPRI (1994, tables 12.4, 13E.5).
It might be concluded from the above that, with the major exception of the much heavier defence burden, there was nothing particularly significant about the structure of Britain’s public expenditure by the 1970s. Caution, however, is suggested in the interpretation that should be placed upon the economic significance of comparative expenditure data. Thus, for example, in the case of education attention is now shifting from quantitative to qualitative concerns, in part because of the rising financial cost of demand-driven educational systems but also because of a reappraisal of the economic benefit-costs (Aldcroft 1992, pp. 18–19). The new focus of attention upon qualitative issues, such as the structural mix of expenditures as between sectors (further/vocational versus higher education), subjects (science/technology versus the humanities), and the general problem of creeping credentialism are particularly pertinent to the British case where deficiencies in Britain’s educational system were almost universally seen as a contributory factor in relative economic decline (Barnett 1986; Davies and Caves 1987; Sanderson 1988; Eltis and Higham 1995). Turning now to the tax side of the account, we noted in section two that, as with the expenditure ratio, Britain began the postwar period with a tax take which was comparatively high by international standards. Subsequently, other countries caught up and there occurred a process of convergence such that by 1979 the British receipts ratio at 34.0 per cent exceeded the G-7 average (32.8 per cent), but was below that for the OECD (35.1 per cent) and EC-9 (39.9 per cent), indeed by nearly six percentage points of GDP in the case of the latter comparator (Middleton 1996b, table 3.8). Whilst there was a process of convergence in the overall tax ratio, there was a divergence for Britain from the average tax structure of the OECD though this was not so much due to conscious design as to political inertia in which ‘big changes in the economy and small-scale decisions about tax rates have cumulatively produced a big change in the British tax system’ (Rose and Karran 1987, table 9.1, p. 220). Moreover, it is clear from Table 5 that for the first half of the 1960s the rise in the receipts ratio was about average for the OECD, but not for the second half when the rise in the British receipts ratio was double that of the average of the comparators. The trend was then reversed in the 1970s, with the EC-9 experiencing a growth in the tax take through to the end of the decade, whilst in Britain the receipts ratio was

Middleton (1997) ‘Britain’s economic problem’ 26/40 __________________________________________________________________________________
falling from mid-decade. Examination of the cross-national data on the tax structure of the OECD reveals four main trends: first, an increase in the receipts ratio; secondly, an increased reliance on taxes on income and social security contributions with a reduced reliance on general consumption taxes; thirdly, a substantial increase in the share of receipts from taxes on the income of persons and employers social security contributions; and fourthly, a marked reduction in the share of receipts from taxes on goods and services with smaller decreases in the shares from taxes on the income of corporations, property and wealth taxes. We have already seen that the UK shared far less in the overall rise in the receipts ratio, but it was also distinctive in other ways, particularly in relation to the EC-9** countries. Thus both in 1955 and 1980, two years for which we have very detailed OECD estimates, the UK tax structure was heavily biased towards taxes on income, particularly on personal incomes, and even more so if social security contributions are taken into account. The erosion in the contribution of corporations to taxes on income was considerably above the average for all three comparators in Table 5, though conversely the rise in employers’ social security contributions was also above the average. Finally, Britain also experienced a most marked reduction in the contribution of taxes on goods and services, in part because of the UK’s more pronounced price inflation which led to an erosion of the effective rate of tax of the specific duties (Ward and Neild 1978, pp. 45, 53). Such international comparisons are helpful in addressing simple political propositions concerning the supposed relationship between Britain’s tax take and deficiencies in economic performance, though they are subject to the well-known difficulty that they exclude tax expenditures and do not capture regulatory differences between countries (Willis and Hardwick 1978). However, given the political prominence that taxes on both personal and corporate incomes assumed by the 1970s we should investigate whether there was something distinctive about the operation of these taxes in Britain, and in particular whether marginal rates were out of line with comparators. Taking corporate taxation first, it is clear that the tax treatment of dividends and retained earnings oscillated over the period as a whole, first favouring one and then the other with consequent implications for company borrowing (debt versus equity finance) and the inducement to invest (Kay and King 1978, p. 190). Wiseman (1980, pp. 9, 31–3, 37, 80–1, 135) in his comparative study of business taxation in the UK and Germany stressed a number of differences:9 the greater volatility of the tax take and of the tax structure, which derived from taxation being much more of a weapon of political competition in Britain; acceptance and use of retrospective tax legislation in Britain, contrary to German practice and possibly resulting in more tax avoidance/evasion and higher compliance costs in Britain; the UK corporate tax system biasing company choice against equity sources of long-term capital whereas it was neutral in Germany; and some evidence that UK tax arrangements resulted in inefficient or unjustified discrimination against small firms. Following Kay and King (1978, ch. 12) in their study of company taxation, Wiseman agreed that reform was necessary, but in both countries (see also King et al. 1984). More broadly, in terms of the G-7 countries, the rates of business taxation do not
9 Until 1947, and with the exceptions of the two world wars, the taxation of corporations was
integrated with the personal income tax system. Between 1947-58 taxation of corporate earnings differentiated between distributed and retained profits, being replaced by a uniform rate until 1965 when a classical-system corporation tax was introduced. This was changed in 1973 to an imputation system, with major assistance for stock relief in 1975 as inflation (artificially) increased the proportion of gross company income deriving from this source: see Price (1978, p. 165) and Wiseman (1980, p. 77).

Middleton (1997) ‘Britain’s economic problem’ 27/40 __________________________________________________________________________________
appear unduly high in the aggregate, being relatively low as a percentage of net output but relatively high in relation to profits (Kay and Sen 1983). However, there is quite considerable evidence of variations in non-domestic rates between areas which distorted and magnified biases in the corporate tax structure (Bennett 1986). The most striking characteristic of business taxation in Britain was how efforts to promote economic growth through higher investment undermined the corporate tax base and resulted in a downward trend in the effective rate of tax on corporate incomes (Figure 3C), this to the point the majority of large corporations paid no mainstream corporation tax by the late 1970s (Kay and King 1978, table 12.1). This needs admittedly to be seen within the context of a declining net profit rate in both manufacturing and the business sector which affected Britain, Germany and other ACCs, especially in the 1970s (Armstrong et al. 1991, tables A1-A2). It appears, therefore, that our focus should be more upon the relatively low level of the pre-tax profit rate in Britain, though clearly there is evidence that the operation of the tax system distorted company choice and therefore resource allocation. Turning now to personal taxation, empirical studies of the effects of taxation on labour supply during the 1970s were unable to locate any clear disincentive effects for the great majority of taxpayers, though far fewer studies were conducted on the labour supply elasticity of high income groups and womens’ labour supply did appear more responsive to changes in the real wage rate (IFS 1978, app. 2.1; Brown 1980). Such evidence was not to deter the incoming Conservative government, with Geoffrey Howe prefacing his June 1979 budget, which cut the standard rate of income tax from 33 to 30 per cent (with a long-term target of 25 per cent) and the top rate (on earned income) from 83 to 60 per cent,10 with the comment that ‘Excessive rates of income tax bear a heavy responsibility for the lacklustre performance of the British economy’ (cited in Holmes 1985, p.23).11 Whatever the potential disincentive effects it remains the case, however, that in terms of the EC-9 Britain by 1975 had the third lowest threshold for income tax and the highest initial and maximum rates; and that in terms of average tax rates,12 Britain had the highest average tax rate at average earnings and the second highest at twice and three times average earnings (IFS 1978, tables 5.16–5.17). While all EC countries experienced a shift in the tax mix towards a greater contribution from taxes on income and social security contributions, in Britain the effective average and marginal rate of tax on average earnings were considerably above the EC-9* average (Sawyer 1982, tables 7.3, 7.5). It is estimated that in 1949 the earnings of a married man with two children became liable for income tax at 103 per cent of average earnings and 187 per cent for the full standard rate, whereas by 1975 the full standard rate applied at just 44.6 per cent of average earnings. By that date families on the official poverty line were subject to income tax, and faced the highest marginal rate of all income earners
10 The top rate of 83 per cent on earned income, when combined with the investment income
surcharge of 15 per cent, was equivalent to a marginal rate of 98 per cent. However, in 1978/9 only 19,200 tax payers had such a marginal rate, equivalent to 0.09 per cent of the total number of income tax payers (calculated from HMSO 1981, tables 16, 19). No doubt more vocal and politically influential than the average tax payer, in terms of numbers they were dwarfed by those low income groups facing marginal rates which actually exceeded 100 per cent because of the interaction of the tax and benefit systems. In 1979/80 there were an estimated 80,000 families in the ‘poverty trap’ (Pond 1982, p. 55).
11 See also Beenstock (1979) for an attempt to apply the Laffer curve to the British case, a paper which generated a heated debate about the existence of such a relationship and the real motives underlying cuts in the rates of income tax (Lloyd Bank Review, 135 (January 1980), pp. 41-4; 136 (April 1980), pp. 43-51).
12 For a married man with two children, and taxation including social security contributions.

Middleton (1997) ‘Britain’s economic problem’ 28/40 __________________________________________________________________________________
(Lowe 1993, p. 285). These characteristics of Britain’s welfare and tax systems no doubt fuelled the perception that the rising costs of welfare benefits were largely being paid by those on average and below average incomes. The significance of high personal taxation may lie, therefore, more with its structure, its implications for social policy, the welfare benefits system and perceptions of fairness with all their ramifications for organized labours’ willingness to enter into social bargains with government and employers. Given the recent focus of research on the role of institutions in explaining the rapid economic growth of the OECD states in the quarter century preceding OPEC I, and in particular in the ways in which they solved problems of commitment and coordination, thereby guaranteeing wage moderation, one of the preconditions for high investment (Eichengreen 1994), public finance systems deserve further study if we are to understand more of the growth process. The next part of the critique of big government requiring consideration concerns the claims made that economic growth was sacrificed for the pursuit of high welfare expenditures. The New Jerusalem thesis of Barnett (1986; 1995) and others has been more than adequately demolished by Harris (1990), Tomlinson(1995) and others, while the available comparative data on social expenditures clearly reveals that by the 1970s Britain’s public finance system was below average for this expenditure function (Gillion and hemming 1985). Indeed, over the 1970s as a whole welfare expenditures in Britain amounted to only 9 per cent of GDP, the lowest figure of the EC-9 states which averaged 13.9 per cent (Lane and Ersson 1990, table 6.5). Much of the reaction against big government in Britain in the 1970s derived from a rather different perception of welfare expenditures. As Cameron (1985, p. 18) observes: ‘This discrepancy between the level of welfare spending effort and the political rhetoric surrounding this domain of policy suggests that welfare spending in nations such as Britain ... provides a convenient political scapegoat for those who wish to attack the scope of government activity – activity which is, by the measure of final consumption expenditure, in fact unusually large.’ Since final consumption expenditure was comparatively large in Britain because of above-average defence expenditures, and since the constituency supporting defence spending correlates – as it also does in America – with those seeking to cut the expenditure ratio, the stage was set for a bitter distributional conflict in the 1980s. It is thus to the possible disincentive effects of welfare expenditures that the New Right might have a plausible case. Such cross-sectional evidence as there is would not support the claim that replacement ratios in Britain were high by international standards (Sorrentino 1981, table 6.12), and indeed one would not expect such an outcome given the limited objectives of the British system for income maintenance programmes. Nonetheless, a number of economists since Maki and Spindler’s (1975) initial paper have sought to demonstrate that the introduction of earnings-related unemployment benefit in 1967 increased the search time of the unemployed. Layard, Nickell and Jackman’s (1991), ch. 5, pp. 448–9) exhaustive study of unemployment did find a correlation between benefit levels and unemployment duration in Britain and other ACCs, but the question arises whether the lower probabilities of re-employment for the long-duration unemployed owed more to the undermining of work skills than to disincentives effects. This suggests once more that deficiencies with vocational education and training contributed to unemployment duration, and that without remedial action there were few incentives for employers to hire the long-term unemployed, especially given the upward trend to unemployment from the mid-1960s. Moreover, from their examination of nineteen OECD states, Layard et al. concluded that in adjusting to exogenous shocks there was some evidence that the economies that performed best were those in which there was a high degree of competition in product markets, benefit systems that discouraged long-duration

Middleton (1997) ‘Britain’s economic problem’ 29/40 __________________________________________________________________________________
unemployment, and either competitive non-unionized labour markets or unionized labour markets characterized by strong central coordination. Britain compared poorly against all of these criteria. The final element of the New Right’s case requiring consideration concerns the supposed bias towards deficit-finance inherent in the Keynesian consensus, thereby creating scope for political business cycles, a motive force for excess bias and the possibility that public sector deficits would crowd-out private sector investment. Taking each in turn, we find no unambiguous evidence on the existence of political business cycles in postwar Britain. Clearly governments included electoral considerations in their objective or reaction function, but the econometric evidence on the relationship between the key dependent variables (typically real income growth, unemployment and inflation) and government popularity is highly ambiguous, leading Mosley (1984, p. 3) to conclude from his extensive review of the literature that in Britain for 1953–81 ‘The “vote function” relating popularity, inflation and unemployment is just too unstable to act as a menu for policy choice.’ This leads directly to the suggestion that it was this imprecision which encouraged pre-election boosts to personable disposable income, for they were unlikely to backfire in terms of subsequent electoral popularity, and that a premium was placed on the presentation of economic facts to the public. That part of the New Right’s critique which derives from the public choice school of Buchanan, Tulloch and others also misunderstands both the motives for adopting Keynesian fiscal policies and (Middleton 1996, ch. 11), more importantly, the actual facts about the public sector balance since the Second World War (see Figure 7). It is now apparent that Keynesian demand management and functional finance came to be adopted in Britain in rather different circumstances from those in which such policies had been framed in the 1930s. Thus, in the late 1940s and early 1950s, the appeal of the Keynesian system for the Treasury was that, in the context of excess demand, it provided a new rational for budget surpluses and restraint in public expenditure (Rollings 1988) with Conservative administrations in the 1950s ‘reluctant Keynesians [who] practised demand management only so long as it did not conflict with what they took to be sound principles,’ while in any case demand management never entailed more than very marginal adjustments to the PSBR because the economy rarely needed much management (Cairncross 1992, p. 95). Accordingly, one must look to the 1960s and beyond for the practical effects of the change in fiscal regime. Moreover, apart from 1951–5, which was much affected by the Korean War, and the 1970s, the adjustment to OPEC I, Britain’s budget deficit was consistently and significantly below the OECD average (Cavanna 1988; Mueller 1989, table 15.5; and Peters 1991, table 3.3). However, whilst the deterioration in public sector finances of the early 1970s was common to almost all the OECD countries, it was much worse in Britain (Chouraqui 1988, table 1.1), but the move into sustained deficits predates OPEC I and the early attempts of the 1974 Wilson government to stabilize demand at a time when other G-7 countries, particularly Germany and Japan, were deflating demand to regain current account balance of payments equilibrium. Thus it is to the Heath years that we must look for the beginnings of fiscal crisis in Britain. We return, therefore, to the rather special circumstances of the 1970s and their potential for over-interpretation. It remains to address one final issue raised by fiscal policy: the charge that government expenditure and/or public sector borrowing crowded-out private expenditures. The 1970s critique of Keynesian conventional wisdom assumed a number of forms: that deriving from the monetarist revival, and then the new classical macroeconomics, which pointed to the impotency of fiscal policy; that which concentrated on differences in the efficiency of resource use in the private and public
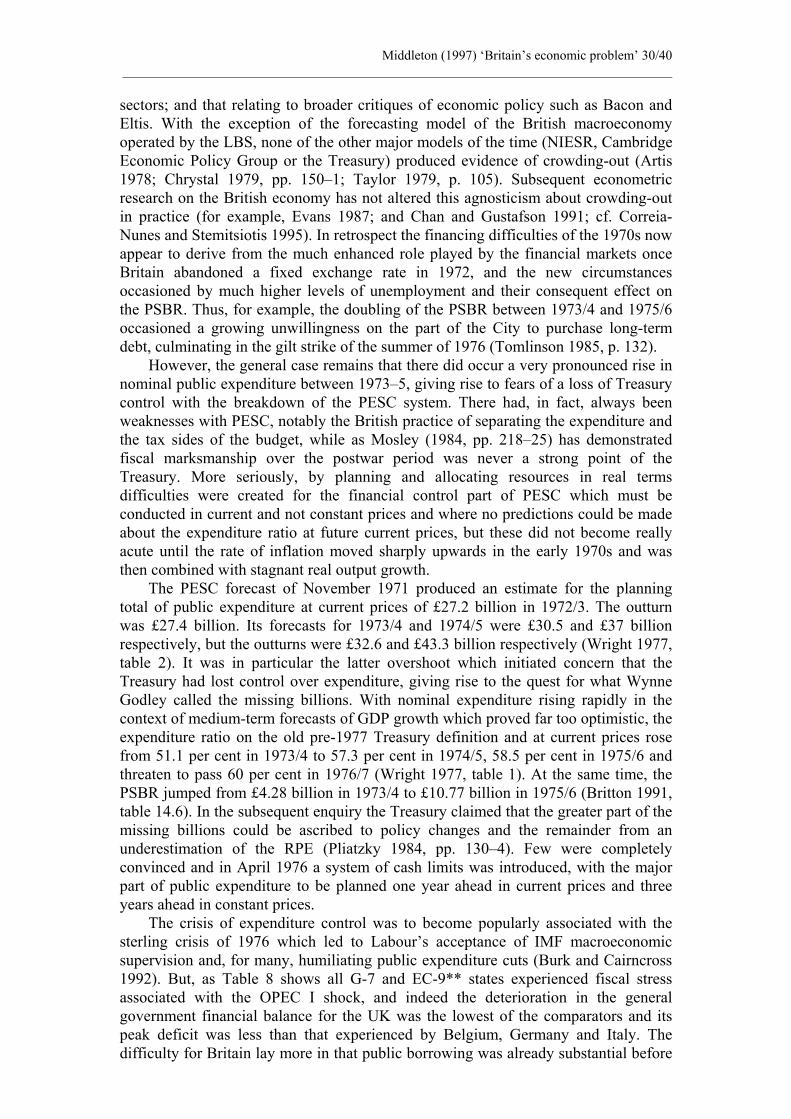
Middleton (1997) ‘Britain’s economic problem’ 30/40 __________________________________________________________________________________
sectors; and that relating to broader critiques of economic policy such as Bacon and Eltis. With the exception of the forecasting model of the British macroeconomy operated by the LBS, none of the other major models of the time (NIESR, Cambridge Economic Policy Group or the Treasury) produced evidence of crowding-out (Artis 1978; Chrystal 1979, pp. 150–1; Taylor 1979, p. 105). Subsequent econometric research on the British economy has not altered this agnosticism about crowding-out in practice (for example, Evans 1987; and Chan and Gustafson 1991; cf. Correia-Nunes and Stemitsiotis 1995). In retrospect the financing difficulties of the 1970s now appear to derive from the much enhanced role played by the financial markets once Britain abandoned a fixed exchange rate in 1972, and the new circumstances occasioned by much higher levels of unemployment and their consequent effect on the PSBR. Thus, for example, the doubling of the PSBR between 1973/4 and 1975/6 occasioned a growing unwillingness on the part of the City to purchase long-term debt, culminating in the gilt strike of the summer of 1976 (Tomlinson 1985, p. 132). However, the general case remains that there did occur a very pronounced rise in nominal public expenditure between 1973–5, giving rise to fears of a loss of Treasury control with the breakdown of the PESC system. There had, in fact, always been weaknesses with PESC, notably the British practice of separating the expenditure and the tax sides of the budget, while as Mosley (1984, pp. 218–25) has demonstrated fiscal marksmanship over the postwar period was never a strong point of the Treasury. More seriously, by planning and allocating resources in real terms difficulties were created for the financial control part of PESC which must be conducted in current and not constant prices and where no predictions could be made about the expenditure ratio at future current prices, but these did not become really acute until the rate of inflation moved sharply upwards in the early 1970s and was then combined with stagnant real output growth. The PESC forecast of November 1971 produced an estimate for the planning total of public expenditure at current prices of £27.2 billion in 1972/3. The outturn was £27.4 billion. Its forecasts for 1973/4 and 1974/5 were £30.5 and £37 billion respectively, but the outturns were £32.6 and £43.3 billion respectively (Wright 1977, table 2). It was in particular the latter overshoot which initiated concern that the Treasury had lost control over expenditure, giving rise to the quest for what Wynne Godley called the missing billions. With nominal expenditure rising rapidly in the context of medium-term forecasts of GDP growth which proved far too optimistic, the expenditure ratio on the old pre-1977 Treasury definition and at current prices rose from 51.1 per cent in 1973/4 to 57.3 per cent in 1974/5, 58.5 per cent in 1975/6 and threaten to pass 60 per cent in 1976/7 (Wright 1977, table 1). At the same time, the PSBR jumped from £4.28 billion in 1973/4 to £10.77 billion in 1975/6 (Britton 1991, table 14.6). In the subsequent enquiry the Treasury claimed that the greater part of the missing billions could be ascribed to policy changes and the remainder from an underestimation of the RPE (Pliatzky 1984, pp. 130–4). Few were completely convinced and in April 1976 a system of cash limits was introduced, with the major part of public expenditure to be planned one year ahead in current prices and three years ahead in constant prices. The crisis of expenditure control was to become popularly associated with the sterling crisis of 1976 which led to Labour’s acceptance of IMF macroeconomic supervision and, for many, humiliating public expenditure cuts (Burk and Cairncross 1992). But, as Table 8 shows all G-7 and EC-9** states experienced fiscal stress associated with the OPEC I shock, and indeed the deterioration in the general government financial balance for the UK was the lowest of the comparators and its peak deficit was less than that experienced by Belgium, Germany and Italy. The difficulty for Britain lay more in that public borrowing was already substantial before

Middleton (1997) ‘Britain’s economic problem’ 31/40 __________________________________________________________________________________
OPEC I struck, and no amount of redefinition of public expenditure was going to convince financial markets that all was well. In fact, Heald’s (1983, table 2.1) analysis shows how false were much of the fears about the control of public expenditure, while of course the expenditure ratio and the PSBR fell markedly in the last three years of Labour’s period in office. Indeed, when adjusted for inflation the real value of public sector debt was lower when Labour left office than in 1974 (Eltis 1988, figure 3.1). Table 8 UK and comparators: general government financial balances as % of nominal GNP, 1973–6 Maximum deterioration 1973 1974 1975 1976 between 1973–6 (% points) Belgium (3.5) (2.6) (4.7) (5.4) 2.8 Canada 1.0 1.9 (2.4) (1.7) 4.3 Denmark 5.2 3.1 (1.4) (0.3) 6.6 France 0.9 0.6 (2.2) (0.5) 3.1 Germany 1.2 (1.3) (5.7) (3.4) 6.9 Italy (8.5) (8.1) (11.7) (9.0) 3.6 Japan 0.6 0.4 (2.7) (3.7) 4.3 Netherlands 0.6 (0.4) (3.0) (2.9) 3.6 UK (3.4) (3.8) (4.7) (4.9) 1.5 US 0.6 (0.3) (4.2) (2.1) 4.8 Averages: EC-9** (1.1) (1.8) (4.8) (3.8) 4.0 G-7 (1.1) (1.5) (4.8) (3.6) 4.1 Source: Derived from Chouraqui (1988, table 1.1). 1992). But, as Table 8 shows all G-7 and EC-9** states experienced fiscal stress associated with the OPEC I shock, and indeed the deterioration in the general government financial balance for the UK was the lowest of the comparators and its peak deficit was less than that experienced by Belgium, Germany and Italy. The difficulty for Britain lay more in that public borrowing was already substantial before OPEC I struck, and no amount of redefinition of public expenditure was going to convince financial markets that all was well. In fact, Heald’s (1983, table 2.1) analysis shows how false were much of the fears about the control of public expenditure, while of course the expenditure ratio and the PSBR fell markedly in the last three years of Labour’s period in office. Indeed, when adjusted for inflation the real value of public sector debt was lower when Labour left office than in 1974 (Eltis 1988, figure 3.1). 4. Conclusions A first step in deriving some conclusions about the veracity of the case made against Britain’s public sector in the 1970s is to examine comparative public finance trends since the Conservatives took office in 1979. Given the 1979 diagnosis cited earlier, that ‘Public expenditure is at the heart of Britain’s economic difficulties’ (HMSO 1979, para 1), and the commitment to reduce the expenditure and tax ratios, their subsequent course provides a sin qua non of the government’s success. However, as Figure 12 shows the practical achievements fall somewhat short of the rhetoric. It was not until the boom year of 1987 that the expenditure ratio fell below the 1979 level, and it was to rise once more after 1990, ending the period 2.6 percentage points of GDP above the 1979 figure. The UK receipts ratio did not finally fall below the 1979 level until 1992. The problem, of course, was the heavy budget charge of the two

Middleton (1997) ‘Britain’s economic problem’ 32/40 __________________________________________________________________________________
depressions of 1979–81 and 1989–92 and the permanently higher level of unemployment which has had to be funded. In mitigation it might be argued that British expenditure and tax ratios are now much closer to the OECD averages than was the case in 1979, and that if comparison is made with the fifteen EU states Britain had by 1993 the lowest expenditure ratio and the second lowest receipts ratio.13 Figure 12 UK and OECD average: general government total outlays and current receipts as % of nominal GDP, 1979–93
Source: Derived from OECD (1994, tables 27–28). Clearly, therefore, there have been significant changes in Britain’s public finance system relative to comparators, though it is appropriate to observe at this point that during this period of retrenchment Britain’s growth rate of real GDP has not matched the long-run EC-12 average.14 The best that can be said, and notwithstanding the brilliant propagandization about Britain’s economic renaissance since 1979, is that the pace of RED has abated. We have already noted the shift in the tax mix in Britain since 1979; to this we should add that the expenditure side of the account has also been transformed. As Table 9 demonstrates expenditure on economic and environmental functions have been severely squeezed while spending on health, personal social services and social security have mushroomed. In short, and 13 The UK expenditure and receipts ratios were 43.5 and 35.8 per cent respectively in 1993; the
OECD averages were 42.0 and 37.8 per cent respectively and those for the EU (less Luxembourg) 53.8 and 47.2 per cent respectively (calculated from OECD 1995, tables 27-8.
14 Between 1979-93 real GDP grew at an annual average rate of 1.7 per cent in the UK and 2 per cent in the EC-12; between the business cycle reference dates 1979-89, the correct years for intertemporal comparison, the figures were 2.4 and 2.2 per cent respectively (Middleton, 1996b, p. 627). Unfortunately, the cyclical instability of the British economy has resulted in much of the gains from above average trend growth being dissipated in two severe depressions since 1979. On balance, economists have concluded that microeconomic successes have been masked by macroeconomic policy failures (Oulton 1995).

Middleton (1997) ‘Britain’s economic problem’ 33/40 __________________________________________________________________________________
notwithstanding very tight controls on welfare benefits relative to the average wage, the social as opposed to the economic agenda of Thatcherism has been not been manifest in the public finances. This should come as no surprise to those who recollect Beveridge’s assumption C and its underlying logic whereby (HMSO 1942, para. 440), on the supply side, full employment boosted national income and thus, for any given tax ratio, the resources to finance welfare expenditures, while on the demand side low levels of unemployment reduced the demand for welfare expenditures, both directly on unemployment benefits and indirectly through the association of primary poverty with unemployment. The breakdown of this calculus in the 1970s is central to explanations of the crisis of Keynesian social democracy. Table 9 General government expenditure by function: (A) in constant 1993/4 prices (£ billions) and (B) as % of GDP at current prices, selected years, 1978/9–93/4 % change 1978/9 1987/8 1993/4 1978/9–93/4 A. Debt interest 21.3 25.1 19.7 (7.5) Defence 21.8 26.6 22.8 4.6 Overseas services 3.0 2.8 3.5 16.7 Agriculture, fisheries, food & forestry 3.0 3.4 4.1 36.7 Trade, industry, energy & employment 11.7 9.3 9.0 (23.1) Transport 8.6 8.0 10.2 18.6 Housing 12.9 5.8 5.4 (58.1) Other environmental services 7.6 7.7 8.8 15.8 Law, order & protective services 7.3 11.3 14.8 102.7 Education 26.2 28.7 33.6 28.2 National heritage 2.1 2.5 2.6 23.8 Health and personal social services 26.4 34.4 43.2 63.6 Social security 48.8 68.7 87.6 79.5 Miscellaneous 7.9 7.5 8.1 2.5 Other accounting adjustments 6.3 8.6 9.6 52.4 Total excluding privatisation proceeds 214.9 250.5 283.0 31.7 Privatisation proceeds 0.0 (7.2) (5.5) GENERAL GOVERNMENT EXPENDITURE 214.9 243.3 277.6 29.2 B. Debt interest 4.3 4.2 3.1 Defence 4.5 4.4 3.6 Overseas services 0.6 0.5 0.6 Agriculture, fisheries, food & forestry 0.6 0.6 0.6 Trade, industry, energy & employment 2.4 1.6 1.4 Transport 1.8 1.3 1.6 Housing 2.6 1.0 0.9 Other environmental services 1.6 1.3 1.4 Law, order & protective services 1.5 1.9 2.3 Education 5.4 4.8 5.3 National heritage 0.4 0.4 0.4 Health and personal social services 5.4 5.7 6.8 Social security 10.0 11.5 13.7 Miscellaneous 1.6 1.3 1.3 Other accounting adjustments 1.3 1.4 1.5 Total excluding privatisation proceeds 44.0 41.8 44.3 Privatisation proceeds 0.0 (1.2) (0.9) GENERAL GOVERNMENT EXPENDITURE 44.0 40.6 43.4 Source: Derived from HMSO (1995, tables 1.3, 1.5). A further characteristic of the public finances and of government economic policies requiring comment here concerns the strategy that greater inequality of incomes would promote enterprise and thus economic growth, an approach explicitly based upon the belief that the pursuit of egalitarianism under the postwar settlement had been taken further in Britain than in its competitors and with more deleterious

Middleton (1997) ‘Britain’s economic problem’ 34/40 __________________________________________________________________________________
consequences. Cross-sectional evidence for the late 1960s and early 1970s compiled by Sawyer (1976, table 4) suggested a postwar convergence of the post-tax distribution of incomes in the main OECD states and nothing unusual about the British case until the top decile of incomes where the income share was significantly below that of the comparator. This obviously provides a clue to the clamour for direct tax cuts by high income groups in the 1970s. Since then there has been a very substantial shift in the tax mix combined with reductions in the headline standard and higher rates of income tax. That the average tax take was substantially higher than that in 1979 for the greater part of the period follows from the evidence for the receipts ratio,15 but what has elicited more comment is the shift in the distribution of income promoted by a taxation policy which sought to promote economic growth through greater inequality. Clearly other forces were also at work in lessening the original income share of the poor and raising that of the rich, but it is estimated that in the first decade of the experiment the top decile of income earners received nearly 50 per cent of the tax remissions (Johnson. and Stark 1989, table 2). Indeed, of the £31 billion in tax cuts implemented between 1979–92, the top percentile received 93 times as much per head as the lowest 50 per cent of income earners (Glyn and Miliband 1994, p. 1). There exists no credible evidence for the ACCs as a whole that the economies which grew more rapidly since OPEC I or OPEC II were those displaying the greatest degrees of income inequality. Indeed, the evidence points to the opposite conclusion (see Kenworthy 1995 for a theoretical and empirical refutation of the trade-off). In terms of labour productivity growth, many of the most successful economies of the 1980s (Belgium, Japan and Sweden) exhibited the lowest level of income inequality in circa 1980, whereas the two least successful economies (Australia and the US) had the opposite characteristic (Glyn and Miliband 1994, figure 0.1). At this level of analysis there is no simple trade-off between equality and efficiency; it is beneath the surface that the issue needs to be explored and where the most profound changes have occurred in Britain’s social and economic life. As Hutton (1995, p. 175) details:
Market rule has recoiled on the state’s finances; as the polarisation of society has worsened, public spending on crime, health and specialist education has increased – and social security spending itself, even though rates are meaner in relation to average earnings, has ballooned as poverty drives millions through the drab waiting-rooms of the rump welfare state.
The distributional consequences of the experiment with free market economics obviously provides a clue to its rationale, while the social and economic costs identified by Hutton and many others constitute both an offset to the benefits of the experiment and have generated a debate about technical and social market failure which differs little in its fundamentals from that which took place in late-Victorian and Edwardian Britain (Middleton 1996b, ch. 5). It is as if this generation of the middle-class need to have demonstrated to them what their great-grandparents eventually took for granted, that there are spill-overs costs for all from poor health, crime and unemployment. Moreover, much of the case that is now being made by opponents of the experiment bear a striking resemblance to the sorts of national efficiency arguments which underpinned middle-class acceptance of the Liberal welfare reforms before the First World War. Then, as now, it was argued that inequality was associated with economic instability and sub-optimal growth, a theme 15 House of Commons researchers have estimated that the cumulative impact of higher taxation –
defined as any excess in the receipts ratio above that recorded in 1978/9 – since Labour left office is equivalent to £265 billion at 1994/5 prices, a sum exceeding the total tax take in 1978/9 (Wintour 1996).

Middleton (1997) ‘Britain’s economic problem’ 35/40 __________________________________________________________________________________
recently developed with some power by Hutton (1995, pp. 176–81) to explain Britain’s current predicament. In April 1992 the prime minister told the Institute of Directors that ‘The British disease is over, cured’. Viewed objectively, the evidence for an economic renaissance would not support such a conclusion. At best, RED abated. Nor do trends in the public finances lend credence to the stronger claims made for a rolling back of the frontiers of the state. The fiscal crisis of the state, much beloved of neo-Marxist writers in the 1970s (for example, O’Connor 1973), which used to forecast the imminent collapse of capitalism has now been turned on its head by the New Right to justify, but not yet to deliver, a massive blow to the welfare state. Taking a broader view than that of just the public finances, we would obviously conclude that the public sector has been subject to dismantlement (privatization), restructuring (flexible service delivery) and moves towards greater efficiency (implantation of a results-orientated culture) (Painter 1991, p. 75), but the resource squeeze has produced nothing like the tax and expenditure ratios that were sought by the New Right in the late 1970s. There is no mystery to this as the Treasury’s difficulties in controlling public expenditure are well-documented (Thain and Wright 1990; Heald 1991; 1995), while mass unemployment, as noted earlier, along with the slow growth of the British economy explain why the tax take still remains so high.16 It is arguable that the tax take was only contained in the 1980s and early 1990s by a combination of North Sea oil and the fruits of privatization, the latter, by convention, negative expenditures. Both of these are now well past their peak. In addition, the revenue base is being undermined by structural changes in the labour market, with casualisation removing many from the net of income tax and national insurance contributions, and the effects of the single market, which impacts on taxes on expenditure, while the long-term consequences of the poll tax debacle for the willingness to pay tax are still working through the system. On the expenditure side, as we have seen, the burgeoning of welfare spending via mass unemployment and deep-seated social changes, together with an ageing population, provide little fiscal space. Yet further ‘cuts’ in taxation, through a continued squeeze on public expenditure, remain centre stage in the Conservative Party’s competition for votes. 17 British social attitudes, however, display no weakening – indeed, the very contrary – of the public attachment to core welfare services (Taylor-Gooby 1995), although, as elsewhere in Europe, there has been something of a retreat from support for more specific interventions to redress market failure through government intervention (Döring 1994). The conclusion seems inescapable that the outlook for the public finances remains grim unless greater macroeconomic stability and a higher trend rate of economic growth can be achieved. That such policy goals are still being sought after seventeen years of the New Right experiment provides an answer to the implicit counterfactual posed earlier in this paper. It is, of course, the supreme irony that notwithstanding the perception of acute fiscal stress, the condition of Britain’s finances are actually much closer to the Maastricht convergence criteria (for stage 3 of EMU) than those pertaining in most other EU states (Arrowsmith 1995), but that within Europe the Conservative Party – as currently constituted – is one of the most antithetical towards further European integration.
16 For assessments of UK prospects, see Pain et al. (1993) and Weale (1994); and for a European
perspective which offers little encouragement to UK policy-makers, Alesina and Perotti (1995). 17 See, for example, prime minister Major’s Mansion House speech (White 1995).

Middleton (1997) ‘Britain’s economic problem’ 36/40 __________________________________________________________________________________
REFERENCES Aldcroft, D.H. (1992) Education, training and
economic performance, 1944 to 1990. Manchester: Manchester University Press.
Alesina, A. and Perotti, R. (1995) ‘Fiscal expansions and adjustments in OECD countries’, Economic Policy, 21 (October), pp. 207–48.
Anon (1995) ‘History in making’, Times Higher Education Supplement, 7 July 1995, p. 13.
Armstrong, P., Glyn, A. and Harrison, J. (1991) Capitalism since 1945. Oxford: Basil Blackwell.
Arrowsmith, J. (1995) ‘Economic and monetary union in a two-stage Europe’, National Institute Economic Review, 152 (May), pp. 76–96.
Artis, M.J. (1978) ‘Fiscal policy and crowding out’, in M.V. Posner (ed.) (1978) Demand management. London: Heinemann, pp. 174–9.
Aschauer, D.A. (1989) ‘Is public expenditure productive?’, Journal of Monetary Economics, 23 (2), pp. 177–200.
Bacon, R.W. and Eltis, W.A. (1976) Britain’s economic problem: too few producers. London: Macmillan.
___ and ___ (1978) Britain’s economic problem: too few producers, 2nd edn. London: Macmillan.
___ and ___ (1996) Britain’s economic problem revisited, 3rd edn. London: Macmillan.
Barnett, C. (1986) The audit of war: the illusion and reality of Britain as a great nation. London: Macmillan.
___ (1995) The lost victory: British dreams, British realities, 1945–1950. London: Macmillan.
Barro, R.J. (1990) ‘Government spending in a simple model of endogenous growth’, Journal of Political Economy, 98 (5, pt. 2, Supplement), pp. S103–S25.
___ (1991) ‘Economic growth in a cross section of countries’, Quarterly Journal of Economics, 106 (2), pp. 407–43.
Baumol, W.J. (1967) ‘Macroeconomics of unbalanced growth: the anatomy of urban crisis’, American Economic Review, 57 (3), pp. 415–26.
Bean, C.R. and Crafts, N.F.R. (1996) ‘British economic growth since 1945: relative economic decline ... and renaissance?’, in N.F.R. Crafts and G. Toniolo (eds) (1996) Economic growth in Europe since 1945. Cambridge: Cambridge University Press, pp. 131–72.
Beenstock, M. (1979) ‘Taxation and incentives in the UK’, Lloyds Bank Review, 134 (October), pp. 1–15.
Bennett, R.J. (1986) ‘The impact of non-
domestic rates on profitability and investment’, Fiscal Studies, 7 (1), pp. 34–50.
Boskin, M.J., Flemming, J.S. and Gorini, S. (1987) Private saving and public debt. Oxford: Basil Blackwell.
Brittan, S. (1975) ‘The economic contradictions of democracy’, British Journal of Political Science, 5 (2), pp. 129–59.
___ (1978) ‘How British is the British sickness?’, Journal of Law and Economics, 21 (2), pp. 245–68.
Britton, A.J.C. (1991) Macroeconomic policy in Britain, 1974–87. Cambridge: Cambridge University Press.
Brown, C.V. (1980) Taxation and the incentive to work. Oxford: Oxford University Press.
Budge, I. (1993) ‘Relative decline as a political issue: ideological motivations of the politico-economic debate in post-war Britain’, Contemporary Record, 7 (1), pp. 1–23.
Burk, K. and Cairncross, A.K. (1992) ‘Goodbye, Great Britain’: the 1976 IMF crisis. New Haven and London: Yale University Press.
Cairncross, A.K. (1992c) The British economy since 1945: economic policy and performance, 1945–1990. Oxford: Basil Blackwell.
Cameron, D.R. (1982) ‘On the limits of the public economy’, Annals of the American Academy of Political and Social Science, 459 (January), pp. 46–62.
___ (1985) ‘Public expenditure and economic performance in international perspective’, in R. Klein and M. O’Higgins (eds) (1985) q.v., pp. 8–21.
Castles, F.G. (1982) ‘The impact of parties on public expenditure’, in F.G. Castles (ed.) (1982) The impact of parties: politics and policies in democratic capitalist states. Beverley Hills, CA: Sage, pp. 21–96.
Cavanna, H. (1988) Public sector deficits in OECD countries: causes, consequences and remedies. London: Macmillan.
Chalmers, M. (1985) Paying for defence: military spending and British decline. London: Pluto Press.
Chan, A. and Gustafson, E. (1991) ‘An empirical examination of government expenditures and the ex-ante crowding-out effect for the British economy’, Applied Economics, 23 (2), pp. 305–10.
Chouraqui, J.-C. (1988) ‘Public sector deficits in OECD countries: causes, consequences and policy reaction’, in H. Cavanna (ed.) (1988) q.v., pp. 1–40.
Chrystal, K.A. (1979) Controversies in British macroeconomics. Oxford: Philip Allan.
Clark, C.G. (1945) ‘Public finance and changes in the value of money’, Economic Journal, 55

Middleton (1997) ‘Britain’s economic problem’ 37/40 __________________________________________________________________________________
(4), pp. 371–89. Clarke, R.W.B. (1978) Public expenditure,
management and control: the development of the Public Expenditure Survey Committee (PESC), ed. A.K. Cairncross. London: Macmillan.
Coates, D. (ed.) (1994) The question of UK decline: the economy, state and society. London: Harvester Wheatsheaf.
___ and Hillard, J. (eds) (1986) The economic decline of modern Britain: the debate between left and right. Brighton: Wheatsheaf Books.
___ and ___ (eds) (1995) UK economic decline: key texts. London: Harvester Wheatsheaf.
Correia-Nunes, J. and Stemitsiotis, L. (1995) ‘Budget deficit and interest rates: is there a link?: international evidence’, Oxford Bulletin of Economics and Statistics, 57 (4), pp. 425–49.
Crafts, N.F.R. (1995a) ‘The golden age of economic growth in western Europe, 1950–1973’, Economic History Review, 48 (3), pp. 429–47.
___ (1995b) ‘“You’ve never had it so good”: British economic policy and performance, 1945–60’, in B.J. Eichengreen (ed.) (1995) Europe’s post-war recovery. Cambridge: Cambridge University Press, pp. 246–70.
Cronin, J.E. (1991) The politics of state expansion: war, state and society in twentieth-century Britain. London: Routledge.
CSO (1987a) United Kingdom national accounts, 1987 edn. London: HMSO.
___ (1987b) Annual abstract of statistics, 1987 edn. London: HMSO
___ (1994a) United Kingdom national accounts, 1994 edn. London: HMSO
___ (1994b) Annual abstract of statistics, 1994 edn. London: HMSO
___ (1995) Economic trends, annual supplement, 1995 edn. London: HMSO.
Cullis, J.G. and Jones, P.R. (1987) Microeconomics and the public economy: a defence of Leviathan. Oxford: Basil Blackwell.
Davies, S.W. and Caves, R.E. (1987) Britain’s productivity gap. Cambridge: Cambridge University Press.
Dilnot, A.W., Kay, J.A. and Morris, C.N. (1985) ‘The UK tax system, structure and progressivity, 1948–1982’, in F.R. Fírsund and S. Honkapohja (eds) (1985) Limits and problems of taxation. London: Macmillan, pp. 52–67.
Döring, H. (1994) ‘Public perceptions of the proper role of the state’, West European Politics, 17 (3), pp. 12–31.
Easterly, W. and Rebelo, S. (1993) ‘Fiscal policy and economic growth: an empirical investigation’, Journal of Monetary Economics, 32 (3), pp. 417–58.
Eichengreen, B.J. (1994) ‘Institutional prerequisites for economic growth: Europe after World War II’, European Economic Review, 38 (3/4), pp. 883–90.
Eltis, W.A. (1988) ‘Britain’s budget deficit in 1967–84: its consequences, causes and policies to control it’, in H. Cavanna (ed.) (1988) q.v., pp. 76–101.
___ (1993) ‘Introduction: how my economics evolved’, in W.A. Eltis (ed.) (1993) Classical economics, public expenditure and growth. Aldershot: Edward Elgar, pp. ix–xxxi.
___ and Higham, D. (1995) ‘Closing the UK competitiveness gap’, National Institute Economic Review, 154 (November), pp. 71–84.
Evans, P. (1987) ‘Do budget deficits raise nominal interest rates?: evidence from six countries’, Journal of Monetary Economics, 20 (2), pp. 281–300.
Feinstein, C.H. (1972) National income, expenditure and output of the United Kingdom, 1855–1965. Cambridge: Cambridge University Press.
___ (1990) ‘Benefits of backwardness and costs of continuity’, in A.W.M. Graham and A. Seldon (eds) (1990) Government and economies in the postwar world: economic policies and comparative performance, 1945–85. London: Routledge, pp. 284–93.
Fischer, S. (1993) ‘The role of macroeconomic factors in growth’, Journal of Monetary Economics, 32 (3), pp. 485–512.
Friedland, R. and Sanders, J. (1985) ‘The public economy and economic growth in western market economies’, American Sociological Review, 50 (4), pp. 421–37.
Friedman, M. (1976) ‘The line we dare not cross: the fragility of freedom at “60%”‘, Encounter, 47, pp. 8–14.
Gillion, C. and Hemming, R. (1985) ‘Social expenditure in the United Kingdom in a comparative context: trends, explanations and projections’, in R. Klein and M. O’Higgins (eds) (1985) q.v., pp. 22–36.
Glyn, A. and Miliband, R. (1994) ‘Introduction’, in A. Glyn and R. Miliband (eds) (1994) Paying for inequality: the economic costs of social injustice. London: IPPR/Rivers Oram Press, pp. 1–23.
Hadjimatheou, G. (1987) ‘Is public expenditure growth a problem?’, Royal Bank of Scotland Review, 153 (March), pp. 17–24.
Harris, J. (1990) ‘Enterprise and welfare states: a comparative perspective’, Transactions of the Royal Historical Society, 40, pp. 175–95.
Heald, D. (1983) Public expenditure: its defence and reform. Oxford: Basil Blackwell.
___ (1991) ‘The political implications of redefining public expenditure in the United Kingdom’, Political Studies, 39 (1), pp. 75–99.

Middleton (1997) ‘Britain’s economic problem’ 38/40 __________________________________________________________________________________
___ (1995) ‘Steering public expenditure with defective maps’, Public Administration, 73 (2), pp. 213–40.
Heidenheimer, A.J., Heclo, H. and Adams, C.T. (1990) Comparative public policy: the politics of social choice in America, Europe and Japan. New York: St. Martin’s Press.
Hicks, J.R. (1948) The problem of budgetary reform. Oxford: Clarendon Press.
Hogwood, B.W. (1983) Trends in British public policy: do governments make any difference? Buckingham: Open University Press.
Holmes, M. (1985) The first Thatcher government, 1979–1983: contemporary conservatism and economic change. Brighton: Wheatsheaf Books.
HMSO (1942) Social Insurance and Allied Services, Report by Sir William Beveridge, BPP 1942–3 (6404).
___ (1979) The government’s expenditure plans, 1980–81, BPP 1979–80 (7746).
___ (1981) Board of Inland Revenue, The survey of personal incomes, 1978–79. London: HMSO.
___ (1995) Public expenditure: statistical supplement to the financial statement and budget report, BPP 1994-5 (2821).
Hutton, W. (1995) The state we’re in. London: Jonathan Cape.
IEA (1979) The taming of government: micro/macro disciplines on Whitehall and town hall. London: IEA.
___ (1980) Town hall power or Whitehall pawn? London: IEA.
IFS (1978) The structure and reform of direct taxation: report of a committee chaired by Professor J.E. Meade. London: George Allen & Unwin.
Johnson, P.G. and Stark, G.K. (1989) ‘Ten years of Mrs Thatcher: the distributional consequences’, Fiscal Studies, 10 (2), pp. 29–37.
Judge, K. (1982) ‘The growth and decline of social expenditure’, in A. Walker (ed.) (1982) q.v., pp. 27–48.
Kay, J.A. and King, M.A. (1978) The British tax system. Oxford: Oxford University Press.
___ and Sen, J. (1983) ‘The comparative burden of business taxation’, Fiscal Studies, 4 (3), pp. 23–8.
Kelly, R. (1992) ‘How Lamont is borrowing to consume’, Guardian, 23 March, p. 14.
Kenworthy, L. (1995) ‘Equality and efficiency: the illusory tradeoff’, European Journal of Political Research, 27 (2), pp. 225–54.
King, M.A., Naldrett, M.J. and Poterba, J. (1984) ‘The United Kingdom’, in M.A. King and D. Fullerton (eds) (1984) The taxation of income from capital. Chicago: University of Chicago Press, pp. 31–86.
Klein, R. (1976) ‘The politics of public expenditure: American theory and British
practice’, British Journal of Political Science, 6 (4), pp. 401–32.
___ and O’Higgins, M. (eds) (1985) The future of welfare. Oxford: Basil Blackwell.
___ and Scrivens, E. (1985) ‘The welfare state: from crisis to uncertainty’, Journal of Public Policy, 5 (2), pp. 141–53.
Lane, J.-E. and Ersson, S.O. (1990) Comparative political economy. London: Pinter.
Larkey, P.D., Stolp, C. and Winer, M. (1981) ‘Theorizing about the growth and decline of government: a research assessment’, Journal of Public Policy, 1 (2), pp. 157–220.
Layard, P.R.G., Nickell, S.J. and Jackman, R. (1991) Unemployment: macroeconomic performance and the labour market. Oxford: Oxford University Press.
Levine, R. and Renelt, D. (1992) ‘A sensitivity analysis of cross-country growth regressions’, American Economic Review, 82 (4), pp. 942–63.
Levitt, M.S. and Joyce, M.A.S. (1987) The growth and efficiency of public spending. Cambridge: Cambridge University Press.
Lindbeck, A. (1995) ‘Hazardous welfare-state dynamics’, American Economic Review, 85 (2, Papers & Proceedings), pp. 9–15.
Lowe, R. (1989) ‘Resignation at the Treasury: the Social Services Committee and the failure to reform the welfare state, 1955–57’, Journal of Social Policy, 18 (4), pp. 505–26.
___ (1993) The welfare state in Britain since 1945. London: Macmillan.
Lynde, C. and Richmond, J. (1993) ‘Public capital and long-run costs in UK manufacturing’, Economic Journal, 103 (4), pp. 880–93.
Maddison, A. (1984) ‘Origins and impact of the welfare state, 1883–1983’, Banca Nazionale del Lavoro Quarterly Review, 37 (1), pp. 55–87.
___ (1991) Dynamic forces in capitalist development: a long-run comparative view. Oxford: Oxford University Press.
Maki, D. and Spindler, Z.A. (1975) ‘The effect of unemployment compensation on the rate of unemployment in Great Britain’, Oxford Economic Papers, n.s. 27 (3), pp. 440–54.
Middleton, R. (1985) Towards the managed economy: Keynes, the Treasury and the fiscal policy debate of the 1930s. London: Methuen.
___ (1992) ‘The economic role of the interwar British state’, in S. Groenveld and M.J. Wintle (eds) (1992) State and trade: government and economy in Britain and the Netherlands since the middle ages. Zutphen: Walburg Pers, pp. 125–51.
___ (1996a) ‘The size and scope of the public sector’, in S.J.D. Green and R.C. Whiting (eds) (1996) The boundaries of the state in modern Britain. Cambridge: Cambridge

Middleton (1997) ‘Britain’s economic problem’ 39/40 __________________________________________________________________________________
University Press, pp. 89–145. ___ (1996b) Government versus the market: the
growth of the public sector, economic management and British economic performance, c.1890–1979. Cheltenham and Brookfield, VT: Edward Elgar.
Mosley, P. (1984) The making of economic policy: theory and evidence from Britain and the United States since 1945. Brighton: Wheatsheaf.
Mueller, D.C. (1989) Public choice II: a revised edition of Public choice. Cambridge: Cambridge University Press.
Mullard, M. (1987) The politics of public expenditure. London: Croom Helm.
Musgrave, R.A. (1985) ‘A brief history of fiscal doctrine’, in A.J. Auerbach and M. Feldstein (eds) (1985) Handbook of public economics. Amsterdam: North-Holland, Vol. I, pp. 1–59.
O’Connor, J. (1973) The fiscal crisis of the state. New York: St. Martin’s Press.
OECD (1978) Public expenditure trends. Paris: OECD.
___ (1981) Long-term trends in tax revenues of OECD member states, 1955–1980. Paris: OECD.
___ (1992) Economic outlook: historical statistics, 1960–1990. Paris: OECD.
___ (1995) OECD economic outlook, 58 (December). Paris: OECD.
Oulton, N. (1995) ‘Supply side reform and UK economic growth: what happened to the miracle?’, National Institute Economic Review, 154 (November), pp. 53–70.
Pain, N., Young, G. and Westaway, P. (1993) ‘The state of the public finances’, National Institute Economic Review, 145 (August), pp. 29–42.
Painter, C. (1991) ‘The public sector and current orthodoxies: revitalisation or decay?’, Political Quarterly, 62 (1), pp. 75–89.
Parry, R. (1986) ‘United Kingdom’, in P. Flora (ed.) (1986) Growth to limits: the western European welfare states since World War II. Berlin: Walter de Gruyter, Vol. 2: Germany, United Kingdom, Ireland, Italy, pp. 157–240.
___ (1987) ‘United Kingdom: institutional synopsis’, in P. Flora (ed.) (1987) Growth to limits: the western European welfare states since World War II. Berlin: Walter de Gruyter, Vol. IV: Appendix (synopses, bibliographies, tables), pp. 357–406.
Parsons, D.W. (1982) ‘Politics without promises: the crisis of “overload” and governability’, Parliamentary Affairs, 35 (4), pp. 421–35.
Peacock, A.T. and Wiseman, J. (1967) The growth of public expenditure in the United Kingdom, 2nd edn. London: George Allen & Unwin.
___ and ___ (1979) ‘Approaches to the analysis of government expenditure growth’, Public
Finance Quarterly, 7 (1), pp. 3–23. Peters, B.G. (1991) The politics of taxation: a
comparative perspective. Oxford: Basil Blackwell.
___ and Heisler, M.O. (1983) ‘Thinking about public sector growth: conceptual, operational, theoretical and policy considerations’, in C.L. Taylor (ed.) (1983) q.v., pp. 177–97.
Pliatzky, L. (1984) Getting and spending: public expenditure, employment and inflation, 2nd edn. Oxford: Basil Blackwell.
Pond, C. (1982) ‘Taxation and public expenditure’, in A. Walker (ed.) (1982) q.v. A. Walker (ed.) (1982) q.v., pp. 49–69.
Price, R.W.R. (1978) ‘Budgetary policy’, in F.T. Blackaby (ed.) (1978) British economic policy, 1960–74. Cambridge: Cambridge University Press, pp. 135–217.
___ (1979) ‘Public expenditure: policy and control’, National Institute Economic Review, 90 (November), pp. 68–76.
Rebelo, S. (1991) ‘Long-run policy analysis and long-run growth’, Journal of Political Economy, 99 (3), pp. 500–21.
Ridley, F.F. (1982) ‘The British disease: diagnosis but no cure’, Parliamentary Affairs, 35 (1), pp. 84–9.
Rollings, N. (1988) ‘British budgetary policy, 1945–1954: a “Keynesian revolution”?’, Economic History Review, 41 (2), pp. 283–98.
Romer, P.M. (1994) ‘The origins of endogenous growth’, Journal of Economic Perspectives, 8 (1), pp. 3–22.
Rose, R. (1983) ‘Disaggregating the concept of government’, in C.L. Taylor (ed.) (1983) q.v., pp 157–76.
___ and Karran, T.J. (1987) Taxation by political inertia: financing the growth of government in Britain. London: Allen & Unwin.
Sabine, B.E.V. (1966) A history of income tax. London: George Allen & Unwin.
Sanderson, M. (1988) ‘Education and economic decline, 1890–1980s’, Oxford Review of Economic Policy, 4 (1), pp. 38–50.
Saunders, P. (1985) ‘Public expenditure and economic performance in OECD countries’, Journal of Public Policy, 5 (1), pp. 1–21.
Sawyer, M.C. (1976) ‘Income distribution in OECD countries’, OECD Economic Outlook: Occasional Studies, (July), pp. 3–36.
___ (1982) ‘Income distribution and the welfare state’, in A. Boltho (ed.) (1982) The European economy: growth and crisis. Oxford: Oxford University Press, pp. 189–224.
Schumpeter, J.A. (1918) ‘The crisis of the tax state’. Rep. in A.T. Peacock, W.F. Stolper, R. Turvey and E. Henderson (eds) (1954) International economic papers (1954), vol. 4, London: Macmillan, pp. 5–38.

Middleton (1997) ‘Britain’s economic problem’ 40/40 __________________________________________________________________________________
Shoup, C.S. (1981) ‘Economic limits to taxation’, Atlantic Economic Journal, 9 (1), pp. 9–23.
Simon, O. (1986) ‘Investing in the infrastructure’, National Westminster Bank Quarterly Review, (May), pp. 2–16.
SIPRI (1994) SIPRI yearbook, 1994. Oxford: Oxford University Press.
Sorrentino, C. (1981) ‘Unemployment in international perspective’, in B. Showler and A. Sinfield (eds) (1981) The workless state: studies in unemployment. Oxford: Martin Robertson, pp. 167–214.
Steinmo, S. (1993) Taxation and democracy: Swedish, British and American approaches to financing the modern state. New Haven: Yale University Press.
Summers, R. and Heston, A. (1991) ‘The PENN world table (mark 5): an expanded set of international comparisons, 1950–1988’, Quarterly Journal of Economics, 106 (2), pp. 327–68.
Supple, B.E. (1994b) ‘Fear of failing: economic history and the decline of Britain’, Economic History Review, 47 (3), pp. 441–58.
Taylor, C.L. (ed.) (1983) Why governments grow: measuring public sector size. London: Sage.
Taylor, C.T. (1979) ‘Crowding out: its meaning and significance’, in S.T. Cook and P.M. Jackson (eds) (1979) Current issues in fiscal policy. Oxford: Martin Robertson, pp. 86–107.
Taylor-Gooby, P. (1995) ‘Comfortable, marginal and excluded: who should pay higher taxes for a better welfare state?’, in R. Jowell, et al. (eds) (1995) British social attitudes: the 12th report. Aldershot: Dartmouth, pp. 1–17.
Thain, C. and Wright, M.W. (1990) ‘Coping with difficulty: the Treasury and public expenditure, 1976–89’, Policy and Politics, 18 (1), pp. 1–15.
Tomlinson, J.D. (1985) British macroeconomic policy since 1945. London: Croom Helm.
___ (1995) ‘Welfare and economy: the economic impact of the welfare state, 1945–1951’, Twentieth Century British History, 6
(2), pp. 194–219. van der Ploeg, F. and Tang, P.J.G. (1992) ‘The
macroeconomics of growth: an international perspective’, Oxford Review of Economic Policy, 8 (4), pp. 15–28.
Walker, A. (ed.) (1982) Public expenditure and social policy: an examination of social spending and social priorities. London: Heinemann.
Wallace, W. (1994) ‘Rescue or retreat?: the nation state in western Europe, 1945–93’, Political Studies, 42 (5), pp. 52–76.
Ward, T.S. and Neild, R.R. (1978) The measurement and reform of budgetary policy. London: Heinemann.
Warwick, P. (1985) ‘Did Britain change?: an inquiry into the causes of national decline’, Journal of Contemporary History, 20 (1), pp. 99–133.
Weale, M.R. (1994) ‘Fiscal policy and the national debt’, National Institute Economic Review, 147 (February), pp. 50–61.
White, M. (1995) ‘Major signals more spending cuts’, Guardian, 21 November 1995, p. 1.
Whiteley, P.F. (1983) The Labour Party in crisis. London: Methuen.
Wiener, M.J. (1981) English culture and the decline of the industrial spirit, 1850–1980. Cambridge: Cambridge University Press.
Willis, J.R.M. and Hardwick, P.J.W. (1978) Tax expenditures in the United Kingdom. London: Heinemann.
Wintour, P. (1996) ‘Tory tax share “outdoes Labour”‘, Guardian, 15 January 1996, p. 2.
Wiseman, J. (1980) Comparative aspects of the taxation of business in the United Kingdom and Germany. London: Anglo-German Foundation for the Study of Industrial Society.
Wright, M.W. (1977) ‘Public expenditure in Britain: the crisis of control’, Public Administration, 55 (2), pp. 143–69.
Wright, V. (1994) ‘Reshaping the state: the implications for public administration’, West European Politics, 17 (3), pp. 102–37.