broad learning-based optimization and prediction of
TRANSCRIPT

Research ArticleBroad Learning-Based Optimization and Prediction ofQuestionnaire Survey: Application to Mind Status ofCollege Students
Lin Yu 1 and Shejiao Ding2
1School of Marxism, Northwestern Polytechnical University, China2School of Humanities, Economics and Law, Northwestern Polytechnical University, China
Correspondence should be addressed to Lin Yu; [email protected]
Received 9 July 2018; Accepted 12 September 2018; Published 9 October 2018
Guest Editor: Jing Na
Copyright © 2018 Lin Yu and Shejiao Ding. This is an open access article distributed under the Creative Commons AttributionLicense, which permits unrestricted use, distribution, and reproduction in any medium, provided the original work isproperly cited.
The mind status of college students is important since it can reflect how the public opinion is going. Only with theaccurate prediction, the corresponding actions can be conducted to prevent the situation from going worse. This paperfocused on the data analysis using the recent developed broad learning method to obtain the learning model and thenthe prediction can be done. Firstly, the questionnaire related to the ideological state is designed. Secondly, the data arecollected and classified using the typical questions and answers. Thirdly, for each pair of the question and the answer,the score is obtained and considered as data training of the system. Fourthly, the input and the output are selectedaccording to the key questions and conclusions. Finally, the broad learning using flat network is employed for dataanalysis without deep structure. Tests show that the design using broad learning can efficiently deal with the regressionproblem and the learning network can be used for prediction.
1. Introduction
Social phenomenon is complex and challenging since thepotential dynamics cannot be known exactly or cannotbe obtained. For example, it is noted that civic educationis a basic education subject that all countries around theworld attach high importance to. Civic education in theUK mainly includes moral education, political education,and religious education, while in the USA, it is impliedin patriotic education and moral education. In Japan, civiceducation is called “social science,” while it is called “lifeeducation” and “state consciousness education” in Singa-pore, and called “ideological and political education” inChina. Due to the difference of the countries in statenature, political system, cultural tradition, education sys-tem, etc., their civic education differs quite a lot in form,content, and method. However, the purpose of civil educa-tion in whatever culture or system is the same: the ruling
class tries to have purposeful and planned impact on thecitizens by applying a certain political ideas and moralnorms, so that the citizens form social moral practice inline with the needs of the ruling class. From the imple-mentation effect of the education of all countries, we cansee that the civic education of each country presents spe-cific goals according to the national needs and by integrat-ing the characteristics of the times. Therefore, “political,ideological, and advancing with times” are the characteris-tics of the civic education of each country.
Due to the significance of civic education, it is impor-tant to know how the status is. Furthermore, with analy-sis, it is key point to find some relation between factorsand the results, while in this way, some actions can betaken before the consequence comes. Using questionnaireto obtain the quality of the status is a useful way. Thequestionnaire should be designed with specific aim sothat the results can reflect a certain intention. However,
HindawiComplexityVolume 2018, Article ID 5736030, 9 pageshttps://doi.org/10.1155/2018/5736030

the data is not easy to analyze. If only the mean valueand the ratio are calculated, only the status of inter-viewers can be reflected while the deep information can-not be digged out for test and the design cannot beused for prediction. For comprehensive analysis, the goalfor questionnaire survey is not restricted to the statistics.The possible target is to model the public opinion whilethe prediction is available and then the possible actioncan be taken. With the abovementioned consideration,the study using machine learning is of great interest. Inliterature, many methods have been analyzed using thebioinspired technique such as genetic algorithm (GA)[1], neural networks (NNs) [2, 3], fuzzy logic system (FLS)[4], particle swarm optimization (PSO) [5, 6], extreme learn-ing machine (ELM) [7–9], deep learning [10], and broadlearning [11]. The methods are mimicking the behavior ofbiology. For example, the GA is using initialization, selec-tion, and variants. ELM is using the feedforward NN, andthe basic idea is using the way of random assignment forgeneralization. Deep learning is using the learning datarepresentations. Recently, the broad learning is gainingattention. The method is using random vector functionallink NN, and the key point is to expand the network byrandomly adding the functions instead of increasing thedepth. In [12], the feature nodes are replaced withTakagi-Sugeno fuzzy system and the fuzzy broad learningsystem is proposed.
For data analysis and system control, NN is widelystudied in [13, 14]. For data analysis, in [15], the complexsale forecasting problem is studied due to the requirementof reliable prediction where the fuzzy NN is used while theinitial weights are generated by genetic algorithm. In [16],the fuzzy NN learning is proposed while the continuousgenetic algorithm is used to improve the performance.One case of global supply chain management is studiedwith data collection, construction of learning method,and decision integration model. In [17], the study is onimportance-performance analysis while the relationship isnonlinear and multicollinearity where the backpropagationNN is used to train the model. In [18], similar work hasbeen done while the case study is with gathering data ofcustomer perception about focal delivered service, fuzzyset design, and attributes’ implicity. In [19], the marketsegmentation is studied using self-organizing feature mapsNN and genetic K-means algorithm. In the test, the proce-dure includes questionnaire design, importance analysis,satisfaction analysis, performance evaluation of the satis-faction, and the discussion. In [20], the restaurant servicerecovery is studied to see how much the consumer willreturn with the recovery plan. In the design, support vec-tor machine and multilayer perceptions are used to predictthe consumer expectations. In [21], the learner’s prefer-ence for the visual complexity on small screens of mobilecomputers is studied by NN. Using RBF-NN model, theaccuracy can be guaranteed while the investigation effortscan be avoided. In [22], the fruit fly optimization algo-rithm is adopted to optimize the NN model while theprincipal component regression is used for the question-naire survey.
From the abovementioned discussion, the question-naire survey is widely used in many applications since itincludes the principal component while the data indicatesthe potential nonlinear model. Using questionnaire surveyis an effective way to analyze the status of mind. The chal-lenge is on how to design the questionnaire survey andhow to analyze the data. Many methods are adopted fordata analysis and optimization where the basic idea isusing NN while some other evolutionary algorithms areused to make the NN more efficient. However, the struc-ture and the parameters should be selected step by step.Deep learning is widely studied recently, and the greatbreakthrough has been achieved. But the design is time-consuming. Broad learning is interesting with randomlyadding new functions while updating the results usingpseudoinverse method. In this way, though the flat workmight grow fast, the computation is not increasing so fast.
In this paper, the work is on questionnaire survey-based data analysis and prediction. The mind status of col-lege students is collected while the inputs and the outputfor the training network are selected. Furthermore, theBL algorithm is employed for optimization. The obtainedmodel is verified via test data. The organization of thepaper is given as follows. In Section 2, the questionnaire sur-vey is discussed. In Section 3, the broad learning is describedand the data optimization is given. In Section 4, the conclu-sions and future works are discussed.
2. Questionnaire Survey and Analysis
This survey takes some college and university students inShaanxi Province as the objects determine the total samplesize required for the survey according to the conservative for-mula for calculating the sample size and the average expectedsample size and samples randomly by the level. A total of1236 questionnaires are distributed, 1202 effective ques-tionnaires are recovered, and the effective recovery rate is97%. The questionnaires do a comprehensive survey tothe ideological and political quality of the college and uni-versity students, including their outlook in life and values,dynamic focus on social events, and degree of ideologicaland political identity. Statistical analysis is conducted afterthe questionnaire data is input into the database throughthe SPSS software.
The three dimensions of the ideological and politicalquality of the college and university students are intercon-nected and complementary. Therefore, when evaluatingthe ideological and political quality level of the collegeand university students, we need to take the three dimen-sions as the correlation coefficients with the same impor-tance (the three dimensions, respectively, account for33.3%), take 2.5 scores (totally 5 scores) as the total scorefor the evaluation standard through the expert consulta-tion method according to the confidence interval andactual needs, work out the general mean distributionmap, and determine poor ideological and political qualityindex (2.5–3) of the college and university students, quitepoor ideological and political quality index (3–3.5), aver-age ideological and political quality index (3.5–4), quite
2 Complexity

high ideological and political quality index (4–4.5), andhigh ideological and political quality index (4.5–5), so asto judge the overall ideological and political quality levelof the college and university students, wherein the ideolog-ical and political quality level of 64.8% college and univer-sity students is [4, 5]. Therefore, we can see that thecurrent ideological and political quality level of the collegeand university students is quite high and at the middleand upper levels.
In the analysis, it is interesting to see that college stu-dents are more interested in career-related topics such as“New joint cooperation with Jingdong Company” (ratio30.12%) “Accommodation Condition Improvement withAir-conditioner” (ratio 49.33%) while high technology-related news which can exhibit the university’s reputation isgaining attention such as “The Unmanned Aerial VehicleShow in National Day” (ratio 45.01%). Oppositely, they paylittle attention to the speech on politics (ratio 15.47%) orthe results of Outstanding Young Investigator Award ofNational Natural Science Foundation (ratio 21.13%).
3. Data Representation and Broad Learning
In the questions, 34 items are included for the data regres-sion. In the question, different answers are labeled as “1–5.”Furthermore, the gender is considered while the grade is usedas input. Male is labeled as “0” while female is labeled as “1.”For different grades, different number “1–6” is used as a label.In this way, the input dimension is 36. The status is consid-ered as regression output, while in the questionnaire survey,the option is 4 levels between “positive” and “negative.” Con-sidering the diversity, 404 samples are used for data analysisand learning.
For the broad learning, it is proposed in [11], the mainidea is using pseudoinverse to update the learning weightsince the new weights Wn+1 are obtained form the previousweights Wn using new enhancement nodes with the follow-ing equation:
Wn+1 =Wn − dbTYn
bTYn
1
Furthermore, the sparse features can be included to solvethe optimization problem.
The learning scheme is given as follows. Consider thatthe training sample is X304×36 while the output is Y304×1.For j = 1, j ≤m, the parameters are randomly generatedas Whj
and βhj. Furthermore, the new function is calcu-
lated as follows:
Hj = ξ XWhj+ βhj
2
The enhancement node group is written as Hm = H1,H2,H3,… ,Hm . The critical step is to calculate the pseu-doinverse as follows:
Am = X Hm 3
Furthermore, the weights are calculated as follows:
Wm = Am +Y 4
If the training error threshold is not satisfied, the newgeneration of Whj+1
, βhj+1, Hm+1, and Am+1 will be randomly
given. The process will continue until the training errorthreshold is satisfied.
Remark 1. The idea is interesting since the adding of nodes iseasy while the calculation will not take up too much time.In this way, the broad learning can be applied in an effi-cient way.
In the test, the performance using broad learning is given.Two kinds of learning are shown as training accuracy andtesting accuracy. For the all 404 samples, if “P” samples areused for test, the rest “404 − P” samples will be employedfor model training.
In Figures 1–3, the cases using 20 test samples arestudied. The results show that with the nodes adding,the training accuracy is increasing while the testing accu-racy is changing. But in all, the trend of the accuracy isgood and the difference is due to the characteristics ofrandomness of the algorithm.
In Figures 4–6, the cases using 30 test samples arestudied. The training accuracy increases with nodes add-ing while the testing accuracy is changing. This is depen-dent on the quality of the test samples. It can beconcluded that the quality is important for data analysiswhile the broad learning can efficiently fulfill the require-ment of regression.
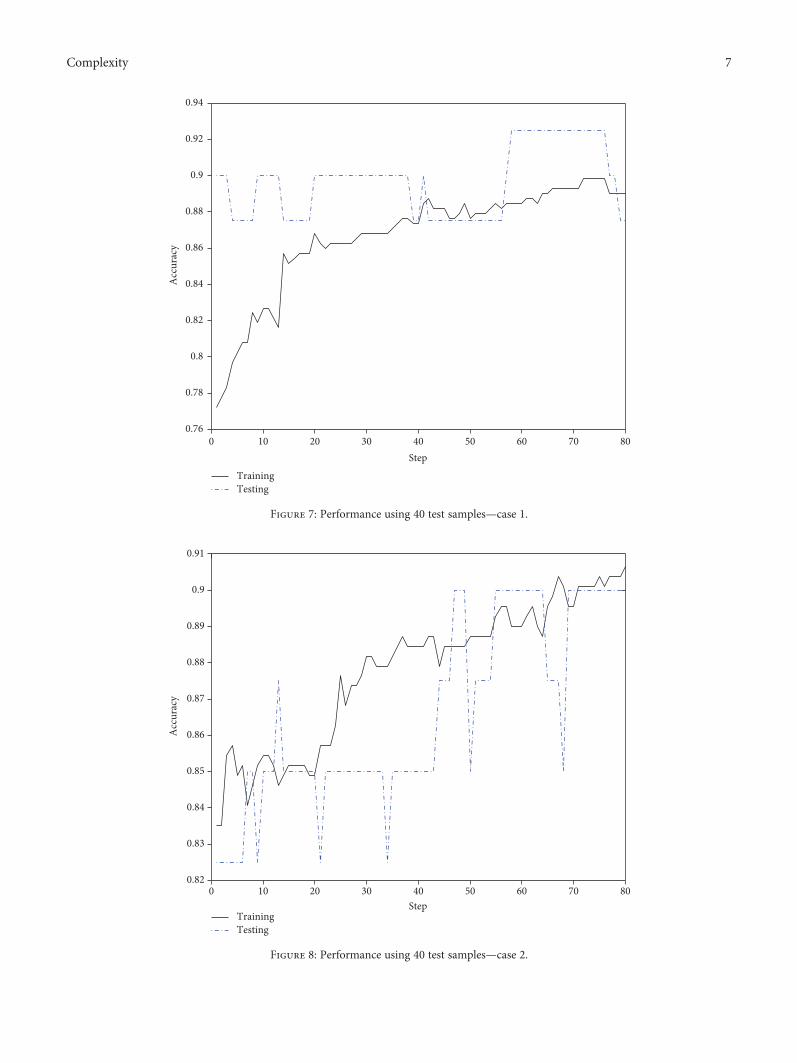
In Figures 7–9, the cases using 40 test samples are stud-ied. The training accuracy increases with nodes adding whilethe testing accuracy is stable.
Through the 3 sets of tests, it can be known that thebroad learning-based design can efficiently build the rela-tion between the input signals and the output information,though the model is nonlinear and unknown. During theprocess, the random vector functional link neural networkis generated using the function and the network can growwith more features while the computation efficiencyremains very high. For the prediction, due to the random-ness of the samples, the accuracy is also highly dependenton the data quality.
4. Conclusions and Discussions
In this paper, the broad learning is given as data analysis andoptimization. The questionnaire survey data is firstly ana-lyzed and then the label is given for the inputs and the output.Using broad learning, the design shows the performance ofthe learning algorithm. It is also shown that data quality isimportant for accuracy.
For future work, the pruning of the nodes is interesting.Also due to the randomness, the performance is not so stable.Maybe some statistics can apply on the randomness, and theresults can be more robust. More complex questionnaire
3Complexity

0 10 20 30 40 50 60 70 800.65
0.7
0.75
0.8
0.85
0.9
0.95
1
Step
Accuracy
TrainingTesting
Figure 2: Performance using 20 test samples—case 2.
0 10 20 30 40 50 60 70 800.74
0.76
0.78
0.8
0.82
0.84
0.86
0.88
0.9
0.92
Step
Accuracy
TrainingTesting
Figure 1: Performance using 20 test samples—case 1.
4 Complexity

0 10 20 30 40 50 60 70 800.8
0.81
0.82
0.83
0.84
0.85
0.86
0.87
0.88
0.89
0.9
Step
Accuracy
TrainingTesting
Figure 4: Performance using 30 test samples—case 1.
0 10 20 30 40 50 60 70 800.74
0.76
0.78
0.8
0.82
0.84
0.86
0.88
0.9
0.92
Step
Accuracy
TrainingTesting
Figure 3: Performance using 20 test samples—case 3.
5Complexity

0 10 20 30 40 50 60 70 80Step
Accuracy
0.76
0.78
0.8
0.82
0.84
0.86
0.88
0.9
TrainingTesting
Figure 6: Performance using 30 test samples—case 3.
0 10 20 30 40 50 60 70 800.76
0.78
0.8
0.82
0.84
0.86
0.88
0.9
Step
Accuracy
TrainingTesting
Figure 5: Performance using 30 test samples—case 2.
6 Complexity
0 10 20 30 40 50 60 70 800.76
0.78
0.8
0.82
0.84
0.86
0.88
0.9
0.92
0.94
Step
Accuracy
TrainingTesting
Figure 7: Performance using 40 test samples—case 1.
0 10 20 30 40 50 60 70 800.82
0.83
0.84
0.85
0.86
0.87
0.88
0.89
0.9
0.91
Step
Accuracy
TrainingTesting
Figure 8: Performance using 40 test samples—case 2.
7Complexity

can be designed to collect more information, and the learningscheme is expected to obtain some critical features formental test.
Data Availability
The data used to support the findings of this study are avail-able from the corresponding author upon request.
Conflicts of Interest
The authors declare that they have no conflicts of interest.
References
[1] U. Maulik and S. Bandyopadhyay, “Genetic algorithm-basedclustering technique,” Pattern Recognition, vol. 33, no. 9,pp. 1455–1465, 2004.
[2] S. Haykin, Neural networks: a comprehensive foundation,Prentice Hall PTR, Upper Saddle River, NJ, USA, 1994.
[3] D. F. Specht, “A general regression neural network,” IEEETransactions on Neural Networks, vol. 2, no. 6, pp. 568–576,1991.
[4] E. H. Mamdani, “Application of fuzzy logic to approximatereasoning using linguistic synthesis,” in MVL '76 Proceedingsof the sixth international symposium on Multiple-valued logic,pp. 196–202, Logan, Utah, USA, May 1976.
[5] Y. Shi and R. C. Eberhart, “Empirical study of particle swarmoptimization,” in Proceedings of the 1999 Congress on Evolu-tionary Computation-CEC99 (Cat. No. 99TH8406), pp. 320–324, Washington, DC, USA, July 1999.
[6] R. C. Eberhart and Y. Shi, “Particle swarm optimization: devel-opments, applications and resources,” in Proceedings of the2001 Congress on Evolutionary Computation (IEEE Cat.No.01TH8546), vol. 1, pp. 81–86, Seoul, South Korea, May2001.
[7] G. B. Huang, D. H. Wang, and Y. Lan, “Extreme learningmachines: a survey,” International Journal of Machine Learn-ing and Cybernetics, vol. 2, no. 2, pp. 107–122, 2011.
[8] H. J. Rong, Y. S. Ong, A. H. Tan, and Z. Zhu, “A fast pruned-extreme learning machine for classification problem,” Neuro-computing, vol. 72, no. 1–3, pp. 359–366, 2008.
[9] H. J. Rong, G. B. Huang, N. Sundararajan, andP. Saratchandran, “Online sequential fuzzy extreme learningmachine for function approximation and classification prob-lems,” IEEE Transactions on Systems Man and CyberneticsPart B (Cybernetics), vol. 39, no. 4, pp. 1067–1072, 2009.
[10] Y. Lecun, Y. Bengio, and G. Hinton, “Deep learning,” Nature,vol. 521, no. 7553, pp. 436–444, 2015.
[11] C. P. Chen and Z. Liu, “Broad learning system: an effective andefficient incremental learning system without the need fordeep architecture,” IEEE transactions on neural networks andlearning systems, vol. 29, no. 1, pp. 10–24, 2018.
[12] S. Feng and C. P. Chen, “Fuzzy broad learning system: a novelneuro-fuzzy model for regression and classification,” IEEETransactions on Cybernetics, pp. 1–11, 2018.
[13] H. Jiang and Y. Dong, “A novel model based on square rootelastic net and artificial neural network for forecasting globalsolar radiation,” Complexity, vol. 2018, Article ID 8135193,19 pages, 2018.
[14] X. Lv, X. Li, J. Cao, and P. Duan, “Exponential synchronizationof neural networks via feedback control in complex
0 10 20 30 40 50 60 70 800.78
0.8
0.82
0.84
0.86
0.88
0.9
0.92
0.94
0.96
Step
Accuracy
TrainingTesting
Figure 9: Performance using 40 test samples—case 3.
8 Complexity

environment,” Complexity, vol. 2018, Article ID 4352714, 13pages, 2018.
[15] R. Kuo, “A sales forecasting system based on fuzzy neural net-work with initial weights generated by genetic algorithm,”European Journal of Operational Research, vol. 129, no. 3,pp. 496–517, 2001.
[16] R. Kuo, S. Hong, Y. Lin, and Y. Huang, “Continuous geneticalgorithm-based fuzzy neural network for learning fuzzy if–then rules,” Neurocomputing, vol. 71, no. 13–15, pp. 2893–2907, 2008.
[17] W.-J. Deng, W.-C. Chen, and W. Pei, “Back-propagation neu-ral network based importance–performance analysis for deter-mining critical service attributes,” Expert Systems withApplications, vol. 34, no. 2, pp. 1115–1125, 2008.
[18] W.-J. Deng and W. Pei, “Fuzzy neural based importance-performance analysis for determining critical service attri-butes,” Expert Systems with Applications, vol. 36, no. 2,pp. 3774–3784, 2009.
[19] R. Kuo, Y. An, H. Wang, and W. Chung, “Integration of self-organizing feature maps neural network and genetic k-meansalgorithm for market segmentation,” Expert Systems withApplications, vol. 30, no. 2, pp. 313–324, 2006.
[20] H.-C. Huang, “Using artificial neural networks to predict res-taurant industry service recovery,” International Journal ofAdvancements in Computing Technology, vol. 4, no. 10,pp. 315–321, 2012.
[21] L.-T. Wang and K.-C. Lee, “The study of learners’ preferencefor visual complexity on small screens of mobile computersusing neural networks,” Turkish Online Journal of EducationalTechnology, vol. 13, no. 2, pp. 168–180, 2014.
[22] S.-M. Lin, “Analysis of service satisfaction in web auctionlogistics service using a combination of fruit fly optimizationalgorithm and general regression neural network,” NeuralComputing and Applications, vol. 22, no. 3-4, pp. 783–791,2013.
9Complexity

Hindawiwww.hindawi.com Volume 2018
MathematicsJournal of
Hindawiwww.hindawi.com Volume 2018
Mathematical Problems in Engineering
Applied MathematicsJournal of
Hindawiwww.hindawi.com Volume 2018
Probability and StatisticsHindawiwww.hindawi.com Volume 2018
Journal of
Hindawiwww.hindawi.com Volume 2018
Mathematical PhysicsAdvances in
Complex AnalysisJournal of
Hindawiwww.hindawi.com Volume 2018
OptimizationJournal of
Hindawiwww.hindawi.com Volume 2018
Hindawiwww.hindawi.com Volume 2018
Engineering Mathematics
International Journal of
Hindawiwww.hindawi.com Volume 2018
Operations ResearchAdvances in
Journal of
Hindawiwww.hindawi.com Volume 2018
Function SpacesAbstract and Applied AnalysisHindawiwww.hindawi.com Volume 2018
International Journal of Mathematics and Mathematical Sciences
Hindawiwww.hindawi.com Volume 2018
Hindawi Publishing Corporation http://www.hindawi.com Volume 2013Hindawiwww.hindawi.com
The Scientific World Journal
Volume 2018
Hindawiwww.hindawi.com Volume 2018Volume 2018
Numerical AnalysisNumerical AnalysisNumerical AnalysisNumerical AnalysisNumerical AnalysisNumerical AnalysisNumerical AnalysisNumerical AnalysisNumerical AnalysisNumerical AnalysisNumerical AnalysisNumerical AnalysisAdvances inAdvances in Discrete Dynamics in
Nature and SocietyHindawiwww.hindawi.com Volume 2018
Hindawiwww.hindawi.com
Di�erential EquationsInternational Journal of
Volume 2018
Hindawiwww.hindawi.com Volume 2018
Decision SciencesAdvances in
Hindawiwww.hindawi.com Volume 2018
AnalysisInternational Journal of
Hindawiwww.hindawi.com Volume 2018
Stochastic AnalysisInternational Journal of
Submit your manuscripts atwww.hindawi.com