broad overview of energy efficiency and renewable - nrel
TRANSCRIPT

NREL is a national laboratory of the U.S. Department of Energy, Office of Energy Efficiency & Renewable Energy, operated by the Alliance for Sustainable Energy, LLC.
Contract No. DE-AC36-08GO28308
A Broad Overview of Energy Efficiency and Renewable Energy Opportunities for Department of Defense Installations E. Anderson, M. Antkowiak, R. Butt, J. Davis, J. Dean, M. Hillesheim, E. Hotchkiss, R. Hunsberger, A. Kandt, J. Lund, K. Massey, R. Robichaud, B. Stafford, and C. Visser Produced under direction of the Strategic Environmental Research and Developmental Program for the U.S. Department of Defense by the National Renewable Energy Laboratory (NREL) under Interagency Agreement IAG-10-1779 and Task No. WFR4.1000.
Technical Report NREL/TP-7A20-50172 August 2011

NREL is a national laboratory of the U.S. Department of Energy, Office of Energy Efficiency & Renewable Energy, operated by the Alliance for Sustainable Energy, LLC.
National Renewable Energy Laboratory 1617 Cole Boulevard Golden, Colorado 80401 303-275-3000 • www.nrel.gov
Contract No. DE-AC36-08GO28308
A Broad Overview of Energy Efficiency and Renewable Energy Opportunities for Department of Defense Installations E. Anderson, M. Antkowiak, R. Butt, J. Davis, J. Dean, M. Hillesheim, E. Hotchkiss, R. Hunsberger, A. Kandt, J. Lund, K. Massey, R. Robichaud, B. Stafford, and C. Visser
Produced under direction of the Strategic Environmental Research and Developmental Program for the U.S. Department of Defense by the National Renewable Energy Laboratory (NREL) under Interagency Agreement IAG-10-1779 and Task No. WFR4.1000.
Technical Report NREL/TP-7A20-50172 August 2011

NOTICE
This manuscript has been authored by employees of the Alliance for Sustainable Energy, LLC (“Alliance”) under Contract No. DE-AC36-08GO28308 with the U.S. Department of Energy (“DOE”). **Note**The tables and figures in this report may be copyrighted and are included for informational purposes only, limited to use in this report, and not to be further disseminated or used without the permission of the sources cited.** This report was prepared as an account of work sponsored by an agency of the United States government. Neither the United States government nor any agency thereof, nor any of their employees, makes any warranty, express or implied, or assumes any legal liability or responsibility for the accuracy, completeness, or usefulness of any information, apparatus, product, or process disclosed, or represents that its use would not infringe privately owned rights. Reference herein to any specific commercial product, process, or service by trade name, trademark, manufacturer, or otherwise does not necessarily constitute or imply its endorsement, recommendation, or favoring by the United States government or any agency thereof. The views and opinions of authors expressed herein do not necessarily state or reflect those of the United States government or any agency thereof.
Cover Photos: (left to right) PIX 16416, PIX 17423, PIX 16560, PIX 17613, PIX 17436, PIX 17721
Printed on paper containing at least 50% wastepaper, including 10% post consumer waste.

iii
List of Acronyms
ΔT temperature difference $/kWh cost per kilowatt hour °C degrees Celsius °F degrees Fahrenheit AC alternating current AEV all-electric vehicle ARBOT Augmented Reality Building Operations Tool ARRA American Recovery and Reinvestment Act ASHRAE American Society of Heating, Refrigerating, and Air Conditioning Engineers a-Si amorphous silicon BACnet Building Automation and Control Network BAS building automation system BAU business as usual BEAR Basic Expeditionary Airfield Resources BIPV building-integrated photovoltaics BLM Bureau of Land Management BTP Building Technologies Program Btu British thermal unit Btu/ft2 British thermal units per square foot Cd cadmium CdTe cadmium tellurium CERTS Consortium for Electric Reliability Technology Solutions CFD computational fluid dynamics CHP combined heat and power CIGS copper-indium-gallium diselenide CIS copper indium diselenide CO2 carbon dioxide CONUS continental United States CPV concentrating PV CSP concentrating solar power DC direct current DER distributed energy resources DEVap Desiccant Enhanced Evaporative Air Conditioner DOD U.S. Department of Defense DOE U.S. Department of Energy DSCM dry standard cubic meter EERE DOE Office of Energy Efficiency and Renewable Energy EISA 2007 Energy Independence and Security Act of 2007

iv
EPAct 2005 Energy Policy Act of 2005 EPCC Electronic Power Control and Conditioning ESM energy surety microgrids EVGI electric vehicle grid integration EVSE electric vehicle supply equipment FERC Federal Energy Regulatory Commission FOB Forward Operating Base FY fiscal year GaAs gallium arsenide GHG greenhouse gas GHP geothermal heat pump GSA General Services Administration GSHP ground source heat pump GS-IHP ground source integrated heat pump GUI graphical user interface GW gigawatt GWh gigawatt-hour HAWT horizontal-axis wind turbines HFC hydrofluorocarbon HVAC heating, ventilating, and air conditioning Hz hertz IEEE Institute of Electrical and Electronics Engineers IPOpS Installation Power Optimization System ISBPS Integrated Smart BEAR Power System km2 square kilometer kV kilovolt kW kilowatt kWh kilowatt-hour lb pound LCOE levelized cost of energy LED light-emitting diode LEED Leadership in Energy and Environmental Design Li lithium ion LIDAR light detection and ranging lm lumen m meter MSW municipal solid waste MW megawatt MWe megawatt electricity

v
MWh megawatt-hour NaS sodium sulfur NEDO New Energy and Industrial Technology Development Organization NiCd nickel cadmium NiMH nickel metal hydride NIST National Institute of Standards and Technology NOAA National Oceanographic and Atmospheric Administration NREL National Renewable Energy Laboratory NZEI Net Zero Energy Installation O&M operation and maintenance ORC Organic Rankine Cycle ORNL Oak Ridge National Laboratory Pb lead-acid PbO2 lead dioxide PCM phase change material PEV plug-in electric vehicle PHEV plug-in hybrid electric vehicle PIER Public Interest Energy Research PNNL Pacific Northwest National Laboratory PPA power purchase agreement PV photovoltaic(s) PVC polyvinyl chloride quad quadrillion Btu R&D research and development redox reduction-oxidation RMOTC Rocky Mountain Oilfield Testing Center rpm revolutions per minute SCADA supervisory control and data acquisition SODAR sonic detection and ranging SPIDERS Smart Power Infrastructure Demonstration for Energy Reliability and Security TES thermal energy storage TM3PS Tactical Modular Mobile Microgrid Power Systems TPD tons per day UPS uninterruptible power supply USGS U.S. Geological Survey UTES underground thermal energy storage

vi
V volt VAR volt ampere reactive VAWT vertical-axis wind turbines VPP virtual power plants W watt WCC Western Cooling Challenge WCEC Western Cooling Efficiency Center WTE waste to energy

vii
Executive Summary
Background The Strategic Environmental Research and Developmental Program (SERDP)/Environmental Security Technology Certification Program (ESTCP) is the Department of Defense’s (DOD) environmental science and technology program focusing on issues related to environment and energy for the military services. Part of ESTCP’s charter is to investigate, demonstrate, and validate environmental and/or energy technologies that offer the potential to provide significant benefit to DOD via a variety of channels including, for example, increased efficiency, regulatory compliance, cost savings, and/or reduced petroleum consumption.
The SERDP/ESTCP Office requested that the National Renewable Energy Laboratory (NREL) provide technical assistance with strategic planning by evaluating the potential for several types of renewable energy technologies at DOD installations. NREL was tasked to provide technical expertise and strategic advice for the feasibility of geothermal resources, waste-to-energy technology, photovoltaics (PV), wind, microgrids, and building system technologies on military installations. NREL’s deliverables were to provide a draft report no later than November 10, 2010 and a final report prior to a January 2011 SERDP/ESTCP Funding Opportunity Announcement. This report satisfies the second and final report deliverable requirement. Although not specifically requested by SERDP, included in the report is an energy storage section that provides descriptions and applications of electrical energy storage. Also included is an electric vehicle grid integration (EVGI) section that describes a demonstration of EVGI technology as well as challenges and opportunities of EVGI to a military-base grid. Technology Summaries and Recommendations The following is a very brief summary of six major renewable energy technologies that were examined and their potential for applications at DOD installations. Also included is a brief summary of one or two of the major recommendations for each of the six major renewable energy technologies considered. Geothermal Resources The potential for using geothermal resources for electricity generation on DOD installations is highly dependent on the geographical location of the DOD installation but offers significant potential for renewable energy development and can provide baseload power. In general, DOD installations in areas of high geothermal gradient in the Southern and/or Western United States and selected non-CONUS bases such as Guam may offer the most potential for developing geothermal electric resources.
Geothermal heat pump (GHP) systems are a technology that uses heat pumps to exchange heat between the building and the topmost layers of soil and rock or surface/groundwater. GHP systems are a proven, efficient technology to reduce the consumption of other sources of energy for heating and cooling, and are already utilized at DOD installations including Fort Polk, Louisiana. Since GHP technology uses normal ground and groundwater temperatures, it has the potential to be utilized across a far larger geographic area than geothermal electric energy, and can be considered at all DOD facilities to provide both heating and cooling.
viii
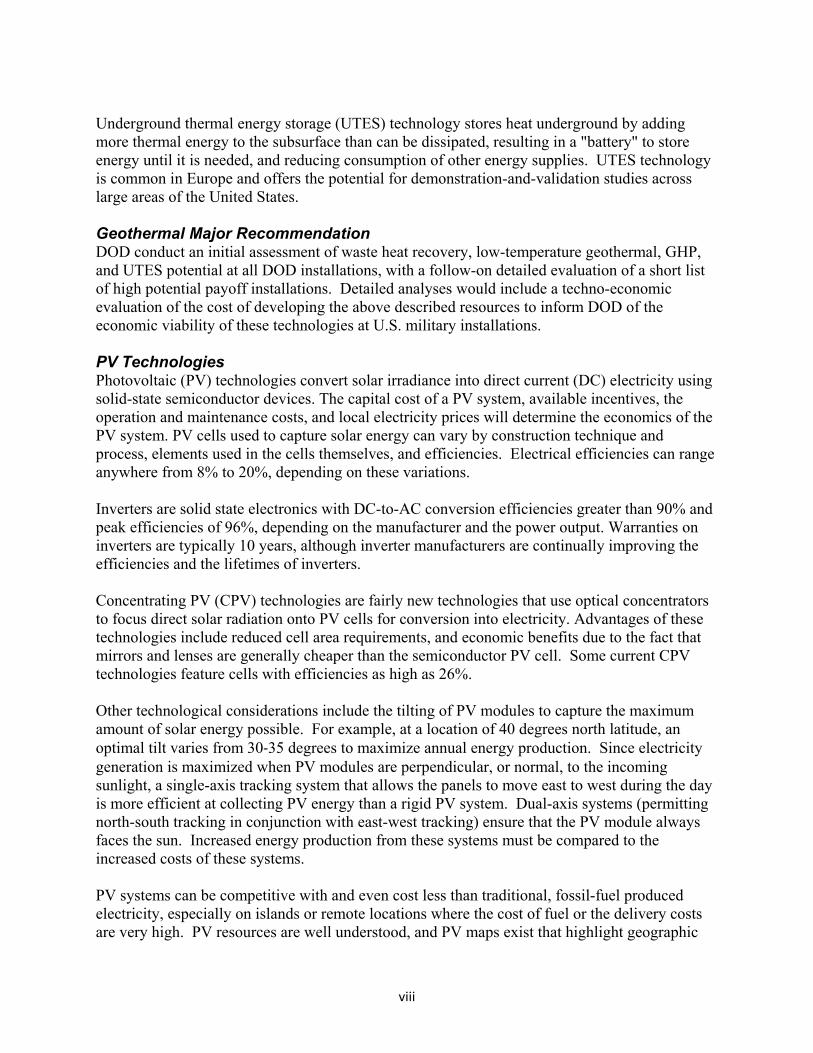
Underground thermal energy storage (UTES) technology stores heat underground by adding more thermal energy to the subsurface than can be dissipated, resulting in a "battery" to store energy until it is needed, and reducing consumption of other energy supplies. UTES technology is common in Europe and offers the potential for demonstration-and-validation studies across large areas of the United States.
Geothermal Major Recommendation DOD conduct an initial assessment of waste heat recovery, low-temperature geothermal, GHP, and UTES potential at all DOD installations, with a follow-on detailed evaluation of a short list of high potential payoff installations. Detailed analyses would include a techno-economic evaluation of the cost of developing the above described resources to inform DOD of the economic viability of these technologies at U.S. military installations. PV Technologies Photovoltaic (PV) technologies convert solar irradiance into direct current (DC) electricity using solid-state semiconductor devices. The capital cost of a PV system, available incentives, the operation and maintenance costs, and local electricity prices will determine the economics of the PV system. PV cells used to capture solar energy can vary by construction technique and process, elements used in the cells themselves, and efficiencies. Electrical efficiencies can range anywhere from 8% to 20%, depending on these variations.
Inverters are solid state electronics with DC-to-AC conversion efficiencies greater than 90% and peak efficiencies of 96%, depending on the manufacturer and the power output. Warranties on inverters are typically 10 years, although inverter manufacturers are continually improving the efficiencies and the lifetimes of inverters.
Concentrating PV (CPV) technologies are fairly new technologies that use optical concentrators to focus direct solar radiation onto PV cells for conversion into electricity. Advantages of these technologies include reduced cell area requirements, and economic benefits due to the fact that mirrors and lenses are generally cheaper than the semiconductor PV cell. Some current CPV technologies feature cells with efficiencies as high as 26%.
Other technological considerations include the tilting of PV modules to capture the maximum amount of solar energy possible. For example, at a location of 40 degrees north latitude, an optimal tilt varies from 30-35 degrees to maximize annual energy production. Since electricity generation is maximized when PV modules are perpendicular, or normal, to the incoming sunlight, a single-axis tracking system that allows the panels to move east to west during the day is more efficient at collecting PV energy than a rigid PV system. Dual-axis systems (permitting north-south tracking in conjunction with east-west tracking) ensure that the PV module always faces the sun. Increased energy production from these systems must be compared to the increased costs of these systems.
PV systems can be competitive with and even cost less than traditional, fossil-fuel produced electricity, especially on islands or remote locations where the cost of fuel or the delivery costs are very high. PV resources are well understood, and PV maps exist that highlight geographic

ix
areas of high PV potential. In general, the Southwestern United States and places like Hawaii are strong candidates for PV, although PV—and especially non-concentrating PV—can be used in all 50 states. Economies of scale generally result in reduced costs per kW for larger systems; smaller systems tend to have higher relative installed costs. Since there are no moving parts, PV modules often include warranties of 20 to 25 years. The warranty is typically used as the lifetime in financial calculations even though the lifetime may be longer. PV modules can be the most durable component of a PV system.
PV Major Recommendation There are several major recommendations contained in the PV section of this report, but the primary recommendation is that DOD conduct a survey of existing facilities to determine appropriate locations of PV systems based on economics and any other tactical/technological considerations and then take steps to implement those systems. Microgrid Technologies Microgrids are coordinated energy generation and electrical distribution systems capable of operating independently from the macrogrid (main utility grid). They include multiple distributed energy generation resources and multiple loads and have controller capabilities to dispatch generation, control loads and provide seamless connection/disconnection with the macrogrid. Microgrids typically include two critical pieces of equipment—a switch to disconnect and reconnect to the macrogrid when needed and a controller that dispatches generation, load and microgrid support functions.
The decentralized nature of microgrids provides physical redundancy to the electrical distribution system, which reduces the possibility a single failure (whether terrorist or natural disaster in origin) causing a complete collapse of the grid. However, the integration of more microprocessor-based controls and especially smart grid technologies into the electrical system adds new access vectors to critical infrastructure components, increasing vulnerability to cyber attacks.
A microgrid connecting to and disconnecting from the grid presents many challenges to the local utility. These include voltage, frequency, and power transfer concerns, as well as protection schemes and identifying steady state and transient conditions, to name a few. Other challenges include the integration of renewable energy into the microgrid, and ensuring that a microgrid is not only operating, but is operating efficiently—minimizing fuel use for example.
DOD, the U.S. Department of Energy (DOE), and several national laboratories and large defense contractors are involved in microgrid development demonstration and deployment efforts, some at DOD installations. Several microgrid research and testing facilities are being developed and/or are operational as well. Microgrid Major Recommendation The entire field of microgrids is a very “hot” topic for DOD currently, and the microgrid section of this report contains many recommendations that would be beneficial. Microgrid research, development and deployment in general address both mission assurance and energy security concerns of DOD. However, the area most strongly recommended for immediate focus is

x
development of controller technology. The controller is critical to successful microgrid operation and provides the dispatching intelligence necessary to keep the critical load running when the microgrid is disconnected from the macrogrid. Selecting several sites that provide unique operating environments, such as size of system, criticality of loads, type of onsite generation, and presence of energy storage would provide a good balance for development of several controller technologies.
Waste-to-Energy Technologies Waste-to-energy (WTE) generally refers to technologies that directly convert a post-recycled waste stream into energy, without the use of an intermediary step such as landfilling. The pathways include thermochemical conversion, such as mass burn and gasification, and biological conversion, such as anaerobic digestion. These conversion methods transform most of the waste into energy but not all, leaving approximately 10% – 30% of the material (by weight) to be marketed as a co-product or disposed of in a landfill. Factors influencing WTE economic feasibility include tipping fees (per-ton fee collected for disposal of customers’ solid waste) and the local market rates for the electricity or heat produced. WTE tends to be more economical in the coastal areas of the United States because of the high cost of building new landfills and inability to locate these new facilities near population centers. This is reflected in the aggressive pursuit of municipal WTE projects in California, New York, Maryland, and Florida. There are 400 closed or inactive landfills on DOD installations, occupying more than 5,000 acres of unusable space for the military training and support missions. Implementation of WTE offers the potential to preserve the space of the 71 remaining DOD landfills and may serve as a remediation process for closed landfills, processing the buried waste and reclaiming the land.
Mass burn is the most proven technology using standard combustion techniques and requires feedstock on the order of 300 or more tons per day (tpd). A significant amount of off-site material would be needed to supplement the typical 10 – 100 tpd waste stream available on a DOD installation. Mass burn WTE is being considered at several DOD installations adjacent to metropolitan areas with large waste streams.
Gasification is an emerging WTE technology in which fuel is heated in a limited-oxygen environment. It is typically smaller in scale than mass burn , and produces a synthetic gas that can be used in a variety of ways. There are several small-scale gasification projects planned at DOD sites. Of the WTE technologies, gasification is likely to be the least-costly conversion method and has a scale of operations well suited for DOD installation-level waste streams. This method has yet to be proven on a DOD installation.
Anaerobic Digestion is an emerging WTE technology using biological conversion methods to process organic waste materials. The end result is a biogas high in methane content. Little work in the United States is focused on directly converting municipal solid waste to energy via anaerobic digestion.

xi
Waste to Energy Major Recommendations 1. DOD develops and adopts a consistent lifecycle cost methodology for solid waste
disposal to accurately determine waste-to-energy economic feasibility and projected payback potential.
2. DOD facilitates one or more WTE demonstration projects at installation(s) with characteristics favorable for WTE projects, including:
• High lifecycle solid-waste disposal cost (greater than $70/ton)
• High cost of electricity (greater than $.12/kWh blended rate)
• Onsite solid waste volume greater than 30tpd (access to offsite waste volume greater than 500tpd can be considered for a mass burn project)
Wind Technology Wind turbines convert wind energy to electricity. In determining the viability of wind as an energy source, it is important to know to the greatest extent possible the extent of the wind resource before investing in and installing a wind turbine. Potential large-scale wind projects may involve taking wind measurements for a year or more before determining whether or not to go ahead with the project. Wind resource maps and data sets currently exist that can assist in initially determining locations favorable for wind energy development.
Wind power is proportional to the velocity of the wind cubed (V3), meaning that if wind speed were to double, corresponding wind power would increase by a factor of eight. Conversely, halving wind speed reduces available power by a factor of eight. Clearly, wind speed is critical in wind power production, and in many cases, the simplest way to increase wind speed is to increase the height of the wind tower itself.
Because power increases as the cube of wind speed, much of the average power available to a wind turbine comes during relatively short periods of high wind speed. It is only in high winds that the turbine produces at rated power. To take full advantage of windy periods, the wind turbine needs a large enough generator and a strong gearbox. The average power produced (aka capacity factor) by a utility-scale wind turbine over time is 25% – 45% of the rated power the machine is capable of delivering. Typical capacity factors will be 10% – 25% for small wind turbines.
The high “surface roughness” associated with buildings in an urban environment has an adverse affect on wind power output. Life cycle costs of rooftop wind systems are not very compelling in terms of economic benefit, and they are not recommended due to safety factors and buildings not designed for rooftop turbines. DOD may find small wind systems might make more sense in a public relations setting rather than economically—that is, perhaps at a guard shack or other location that has high visibility to the general public, and lends itself favorably to public perception of DOD’s renewable energy efforts.

xii
Wind Major Recommendation Utility-scale wind turbines have much better economics, operations and maintenance (O&M), and energy performance than small wind turbines. It is recommended that DOD examine the utility-scale option at those sites that make the most sense—good wind resource (Class 3+), minimal operations impact, reasonable distance-to-grid intertie, high cost of energy (greater than $0.06/kWh)—and then take steps to implement wind technologies at those sites subject to a favorable economic analysis and any military tactical/ technological considerations. Buildings Technologies This report contains greater than 35 building-related technologies that are receiving funding through DOE’s Building Technologies Program (BTP), are currently available, and/or are candidates for demonstration in the near future. Multiple technology opportunities exist in each of the core research and development (R&D) tracks within DOE’s BTP: whole building design, building envelope R&D, appliances, advanced cooling technologies, geothermal heat pumps, advanced controls and diagnostic R&D, and lighting. What is most compelling about building technologies is that DOD could reduce the energy use of new commercial buildings by 30% – 605 with off-the-shelf, commercialized technologies and reduce the energy use of all of their existing buildings by at least 30% with commercialized technologies when they utilize a whole building design and renovation approach discussed in the report. This translates into tens of millions of dollars saved by DOD, in many cases with payback of initial investment in less than five years. A "whole building design" approach incorporates multiple building technologies and produces an optimal solution for building retrofit or design. A logical demonstration project would be to pilot this approach on a few DOD facilities to demonstrate the effectiveness of the novel optimization approach and develop the internal capacity within DOD to adopt the process on all new DOD facilities. It is also recommended that DOD adopt a new fully-automated energy-auditing tool that is incorporated into an internal workforce development plan to holistically retrofit existing DOD facilities with an optimal suite of energy efficiency measures. Building Technologies Major Recommendation DOD initially supports pilot project "whole building design" analyses on a limited number of DOD installations. After successful testing, implement full-scale building analyses at installations/buildings DOD wide that offer significant energy efficiency potential, and then implement all cost-effective energy savings measures under a given bundled payback period (say seven years or less.)

xiii
Table of Contents List of Acronyms ........................................................................................................................................ iii Executive Summary .................................................................................................................................. vii
Background ............................................................................................................................. vii Technology Summaries and Recommendations ..................................................................... vii
Geothermal Resources ..................................................................................................... vii Geothermal Major Recommendation ............................................................................. viii PV Technologies ............................................................................................................ viii PV Major Recommendation ............................................................................................. ix Microgrid Technologies ................................................................................................... ix Microgrid Major Recommendation .................................................................................. ix Waste-to-Energy Technologies ..........................................................................................x Waste to Energy Major Recommendations ...................................................................... xi Wind Technology ............................................................................................................. xi Wind Major Recommendation ........................................................................................ xii Buildings Technologies ................................................................................................... xii Building Technologies Major Recommendation ............................................................ xii
1 Introduction ........................................................................................................................................... 1 2 Geothermal and Waste Heat Resources ............................................................................................ 1
2.1 Introduction ........................................................................................................................1 2.2 Task 1: Co-production and other Low-temperature Geothermal Resources ......................2
2.2.1 Background ..............................................................................................................2 2.2.1.1 Co-produced Water .................................................................................. 2 2.2.1.2 Co-production Demonstrations and Current State of the Technology ..... 3
2.2.2 Other Low-temperature Geothermal Resources ......................................................4 2.2.2.1 Geopressured Resource ............................................................................ 4 2.2.2.2 Geopressured Demonstrations and Current State of the Technology ...... 5 2.2.2.3 Low-Temperature Hydrothermal System Resources ............................... 6 2.2.2.4 Current State of the Hydrothermal Technology ....................................... 7 2.2.2.5 Case Study – Fort Bliss ............................................................................ 8
2.2.3 Methodology and Approach ....................................................................................9 2.2.4 Low-temperature Resource Assessment ................................................................10
2.2.4.1 Co-production Resource Assessment .................................................... 10 2.2.4.2 Geopressured Resource Assessment ...................................................... 12 2.2.4.3 Low-Temperature Hydrothermal ........................................................... 13
2.2.5 An Example of Geothermal Power Generation at Fallon Naval Air Station .........14 2.2.5.1 Low-temperature Geothermal Economic Considerations ...................... 14
2.2.6 Permanent Non-CONUS U.S. Military Installation Geothermal Power Potential 15 2.2.6.1 Case Study – Guam ................................................................................ 20
2.3 Task 2: Waste Heat Recovery and Non-power, Energy Efficiency Geothermal Technologies ....................................................................................................................22 2.3.1 Technology Current State and Future Trends ........................................................22
2.3.1.1 Earth-Air Heat Exchange ....................................................................... 22 2.3.1.2 Geothermal Heat Pumps ........................................................................ 22 2.3.1.3 GHP Case Study – Fort Polk ................................................................. 24
2.3.2 Underground Thermal Energy Storage ..................................................................24

xiv
2.4 Recommendations ............................................................................................................25 2.4.1 Site-Specific Data Collection and Evaluation ........................................................25 2.4.2 Advanced Research ................................................................................................26
2.4.2.1 Power Plant Efficiency .......................................................................... 26 2.4.2.2 Hybrid Power Production ...................................................................... 26 2.4.2.3 Reservoir Assessment and Simulation ................................................... 27 2.4.2.4 GHP Technology ................................................................................... 27 2.4.2.5 Path Forward .......................................................................................... 27
3 Solar Electric and Storage Technologies ........................................................................................ 28 3.1 Photovoltaics ....................................................................................................................28
3.1.1 Technology Overview ............................................................................................28 3.1.1.1 PV Modules ........................................................................................... 28 3.1.1.2 Concentrating PV (CPV) ....................................................................... 29
3.1.2 Solar Resource Maps .............................................................................................30 3.1.3 Balance of System..................................................................................................33
3.1.3.1 Tracking Systems ................................................................................... 33 3.1.3.2 Inverters ................................................................................................. 35 3.1.3.3 Losses ..................................................................................................... 35
3.1.4 Costs .......................................................................................................................36 3.1.5 State of the Research ..............................................................................................37 3.1.6 Recommendations for PV ......................................................................................38
3.2 Concentrating Solar Power ...............................................................................................39 3.2.1 Technology Overview ............................................................................................39
3.2.1.1 Linear Concentrator CSP Systems ......................................................... 40 3.2.1.2 Parabolic Dish CSP Systems ................................................................. 41 3.2.1.3 Power Tower CSP Systems ................................................................... 42 3.2.1.4 Energy Storage ....................................................................................... 43 3.2.1.5 Capacity Factor ...................................................................................... 43
3.2.2 CSP Siting Considerations .....................................................................................43 3.2.3 Costs .......................................................................................................................45 3.2.4 State of the Research ..............................................................................................46 3.2.5 Recommendations for CSP ....................................................................................46
3.3 Energy Storage .................................................................................................................47 3.3.1 Technology Overview ............................................................................................47
3.3.1.1 Lead-Acid Batteries ............................................................................... 51 3.3.1.2 Nickel–Based Batteries .......................................................................... 53 3.3.1.3 Lithium-Based Batteries ........................................................................ 54 3.3.1.4 Flow Batteries ........................................................................................ 55 3.3.1.5 Pumped Hydro ....................................................................................... 56 3.3.1.6 Compressed Air Energy Storage ............................................................ 56 3.3.1.7 Sodium Sulfur Batteries ......................................................................... 56 3.3.1.8 Flywheels ............................................................................................... 57 3.3.1.9 Supercapacitors and Ultrabatteries ........................................................ 58 3.3.1.10 Hydrogen................................................................................................ 59
3.3.2 State of the Research ..............................................................................................59 3.3.3 Costs, Metrics, and Payback ..................................................................................59

xv
3.3.4 Recommendations for Energy Storage ..................................................................61 4 Microgrid Technologies ..................................................................................................................... 62
4.1 Overview of Electric Industry Future ...............................................................................62 4.2 Summary of Current Microgrid Research, Technology, and Demonstration Efforts ......64
4.2.1 Technology Overview ............................................................................................64 4.2.2 NIST and IEEE Smart Grid Efforts .......................................................................66 4.2.3 Domestic Microgrid Projects .................................................................................67
4.2.3.1 Honeywell’s Enterprise Buildings Integrator (EBI) Energy Manager and Encorp’s Enpower generator controls work to optimize Fort Bragg’s energy costs (Jim Peedin, Fort Bragg Department of Public Works, civilian) .................................................................................................. 71
4.2.3.2 Twentynine Palms Microgrid Design by GE ......................................... 72 4.2.3.3 The CERTS Microgrid Program ............................................................ 73 4.2.3.4 Fort Irwin and Fort Bliss Mobile Microgrid with Next Energy ............. 76 4.2.3.5 Energy Surety Microgrids (ESM) and SPIDERS at Sandia Labs .......... 77 4.2.3.6 Net Zero Energy Installations and Microgrid Assessments at National
Renewable Energy Laboratory (NREL) ................................................ 79 4.3 Microgrid Market Participants in the United States .........................................................80
4.3.1 Honeywell ..............................................................................................................80 4.3.2 GE ..........................................................................................................................80 4.3.3 Lockheed Martin ....................................................................................................81 4.3.4 Cummins Power Generation ..................................................................................81
4.4 International Microgrid Activities ....................................................................................81 4.5 Recommendations for Microgrid .....................................................................................83 4.6 Electric Vehicle Integration to a Military Base Grid .......................................................85
4.6.1 Assumptions ...........................................................................................................86 4.6.1.1 Electrifying a Base Fleet ........................................................................ 87 4.6.1.2 Why Plug-ins? ........................................................................................ 88
4.6.2 Electric Vehicle Infrastructure ...............................................................................88 4.6.2.1 Charger—On-board/Off-board .............................................................. 89 4.6.2.2 Electric Vehicle Supply Equipment ....................................................... 89
4.6.3 Scenarios ................................................................................................................89 4.6.4 Demonstrating Electric Vehicle Grid Integration (EVGI) .....................................91 4.6.5 Expected Issues ......................................................................................................92 4.6.6 Conclusions ............................................................................................................93 4.6.7 Recommendations for Vehicle-to-Grid ..................................................................94
5 Wind Energy Technology and Buildings ......................................................................................... 96 5.1 Wind Resource Assessment Tools and Resources ...........................................................96
5.1.1 Wind Technology Overview ..................................................................................96 5.1.1.1 Small Wind Turbines ............................................................................. 97 5.1.1.2 Mid-size Wind Turbines ........................................................................ 98 5.1.1.3 Large Wind Turbines ............................................................................. 98 5.1.1.4 Wind Turbines for the Built Environment ............................................. 99
5.1.2 Wind Assessment Parameters ................................................................................99 5.1.2.1 On-site Data Collection ........................................................................ 100 5.1.2.2 Wind Maps ........................................................................................... 101

xvi
5.1.2.3 Wind Data Sets/Sources ....................................................................... 102 5.1.2.4 Computational Fluid Dynamic Modeling ............................................ 102
5.2 Wind Power ....................................................................................................................102 5.2.1 Vertical Wind Shear .............................................................................................104 5.2.2 Characteristics of Wind in the Built Environment and on Rooftops ...................106
5.3 Economics of Rooftop Wind Systems ............................................................................111 5.3.1 Methodology – Life Cycle Cost Approach ..........................................................112 5.3.2 Case Studies of Rooftop Wind Applications .......................................................114
5.4 Recommendations ..........................................................................................................115 5.4.1 DOD Annual Energy Load and Small Wind Turbines ........................................115
5.4.1.1 Other Options for Increasing Renewable Energy Production/Consumption for DOD ...................................................... 115
6 Waste-to-Energy Technologies ....................................................................................................... 118 6.1 Technology Overview ....................................................................................................118
6.1.1 Mass Burn ............................................................................................................118 6.1.1.1 Process Description .............................................................................. 118 6.1.1.2 Residual Material ................................................................................. 119 6.1.1.3 Scale of Operation ................................................................................ 119 6.1.1.4 Challenges ............................................................................................ 120 6.1.1.5 Active Projects ..................................................................................... 120 6.1.1.6 Planned Projects ................................................................................... 120
6.1.2 Gasification ..........................................................................................................120 6.1.2.1 Process Description .............................................................................. 120 6.1.2.2 Residual Materials ............................................................................... 122 6.1.2.3 Scale of Operations .............................................................................. 123 6.1.2.4 Challenges ............................................................................................ 123 6.1.2.5 Active Projects ..................................................................................... 123 6.1.2.6 Planned Projects ................................................................................... 123
6.1.3 Anaerobic Digestion ............................................................................................124 6.1.3.1 Process Description .............................................................................. 124 6.1.3.2 Residual Materials ............................................................................... 125 6.1.3.3 Scale of Operations .............................................................................. 125 6.1.3.4 Challenges ............................................................................................ 125 6.1.3.5 Active Projects ..................................................................................... 125 6.1.3.6 Planned Projects ................................................................................... 126
6.2 Technology Comparison ................................................................................................126 6.3 Recent Waste-to-Energy Technology Developments ....................................................126
6.3.1 Plasma Arc Gasification ......................................................................................126 6.3.1.1 Improved Efficiency ............................................................................ 126 6.3.1.2 Plasma Arc Projects ............................................................................. 127
6.3.2 Hydrothermal Gasification...................................................................................127 6.3.3 Hybrid Approach .................................................................................................127
6.4 Department of Defense Applications .............................................................................128 6.4.1 Establishing a Baseline ........................................................................................128 6.4.2 Economic Analysis of Existing DOD WTE Projects ..........................................129
6.4.2.1 Fort Bliss .............................................................................................. 129

xvii
6.4.2.2 Fort Irwin ............................................................................................. 129 6.4.3 General Economic Analyses ................................................................................130
6.5 Benefits to DOD .............................................................................................................130 6.6 Benefits to the United States ..........................................................................................131 6.7 Recommendations ..........................................................................................................131
6.7.1 Program Recommendations .................................................................................131 6.7.2 Project Recommendations ...................................................................................132
7 Buildings Technologies ................................................................................................................... 133 7.1 Overview of DOD Commercial Building Energy Use ...................................................133
7.1.1 Investment in Energy Efficiency .........................................................................134 7.1.2 New Building Designs .........................................................................................135
7.2 DOE Building Technologies Program ...........................................................................135 7.3 Whole Building Design ..................................................................................................139
7.3.1 Opportunity #1 – Net Zero Energy Commercial DOD Building Using Novel EnergyPlus Optimization Analysis ......................................................................142
7.3.2 Opportunity #2 – Net Zero Energy Commercial DOD Building Renovation Using Novel EnergyPlus Optimization Analysis ...........................................................144
7.3.3 Opportunity #3 – DOD Specific Automated Energy Auditing Tool Using OpenStudio and EnergyPlus ................................................................................145
7.4 Building Envelope Research and Development .............................................................151 7.4.1 Opportunity #1 – High Performance (Triple-Paned) Window Bulk Purchase
Program ................................................................................................................152 7.4.2 Opportunity #2 – Aerogel-Based Spaceloft Insulation for General Building
Applications .........................................................................................................153 7.4.3 Opportunity #3 – Sunlight Responsive Thermochromic Windows .....................156 7.4.4 Opportunity #4 – Cool Roofs ...............................................................................156 7.4.5 Opportunity #5 – Electrochromic Windows ........................................................157 7.4.6 Opportunity #6 – Phase Change Materials ..........................................................158 7.4.7 Opportunity #7 – PV Facades ..............................................................................158 7.4.8 Opportunity #8 – Integrated Roof Systems (Generation, Cool Roofs, Water
Catchment) ...........................................................................................................159 7.4.9 Opportunity #9 – Low-Cost Solar Water Heaters for Mild Climates ..................160
7.5 Appliances Research & Development ............................................................................161 7.5.1 Opportunity #1 – Grid-Friendly Appliance Controllers ......................................161 7.5.2 Opportunity #2 – Low-Energy-Use Refrigerators ...............................................162 7.5.3 Opportunity #3 – Low Energy Use Clothes Washers ..........................................162 7.5.4 Opportunity #4 – Heat Pump Domestic Water Heaters .......................................162
7.6 Advanced Cooling Technologies ...................................................................................163 7.6.1 Opportunity #1 – Desiccant-Based Indirect Evaporative Cooling System (DEVap)163 7.6.2 Opportunity #2 – Advanced Rooftop Air-Conditioning Units ............................165 7.6.3 Opportunity #3 – Multiple Opportunities through the California Energy
Commission PIER Program .................................................................................168 7.7 Geothermal Heat Pumps .................................................................................................168
7.7.1 Opportunity #1 – Ground Source Integrated Heat Pump (GS-IHP) ....................168 7.7.2 Opportunity #2 – New Foundation Heat Exchanger ............................................169 7.7.3 Opportunity #3 – Compact Prefabricated New Foundation Heat Exchanger ......170

xviii
7.7.4 Opportunity #4 – Ongoing GSHP-Related Demonstration and R&D Projects Funded by DOE ...................................................................................................170
7.8 Advanced Controls and Integrated Commissioning and Diagnostics R&D ..................171 7.8.1 Opportunity #1 - Self-Correcting and Self-Configuring HVAC Controls ...........171 7.8.2 Opportunity #2 - Image Processing Occupancy Sensor Controls ........................173 7.8.3 Opportunity #3 - Building-Wide, Proactive Energy Management Systems for
High-Performance Buildings ...............................................................................174 7.8.4 Opportunity #4 – Demonstration of an Enterprise Energy Management System
using New Standardized Data Schemas to Assist with Operational Decisions ...175 7.8.5 Opportunity #5 – Augmented Reality Building Operations Tool (ARBOT) ......176 7.8.6 Opportunity #6 – Multiple Opportunities through PNNL’s Fault Detection and
Diagnostics and Wireless Controls Programs ......................................................180 7.8.7 Opportunity #7 – Demand Response Research Center at Lawrence Berkeley
National Laboratory .............................................................................................180 7.8.8 Opportunity #8 – Multiple Opportunities through the California Energy
Commission PIER Program .................................................................................181 7.8.9 Opportunity #9 – Multiple Opportunities through the University of Colorado’s
Building Systems Program ..................................................................................181 7.8.10 Opportunity #10 – Multiple Opportunities through the California Lighting
Technology Center ...............................................................................................182 7.8.11 Opportunity #11 – Potential Opportunities through Texas A&M Energy Systems
Laboratory and University of Nebraska’s School of Architectural Engineering .182 7.9 Lighting ..........................................................................................................................182
7.9.1 Opportunity #1 – 2010 Solid State Lighting Competition – Winner (EnduraLED A19 Lamp, by Philips Lighting) ..........................................................................186
7.9.2 Opportunity #2 – 2010 Next Generation Luminaires Indoor – General Illumination Lighting Winner (“CAREENA LED” by Zumtobel Lighting, Inc.)186
7.9.3 Opportunity #3 – Novel Lighting Control Opportunities ....................................187 7.9.4 Opportunity #4 – Multiple Opportunities through the California Energy
Commission PIER Program .................................................................................187 7.10 Recommendations ..........................................................................................................188
References ............................................................................................................................................... 189 Appendix A: Sampling of Small Wind Turbine Manufacturers ........................................................... 200 Appendix B: Sampling of Small Wind Turbine Manufacturing Specification Sheets ...................... 201 Appendix C: Partial List of Consultants for Wind Modeling ............................................................... 211 Appendix D: Waste-to-Energy Projects ................................................................................................ 212

xix
List of Figures Figure 1. Viable co-production wells within 20 miles of military installations ..................................... 4 Figure 2. Location of military installations relative to geopressured reservoirs in the United States6 Figure 3. Current (2010) geothermal power installed capacity with projections for planned
installation; all currently installed capacity in the United States is in hydrothermal systems .................................................................................................................................... 7
Figure 4. Temperatures at 4.5-km depth (NREL 2010; Blackwell and Richards 2004); CONUS military installations overlay ................................................................................................ 10
Figure 5. Location of non-CONUS U.S. military installations relative to plate tectonic boundaries; inset maps: A is shown in Figure 6; B in Figure 7 and Figure 8, and C in Figure 10 ..... 15
Figure 6. Caribbean region showing non-CONUS military installations relative to plate tectonic boundaries and volcanoes ................................................................................................... 16
Figure 7. Heat flow map of Europe (European Communities 2002) with the locations of non-CONUS U.S. military installations overlain; plate boundaries and locations of volcanoes are also indicated ................................................................................................ 17
Figure 8. Temperature for Europe at 5-km depth (European Deep Geothermal Energy Programme 2010) with the locations of non-CONUS U.S. military installations overlain; plate boundaries and locations of volcanoes are also indicated .............................................. 18
Figure 9. Neustadt-Glewe geothermal heat recovery and district heating system schematic (Courtesy of GEO X, reprinted with permission) ................................................................ 19
Figure 10. Locations of non-CONUS U.S. military installations relative to plate tectonic boundaries and volcanoes in Japan-South Korea region ..................................................................... 20
Figure 11. Volcanoes of the Mariana Arc near Guam; note the Submarine Volcano located northwest of Guam (Source: oceanexplorer.noaa.gov) .................................................... 21
Figure 12. The four basic types of ground source systems (Courtesy of the Geo-Heat Center, reprinted with permission) ................................................................................................... 23
Figure 13. Module cross-section of a typical PV module with glass on the front and a polymer film as the back substrate (Source: NREL) ................................................................................ 29
Figure 14. Three different types of CPV systems: linear concentrator, point focus dish concentrator, and point focus fresnel lens concentrator (Source: NREL) ...................... 30
Figure 15. Solar resource map of the United States for a PV system tilted at latitude facing south (Source: NREL) ...................................................................................................................... 31
Figure 16. Optimal tilt of flat-plate PV systems based on measured solar resource data for 239 locations in the United States (Source: NREL) .................................................................. 32
Figure 17. For any location there is a range of tilts and azimuths that can capture 90% or more of the solar resource on a flat plate PV system; shown are the possible combinations for the region marked 30 on the U.S. map (Source: NREL) .................................................... 32
Figure 18. The concentrating solar resource of the United States is shown with the southwestern states having the best solar resource for CPV and CSP systems ................................... 33
Figure 19. Illustrates a comparison by month of a 1-kW PV system in Boulder, Colorado; the Energy Production Data are for a 4-kW pv system but can be easily translated to a 1-MW PV system by multiplying the energy production by 250 (Source: NREL PVWATTS 2010) ........................................................................................................................................ 34
Figure 20. Monthly energy production for a 4-kW flat plate PV system in Boulder, Colorado (Source: NREL PVWATTS 2010) .......................................................................................... 35
Figure 21. Left: CSP system using parabolic troughs to concentrate sunlight on an absorber tube at the linear focal point; optional thermal storage tanks are shown in this schematic (Source: NREL); Right: photo of a parabolic trough reflector 6 meters across made by skyFuel (Source: SkyFuel/NREL PIX 18227) ....................................................................... 41
Figure 22. Left: CSP system using linear fresnel reflectors to concentrate sunlight on the receiver assembly (Source: NREL); Right: Photo of several flat fresnel reflectors concentrating sunlight on a receiver above (Source: Ausra from http://solareis.anl.gov/documents/docs/NREL_CSP_3.pdf) ............................................. 41
Figure 23. Left: CSP system using a parabolic dish to concentrate sunlight on the receiver of a sterling heat engine (Source: NREL); Right: Photo of a 25-kW system developed by
xx
sterling energy systems (Source: Sandia National Laboratories) ................................... 42 Figure 24. Left: CSP using heliostats (moveable mirrors) to concentrate sunlight on the receiver at
the top of the tower (Source: NREL); Right: Photo of eSolar’s Sierra Solar Tower, 5-MW CSP system in Lancaster, California (Source: Courtesy of eSolar, reprinted with permission) ............................................................................................................................ 43
Figure 25. Concentrating solar resources of the United States (Source: NREL) ............................... 44 Figure 26. Direct normal solar radiation in the southwest United States, filtered by resource, land
use, and topography (Source: NREL) ................................................................................. 45 Figure 27. Chart of different energy storage systems energy densities by volume and by weight
(Courtesy of the Electricity Storage Association, reprinted with permission) ............... 49 Figure 28. Shows a schematic plate assembly for a lead-acid battery (Courtesy of CSIRO,
reprinted with permission) ................................................................................................... 52 Figure 29. Different types of lead-acid batteries (Source: NREL) ........................................................ 52 Figure 30. Schematic of a flow battery where electrolyte flows through a fuel cell (From Zhenguo
Yang, Jun Liu, Suresh Baskaran, Carl H. Imhoff, and Jamie D. Holladay, “Enabling Renewable Energy—and the Future Grid—with Advanced Electricity Storage,” JOM, 62 (9) (2010), pp. 14–23. Copyright © 2010 by The Minerals, Metals & Materials Society. Reprinted with permission.) ................................................................................................. 55
Figure 31. Sodium sulfur battery schematic (Courtesy of NGK Insulators Ltd., reprinted with permission) ............................................................................................................................ 57
Figure 32. Schematics of an asymmetrical supercapacitor on the left and an ultrabattery on the right that has a combination negative plate consisting of a carbon electrode and a lead electrode (Courtesy of CSIRO, reprinted with permission) .............................................. 58
Figure 33. Capital costs of different energy storage systems per unit of power and per unit of energy (Source: Electricity Storage Association, reprinted with permission) ............... 60
Figure 34. Example of photovoltaic, microturbine, wind, and internal combustion engine energy resources (Courtesy of EPRI, reprinted with permission) ................................................ 62
Figure 35. Microgrid and components (Source: NREL) ....................................................................... 66 Figure 36. Interaction of actors in different smart grid domains through secure communication
flows and electrical flows (Courtesy of the National Institute of Standards and Technology, reprinted with permission) ............................................................................. 67
Figure 37. A 7-MW cogeneration system is part of a comprehensive set of energy and facility upgrades at a Marine base in Twentynine Palms, California (Source: NREL PIX 12709)72
Figure 38. Schematic of the CERTS microgrid (Copyright 2008, The Regents of the University of California. No use is permitted without written permission. Please contact Chris Marnay at [email protected]
75 if you wish to use or reproduce this diagram for any
purpose. Reprinted with permission) .................................................................................. Figure 39. The Smith Electric Newton All-Electric Truck, upfitted into one of many different
configurable options (Courtesy of Smith Electric Vehicles, reprinted with permission)87 Figure 40. Illustration of PEV infrastructure (Source: NREL) ............................................................... 89 Figure 41. Scalable renewable PEV energy management component for microgrids (Source:
NREL) ...................................................................................................................................... 92 Figure 42. Schematic diagram of a grid-tied wind energy system (Source: NREL) ........................... 98 Figure 43. Wind data collection regions associated with met towers, SODAR and LIDAR (Courtesy
of Second Wind, reprinted with permission) .................................................................... 100 Figure 44. 80-m wind speed map of the United States (Source: U.S. DOE 2010) ............................. 101 Figure 45. Comparison of aerodynamic efficiencies of common types of wind turbines (Source:
NREL) .................................................................................................................................... 104 Figure 46. Surface roughness impacts on wind speed vs. height using the logarithmic law
approach (Courtesy of Tom Lambert at Mistaya Engineering Inc., reprinted with permission) .......................................................................................................................... 106
Figure 47. Rural surface roughness on the left and urban surface roughness on the right (Courtesy of STFC, reprinted with permission) ................................................................ 107
Figure 48. Wind velocity profiles for rural, suburban and urban settings (Courtesy of STFC, reprinted with permission) ................................................................................................. 108
Figure 49. CFD models of wind flow over and around buildings; 3-dimensional at left and

xxi
2-dimensional at right (Courtesy of PhD research, Sander Mertens TU Delft, reprinted with permission) .................................................................................................................. 109
Figure 50. Horizontal velocity contours, south wind direction (Courtesy of CPP Wind Engineering, reprinted with permission) ................................................................................................. 110
Figure 51. Typical mass burn plant process diagram (Courtesy of ecomaine, reprinted with permission) .......................................................................................................................... 119
Figure 52. Example of a biomass gasifier (Courtesy of HTCW.info, reprinted with permission) ... 121 Figure 53. Individual agency reductions in Btu per square foot of goal building space in FY 2007
compared to FY 2003 (Source: http://www1.eere.energy.gov/femp/pdfs/annrep07.pdf)134 Figure 54. Venture capital investment in energy efficiency (Source: NREL) .................................... 138 Figure 55. Side view of research support facilities (Source: NREL PIX 17778) ................................ 140 Figure 56. Research support facility’s natural ventilation design (Source: RNL Design) ............... 141 Figure 57. Opt-E-Plus optimization results (Source: NREL Opt-E-Plus Software) ........................... 143 Figure 58. OpenStudio facility rendering (Source: U.S. DOE OpenStudio Software) ...................... 146 Figure 59. Single zone air delivery system (Source: U.S. DOE EnergyPlus Software) ................... 147 Figure 60. Building component library screenshot (Source: NREL) ................................................. 148 Figure 61. Google SketchUp / EnergyPlus model using PhotoMatch (Source: NREL) ................... 149 Figure 62. Heat loss through residential building envelope (Source: NREL) ................................... 151 Figure 63. Insulation value per inch comparison (Source: NREL) .................................................... 154 Figure 64. Aerogel insulation material (Source: NREL PIX 08754) .................................................... 155 Figure 65. Schematic and photo of the Coolerado H-80 hybrid rooftop unit (Courtesy of Coolerado,
reprinted with permission) ................................................................................................. 166 Figure 66. Mockup of augmented reality use case for variable-air volume box diagnostic (Source:
NREL) .................................................................................................................................... 178 Figure 67. Mockup of augmented reality use case for daylighting (Source: NREL) ........................ 178 Figure 68. Mockup of augmented reality use case for chiller diagnostic (Source: NREL) ............. 179 Figure 69. 12-W LED replacement of 60-W incandescent (Courtesy of Zumtobel, reprinted with
permission) .......................................................................................................................... 186 List of Tables Table 1. Work to be done during the various Ft. Bliss exploration phases .......................................... 9 Table 2. CONUS military installations with co-production potential ................................................... 11 Table 3. CONUS military installations with geopressured resource potential ................................... 12 Table 4. Military installations within 40 miles of known low-temperature hydrothermal systems ... 13 Table 5. Derate factors used by PVWATTS for DC to AC losses (Source: NREL PVWATTS 2010) .. 36 Table 6. Area associated with 1 kW of PV of various PV module types .............................................. 37 Table 7. Global installed CSP plants (Source: Price 2010) ................................................................... 40 Table 8. Historical and predicted CSP costs (Source: Aabakken 2006) .............................................. 46 Table 9. Description of energy storage technologies ........................................................................... 48 Table 10. Energy storage applications for DOD facilities ..................................................................... 50 Table 11. Current DOD microgrid demonstration projects ................................................................... 70 Table 12. Critical components of microgrid research and development ............................................ 83 Table 13. Modeled vehicle characteristics ............................................................................................. 86 Table 14. Electric truck options available on the 2010 GSA schedule ................................................ 88 Table 15. Turbine sizes and markets in the United States .................................................................... 96 Table 16. Surface roughness lengths and descriptions ..................................................................... 105 Table 17. Rooftop wind velocity profiles at 20 ft (6.1 m) above the roof ........................................... 111 Table 18. Sample wind turbine specifications ..................................................................................... 111 Table 19. Economic factors of wind turbine installations at 30 ft (9.1 m) above the roof ............... 113 Table 20. Economic factors of wind turbine installations at 15.2 m (50 ft) above the roof ............. 114 Table 21. Comparison of small-, mid-, and large-size turbine numbers, production, and
economics ............................................................................................................................ 116 Table 22. Average mass burn emissions (Source: Lauber 2006) ...................................................... 118 Table 23. Example of Syngas combustion emissions (Source: Lauber 2006) ................................. 122 Table 24. Comparison of key metrics ................................................................................................... 126

xxii
Table 25. Solid waste disposal data for fixed installations (Source: Davis 2010) ............................ 128 Table 26. DOD energy use intensity statistics (Source:
http://www1.eere.energy.gov/femp/pdfs/annrep07.pd) ................................................... 133 Table 27. Total DOD investments in energy efficiency in 2007 (Source:
http://www1.eere.energy.gov/femp/pdfs/annrep07.pdf) .................................................. 135 Table 28. DOE appropriations and requests for energy efficiency and renewable energy (Source:
http://www1.eere.energy.gov/femp/pdfs/annrep07.pdf) .................................................. 136 Table 29. Excerpt of WCC summary for the Coolerado H-80 (Source: Coolerado).......................... 167 Table 30. DOE solid-state lighting R&D projects (Source: U.S. DOE Solid State Lighting
Program) ............................................................................................................................... 183 Table 31. U.S. DOE solid-state lighting R&D projects ......................................................................... 184

1
Introduction
The Strategic Environmental Research and Developmental Program (SERDP)/Environmental Security Technology Certification Program (ESTCP) Office requested that the National Renewable Energy Laboratory (NREL) provide technical assistance with strategic planning by evaluating the potential for several types of renewable energy technologies at DOD installations. NREL was tasked to provide technical expertise and strategic advice for the feasibility of geothermal resources, waste-to-energy technology, photovoltaics (PV), wind, microgrids, and building system technologies on military installations. Also included in the report is an energy storage section that provides descriptions and applications of electrical energy storage, and an electric vehicle grid integration (EVGI) section that describes a demonstration of EVGI technology as well as challenges and opportunities of EVGI to a military base grid.
The sections that follow are each devoted to the special characteristics, resource requirements, and opportunities of a particular renewable energy technology. The presentation of material is tailored to each of the technologies. Each section concludes with a list of recommendations based on the assessment, while the Executive Summary contains a major recommendation or two associated with each technology. Geothermal and Waste Heat Resources
Introduction This section of the report addresses two of the tasks to provide strategic advice to the DOD SERDP/ESTCP Office regarding renewable energy and energy efficiency measures that can be implemented to meet renewable power generation and energy security goals of the U.S. military. The two tasks as defined in the original scope of work were to:
Provide strategic advice regarding the economic and technical feasibility of using geothermal resources to produce electricity from abandoned oil and gas wells near military installations. This will include geospatial analysis of potential geothermal resources in proximity to military installations.
Provide strategic advice regarding the economic and technical feasibility of using waste heat and/or relatively low-temperature geothermal resources on military installations to produce electricity.
To provide strategic advice and recommendations on both tasks in a clear and concise format, NREL re-organized the structure of the two tasks, as directed by DOD-ESTCP, as follows:
Assess the technical and economic feasibility of using low-temperature geothermal resources situated near military installations to produce electricity. Resource types include: abandoned oil and gas wells (commonly referred to as co-production), geopressured systems, hydrothermal systems, and potentially sedimentary basin systems.
Assess the technical and economic feasibility of using:
Waste heat generated at military installations to produce electricity utilizing low-temperature geothermal technologies

2
Geothermal storage and/or normal ground temperature to provide space heating and cooling at military installations (this includes assessment of geothermal heat pumps and underground thermal storage systems).
Task 1 focuses on identifying permanent U.S. military installations that may benefit from their proximity to geothermal resources. Both continental United States (CONUS) and non-continental (non-CONUS) installations are considered. In general, the evaluation of the CONUS bases is more in depth due to our knowledge of the United States’ geothermal resource base, while evaluation of non-CONUS installations is more speculative, except in areas of previous NREL assessment (i.e., Guam). The technologies discussed in Task 2 are not limited by geographic proximity to a geothermal resource like those discussed in Task 1. Therefore, emphasis is placed on describing the technologies and how they can be implemented. Task 1: Co-production and other Low-temperature Geothermal Resources
Background Like other renewable energy resources, geothermal power generation provides clean energy with little to no greenhouse gas emissions. But unlike most other renewable energy technologies, it has the advantage of being able to supply baseload power without some type of energy storage medium. Utilization of low-temperature geothermal resources has the potential to be a viable solution for small- to medium-scale power generation needs of the U.S. military. Low-temperature geothermal resource types typically considered suitable for power generation include: co-produced water from oil and gas wells, geopressured fluids from deep sedimentary basins, and active hydrothermal systems. Another potential source of low-temperature geothermal fluids, which is currently being assessed by the U.S. Department of Energy (DOE), are thermal aquifers found in sedimentary basins that are not mixed with hydrocarbons or geopressured. For this report, low-temperature resources are defined as those with fluid temperatures below 150°C and, in most cases, temperatures in excess of 80°C. The applicability of the lower limit (i.e., 80°C), however, is dependent on the temperature difference (ΔT) between the cooling system and the working fluid. Typically, geothermal power plants are air cooled and the ΔT is controlled by ambient air temperatures; however, some systems are water cooled which can reduce the lower temperature limit and thereby improve the efficiency of the plant. Co-produced Water Co-production utilizes water produced as a byproduct from oil and gas wells as a potential resource for geothermal power generation. Water produced from oil and gas wells is historically considered an inconvenience by the industry, because of the high cost of disposal through re-injection and/or treatment. Co-produced water is typically considered a low-temperature geothermal resource because the bulk of the known resource capacity is below 150°C (Augustine and Falkenstern In Prep). Gas wells show the highest potential for geothermal power production. This is because of the thermal evolution of hydrocarbons, where oil forms at temperatures between 65°C and 150°C and natural gas forms at temperatures >150°C.

3
Co-production Demonstrations and Current State of the Technology Abandoned oil and gas well co-production has never been demonstrated at a current military installation. In the Unites States, only one example of power generation from co-produced water is currently active. At the Rocky Mountain Oilfield Testing Center (RMOTC), located 35 miles north of Casper, WY, 60,000 barrels of water per day of 100°C water are used to generate ~250 kW of electricity with a binary Organic Rankine Cycle (ORC) power plant (RMOTC 2010). The DOE-run RMOTC facility has additional plans to install another 250-kW power plant in the near future. DOE, in part, has also funded Chena Power, LLC, to build and demonstrate a mobile geothermal power plant to showcase co-production technology across the United States (U.S. DOE 2010); currently the mobile unit is in Utah. Two additional projects have been funded through the American Recovery and Reinvestment Act (ARRA) to demonstrate co-production viability in the Williston Basin of North Dakota and the Gulf Coast of Texas (U.S. DOE 2010); both projects are still in early stages of development. There are a number of benefits associated with co-production compared to other low-temperature resources, including:
The use of existing oil and gas field infrastructure
Simplified technology deployment
Relatively low risk
Improved economics of oil and gas wells.
Potentially the most important benefit of co-production is that existing oil and gas wells can be repurposed and other well field infrastructure, such as power lines, pipelines, and roads, can be leveraged to mitigate financial risk. Because of this, deployment is simplified and, in many cases, co-production can be considered a “plug-and-play” activity (e.g., Chena Geothermal, LLC, mobile power plant demonstration). These benefits, as well as the resource being well characterized (i.e., proven) ahead of time, mean the development of co-produced water for power generation is relatively low risk. Finally, if power purchase agreements are made with oil and gas operators, co-production can improve a well or well field economics by generating revenue from what is considered waste water. Drawbacks associated with co-production as a source of power generation include:
Generally on the low end of the low-temperature range
Limited geographic distribution of the resource
The need for sufficient water flow capacity
Water disposal issues.
As mentioned previously, co-produced water is a dominantly low temperature resource. It is also limited in geographic extent to areas of known/active oil and gas development, unless a developer wants to take on the financial risk of drilling a new well or set of wells. Also, not all areas of oil and gas production produce either an appreciable quantity of water and/or water of sufficient temperature for power generation. Finally, as mentioned previously, the potential for power generation from co-production appears to be limited to mostly gas wells.

4
Another drawback is that oil and gas wells are designed to minimize the water-to-oil or water-to-gas ratio. This means that either multiple wells will be needed to produce enough water or that a well will need to be re-completed (i.e., perforate the casing) to enhance the inflow of water. In many cases, both will need to be done. Currently, recompletion using conventional tools is considered an economic barrier to commercial development of the resource. Finally, the issue of what to do with the waste water still exists—it will either need to be re-injected or treated and disposed of. There are a number of regulatory hurdles that must be overcome, which can impact the economic viability of development of this resource. However, as mentioned above, the ability to improve the overall economics of the well/well field can help mitigate this issue.
Figure 1. Viable co-production wells within 20 miles of military installations
Other Low-temperature Geothermal Resources
Geopressured Resource Geopressured reservoirs (a.k.a., over-pressured reservoirs) are found in deep, geologically young sedimentary basins where rapid burial of underlying formations result in higher than normal fluid pressures. The depth of burial, in turn, can result in fluid temperatures that are sufficient for

5
geothermal energy development. Geopressured resources can be considered a variation on co-production, but are typically considered separate because the water to hydrocarbon ratio often makes extraction uneconomical for oil and gas operators. Geopressured Demonstrations and Current State of the Technology There has been one successful pilot-scale demonstration of the geopressured technology at Pleasant Bayou located in Brazoria, TX. From 1989-1990, a 1-MW binary ORC was operated, generating more than 3,400 MWh of electricity during a 7-month period. Currently, Louisiana Geothermal, LLC, is working to demonstrate geopressured technology in Cameron Parrish, LA, with DOE support (U.S. DOE 2010). Much like co-production, the exploitation of geopressured resources is relatively low risk because conventional, off-the-shelf equipment (i.e., plug-and-play) can be used with slight modification for high-pressure fluid intake to generate power. Also, geopressured systems can produce more power on a per-well or well-field basis relative to co-production due to high fluid pressures associated with the resource type. Geopressured resources are found in some of the same basins as co-produced water resources; however, they are confined to the deepest parts of the basins, which results in the geographic extent being much more restricted (Figure 2). Other drawbacks to geopressured resource development include the need to recomplete or deepen existing wells (or even drill new wells) as these units are either bypassed or deeper than the regional hydrocarbon pay zone. Like co-production, geopressured resources also have water disposal issues.

6
Figure 2. Location of military installations relative to geopressured reservoirs in the United States
Low-Temperature Hydrothermal System Resources Hydrothermal systems are considered the conventional method of extracting geothermal energy for power generation. In the United States, more than 2,200 MWe are generated (3,300 MWe installed capacity) from water and steam produced from hydrothermal reservoirs (GEA 2010). The vast majority of the hydrothermal resources being exploited at present are considered high temperature (i.e., >150°C in the reservoir); however, a number fall in the low-temperature range (e.g., Chena Hot Springs, AK). Hydrothermal resources are found primarily in the western United States, with California and Nevada being the two largest producers of geothermal power from hydrothermal resources (Figure 3).

7
Figure 3. Current (2010) geothermal power installed capacity with projections for planned
installation; all currently installed capacity in the United States is in hydrothermal systems
Current State of the Hydrothermal Technology Electricity generation from hydrothermal resources employ binary ORCs, flash, and dry-steam power plants; however, binary ORCs are considered more suitable for low-temperature applications. Most hydrothermal power systems attempt to use a closed-loop concept, where water is produced from one or more wells and then re-injected to mitigate hydraulic and temperature drawdown effects. The benefits of exploiting low-temperature hydrothermal resources include:
Leveraging knowledge gained by geothermal power industry
Less toxic/corrosive waters compared to co-production and geopressured resources
Potentially much larger geographic distribution than co-production and geopressured resources.
Drawbacks to utilization of low-temperature hydrothermal systems include:
Geographic extent is limited to the western United States

8
In most cases, exploration and drilling will need to be conducted to find and delineate the resource
Infrastructure will need to be built to access the resources, which can be remote
Higher risk relative to co-produced and geopressured resources.
There is a vast amount of knowledge that has been gained over the last half century by the geothermal power industry that can be leveraged to overcome obstacles associated with utilizing low-temperature hydrothermal resources. For example, more low-temperature hydrothermal resources have been identified relative to high-temperature hydrothermal resources. Unfortunately, none of this mitigates the issues of geographic extent and distribution. The cost of exploration, drilling, and infrastructure can be considerable when compared to co-production and geopressured resource development (i.e., millions vs. hundreds of thousands of dollars), and to prove a hydrothermal resource, it must be drilled. Case Study – Fort Bliss NREL’s geothermal team is working with DOD facilities regarding on-base opportunities for geothermal installations. In particular, NREL is working with Fort Bliss, TX, to help expand their power generation and space conditioning needs associated with an eminent 90,000+ troop expansion. To accomplish this, Fort Bliss requested support from the Federal Energy Management Program to create plans for implementing the recommendations of the Fort Bliss Energy Security Tiger Team in May 2009. This 13-month project, supported by ARRA funds, resulted in the Fort Bliss Energy Efficiency and Renewable Energy Master Plan draft. The draft identifies renewable energy opportunities at Fort Bliss, estimates their costs and benefits, and recommends strategies for implementation. Of the resources being investigated at Fort Bliss, geothermal is planned to be the third largest. The current plan is for geothermal at McGregor range, which would account for about 10% of the total resources to meet 425 GWh production for the base. Sandia National Laboratory was commissioned in the 1990s to drill four slimholes. The test wells measured temperatures around 175-185°F (80-85°C). Extensive geothermal exploration and evaluation must occur before the size and quality of the geothermal resource can be determined. The first step in this investigation is being funded as part of a DOE Geothermal Program ARRA grant that was awarded to the city of El Paso for exploration of geothermal resources at Fort Bliss. The County of El Paso team consists of Ruby Mountain, Inc. (project management), University of Utah Energy and Geosciences Institute, Aerospect (new drilling technology provider), and private share partner Radion Energy, LLC. The field investigation work will be performed in the three phases listed in Table 1.

9
Table 1. Work to be done during the various Ft. Bliss exploration phases
Phase I Phase II Phase III
• Literature Review
• Field Survey
o Heli-Lite drilling – Determine subsurface stability and consolidation
o Geological sample collection
o Infrared imaging survey – Detect faulting and geothermal anomalies
o Mercury survey – Identify previous geothermal activity
o Thermal gradient survey 6 ft. to150 ft. – Test the ground temperature at various depths
o Gravity survey – Characterize buried geologic structures and determine depth to bedrock
• Two slimholes • Flow testing of slimholes and verification of thermal capacity
• Model development plan for identified geothermal resources
The 3-year study will determine if (and where) commercially viable low-temperature geothermal resources exist in the McGregor test area, and if necessary, at other lesser-known sites that exist on the Fort Bliss Military Installation. The study will also determine the location the resources can be best accessed without compromising the tactical and strategic missions of the base. Secondly, the study will determine if resources that have adequate temperatures also have a water/fluid flow rate and volume to justify commercial development at any scale, considering the 20-MW target identified by the base. Finally, the study will determine if the resource is adequate, where production facilities can be located for power production, if (and how) such facilities can be used to power the McGregor Range installation, and how such power can be returned to the grid for use at Fort Bliss. The Fort Bliss team is concurrently examining the feasibility of a geothermal power plant in the McGregor Range area. They are examining transmission line access and cost, water availability and quality, and Environmental Assessment issues. A meeting with U.S. Geological Survey (USGS) indicated that water access is very limited near the Davis Dome and is brackish (salty and briny) in quality. Methodology and Approach The approach discussed above for conducting a first-cut resource assessment of the various low-temperature geothermal resources consisted of data gathering and geospatial analysis to determine the proximity of permanent military installations to known resources, or in the case of bases outside of the United States, to features that are associated with known geothermal systems. For example, the proximity of military installations to areas of elevated temperature at 4.5-km depth, as shown in Figure 4, suggests the potential for development of power generation capabilities at a number of military installations.

10
Figure 4. Temperatures at 4.5-km depth (NREL 2010; Blackwell and Richards 2004); CONUS
military installations overlay
Low-temperature Resource Assessment
Co-production Resource Assessment For this assessment, NREL compiled a database for a larger DOE co-production study consisting of 2.5 million wells of various types was leveraged. A number of criteria (largely based on the NREL-DOE study) were used to determine the potential co-production resource available to U.S. military installations, including:
Proximity to installations (within 20 miles)
Wells must be active (i.e., currently being produced)
Wells must produce water as a by-product (no minimum was set)
Measured or estimated water temperatures must be in excess of 80°C.
Using these criteria, the number of potential wells reduced to slightly more than 14,000 with suitable temperature within 20 miles of a military installation (Figure 1). This should be considered a minimum as there may be a significant number of wells that are inactive, but are potentially available for co-production. Preliminary results suggest that a number of installations

11
may benefit from their proximity to active wells capable of supporting co-production, listed in Table 2.
Table 2. CONUS military installations with co-production potential
Military Installation State Rank
Fort Chaffee AR High
Lemoore NAS CA
Medium
Travis AFB Low
Fort Polk MR
LA
Medium
Barksdale AFB High
Claiborne Range MR Medium
Louisiana Army Ammunition Plant High
Camp Shelby MR MS Medium
Tinker AFB
OK
Low
Fort Sill MR Low
U.S. Army Ammunition Plant Medium
Goliad Naval Auxiliary
TX
High
Chase Field NAS High
Waldron Field Medium
Cabaniss Field NAS Medium
Corpus Christi NAS Medium
Moore Army Airfield High
Kingsville NAS Medium
Orange Groove NAS High
Longhorn Army Ammunition Plant High
Additional refinement of this assessment is needed to better constrain resource estimates, as well as the power generation capacity of a well and/or well field. For example, if the active well-only criteria is modified to include wells that are inactive but not plugged and abandoned (i.e., shut in because they are currently uneconomical to produce likely due to the well producing too much water), the potential for a significant expansion of the resource base exists. This could lead to an expansion of the list of installations (Table 2) with potential for generating power from co-production.

12
Geopressured Resource Assessment Assessment of the viability of geopressured resource for use by military installations is qualitative as no well data are available. For this assessment, the locations of military installations were overlaid on a map showing the boundaries of known geopressured reservoirs in the United States (USGS 1975). Military installations with the potential to exploit geopressured resources are listed in Table 3.
Table 3. CONUS military installations with geopressured resource potential
Military Installation State Rank Sacramento Air Signal Depot
CA
High
Concord Naval Weapons Station Camp Parks MR Moffett Federal Airfield Rough and Ready Island Naval Reservation Oakland Army Base Travis AFB Point Arena Air Force Station Beale AFB
Medium Lemoore NAS Edwards AFB Low Louisiana Army Ammunition Plant
LA High
Alvin Callender Field Barksdale AFB Medium Camp Villere Low Camp Shelby MR MS High Fort Sill MR OK Medium Goliad Naval Auxiliary
TX High
Chase Field NAS Waldron Field Cabaniss Field NAS Corpus Christi NAS Moore Army Airfield Kingsville NAS Orange Groove NAS

13
Low-Temperature Hydrothermal There are a number of military installations being investigated for development of potentially high-temperature hydrothermal resources (e.g., Hawthorne Army Depot, Fallon NAS [see case study below], El Centro NAS, Chocolate Mountain Naval Reserve, Salton Sea MR, and Twentynine Palms Marine Corp Base) and one, Coso Geothermal Field at the China Lake Weapons Center, that is currently producing power from such a resource (Sabin, et al. 2010). There are additional military installations near known or suspected low-temperature resources or on the margins of known high-temperature hydrothermal areas, and for this assessment, identifying known, but undeveloped low-temperature hydrothermal systems within 40 miles of military installations were emphasized (Table 4).
Table 4. Military installations within 40 miles of known low-temperature hydrothermal systems
Military Installation State Resource Name (Temperature in °C)
Yuma Proving Ground
AZ Dunes, CA (145) and East Mesa, CA (165) Barry D. Goldwater Air Force Range
U.S. Marine Corps Air Station
Edwards AFB
CA
Randsberg (120) China Lake Naval Weapons Center
Ft. Irwin
March Air Reserve Base Arrowhead HS (115)
Camp Roberts
Paso Robles (95) and Tassajara (95) Hunter Liggett MR
Camp San Luis Obispo
Travis AFB Boyes (110) and Sonoma Mission Inn (110) Concord Naval Weapons Station
Sierra Army Depot Amadee (115) and Wendel (120)
Saylor Creek Aerial Gunnery Range
ID Radio Towers (90), Latty HS (110), White Arrow HS (100), and Banbury (95)
Mountain Home AFB
Ada County National Guard Maneuver Area
Ft. Bliss MR/White Sands Missile Range TX/NM Radium HS (90)
Dugway Proving Grounds UT Abraham HS (90)
In addition to the bases listed above, Nellis Air Force Base and Ranges and El Toro Marine Corp Air Station are worth considering because of their proximity to areas of high probability for finding a hidden (or blind) hydrothermal system (USGS 2008).

14
An Example of Geothermal Power Generation at Fallon Naval Air Station Fallon Naval Air Station, Nevada, is an in-progress example of geothermal power installation at a DOD facility, where a 30-MWe geothermal power plant is expected to be located near the southeast border of the Station (Wasson 2006). This project is being overseen by the U.S. Navy’s Geothermal Program Office who conducted the exploration and has contracted with Ormat Nevada, Inc. to drill wells and install the power plant. Per the Geothermal Program Office’s business model, the power generated by the plant will be sold through a long-term power purchase agreement to a power supplier, in this case Sierra Pacific Power Company. Although the scope of the work considered in this report is to generate power for installation use, it is worth mentioning that the Navy will be compensated over the first 20 years of the plant operation at 5% of the gross income from the power sales, and after 20 years, this portion increases to 15%. Low-temperature Geothermal Economic Considerations There are a number of economic considerations to be made when determining which, if any, low-temperature geothermal resource to develop for power generation purposes. Considerations affecting all low-temperature resource types described above include:
Geothermal power plant type and size
Infrastructure construction/improvements (i.e., roads, power lines, pipelines, and wells)
Distance to the resource
Additional applications of direct use and thermal energy storage (see Task 2).
Resource-specific factors such well re-working/re-completion (for co-production and geopressured resources) or drilling (for hydrothermal resources) must be considered. It is always cheaper to recomplete a well than to drill it. Resource temperature and flow capacity will dictate the type and size of power plant that can be employed. Most low-temperature resources will utilize a binary ORC, but other cycles such as Kalina or Stirling may be better depending on the type of cooling system, local climate conditions, and the rate of water production. Costs associated with the construction of a power plant, excluding any subsurface work, include: infrastructure construction or improvements, engineering/architectural services, and project management/coordination. The distance from the resource to the load center (i.e., the military installation) directly impact the cost of infrastructure construction, and in general, the farther the resource is from the installation the more expensive the project will be. Additional applications of the geothermal resource (e.g., district heating, thermal energy storage, etc) have the potential to improve the economics of the proposed development by capturing additional benefits (i.e., an offset in heating and/or cooling loads for buildings) with a relatively small increase in overall investment. In many cases, these issues are considered economic barriers for commercial development, but the economics for development for military concerns will be different and more site-specific data is needed to conduct a full-scale assessment of the techno-economic factors affecting deployment of geothermal technology.

15
Permanent Non-CONUS U.S. Military Installation Geothermal Power Potential As part of this assessment, NREL also evaluated non-CONUS U.S. military installations to determine their potential for utilization of foreign geothermal resources for power generation. The objective was to identify military installations within or adjacent to areas that have a high probability of containing geothermal resources. This portion of our assessment is qualitative due to limited data availability and general lack of local knowledge, with the exception of Europe and Japan where data are publicly available. To identify the geologic features of potential geothermal areas, zones of crustal subduction or extension and associated volcanoes were identified. Figure 5 shows the locations of all permanent U.S. military installations worldwide relative to global tectonic plate boundaries. Installations such as Lajes Field, Diego Garcia, Anderson, and Mariana are all located on islands near extensional plate boundaries (Figure 5), which suggest geothermal potential due to crustal thinning and volcanic activity.
Figure 5. Location of non-CONUS U.S. military installations relative to plate tectonic boundaries;
inset maps: A is shown in Figure 6; B in Figure 7 and Figure 8, and C in Figure 10

16
The proximity of installations located in Puerto Rico and the U.S. Virgin Islands to the Puerto Rico Trench, a subduction zone, make them likely places to find geothermal resources (Figure 6). The U.S. Naval Base-Guantanamo Bay on the Island of Cuba, however, has little potential for geothermal.
Figure 6. Caribbean region showing non-CONUS military installations relative to plate tectonic
boundaries and volcanoes
In Europe, a significant number of installations in Germany and Belgium are located within area of high heat flow (Figure 7) and elevated temperatures at 5-km depth (Figure 8). There are a number of geothermal projects that have been developed or are in the development stage in areas near some of the installations in Germany. These projects utilize a type of geothermal heat recovery system known in the United States as sedimentary basin geothermal in which well doublets or well set doublets are completed in highly permeable sedimentary formations (e.g., karst limestone or sandstone) with sufficiently high fluid temperatures (Figure 9). These systems, located near Landau, Neustadt-Glewe, Unterhaching (Seibt, et al. 2005), are designed to not only use the geothermal resources to generate power, but for district heating prior to reinjection.
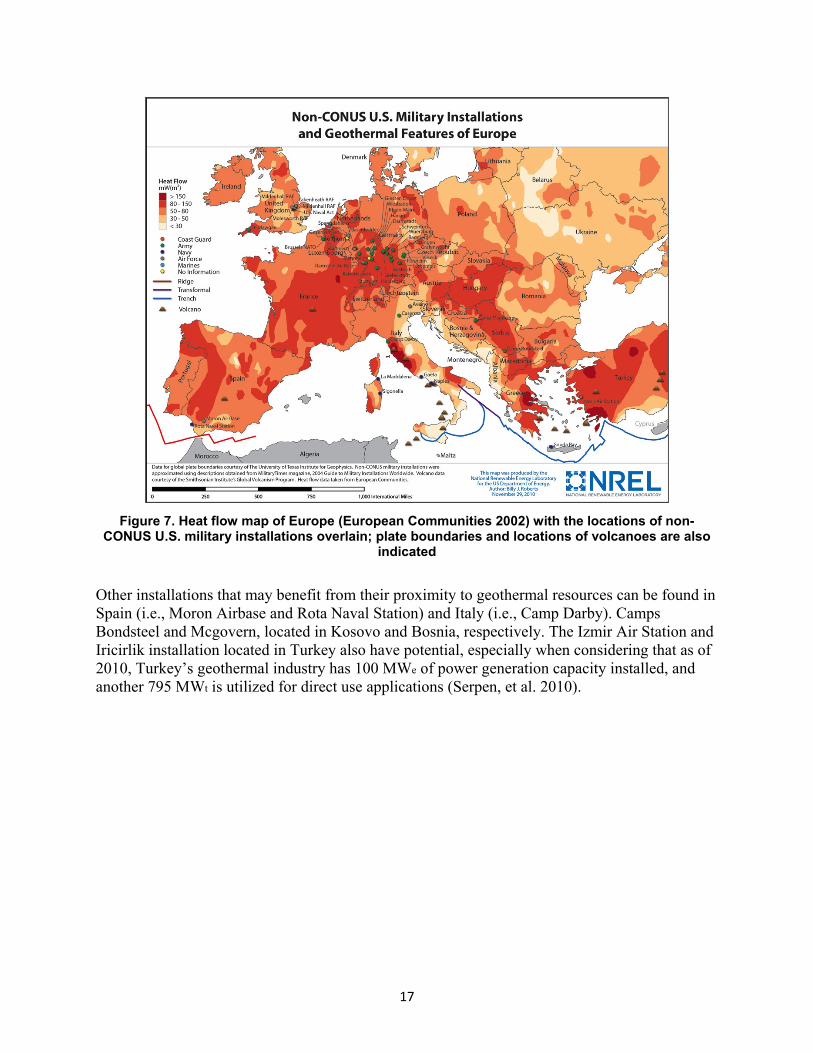
17
Figure 7. Heat flow map of Europe (European Communities 2002) with the locations of non-
CONUS U.S. military installations overlain; plate boundaries and locations of volcanoes are also indicated
Other installations that may benefit from their proximity to geothermal resources can be found in Spain (i.e., Moron Airbase and Rota Naval Station) and Italy (i.e., Camp Darby). Camps Bondsteel and Mcgovern, located in Kosovo and Bosnia, respectively. The Izmir Air Station and Iricirlik installation located in Turkey also have potential, especially when considering that as of 2010, Turkey’s geothermal industry has 100 MWe of power generation capacity installed, and another 795 MWt is utilized for direct use applications (Serpen, et al. 2010).
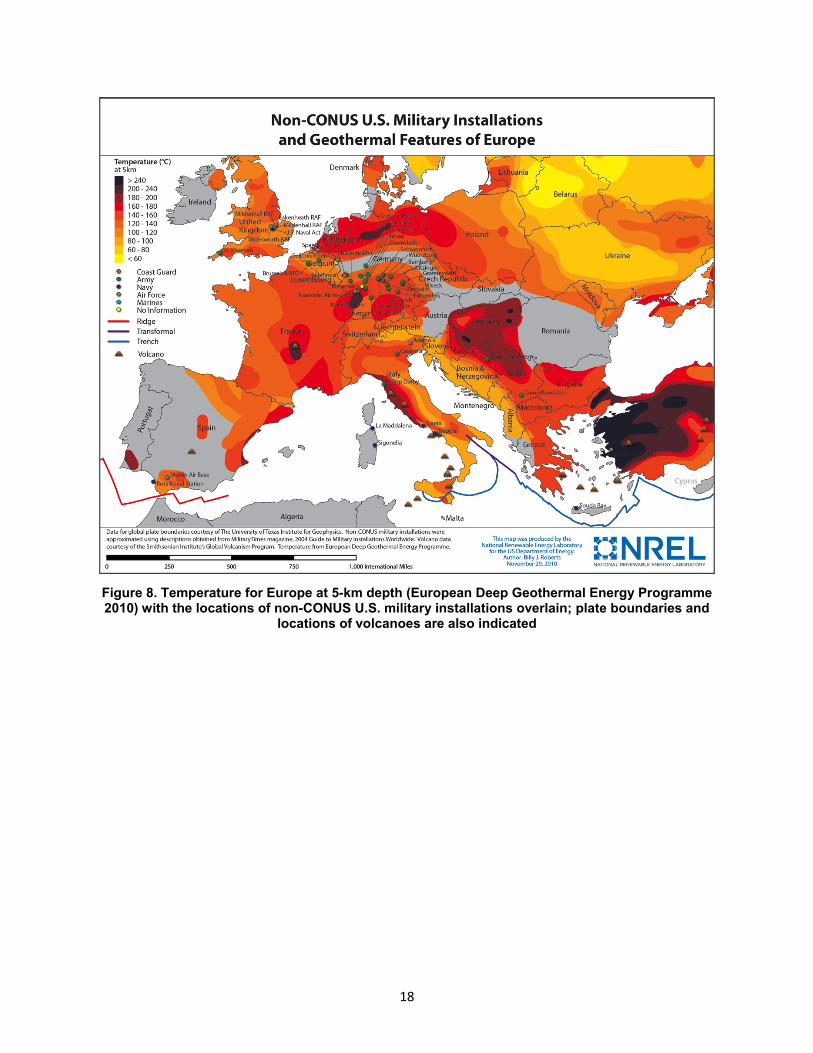
18
Figure 8. Temperature for Europe at 5-km depth (European Deep Geothermal Energy Programme 2010) with the locations of non-CONUS U.S. military installations overlain; plate boundaries and
locations of volcanoes are also indicated

19
Figure 9. Neustadt-Glewe geothermal heat recovery and district heating system schematic
(Courtesy of GEO X, reprinted with permission)
The U.S. military has a significant number of installations located in the Japan-South Korea area (Figure 10). Of the two countries, Japan has the greatest potential for generating power from geothermal resources due to its proximity to an active subduction zone resulting in numerous volcanoes (GRSJ 2010). The estimated potential of geothermal power generation in Japan is >20,000 MWe from hydrothermal reservoirs at relatively shallow depths (i.e., <3 km). Currently, 21 electric power units at 18 geothermal sites, mainly located in northern Honshu and Kyushu Islands, are in operation with a total capacity of 537 MWe. The proximity of U.S. military installations to the active fields indicates that power generation may be a viable option. The potential for power generation from geothermal resources in Korea appears to be low, but may be due to the lack of data available. South Korea has only recently begun assessing it resource base. With preliminary results indicating that there may be significant resources in the southeast quadrant of the country (Lee, et al. 2010).

20
Figure 10. Locations of non-CONUS U.S. military installations relative to plate tectonic boundaries
and volcanoes in Japan-South Korea region
Case Study – Guam Guam represents one of the DOD’s highest priority locations for the development of renewable energy due to Guam’s strategic importance, extremely high energy costs, dependence on imported fossil fuel, and the expected future pressure on the island’s energy resources from the planned increase in the military and dependent population. Baseload geothermal power would be a tremendous asset if it could be found and developed on Guam. A team from NREL and the Navy’s Geothermal Program Office, China Lake, CA, conducted an assessment of the geothermal potential of the island in April 2010. Guam has no obvious surface features suggesting geothermal potential and has never been the focus of a geothermal exploration campaign nor even a rigorous geothermal assessment. Guam lies on a regional trend of high heat flow, the Izu-Bonin-Mariana (IBM) volcanic arc system (Figure 11). However, while the central and northern portions of the IBM arc are volcanically active, Guam is not. Nonetheless active submarine volcanism occurs in deep water tens of miles west of Guam.

21
The NREL/Navy team uncovered a report of a steam vent in an abandoned limestone quarry on the southwest corner of Tumon Bay. The team located the quarry and spoke extensively with Prof. John Randall, University of Guam (retired) who visited the quarry in the early 1970s specifically to observe the steam phenomenon. The evidence of the steaming vent, and a report of a hot water well in the Ylig Valley, suggest that geothermal fluids are present in the subsurface on Guam. Certainly, there appears to be enough information to warrant further investigation and exploration for geothermal systems on Guam. A crucial step will be to drill one or more temperature gradient holes to verify the presence of heat at economically drillable depths.
Figure 11. Volcanoes of the Mariana Arc near Guam; note the Submarine Volcano located
northwest of Guam (Source: oceanexplorer.noaa.gov)

22
Task 2: Waste Heat Recovery and Non-power, Energy Efficiency Geothermal
Technologies In Task 1, geothermal technologies were considered primarily from the vantage point of using geothermal fluids to produce useful energy. There are two other groups of applications to consider under Task 2. Task 2a: The first of these groups is to use power conversion equipment used in the geothermal industry for the conversion of heat from sources other than geothermal, namely waste heat. Many geothermal wells produce fluids that have a temperature less than 150 C. Consequently, in recent years several companies have developed products for conversion of low temperature heat into electricity. Ormat, Thermex, and UTC all have products for this purpose. There is no technical barrier to utilizing cooling water carrying low temperature waste heat instead of geothermal brine. Indeed, UTC markets its PureCycle system, which has been deployed for geothermal electricity in such places as Chena Hot Springs in Alaska, as a waste heat capture and conversion system (UTC Power 2005). These technologies typically run on an ORC, wherein a low boiling point organic compound, such as a refrigerant or isobutane, is boiled using the hot water from a waste heat stream or geothermal well, and the resulting vapor is used to turn a turbine (DiPippo 2005). However, other thermodynamic cycles are possible and have been investigated. Task 2b: The second group of applications includes the non-power, energy efficiency geothermal technologies. This group comprises earth-air heat exchangers, geothermal heat pump (GHP) systems (sometimes referred to as ground source heat pump systems or geoexchange systems), and underground thermal energy storage (UTES). Technology Current State and Future Trends
Earth-Air Heat Exchange Earth-air heat exchangers, also known as air-ground or ground-air heat exchangers, are essentially a system for drawing ventilation air into a building through a subterranean pathway in order to preheat it (in the winter) or pre-cool it (in the summer) through heat exchange with the soil. This pathway can be as simple as a system of shallow underground pipes connected to the surface air outside through a short intake tower, or as complex as a basement labyrinth such as that used in the construction of the Research Support Facility at NREL. These systems can be particularly effective in especially airtight ‘green’ buildings that are not very ‘leaky’ and require significant active air exchange. They are particularly effective when used in conjunction with a recuperator. Earth-air heat exchangers are widely deployed in Europe, but have seen relatively limited usage in the United States. There is some opportunity here for demonstration and validation of this elegantly simple but under-utilized technology. Geothermal Heat Pumps GHP systems are a widely recognized technology that is becoming more widespread within the United States. Currently, more than 52,000 tons of GHP capacity is installed at DOD installations (U.S.DOD 2007). GHP and its variations use heat pumps to exchange heat between the building and the topmost layers of soil and rock, or surface/groundwater (Figure 12). While

23
earth-air heat exchangers exchange heat between incoming ventilation air and the ground in the vicinity of a building, they pre-heat or pre-cool ventilation air. By contrast, GHPs exchange heat between a building and the ground in its vicinity, and typically carry the full heating and cooling load of the building. Whereas an earth-air heat exchanger draws in air to mix directly with the building air, the GHP circulates fluid, usually water or a water-antifreeze mixture, through coils passing through the soil (or surface or groundwater) where it picks up or sheds heat, depending on whether it is in heating or cooling mode. This fluid is then brought into the building where it exchanges heat with the primary circulation inside the building. Vertical borehole and horizontal loop fields are the two most common types of GHP systems (Figure 12). Horizontal loops are much less expensive to install but require a large open outdoor area for trenching and burial. When these open areas are lacking, the vertical borehole option may be considered. In either system, heat is withdrawn from the ground in winter, or injected in the summer as needed. When dumped to the ground, the heat dissipates such that the average ground temperature remains roughly constant.
Figure 12. The four basic types of ground source systems (Courtesy of the Geo-Heat Center, reprinted with permission)
In closed-loop systems, heat transfer occurs through the walls of the buried pipes or tubing. In open systems, the ground loop is not closed and heat transfer occurs through mass transfer of water with the local aquifer system. Normal groundwater flow then carries away excess heat. Although variations on these are also available, this covers the basic conceptual framework. There are a number of factors affecting the performance potential of GHP installations, including: climate, soil properties (thermal conductivity, heat capacity), local hydrology, the type and size of GHP technology considered, characteristics of the building or buildings, local

24
infrastructure supporting GHP such as availability of experienced GHP professionals, and the cost and efficiency of the new or existing conventional HVAC equipment compared to a GSHP system (Hughes 2008). GHP Case Study – Fort Polk An instructive study of a GHP system at an Army base can be found in the case of Fort Polk, LA. One of the world’s largest installations of a GHP system was installed at Fort Polk, LA during 1995-1996 (ClimateMaster 2005). The project was a joint effort of the Army and Co-Energy Group, an energy services company, and was carried out under an energy saving performance contract (ESPC). At the time it was the largest federal ESPC, funded by $18.9 million in private capital, with no investment by the federal government except for procurement and administrative costs. The project will be paid for over 20 years by the energy and maintenance cost savings resulting from the retrofit. The retrofit reduced overall electrical consumption in Fort Polk Family housing (4,003 homes) by 26 million kWh per year, and eliminating annual natural gas consumption of 260,000 therms (IGSHPA 2008). The summer peak electrical demand was reduced by 7.5 MW (43%). Electrical energy savings and reduction of peak demand improved the annual electric load factor from 0.52 to 0.62, which may allow the Army to negotiate lower rates for the entire base. Co-Energy Group is responsible for the maintenance of the GHPs and for providing ongoing measurement and verification to ensure that cost and energy savings continued to be delivered to the Army (ORNL 2005). More than 8,000 borehole heat exchangers were installed to a depth of 130-325 ft; about 686 miles worth of 1-inch diameter polyethylene piping were installed in the vertical GHP heat exchangers. This would equate to approximately 6,600 tons of installed capacity or 23.2 MW (thermal). Maintenance cost for the system was about 18 cents per square foot per year compared to about 29 cents with the former conventional heating and cooling system. 4,003 ClimateMaster VZ series GHPs ranging from 1.5 to 2.5 tons (5.3 to 8.8 kW) were installed in the residences. The GHP saves the Army about $345,000 annually for the 20-year life of the contract (Co-Energy Group received 77.5% share of the energy savings in exchange for assuming responsibility for the maintenance and of course, the capital investment). After the contract expires in 2016, the Army will save about $2.2 million annually during the remaining GHP service life. The project also reduces CO2 emission by 22,400 tons per year. Underground Thermal Energy Storage If a borehole GHP system is ‘over-built’ (i.e., is built where more heat is dumped into the volume of the subsurface than can be dissipated), the temperature of the borehole field will be raised. This concept can be exploited so that the borehole field, instead of being designed to dissipate heat, is designed to store heat as a sort of thermal battery (IEA 2010). The heat can be used at a later time as needed. In this case, a borehole thermal energy storage system, one type of UTES, has been built. The corresponding open-loop thermal storage system is an aquifer thermal energy storage system. Aquifer thermal energy storage systems can be built in areas where groundwater flow in a confined aquifer is very slow so that the stored heat is not advected away. While UTES are not common in North America, they are used widely in Europe and are a technically mature technology (Sanner, et al. 2003). There are several installations in Canada; of

25
particular interest is the system built at Drake Landing in Okotoks, Alberta. This system is sized to serve an entire community and is of a size comparable to what such an installation on a military base may look like. In addition, there are companies in the United States who are beginning to see the value of these systems, and there is a relatively new installation at Stockton University in New Jersey. These systems present an excellent opportunity for demonstration and validation studies, as well as R&D possibilities that will help improve the thermal efficiency of power generators on DOD sites throughout much of the world. Recommendations To more fully assess the viability and facilitate the deployment of geothermal and waste heat recovery technologies discussed in Tasks 1 and 2, so that U.S. military concerns about energy security and sustainability are addressed, a number of data collection and evaluation and advanced R&D activities are recommended. Site-Specific Data Collection and Evaluation Based on NREL’s experience, the following detailed assessments are recommended to determine the waste heat recovery, low-temperature geothermal, GHP, and UTES potential at all DOD installations, as well as to develop a general set of systems requirements that would be used to facilitate the decision-making process. Assessments should include:
A more thorough evaluation of the waste heat and low-temperature resources (quantity and quality) available at military installations
The likely outcome would be to select a short list of installations with high potential for geothermal and/or waste heat applications to begin with.
A techno-economic evaluation of the cost of developing the above described resources to inform DOD of the economic viability of these technologies at U.S. military installations; the following data will be necessary to accomplish this:
o Installation energy and heating and cooling load requirements (peak and average for each month) along with cost and type (e.g., coal, gas, nuclear etc.) of energy source
o Installation heating and cooling system types (e.g., baseboard, forced air, etc.)
o Building square footage and open land area, along with their relationships to each other
o Building construction type and/or insulation for each building type
o Basic geologic and soil characteristics of installations
o Climatic conditions.
These data should be input into a database for use by all stakeholders:
o A review of installation energy audits, engineering reports, and any other information from base engineers, if available, as well as any publicly accessible information

26
o These data will help determine opportunities for energy savings using GHP and/or UTES systems, as well as determining the potential for waste heat capture for power generation.
o Instrument new installations of geothermal technologies at DOD bases to collect real-time data on the systems’ performance so that further research and analysis can be conducted in order to improve system performance
o This data can be combined with the GHP database for whole systems modeling efforts that will benefit DOD.
For non-CONUS, more extensive review of geothermal resources in the vicinity of installations, focused on a short list of higher probability sites, will need to be conducted. Additionally, case studies using a standard format should be prepared to ensure data collection and analysis is consistent. Advanced Research Advancements that will more fully enable the utilization of lower temperature hydrothermal resources are needed. Research focused on increasing power plant efficiency, hybrid power production options, and reservoir assessment and simulation could accomplish this objective. Power Plant Efficiency Improving power plant efficiency will help facilitate the development of low-temperature resources in two ways: 1) It will improve the economics of development (i.e., more power from a given resource), and 2) Allow for utilization of resources that are on the lower end of the low-temperature range (i.e., <100°C). Specific research areas include:
Advanced cooling power plant systems (e.g., hybrid cooling)
Advanced heat exchangers and working fluids
Alternative thermodynamic cycles (e.g., Stirling, Kalina).
Advanced power plant cooling systems help increase ΔT, resulting in increased power output at a given resource temperature and flow rate, as well as the ability to use lower temperature resources in areas with high average ambient air temperatures. As mentioned previously, GHP and UTES systems could be used to enhance power plant output over the course of a year, and especially improve plant efficiency during the high-demand portion of the warmer months. Advanced heat exchangers and working fluids would impact the efficiency of a power plant directly, while implementing alternative thermodynamic cycles could optimize a plant for given resource and climatic conditions. Hybrid Power Production Top-cycle applications to preheat fluids [e.g., concentrated solar power (CSP)-geothermal, combustion-geothermal, etc.] may be possible at bases in some regions. While these systems are still largely experimental, a CSP-geothermal hybrid system may be feasible at some bases with a low grade geothermal resource and plenty of sun. Bottom cycle heat capture to generate power and increase overall plant efficiency is another area that can be exploited with geothermal technology. While the latter would not necessarily be geothermal, it would utilize technology from the geothermal sector to enhance the performance of a base power system.

27
Reservoir Assessment and Simulation There is a strong need for improved methods of determining reservoir properties at depth. DOE invested in exploration technology development as part of the ARRA, but additional work is still needed to refine data collection and processing techniques. Another area needed for subsurface characterization is the development of better, less expensive, more user-friendly, 3-D geologic and reservoir modeling software. GHP Technology Although GHP technology is well established within DOD for HVAC applications, there is ample opportunity for more deployment. In addition, there are some interesting R&D opportunities that present themselves relating to this technology. One important possibility is to integrate ground loops into the process system to assist air-cooled condensers in dry regions. This concept can be integrated with any thermal cycle power generation that uses air-cooled condensers. It has the potential to provide a better heat sink on hot summer days when demand peaks than air-cooled condensers alone. Other variations that use GHP-related technology can be envisaged. Path Forward
There are also a number of programmatic-level initiatives that could improve the outcomes of technology applications discussed in both Task 1 and 2, including:
o Establishment of a GHP Center of Expertise to support continuing DOD efforts in ground source technology—basic data components of the Center, which would need to be collected, include:
Soil Thermal Properties Database
Power usage and HVAC system database
Equipment specifications database
(Both the Soil Thermal Properties STP database and the GHP Center of Excellence have been recommended by previous studies funded by DOD [DOD 2007])
Establishment of a testing and validation facility for geothermal technologies
Determination of technical and economic barriers to deployment at U.S. military installations
Continual identification of new R&D opportunities in all technology areas discussed in this report to enable future deployment.

28
Solar Electric and Storage Technologies
This section discusses the two dominant solar electric technologies, photovoltaics (PV) and concentrating solar power (CSP). Storing solar electricity increases its value. Current storage technologies are also discussed in this section. Photovoltaics Technology Overview PV technologies convert solar irradiance into direct current (DC) electricity using solid-state semiconductor devices. The PV module, along with the solar resource and the balance-of-system components will determine the performance of the PV system. The capital cost of a PV system, available incentives, the operation and maintenance costs, and local electricity prices will determine the economics of the PV system. A PV system can reduce utility bills by reducing the energy (kilowatt-hour [kWh]) charges. With the variability of the solar resource, a combination of energy management and energy storage is required to consistently make a reduction in demand (kilowatt [kW]) charges, if present. PV Modules A variety of semiconductors are used for different types of PV cells and modules: silicon (crystalline, poly-crystalline and amorphous), copper-indium diselenide (CIS), cadmium tellurium (CdTe, pronounced cad-tell), and various combinations of the III-V (pronounced three-five) elements, such as Gallium arsenide (GaAs) and Indium phosphide (InP). PV cells are the basic building blocks of modules. Thin film technologies include amorphous silicon (a-Si), CIS, or CdTe cells. Sometimes the cells are physically separate units as in the case of crystalline and polycrystalline silicon cells. In other cases the cells are formed when the module is manufactured, as in most thin film modules. Cells and PV modules are referred to by the dominant photovoltaic material, although the cells and PV modules consist of many different layers of other semiconductors, insulators, and metals. In many cases different cells of similar materials can be stacked in a multijunction cell configuration for higher efficiencies. Crystalline and polycrystalline silicon cells are grown in ingots or cast into ingots. The ingots are sliced into wafers, which are processed into cells by various chemical processes and metallization to form electrical contacts. Single crystal cells, referred to as crystalline, have higher sunlight-to-electricity efficiencies, up to 24%, compared to polycrystalline cells at up to 19%. The silicon cells are assembled into modules by electrically connecting the cells in a series to increase the voltage. The strings of cells are encapsulated between a sheet of clear, electrically insulating polymer on the front side, and either clear or opaque electrically insulating polymers on the back side. Tempered glass is used as the durable front surface on a module. See Figure 13.

29
Figure 13. Module cross-section of a typical PV module with glass on the front and a polymer film
as the back substrate (Source: NREL)
Amorphous silicon cells are manufactured directly onto glass or a back substrate. The silicon is not atomically ordered as in crystalline silicon cells; it is in an amorphous, disordered state. Because of this disorder, the cell efficiencies are reduced to a range of 8%-12%. However, the manufacturing process is simpler and requires less energy and less raw materials, resulting in a finished a-Si module that can be cost-effective and comparable to other PV modules. Amorphous silicon modules have an initial power loss when first deployed outdoors. This light-induced degradation loss is known and different manufacturers minimize this initial loss by making multijunction cells which have thinner layers and by adding hydrogen into the amorphous silicon. In all cases, a-Si modules are rated on their stabilized power after the initial loss.
Copper indium diselenide (CIS) is also abbreviated CIGS when gallium is used and CIGSS when both gallium and sulfur are used. CIS modules are manufactured similar to amorphous silicon—directly on glass. Efficiencies of CIS modules are approximately 13% for production modules and 19% in laboratory solar cells (Ramanathan et al. 2005). Cadmium tellurium (CdTe) modules are the lowest cost PV technology at present and they achieve 10-11% efficiencies. Modules are being sold by First Solar for under $1/W. First Solar is the global production leader of all PV technologies. Since the modules contain cadmium, First Solar has established a bonded recycling program to accept back and recycle all PV modules sold.
III-V cells are high efficiency cells in the 20-30% efficiency range. The higher price and high efficiencies make III-V cells acceptable for concentrating PV systems. III-V cells and modules are rarely used in a flat plate configuration for terrestrial applications. Concentrating PV (CPV) Concentrating PV (CPV) technologies are a fairly new technology that use optical concentrators to focus direct solar radiation onto PV cells for conversion into electricity. By using optical concentrators to focus the solar radiation onto solar cells, the cell area can be reduced. This is promising because mirrors and lenses are cheaper than the semiconductor PV cell. Concentrators can only use 85% of the energy that is within the beam of the sun. CPV has been used with the higher efficiency crystalline silicon and III-V cells.

30
Concentration ratios, which is the total area of the front of the CPV assembly divided by the area of the CPV cell, range from 2x to 400x. With the increased concentration there is an increase in heat by the CPV that needs to be reduced using passive cooling fins or active cooling. See Figure 14 for three different CPV systems: linear concentrator, point focus dish concentrator, and point focus Fresnel lens concentrator. All CPV systems require mechanical tracking to keep the concentrator assembly pointed at the sun. CPV systems are modular like flat plate PV systems; larger systems are made by increasing the number of the smaller, modular CPV assemblies. Some current CPV technologies feature cells with efficiencies as high as 26% (PV FAQs 2005). NREL has recently summarized the opportunities and challenges for the CPV industry (Kurtz 2010).
Figure 14. Three different types of CPV systems: linear concentrator, point focus dish
concentrator, and point focus fresnel lens concentrator (Source: NREL)
Solar Resource Maps NREL publishes several solar resource maps for different technologies since each technology can respond to different portions of the solar spectrum. Detailed site-specific maps are generated through NREL’s geographic information system team. The PV solar resource map in Figure 15 is for non-concentrating, flat plate PV modules tilted at latitude (tilted from the horizontal the same number of degrees of latitude) facing south. The variation in solar resource from a good location, 6 kWh/m2/day, is 50% better than locations with marginal solar resource, such as the upper Midwest and New England states with solar resources approximately 4 kWh/m2/day. For example, a location with a solar resource of 4 kWh/m2/day requires a PV system that is 50% larger to produce the same amount of electricity as the same type of system at a site with a 6 kWh/m2/day resource.

31
Figure 15. Solar resource map of the United States for a PV system tilted at latitude facing south
(Source: NREL)
PV modules tilted at latitude maximize the annual energy production at latitudes less than 20 degrees. At higher latitudes, the correlation is not valid. Christensen and Barker 2001 analyzed the annual solar resource data for different latitudes. At a location of 40° north latitude, an optimal tilt varies from 30°-35°to maximize the annual energy production. See Figure 16.

32
Figure 16. Optimal tilt of flat-plate PV systems based on measured solar resource data for 239
locations in the United States (Source: NREL)
Christensen and Barker 2001 also analyzed the solar resource on a flat surface for different tilt angles and azimuths (angle away from facing south). Depending on the location, 90% of the annual solar resource falls on a flat surface with tilts of 0° to 60° and azimuths of -75° to 75°. See Figure 17 that covers the U.S. region labeled 30. While it is desirable to maximize the energy production through tilt angle and array orientation, these factors are not always controllable and they may not have a large impact on production losses. The affect of different tilt and azimuth angles should be analyzed separately for each potential site.
Figure 17. For any location there is a range of tilts and azimuths that can capture 90% or more of the solar resource on a flat plate PV system; shown are the possible combinations for the region
marked 30 on the U.S. map (Source: NREL)
The concentrating solar resource map in Figure 18 is for concentrating systems that capture the direct beam of the sun. In the U.S., the southwestern states with low humidity and clear blue skies have the best concentrating solar resource. Concentrating PV systems are generally used in the southwestern states since there is excellent solar resource, which results in better economics.

33
Figure 18. The concentrating solar resource of the United States is shown with the southwestern
states having the best solar resource for CPV and CSP systems
Balance of System The module mounting system, which may include mechanical tracking, inverters, switches, fuses, and cables, are part of the balance of system required for a safe, functioning PV system. While PV modules have no moving parts, the modules can be tilted or rotated to maximize exposure to the sun. Additionally, all PV systems produce DC electricity. Therefore, in applications where alternating current (AC) electricity is used, an inverter is needed to convert the DC electricity into AC electricity. For concentrating PV systems, the concentrator mirrors or lenses are part of the concentrator module assembly and not part of the balance of system. Tracking Systems Electricity generation is maximized when PV modules are perpendicular, or normal, to the incoming sunlight. Mechanical tracking is used to enable PV panels to have greater access to sunlight—when compared with fixed panels—throughout the day and the year. Single-axis tracking systems are oriented on a north-south axis and the panels move from east to west throughout each day. These systems allow the panels to track the sun from east to west daily, but they do not have the capability to orient themselves north and south as the sun’s

34
altitude changes throughout the year. Single-axis tracking of an array will increase the energy production in some locations by up to 50% for some months and by as much as 35% over the course of a year. The most benefit comes in the early morning and late afternoon when the tracking array will be pointing more nearly at the sun than a fixed array. Generally, tracking is more beneficial at sites between 30° latitude north and 30° latitude south. For higher latitudes the benefit is less because the sun drops low on the horizon during winter months (U.S. DOE SETP December 22-23, 2010). Many utility-scale PV systems are single axis tracking. Two-axis tracking changes the PV module orientation in two different directions so that the PV module always faces the sun. Thus, the panels track the sun from east to west each day, and also from north to south throughout the year. Figure 19 shows images of fixed-, single- and dual-axis tracking systems.
Figure 19. Illustrates a comparison by month of a 1-kW PV system in Boulder, Colorado; the Energy Production Data are for a 4-kW pv system but can be easily translated to a 1-MW PV
system by multiplying the energy production by 250 (Source: NREL PVWATTS 2010)

35
Figure 20. Monthly energy production for a 4-kW flat plate PV system in Boulder, Colorado
(Source: NREL PVWATTS 2010)
Inverters Inverters are solid state electronics with DC-AC conversion efficiencies greater than 90% and peak efficiencies of 96% depending on the manufacturer and the power output as a function of the inverter’s power rating. Warranties on inverters are typically 10 years. Manufacturers are continually improving inverter efficiencies and duration. The inverters include a maximum power point tracking (MPPT) function to operate the PV system at peak power throughout the day and the year. For high efficiency DC-AC inverters with MPPT, there is little reason to consider switching to or identifying only DC-powered loads or appliances to improve on efficiency. There are some specialized applications such as water pumping where direct connection of PV modules to a DC pump is cost-effective. In most other applications, conversion of the DC PV system output to AC is more advantageous. Losses In addition to inverter losses, there are several other losses that reduce the DC-AC system efficiency. See Table 5 for a list of de-rate factors used by the PV calculation tool, PVWATTS. An industry-accepted standard for derate losses is 0.77. Losses are based on equipment selection, such as the PV modules nameplate rating variations, PV module mismatch (batch variations at the manufacturer plant), and the inverters that may also require a separate transformer. Losses are also a result of the design and installation of components such as diodes, connections, and wire sizes. The other losses are under the control of the PV system operator, such as shading, soiling, and system availability. Most PV systems should be able to do better than the PVWATTS average with better equipment selection and good operation and maintenance. Soiling losses (assumed to be 5% in PVWATTS) are location dependent and highly variable. PV modules are typically washed with a water spray. The frequency of the washing depends on the rain intervals and the availability of water for washing. Several companies are proposing or selling aftermarket coatings that reduce the soiling buildup. Presumably the cost of the coating is less expensive and applied less often than the water and associated labor to wash a PV system. There are few, if any, unbiased evaluations of the performance of anti-soiling coatings.

36
Table 5. Derate factors used by PVWATTS for DC to AC losses (Source: NREL PVWATTS 2010)
Component Derate Factors Component Derate Values
Area of System (square foot [ft2])
PV module nameplate DC rating 0.95 0.80–1.05
Inverter and Transformer 0.92 0.88–0.98
Mismatch 0.98 0.97–0.995
Diodes and connections 0.995 0.99–0.997
DC wiring 0.98 0.9–0.99
AC wiring 0.99 0.98–0.993
Soiling 0.95 0.30–0.995
System availability 0.98 0.00–0.995
Shading 1.00 0.00–1.00
Sun-tracking 1.00 0.95–1.00
Age 1.00 0.70–1.00
Overall DC to AC derate factor 0.77 (PVWATTS Default)
Costs In some locations, the electricity produced by a PV system costs less than the traditional, fossil-fuel produced electricity, especially on islands or remote locations where the cost of fuel or the delivery costs are very high. In most locations, the electricity cost ($/kWh) of a PV system is highly dependent on the solar resource, grants, subsidies, and tax breaks. The installed system costs are in the range of $4-6/watt (W) for large MW-sized PV systems with energy costs of $0.15-0.25/kWh depending on location and financial incentives. Higher efficiency panels tend to cost more than less efficient ones. Since PV modules have different efficiencies, it is important to consider the efficiency versus the available or required area of the PV system, and to consider the cost implications of more or less efficient panels. Fewer modules made of a higher efficiency cell (such as single-crystalline) will be needed for approximately the same power output as more modules made of a lower efficiency cell (such as thin-film). Therefore, if a project location is space-constrained, then a higher efficiency (and potentially higher cost) module may make the most sense. However, if a project has an abundance of space, a lower efficiency, less costly module may be most practical. This concept is further supported by Table 6.

37
Table 6. Area associated with 1 kW of PV of various PV module types
Type of Module Efficiency of Module Area of System (square foot [ft2])
Crystalline 15% 71ft2
Amorphous 9.5% 99ft2
III-V 19.3% 55ft2
Economies of scale generally result in reduced costs per kW for larger systems; small systems in the kW-sized range tend to have higher installed costs. Since there are no moving parts, PV modules often include warranties of 20 to 25 years. The warranty is typically used as the lifetime in financial calculations even though the lifetime may be longer. PV modules can be the most durable component of a PV system. Nonetheless, the selling prices of complete PV systems are fairly competitive between technologies. State of the Research The research and development goals for PV are to increase the cost-effectiveness of the PV systems by reducing material or installation costs, improving efficiencies, and improving production throughput. Crystalline and polycrystalline PV systems are the moving targets that all other systems are compared with, in addition to the levelized cost of electricity from electric utilities or generators. The U.S. DOE estimates that a $1 per watt installed PV solar energy system—equivalent to 5–6¢/kilowatt hour (kWh)—would make solar without additional subsidies competitive with the wholesale rate of electricity, nearly everywhere in the United States. DOE recently announced a goal to achieve a cost of installed solar PV systems to $1/W by 2017 (U.S. DOE SETP December 22-23, 2010). Some research in thin film technologies has focused on improving the PV performance at low light conditions. However, only a-Si modules, in particular Uni-Solar, have reported on improved PV performance at low light conditions, measured in kWh/kW installed. Other thin film companies sometimes claim this advantage also but haven’t substantiated their claim with peer-reviewed data. The premise is that the improved performance at low light is advantageous for a-Si PV systems installed in hazy or cloudy locations. Other PV companies that don’t produce thin film modules refute the claim and point to system data showing no improvements and that there are other more important factors such as system uptime and inverter reliability. On balance, any low light performance improvement will be a secondary consideration, not a primary consideration. CPV can reduce the equipment costs by minimizing the quantity of expensive semiconductor material that is needed and instead using less expensive steel, aluminum, or plastics to concentrate the sunlight. There is a balance between high concentration and the need for higher tracking precision and lower concentration, which uses lower cost tracking equipment. Most CPV systems are better performers in regions with low humidity and clear blue skies. The

38
calculated or projected cost advantages of CPV become negligible or a detriment in locations with high humidity and increased overcast skies. Flat plate PV systems can be combined with other non-electrical systems. At least one company, PVT Solar, is developing and marketing combined PV and solar thermal hot water systems, abbreviated PVT. A solar thermal hot water system is placed under the PV system to capture the heat from the PV modules. The water temperature is less than in a standalone SHW system, but the claim is that the collected energy (thermal and electrical) per area is more than either system separately. The size of any PVT system is limited by the amount of hot water that can be used. Given the large area of a flat plate PV system, on the order of 13 W/ft2 for a 14% efficient PV module, a ground mounted PV system could be used for rain water collection. If the PV modules are tilted at an angle greater than 5°, rainwater will flow off the bottom of each module. Although a lesser consideration in the design of a PV system, rainwater runoff has to be managed at all PV system installations to reduce soil erosion. As an example, a 100 kW PV system has about 7,700 ft2 of PV modules and a 1-inch rainfall would produce 640 ft3 (4,800 gallons) of water if it were captured using traditional rain gutters at the bottom of the PV modules. The use of plastic, non-conductive gutters would avoid electrical grounding requirements. Additionally, the use of non-conductive inserts or fillers between PV modules would lead to more water capture. Innovative mounting structures are being developed that reduce PV installation labor and costs, eliminate concrete foundations, and decrease the installation time. Many of the ballasted weighted structures designed for roof tops with no roof penetrations can be used on the ground. Research and development is ongoing on high reliability inverters. Most inverters have warranties of 10 years, which is an administrative requirement of PV systems installed in California, and has been adopted by many other states. The warranty is not necessarily a reflection of lifetime, but an economic and risk consideration of the inverter’s manufacturer. Microinverters, or back of the module inverters, offer promise for difficult installations with shading problems, finer control over energy production at the PV module level, and reduced costs in case of widespread damage to a PV system since each PV module and microinverter is an autonomous PV system at the AC electricity level. Recommendations for PV Many DOD sites have deployed PV systems, both at a distributed and a utility scale, to reduce electricity use and greenhouse gas emissions, meet operational needs, and enhance energy security. CPV systems are a newer technology, and although there’s been minimal or no deployment by DOD, there are two bases that are currently planning CPV technology demonstrations (SERDP/ESTCP December 23,2010). There are many aspects of PV or CPV technologies that could be studied to balance or provide focus for DOD applications.
1. Conduct site wide study/survey of existing facilities to determine appropriate locations of PV systems and work to implement those systems.

39
2. Study or research on the benefits of widespread PV modules with microinverters versus a centralized PV system with string inverters within a DOD facility, especially with respect to continuity of power in contrast to a typical centralized PV system.
3. Research and pilot cost-effective anti-soiling coatings for PV modules to reduce the need for manual cleaning, meet water requirements, and improve long-term performance.
4. Research and pilot communications technologies between electrical generation and loads in a microgrid operation within the DOD continuity of operations constraints.
5. Fund a demonstration system using PVT or rainwater collection.
Concentrating Solar Power Technology Overview CSP technologies convert solar irradiance to electricity through a thermal process. These systems concentrate solar energy 50 to 10,000 times to produce high-temperature thermal energy, which is used to produce electricity for distributed- or bulk-generation process applications. There are many variations of these technologies. (Argonne 2010) Many of these variations are company specific and are presently cost effective, may be cost effective when produced in large quantities (economies-of-scale), or are predicated on a technology breakthrough or by implementing R&D processes into production. Concentrating solar power systems concentrate sunlight to heat a working fluid, typically oil, which is circulated to a steam turbine or a Sterling engine. The sunlight is concentrated at the
• focal line of parabolic troughs or linear Fresnel reflectors,
• focal point of a parabolic dish,
• top of a solar tower using heliostats (movable mirrors).
Because of the variability of solar resource, CSP systems are often paired with thermal energy storage (TES), which enables the system to provide a consistent quantity of electricity. Through energy management and TES, CSP technologies can help reduce energy costs as well as demand charges. A parabolic dish concentrator can be deployed in 2- to 25-kW modular unit sizes, whereas troughs and solar towers are deployed in MW sizes to achieve economies-of-scale pricing. Large utility-scale systems have focused on the linear and tower systems, but the smaller, modular dish systems could potentially fill niche needs at DOD facilities.

40
At the end of 2008, there were 430 MW of cumulative, grid-tied CSP capacity worldwide, with more than 95% (419 MW) of this global capacity located in the Southwestern United States. By July 2009, global capacity increased to about 550 MW with the addition of 120 MW in Spain. This reduced the U.S. share to approximately 75%. Of the 550 MW of CSP worldwide, nearly 95% (519 MW) is parabolic trough technology, with the remainder (31 MW) being tower technology. On the global level, CSP capacity is poised to double in the near future, because nearly 600 MW of CSP were in the engineering, procurement, and construction stages by the end of 2008 (Grama 2008). Table 7 lists installed CSP plants worldwide as of July 2009.
Table 7. Global installed CSP plants (Source: Price 2010)
Plant Name Location Technology Type
Year Installed Capacity (MW)
SEGS I–IX California, United States Trough 1985–1991 354
APS Saguaro Arizona, United States Trough 2005 1
Nevada Solar One Nevada, United States Trough 2007 64
PS10 Spain Tower 2007 11
Puertollano Plant Spain Trough 2009 50
Andasol I Spain Trough 2009 50
PS20 Spain Tower 2009 20
Linear Concentrator CSP Systems Linear concentrator systems collect the sun's energy using long, rectangular, flat-, slightly-curved-, or parabola-shaped mirrors. The systems are single-axis tracking, which enables the mirrors to tilt directly toward the sun at all times. The sunlight is then focused, or concentrated, on absorber tubes (or receivers) that run the length of the mirrors. The reflected sunlight heats the working fluid, which is flowing through the tubes. This hot fluid is used to boil water in a conventional steam-turbine generator to produce electricity. There are two major types of linear concentrator systems. In parabolic trough systems, the receiver tubes are positioned along the focal line of each parabolic mirror. In linear Fresnel reflector systems, one receiver tube is positioned above several mirrors to allow the mirrors greater mobility in tracking the sun. Parabolic trough CSP systems consist of a large, modular array of single-axis-tracking parabolic trough solar collectors. Many parallel rows of these solar collectors span across the solar field, usually aligned on a north-south horizontal axis. Some of the new trough plants include thermal storage. Plant sizes can range from 1.0 to 100 Megawatt electric (MWe) (Aabakken 2006). Figure 21 contains a graphic and a photo of a parabolic trough system.

41
Figure 21. Left: CSP system using parabolic troughs to concentrate sunlight on an absorber tube
at the linear focal point; optional thermal storage tanks are shown in this schematic (Source: NREL); Right: photo of a parabolic trough reflector 6 meters across made by skyFuel (Source:
SkyFuel/NREL PIX 18227)
The first parabolic trough CSP systems installed in the United States were known as solar energy generating systems and were installed in stages I-IX between 1984 and 1990 in Southern California. These systems total 354 MW of installed capacity. Newer parabolic trough CSP systems have been installed in the Southwestern United States, including Nevada, California, and Arizona. The linear Fresnel reflector CSP system is similar to the trough CSP system except that flat reflectors concentrate sunlight on the receiver. The flat reflectors can be less expensive than the parabolic reflectors, and more flat reflectors can be used in the same area. The reflectors are relatively low to the ground (less than 10 ft), and the receiver can be as high as 30 – 40 ft, depending on the design and number of reflectors. Figure 22 contains a graphic and a photo of a linear Fresnel reflector system.
Figure 22. Left: CSP system using linear fresnel reflectors to concentrate sunlight on the receiver assembly (Source: NREL); Right: Photo of several flat fresnel reflectors concentrating sunlight on a receiver above (Source: Ausra from http://solareis.anl.gov/documents/docs/NREL_CSP_3.pdf)
Parabolic Dish CSP Systems A parabolic dish CSP system, sometimes known as a dish/engine system, uses a mirrored dish resembling a very large satellite dish. The dish-shaped surface directs and concentrates sunlight onto a thermal receiver, which absorbs and collects heat and transfers it to the engine generator.

42
The most common type of heat engine used today in dish/engine systems is the Sterling engine. This system uses the fluid heated by the receiver to move pistons and create mechanical power. The mechanical power is then used to run a generator or alternator to produce electricity. Parabolic dish CSP can have high peak efficiencies of greater than 30% because the optical concentration can be several hundred times and the operating temperature at the heat engine is not limited to the operating temperature ranges of oils and fluids used in parabolic trough systems. Dishes are available in 2 to 25 kW in size. They can be used individually, in small groups for distributed or remote power, or in large clusters for utility scale applications (1–10 MWe) (Aabakken 2006). A number of prototype dish/Sterling systems are currently operating in Nevada, Arizona, and Colorado in the United State, and in Spain. High levels of performance have been established. Durability remains to be proven, although some systems have operated for more than 10,000 hours (Aabakken 2006). Figure 23 contains a graphic and a photo of a parabolic dish CSP system.
Figure 23. Left: CSP system using a parabolic dish to concentrate sunlight on the receiver of a
sterling heat engine (Source: NREL); Right: Photo of a 25-kW system developed by sterling energy systems (Source: Sandia National Laboratories)
Power Tower CSP Systems A power tower system uses a large field of flat, sun-tracking mirrors known as heliostats to focus and concentrate sunlight onto a receiver on the top of a tower. The height of the tower increases with the power of the system which requires a larger reflector field. (Power from the Sun 2001) More power means more reflectors, which requires a higher tower. In this type of system the heat transfer fluid is contained in one location—the receiver on top of the tower—rather than circulating around the reflector field. The heat-transfer fluid is heated by the concentrated sunlight and steam is generated. The steam is used in a conventional turbine generator to produce electricity. Some power towers use water/steam as the heat-transfer fluid. Other advanced designs are experimenting with molten nitrate salt because of its superior heat-transfer and energy-storage capabilities. This energy-storage capability, or thermal storage, is an important consideration because it enables the system to continue to dispatch electricity during cloudy weather or at night. Plant size can range from 30 to 200 MWe. (Aabakken 2006) A 10-MWe pilot power tower plant with three hours of storage, called Solar Two, operated successfully near Barstow, California, leading to the first commercial plant being planned in

43
Spain. The planned plant in Spain will be a 30-100 MW commercial plant (Aabakken 2006). Figure 24 contains a graphic and a photo of a power tower CSP system.
Figure 24. Left: CSP using heliostats (moveable mirrors) to concentrate sunlight on the receiver at
the top of the tower (Source: NREL); Right: Photo of eSolar’s Sierra Solar Tower, 5-MW CSP system in Lancaster, California (Source: Courtesy of eSolar, reprinted with permission)
Energy Storage CSP systems can be combined with thermal energy storage, which can be used to extend CSP electricity production time up to 16 hours per day and to allow for greater dispatchability (the ability to increase or decrease electricity generation on demand) (Aabakken 2006). The size and type of the solar thermal storage system determines how much power production can be shifted later that day and the economics of that shift, if based on time-of-use utility pricing. Typically the thermal energy storage is only for that day and can’t be effectively used for the next day or beyond. Gaseous or liquid fuels can be burned to augment the stored thermal energy. Capacity Factor The most recently built CSP trough, tower, and dish-engine systems have AC capacity factors in the mid-20% range. With six hours of thermal storage, capacity factors increase to about 40%, and additional increases in thermal storage will enable capacity factors and dispatchability to increase even more. (Aabakken 2006) CSP Siting Considerations CSP technologies use only direct beam insolation. Unlike PV, CSP technologies do not produce electricity when there is cloud cover. In the United States, the best direct solar resource is in the Southwest, especially where direct beam insolation is greater than 6.75 kWh/m2/day. Figure 25 shows direct beam solar resource throughout the United States.

44
Figure 25. Concentrating solar resources of the United States (Source: NREL)
Other considerations for optimal CSP siting include a land slope of less than 1°, and for large systems, at least 10 km2 of contiguous land. When these factors are taken into consideration, there are approximately 53,900 square miles of ideal land area in the Southwestern United States, which equates to about 6,877 GW of potential resource and more than 16 million GWh of generating capacity (Price 2010). This is about four times the annual U.S. electricity production (U.S. EIA December 2010). These ideal land areas are shown in Figure 26.

45
Figure 26. Direct normal solar radiation in the southwest United States, filtered by resource, land
use, and topography (Source: NREL)
Another important consideration is the availability and proximity of water to potential CSP systems. The most common and economical method for cooling a CSP plant is evaporative water cooling. A water-cooled parabolic trough plant typically requires approximately 800 gallons/MWh. Power towers operate at a higher temperature and have lower water cooling needs, ranging from 500 to 750 gallons/MWh. Dish-engine systems do not require water cooling. As CSP plants are usually constructed in dry regions, water-scarcity and competing-use issues are of concern (except for dish-engine systems) (Aabakken 2006). An alternative to water cooling is dry or air cooling, which eliminates about 90% of water (U.S. DOE 2009). However, air cooling requires higher upfront capital costs and can result in a 5% decrease in electricity generation, depending on location temperature. This plant-efficiency reduction amounts to a 2% – 9% increase in levelized cost of energy (LCOE). An alternative is to implement hybrid cooling, which decreases water use while minimizing the generation losses experienced with dry cooling (Aabakken 2006). Costs In some locations the unit electricity costs ($/kWh) of CSP systems are less than the electricity costs from traditional fuels, especially on islands or remote locations where the cost of fuel or energy delivery costs are very high. In other locations, the $/kWh of CSP systems are highly dependent on solar resource, grants, subsidizes, or tax breaks. The installed system costs are coming down and incentives are expected to be reduced or eliminated over time. Capital costs range from $3.50 to $4.50/W) and electrical energy costs in the $0.06 to $0.20/kWh for large systems in the MW sizes. Smaller systems and companies with small manufacturing volumes will have higher costs. An overview of cost, O&M, and LCOE is provided in Table 8.

46
Table 8. Historical and predicted CSP costs (Source: Aabakken 2006)
Cost 2003 2005 2007 2012 2018 2025
Total ($/kWe)
Power Tower
6800 4100 3500 NA 2500 NA
Trough 2805 3556 3422 2920 NA NA
Dish NA NA NA NA NA NA
O&M ($/kWh)
Power Tower
0.04 0.01 0.01 NA 0.01 NA
Trough 0.02 0.01 0.01 0.007 NA NA
Dish NA NA NA NA NA NA
LCOE ($/kWh)
Power Tower
0.12 0.06 0.06 NA 0.04 NA
Trough 0.11 0.10 0.06 0.05 NA NA
Dish 0.40 NA 0.20 NA NA 0.06
State of the Research U.S. DOE R&D goals are to increase the cost-effectiveness of CSP systems by reducing material or installation costs, improving efficiencies, and improving production throughput. The goals for CSP technologies are:
$0.08 – $0.10/kWh with 6 hours of thermal storage in 2015 (intermediate power)
$0.05 – $0.07/kWh with 12-17 hours of thermal storage in 2020 (baseload power) (U.S. DOE 2008)
DOE Office of Energy Efficiency and Renewable Energy (EERE) programs are focused on driving down costs and increasing performance at all levels—reflectors, advanced heat-transfer fluids, TES, reducing water usage for cooling, and reducing institutional barriers and costs, in the next few years and in the long term. DOE funds seven companies for R&D of linear concentrator systems, two companies for dish/engine systems, 17 companies and universities for thermal storage, and one company for a 200-MW power tower receiver. Recommendations for CSP Currently, no DOD sites have deployed CSP systems. Fort Irwin in California is working to develop a 500-MW parabolic trough system, which is expected to start production in 2014. (NREL 2010) Other bases in the desert southwest have also been actively considering CSP, but Fort Irwin is the farthest along in project development. CSP systems do provide an opportunity for DOD bases to produce clean on-site electricity to reduce costs and emissions and to increase energy security. These systems can deliver energy at prices comparable to the local utility in the Southwestern United States with existing federal and state incentives. However, only one CSP technology (parabolic troughs) has had long-term demonstration on a fully-commercial scale. As of mid-2009, two power towers were grid tied in Spain, but this technology type is still relatively new to the commercial market. In addition, dish-

47
engine systems and linear Fresnel reflectors have not yet been deployed at a near-commercial scale (Aabakken 2006). Also, the range of sizes of CSP systems is limited. Other than dish concentrating systems at the 2 – 25-kW power rating, the minimum system sizes start at about 1 MW to take advantage of economies of scale. Smaller linear CSP systems may be possible however. Also, thermal energy storage is needed for greater dispatchability. DOD needs to consider heights of CSP systems with respect to visibility and operational impact: power towers (100 ft and higher), parabolic troughs (20 ft), linear reflectors (40 ft), and parabolic dishes (30 – 40 ft). Near-term CSP-related opportunities for DOD include:
1. Study or research the benefits and potential of CSP systems within DOD. Fund a demonstration project, if warranted.
2. Develop and pilot cost effective anti-soiling coatings for CSP reflectors to reduce the need for manual cleaning and reduce water requirements.
Develop and pilot communications technologies between electrical generation and loads in a microgrid operation within DOD continuity of operations constraints. Energy Storage Technology Overview Energy storage is utilized when electricity is needed at a different time than when it was generated or at a greater power level than is possible with the electrical generation equipment. This report considers energy storage options that result in electrical output, are rechargeable, and stationary. Thermal storage for electrical energy is discussed in the Concentrating Solar Power section. Many energy storage concepts remain active in the research and development community. These include flywheels, superconductors, supercapacitors, pumped storage hydro, compressed air energy storage, flow batteries, lithium- and sodium-based electrochemical batteries, and lead acid batteries. When comparing different energy storage technologies, descriptions such as “higher” and “improved” are qualitative and relative terms compared to lead-acid battery performance. Quantitative measures of costs, efficiency, cycles, and energy capacity are presented in this section for comparison to competing non-energy storage technologies, such as engine generators and load management. Table 9 gives an overview of different energy storage technologies.

48
Table 9. Description of energy storage technologies
Type Description Comments
Lead-acid (Pb) Mature electrochemical battery, low capital cost, reasonable cycle life on the order of several 1,000 cycles, used in both power and energy applications.
Lead-acid is a dominant technology. Carbon addition to the negative plate significantly increases cycle lifetime by a factor of 10.
Nickel cadmium (NiCd)
Mature electrochemical battery, higher capital cost, better cycle life, used in both power and energy applications, especially in cold environments.
There is no “memory” effect in NiCd batteries compared to some consumer sized batteries because of the different plate construction.
Nickel metal hydride (NiMH)
Nickel-based electrochemical battery with improved power and energy to weight performance.
Lighter in weight than Pb or NiCd batteries but being overtaken by Lithium ion batteries.
Lithium ion (Li) Li-based batteries offer improved power and energy to weight and volume performance. Good for power applications.
Displacing Pb, NiCd, and NiMH batteries in most consumer electronics. Capital cost is a key driver limiting adoption of large format batteries for energy storage.
Sodium sulfur (NaS) Commercially available, operate around 300oC in the megawatt (MW) range for up to 4 hours.
Metal air batteries High power solid state battery. Some types of these batteries are not rechargeable.
Flow batteries Use large volumes of liquid electrolyte flowing through a fuel cell to produce electricity.
A multitude of chemistries are in use or being proposed. Flow batteries are capable of large power outputs for several hours.
Super capacitors Extremely high power solid state devices but not much energy.
Great for power applications with cycle lifetimes greater than 100,000.
Ultrabattery Combination of a supercapacitor and a lead-acid battery for higher power while retaining lead-acid energy performance.
Being developed for demonstration projects. Good research results.
Flywheels A rotating cylinder or disk in a vacuum stores energy with very fast response times charging and discharging.
Commercially available in limited quantities for power quality applications.
Pumped hydro Water is pumped to a higher elevation (charged) and released (discharged) at a later time, usually in sizes of 50 MW and larger.
More pumped hydro is used for utility-scale energy storage than any other technology. This is the lowest energy cost storage technology. Smaller MW sized concepts have been proposed and developed.
Compressed air energy storage (CAES)
Air is compressed to a higher pressure (charged) and released (discharged) at a later time.
While caverns are typically used, man-made chambers have been proposed or are being investigated.

49
One way to compare the different energy storage systems is by energy density by volume or by weight as described in Figure 27. Different applications, such as vehicles, require energy storage systems that have both high energy densities by weight and by volume. Flywheels are big and heavy because of the metal containment around the flywheel and the volume of the spinning rotor. Electrochemical capacitors, also known as supercapacitors, have very low energy densities. Figure 27 must be used with other information, such as capital cost, for stationary energy applications where weight and volume are secondary considerations.
Figure 27. Chart of different energy storage systems energy densities by volume and by weight
(Courtesy of the Electricity Storage Association, reprinted with permission)
Table 10 below describes problems faced by DOD facilities that could be addressed with energy storage. The application for DOD, the challenges associated with the application, and requirements of the energy storage solution are discussed.

50
Table 10. Energy storage applications for DOD facilities
Applications Challenges Requirements
Power quality Poor power quality including momentary interruptions, voltage sags or swells, voltage spikes, poor frequency regulation, and power factor.
All power quality problems occur on the millisecond to several minute ranges. The energy to correct these problems is small while the power can be significant. Fast electronics need to be coupled to a fast energy storage system.
Power outages Power outages range from greater than several minutes to several hours. Solutions for power outages greater than 12-24 hours are similar to solutions for isolated microgrids or off-grid facilities.
An energy storage system needs to provide the power and deliver the energy for a minimum period of time. This system could provide power for 1-2 minutes until engine generators can be brought on line or for several minutes until an orderly shutdown is made if power is not restored.
Renewable energy power smoothing
Wind or PV power output may be higher than allowed on the distribution system or the power variations may cause grid instability.
The electronics and energy system have to absorb high power outputs and fill in low power valleys in the seconds to minutes range. Longer energy storage times are possible to limit the power production on the distribution system at any given time. This is similar to demand management and load leveling.
Demand management or load leveling
High power equipment or high starting loads lead to high demand charges.
Local energy storage supplies the peak demand (power). The energy storage should be coordinated with a demand management system.
Time of use energy pricing
Loads that need to run during the high price time periods increase energy costs.
Depending on the load and the renewable energy systems, the energy storage output needs to shift RE production to the high price time periods.
Distribution upgrade deferrals
New equipment or facility upgrades are made on a distribution line that also needs to be upgraded.
Energy storage systems could smooth out the peak power demands on the distribution line. Combining renewable energy generation along with energy storage could delay distribution upgrades.
Energy security and continuity of operations
Continuity of operations requires power for time periods ranging from days to months. Fuel deliveries cannot be guaranteed or the cost of delivery may be very high.
On site renewable energy generation and an energy storage system capable of storing energy for several hours to days is needed. The energy storage would also be charged with cycling of any engine generators operating in a fuel saving mode.

51
Applications range from high power over short time periods (seconds to 15 minutes), to energy over long time periods (hours to days). Power quality energy storage systems, including uninterruptible power supplies (UPS), provide high power over short durations from milliseconds to minutes. Energy firming or shifting applications, such as smoothing PV or wind energy system outputs, operate over medium durations from seconds to several hours. Energy storage applications, such as off-grid applications or isolated microgrids, require systems capable of discharges of 1–3 days. Costs can be quantified in several ways: capital costs, typically $/kW for power applications; and energy costs over the system lifetime, typically $/kWh for energy applications. Costs of energy storage systems are discussed in further detail below. For each application there may be additional critical requirements such as weight, volume, and O&M. For most facilities, weight and volume are not prime considerations, except when selecting where to place an energy storage system. O&M should be carefully assessed to ensure funds and technical expertise is available to meet the needs of the selected energy storage systems. While outside contractors can do the O&M under normal conditions, a minimum level of technical capability should be available at the facility as well. All energy storage systems present many hazards and risks—all of which can be minimized through proper design, installation, operation, maintenance, and disposal. Market direction for all energy storage technologies is to improve the cost effectiveness by increasing lifetime, increasing efficiency, reducing capital costs, reducing O&M costs, and increasing production volumes. Lead-Acid Batteries Lead-acid batteries, along with pumped hydro and NiCd batteries, are the oldest and most mature energy storage technologies. The basic construction of a lead-acid battery consists of lead dioxide (PbO2) for the positive plate, Pb for the negative plate, and a separator in between the plates. The electrolyte consists of sulphuric acid and water. The separator provides electrical isolation between the positive and negative plates while allowing free movement of the electrolyte between the plates. All of the plates, the separator, and the electrolyte are contained within an enclosure, or battery case. A single lead-acid cell has a nominal voltage of 2 V. The actual voltage depends on the state of charge of the battery, whether the battery is being charged or discharged, and the battery temperature. Variations of the basic battery are available for specific energy, power, and cycling applications. Larger area plates and parallel connected plate assemblies are used in an enclosure to increase the current while multiple plate assemblies are series connected to increase the voltage.

52
Figure 28. Shows a schematic plate assembly for a lead-acid battery (Courtesy of CSIRO,
reprinted with permission)
Figure 29 shows the different types of lead-acid batteries. The vented (or flooded) configuration contains liquid electrolyte (either acid or base). In the vented configuration, electrolyte can spill out if the battery is tipped, or if the case becomes damaged. Most of the other electrochemical chemistries discussed in this report can be incorporated into vented or sealed battery configurations.
Figure 29. Different types of lead-acid batteries (Source: NREL)
Flooded batteries have extra liquid electrolyte inside the case that can spill out if the battery is tipped or the case cracks. Secondary containment under these batteries is required by code. Flooded batteries typically do well in hot climates or environments since the liquid electrolyte provides some thermal mass that regulates the internal battery temperature. Flooded batteries are usually less expensive than sealed batteries. The sealed or valve-regulated lead-acid battery configuration avoids many of the vented battery configuration’s disadvantages by immobilizing or minimizing the electrolyte. Absorbed glass mat batteries are different than gel batteries, even though both are sealed lead-acid batteries. An absorbed glass mat battery immobilizes the electrolyte by absorbing the electrolyte into a fiberglass mat. A gel battery immobilizes the electrolyte by adding silica gel, creating a semi-solid mass.

53
Sealed batteries have just enough electrolyte that is adsorbed in between the plates within a glass mat separator or with the electrolyte in a gel form. Under normal operating conditions in a sealed battery, the hydrogen gas that is generated during charging and discharging is recombined with oxygen inside the cell. However, under abnormal conditions, a valve-regulated lead-acid battery can vent fumes or hydrogen. Since the electrolyte volume in a valve-regulated lead-acid battery is less than in a flooded battery, the total possible volume of gas is less. Depending on the manufacturer, sealed batteries can usually be placed in any orientation (with the battery terminals on top or on the side). Sealed batteries are generally more convenient to install and operate, even though the initial and operating costs may be higher. The lifetime of a lead-acid battery is limited by several factors depending on the type of battery and the application. Usually the lifetime of a lead-acid battery is specified as when the usable capacity is 80% of the initial rated capacity. A lead-acid battery at 80% capacity will still function, just not as long. The capacity is reduced over the lifetime by several factors. Two prominent factors are sulfation on the plates and loss of electrolyte. Both factors can be minimized through proper operation and maintenance. The efficiency of the charge/discharge cycle of lead-acid batteries depends on the battery’s state-of-charge. The charging efficiency decreases as the battery state-of-charge increases. At intermediate states-of-charge (20%-80%) the charging efficiency is in the range of 90%-95%. At high states-of-charge (more than 80%) the charging efficiency could be in the range of 50%. A blended efficiency based on the expected states-of-charge over a discharge/charge cycle is application specific, but a range of 85%-95% is reasonable. Most batteries save and produce DC electricity so an AC/DC battery charger and a DC/AC inverter are required for the battery system. The charger and inverter have conversion efficiencies in the range of 80% (old equipment) to 95% (newer equipment). The standby losses for a lead-acid battery are 1%-2% of the capacity per month, which is quite small compared to other energy storage technologies. Factoring in the battery and electrical equipment efficiencies, a range of round trip (AC in to AC out) efficiencies of 65%-80% (95% AC-DC x 85%-95% charge x 85%-95% discharge x 95% DC-AC) is reasonable. A range of efficiencies is possible since there are different lead-acid battery technologies, operating conditions, and charger/inverter equipment. Standards are one measure of the maturity of any technology since it takes several years to develop standards and reflect what consumers are using or specifying. The IEEE publishes consensus standards on a wide variety of topics, including energy storage devices. An IEEE standard is useful because it presents best practice recommendations and reflects a consensus within the industry. There are eight standards for lead-acid batteries and three for NiCd batteries. There are no published standards for any other specific type of energy storage systems. Nickel–Based Batteries NiCd batteries are a mature technology. NiMH batteries were developed to replace NiCd consumer batteries before lithium batteries became available. NiCd batteries used for energy storage are constructed differently from the consumer electronic batteries. The basic construction is similar to the plate construction used for lead-acid batteries

54
(see Figure 27) except that the positive plate is nickel-hydroxide, the negative plate is cadmium-hydroxide, and a base potassium hydroxide is used for the electrolyte instead of an acid. NiCd batteries constructed in the plate format for energy storage do not have any “memory effect” that can be present in small consumer-sized batteries. The nominal cell voltage is 1.2 V compared to the 2 V lead-acid cell voltage. NiCd batteries, while costing more than lead-acid batteries, are used for difficult and demanding applications: operating temperatures from –40oC to +60oC, excellent cycling capability (up to 3,000 cycles), and similar maintenance as lead-acid batteries. NiCd batteries have an efficiency of 65% and lose about 5% energy capacity per month. NiCd batteries are the preferred choice for many PV and wind/battery systems in cold climates such as Alaska. NiMH batteries replace the heavy cadium (Cd)-based negative plate with a lighter weight metal hydride plate. Consequently, the energy density by weight and by volume is improved. The self discharge rate can be 0.5%-1% capacity loss per day, or 15%-30% per month. Self discharge will not impact performance in typical daily cycling applications, but it will lead to a slight increase in additional energy to overcome this loss. While NiMH batteries are used on consumer products and electric vehicles, this battery is not widely used in stationary applications. Lithium-Based Batteries Lithium-based batteries have names such as lithium ion, lithium metal, lithium iron phosphate, and lithium polymer. The name depends on the manufacturer or internal construction, which distinguishes a particular battery from the multitude of lithium-based batteries. Lithium-based batteries are prevalent in consumer electronics and widely considered for use in electric vehicles. Most lithium battery packs require internal battery charging circuits to prevent thermal runaway and cell rupture. The charging circuitry prevents conditions such as over temperature, over charging, and excess internal pressure. The charge/discharge efficiency is 80%-90%. Cycle lifetimes range from 400-1,200 cycles. The voltage of lithium based batteries ranges from 3.2 to 4 V depending on the anode and cathode used. The higher voltage is convenient in that fewer cells need to be series connected to get higher voltages, in contrast to the 2 V lead-acid cells. Energy density by weight and volume is significantly higher than lead-acid batteries. The self-discharge rate is 5%-10% per month, which is better than NiMH batteries. Several companies are developing large lithium batteries for utility scale applications that would be acceptable sizes for many DOD facilities. A123 is developing an 8-MW, 32-MWh battery for Southern California Edison for use at the Tehachapi wind farm. A123 is developing a smaller 25-kW, 50-kWh battery for DTE Energy in a community energy (distributed energy resource) setting. Cost remains the biggest impediment to wide spread use of lithium-based batteries in the larger energy storage markets beyond consumer products and vehicles.

55
Flow Batteries In the other electrochemical batteries, the electrolyte is contained in the battery case and the energy capacity is limited by the volume of electrolyte in the battery. In flow batteries, the liquid electrolyte is contained in separate tanks and flows across the electrodes. The energy capacity is limited by the volume of the external electrolyte tanks. Flow batteries are conceptually very simple. The power and energy can be specified separately.
Figure 30. Schematic of a flow battery where electrolyte flows through a fuel cell (From Zhenguo Yang, Jun Liu, Suresh Baskaran, Carl H. Imhoff, and Jamie D. Holladay, “Enabling Renewable Energy—and the Future Grid—with Advanced Electricity Storage,” JOM, 62 (9) (2010), pp. 14–23. Copyright © 2010 by The Minerals, Metals & Materials Society. Reprinted with permission.)
The power output is determined by the area of fuel cell electrodes and the number of cells. Like all batteries and fuel cells, individual cells are connected in series to increase the voltage and in parallel to increase the current. The fuel cell output is DC electricity, so a DC-AC inverter is required to provide AC power. An AC-DC charger is required to recharge the battery. Several combinations of electrolytes are used. Typical combinations include vanadium redox (reduction-oxidation) and zinc bromine. In the vanadium redox battery, vanadium changes electrical states in the two different electrolytes and there are no changes at the electrodes. In the zinc bromine system, a hybrid flow battery, zinc is plated onto the negative electrode and bromine gas is generated at the positive electrode. The energy density by weight is lower than lithium based and similar to lead-acid batteries. The energy density by weight is not a critical factor in the selection of flow batteries for stationary applications. Some flow battery systems have a very fast response time supplying power as the load changes. Cycle lifetimes are in the range of 3,000-10,000 cycles, which is dependent on the fuel cell and pumps. The electrolytes have indefinite lifetimes. Flow batteries can respond rapidly to changing loads depending on the electronics. Changing between charge and discharge cycles is

56
accomplished by changing the polarity on the fuel cell, which is relatively quick. Round trip efficiency is in the range of 65%-75% although that number does not include the charger and inverter efficiency, and may not include the pump energy. Many flow batteries have been installed for different applications for wind energy farms, PV systems, and utility generators. Power and energy ratings of 1 MW and 4 MWh are fairly common. Units in the kW range are also available. Pumped Hydro Pumped hydro storage is generally considered a utility energy storage option with limited locations. However, there may be some DOD facilities that could take advantage of the technology, or adaptations, so it is included in this report. In a pumped hydro system, water is pumped up hill to a large reservoir where it is stored for later use. Because of the large impact of these facilities, environmental regulation must be considered carefully when developing a project. These facilities can exceed 20 hours of discharge capacity and can achieve efficiencies of more than 75%. Pumped hydro storage systems can deliver unlimited cycles, with generation equipment and pumps replaced or refurbished as needed. In the United States, about 20 GW of pumped hydro storage is deployed (Denholm 2010). Compressed Air Energy Storage Compressed air energy storage Compressed air energy storage is generally considered a utility energy storage option with limited locations. As described in the NREL Technical Report “The Role of Energy Storage with Renewable Energy Generation,” (Denholm 2010), compressed air energy storage is based on conventional gas turbine technology and uses the elastic potential energy of compressed air. Energy is stored by compressing air in an airtight underground storage cavern. To extract the stored energy, compressed air is drawn from the storage vessel, heated, and then expanded through a highpressure turbine that captures some of the energy in the compressed air. The air is then mixed with fuel and combusted, with the exhaust expanded through a lowpressure gas turbine. The turbines are connected to an electrical generator.” Compressed air energy storage can provide unlimited cycles. A disadvantage of this technology is the need for a natural or man-made underground cavern. Nevertheless, some DOD facilities could take advantage of the technology. Sodium Sulfur Batteries NaS batteries are a molten metal battery operating 300°-350oC. Both the sodium and sulfur are molten and the sodium diffuses through a solid separator to react with the sulfur to make Na2S4. Although this technology was considered for vehicle applications, it is more suited for stationary applications.

57
Figure 31. Sodium sulfur battery schematic (Courtesy of NGK Insulators Ltd., reprinted with
permission)
The AC-AC charge/discharge efficiency is 71%-78%. The energy density is high and a long cycle lifetime of 2,500-4,500 cycles is estimated depending on the depth-of-discharge. Once operating, the charge/discharge cycles provide most of the heat to keep the operating temperature high. Xcel Energy will be testing a 1-MW, 7.2-MWh NaS battery from NGK in conjunction with a wind energy farm in Minnesota. American Electric Power, based in Ohio, has been testing MW-sized NaS batteries from NGK in several locations since 2006. NGK Insulators in Japan, is the dominant supplier of the high temperature, hot NaS batteries. Ceramatec in Salt Lake City, Utah, is developing a warm NaS battery (90oC, non-molten) using an ionic liquid for transport of sodium ions to the sulfur as opposed to molten sodium and sulfur. Ceramatec expects to develop a 5-kW, 20-kWh battery capable of 3,650 daily cycles (10 years). Ceramatec is still developing the prototype battery, which should be available in 1-2 years for prototype testing. Flywheels Flywheels are conceptually a simple system with only one moving part: a rotor spinning at 10,000 revolutions per minute (rpm) or more. The stored energy is determined by the diameter and geometry of rotor and the rotational speed of the rotor. The rotor has to be in a vacuum chamber to eliminate air resistance and in a very durable enclosure in case there is a catastrophic failure of the rotor. A motor/generator is electromagnetically coupled to the rotor to speed up the rotor (charge) and slow down the rotor (discharge). The motor can charge or discharge the flywheel at equal and very high rates.

58
Flywheels are cost effective in many power quality applications and bridging power applications in coordination with an engine generator. In some applications, discharges up to 1 hour are possible. While even longer discharge times are possible, the cost effectiveness of flywheels diminishes for standalone power because of high self discharge rates of 20% energy capacity loss per hour. Research and development on better bearings, including superconducting magnetic bearings, should reduce this loss. Cycle lifetimes of flywheels is expected to be 10,000 to 1 million cycles. The energy efficiency of flywheels can be as high as 90% depending on the flywheel construction and the electronics needed for AC in and AC out. Beacon Power is the dominant flywheel manufacturer with standard 100-kW, 25-kWh (15 minute discharge) units. Beacon Power is developing a 100-kW, 100-kWh flywheel with no hub or shaft, which will reduce the self discharge rate and the projected energy costs. Supercapacitors and Ultrabatteries Supercapacitors, ultracaps, electrochemical double-layer capacitors, and asymmetrical supercapacitors are names for devices that store energy in capacitors. These devices are ideal for high discharge rates and weigh power densities, and provide cycle lifetimes greater than 100,000 cycle. Typically these devices are not good for energy densities and have high discharge rates. These devices work well in power quality applications. The asymmetrical supercapacitor has a construction similar to a lead acid battery (Figure 28) except the negative plate is carbon. East Penn, under license from Ecoult, will begin manufacturing ultrabatteries, which combine the advantages of a lead acid battery and a supercapacitor. See Figure 32 for a schematic representation of the ultrabattery.
Figure 32. Schematics of an asymmetrical supercapacitor on the left and an ultrabattery on the
right that has a combination negative plate consisting of a carbon electrode and a lead electrode (Courtesy of CSIRO, reprinted with permission)

59
Hydrogen Hydrogen gas generated by an electrolyzer powered through excess PV or wind energy production is stored in high pressure tanks for later use. When energy is needed, the hydrogen flows through a fuel cell to generate DC electricity. An inverter is needed to convert the fuel cell’s DC power to AC power. This is an attractive energy storage system that combines several known subsystems into a complete system. NREL has reported on an analysis of hydrogen storage versus other electrical energy storage systems (Steward et al. 2009). State of the Research Under license from Ecoult, East Penn is modifying their large format lead-acid batteries by adding carbon to the negative plate. This significantly reduces sulfation on the negative plate, the major cause of capacity loss in a lead-acid battery. By reducing the sulfation, the cycle life has increased by a factor of 10 in test batteries. This is a significant improvement on a mature technology where improvements were not expected. A 2- to 4-MWh lead-acid carbon battery will be installed in late 2011 in New Mexico in conjunction with a 500-kW PV system. Flow batteries are attracting a lot of attention since the concept is simple and energy and power can be specified separately. New chemistries and modifications of old chemistries are proposed for future large-scale demonstration projects. Hoping to capitalize on the extensive production experience of small Li-based batteries for consumer products, the industry is developing larger format batteries for stationary applications.
Costs, Metrics, and Payback Costs are presented in several different ways for energy storage systems. In many cases costs are based on estimates, such as cycle life and round trip efficiencies, from demonstration projects. Therefore, most cost estimates are just that–estimates. Capital cost per unit of energy ($/kWh-output) is calculated as the capital cost of the system measured in dollars ($) divided by the lifetime energy output measured in kWh. The lifetime energy output can be estimated by the number of cycles, the energy output per cycle, and the round-trip efficiency of charging and discharging the energy storage system. Cost per unit of energy ($/kWh-output) = Initial cost ($) / [number of cycles x capacity (kWh) x
efficiency] Different studies or manufacturer’s data will have different costs per unit of energy depending on the assumptions of the number of cycles and the efficiency. Supercapacitors with estimated lifetimes on the order of 100,000 cycles (over 273 years of daily cycling) fair well compared to a lead-acid battery with 1,000-3,000 cycles despite the supercapacitor’s low energy capacity (kWh). Another cost parameter is the capital cost per unit of power. The total capital cost in dollars is divided by the rated power of the energy storage system measured in kW. The Electricity Storage Association reports the energy costs and capital costs of different technologies in Figure 33.

60
Figure 33. Capital costs of different energy storage systems per unit of power and per unit of
energy (Source: Electricity Storage Association, reprinted with permission)
The costs of the different energy storage systems are expected to improve, albeit slightly, as capital costs are reduced with volume production, increased cycle lifetimes, and increased charge/discharge efficiencies. Limited cost changes are expected for mature technologies such as lead-acid batteries, NiCd batteries, and pumped hydro. However, the new lead-acid carbon battery from East Penn will result in a reduction in the capital cost per unit energy as shown in Figure 29 since the cycle lifetime is expected to improve by a factor of 10. The capital cost per unit power may increase slightly since the battery will have the same power rating with a slight premium charge for the carbon addition. While the energy costs relative to utility costs are high, energy storage systems can still be desirable since there are other possible intangible benefits such as energy security, continuity of operations, and less chance of lost productivity from power quality problems or outages. Most energy storage systems are quoted in $/kW installed cost and $/kWh delivered energy over the lifetime of the system. While these are easy numbers to calculate or estimate, those metrics do not describe the value of the energy storage system. Payback is difficult to quantify since a traditional economic value of no electricity is difficult to calculate for DOD missions. Transaction based companies (stock brokers, bookstores, on-line retailers) can estimate the loss of sales if there is no electricity or Internet. Usually energy storage is justified on a risk assessment and the level of risk that is acceptable with respect to the mission. The main market direction is to improve the cost-effectiveness of all energy storage technologies by reducing initial costs, increasing production volumes, increasing lifetimes or cycles, and reducing O&M costs. There are different market focuses for utility-scale energy storage and electric vehicle energy storage. Markets for power quality energy storage are cost effective for

61
many industries, such as semiconductor manufacturing, where power quality problems can result in production line problems and well-defined economic losses. Market directions for medium sized applications within a microgrid have been discussed, but the end user benefits are not clearly defined. DOE has recently awarded several development contracts in 2010 for different types of energy storage systems. While many of the contracts are multiyear and systems will not be installed for several months and maybe even years, it is instructive to analyze the types of awards. DOE selected contracts based on market readiness and applications that included all of the technologies discussed above. Recommendations for Energy Storage Energy storage systems allow engine generators to operate at their highest efficiency or to capture energy when the sun shines or the wind blows, reducing the need of liquid fuels or electricity from the local utility. Energy storage is the single most critical element that needs to be included in any continuity of operations. Liquid and gaseous fuels for engine generators are the most common energy storage methods but these fuels are not rechargeable, only refillable. However, rechargeable energy storage systems are needed for long-term continuity of operations beyond several days. All energy storage companies think that their product is the best. ESTCP should fund one or more energy storage system demonstrations. Energy storage technologies that could easily find an application within DOD and should be considered are advanced lead-acid, Li-ion, flow, NaS, and hydrogen. These demonstrations should complement but not overlap demonstrations done for electric utilities or companies. Most economics of energy storage systems are based on estimated lifetimes, not measured lifetimes. These demonstrations will help determine better O&M costs and system lifetime estimates. As with all electrical generators, communications between electrical generation and loads in a microgrid operation within DOD continuity of operations constraints should be investigated.

62
Microgrid Technologies
Overview of Electric Industry Future “Over the coming ten years, the North American electric industry will face a number of significant emerging reliability issues. The confluence of these issues will drive a transformational change for the industry, potentially resulting in a dramatically different resource mix, a new global market for emissions trading, a new model for customer interaction with their utility, and a new risk framework built to address growing cyber security concerns.” (NERC 2009) Climate change and the prospect of a carbon-constrained business and regulatory environment, uncertain and poorly understood demand outlook, and an increasingly complex market structure are significant factors shaping the electric power system. Rapid technology development, aging capital stock, and a workforce with a significant portion nearing retirement age are additional influences transforming the industry. These changes may exaggerate the vulnerabilities to physical and cyber disruptions that currently exist within the unique operating environment of the electric power system. Increases in renewable generation and natural gas fuel generation sources, and in distributed energy storage technologies—all technologies that reduce the carbon footprint—are expected to create a resource mix that is characteristically different from existing portfolios. Renewable portfolio standards, potential carbon cap-and-trade legislation, the move toward well-functioning, liquid electricity markets that facilitate clear and transparent price signals for both investors and consumers, and Regional Transmission Organizations/Independent System Operators markets that promote demand-response aggregation opportunities will help shape the market transformation. Plug-in electric vehicle stations, acting as both load centers (when charging) and distributed energy storage ancillary support centers (when fully charged and idle), will be a significant feature of the system. The addition of millions of new intelligent components through smart grid initiatives are expected to enhance reliability, engage consumers in their energy budgeting, accommodate renewable generation and renewable distributed energy storage projects, and reinforce the need to resist both physical and cyber attacks.
Figure 34. Example of photovoltaic, microturbine, wind, and internal combustion engine energy
resources (Courtesy of EPRI, reprinted with permission)

63
As these forces come together, the North American electric industry will take on new levels of complexity in the next decade. If the trends outlined above continue, the new system will include utility and customer-owned distributed energy resources (DER) that are supported by smart grid technologies. DER include distributed generation and/or distributed resources, which may be comprised of either renewable or fossil fuel generation and distributed energy storage. Efficient operations will rely on both standardized procedures to facilitate sharing of resources between balancing areas and interoperability standards that ensure compatibility of technologies. Grid stability will be a central concern as penetrations of intermittent generation sources (typical of photovoltaic(s) [PV] and wind generation) continue to increase. Energy storage and voltage and reactive power support technologies will move in to provide needed grid support for this variable generation. Long distance, high-voltage transmission lines will be needed to move remote renewable generation to load centers. Aggregation, which statistically enhances the predictability of both load and intermittent resources, will expand the effective use of these resources in the resource portfolio. Tariff structures will become increasingly complex to provide price-signals that will morph load profiles to assist with real-time dispatch options. Forecasting and sub-hourly data will underpin the effectiveness of balancing area operations. Distilling these projections down to focus specifically on the factors influencing microgrids yields policies and technology related to DER—small-scale technologies to deliver power close to the load center. Many times, DER can provide more secure electricity with a higher reliability and at a lower cost than centralized generation sources. It can also provide benefits to the utility grid including the mitigation or elimination of transmission and/or distribution system infrastructure capital investment, reduction of transmission congestion and environmental impacts, voltage reactive power support/power quality stabilization, as well as fewer line losses. Local power supplies also provide opportunities to combine electrical generation with thermal energy generation. Traditional standby power sources for critical facilities can double as DER. These small generation sources located on the distribution side of the electric power system serve as a generation source for peak shaving, provide an economical option to power purchases during high cost periods, and/or become sources to support a site’s unique ancillary service needs, such as voltage and frequency support. Ancillary services are those functions performed by electrical generating, transmission, system-control, and distribution system equipment and people to support the basic services of generating capacity, energy supply, and power delivery. The Federal Energy Regulatory Commission (FERC 1995) defined ancillary services as “those services necessary to support the transmission of electric power from seller to purchaser given the obligations of control areas and transmitting utilities within those control areas to maintain reliable operations of the interconnected transmission system.” FERC identified six ancillary services: reactive power and voltage control, loss compensation, scheduling and dispatch, load following, system protection, and energy imbalance. (ORNL2010http://www.ornl.org/sci/engineering _science_technology/cooling_heating_power/Restructuring/Ancillary_Services.pdf)

64
DER technologies consist of both small-scale renewable generation (e.g., PV, wind) and traditional, fossil-fueled generators. Historically, local generation has not played a large role in the centralized-oriented electrical system. In order to maintain the integrity of the infrastructure serving the centralized system, utilities have constructed significant barriers to DER, including rate structure penalties and interconnection obstacles. However, legislative and market forces have begun to reshape the role DER is playing in the system and utilities are beginning to incorporate DER in their resource planning. A recent presentation by American Electric Power on the future for electric utilities included customer-owned DER as a significant challenge to be considered and presented diagrams of a decentralized network of generators feeding local loads supported with controllers and energy storage dispersed throughout the system. Generation placed on the distribution system can also help address security issues, both physical and cyber. The decentralized nature of DER provides physical redundancy to the electrical system generation fleet. This redundancy, in combination with the geographical distribution inherent in DER, diffuses the potency of single target hits (whether terrorist or natural disaster in origin) and lessens the dependency on centralized generation sources. However, the integration of more microprocessor-based controls and especially smart grid technologies into the electrical system adds new access vectors to critical infrastructure components, increasing vulnerability to cyber attacks. The concept of microgrids, or clusters of generation and load that can disconnect and reconnect to the electric power system when disruptions occur, creates networks that can operate independently of the macrogrid, the much larger electric power system, comprised of one or multiple utility systems, to which the microgrid is connected, even during emergency outages. Summary of Current Microgrid Research, Technology, and Demonstration Efforts
Technology Overview A microgrid, as referenced in this paper, is a coordinated energy and electrical distribution system that is capable of independent and dispatchable grid-interactive operation that includes multiple DER (including renewable and fossil fueled sources) and multiple load centers (which may be comprised of one or more customers) and has controller capabilities to dispatch generation, control loads, and provide seamless connection/disconnection with the macrogrid. Microgrids usually incorporate small scale DER (< 1 megawatt [MW]) into low-voltage electric systems and are also commonly referred to as minigrids, embedded generation, or virtual power plants. A microgrid may include a single building with multiple generation and load points, a group of buildings or campus, or a larger geographic area such as a military base. Traditional distributed generation has been closely regulated for safety and grid performance impacts since there were few installations and the installations were not considered a critical part of the infrastructure. Typical examples include facilities that have on-site generators to supply critical industrial processes. Standard operating procedures for distributed generation include the ability to instantaneously disconnect in the event of grid outage with severe limitations on independent control of DER.

65
In contrast, microgrids are designed to operate semi-independently, with the ability to operate connected to the grid—and under normal conditions—or to disconnect as needed. When disconnected, the microgrid is capable of performing the control functions normally provided by the macrogrid, or electric power system, including dispatching generation, shedding load, and providing power quality and reliability support as needed during load or generation changes. Microgrids can be placed in service for a variety of end uses, such as coordinating total system energy requirements (especially for sites with large heat loads or waste heat recovery systems), tailoring power quality and reliability requirements, providing a single controlled energy source to the grid (possibly to take advantage of tariff structure), and providing energy surety in case of disruptions to the macrogrid. A microgrid connecting to and disconnecting from the grid presents many challenges to the local utility. These include voltage, frequency, and power transfer concerns, as well as protection schemes and identifying steady state and transient conditions. To address these challenges, the standard IEEE P1547.4 Draft Guide for Design, Operation, and Integration of Distributed Resource Island Systems with Electric Power Systems is being developed by the Institute of Electrical and Electronics Engineers (IEEE). This standard is designed to ensure safe operation of microgrids even after the macrogrid has been disabled.
“This document (IEEE 1547.7) covers microgrids and intentional islands that contain DR [distributed resources] connected with utility EPS [electric power system]. It provides alternative approaches and good practices for the design, operation, and integration of the microgrids and covers the ability to separate from and reconnect to part of the utility while providing power to the islanded electric power system. It is intended to be used by electric power system designers, operators, system integrators, and equipment manufacturers when planning and operating microgrids. Its implementation will expand the benefits of DR by enabling improved power system reliability and building on the requirements of IEEE 1547-2003.” (Kroposki and Martin 1985).
Direct current (DC) microgrids offer another option. Since many of the small renewables generate low voltage DC power, a DC circuit linking DC devices to DC power supplies might be more efficient by eliminating the power inverter losses. The costs to install a parallel set of circuits may offset efficiency gains. However, if the DC power source were also a standby energy source for data processing equipment, this option could be feasible. Intel is currently pursuing a DC microgrid application for data center operations (Aldridge, et al. 2010). Microgrids typically include two critical pieces of equipment—a switch to disconnect and reconnect to the macrogrid when needed and a controller that dispatches generation, load, and microgrid support functions. -Communications and protection schemes are also critical to the microgrid design. A microgrid controller can utilize existing energy management systems and smart grid technologies. A simple microgrid diagram is illustrated below in Figure 35.

66
Figure 35. Microgrid and components (Source: NREL)
NIST and IEEE Smart Grid Efforts The National Institute of Standards and Technology (NIST) has been assigned the primary responsibility of coordinating the development of a framework that includes protocols and model standards for smart grid device interoperability. The NIST Framework and Roadmap for Smart Grid Interoperability Standards Release 1.0 (Draft) and its related documents identify various standards development organizations, list related standards, and identify efforts needed to move forward. This framework identified the interaction of participants in the smart grid (see Figure 36, below).

67
Figure 36. Interaction of actors in different smart grid domains through secure communication flows and electrical flows (Courtesy of the National Institute of Standards and Technology,
reprinted with permission)
“Interoperability—the ability of diverse systems and their components to work together—is vitally important to the performance of the Smart Grid at every level. It enables integration, effective cooperation, and two-way communication among the many interconnected elements of the electric power grid. Effective interoperability is built on a unifying framework of interfaces, protocols, and the other consensus standards. Widely adopted standards also will help utilities to mix and manage varying supplies of solar, wind, and other renewable energy sources and better respond to changing demand. Smart Grid interoperability and cyber security standards must reflect industry consensus, with active participation, and where required, leadership and coordination by government. Accelerating development of the Smart Grid ranks among the Obama Administration’s top priorities. Funding through the American Recovery and Reinvestment Act provides a tremendous opportunity to “jump start” implementation of the Smart Grid.” (NIST)
The National Renewable Energy Laboratory (NREL) is actively involved with the development of standards for both microgrid and smart grid technology. Benjamin Kroposki, Thomas Basso, and Richard DeBlasio are working on committees within the IEEE to formulate standards to facilitate deployment and contribute to the development of microgrid standards. NDIA E2S2 Conference Denver, CO June 14, 2010 (Westby) Domestic Microgrid Projects In the United States, several large pilot demonstration projects are underway using U.S. DOE funds to develop technologies that encourage DER use during peak load periods. One requirement for these projects includes the ability to operate in both grid parallel and islanded

68
modes. Although not specifically designated as microgrid projects, they contain elements of local generation, intelligent self-islanding, and local storage and demand response capabilities and should provide relevant information to promote microgrid efforts. These demonstration projects are currently in place at Chevron Energy, Consolidated Edison, New York, ATK Space Systems, Illinois Institute of Technology, the City of Fort Collins, Colorado, San Diego Gas and Power, Allegheny Power, and the University of Nevada Las Vegas. Several smart grid projects are also underway. Again, these projects are not microgrid-specific, but the findings should enhance foundational knowledge for microgrid implementation. American Recovery and Reinvestment Act (ARRA)-funded Smart Grid Demonstration projects include Los Angeles Department of Water and Power, Kansas City Power and Light, Pecan Street Project, Center for Commercialization of Electric Technologies, Pacific Northwest Demonstration Project, and Southern California Edison. These projects include large-scale energy storage, distribution and transmission system monitoring devices and a range of other smart technologies that will be helpful in a microgrid configuration. In addition, there are 100 projects funded under the ARRA Smart Grid Investment Grant program that are researching relevant equipment like automated substations, load control devices, plug-in hybrid electric vehicles (PHEVs) and charging stations—all of which help enhance the functionality of microgrids in the electrical power system. ESTCP is funding a United Technologies Research Center microgrid project at McGuire Air Force Base in New Jersey. The project is a building-level microgrid involving controls, a storage battery, and PV on the roof of the building (the base medical clinic). United Technologies Research Center designed the microgrid, created computer models to validate the design, constructed the switching controls, and will be installing the control system and battery in early 2011. More details of the project can be found at http://www.serdp.org/Program-Areas/Energy-and-Water/Energy/Microgrids-and-Storage/EW-200939. SERDP is supporting a DOD microgrid project at Fort Bragg in North Carolina. This effort, led by Virginia Tech, is focused on developing a methodology to assess microgrid technology options through modeling and simulation. DOD and DOE are engaged in several demonstration projects that focus specifically on the assessment of stationary microgrid capabilities or the development of microgrid systems. These projects have attracted several technology companies including GE, Lockheed Martin, and Honeywell. The mobile microgrid concept is also under development. Fort Irwin and Fort Bliss are participating in prototype development for a mobile microgrid that is expected to minimize vulnerabilities related to fuel transport and ensure more autonomous forward-operating bases. Finally, the national laboratories have been directly involved with ongoing research activities related to microgrid components, standards, and testing. Research facilities are also available for testing microgrid electrical systems. For example, Lockheed Martin has the Microgrid Development Center, a test facility in Dallas, Texas. This unique facility provides comprehensive power system modeling, simulation, and hardware-in-the-loop and software-in-the-loop testing in one location. The company was recently awarded $3.5 million dollars to develop an intelligent system that will integrate a variety of energy

69
sources, including renewables, into existing Basic Expeditionary Airfield Resources (BEAR) power grids, with goals to reduce fuel consumption by 25%, alleviate logistics burdens, and improve power availability. Sandia Labs has the Distributed Energy Technologies Laboratory in Albuquerque, New Mexico, where research is conducted on the integration of emerging energy technologies into new and existing electricity infrastructures. The Distributed Energy Technologies Laboratory’s reconfigurable infrastructure simulates a variety of real-world scenarios, such as island and campus grids, including military installations, remote operations, such as forward operating bases, and scaled portions of utility feeders and the transmission infrastructure. NREL also has extensive testing capability at its Distributed Energy Resources Test Facility to evaluate micro-grid components and systems. This testing capability will be expanded to medium voltage microgrids at the Energy Systems Integration Facility and will include:
Renewable energy-generating systems integration analysis (by implication these are all testing capabilities)
PHEVs and electrical storage systems analysis
Hydrogen energy systems, production, and storage analysis
High-performance computing capability (200+ teraflop) for research modeling and simulation (expansion capability to 1,000 teraflops).
The Energy Systems Integration Facility is scheduled for completion in 2012, and will allow for collaboration and industrial partnering and will showcase the Green Computing Data Center. The facility will house a variety of research projects that aim to overcome the technical barriers associated with adding new renewable energy generation systems to the electrical grid. There are a few examples of systems in operation that can be characterized as microgrids, but given the restrictions on intentional islanding currently in place, the ability to operate off-grid has not been well tested. The primary focus for these projects has been economic optimization of on-site generation resources. Fort Bragg has an operating microgrid of this type that combines technology from Encorp and Honeywell. The next level of microgrid development is represented in projects that are currently funded and in preliminary design and testing stages. Examples include GE’s work at Twentynine Marine Corps Base, Consortium for Electric Reliability Technology Solutions (CERTS), and the mobile microgrid prototype in development with NextEnergy at Fort Irwin and Fort Bliss. Other projects recently funded by DOE and DOD that are in design development include Sandia’s work with Energy Surety Microgrids (ESM) and NREL’s Net Zero Energy Installation (NZEI) microgrid efforts. Table 11 below summarizes some of the more significant DOD microgrid demonstration projects currently underway.

70
Table 11. Current DOD microgrid demonstration projects
Service Installation State Project Name
Army Ft Bragg NC Economic dispatch of on-site generation; currently no islanding capability. Complete.
Marines Twentynine Palms CA Microgrid demonstration project, GE
Army Ft Irwin/Ft Bliss CA Mobile microgrid development with NextEnergy, NextEnergy Cyber security, Sandia/NREL
ESTCP/SERDP Microgrid Projects
Air Force McGuire Air Force Base NJ Distributed Power Systems for Sustainable Energy Resources
Army Ft. Bragg NC Feasibility and Guidelines for the Development of Microgrids in Campus-type Facilities
Sandia SPIDERS and Energy Surety Microgrid Projects
PACOM Camp Smith HI Smart Power Infrastructure Demonstration for Energy Reliability and Security (SPIDERS),Sandia
Army Ft Sill/Ft Belvoir/Ft Devons Energy Surety Microgrid Projects, Sandia
Air Force Hickam/PMRF HI Grid support high PV integration, NREL SPIDERS, Sandia
Army Ft Carson CO PEVs microgrid integration, NREL SPIDERS, Sandia
Army Wheeler Army Airfield HI TARDEC Smart Charging Microgrid. Honeywell is integrating PV, diesel gen, bulk grid, and PEV’s.
Marines Twentynine Palms CA Experimental Forward Operating Base (ExFOB): Optimizing power and water usage.
NREL Net Zero Energy Installation Projects and Other Microgrid Assessments
USAF USAFA CO NZEI, NREL Microgrid/Utility Privatization, NRELPower Storage , NREL
Navy South Potomac MD NZEI, NREL Microgrid for critical facilities, NREL
Army Pohakuloa HI NZEI with Initial Microgrid Assessment, NREL
Marines Headquarters Building LA Climate-neutral case study—critical load backup-initial microgrid assessment, NREL
Marines Miramar CA Energy security micogrid planning and design as a follow on project from NREL NZEI microgrid initial assessment
Army Transportable Hybrid Electric Power System Mobile microgrid incorporating wind, PV, diesel gensets and
batteries, NREL
PNNL Microgrid Projects
Army Joint Base Lewis McChord WA Microgrid for critical facilities, PNNL

71
A brief discussion of representative projects follows: Honeywell’s Enterprise Buildings Integrator (EBI) Energy Manager and Encorp’s
Enpower generator controls work to optimize Fort Bragg’s energy costs (Jim Peedin, Fort Bragg Department of Public Works, civilian)
In 2003, a demand response system was implemented at Fort Bragg to optimize energy costs. The Honeywell Enterprise Buildings Integrator Energy Manager gathers day-ahead power prices from the local utility, forecasts loads and dispatches generators and demand management systems accordingly. Honeywell utilized the Encorp Enpower-GPC controls to control the generators and parallel them to the internal distribution grid. The original design intent was to reduce loads at the post by dispatching building-specific diesel generators. Since then, certain changes have been made and lessons learned. The base originally started with 11 diesel generators used for backup on a building-specific basis, totaling 2.5 MW. A 5-MW combined heat and power (CHP) system and four additional diesel generators with 4.5 MW output were subsequently added. The four diesel generators encountered technical problems with paralleling capability due to non-standard generator pitches and were removed from the demand management generator fleet. Honeywell continues to manage the CHP and 11 diesel generators to support the real-time pricing power procurement program. Fort Bragg has added additional demand response capability in the form of 2.2 million gallons of cold water thermal storage system, and is working to double that in the near future. The cold water is produced with off-peak power, and is used for cooling during peak periods. The cold water lasts for 4-8 hours, depending on cooling loads. The installation is also in the early stages of load control and uses the utility monitoring and control software UMCS building automation system to utilize HVAC setbacks and load cycling. Fort Bragg is also pursuing PV generation and islanding capability to support mission-critical facilities. The base is pursuing PV generation, however, financing has been challenging. In contrast to the GE work being done at Twentynine Palms, Fort Bragg cannot form an energy island. GE has submitted a grant to the Environmental Security Technology Certification Program to assist with this effort, but this work has not yet been funded.

72
Figure 37. A 7-MW cogeneration system is part of a comprehensive set of energy and facility
upgrades at a Marine base in Twentynine Palms, California (Source: NREL PIX 12709)
Twentynine Palms Microgrid Design by GE The base has 10 substations with two to five feeders on each one, for a total base peak load of about 25 MW. For this demonstration project, the critical load bearing substation will have an islanded load of about 11 MW, served off of four feeders. Currently the base incorporates diesel generators to back up existing loads, sized just under peak demand. Renewable generation located on the four microgrid feeders includes 1 MW of PV, a 7-MW CHP plant and two 250-kW fuel cells. An additional 11.5 - 16.5 MW of solar, wind, wood burning, and geothermal renewable generation is planned for the base, as well as a new 7-MW cogeneration facility to cover the peak load demand. Existing capacitor banks are currently used to support the base’s distribution system, and each feeder on the microgrid’s critical load substation has a capacitor bank for support. The microgrid demonstration project is planned to be about half the existing peak load at 10.6 MW during islanded operation. Although the project is not expected to be completed until the end of 2011, preliminary design review should occur in the 4th quarter of 2010. During preliminary design, many of the issues for the project have been identified. The primary effort will be creating the interfaces with the existing equipment including the existing energy management infrastructure and relays. Protection schemes will need to be updated to incorporate the new operating mode and the new controller equipment. Load shedding schemes will also need to be created. More than 20 upgrades are planned for the protection and energy metering relays. Upon completion of the preliminary design, the base will work with the utility to ensure that all regulations will be met. This includes California Rule 21, Generating Facility Interconnections, which recommends standard practices for the connection of DER to the utility grid.

73
GE uses a linear optimization solver to approach the microgrid dispatchability issue while grid-connected so that cost of operation is minimized. The critical components in the GE control system are the right mix of generation assets and a good forecast model for loads and renewable generation. The Model Predictive Control algorithm optimizes dispatch using load forecasts, renewable generation forecasts and stored energy. The dispatch algorithm determines unit commitment and economic dispatch based on benefit objective function and operation constraints. It can incorporate the CHP and thermal loads, use controllable loads as a resource, and account for renewable generator intermittency and forecasting. Currently, there are no meters on the Twentynine Palms buildings, so no building load profiles are available. Three years of existing base-wide data is available, and this will be used to develop models for GE’s optimal dispatch. Real-time forecasting for PV renewable generation was included in the initial Bella Coola system, so predictive models will also be developed for PV generation resources. The existing capacitor banks will be used for voltage and volt ampere reactive (VAR) support. Operation instructions for each generator are personalized in the supervisory controls using generation specifications like ramp rate, minimum/maximum power/thermal output, and generator efficiency to achieve optimum performance for each generator. Additional optimization constraints impacting the system include market price of electricity, fuel requirements for generation assets, and energy storage efficiency. The unique configuration for each generation asset provides a flexible, but customized approach to the microgrid dispatch optimization. Typically, GE’s Tieline Controller would ensure the seamless transition between grid and islanded modes. However, the asset portfolio at the Twentynine Palms demonstration project does not have enough assets to utilize that functionality. Instead, load shedding will be used as a resource to assist with the grid connection transitions. Military bases have stringent data security requirements. As a result, GE anticipated that installing the wireless communications on the base would be challenging. Permission for installing the system has been granted by the base and has been much easier than expected. A dedicated GE MDS wireless system will be installed for communications between the generation assets and the substation. Once the preliminary report is complete, base personnel will work with the utility to resolve their concerns related to the proposed microgrid system. As part of the implementation plan, the system will run in advisory mode for six weeks prior to moving into automatic mode. Training the personnel from the Department of Public Works on the equipment and the Web interface will also be part of the rollout. Once the demonstration has been completed, consideration to issues related to redundancy for controller operations will be considered. The CERTS Microgrid Program Consortium for Electric Reliability Technology Solutions (CERTS) was formed in 1999 to research, develop, and disseminate new methods, tools, and technologies to protect and enhance the reliability of the U.S. electric power system and functioning of a competitive electricity

74
market. The organization developed a microgrid concept which was presented in 2002. Field lab testing began in 2007 and field demonstrations started in 2009, including the DOE/Chevron Energy Solutions Santa Rita Jail Microgrid Demonstration (21 kV), static switch, storage, natural gas generation, fuel cell, and PV), the California Energy Commission/Sacramento Utility District (CEC/SMUD) Microgrid Demonstration, scheduled to be operational in 2011 and is expected to include three 100-kW TecoGen CHP units, PV, and uninterruptible power supply (UPS) functions (Lawrence Berkeley National Laboratory 2009). The CERTS Microgrid concept is an advanced approach for enabling integration of, in principle, an unlimited quantity of DER into the electric utility grid. A key feature of a microgrid is its ability to separate and isolate itself from the utility system during a utility grid disturbance. With the CERTS system, this is accomplished via intelligent power electronic interfaces and a single, high-speed, switch which is used for disconnection from the grid and synchronization to the grid. During a disturbance, the DER and corresponding loads can autonomously be separated from the utility’s distribution system, isolating the microgrid’s load from the disturbance (and thereby maintaining a high level of service) without harming the integrity of the utility’s electrical system/power grid. The techniques comprising the CERTS Microgrid concept are:
• A method for effecting automatic and seamless transitions between grid-connected and islanded modes of operation, islanding the microgrid’s load from a disturbance, thereby maintaining a higher level of service and without impacting the integrity of the utility’s electrical power grid
• An approach to electrical protection within a limited source microgrid that does not depend on high fault currents
• A method for microgrid control that achieves voltage and frequency stability under islanded conditions without requiring high-speed communications between sources.
Field lab tests fully confirmed earlier research that had been conducted through analytical simulations, laboratory simulations, and factory-acceptance testing of individual microgrid components. During the tests, the islanding and resynchronization method met all IEEE 1547 and power quality requirements. The CERTS microgrid has two critical components: the static switch and the micro source. The static switch, which consists of three pairs of anti-parallel Silicon controlled rectifiers (SCRs), enables seamless transfer of energy from the power grid or distributed generation to the loads to avoid service interruption upon a power quality deficiency. The most important function of the static switch is reclosing upon restoration of normal grid conditions. A synchronization controller is used for this purpose because it monitors instantaneous voltages across the SCRs. When the difference between the two is less than 5% of the nominal voltage level, the output gives a logic signal to the SCR firing board, which then triggers all three-phase SCRs at the same time. By using the static switch, power quality problems become transparent to the critical or sensitive customer loads. However, one of the major issues of the static switch is power loss in solid-state semiconductor devices. In the static switch, line current flows in the devices continuously, causing power consumption and element heating during normal operation. As a result, relatively large cooling equipment is required, which imposes additional operating costs to limit SCR

75
temperature. It also results in reduced efficiency and lower reliability in the device. Therefore, the heat sink and cooling function selection is critical.
Figure 38. Schematic of the CERTS microgrid (Copyright 2008, The Regents of the University of California. No use is permitted without written permission. Please contact Chris Marnay at
[email protected] if you wish to use or reproduce this diagram for any purpose. Reprinted with permission)
Another important issue is the speed of operation of the static switch, which is primarily determined by the switching time. The switching time is of importance because it identifies the duration of power discontinuity/interruption for the sensitive load. The duration of power discontinuity is the key factor in predicting proper operation of the load. The static switch must be able to perform a fast transfer from the distributed source to the healthy grid regardless of the load type and the fault/disturbance characteristics. After islanding, each micro source can seamlessly balance the power on the islanded microgrid (NREL 2004).
The next logical phase for research, development, and deployment of the CERTS Microgrid concept is to prioritize, develop, and demonstrate additional technology enhancements required to optimize the microgrid and demonstrate its commercial viability. Planned microgrid work involves unattended continuous operation of the microgrid for 30 to 60 days to determine how utility faults impact the operation of the microgrid and to gauge the power quality and reliability improvements offered by microgrids. In fiscal year 2011, the CERTS project team plans to complete full-scale testing of the following new hardware elements at the test bed in Ohio: 1) mechanical switch (for comparison to earlier testing of performance of an electronic static switch); 2) smart loads that respond automatically and autonomously to frequency deviations;
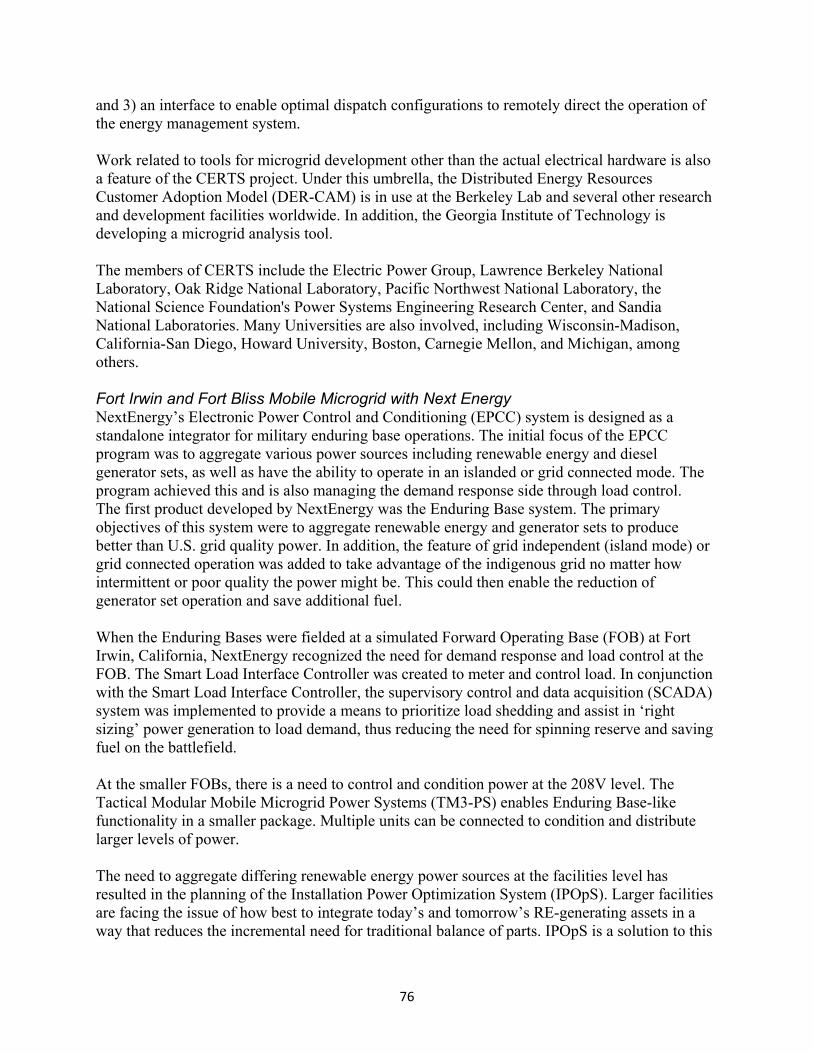
76
and 3) an interface to enable optimal dispatch configurations to remotely direct the operation of the energy management system. Work related to tools for microgrid development other than the actual electrical hardware is also a feature of the CERTS project. Under this umbrella, the Distributed Energy Resources Customer Adoption Model (DER-CAM) is in use at the Berkeley Lab and several other research and development facilities worldwide. In addition, the Georgia Institute of Technology is developing a microgrid analysis tool. The members of CERTS include the Electric Power Group, Lawrence Berkeley National Laboratory, Oak Ridge National Laboratory, Pacific Northwest National Laboratory, the National Science Foundation's Power Systems Engineering Research Center, and Sandia National Laboratories. Many Universities are also involved, including Wisconsin-Madison, California-San Diego, Howard University, Boston, Carnegie Mellon, and Michigan, among others. Fort Irwin and Fort Bliss Mobile Microgrid with Next Energy NextEnergy’s Electronic Power Control and Conditioning (EPCC) system is designed as a standalone integrator for military enduring base operations. The initial focus of the EPCC program was to aggregate various power sources including renewable energy and diesel generator sets, as well as have the ability to operate in an islanded or grid connected mode. The program achieved this and is also managing the demand response side through load control. The first product developed by NextEnergy was the Enduring Base system. The primary objectives of this system were to aggregate renewable energy and generator sets to produce better than U.S. grid quality power. In addition, the feature of grid independent (island mode) or grid connected operation was added to take advantage of the indigenous grid no matter how intermittent or poor quality the power might be. This could then enable the reduction of generator set operation and save additional fuel. When the Enduring Bases were fielded at a simulated Forward Operating Base (FOB) at Fort Irwin, California, NextEnergy recognized the need for demand response and load control at the FOB. The Smart Load Interface Controller was created to meter and control load. In conjunction with the Smart Load Interface Controller, the supervisory control and data acquisition (SCADA) system was implemented to provide a means to prioritize load shedding and assist in ‘right sizing’ power generation to load demand, thus reducing the need for spinning reserve and saving fuel on the battlefield. At the smaller FOBs, there is a need to control and condition power at the 208V level. The Tactical Modular Mobile Microgrid Power Systems (TM3-PS) enables Enduring Base-like functionality in a smaller package. Multiple units can be connected to condition and distribute larger levels of power. The need to aggregate differing renewable energy power sources at the facilities level has resulted in the planning of the Installation Power Optimization System (IPOpS). Larger facilities are facing the issue of how best to integrate today’s and tomorrow’s RE-generating assets in a way that reduces the incremental need for traditional balance of parts. IPOpS is a solution to this

77
condition. In conjunction with other EPCC products, the system can manage both the power quality of the upstream generating assets and the downstream loads. EPCC has similar functions to the Encorp system, in that it promotes efficient generator fuel use. With its power quality controls, the EPCC can also manage the seamless integration of alternative power sources, and eliminate surges that cause electronic equipment to fail. EPCC can concurrently manage electric power from a variety of external resources including conventional generators and renewable energy such as fuel cells, wind, solar power, electric vehicles with exportable power, and batteries. Even though the EPCC is designed for remote locations, it also has the capability of connecting to a host grid, if available. The EPCC is designed to provide a continuous, transient-free electrical supply that is consistent and compatible with electronic-based system loads. Field tests are being conducted at Fort Irwin, California, and Fort Bliss, Texas, on units ranging from 250 kW to 500 kW. The Fort Irwin equipment is a prototype model and has been operating well, according to Next Energy. They have set up tests to force load shedding and generator start up. Grid power is not available in this area of the base. The only intervention required by NextEnergy is the training of operators at the time of troop rotation. NextEnergy will deploy an EPCC at a DOD logistics operation in Afghanistan by the end of 2010. The EPCC design is based on a UPS architecture, which limits the maximum power input and output of the unit. To build units rated higher than the 500 kW currently available, a UPS with a higher capacity must be used. In contrast, the GE work being done at Twentynine Palms is limited by the capacity of the switchgear at the point of common coupling. Energy Surety Microgrids (ESM) and SPIDERS at Sandia Labs Sandia Labs has developed the ESM concept to address the five elements of energy surety—safety, security, reliability, sustainability, and cost effectiveness. The ESM has five key operational features:
• Plug and play: Distributed generation sources and loads can be inserted and removed with minimal physical or logical changes
• Controller system eliminates single points of failure: If an event disables the system’s main defenses, the control system can maintain critical operations
• Ensures most efficient and cost-effective operation: The control system can optimize the use of power system components with minimal or no human intervention
• Operates islanded or grid-tied: The ESM has the capability to alter between the two states automatically, as dictated by system conditions
• Adaptive to changes: It is aware of changes to the number and state of available resources.
One of the key design features of the ESM is its centralized command and distributed data processing. It features a hierarchical processing command structure which is dynamic rather than static. Another key feature is its interoperability. The system’s nodal design simplifies the data requirements, so the controller’s data gathering is more straightforward and adding new technology is easier. Finally, the system adaptability is maximized through the use of logical nodes. Each logical node has the detailed information required to adjust its state in the system as needed and to communicate relevant information to the management processor, or microgrid

78
logical node. The nodal arrangement allows the use of standard security mechanisms to authenticate node participation (Menicucci and Ortiz-Moyet 2009). Sandia Labs is also coordinating the Smart Power Infrastructure Demonstration for Energy Reliability and Security (SPIDERS) as part of the Joint Capability Technology Demonstration on Energy Security. This program will focus on cyber defense within a smart microgrid on Camp Smith, Hawaii. The desired capabilities of the SPIDERS system follow:
• Provide cyber defense of a smart grid network
o Establish a strategy of defense-in-depth using virtual secure enclaves and a sensor architecture
o Institute strong authentication and role-based access controls.
• Intelligent and secure electric grid providing efficient and reliable power to military task critical assets ensuring uninterrupted national defense
o Allow power to be used with maximum efficiency
Institute energy demand management systems
Maximize asset utilization
o Make DOD demonstration grid both fault and attack tolerant with rapid recovery after natural disaster or deliberate attack
Enable islanding, protection of power supply and task critical assets
o Allow all sources of power to provide electricity to the grid
o Enable the high penetration, stability, and security of renewable energy production
Dynamic/adaptive protective relaying scheme
o Coordination and demonstration with utilities and the military (Jost and Ka’iliwai 2009).
This project will be developed in two independent tracks working in parallel: 1) Smart Microgrid Project Strategy with Sandia and Oak Ridge Laboratories will work on smart microgrid conceptual design and 2) Parallel Virtual Secure Enclave (VSE) Cyber Experimentation Strategy with Idaho National Laboratory and the SCADA test bed focusing on SCADA defense experiment. The SPIDERS microgrid is expected to be up and running by 2013 at Hawaii’s Camp Smith supporting about 10 MW. Aspects of the microgrid technology will also be tested at Pearl Harbor-Hickam joint base in Hawaii. Fort Carson will also host testing of some of the cyber security and smart metering capabilities (Maron and Climatewire 2010). Sandia also has military microgrid efforts at Fort Belvoir, Fort Devens, Philadelphia Naval Yard, NAVFAC (Norfolk), Maxwell AFB, Schriever AFB, Vandenberg AFB, and Kirkland AFB. Work at Indian Head and Guam/Okinawa is also under consideration. (Torres 2010)

79
Net Zero Energy Installations and Microgrid Assessments at National Renewable Energy Laboratory (NREL)
Microgrids are best implemented in the context of a “systems” approach to energy. One such state-of-the-art approach is to follow the process being developed through DOD-DOE initiative by the NZEI task force. This initiative was formally implemented in 2008. Pilot NZEI demonstration sites have been identified for each of the services. The four sites include Miramar Marine Corps Air Station, U.S. Air Force Academy, the Army Pohakuloa Training Area, and South Potomac Navy Base. The goal is to create a template resulting in a replicable process that can be implemented across the services. The task force provides coordination and oversight, and selects the pilot installations. Support from NREL begins with planning and continues through implementation. This approach starts with an assessment containing the following elements:
• Baseline: Durrent energy consumption and facility or system demand, identification of critical loads
• Energy efficiency: Retrofit improvement potential, new construction design improvement, and optimization
• Renewable energy: Deployment of renewable energy (size, location)
• Electrical systems: Interconnection and microgrid “baselining”
• Transportation: Reduce and replace fossil fuel use
• Greenhouse gases: Baseline and reductions.
Proceeding in this manner systematically minimizes loads (efficiency) and integrates renewable generation to meet these loads, before grid issues are addressed. NZEI grew from the idea of a renewable energy community:
“…the buildings and transportation sectors use approximately 70% of the United States’ energy. Changing the way we design new communities using a renewable energy systems approach—with sustainable planning, net zero-energy homes, advanced vehicles, and innovative utility interconnections—could significantly decrease this energy use, as well as its associated emissions and climate change impacts, both in the U.S. and worldwide.” (Carlisle, et al. 2008).
While some components of a renewable energy community are common, advanced vehicles and innovative utility interconnections are not widely implemented. Advanced vehicles, such as a PHEV, not only play a role as efficient transportation, but their batteries can play a role in grid energy storage. The Fort Carson project will be focusing on integrating vehicle-to-grid technology on the base. Microgrids enable the systematic implementation of these technologies, and create additional pull for their development. When presented in this context, microgrids are seen as a critical component of grid modernization, enabling more reliable electrical distribution networks and encouraging local energy production. The systematic approach provided by NZEI creates a robust system implementation that incorporates microgrids from a comprehensive perspective starting with energy efficiency. This approach provides a continuum of implementation efforts to reduce the carbon footprint and incorporate microgrid technology to provide surety of operations.

80
Although not all microgrids are planned in this way, the systems approach minimizes backup generation capacity requirements through energy efficiency improvements and maximizes renewable energy integration. The microgrid implementation projects described above were started before the conception of NZEI, and in hindsight, would have benefitted from this type of systematic approach. Microgrid Market Participants in the United States Several technology companies are working on product lines or components that will be microgrid compatible. The critical equipment for microgrids include high speed switches, generation and load controllers, as well as supporting communications and sensor technology. Many manufacturers are forming partnerships to couple their products with complementary technology, for example, Honeywell and Encorp at Fort Bragg. Other companies post microgrid capabilities with very few details related to specific products implying ongoing research and development efforts. Many international companies are involved in projects outside the United States. Following are some descriptions of microgrid-specific projects by manufacturer. Honeywell In addition to Fort Bragg, Honeywell is working with rapid electric vehicles on a bi-directional charging technology for microgrids in the U.S. Army Tank Automotive Research Development Engineering Center. The project at Wheeler Air Base in Hawaii involves the design, building, and demonstration of plug-electric vehicles to determine technical readiness of microgrids to accept and deliver power in both alternating and DC systems. GE GE’s work with microgrids began in 2005 with a two-year grant from DOE to develop a microgrid energy management system. By the end of 2007, GE was ready to begin the demonstration phase of the program, however, the initial demonstration sites were abandoned due to financial issues. An initial implementation of GE’s microgrid system was installed at Bella Coola, an off-grid site north of Vancouver, Canada, (also referred to as “remote operations” above). Peak/average load for this site was 4.7/3.2 MW with renewable hydro, diesel generators, and a hydrogen energy system. Challenges included load spikes from the local sawmill and unpredictable interruptions to the hydroelectric power caused in some instances by log jams. One of the findings from this initial demonstration emphasized the need for fast-response assets that can operate above rated capacity. The Bella Coola project provided a number of challenges, including having the renewable penetration approach 100%, whose solutions could be applied to subsequent microgrid projects. The next implementation of the microgrid control system involved an opportunity with Twentynine Palms Marine Corps base in southern California. This project is sponsored by the Environmental Security Technology Certification Program and was discussed in detail earlier in this report.

81
Lockheed Martin Lockheed Martin is developing products for the mobile microgrid market with the Air Force. The company is providing systems engineering support to San Diego Gas & Electric for the Borrego Springs microgrid demonstration project, one of the first utility-scale systems in the nation. The Integrated Smart-BEAR Power System (ISBPS) is part of the BEAR program. The lightweight, air-transportable system is designed to establish mobile air bases. The ISBPS can integrate a variety of energy sources, including renewables, into the existing BEAR power grid, ISBPS capabilities include operating in both grid-tied and grid-independent modes. The ISBPS will be initially developed at Lockheed Martin’s Dallas facility. Lockheed Martin also has a smart grid product line, called SEEsuite Smart Grid Command and Control™ platform that provides demand response management and grid situational awareness. Cummins Power Generation Cummins has provided a microgrid to Snow Summit Ski Resort in southern California that includes a medium-voltage loop integrating a system of generators, transfer switches, digital paralleling equipment and controls manufactured by Cummins. The system includes Cummins Power Generators and PowerCommand digital master controllers. The system is capable of running in a variety of configurations that include assigning power from three sources—the utility, three gensets at the top of the mountain and three gensets at the base area—to almost any load in the system. The master controllers are capable of matching voltage and frequency between the six gensets and the utility within seconds as the combination of power sources changes. The microgrid system is also able to provide resort-wide power in the event of utility failure and to allow equipment to be taken off-line for maintenance. International Microgrid Activities Microgrid efforts are very active internationally. Serious work on microgrids in Europe started earlier than in the United States for two major reasons. First, Europe experienced political pressure to explore power solutions with a lower carbon footprint earlier than North America, and microgrids, with their ability to integrate high levels of renewables and integrate cogeneration, were explored. Second, the European Union implemented legislation in the early 2000s, which enabled distributed generators. This legislation reduced the barrier to entry for DER, allowing distributed generation to move into markets that were previously underserved by conventional central generation. Currently, several European countries are operating microgrid projects, but Denmark is one of the world’s leaders in distributed generation. The best known of the true microgrid demonstrations in Denmark is the Bornholm Island microgrid. It serves 28,000 customers, provides over 55 MW of peak power, and incorporates 30 MW of wind power. The microgrid is connected to a high power node in Sweden and is able to successfully island off from the overall grid when power quality is low. Denmark has already achieved a record of 20% penetration of wind power (2007 data), and is now moving towards a target set out by a new national energy strategy which implies 50% wind power penetration for the electric power system by 2025. Innovative control architectures like

82
virtual power plants (VPP), cell-based systems, and vehicle-to-grid are under consideration and development for electric power systems. A VPP is a group of DER units that are controlled to function together like a single power plant, thereby improving the market function and providing valuable flexibility to the power system. Through the VPP concept, individual DERs will be able to gain access and visibility across the energy markets. They will also benefit from VPP market intelligence to maximize their revenue. Without the VPP, these individual units would not have been able to participate in the market due to their small size or stochastic energy supply. Agents help implement the dynamic adaptability in microgrid, e.g., from grid-connected to islanding mode. An agent is an encapsulated computer system that is situated in some environment and can act flexibly and autonomously in that environment to meet its design objectives. Intelligent agents have sophisticated cooperation mechanisms which could help implement the required cooperation between different DERs in a microgrid. (Saleem and Lind 2010) Japan is also advancing the implementation of the microgrid approach. Most recently, Japan’s energy agency, The New Energy and Industrial Technology Development Organization (NEDO), partnered with the state of New Mexico to co-fund and develop microgrid projects for several communities. NEDO is Japan’s largest public R&D management organization for promoting the development of advanced industrial, environmental, new energy, and energy conservation technologies. NEDO demonstration projects include the Hachinohe microgrid, part of a regional utility grid that includes generation management, the Sendai microgrid, a university campus with multi-level power quality supply and emergency backup, and the Kyotango microgrid, a virtual power system (distributed), with load and generation management. Kyushu Electric Power is conducting microgrid system demonstration tests on six remote islands, aiming at the reduction of CO2 emissions and fuel costs, as well as the expanded introduction of renewable energy including photovoltaic and wind power. The tests started in 2009 and are scheduled to continue through 2012. In 2009, demonstration facilities were installed on each island, and data collection started in FY 2010.The microgrid system installed at the Shimizu Institute of Technology entered practical operation in August 2006 and produces a total output of 600 kW. The microgrid system consists of two main power-generation units and two electrical storage units. The main power-supply units are based on natural gas cogeneration supported by a nickel hydride battery and electrical double-layer capacitor that are deployed in conjunction to respond to sudden load changes. The PV generation system contributes to the use of power supplies that are based on natural energy sources. In Canada, several projects are underway, including the BC Hydro energy storage, BCIT Burnaby campus, and Hartley Bay microgrid projects in British Columbia. In Korea, autonomous microgrids have been operational since 2004. A 120 kW pilot microgrid project at the Korea Electrotechnology Research Institute (2007-2009) included real and simulated DG, simulated load, and energy management system, in grid-connected and stand-alone operational modes. The microgrid on the Greek Island of Gaidouromantra, Kythnos, is autonomous and was installed in 2001. It is composed of a three-phase low-voltage grid, formed by battery inverters. The grid is composed of overhead power lines and a communication cable running in parallel to serve the monitoring and control needs. Technologies involved include PV, battery storage, a diesel genset, and intelligent load controllers.

83
Recommendations for Microgrid The critical components of a microgrid effort are summarized in Table 12 below. Future demonstration efforts focusing on any of the bullets listed would move the operational readiness of microgrids forward, however, the area most strongly recommended for immediate focus is development of the controller technology. The controller is critical to successful microgrid operation and is the heart of the system. The controller provides the dispatching intelligence necessary to keep the critical load running when the microgrid is disconnected from the macrogrid. Enhancing the capability for seamless switching is another area of immediate focus. Working with manufacturers to test and enhance their equipment at demonstration projects is recommended. Selecting several sites that provide unique operating environments, such as size of system, criticality of loads, type of on-site generation, and presence of energy storage would provide a good balance for development of several controller technologies. Switching technology could also be tested as part of these demonstration efforts. Given the primary focus of DOD goals, all research focused on microgrids would address both the mission assurance and energy security objectives. Microgrids have the potential to reduce vulnerability to power grid disruptions and integrate higher penetrations of renewable on military installations. They can also be an important component to assuring access to reliable supplies of energy and protecting/delivering sufficient energy to meet installation energy needs.
Table 12. Critical components of microgrid research and development
Switch-disconnect and reconnect from the macrogrid
• Seamless disconnect/reconnect • Compliance with IEEE 1547 and interconnection agreement with utility • Optimize energy flow at point of interconnection
Controller-dispatch generation, load, and support
• Integrate renewables • Utilize energy management • Minimize fuel inventory • Extend duration of islanded operation • Coordinate system protection and communication
Other areas of concern
• Military specifications for smart grid or microgrid • Other energy surety areas of concern unique to specific installations • Communications during emergency outage • Interaction with local community during emergency outage
Demonstration projects using existing infrastructure at military bases will provide a unique opportunity to further microgrid technology and policy developments. The SERDP-sponsored GE demonstration project at Twentynine Palms will provide good data for microgrid operation in a grid-connected environment with significant renewable generation penetration in the microgrid portfolio. As part of the demonstration project, the base will work with the utility to break the historical barrier of intentional islanding. Similar interactions will occur with the Miramar, Fort Carson, and Air Force Academy projects.

84
Additional demonstration projects could facilitate the interactions with the utilities to begin working through the details of intentional islanding. This experience coupled with the publication of the new IEEE 1547.4 standard and application of the National Institute of Standards and Technology (NIST) and other IEEE standards to microgrid projects will accelerate the needed adjustments—both technical and policy oriented—to make this a smooth transition. The implementation, issues, successes, and results of these projects should be followed closely. Monitoring of different technologies and comparison of pros and cons of each will help define the characteristics of the microgrid components. Other demonstration projects incorporating existing systems with different distribution system and renewable generation configurations will provide much needed data on functionality of the components and design issues of concern. Facilitating seamless transition for those microgrids that have already been established for economic dispatch opportunities, like Fort Bragg, provides another avenue for technology development. Adding switching and appropriate protections to these systems offers a low cost option for quick implementation. Most essential military facilities already have much of the costly infrastructure that is necessary for microgrid status. Critical buildings and entire bases have significant standby generation capable of closed transition with the local utility. These facilities may also have building management systems in place for energy efficiency measures, and these control systems can be used by the microgrid controller for load shedding, including chillers, fans, lights, etc., as necessary for grid support during islanding conditions, integration of renewable energy to system, and use of PV inverters to include VAR support. The electrical island controller would balance system load and DER at all times. Distributed energy storage could be added to ensure selected portions of the site were uninterrupted during the transitions between grid disconnection and reconnection to microgrid sources. It is suggested that a range of sizes of military bases be considered for demonstration projects, including remote sites with small loads and large bases that are near-microgrid ready. These projects, which may range from single buildings to campuses with hundreds of facilities, will provide different types of technological, geographic, and operational challenges, and the resulting gains in knowledge can be used at similar locations elsewhere. The addition of advanced metering infrastructure, a microgrid control system, and cyber-secure communications equipment and technologies to existing facilities is a prudent choice for energy management, autonomous operation, and the integration of leading-edge microgrid technologies into DOD sites. The installation of advanced metering infrastructure devices and related monitoring systems, together with telecommunications infrastructure and DER projects, are currently underway at military facilities worldwide. It is important that these projects address the new standards being adopted by NIST. In particular, cyber security standards implemented by DOD should be in line with the proposed Guidelines for Smart Grid Cyber Security issued recently by NIST. These guidelines, which include high-level security requirements, can be used in the development of strategies for protecting the modernizing power grid from attacks, malicious code, cascading errors, and other threats. The focus of these strategies should include monitoring the working groups and developing cyber security techniques for data transfer. More stringent standards appropriate for DOD work may need to be developed.

85
Several American manufactures have long-established reputations in building energy management systems. A request for proposal to develop an integrated microgrid-compatible building/facility that includes based monitoring, load management, and facility island generation resources (both fossil and renewable-based) control system that is interoperable with adjacent building/facility power systems is recommended. The system would be similar to the current work at Twentynine Palms and could incorporate efforts scheduled for early 2011 at Miramar and the Air Force Academy. It could be awarded within the context of demonstration projects to several manufacturers and would be based upon the latest equipment manufacturer’s engineering technologies with standardization of the protocol/data transfer between building/facility control systems and the microgrid controller or grid. All projects should be modular in approach and incorporate the adopted NIST and IEEE standards for smart grid, equipment interoperability, and microgrid requirements, where applicable. Distributed storage provides several advantages to the microgrid, as described elsewhere in this paper. The integration of electric vehicle infrastructure with the microgrid could become a valuable asset for renewable energy-based generation systems and area electrical power system stability. The development of infrastructure for vehicle-to-grid technology is not active at this time, but with electric vehicles now on the market, this is likely to change. Development of bi-directional electric vehicle charging infrastructure (electric vehicle charging and discharging, with management concept as described earlier in this paper) will be costly and should be well-planned to integrate effectively into the respective microgrids. Secure communications methods should be incorporated into the systems. It is recommended that the conversion of medium-duty commercial platforms from fossil fuel-based transport to electric vehicles, together with the necessary vehicle charging infrastructure, be undertaken at selected sites. This would build on the work currently underway at Fort Carson. Vehicles in this range represent a significant portion of a typical base fleet, and also include large battery capacities that can become significant energy storage reservoirs. Other distributed energy storage technologies should also be explored, including compressed air, water storage/hydro, flywheels, and fuel cells. The demonstration projects provide real-world testing environments and if pursued by a variety of technology manufacturers, can create customized combinations of components to solve the myriad of unique operating environments. Multiple examples also help distill the critical issues of concern for future implementation and help to identify areas in need of additional standards development or modification. By participating in the demonstration, technology companies can use the design effort to develop technology improvements. The experience gained through the demonstration projects on military bases can be generalized to other microgrid environments including university campuses, municipalities, or other private sector applications. The demonstration projects help to force the development of technology that is appropriate and capable of performing the necessary microgrid functions. This, in combination with pushing the policy development at the utility level, will move general implementation forward more quickly.

86
Electric Vehicle Integration to a Military Base Grid Microgrid and vehicle-to-grid technologies are complementary. Therefore, this section summarizes the potential benefits of electric vehicle grid integration (EVGI) with a military base microgrid. It is based on a report prepared by NREL for the Fort Carson Army Post. The purpose of that report was “to assess opportunities for increasing energy security through renewable energy and energy efficiency at Front Range installations… NREL performed a comprehensive assessment to appraise the potential of Fort Carson to achieve net zero energy status through energy efficiency, renewable energy, and electric vehicle integration,” (Anderson and Markel 2010). Fort Carson occupies 137,000 acres south of Colorado Springs, Colorado. In the Fort Carson study, NREL has found that even at relatively small adoption rates, the control of electric vehicle charging on a base will aid in regulation of variable renewable generation loads and help stabilize the grid or microgrid. DOD installation dependence on petroleum for transportation and a fragile commercial electricity grid for electrical energy presents a substantial risk to operations. The introduction of electrified vehicles and energy storage systems with the ability to reduce transportation petroleum consumption and provide dispatchable electricity grid management functions would support the integration of renewable generation and increase the robustness and flexibility of the base energy supply network. The availability and affordability of distributed renewable energy generation options will likely increase during the next decade, thus increasing the plug-in vehicle options as well. NREL anticipates that U.S. military bases will interact with plug-in vehicles belonging to the transportation motor pool (a designated, secure area for parking military-owned vehicles), as well as its military and civilian commuters. This analysis evaluates the management of all-electric fleet vehicles and commuter electric vehicles, based on performance and nationwide rollout plans for the Nissan Leaf and GM Volt. Light-duty plug-in electric vehicles (PEVs) are currently in production and scheduled to arrive at select dealerships and in national fleets in late 2010 to 2011. Assumptions Vehicles considered for this analysis represent either commuters who live off base or GSA-leased cars, trucks, or vans. These vehicles are categorized as either conventional, plug-in hybrid electric vehicle (PHEV), all-electric vehicle (AEV), or GSA fleet electric trucks. To simplify analysis, each PHEV, AEV, and electric truck sub-fleet described in Table 13. Table 13 is categorized with generic characteristics representative of similar PEV options expected to be available in the near-term market. Each vehicle is considered to operate independently but also influences the net effects. This electric fleet—carrying multiple megawatt-hours of storage—would create an important dynamic resource for the base microgrid.

87
Table 13. Modeled vehicle characteristics
Vehicle Type Units PHEV AEV Electric Truck
Battery capacity kWh 12 25 80
Energy consumption
Wh/mi 300 250 800
Charge-depleting range
mi 40 100 100
Life-expectancy years 15 15 15
EVSE charge level
- 2 2 3
Electrifying a Base Fleet In a previous study, NREL found that nearly one quarter of the GSA-leased transportation motor pool (TMP) is currently well-suited for replacement with one of the three all-electric truck options now available via the GSA.
Figure 39. The Smith Electric Newton All-Electric Truck, upfitted into one of many different configurable options (Courtesy of Smith Electric Vehicles, reprinted with permission)
Transport shuttles, bucket trucks, stake trucks, and refrigerated vans all represent highly valuable roles of PEVs on base. Their mission of continuous, short trips during the day on base and returning to the same lot each night reflects the ideal electric vehicle duty cycle. Similarly, delivery vans and general use medium-duty trucks also present valid opportunities for electric drive.

88
Table 14. Electric truck options available on the 2010 GSA schedule
GSA Vehicles Smith Newton Zero Truck ZT Enova Ze
GVWR class 4 to 6 3 to 5 3 to 4
GSA item number 571E.1 95E 134E.1
Maximum range (mi) 100 75 150
Maximum speed (mph) 50 60 65
GSA base price $167,000 $142,100 $109,500
Incremental cost $109,548 $119,573 $80,309 Each of these medium-duty commercial platforms has a large battery capacity (60-120 kWh) to meet typical daily driving distance requirements and at least one will have the opportunity to fast charge at rates of nearly 20 kW. This will provide adequate mission capability for intra-base delivery, troop transportation, ambulance support, civilian shuttles, and other executive services. At current utility charges, fuel to drive each mile will cost less than $0.03, roughly 80% less than the gasoline that current TMP trucks and vans consume. For this analysis, the gradual phase-in of commuters (and commuter energy) was assumed as the motor pool (and motor pool energy) phased out during the morning. The opposite trends should occur in the evening as commuters depart and motor pool vehicles return. Why Plug-ins? Plug-in vehicles range from PHEVs of varying battery capacities (and all-electric ranges) to AEVs or electric vehicles; both offer two potential benefits to the operator:
High rates of petroleum consumption displacement (via enhanced efficiencies), (Markel, Pesaran, and Smith 2009).
Clean and affordable operations (via fuel diversity from relatively inexpensive and potentially renewable sources), (Denholm, Markel, and Parks 2007).
These automotive technologies, when deployed appropriately with the proper control, can also facilitate the build-out and maintenance of a cleaner, more reliable grid. While parked—and the average car is parked more than 90% of the time (Denholm, Markel, and Kuss 2009)—plug-in cars will provide a flexible load or possible energy storage with adjustable charge and discharge capabilities. NREL found that if a base applies such grid stability options to its microgrid, the base may experience amplified savings and power quality benefits. Electric Vehicle Infrastructure An electric fleet will require the following infrastructure in the same way that a conventionally fueled fleet will require maintenance equipment, storage accommodations, and fueling infrastructure (Markel 2010). Though standardization is currently lacking, commercial options exist for each item.
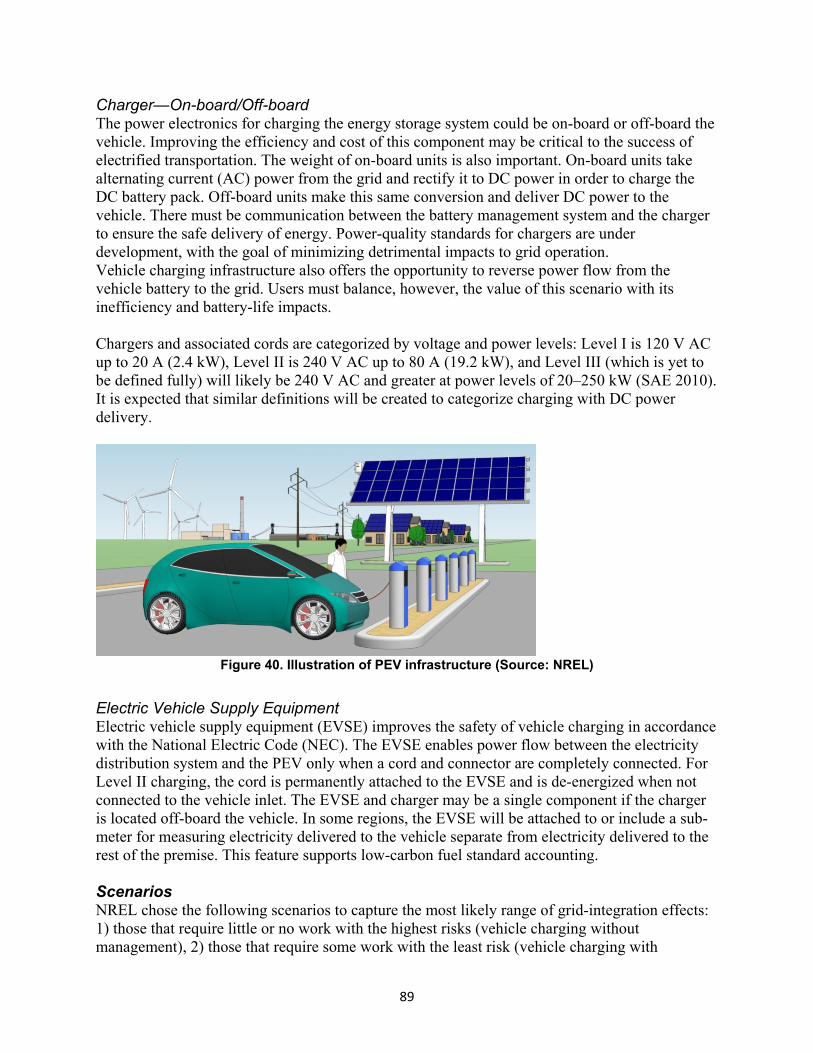
89
Charger—On-board/Off-board The power electronics for charging the energy storage system could be on-board or off-board the vehicle. Improving the efficiency and cost of this component may be critical to the success of electrified transportation. The weight of on-board units is also important. On-board units take alternating current (AC) power from the grid and rectify it to DC power in order to charge the DC battery pack. Off-board units make this same conversion and deliver DC power to the vehicle. There must be communication between the battery management system and the charger to ensure the safe delivery of energy. Power-quality standards for chargers are under development, with the goal of minimizing detrimental impacts to grid operation. Vehicle charging infrastructure also offers the opportunity to reverse power flow from the vehicle battery to the grid. Users must balance, however, the value of this scenario with its inefficiency and battery-life impacts. Chargers and associated cords are categorized by voltage and power levels: Level I is 120 V AC up to 20 A (2.4 kW), Level II is 240 V AC up to 80 A (19.2 kW), and Level III (which is yet to be defined fully) will likely be 240 V AC and greater at power levels of 20–250 kW (SAE 2010). It is expected that similar definitions will be created to categorize charging with DC power delivery.
Figure 40. Illustration of PEV infrastructure (Source: NREL)
Electric Vehicle Supply Equipment Electric vehicle supply equipment (EVSE) improves the safety of vehicle charging in accordance with the National Electric Code (NEC). The EVSE enables power flow between the electricity distribution system and the PEV only when a cord and connector are completely connected. For Level II charging, the cord is permanently attached to the EVSE and is de-energized when not connected to the vehicle inlet. The EVSE and charger may be a single component if the charger is located off-board the vehicle. In some regions, the EVSE will be attached to or include a sub-meter for measuring electricity delivered to the vehicle separate from electricity delivered to the rest of the premise. This feature supports low-carbon fuel standard accounting. Scenarios NREL chose the following scenarios to capture the most likely range of grid-integration effects: 1) those that require little or no work with the highest risks (vehicle charging without management), 2) those that require some work with the least risk (vehicle charging with

90
management), and 3) those with the greatest benefits and the greatest costs (vehicle charging and discharging with management). Scenario 1: Vehicle charging without management Also known as opportunity charging, unmanaged charging typically begins at the maximum rate as soon as the vehicle is parked and plugged in. On a typical base, opportunity charging coincides with demand peaks, creating high electricity loads and costs. Charging under this scenario likely adds significantly to the base load and peak demand. During a critical-load scenario, when the base is separated from the main grid and only GSA electric trucks are plugged in, unmanaged charging results in a small additional load. Scenario 2: Vehicle charging with management Regional utilities employ demand response programs to reduce excess costs during peaking demands by curtailing certain customer equipment under specific agreements in exchange for payment to the customer. In a similar fashion, controlled charging of vehicles is another load that grid operators can regulate to counter any large demand or supply transients, which could damage equipment or even cause blackouts. Parked (and plugged in) PEVs may play a role in buffering variation in output from renewable supplies, which can occur with unexpected changes in the weather. The electric fleet could smooth many of the power drops during periods where large numbers of commuters are parked on base by regulating charging. However, changes of 20% of the peak demand may still occur within a short period and without compensation. These fluctuations may create significantly more costs for the utility than the savings resulting from smoothing with PEV charging. On the other side of the meter, the fluctuations in power demand will be smoothed when energy is available. When large amounts of solar energy became available—which frequently occurs as the sun emerges from cloud cover—PEVs absorb the additional unexpected energy. In practice, this compensating reaction would allow additional time to efficiently ramp down large generators without causing dangerous swings in voltage or frequency on the grid. During emergency operations, properly managed charging defers the vehicle power requirement to times when the demand is lower or when excess renewable energy is available. Each evening a large portion of the load reduction would be absorbed by charging the motor pool electric trucks. Unfortunately, in this scenario, the vehicles that remain parked become relatively useless once completely charged. The benefits after these times are relatively diminished. Even with these charging restrictions, a base microgrid could still provide enough energy for these vehicles each day without creating a new peak in demand. In fact, diesel fuel could be used more efficiently in on-site transportation by running generators that charge electric trucks during emergency conditions rather than by fueling diesel-powered trucks. Large generators run at roughly 35% efficiency and charge the vehicles at about 95% efficiency. Electric powertrains in these vehicles operate at an average of about 80-85% efficiency, totaling roughly 27% pump-to-

91
wheels efficiency, while the average diesel truck runs at closer to 20% efficiency on average. A base fleet can drive nearly 35% further with each gallon of fuel in electric vehicles and still support the microgrid. Scenario 3: Vehicle charging and discharging with management The ability to discharge PEVs effectively doubles the range of power with which a grid operator can regulate the system’s power budget. Additionally, the storage capacity of the PEVs connected to the grid could be used in load shifting and long duration load leveling. Compared with the model results during charge management, the resulting net load profile with vehicle discharge capability is significantly smoother. Any sharp changes in load occur primarily during times that vehicles leave the charging station (to go home or on a route). This additional flexibility provides an opportunity to utilize generation resources in an optimal combination based on price, emissions, or other metrics. During emergency operations, even a small fleet of electric trucks can help prevent some extreme load swings and better utilize electricity produced by solar or wind on base. These grid management services require significant use of the fleet truck batteries, but the diurnal fluctuation in loads only draws approximately the equivalent of one cycle per day on each one. Demonstrating Electric Vehicle Grid Integration (EVGI) NREL internally funded work during the past two years and in the coming year that provides a foundation of research on vehicle-to-grid technologies, testing, and operations. A pilot renewable charging station and a demonstration PHEV with vehicle-to-grid has been created. Vehicle-to-grid-capable vehicles have been tested to existing grid integration standards. A bi-directional Level III fast-charge system is planned for installation at NREL in fiscal year 2011 quarter one. This system will offer a facility for understanding the attributes and grid impacts of fast-charge systems. Figure 41 depicts the combination of PV providing shade for vehicles and energy to the microgrid along with vehicle energy management portals. The portals show a combination of Level III (20-250 kW) and Level II (0-20 kW) access points (as indicated). Systems optimization analysis is needed to understand the scalability needed to satisfy several vehicles and up to thousands of vehicles. We recommend further investigation to determine the attributes of this system relative to available electricity grid distribution systems and the microgrid operations.

92
Figure 41. Scalable renewable PEV energy management component for microgrids (Source: NREL)
With the added benefits of providing premium covered parking, these systems will add to the on-site renewable energy generation without occupying rooftops. Expected Issues Several issues remain to be addressed, including:
Capital and installation costs of EVSE. Many EVSE manufacturers have published MSRPs for their various products, but great uncertainties in the costs of permitting and installation contracts remain. These factors will vary significantly depending on the municipality and contractor.
Circuit supply upgrade requirements. Building codes are quite different between locations. Electrical infrastructure, or “behind the wall”, of EVSE locations may require as little as no development, or as much as total rework, depending on the age and location of a facility and power availability (such as phases, voltages, amperage).
Dedicated parking spots. Consumer studies indicate that PEV owners/operators will want to charge their vehicles often and EVSE may be in high demand on the base (Cromie, Neenan, and Wheat 2010). The need for EVSE may or may not align with the desire for dedicated parking and the needs of the microgrid.
Electricity accounting differences between civilian and military vehicles. If commuter vehicles are viewed as a resource to the base’s grid operations, they must be provided with electricity. The rates at which charges are made available to civilian owners of these vehicles will be at the administration’s discretion and will likely be different than the rates for GSA vehicles. Additionally, a non-utility is restricted from reselling electricity, but can recoup expenses by establishing fees for parking or time at the charger.
Fleet vehicle turnover rates with respect to payback period of grid services. GSA vehicles are typically replaced within a few years and only heavy duty vehicles are kept for longer than 10 years, but some of the first waves of PEVs will have incremental costs that require longer payback periods based on fuel savings alone (U.S. GSA 2010). Fortunately, battery price forecasts indicate that incremental costs will quickly drop,

93
although the business case will depend on alternative functions (such as grid integration) early on.
Feasibility and safety of bi-directional power flow in practice. Today, power is predominantly delivered to the grid by utility-sanctioned generators and distributed renewables, such as residential wind and solar, but requires sophisticated synchronization via highly refined power electronics. NREL tests indicate that bi-directional power exchange from vehicles is feasible, but wide-scale implementation has yet to be demonstrated.
Secure data collection, handling, and communication. PEV grid integration can boost military security by enhancing the reliability of their grid. However, a large amount of information will be exchanged in the smart microgrid, which enables these abilities and must be transmitted, processed, and stored securely. Precedents have been established, but with new equipment—or new uses of established equipment—comes new risk.
Conclusions PEVs present opportunities to reduce fuel costs and utility bills, while meeting alternative fuel requirements. Their dual roles in efficient transportation and utility assets bolster a reduction in petroleum consumption and an increase in local fuel sources, especially renewable energy. NREL found that a military base can effectively use these vehicles in many, if not all, vehicle charge control scenarios to achieve internal and federal goals, resulting in a more robust transportation and electricity system. However, these results are highly dependent on the assumptions, of which the demand load is the most questionable. Any further progress will require proper data collection from utility meters on base. Most notably, the PEVs exhibited the largest potential for enhanced grid efficiency when utilized in proper coordination, and/or with bi-directional charge capability. It was found that 75 motor pool vehicles did not provide enough benefit for justified investment in electric trucks in a controlled charge-only configuration on the microgrid (Scenario 2), but vehicle-to-grid (Scenario 3) changes the story significantly by effectively supplying storage with twice the power and energy ranges. In both normal and emergency situations, the relatively continuous storage assets can assist the microgrid, providing large buffers and delaying drastic changes in voltage and frequency. This could help bolster the reliability of controls in the microgrid system. Still, arrival and departure times of vehicles coincide with large changes in the assumed demand loads. If the actual base loads turn out in reality to be similar, it may become necessary to institute staggered schedules for additional grid stability. Battery technology that can serve both transportation and grid services needs should become highly valued. At this time it is unclear what the specifications for energy storage providing grid services should be, and if it is consistent with transportation application specifications. It is also unclear whether energy storage that is only used 10% of the time in a transportation application should be used both for transportation and grid services during a single life span or as a transportation resource in a first life and then as a grid resource in a second life.

94
The greatest technical risks to project execution are the challenges working with multiple vendors for components and the integration and interoperability hurdles that will exist in making these components a working system. Standards for communication to the vehicles are currently under development and will likely be ready fairly soon. There are potential safety risks in working with Lithium-ion battery technology and high power electrical systems. Key technology areas required to support vehicle-to-grid include:
• Networked building energy management systems • Secure communication methods with plug-in electric vehicles • Renewable energy system dynamic data collection and forecasting • Off-board bi-directional vehicle energy storage management electronics (combination
inverter/converter) • Energy efficiency-focused micro-grid controls • Predictive demand reduction algorithms under utility-tied operations for reducing costs • Studies on the battery life implications of vehicle-to-grid applications.
Recommendations for Vehicle-to-Grid Vehicle-to-grid project recommendations should be viewed as complementary to projects suggested in the microgrid section of this report. In addition, the areas discussed in this section would benefit from SERDP or ESTCP support and funding. To support vehicle-to-grid progress, experts recommend:
• Performing studies to characterize the current utilization of both civilian and military vehicles on base to improve estimates and modeling of the benefits of vehicle-to-grid integration with a base microgrid. Investigate strategies to increase availability of future PEVs to a base microgrid under normal and emergency conditions. This would permit more accurate analysis of potential energy storage and grid regulation, as well as improved economic analysis of vehicle-to-grid integration.
• Evaluating conductive and inductive charging methods and determining the benefits and detriments of each. As a part of this, sponsor technology development that supports bi-directional power flow.
• Investigating cost-reduction potential of evolving technologies. • Studying the interactions of major vehicle-to-grid subsystems, including vehicle to
EVSE, vehicle-to-grid operations, and EVSE to the grid and to individual buildings, to achieve a better understanding of potential problems and areas of improvement. Evaluate the interface and operability between electric vehicles and microgrids. Support demonstration projects integrating vehicle to grid with renewable energy technologies and/or with fast charge infrastructure.
• Developing strategies for collecting and integrating vehicle, buildings, renewable energy, and base grid dynamic operational data.
• Creating methods of monitoring and costing energy for both employee- and facility-owned vehicles, for the benefit of both.
• Evaluating applications of electric vehicles, including both light and heavy systems.

95
• Investigating different vehicle operating scenarios to determine the effect on cost, fuel use, reliability, availability, power quality, and emissions.
• Demonstrating the use of automotive batteries in grid support applications, which will ideally increase scale of battery use and reduce the cost of advanced batteries.
• Developing and testing cyber security enhancements. Because the security of data, communications systems, and the network infrastructure is of high importance for an electrical grid or microgrid, it is critical to develop methods that can attack existing systems and test that security. A breach of security could lead to vehicle systems being hacked into and remotely controlled for destructive purposes. One possible testing strategy is to invite people to invent ways to hack into test systems and use that as a means of improving security.
• Another important area of future work is the necessity to support planning studies on distribution system upgrades to accommodate secure communications. Considering additional vehicles for vehicle-to-grid applications.
• The study cited here evaluated a small subset of available vehicles. Additional commercial fleet vehicles are available for hybridizing, such as fire trucks, refuse haulers, mobile multi-purpose generator vehicles, and school buses.

96
Wind Energy Technology and Buildings
NREL was tasked by SERDP to investigate the costs and feasibility of using building integrated wind turbines—also known as wind in the built environment turbines—to offset building energy loads across DOD facilities. To complete that task, this section examines:
• Wind turbine technologies and sizes • Wind resource assessment tools and resources • Site investigation • Characteristics of wind in the built environment and on rooftops • Estimated energy and economic performance in the built environment and on
rooftops • Case studies of wind in the built environment and on rooftops • Small wind turbines for rooftops • Economic performance of small, mid-size, and large turbines
Wind Resource Assessment Tools and Resources Wind Technology Overview Jump-started by the dual energy crises of the 1970s, the use of wind turbine technology has been steadily evolving. Over the last few decades, significant research and development and operation and maintenance (O&M) efforts have been aimed at driving down the costs of using wind energy to generate electricity. There are several distinct wind turbine size ranges, each associated with different market segments.
Table 15. Turbine sizes and markets in the United States
Turbine Size Range Target Market 2009 Installed Megawatts
1–100 kilowatts (kW) Residential, small business, small farm/ranch, individual building
20
100–1,000 kW Community, mid-size business, large farm/ranch
460
1000–3,000 kW Utilities, wind farms, large businesses
9,504
2000–6,000 kW Offshore wind farms 0 There are two types of wind turbines used to generate electricity: horizontal axis wind turbines (HAWT) and vertical axis wind turbines (VAWT). Generally speaking, HAWT are the most tried and true of the wind turbine technologies. Although there are several varieties of VAWT, they are less efficient than HAWT, cost more to fabricate, have greater controls issues, and drive up O&M costs. There are very few VAWT installed. Wind turbine generators convert wind energy into electricity via a direct drive generator or a planetary gearbox. These generators produce either direct current (DC) or “wild or variable

97
frequency” alternating current (AC) electricity. DC electricity is converted to grid-quality AC with an inverter. Wild AC has a fluctuating frequency (utilities provide electricity at a frequency of 60 hertz with very little variation), so it is first converted to DC and then inverted back to grid-quality AC. For some small turbines, the inverter is an integral part of the purchased unit, while for others, a separate inverter must be purchased and installed. HAWT are usually placed upwind of the turbine tower. These generators need to be directed into the wind with a yaw mechanism—typically, a passive yaw mechanism (similar to a wind vane) for a small turbine and an active yaw mechanism for a large wind turbine. There are both upwind and downwind turbines on the market in both sizes. Small Wind Turbines Small wind turbines can vary widely in size and shape. HAWT that have been independently tested and/or certified are recommended—they represent the best value among wind turbine technologies. Towers can range from 10 m for a 1- to 3-kW turbine to 40 m for a 100-kW turbine. Rotor diameters can range from 2 m for a 1-kW turbine to 21 m for a 100-kW turbine. The turbines are usually tied into a low voltage distribution line or, for turbines with fewer than 10 kW, into a service panel in a building. The electricity produced is on the facility owner’s side of the utility meter and used to offset or reduce the number of kilowatt-hours (kWh) purchased from the utility. Figure 42 shows the major components of a grid-tied wind energy system. In addition to a wind turbine, small grid-connected wind systems include the following components:
Inverters that convert DC or wild AC to grid-quality AC and provide important safety, monitoring, and control functions
Safety equipment such as disconnect switches, grounding equipment, and surge protection
Meters and instrumentation

98
Figure 42. Schematic diagram of a grid-tied wind energy system (Source: NREL)
Mid-size Wind Turbines Mid-size wind turbines can vary widely in size, ranging from 100 to 1000 kilowatts. Towers can range from 30 m for a 100-kW turbine to 80 m for a 1000-kW (1 MW) turbine. Rotor diameters can range from 21 m for 100-kW turbines to 58 m for a 1000-kW turbine. These turbines generally produce wild AC electricity, so it is converted to DC, then inverted back to grid-quality AC. The turbines are usually tied into a 13-, 23-, or 34- kilovolt, three-phase distribution line. The turbines are typically 480 to 690 volt alternating current (VAC) and a transformer is used to bring them up to the local distribution voltage. The electricity produced is on the facility owner’s side of the utility meter and used to offset or reduce the number of kWh purchased from the utility. Large Wind Turbines The size of utility-scale wind turbines has increased continuously over the past two decades. Towers have become taller and rotor diameters have increased, both serving to drive down the cost of energy (COE) generated by these turbines. Currently, for on-shore applications, these turbines range from 1,000 to 3,000 kW (1 to 3 MW). The towers range from 80 to 120 m and the rotors range from 58 to 115 m, which means that individual blades are nearly 60 m (or about 200 ft) long. Blades may continue to increase in size, but the challenges of transporting them on roads with sharp curves, through intersections with 90-degree turns, through tunnels, and over bridges are enormous and may become a limiting factor.

99
Large turbines have sophisticated controls to pitch or furl the blades and determine how much wind strikes the rotor. Electrical interconnection for these turbines may be similar to electrical interconnection for mid-size turbines. For military bases with loads in the 40- to 80-MW range, 10 to 20 MW of wind could be connected to the distribution side of the base to offset utility electricity purchases. Large wind turbines are designed for wind farm applications. In these cases, the turbines are typically connected together and fed into a dedicated substation, which steps the system voltage up to transmission level voltages such as 69 or 138 kilovolts. A number of offshore wind projects using large wind turbines are in the planning stages in the United States, though none have been built to date. The permitting authorities and the rules and regulations they will enforce have been in the realignment and vetting stage throughout most of this decade. As policy and practice firm up, offshore wind farms will follow at some point during the next decade. Currently, there are over 2,400 MW of offshore wind projects in various stages of permitting. There are over 2,100 MW of offshore wind turbines installed around the globe, primarily in the waters surrounding Europe. Generally speaking, offshore wind is smoother (more laminar) and less turbulent than onshore winds. Vertical wind shear factors are lower, which means that offshore towers do not need to be as high as onshore towers. The towers for offshore wind are in the 60- to 100-m range. The rotor diameters range from 58 to 132 m. Wind Turbines for the Built Environment There have been relatively few turbines designed and tested for use on rooftops in the built environment. Generally, small turbines are deemed suitable because they are small and will fit on the roof or other available space. One manufacturer that had performed considerable research on turbine design and optimization in the rooftop market has suspended its product line to focus on other non-wind market products. There is not enough analyzed wind data from rooftops to fully characterize the turbulence and thrust forces necessary to create reliable turbine design codes (as has been done for larger turbines). There are many manufacturer claims about the suitability of their turbines for rooftops and the built environment, but there is very little testing and data to support these claims. Certification standards have not yet been developed for rooftop turbines. Rooftops and the built environment demand very robust turbine designs and components. It is recommended that turbines only be installed on buildings designed for the added wind and torque loads they will put on the building. However, exact load amounts have not been well-researched to date. Impact on the building structure and components (concrete, beams, screws, bolts, etc.) of the turbine and the vibration inherent in its mechanical motions and energy transformations are not well understood. Wind Assessment Parameters Buildings are often viewed as potential sites for wind turbine installation. The rule of thumb with wind energy is to determine the extent of the wind resource and the likelihood of an

100
economically successful project before investing in and installing a wind turbine. The type of wind assessment undertaken depends upon the expected size and cost of the wind turbine(s). The following paragraphs outline the range of assessment activities and costs for different sizes of turbines and projects. Utility-scale turbine projects are well-documented and more consistent in practice. For small turbine projects in the built environment, wind assessment practices are much less consistent. On-site Data Collection Large wind farms or utility-scale turbines (1- to 3-MW) require substantial financial investments. Ensuring viable economics is critical. These projects typically involve a year-long assessment with a 60- to 80-m meteorological (met) tower that is fully instrumented with anemometers and wind vanes at several heights. Costs for a single meteorological tower—which include data collection, analysis, installation, and takedown— may range from $50,000 to $80,000. A wind farm might require 2 to 10 towers. Other wind resources assessment tools—such as sonic detection and ranging (SODAR) or light detection and ranging (LIDAR) technologies—are used to augment met tower assessments. They provide wind data up to the 100- to 200-m range.
Figure 43. Wind data collection regions associated with met towers, SODAR and LIDAR (Courtesy
of Second Wind, reprinted with permission)
For mid-sized wind turbines in the 100- to 1000-kW range, using a smaller met tower (30 to 50 m) or wind data purchased from professional wind resource assessment companies can be a more economic, prudent approach. With a purchased data set, the timeline for resource investigation can be shortened significantly. Costs for these approaches typically range from $5,000 to 50,000. Small turbines (1 to100 kW) are a smaller investment and are suitable for remote outposts, rural residences and businesses, suburban residences and businesses, and even the urban/built environment. For these projects, assessment strategies are simpler, timelines are shorter, and costs are lower. Existing resources and purchased data sets can be used in the assessment process.

101
Wind Maps All wind resource investigations should begin with available wind resource maps. The Wind Powering America Web site (www.windpoweringamerica.gov) is a good place to start. The 80-Meter Wind Resource Map found there shows the predicted mean annual wind speeds across the United States at an 80-m height (at a spatial resolution of 2.5 km that is interpolated to a finer scale). The clickable map takes users to similar maps for each individual state.
Figure 44. 80-m wind speed map of the United States (Source: U.S. DOE 2010)
Maps vary state-by-state, but some have a variety of wind maps available for different applications and different turbine sizes. Massachusetts, for example, also has a 50-m wind speed map available. The state maps may be of even higher resolution visually for easier use or represent wind speeds at even higher heights. There are a number of state wind working groups that have put together very useful wind resource information on their Web sites. Texas, for example, offers a wind map detailed by county (http://www.infinitepower.org/reswind.htm). Wind developers use wind resource maps to determine where to begin looking for good wind sites. Residential, urban, or small business owners might use the state wind maps in their preliminary resource assessments. The wind resource maps were created using atmospheric science and mathematical techniques to essentially fill in the missing wind speed data between existing met towers scattered throughout the country for different applications (and at different heights with different data sets and resolutions). The cumulative wind and weather data sets associated with these met towers represents the next level of available information that can help to more accurately define wind resources.

102
Wind Data Sets/Sources There are a variety of wind data sources available publicly. These include the Wind Energy Resource Atlas of the United States (http://rredc.nrel.gov/wind/pubs/atlas/),which serves as an archive of wind data, and the National Climatic Data Center (http://www.ncdc.noaa.gov/oa/ncdc.html) operated by the National Oceanographic and Atmospheric Administration (NOAA). The Climate Center operated by Utah State University (http://climate.usurf.usu.edu/index.php) is a straightforward source of existing weather data culminated from a variety of available resources. From the home page, the user can access a variety of weather data sources, including:
COOP – Cooperative Observer Network Data
GSOD – Global Daily Weather Data
AWOS – Automated Weather Observing Stations
CRN – Climate Reference Network Data
The stations collect different weather parameters, so the usefulness of the data will vary. The comprehensiveness of the data sets also varies widely. There are additional stations, such as Automated Surface Stations, that provide data available through other sources. Commercial companies also offer wind resource maps or assessment software for registered users on a paid basis. Several of these companies are listed in the references section in the appendix. Computational Fluid Dynamic Modeling Modern computational fluid dynamics (CFD) modeling techniques represent the leading edge in wind assessment and micrositing. They are used in the wind industry to help more accurately characterize the wind regime, particularly in complex terrain. Using a combination of boundary layer theory and stream flow equations (such as the Navier-Stokes equation), CFD analysis attempts to fully characterize the movement of air. Built environments present a very complex terrain; endless series of wind flow channels (streets and railways) weave in both grid-like and more random directions through tall structures with different orientations. CFD, while not perfect in capturing all of the complexities of fluid flow, does provide a very good analysis of the impacts of certain kinds of structures on flowing fluids. The analysis can be more expensive than a data set purchase, but is typically less expensive than a small met tower installation. The array of factors included in the model determines the pricing. The analysis may focus only the rooftop of the building itself, its structures, and wind flow directions. A more detailed analysis might characterize the wind flows through the city or as impacted by adjacent buildings. The cost for CFD analysis can range from $5,000 to $20,000 for a single site. Wind Power The amount of wind varies with season, time of day, and weather events. Collected wind data focuses on two primary considerations: average annual wind speed and a frequency distribution of the wind at various speeds. The wind speed at any given time determines the amount of power

103
available in the wind and, subsequently, the power that can be captured using a wind turbine generator.
The power available in the wind is given by the equation: P = A ρ V3/2
where
P = power of the wind [watts]
A = windswept area of the rotor (blades) = πD2/4 = πr2 [m2] (π r2 [3.28 ft2])
ρ = density of the air [kg/m3] (2.2 lb/3.28 ft3) (at sea level at 15°C)
V = velocity of the wind [m/s] (3.28 ft/sec).
As shown, wind power is proportional to velocity cubed (V3). This is noteworthy because if wind velocity is doubled, wind power increases by a factor of eight (23 = 8)! Consequently, small differences in average speed cause significant differences in energy production. Therefore, examining ways to increase the wind velocity at different sites should be considered. Normally, the easiest way to accomplish this is to increase the height of the tower. Another approach is micrositing the wind turbine to avoid impediments (hills, trees, buildings, etc.) to wind flow that cause turbulence and reduce wind velocities. For applications such as rooftop locations or sites with potential for reduced wind flow, the corollary of wind power increasing by the cube of wind velocity factor increase should be kept in mind. That is, as the wind velocity decreases, the wind power decreases as the cube of the wind velocity factor decreases. In other words, if the wind velocity is halved (i.e. half of the original velocity), then the wind power will be reduced by a factor of eight ([1/2]3 = 1/8). The negative effect of lower wind speeds has profound implications on important considerations such as annual energy production of the wind turbine(s).
The equation for determining the power from a wind turbine is:
PWT = Cp A ρ V3/2
where
PWT = power of the wind turbine [watts]
Cp = unitless power conversion coefficient (efficiency).
The power coefficient (Cp ) measures the efficiency of the wind turbine, which has a theoretical maximum of 0.593 (59.3%). The theoretical maximum conversion efficiency is also known as the Betz Limit. Figure 45 compares the power coefficients for different types of wind turbines. Typical values range from 0.2 to 0.45.

104
Figure 45. Comparison of aerodynamic efficiencies of common types of wind turbines (Source:
NREL)
Since power increases as the cube of wind speed, much of the average power available to a wind turbine comes in short bursts during periods of high wind speed. It is only in high winds that the turbine produces at rated power. To capture such bursts, the wind turbine needs a large enough generator and a strong gearbox that go underutilized most of the time. The average power produced by a wind turbine over time will be a fraction of the peak, or rated power, the machine is capable of delivering. Typical utilization rates, or capacity factor, will be 10 to 25% for small wind turbines, though typically higher for utility-scale wind turbines. Vertical Wind Shear Vertical wind shear is defined as the change in wind speed with the change in height. Typically, wind speed increases as the height above ground increases. This variation of wind speed with elevation is called the vertical profile of the wind speed, or vertical wind shear. In wind turbine engineering, the calculation of vertical wind shear is an important design parameter, since it

105
directly determines the productivity of a wind turbine on a tower of certain height. It can also strongly influence the lifetime of a turbine rotor blade, specifically for larger wind turbines. Analysts typically use one of two mathematical relations to characterize the measured wind shear profile:
Logarithmic profile, or log law Power law profile, or power law.
For this report, the log law approach is used since many of the references characterizing the topography of the landscape use typical log law descriptors. Surface roughness, sometimes referred to as surface roughness length, describes the conditions of the ground and its expected impact on wind flows. The surface roughness parameter is calculated using the existing wind speed data at various heights. The resultant surface roughness characterization may not always match the actual surface conditions, but it serves as a descriptor of the vertical wind shear profile. Resultant surface roughness lengths have been calculated for various surface conditions and are shown in Table 16 below. The terrain description concerns the ground conditions and features that result in the different roughness lengths calculated in the right-hand column. Smooth surfaces such as calm, open sea have very low wind shear values, such as 0.0002 m (0.000656 ft), while agricultural crop land is typically a little higher at 0.05 m (0.645 ft) of surface roughness length. Areas with a few trees have surface roughness of about 0.1 m (0.328 ft) while cities with tall buildings would be about 3.0 m (9.84 ft).
Table 16. Surface roughness lengths and descriptions
Terrain Description Surface Roughness
Very smooth, ice or mud 0.00001 Calm, open sea 0.0002 Blown sea 0.0005 Snow surface 0.003 Lawn grass 0.008
Rough pasture 0.01
Fallow field 0,03
Crops 0.05
Few trees 0.10
Many trees, few buildings 0.25
Forest and woodlands 0.50
Suburbs 1.5
Center of cities with tall buildings 3.00

106
The application of surface roughness lengths can be seen in Figure 46 below. As shown in the graph, at a height of 100 m (328 ft) above the ground, the impact of surface roughness is negated and the wind speeds are all assumed to be 10 meters per second (m/s) (22 miles per hour (mph)). With low surface roughness (designated by z0 = 0.00001 m), the wind speed decreases minimally, moving closer to the ground such that even as low as 5 m (16.4 ft) above the ground, the wind speed is 8 m/s (17.6 mph). It has only decreased 20% despite a 95% reduction in height above the ground. With high surface roughness associated with cities and high buildings (designated by z0 = 3 m or 9.8 ft), the wind speed decreases by 20% with only a 50% reduction in height above the ground, and the wind speed is reduced by 50% at about18 m (about 59 ft) above the ground, or a reduction in height of 82%. This is the phenomena at play in analyzing the wind regime on top of many buildings.
Figure 46. Surface roughness impacts on wind speed vs. height using the logarithmic law
approach (Courtesy of Tom Lambert at Mistaya Engineering Inc., reprinted with permission)
Characteristics of Wind in the Built Environment and on Rooftops Wind energy, like most fields of energy, points decidedly toward least cost of electricity generation, balanced by the other available options at a given location. The result is that wind turbines for making electricity are typically considered in windy, rural environments that have a significant wind resource, favorable terrain (typically flat or rolling hills with relatively few significant surface obstructions), and competitive economics dictated by alternatives (utility bulk power for wind farms, stand-alone diesel, or grid extension for wind turbines less than 100 kW). The urban environment presents challenges that must be considered and overcome before the decision to install a wind turbine in such an environment takes place. These challenges are site- and building-specific and cannot be overcome effectively with a generalized approach or calculations. One of the challenges of wind in the built environment (which is not obvious when standing on top of a building of four stories or more) is that the ground level for surface roughness has

107
essentially been moved from the ground to some level much closer to the building top. This effect is shown in the sketch in Figure 47. The black arrows are wind velocity vectors with the length corresponding roughly to wind speed. On the left, the vertical wind shear profile for a rural area is illustrated. It shows a wind speed of 0.0 m/s or mph at the ground level, indicating that wind speeds increase going higher. It has a smooth vertical wind shear profile as the arrows gradually get longer with increased height above the ground. The figure on the right, designated as Roughness 2, illustrates the impact of an uneven building profile across an urban landscape. The study on building-mounted wind turbines (Dutton 2005) assumed that the ground reference Z0, ref, with wind speeds equivalent to 0.0 was moved up to height d, defined as 0.75 (or 75%) of the average height of the buildings in the area.
Figure 47. Rural surface roughness on the left and urban surface roughness on the right
(Courtesy of STFC, reprinted with permission) The three graphs below in Figure 48 illustrate the impact of added surface roughness when moving from typical rural sites (graph a) to the suburban locations (graph b) to urban locations (graph c).

108
Figure 48. Wind velocity profiles for rural, suburban and urban settings (Courtesy of STFC,
reprinted with permission)
The three-dimensional model of a building Figure 49 illustrates the impact of the building itself in interrupting otherwise free-flowing wind. As shown, the moving air diverts upward over around the building. The wind also swirls in eddies upon itself in the lower windward regions. The building at right depicts a two-dimensional flow model that focuses on the wind path of a slice of air going over the middle of the building directly perpendicular to the face of the building. Following the color gradient (blue is slower, red is faster), as the wind approaches the building from the left, the wind that goes up and over the building begins to accelerate as it approaches the top edge. This is illustrated by the vector arrows changing color from dark blue to light blue to green. The wind acceleration continues well above the building as the yellow arrows indicate. The sharp contrast of yellow to light blue over the top of the building indicates the separation of flow. All vectors above this region have continued acceleration, while everything below shows both deceleration and even some small amounts of reverse flow (wind flowing to the left at the top of the building). This reverse flow effect is known as an eddy. This graphic shows why rooftop wind turbines generally have had a history of underperformance. It also suggests that siting a wind turbine as high as possible above the roof surface is probably the most prudent course of action from an energy production perspective. It must also be considered that the wind comes from multiple directions, so the installation of turbines to maximize acceleration from one direction will lead to reduced or no production from other directions.
Typical velocity profiles showing the relative effect of the frictional slowing of air in (a) rural location (b) suburban location and (c) city center location. Notice the wind speed decreases from ~5.0 m/s at 50 m in (a) to ~4.1 m/s in (b) to ~3.0 m/s in (c)

109
Figure 49. CFD models of wind flow over and around buildings; 3-dimensional at left and 2-dimensional at right (Courtesy of PhD research, Sander Mertens TU Delft, reprinted with
permission)
Tops of building have very turbulent conditions, with winds of rapidly varying speeds and directions. Wind turbines generally perform better with smoother winds and more homogenous directions. As can been seen in Figure 49, the wind conditions can vary widely from point to point on the surface of the roof even over a distance as small as a few meters (around 6 to 15 ft). Increasing the height above the roof of the building can also have a significant impact on wind speeds and turbulence. Lastly, changing the direction from which the wind approaches the building may completely change any of the observations from the location on the surface of the roof. The roof surface becomes more complex with the addition of penthouse structures; heating, ventilating, and air conditioning (HVAC) equipment; varying roof shapes (such as pitched or multi-surface/multi-angled); and non-symmetrical architectural or mechanical features (such as clerestory windows). The addition of similar features and complexity from other buildings in the vicinity exacerbates an already complex resource picture. This discussion should make it clear that it is nearly impossible to predict the wind resource on top of a particular building. The complexity of the terrain as well as the variability of the conditions and wind paths is such that the patterns are challenging to discern. Measuring the wind resource on top of the building of interest is the only prudent approach to follow. The two-dimensional flow model in Figure 49 clearly shows the eddy below the flow separation line that forms as air moves up and over a building. This is critical since the installation of a turbine will need to be above the flow separation line to ensure that it is in a good wind flow region. It should be noted that the winds speeds above the flow separation line are typically accelerated relative to the free wind speed. Another interesting viewpoint on the variation of wind in the rooftop environment can be seen graphically in the color-coded CFD modeling shown in Figure 50. The colored models illustrate the wind speed variation (i.e. turbulence) moving in 10-ft (3-m) increments above the roof plane. The point to note in the first model (a) (at 10 ft above the roof plane) is that the wind speed can vary by 60% (45% below to 15% above the mean wind speed). In the final model (e) (at 50 ft

110
above the roof) the wind variation begins to smooth out and there is roughly only a 15% difference in wind speeds in the same plane at 50 ft.
Figure 50. Horizontal velocity contours, south wind direction (Courtesy of CPP Wind Engineering,
reprinted with permission)
It is also important to note that this wind profile is only applicable when wind comes in at angle that is perpendicular to the south face of building. When the wind comes in over the corner from the southeast or southwest direction, turbulence will increase and wind speeds may increase or decrease at different points above the roof (as shown in Table 17). The variation (from most

111
accelerated to most decelerated) in the plane 20 ft above the roof is 37%. The impact of the roof surface structure and obstructions will vary depending upon the direction from which the wind comes into the roof.
Table 17. Rooftop wind velocity profiles at 20 ft (6.1 m) above the roof
Wind Direction Umean/Uref Location
1 2 3 4 5 NE 1.02 1.05 0.66 0.66 1.02 S 0.78 0.79 0.78 0.85 0.96 SSW 0.99 1.02 1.00 0.93 0.90 WSW 1.03 0.97 0.83 0.95 0.96 W 0.67 0.67 0.80 0.86 0.99 WNW 1.00 0.97 0.96 0.97 1.06 NW 1.01 0.94 0.96 0.99 1.02 NNW 1.02 0.89 0.84 0.86 0.88
Economics of Rooftop Wind Systems Several wind turbines were selected for economic modeling. The product specification sheets can be found in Appendix B. There are dozens of wind turbines that could have been chosen. However, very few wind turbines are designed for the rooftop environment. Table 18 lists specifications for the selected turbines.
Table 18. Sample wind turbine specifications
Parameter Skystream 3.7 Urban Green 4 kW Broadstar Aerocam 1
Rated Capacity 2.4 kW 4 kw 11 kw
Rotor Diameter 3.7 m (12 ft) 3 m (9.8 ft) by 4.4 m (14.4 ft)
4.8 m (16 ft) by 4.3 m (14ft)
Weight 77 kg (170 lb) 444 kg
Swept Area 10.87 m (115.7 ft) 12.5 m 20.6 m (224 ft)
Tower Height Variable 7 m 4.6m (15 ft)
Type Downwind staff regulated Permanent magnet
Maximum Tip Speed 66 m/s (216.5 ft/s) Cut-in Wind Speed 3.5 m/s (8 mph) 3.5 m/s 2.7 m/s (6 mph)
Cut-out Wind Speed 25 m/s Failsafe mechanical braking
Rated Wind Speed 13 m/s (29 mph) 12 m/s Survival Wind Speed 63 m/s (140 mph) 50 m/s (110 mph)
Warranty 5 year limited warranty

112
Procurement and O&M costs were calculated by averaging data from three sources:
2010 AWEA Small Wind Turbine Global Market Study (AWEA 2010)
Small Wind Study Results presented at California’s Emerging Renewables Program (ERP) workshop in 2009 (KEMA 2009)
Wind at Community and Building/Industrial Scale presented at the California Energy Commission Integrated Energy Policy Report Workshop in 2008 (van Dam, et al. 2008)
So few wind turbines are installed on buildings that it is very difficult to obtain accurate installation quotes. Installation costs for conventional ground-mounted systems were taken from a case study and tripled to reflect the added cost of designing and installing on a rooftop. Siting wind turbines on rooftops is difficult, and is complicated all the more when the roof has not been specifically designed for this sort of physical, mechanical and electrical load. It is anticipated that only a cash purchase from appropriations or energy project budget would be necessary to purchase and install the turbine(s). Methodology – Life Cycle Cost Approach Life cycle cost analysis is conducted using the economic assumptions and methods of regulation 10 CFR 436 (GPO 2010). The Building Life Cycle Cost software was developed by the National Institute of Standards (NIST) to analyze the life cycle cost of energy and water efficiency and conservation projects at federal facilities (U.S. DOE 2010). This same model can also be applied to analyze energy generation projects and it was used for this analysis. To provide effective decision-making information, the economic analyses focused on three project scenarios:
Business as usual (BAU) – no wind turbines
Three turbine models installed at 9.1 m (30 ft)
Three turbine models installed at 15.2 m (50 ft).
Three turbines were chosen for economic modeling, representing the high, low, and middle economic and energy production cases. It was assumed that five turbines of each type would be installed at the locations modeled on top of the roof and that each would be installed at 9.1 m (30 ft). A 25-year project life was chosen for economic modeling, though it is not clear that a turbine would last that long in this turbulent environment. The wind speed of 9.6 mph (4.3 m/s) was used for the economic modeling. As seen in Table 19, the simple payback for these turbines in this wind regime is quite high. The cost of generating energy (shown as COE) is estimated to be $0.33/kWh for the Skystream turbine, $0.38/kWh for the UrbanGreen 4-kW turbine and $3.04/kWh for the Broadstar AeroCam turbine. The Skystream-generated electricity is more than 2.6 times the national average ($0.12/kWh) for electricity (U.S. EIA 2010).
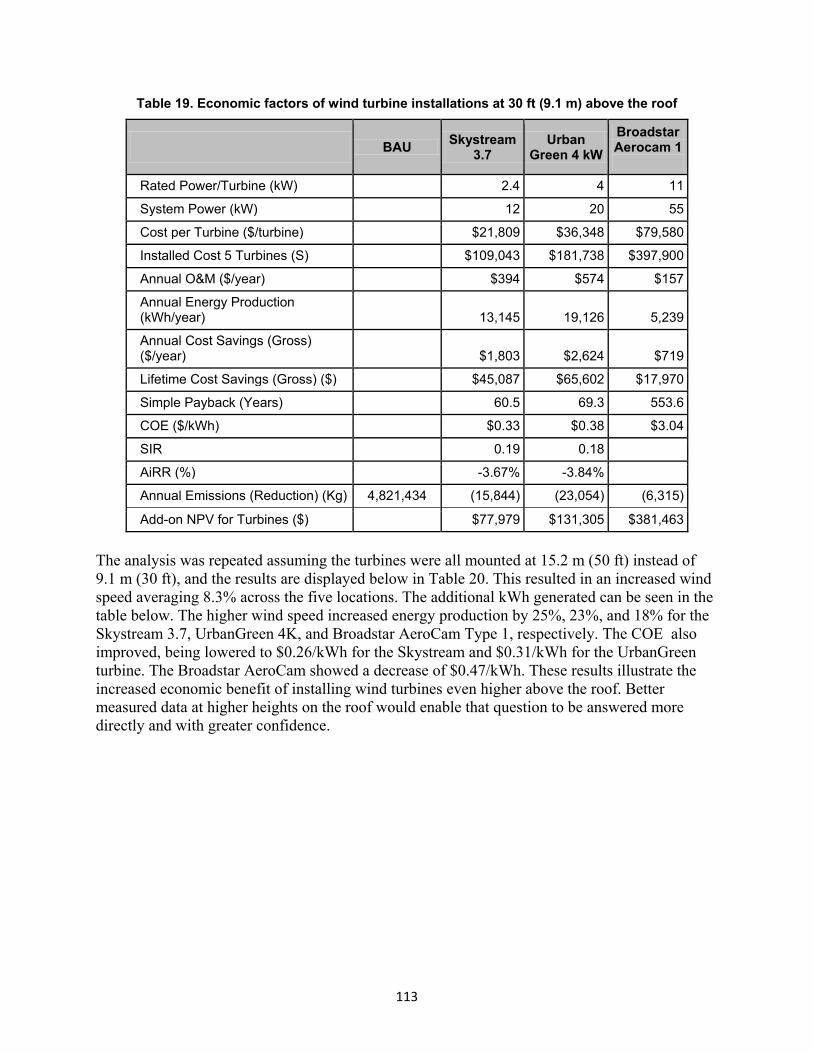
113
Table 19. Economic factors of wind turbine installations at 30 ft (9.1 m) above the roof
BAU Skystream
3.7 Urban
Green 4 kW
Broadstar Aerocam 1
Rated Power/Turbine (kW) 2.4 4 11
System Power (kW) 12 20 55
Cost per Turbine ($/turbine) $21,809 $36,348 $79,580
Installed Cost 5 Turbines (S) $109,043 $181,738 $397,900
Annual O&M ($/year) $394 $574 $157
Annual Energy Production (kWh/year) 13,145 19,126 5,239
Annual Cost Savings (Gross) ($/year) $1,803 $2,624 $719
Lifetime Cost Savings (Gross) ($) $45,087 $65,602 $17,970
Simple Payback (Years) 60.5 69.3 553.6
COE ($/kWh) $0.33 $0.38 $3.04
SIR 0.19 0.18
AiRR (%) -3.67% -3.84%
Annual Emissions (Reduction) (Kg) 4,821,434 (15,844) (23,054) (6,315)
Add-on NPV for Turbines ($) $77,979 $131,305 $381,463
The analysis was repeated assuming the turbines were all mounted at 15.2 m (50 ft) instead of 9.1 m (30 ft), and the results are displayed below in Table 20. This resulted in an increased wind speed averaging 8.3% across the five locations. The additional kWh generated can be seen in the table below. The higher wind speed increased energy production by 25%, 23%, and 18% for the Skystream 3.7, UrbanGreen 4K, and Broadstar AeroCam Type 1, respectively. The COE also improved, being lowered to $0.26/kWh for the Skystream and $0.31/kWh for the UrbanGreen turbine. The Broadstar AeroCam showed a decrease of $0.47/kWh. These results illustrate the increased economic benefit of installing wind turbines even higher above the roof. Better measured data at higher heights on the roof would enable that question to be answered more directly and with greater confidence.

114
Table 20. Economic factors of wind turbine installations at 15.2 m (50 ft) above the roof
BAU Skystream
3.7 Urban
Green 4 kW Broadstar Aerocam 1
Rated Power/Turbine (kW) 2.4 4 11
System Power (kW) 12 20 55
Cost per Turbine ($/turbine) $21,809 $36,348 $79,580
Installed Cost 5 Turbines (S) $109,043 $181,738 $397,900
Annual O&M ($/year) $494 $703 $186
Annual Energy Production (kWh/year) 16,447 23,433 6,195
Annual Cost Savings (Gross) ($/year) $2,261 $3,215 $850
Lifetime Cost Savings (Gross) ($) $56,516 $80,375 $21,249
Simple Payback (Years) 48.2 56.5 468.1
COE ($/kWh) $0.26 $0.31 $2,57
SIR 0.19 0.18
AiRR (%) -3.67% -3.84%
Annual Emissions (Reduction) (Kg) 4,821,434 (15,844) (23,054) (6,315)
Add-on NPV for Turbines ($) $77,979 $131,305 $381,463
Case Studies of Rooftop Wind Applications The Warwick Wind Trials represents one of the first comprehensive assessments of small wind turbines installed in rooftop applications (Encraft 2009). The study examined 26 building-mounted turbines across England. Highlights of their findings include:
Average wind speeds measured at all sites are lower than predicted by wind maps (generated similarly to U.S. wind maps). Wind speeds at 16 out of 26 sites were more than 40% lower than estimated.
When turbines are switched on (and imported energy is discounted) perfect in use capacity factors range from 0.29% to 16.54% and had an overall average of 4.15%.
Actual in use capacity factors average 0.85%.
The basic conclusions and lessons learned from the Warwick Wind Trials is that the wind regime on top of buildings is challenging to characterize well. The wind resource and wind turbine performance are generally significantly lower than expected. The most accurate and effective method of assessing the wind resource on top of a building is to install a met tower on the roof of the building as close to the intended locations of the wind turbine(s) as possible. Of course, this option is not always economically feasible or an effective use of project funds, especially as the investigation may show there is not enough wind to make it worthwhile. It takes time and effort

115
to install wind turbines on roofs correctly, and that may preclude it from having an economic payback. As this wind in the built environment discussion attempts to make clear, rooftop locations for wind turbines are challenging due to the many variable factors in the wind resource itself. Additional considerations include the turbine suitability for very turbulent environments, the development of mounting systems, building structural viability, and noise and vibration mitigation. Although there is no defined consensus, generally speaking, the small wind industry and the author of this report feel that installing a poorly performing or inadequately designed wind system on the top of a building in an urban environment is not a recommended course of action. Recommendations
DOD Annual Energy Load and Small Wind Turbines The DOD annual energy load for its facilities in FY 2009 was 205,000 billion British thermal units (Btu) or 60.1 million megawatt-hours (U.S. DOD 2010). This was a 1.3% increase over FY 2008. DOD spent $3.6 billion for this energy at a simple averaged cost (including demand charges, etc.) of $0.06/kWh. Assuming DOD wanted to meet the EPACT 2005 renewable energy goal of 7.5% renewable energy sources, the target production would be 4.5 million megawatt-hours per year. DOD currently pays $270 million each year for electricity, representing that 7.5%. The Skystream 2.4-kW turbine was the most economic model in the previous life cycle cost analysis. Assuming the Skystream produced 4,038 kWh per year (4.0 MWh per year) at every DOD site, it would take 1,115,891 Skystream wind turbines at an installed cost of $17.9 billion (assuming $16,000 per turbine) to generate 7.5% of DOD’s annual facilities energy. This means spending roughly five times the annual electricity budget to produce 7.5% of the electricity. And the O&M on over 1.1 million small turbines might be one-third to one-half of the cost offset due to wind energy production. This path is very uneconomic and not recommended. Other Options for Increasing Renewable Energy Production/Consumption for DOD Utility-scale wind turbines have much better economics, O&M, and energy performance than small wind turbines. NREL recommends that DOD examine the utility-scale option at the most feasible sites (good wind resource, minimal operations impact, reasonable distance to grid intertie, etc.) and then take steps to implement wind resources at those sites. An economic comparison of small, mid-size, and utility-scale turbines side-by-side helps to shed light on the futility of trying to generate a reasonable portion of DOD’s annual electricity via small wind. The annual energy target was 7.5% of DOD’s annual electricity usage, or 4.5 million megawatt-hours per year. Bear in mind, this analysis assumes well-sited, ground-mounted turbines in a Class 3 wind resource. The previous sections on small wind in the built environment or on top of buildings would yield fewer kWh per year and have longer paybacks than the small wind turbine results below.

116
Table 21. Comparison of small-, mid-, and large-size turbine numbers, production, and economics
Skystream – 2.4 kW NW100 – 100 kW Vestas V112 – 3000 kW
Annual Energy/Turbine (MWh/yr) 4.0 228
9,572
Number of Turbines 1,115,891 19,793 471
Installed Cost/Turbine ($/turbine) $16,000 $500,000
$7,800,000
Total Installed Cost ($) $17,854,255,572 $9,896.309.283 $3,671,966,671
Annual O&M ($/yr) $111,589,097 $49,481,546 $45,059,678
Net Savings/Year ($/yr) $158,410,903 $220,518,454 $224,940,323
Simple Payback (Years) 112.7 44.9 16.3
Table 21 illustrates that to generate 7.5% of its electricity from wind, DOD would need roughly 1.1 million small turbines, 19.8 thousand 100-kW turbines or 471 3-MW turbines, or about 1,300 megawatts of wind capacity, roughly the size of 2 to 3 large wind farms. Given the number of bases and amount of land DOD controls, it is worth investigating sites for some of these turbines to move DOD towards its energy goals. There are caveats to these results, including:
Some DOD sites will have better wind than Class 3 and the economics will improve as more kWh are generated per year and the simple payback years will decrease.
There will be sites with COE much higher than $0.06/kWh. At these sites, the economics will improve if the wind resource is Class 3 or above.
There will be DOD sites with less than Class 3 wind or with COE of less than $0.06/kWh. The economics of these sites will be more challenging and some may not be worth pursuing at the present time given current COE.
The greater opportunity, both in terms of economics and energy security, is utility-scale wind turbines electrically tied into the back-up or emergency power system for any particular DOD base. There is an additional cost for incorporating this type of system as it needs transfer switches, added controls, and load balancing equipment. Military bases already have back-up electricity generating systems to be deployed in times of attack, when security is threatened, or when the utility grid goes down. Most DOD emergency power systems are diesel-powered and rely on the on-site storage of fuel to provide fail-safe power in periods of attack or other power-outage scenarios. There is only so much fuel that can be safely and adequately stored (and cycled) on base. Adding in renewable energy systems, such as wind and solar, to the emergency power system will increase the robustness and resiliency of the emergency systems and lengthen the period of time the entire base can operate successfully without utility-supplied grid power or additional supplies of fuel.

117
In addition to enhancing the emergency power systems, wind energy can serve to lower the energy bills and consumption of the base load during the long periods in between the emergency applications.

118
Waste-to-Energy Technologies
Technology Overview The primary technologies used to convert waste to energy (WTE) are reviewed below. Mass Burn Mass burn is the most proven WTE technology using standard combustion techniques. Process Description Waste materials are delivered to the facility using collection trucks, each carrying 13-14 tons of municipal solid waste (MSW), or transfer trucks carrying approximately 24 tons of MSW each. The waste is tipped in an indoor receiving area and kept at a slight negative pressure to minimize the release of odors to the surrounding areas. An operator removes large appliances or other non-combustible materials and feeds the remaining material into a chute that feeds waste into a furnace. In the furnace, the MSW is combusted on a grate or in a fluidized bed, releasing energy in the form of heat. The gaseous and particulate products of the combustion reaction pass through several stages of emissions controls to meet U.S. Environmental Protection Agency (EPA) requirements.
Table 22. Average mass burn emissions (Source: Lauber 2006)
Pollutant Average Emission EPA Standard
Average Emission (percent of EPA
Standard) Unit
Dioxin/Furan, TEQ Basis 0.05 0.26 19.2% ng/dscm
Particulate Matter 4 24 16.7% mg/dscm
Sulfur Dioxide 6 30 20% ppmv
Nitrogen Oxides 170 180 94.4% ppmv
Hydrogen Chloride 10 25 40% ppmv
Mercury 0.01 0.08 12.5% mg/dscm
Cadmium 0.001 0.020 5% mg/dscm
Lead 0.02 0.20 10% mg/dscm
Carbon Monoxide 33 100 33.3% ppmv
The heat released from the combustion of the MSW is transferred to a boiler filled with water. The water is converted to steam, which drives a steam turbine to produce electricity, or is used for various heating applications.

119
Figure 51. Typical mass burn plant process diagram (Courtesy of ecomaine, reprinted with permission)
The facility collects revenue from two sources: tipping fees (per-ton fee collected for disposal of customers’ solid waste) and selling electricity or heat produced. Tipping fees are generally determined by local market conditions and are generally equivalent to the cost of burying the solid waste material in a landfill. The excess electricity, above that which is needed to operate the facility, can be sold to the grid under terms of a Power Purchase Agreement (PPA) negotiated with the local utility. Heat from the plant’s operations can also be sold under a similar agreement. Residual Material The mass burn process converts approximately 75% (by weight) of incoming MSW into energy. The remaining 25% is primarily bottom ash, which must be tested to ensure it contains less than the accepted amounts of hazardous materials. Once tested, it can be reused as a base material for construction projects or for daily landfill cover. Scale of Operation Mass burn facilities are usually operated with an available feedstock of 300 or greater tons per day (TPD). At lower feedstock levels, the facility should not be expected to generate enough revenue to offset fixed operating costs and the high capital costs associated with emissions control equipment. The conversion efficiency of a mass burn facility is approximately 550 kWh produced for each ton of MSW processed. For continuous operations, this results in .025 MW per TPD. The typical size for plants utilizing this technology is approximately 1,000 TPD feedstock consumed and 25 MW of electricity produced (Genivar et al. 2007).

120
Challenges To be economical, mass burn facility needs a relatively large waste stream to generate the tipping fees and energy sales revenues that will offset the high capital cost of emissions control equipment. The waste stream must also be secure for the life of the WTE facility. Local legislation, in the form of a “flow control” ordinance, may limit destinations for a municipality’s solid waste. This, and competition from other waste management resources, can impede the ability of a WTE facility to maintain the necessary waste volume for efficient operations. There is also a public perception opposing the mass burn process. This perspective, and proposed EPA policy revisions for incinerators, makes permitting mass burn facilities that use this technology difficult (Psomopoulos 2009). Active Projects There are 88 existing commercial facilities utilizing mass burn technology (or a similar system of combusting processed MSW in the form of refuse-derived fuel(RDF)) in operation in the United States. These facilities operate in 25 states and combust approximately 26.3 million tons of MSW per year (Psomopoulos 2009) (WTERT 2010). Planned Projects Covanta Corporation is negotiating with Aberdeen Proving Grounds to upgrade the existing 360-TPD facility (operated by the Northeast Maryland Solid Waste Authority under an Enhanced Use Lease). The new facility is proposed to be a 1200-TPD facility, receiving waste from neighboring Montgomery County (McGeown 2010). The National Renewable Energy Laboratory (NREL) is evaluating the possibility of a 3,300-TPD hybrid facility at Fort Bliss, Texas. The facility has the potential to generate approximately 65 MW of energy from waste and will be integrated with a concentrating solar power (CSP) facility. The CSP component will contribute to peak power and increase the total plant capacity to approximately 100 MW (Dahle 2010). Gasification Gasification is an emerging WTE technology in which fuel is heated in a limited-oxygen environment. Process Description Waste materials are delivered and stockpiled in a similar manner as mass burn systems. These facilities are typically smaller in scale and the rate of feedstock delivery is much smaller. Gasification facilities are also more likely to include sorting of feedstock to remove recyclable materials and help provide a more homogeneous fuel. Figure 52 illustrates the gasification chamber and process. The non-recyclable material is fed into the gasification chamber using an auger feed mechanism. The gasification chamber is similar to the furnace of a mass burn system. Fuel is either piled on a grate or partially suspended within a fluidized bed.
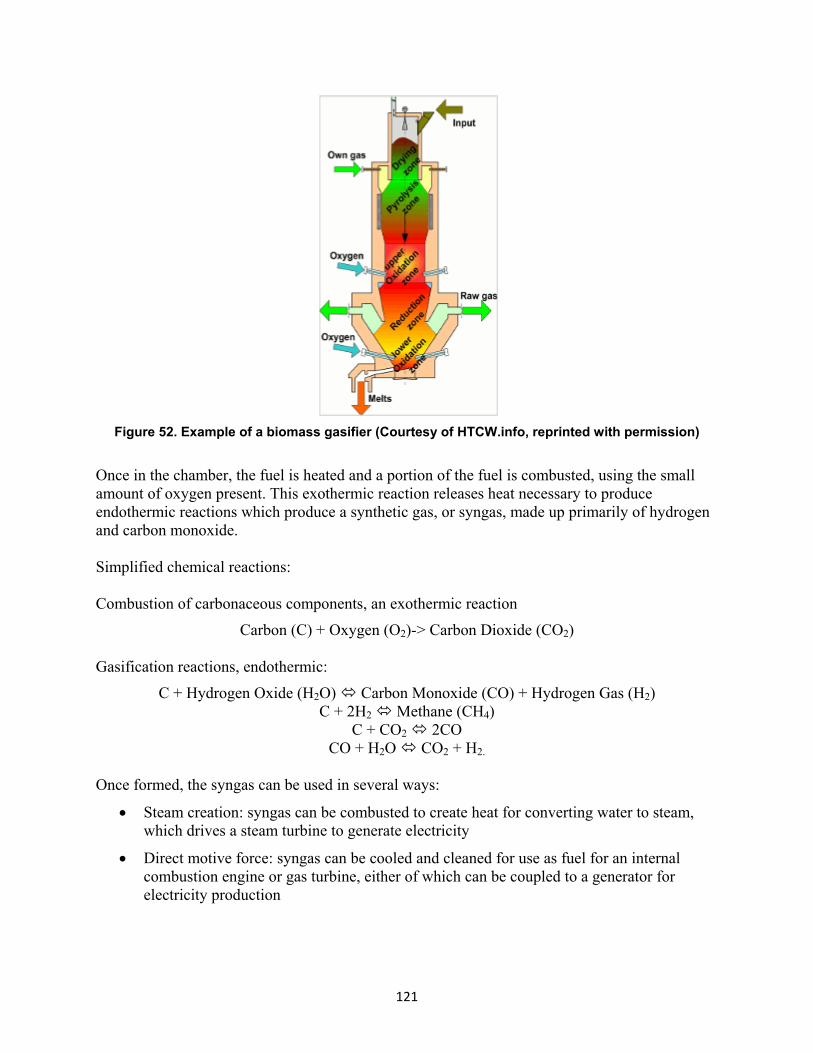
121
Figure 52. Example of a biomass gasifier (Courtesy of HTCW.info, reprinted with permission)
Once in the chamber, the fuel is heated and a portion of the fuel is combusted, using the small amount of oxygen present. This exothermic reaction releases heat necessary to produce endothermic reactions which produce a synthetic gas, or syngas, made up primarily of hydrogen and carbon monoxide. Simplified chemical reactions: Combustion of carbonaceous components, an exothermic reaction
Carbon (C) + Oxygen (O2)-> Carbon Dioxide (CO2)
Gasification reactions, endothermic:
C + Hydrogen Oxide (H2O) Carbon Monoxide (CO) + Hydrogen Gas (H2) C + 2H2 Methane (CH4)
C + CO2 2CO CO + H2O CO2 + H2.
Once formed, the syngas can be used in several ways:
• Steam creation: syngas can be combusted to create heat for converting water to steam, which drives a steam turbine to generate electricity
• Direct motive force: syngas can be cooled and cleaned for use as fuel for an internal combustion engine or gas turbine, either of which can be coupled to a generator for electricity production

122
• Liquid fuel conversion: cooled and cleaned syngas can be converted to various liquid fuels using the Fischer-Tropsch process, a series of chemical reactions occurring from introduction of a catalyst to the syngas
• Energy storage: syngas can be stored for later use or transferred to another location.
The syngas is the only direct output of the gasification process. If the syngas is combusted, in the various methods described above, the resulting emissions must be monitored and maintained below EPA levels, and is not typically an issue. Table 23 shows the EPA standards of syngas combustion emissions. Local standards, such as the strict nitrogen oxide NOx limit of California’s San Joaquin Valley Air Pollution Control District, may require additional emissions control systems to be used (Walt 2010).
Table 23. Example of Syngas combustion emissions (Source: Lauber 2006)
Item Tested Location Test Result Unit EPA Standard
Princeton versus EPA
Particulate Stack 0.0014 gr/dscf 0.0015 10% lower
CO Stack 32.2 ppmv 100 60% lower
Hydrocarbon (HC) Stack Not Detectable
ppmv 10 99% lower
NOx Stack 66.81 ppmv 150 60% lower
Sulfur Dioxide (SO2) Stack 15.88 ppmv 30 50% lower
Hydrochloric Acid HCI Stack 12.068 ppmv 25 50% lower
Chlorine (Cl2) + HCI 9.068 ppmv 21 60% lower
Mercury (Hg) Stack 0.0081 ug/m3 8.1 99% lower
Dioxin Furan Stack 0.098 ngTEQ/dscm 0.11 10% lower
Opacity Stack 10% 10% Same
The gasification facility collects revenue from several possible sources. Tipping fees are paid to the WTE facility for disposal of the MSW. The energy produced, in the form of electricity, syngas, or liquid fuels can be sold immediately upon production or stored for later use or sale. The terms for selling the energy product(s) vary and may include combinations of electricity, syngas, liquid fuels, or storage options. The residual material may be marketed as well, particularly vitrified slag from high-temperature gasification. Residual Materials Characteristics of residual materials vary depending on the temperature level for the respective gasification processes. At low temperatures (below the melting point for inorganic components of the feedstock), the residual material is bottom ash and can be reused as a building material or sent to a landfill. At higher temperatures, the inorganic material flows from the gasification chamber in a molten state. This vitrified slag is cooled and processed for reuse, typically as a

123
value-added product such as aggregate material for construction, road material, floor tiles, roof tiles, landscaping or insulation (Young 2010). The amount of residual material ranges from 0% to 20% by weight; though the low end of these figures rely on reuse of generated co-products (e.g., ash, slag). “Worst case” estimates, if co-products could not be used, are residual materials accounting for 15%-25% of MSW feedstock, by weight (Los Angeles County Conversion Technology evaluation Report 2007). Scale of Operations Gasification of MSW has been commercially proven overseas at MSW feedstock volumes ranging from 100-300 TPD (slightly above the solid waste stream of a typical DOD installation). The conversion efficiency of gasification WTE ranges from 500 kWh to 1 MWh per ton of MSW, though claims at the high end of this range have little to no operating history as a basis for comparison. For continuous operation, the rating is .02-.04 MW per TPD or approximately 2-4 MW for a 100 TPD system (Genivar, et al. 2007) (Young 2010). Challenges The primary challenge in using MSW to fuel a gasification process for energy recovery is control of the syngas production process. The chemical reactions must be balanced so that oxidation is low (to preserve feedstock for conversion to syngas), but with enough oxidation to provide heat for the endothermic syngas-production reactions. The heterogeneous nature of MSW, with varying heating values and chemical makeup of constituent materials, provides a challenging operational environment in which to optimize syngas production. Public perception is also a challenge, as opponents of WTE have had success in grouping thermo chemical conversion processes together, putting gasification in the same category as mass burn technology in the eyes of some (Stewart 2010). Costs for gasification systems can be high, particularly for small-scale systems. The capital expenditure relative to the revenues to be received for tipping fees and electrical generation is high and requires a highly efficient system to prove economical (NREL 2010). Active Projects There are dozens of WTE facilities that use gasification technology operating in Europe, Asia and Australia. The largest gasification unit in operation is a 378-TPD WTE operation in Kawaguchi, Japan (Circeo 2005). There is one full-scale demonstration plant operating in the United States, a 400 TPD unit operated by Recycling Solutions Technology, in Kentucky (Jones 2010). Planned Projects Various gasification WTE systems are currently being planned. See Appendix A for a full list and description of plans for commercial operations. One concept of particular interest is that of Solena Group, which plans to utilize gasification (see plasma arc described below) to create syngas and ultimately jet biofuel. Solena is planning an operation in California, from which it hopes to supply U.S. military operations; and more recently announced a project in the United Kingdom, partnering with British Airways to convert waste to jet fuel (GreenAir Online 2010).

124
In addition to the commercial-scale plans, several small-scale gasification WTE projects are planned for DOD installations:
• Hurlburt Field: This project uses plasma arc gasification, originally intended for 10 TPD, although the base waste stream is 5 TPD. The developer selected a unit designed to process 25 TPD, due to perception of higher volume needed for economical purposes, and has been operating the unit since July 2010. The project stakeholders are negotiating with their local municipalities to secure a waste stream allowing operation at design specifications of 25 TPD (Diltz 2010).
• Edwards Air Force Base: Infoscitex, an Environmental Security Technology Certification Program (ESTCP) project, plans to demonstrate a 3-TPD conventional gasification unit capable of providing the majority of fuel needed for a 50 kilowatt (kW) generator. The feedstock will be plastics, paper, and food wastes; replicating typical waste from a Forward Operating Base (FOB). Permit activities are in progress with Kern County, California and Infoscitex believes the demonstration project will begin in January 2011 (Cushman 2010).
• Ellsworth Air Force Base: General Atomics plans to demonstrate a 5-TPD hydrothermal gasification unit capable of producing syngas to fuel a 180-300-kW generator. The project was recently announced with few details available as of October 2010 (Johnson 2010).
• Aberdeen Proving Grounds: Princeton Environmental, the North American licensee of Kinsei gasification technology, will demonstrate a 1-TPD system intended for expeditionary applications. Permit activities are in progress and the unit is expected to be operational in January 2011 (Provance 2010).
• Tactical Garbage to Energy Refinery (TGER): Designed by the U.S. Army’s Research, Development, and Engineering Command (RDECOM), the unit was field tested in Iraq in 2008. The hybrid gasification and bioreactor system is reported to have processed .75 TPD of FOB waste and supply syngas to partially offset diesel consumption of a 50-kW generator (Farah-Stapleton 2010). The unit did not perform to full expectations, however, and further development is on hold due to cost concerns (Warner, et al. 2009).
Anaerobic Digestion Anaerobic digestion is an emerging WTE technology using biologic methods to process waste materials. Process Description The feedstock collection and processes for anaerobic digestion are the same as discussed for mass burn and gasification. The importance of sorting materials is higher for anaerobic digestion than other WTE technologies. As such, manual or automatic sorting of materials is typically the first step, removing inorganic materials and recycling those materials with value. The organic materials are placed into a digester, where microorganisms break down the material and release a biogas high in methane.
125
The resulting biogas is captured and serves several purposes:
• Steam creation: the biogas can be combusted to provide heat and produce steam to drive a turbine, coupled to a generator for power production
• Motive force: the biogas can be conditioned and serve as fuel for an internal combustion engine or gas turbine, linked to an electrical generator for power production
• Energy storage: the biogas can be stored for later use or transferred to another location.
Similar to the syngas produced from gasification, the products of anaerobic digestion are captured and the only emissions result from eventual combustion of the gas. These emissions typically fall well within EPA guidelines, though regional policies, such as those of the San Joaquin Valley Air Pollution Control district previously mentioned, can create a need for additional emissions control measures. Residual Materials Anaerobic digestion converts about 70% of the feedstock to energy, leaving approximately 17% as digestate material for compost and 13% unusable residues sent to a landfill. The level of effort necessary to make the digestate material suitable for the compost market depends on the feedstock screening processes used prior to digestion (Los Angeles County Conversion Technology evaluation Report 2007). Scale of Operations Demonstration and commercial scale anaerobic digestion facilities operate at various scales, from several tons of waste per day to 500 TPD facilities overseas. Challenges A large volume of compost material remains after the digestion process, which must be marketed within the local region. This is a useful product, however, it will compete with producers that produce compost as their primary product or from other industries that provide compost as a byproduct. The rate of the biologic reactions is relatively low, as compared to the thermo chemical reactions previously discussed. It takes longer to convert the feedstock to energy using this technology, which results in a less efficient process (Young 2010). Active Projects The most successful organization to implement anaerobic digestion technology is Arrow Ecology and Engineering Company. Arrow operates 300-500 TPD facilities in Israel, Australia, and Mexico City (Los Angeles County Conversion Technology evaluation Report 2007). In the United States, there are no active projects using anaerobic digestion to directly convert MSW to energy. There are projects using animal manure and food wastes as feedstock, which help divert a portion of the solid waste stream but do not address the majority of MSW.

126
Anaerobic digestion is the underlying process creating landfill gas, which can be collected to recover a portion of the energy from organic materials in the waste. This energy recovery is a beneficial use of the waste material after it is buried but is not a direct conversion of waste material to energy and would require continued use and expansion of DOD landfills. Planned Projects Los Angeles County’s WTE project is reaching demonstration phase, with three vendors selected to develop WTE projects for operations beginning in 2012. One of the three selected vendors is Arrow Ecology, selected to build a 150 TPD anaerobic digestion facility (Mitchell 2010). Technology Comparison Of these leading WTE technologies, gasification has been demonstrated to be the least costly conversion method (Baldwin 2010; Young 2010) and has a scale of operations well suited for DOD installation-level waste streams, as shown in Table 24.
Table 24. Comparison of key metrics
Technology Mass Burn Gasification Anaerobic Digestion
Description Direct combustion of unprocessed MSW
Fuel heated in low oxygen environment
Biologic process, microbes breakdown
feedstock
Product Heat Syngas, primarily H2 and CO
Biogas, primarily methane and CO2
Energy Yield 600 kWh per ton MSW 500-1MWh per ton MSW 250 kWh per ton MSW
Application Large Scale Small-Med Scale Medium
Advantages Proven, low-risk Syngas utility, lowest cost Proven, Biogas Utility
Challenges Permitting, perception Unproven for MSW Marketing co-products
Recent Waste-to-Energy Technology Developments Plasma Arc Gasification Plasma arc gasification is a high-temperature method of gasification occurring between 5,000-7,000oC. Improved Efficiency Plasma arc gasification has long held high potential as a WTE technology solution. The intense nature of this technology, which essentially destroys feedstock while producing syngas, has several benefits (Young 2010):
• Increased feedstock flexibility
• Complete conversion of organic materials to energy

127
• Complete disassociation of inorganic materials, resulting in lower volume of residual material
• Purer syngas product (dioxins, furans, tars destroyed at high temperatures)
• Vitrified slag residual material. While still 20% by weight, the material is better accepted as a non-hazardous material for use as a rock substitute in construction applications.
The potential of the technology has been limited, due to the high consumption of power necessary to produce the plasma arc. This power demand contributed to a high parasitic load and low excess electricity available for export to the grid. Recent innovation in plasma arc technology has lowered the parasitic demand of the system from 500 kWh needed to process 1 ton of MSW, to 200 kWh to process the same material (Young 2010). This improvement makes plasma arc gasification the most efficient method for converting waste material to energy, with the 75 TPD demonstration project in Ottawa, Canada claiming efficiency of 1 MWh per ton of MSW processed (PlascoEnergy Group 2010). With the increased electrical output, the advantages noted above are also offered, facilitating easier conversion to liquid fuels and marketing of byproducts. Plasma Arc Projects The improvement in plasma arc efficiency is reflected in the percentage of WTE projects proposed which will use this technology. From the project list of Appendix A (Sjrecycles 2010), six projects have designated a particular technology; four of these have selected plasma arc gasification. Of the previously mentioned planned or active DOD installation projects, only the Hurlburt Field project uses plasma arc gasification. It is also the only project in operation, and therefore the only source for WTE information. The current opinion of the project is that it is not currently economical, due to operating a 25-TPD reactor on 5 TPD of fuel, but will be economically viable once full capacity is reached (Diltz 2010). Hydrothermal Gasification The use of supercritical (pressurized, high temperature) water to gasify waste has been proposed for the Ellsworth Air Force Base WTE project. The minimum projection of 180-kilowatt electrical (kWe) production from 5 TPD MSW feedstock (Johnson 2010) equates to 864 kWh per ton of MSW, which is near the top of the current range of efficiency. While this yield has yet to be proven, the evolution of this gasification method will certainly be worth tracking. Hybrid Approach Combining technologies within one system has shown potential to improve the performance of WTE systems. The concept of the TGER (described previously), utilizes parallel thermal and biological conversion processes in an attempt to produce both syngas and ethanol for use at FOBs. NREL has recently begun working with a potential partner developing a 3-TPD WTE system that will use a phased approach. Conventional gasification will be used in the initial phase, followed by plasma arc gasification of feedstock to provide the benefits of plasma arc conversion

128
while lowering the energy consumption needed. The system is expected to produce 500 kWh per ton of MSW (Davis 2010), a very high yield for a WTE system of this size. Approaches such as these demonstrate innovations that must continue to evolve in order to make WTE economical, particularly for small-scale applications. Department of Defense Applications Establishing a Baseline NREL’s recent projects have included WTE evaluations from several DOD installations. Table 25 lists the solid waste streams of these facilities and key metrics used to evaluate WTE economic viability.
Table 25. Solid waste disposal data for fixed installations (Source: Davis 2010)
Installation Tons Per Day (TPD) Estimated Tipping Fee ($/ton)
Electricity Rate ($/kWh)
United States Marine Corps Base (USMCB) Camp Pendleton
100 unknown $0.12
Fort Irwin 25 178 $0.15
Fort Bliss 90 15 $0.08
Fort Carson 27 30 $0.06
Fort Leonard Wood 34 147 $0.07
Letterkenny Army Depot 10 100 $0.12
U.S. Military Academy 22 70 $0.15
These metrics vary widely, particularly within the range of tipping fee estimates. In conversations with staff at several installations, numerous inconsistencies have been noted (Davis 2010). Some installations have data-collection systems to capture total life cycle costs for solid waste disposal, while others do not. The tipping fee estimate is intended to represent the total direct or contract cost incurred by the installation for designing, building, maintaining, operating, and monitoring a sanitary landfill during its active receiving cycle, and for 30 years after closure. Since contracts for these services are administered by different individuals within different departments, it is difficult to arrive at an all-inclusive tipping fee. This is a critical piece of a WTE evaluation as tipping fees are completely avoided. Collection and sorting costs will still exist but any costs incurred beyond the entrance gate of a landfill are avoided. The most recent data for national tipping fees is for 2009, with an average tipping fee of $44.09 per ton. These figures range from $15 per ton in Oklahoma to $96 per ton in Vermont (Arsova, et al. 2008; van Haaren, et al. 2010). Similar trends are observed at DOD installations, with higher

129
than average tipping fee rates along the coasts due to the challenges of expanding in population-dense areas. Economic Analysis of Existing DOD WTE Projects Of the WTE opportunities NREL has evaluated thus far, two show potential for further evaluation (NREL 2010). Fort Bliss
• Project Concept: Hybrid mass burn WTE and CSP facility. El Paso, Texas, has recently passed legislation directing the city’s 1 million ton waste stream to city-owned landfills, with an exception written to allow use of Fort Bliss landfills. This waste stream will support a 100 MW WTE facility, with a proposed site on Fort Bliss, connected directly to Fort Bliss’ electrical distribution system. The city ordinance passed in August 2010 and the project concept is still in exploratory stages with NREL facilitating Fort Bliss and City of El Paso discussions.
• Capital Cost Estimate: $700 million
• Cost of Electricity to Fort Bliss: $.09 per kWh
• Tipping Fee Paid by City of El Paso: $19 per ton
• Discounted Cash Flow Rate of Return (DCFROR) for Private Ownership: 21%
• Simple Payback for Federal Government Ownership: 14 years.
Benefit – The project affords the opportunity to maintain a secure, inexpensive source of electricity on Fort Bliss. The tipping fees offered to the City are competitive with regional rates and will cut future expansion and transportation costs (due to Fort Bliss’ centralized location to El Paso’s population). Potential to Replicate – WTE projects such as this have high potential at DOD installations with the following characteristics:
• Open space available for industrial development
• Near large metropolitan with a solid waste stream of more than 1 million tons per year
• No existing waste-to-energy projects nearby.
Fort Irwin
• Project Concept: Use of small-scale gasification technology to process the post’s 25 TPD solid waste stream. At current tipping fees and costs of electricity ($178 per ton and $.15 per kWh), there is little economic gain. The primary advantages will be energy security (all fuel comes from Fort Irwin) and avoiding future cost increases, expected to rise to $287 per ton.
• Capital Cost Estimate: $11.6 million • Cost of Electricity to Fort Irwin: $.15 per kWh • Tipping Fee Paid by Fort Irwin: $178 per ton

130
• DCFROR for Private Ownership: 10%
• Simple Payback for Federal Government Ownership: 16 years. General Economic Analyses Detailed research has been done to evaluate the WTE potential of plasma arc gasification using the recent efficiency improvements noted previously.
• 500-TPD facility (Young 2010):
o Capital Cost: $101 million
o Operating and Maintenance (O&M) Cost: $7.5 million per year
o Tipping Fee (market rate for Iowa): $35 per ton
o Breakeven Rate for Electricity Sales: $.067 per kWh
• 94-TPD facility (Young 2010):
o Capital Cost: $29 million
o O&M Cost: $1.1 million per year
o Tipping Fee (market rate for Ottawa, Ontario): $33 per ton
o Electricity Sales (market rate): $.091 per kWh
o Annual Revenue (before taxes): $118,022
Simple payback if government owned would not be favorable, over 200 years. An economic key to this project’s viability is a $6 million grant to the developer
• 30-TPD facility (NREL 2010):
o Capital Cost: $12.9 million
o O&M Cost: $900,000 per year
o Tipping Fee (hypothetical): $90 per ton
o Breakeven Rate for Electricity Sales: $.14 per kWh
Significant improvement over the current Fort Irwin project economics, utilizing conventional gasification assumptions.
Further research must be done to validate the technology improvement claims of plasma arc gasification. If the economics have improved, the side benefits (improved quality of syngas and residual material) are notable. These benefits will improve the potential for liquid fuel conversion via the Fischer Tropsch method and the marketability of the slag residual material. Benefits to DOD WTE technology offers several qualitative and quantitative benefits for DOD:
• Energy security: Fuel sources for WTE operations are local, requiring relatively simple supply chains, and a low probability of disruption

131
• Renewable energy generation: Supports DOD target of 25% renewable energy by 2025
• Greenhouse Gas (GHG) reduction: For mass burn technology, CO2 emissions would decrease between 3%-10% from coal power (Green House Gas Reporting Guidelines 2010), depending on the facility’s existing source of power. There is also a yet-to-be-determined benefit of GHG reductions from elimination of the GHGs which would have been emitted from the material in a landfill (primarily methane). The GHG reporting standards have not yet been defined for WTE gasification systems
• Cost reduction: WTE may provide lowered costs for electricity and MSW tipping fees
• Landfill closure: Expansion of landfills is avoided, and existing landfills can be emptied using WTE systems; allowing the area to be reclaimed
• Expeditionary operations: The Government Accountability Office reported inappropriately slow DOD attention to open pit burning in Iraq and Afghanistan (U.S. GAO 2010). Research into small-scale WTE-gasification units will likely improve the viability for FOB-sized units
• Liquid fuels: Conversion of syngas to renewable diesel or jet fuel has direct benefits, see the previously-mentioned Solena Group in Appendix A
Benefits to the United States The United States is far behind other developed nations in its use of WTE technology. Land resource constraints forced Europe and Asia to deal with their solid waste situation decades ago, and both regions have successfully implemented WTE solutions to manage this problem. In the United States, the availability of land and previously nonexistent regulation of WTE mass burn emissions resulted in a tendency to avoid WTE solutions. As WTE science and technology have improved, several clean WTE options have become available (Gasification News 2010). Even with innovations in WTE technology and solutions, the primary barrier to implementing this WTE is a negative social image. In a recent trip to Asia to research WTE systems, an important distinction between the people of Asia and the Americas was noted. In general, the Asian people trusted the science of WTE and the endorsement of their government in support of this technology (McLaughlin 2010). A challenge to America is overcoming an old image of WTE technology. For DOD, however, there is arguably more social influence over the populations of DOD installations, and indisputably more ability to direct activities that support the mission of DOD. WTE can support this mission, and due diligence done on the part of DOD (subsequently relayed to constituents) will improve acceptance of DOD installations. This localized shift will then help promote a greater cultural awareness throughout the entire United States. Recommendations Program Recommendations To evaluate the feasibility of WTE projects, the true lifecycle costs for solid waste disposal must be understood. The methods by which installations calculate their lifecycle disposal costs appear inconsistent. To remedy this issue, NREL recommends:

132
• A survey of all DOD installations to collect applicable costs using a common template, including:
o Design/build costs o Operating costs o Post closure monitoring o HAZMAT disposal costs and issues
• NREL can review the information for completeness and accuracy by cross-referencing data between installations, and by comparing known industry standardized costs for these services.
• In parallel to evaluating true disposal costs for each installation, other actions should be carried out to verify performance metrics and cost assumptions for the most technically advanced WTE systems.
• Evaluate recently-developed plasma arc gasification projects for proven results.
• Contact known suppliers of WTE plasma arc gasification suppliers for more details on their respective technologies. See Appendix A for a complete list of proposed projects. Primary developers of this technology include:
o Plasco Energy Group
o Alter NRG
o Solena
• Release a Request for Information from suppliers of WTE gasification technology.
These data collection efforts will help determine the true value of WTE projects on DOD installations. Project Recommendations To facilitate the above programmatic requests, one or more demonstration projects should be proposed for DOD installations fitting a favorable profile for WTE projects. Installation characteristics favorable for WTE projects:
• High solid waste disposal cost (more than$70/ton)
• High cost of electricity (more than$.12/kWh blended rate)
• Onsite solid waste volume of more than30TPD
o Access to offsite waste volume of more than500TPD can be considered for a mass burn project.
These installations are likely going to be developed along the U.S. coast, where disposal costs are higher than average due to landfill space constraints. From previously collected information, the Military Academy is a good candidate location. NREL has not collected site-specific data for the Naval Academy, but it is also likely to provide favorable WTE economics due to its location. Demonstration projects at either of these institutions would be high profile (likely to draw the attention and necessary information from technology suppliers), as well as help serve a need for additional renewable energy awareness in military training pipelines.

133
Buildings Technologies
Overview of DOD Commercial Building Energy Use DOD is the largest consumer of energy in the nation (more than ¾ of Federal energy is consumed by DOD). Infrastructure, building type diversity, and varying climatic conditions all impact the agency’s energy consumption. The DOD has reduced energy use intensity by 7.5% from fiscal year (FY) 2003 to 2007 as indicated by the “goal facility” energy use statistics in Table 26.
Table 26. DOD energy use intensity statistics (Source: http://www1.eere.energy.gov/femp/pdfs/annrep07.pd)
Energy Use Intensity Statistics from FY 2003 and FY 2007
Year 2003 2007
Gross square foot (thousand)
3,016,315
3,008,956
Billion Btu 383,117 353,536
Btu/GSF 127,015 117,495 The Energy Independence and Security Act of 2007 (EISA 2007) requires a 3% reduction in energy use intensity per year starting in 2003, resulting in a 12% reduction in energy use intensity (Btu/ft2) through fiscal year 2007. Thus, DOD is not currently meeting the energy use intensity requirements outlined in EISA 2007. Agency reduction requirements in terms of percent reduction in (Btu/ft2) and additional reduction through renewable energy purchases or credits are detailed in Figure 53 for the four-year timeframe. The dashed line on the graph displays the older energy use reduction requirements, prior to the enactment of EISA 2007.

134
Figure 53. Individual agency reductions in Btu per square foot of goal building space in FY 2007
compared to FY 2003 (Source: http://www1.eere.energy.gov/femp/pdfs/annrep07.pdf)
Investment in Energy Efficiency In FY 2007, DOD invested $355.7 million in energy efficiency and renewable energy projects, 10.4% of its total facility energy costs. Of this total, $168.1 million was funded directly by the agency, representing an increase of 3.6% from the previous year, $96.7 million was financed through energy savings performance contracting (ESPC), and $90.9 million was financed as a result of utility energy service contracts (UESC) (U.S. DOE 2007). Through a decentralized approach, DOD awarded the largest number of contracts/delivery orders with 10 energy savings performance contracting projects FY 2007. These contracts included many infrastructure upgrades and new equipment purchases to help DOD installations reduce energy use associated with lighting systems, motors, energy management control systems, and water-consumption. Table 27 shows total DOD investments in energy efficiency in 2007. The following are some notable FY 2007 DOD energy savings performance contracting projects:
Fort Jackson, South Carolina, awarded a $5-million energy savings performance contracting task order at the end of FY 2007. The project included energy management control systems, building re-commissioning, thermal energy storage, substation upgrades, and central plant improvements. An additional $1.6 million in services was included in the task order. This task order was executed under the DOE Super Energy Savings Performance Contracting Program.

135
Aberdeen Proving Ground, Maryland, awarded an energy savings performance contracting contract for a $6.1-million steam system rehabilitation project. Implementation of advance controls was also included in the project.
U.S. Army Garrison Vicenza, Italy, awarded a $2.2-million energy savings performance contracting contract for a 1.5-MW cogeneration project.
Fort Knox, Kentucky, awarded five utility energy service contracts task orders. Three of the five included geothermal heat pumps, lighting retrofits, cool roofs, and steam boilers. The total investment value was $18.7 million.
Table 27. Total DOD investments in energy efficiency in 2007 (Source:
http://www1.eere.energy.gov/femp/pdfs/annrep07.pdf)
Total DOD Investments in Energy Efficiency Projects in 2007
Direct Obligations ESPC UESC
Total Investment
Facility Energy Costs
(FY 2007)
Total Investment
as a% of Energy $
Financed Investment
as a% of Energy $
$168,111,709 $96,693,600 $90,896,600 $355,701,909 $3,416,696,484 10.4% 5.5%
New Building Designs DOD began the design process for 193 new facilities during FY 2007. Of these facilities, 55 are expected to exceed the American Society of Heating, Refrigerating, and Air Conditioning Engineers (ASHRAE) 90.1 requirements by at least 30%. A total of 129 facilities will not use 30% less energy than relevant code nor will they achieve the maximum level of energy efficiency that is life-cycle cost effective. A majority of these facilities are Navy facilities that were all initiated (and budgeted for) prior to the established requirements of the Energy Policy Act of 2005 (EPAct 2005) and Executive Order 13423. Navy policy is now in place that requires compliance with the EPAct 2005 and Executive Order 13423 for all new buildings beginning in FY 2009. DOE Building Technologies Program The U.S. DOE has programs in energy efficiency and renewable energy, with a programmatic budget totaling $2.24 billion in FY2010 and a request to Congress for $2.35 billion in FY2011 (budgetary spending in FY2010 does not include American Recovery and Reinvestment Act [ARRA] funding allocated to DOE programs). Table 28 provides a summary of the energy efficiency and renewable energy appropriations in FY 2009, FY 2010, and the Congressional requests for FY 2011, by technology area in thousands of dollars (U.S. DOE March 2010).

136
Table 28. DOE appropriations and requests for energy efficiency and renewable energy (Source: http://www1.eere.energy.gov/femp/pdfs/annrep07.pdf)
DOE Appropriations and Requests for Energy Efficiency and Renewable Energy (Dollars in thousands)
EE and RE Technology Area FY 2009 Current Appropriations
FY 2010 Current Appropriations
FY 2011 Congressional
Request
Hydrogen technology 164,638 174,000 0
Hydrogen and fuel cell technologies 0 0 0
Biomass and refinery systems R&D 214,245 220,000 220,000
Solar energy 172,414 247,000 302,398
Wind energy 54,370 80,000 122,500
Geothermal technology 43,322 44,000 55,000
Water power 39,082 50,000 40,488
Vehicle technologies 267,143 311,365 325,302
Building technologies 138,113 222,000 230,698
Industrial technologies 88,196 32,000 42,272
Federal energy management program 22,000 32,000 42,272 The building technologies allocation is used primarily for the Building Technologies Program (BTP) within the DOE’s Office of Energy Efficiency and Renewable Energy. The mission of the BTP is to:
“develop technologies, techniques, and tools for making buildings more energy efficient, productive, and affordable. BTP focuses on improving commercial and residential building components, energy modeling tools, building energy codes, and appliance standards.”
Within the BTP there are a number of research and development projects through partnerships with the private sector, state and local governments, national laboratories, and universities. The five-year plan, spanning 2008-2012, for the BTP includes the following goals (U.S. DOE/EERE 2010). Research and Development:
Develop low-cost (target $20/ft2 in 2010), durable (measured by number of cycles to failure, per ASTM International standard) prototype dynamic window.
By 2010, develop solid state lighting with efficacy of 160 lumens per watt (lm/W) in a laboratory device.
By 2010, develop technologies and design strategies that can achieve an average of 40 % reduction in whole house energy use for new residential buildings.
By 2010, develop technologies and design strategies that can achieve an average of 30 % reduction in purchased energy use for new, small, commercial buildings.
137
Equipment Standards and Analysis: By 2008, complete energy conservation standard final rule for packaged terminal air
conditioners and heat pumps.
By 2008, complete determination for battery chargers and external power supplies.
By 2009, complete energy conservation standard final rules for incandescent reflector, fluorescent, and incandescent general service lamps, and also residential dishwashers, ranges and ovens/microwave ovens, residential dehumidifiers, and commercial clothes washers.
By 2010, complete energy conservation standard final rules for residential water heaters, direct heating equipment, pool heaters, and small motors.
By 2010, complete determination for high-intensity discharge lamps.
By 2011, complete energy conservation standard final rules for electric motors (1–200 HP), fluorescent lamp ballasts, residential clothes dryers, room air conditioners, and residential central air conditioners and heat pumps.
Technology Validation and Market Introduction: By 2010, increase the market penetration of ENERGY STAR®-labeled windows to 65%
(40%, 2003 baseline), and maintain 28% market share for ENERGY STAR appliances.
These goals can be furthered through the partnership between the DOE and DOD with demonstration projects that serve as a catalyst to prove or disprove energy savings and overall system life-cycle cost effectiveness associated with specific technologies or designs. The individual research and development programs within the BTP focus on Appliances R&D, Building Envelope, Whole Building Design, Indoor Air Quality, Lighting, Water Heating, Advanced Controls, Commissioning, and Geothermal/Ground-source Heat Pumps. The total building technologies R&D funding was approximately 39% of the 2010 budget, or $86.58 million (U.S. DOE May 2009). This funding allocation is fairly consistent from year to year. These individual programs are detailed further in the following sections to provide an overview of the current research projects within each area, and the key investigators involved in the research. Where information is available, the demonstration potential, contacts, and specific technology applications are noted. This information is provided to identify areas where further investigation is warranted to collaborate between DOE and DOD. Specific collaboration opportunities are ranked based on the relative importance of successful field demonstrations to prove the technical validity and social acceptance of the new technologies. The ranking scale ranges from 1 to 5, with a score of 1 indicating low demonstration potential and a score of 5 indicating high demonstration potential. In addition to the new technology research and development projects currently being funded through the DOE BTP, some of the largest energy efficiency R&D programs in the country are outlined. It should be noted that there are hundreds of new energy efficiency technologies in the R&D phase throughout the country that should be on the radar screen of the Environmental Security Technology Certification Program (ESTCP) program. For the purposes of this paper, a few specific opportunities outside of the DOE BTP program are briefly highlighted. In an attempt to characterize the importance of the venture capital R&D funding in energy efficiency technologies, the total venture capital investments in the US were analyzed. The total

138
venture capital investment in energy efficiency R&D in the United States in 2010 is estimated to be $703 million. The funding allocations are broken down as follows (Cleantech Open 2010):
• Grid Infrastructure (Smart Grid) $243.5 million
• Green IT and Components $180 million
• Green Building $100 million
• Monitoring and Control $80.4 million
• Lighting $72.5 million
• Other Energy Efficiency $26.7 million.
Figure 54 shows venture capital investment in energy efficiency.
Figure 54. Venture capital investment in energy efficiency (Source: NREL)

139
The authors of the venture capital report characterize smart grid investments as an energy efficiency R&D effort, which is debatable. Assuming these classifications are realistic and that the funding levels identified in the report are comprehensive, the total investment in energy efficiency R&D in 2010 was approximately $789 million, where the DOE’s BTP investment in R&D represents only 11% of the total energy efficiency investments in R&D in the United States. These investment levels are growing each year and are poised to spur revolutionary advancements in energy efficiency technologies. It should be noted that these funding levels do not include R&D investments in all of the other countries outside of the United States. Whole Building Design
Within the BTP building design program, R&D emphasis is on “whole building, systems engineering approaches that optimize efficiency for specific climate zones and applications, while integrating efficiency with renewable energy technologies.” A whole building approach takes into account the complex and dynamic interactions between a building and its environment, among a building’s energy systems, and between a building and its occupants. R&D efforts are focused on technologies that contribute to a more efficient whole-building strategy. At the outset of this report, the NREL researchers would like to stress that
DOD could reduce the energy use of new commercial buildings by 30% – 60% with off-the-shelf, commercialized technologies and reduce the energy use of all of their existing buildings by at least 30% with commercialized technologies when they utilize the whole building design and renovation approach discussed below.
The whole building design and retrofit approach are appropriate for incorporating and designing for the interactions of individual energy conservation measures in an integrated fashion. In existing buildings, holistic retrofits also allow for the bundling of shorter payback measures with longer payback measures to enable the financing of a bundled set of energy conservation measures on a life-cycle cost basis. For example, a Pacific Northwest National Laboratory (PNNL) report determined that the energy savings potential in federal buildings is on the order of 25 kBtu/ft2 with an initial investment of $1.96/ft2 and would result in cost savings of $0.36/ft2 (Brown and Dirks undated). Assuming these numbers are applicable to all DOD facilities, DOD would need to invest $5.89 billion in agency appropriations for energy efficiency upgrades and would save $1.085 billion a year in energy savings, with a payback period of 5.43 years. It should be noted that this PNNL report is an older report (2001) comparing savings potential to a baseline of 1985 through 2005. Although this is an older study, NREL employees have audited over 50 DOD buildings at a variety of military bases throughout the country and have found that this minimum level of ~25% – 40% savings potential still exists in existing DOD facilities relative to a 2010 baseline for the following reasons:
The majority of DOD facilities were constructed sometime between World War I and World War II. At the time the facilities were constructed to meet the wartime/ mission critical needs and were built as quickly as possible. Consequently, the buildings have little to no insulation, utilize single-paned windows, have inefficient heating, ventilation and air conditioning (HVAC), lighting, and plug load systems.

140
The DOD manages such a large building stock that it is an enormous task to renovate all of its facilities. The majority of the building efficiency projects have focused on simple energy conservation measures and have not captured all of the opportunities that exist in each DOD facility.
NREL is working on a number of net zero energy DOD base pilot projects and has characterized the energy efficiency improvement potential at two bases:
The energy efficiency potential at Ft. Carson was estimated as 26.7% for electricity, 17.2% for natural gas, and a 20.3% overall energy reduction.
Marine Corps Air Station Miramar has 800 facilities with an average energy use intensity of 55 kBtu/ft2. The total energy efficiency potential was estimated as 16.0% for electricity, 10.7% for natural gas, and a 13.3% overall reduction. Thus, Miramar already uses less than half of the energy of a typical base on a Btu/ft2 basis and still has energy efficiency reduction potential with off-the-shelf, commercialized energy efficiency technologies.
It is NREL’s recommendation that these whole building design and retrofit strategies take precedence over single technology applications and retrofits. In addition, until recently, large-scale, cost-effective net-zero energy buildings (NZEBs) were thought to lie decades in the future. However, ongoing work at NREL proves that NZEB status is both achievable and repeatable today. NREL’s new Research Support Facilities (shown in Figure 55), which opened in June of 2010, is one of the world’s most energy-efficient office buildings and the largest NZEB in the United States. It was designed to be one of the first large-scale NZEBs and achieved the U.S. Green Building Council’s (USBGC) Leadership in Energy and Environmental Design (LEED) highest rating, LEED Platinum. The 220,000-ft2 building currently houses 824 employees on NREL’s South Table Mountain campus.
Figure 55. Side view of research support facilities (Source: NREL PIX 17778)
The Research Support Facility is designed to perform 50% better than the ASHRAE 90.1 2004 standard, has an energy use intensity target of 35 kBtu/ft2/yr (including a data center), and a total
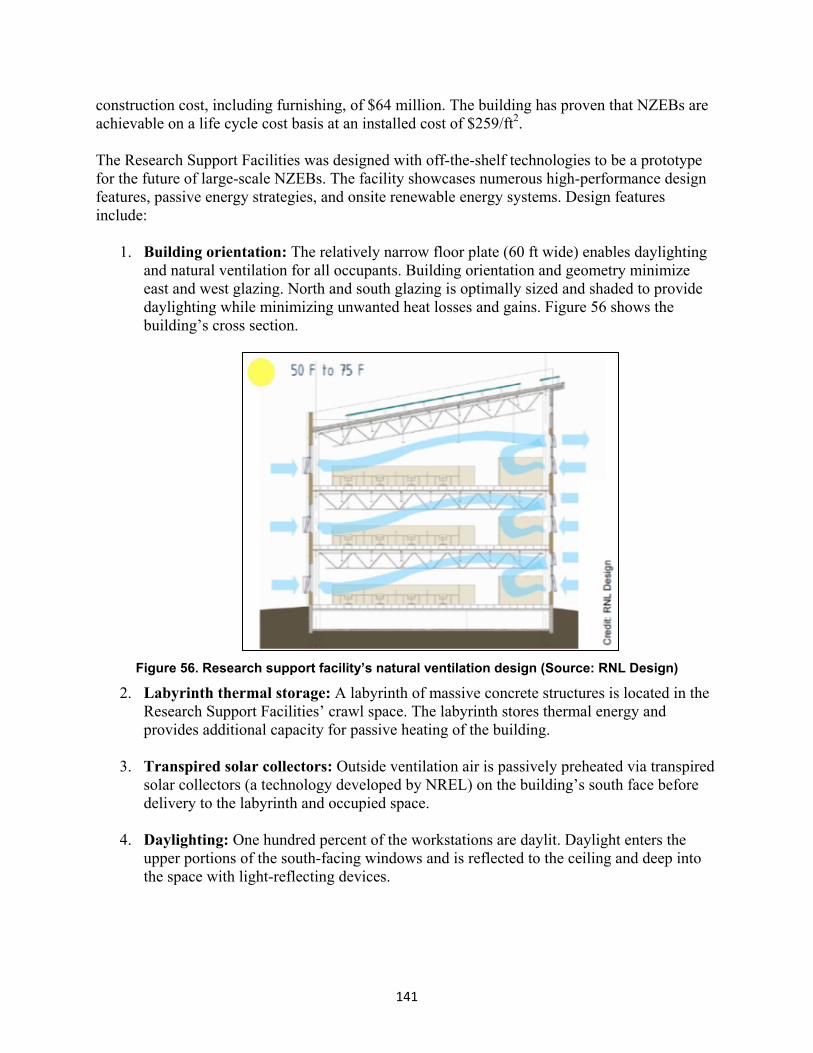
141
construction cost, including furnishing, of $64 million. The building has proven that NZEBs are achievable on a life cycle cost basis at an installed cost of $259/ft2. The Research Support Facilities was designed with off-the-shelf technologies to be a prototype for the future of large-scale NZEBs. The facility showcases numerous high-performance design features, passive energy strategies, and onsite renewable energy systems. Design features include:
1. Building orientation: The relatively narrow floor plate (60 ft wide) enables daylighting and natural ventilation for all occupants. Building orientation and geometry minimize east and west glazing. North and south glazing is optimally sized and shaded to provide daylighting while minimizing unwanted heat losses and gains. Figure 56 shows the building’s cross section.
Figure 56. Research support facility’s natural ventilation design (Source: RNL Design)
2. Labyrinth thermal storage: A labyrinth of massive concrete structures is located in the Research Support Facilities’ crawl space. The labyrinth stores thermal energy and provides additional capacity for passive heating of the building.
3. Transpired solar collectors: Outside ventilation air is passively preheated via transpired solar collectors (a technology developed by NREL) on the building’s south face before delivery to the labyrinth and occupied space.
4. Daylighting: One hundred percent of the workstations are daylit. Daylight enters the
upper portions of the south-facing windows and is reflected to the ceiling and deep into the space with light-reflecting devices.

142
5. Triple paned, operable windows with individual sunshades: Aggressive window shading is designed to address different orientations and positions of glazed openings. Occupants can open some windows to bring in fresh air and cool the building naturally.
6. Precast concrete insulated panels: A thermally massive exterior wall assembly using an
insulated precast concrete panel system provides significant thermal mass to moderate the building’s internal temperature.
7. Radiant heating and cooling: Approximately 42 miles of radiant piping runs through all floors of the building, using water instead of forced air as the cooling and heating medium in the majority of workspaces.
8. Underfloor ventilation: A demand-controlled dedicated outside air system provides fresh air from a raised floor when building windows are closed on the hottest and coldest days. Ventilation is distributed through an underfloor air distribution system. Evaporative cooling and energy recovery systems further reduce outdoor air heating and cooling loads.
9. Energy efficient data center and workstations: A fully contained hot and cold aisle
datacenter configuration allows for effective air-side economizer cooling with evaporative boost when needed while capturing waste heat for use in the building. Plug loads are minimized with extensive use of laptops and high-efficiency office equipment.
10. Onsite solar energy system: Approximately 1.6 MW of onsite photovoltaics (PV) will
be installed and dedicated to the Research Support Facilities. Rooftop PV power will be added through a Power Purchase Agreement, and PV power from adjacent parking areas will be purchased with 2009 ARRA funding.
Opportunity #1 – Net Zero Energy Commercial DOD Building Using Novel
EnergyPlus Optimization Analysis Several labs and private sector companies are developing new features and front-end user interfaces for Energy Plus. However, a comprehensive front end that is free to the public does not exist. To NREL’s knowledge, a comprehensive optimization tool for Energy Plus is also not available through any other organization. The optimization tool NREL has developed is currently an internal R&D tool at NREL and isn’t currently publicly available. The optimization tool is discussed here because it is the only tool that is currently being used for the development of new construction energy efficiency standards throughout the country. The recommendations and benefits listed here could be potentially satisfied by another program or tool with similar capabilities. NREL develops and utilizes advanced energy modeling tools to help architects, engineers, and facility managers understand the energy implications of their designs and maximize the efficiency of their buildings. Whole-building energy modeling and optimization are important tools for achieving energy-efficient, cost-effective buildings. Optimizing a building’s design to achieve cost-effective energy savings is challenging because of the many variables involved. Manually running energy simulations to analyze all the possible system interactions is time consuming and may not return the best results. For example, if 15 energy efficiency measures were identified, a total of 3,269,017 (1515) different simulations would be needed to model all of the different combinations of building designs.

143
Opt-E-Plus was developed by NREL to address the issues described above and to support the development of low- and NZEBs by integrating simulation and optimization. Opt-E-Plus presents a range of design options, each of which minimizes energy use at a particular economic cost. This range of design options is also known as a Pareto optimal front in formal multivariate optimization terminology. Figure 57 shows the typical output of an Opt-E-Plus analysis. In this figure, each point represents a unique combination of energy efficiency measures that defines a single potential building design and corresponds to an EnergyPlus simulation run.
Figure 57. Opt-E-Plus optimization results (Source: NREL Opt-E-Plus Software)
These options enable designers and engineers to set project goals based on a reasonable understanding of the tradeoffs between energy use and economics for a particular project. Opt-E-Plus utilizes the DOE’s whole-building energy simulation engine EnergyPlus to ensure that interactions between energy design measures (e.g., lower lighting power density results in lower cooling energy but increased heating energy) are accurately captured. An energy design measure is a perturbation to the building model that influences the objective functions (it does not have to save energy). Although EnergyPlus is a very detailed calculation engine, the focus at this stage is on whole-building integration strategies rather than on details of a single subcomponent. NREL used Opt-E-Plus to set the design goals for the Research Support Facility (discussed above) and is currently working with the Army on developing a series of prescriptive design guides to meet the EISA 2007 legislation requiring a 55% reduction in fossil fuel use for all new DOD facilities using the Opt-E-Plus energy modeling process. A number of Army sites have expressed an interest in using the Opt-E-plus framework to make informed design decisions and

144
set overall energy performance goals as high as economically feasible on a life-cycle cost basis for a few new model facilities. A next step would be to pilot this approach at a few DOD facilities to demonstrate the effectiveness of the novel optimization approach, incorporate Opti-E-Plus into a commercially available tool, and develop the internal capacity within DOD to adopt the process on all new DOD facilities. Applicable DOD Market:
All new commercial DOD buildings. The new design methodology will ensure that maximum energy savings are realized on a life-cycle cost basis. The methodology also ensures that DOD does not spend additional funding on energy efficiency projects that do not provide an appropriate return on investment.
Energy Savings Potential: The energy savings potential is on the order of 35% – 65% relative to an ASHRAE 90.1 2004
baseline. Additional energy can be saved through the use of onsite renewable energy systems to achieve a net zero energy facility.
Potential Commercialization Date: Currently Available Contact information: Michael Deru, 303-384-7503 [email protected] Demonstration Potential: 5 The demonstration potential for this novel energy-modeling approach was ranked high based on the energy savings potential of the new approach. The modeling technique can also set the framework for a new standard of energy modeling for new DOD facilities. Opportunity #2 – Net Zero Energy Commercial DOD Building Renovation Using
Novel EnergyPlus Optimization Analysis The energy savings potential in existing DOD facilities discussed above demonstrates the potential to reduce annual utility bills by over one billion dollars per year. The same approach discussed above for optimizing the energy performance of new facilities can be applied to either full facility modernization projects or whole-building energy efficiency upgrades in existing commercial buildings. In terms of relative savings potential, the energy savings potential in existing facilities is orders of magnitude higher than new construction, given the fact that DOD owns over 350,000 facilities and only constructs around 150 new facilities each year. The current analysis procedures for energy-efficiency upgrades in DOD facilities depend on the level of assessment and the expertise of the consulting firm performing the analysis. There currently are not any standardized analysis tool requirements for analyzing energy efficiency upgrades in DOD facilities. Opt-E-plus could be used to set overall energy reduction goals and define the optimum set of retrofit solutions for a few facility modernizations and whole-building energy-efficiency projects. The Opt-E-Plus framework could also be incorporated into a commercially available existing building analysis tool. Applicable DOD Market:
All existing commercial DOD buildings. The new design methodology will ensure that maximum energy savings are realized on a life-cycle cost basis. The methodology also

145
ensures that DOD does not spend additional funding on energy efficiency projects that do not provide an appropriate return on investment.
Energy Savings Potential:
The energy savings potential is on the order of 30% – 75% relative to current energy use per square foot. Additional energy can be saved through the use of onsite renewable energy systems to achieve net zero energy classification.
Potential Commercialization Date: Currently Available Contact information: Michael Deru, 303-384-7503, [email protected] Demonstration Potential: 5 The demonstration potential for this novel energy modeling approach was ranked high based on the energy savings potential of the new approach. The modeling technique can also set the framework for a new standard of energy modeling for existing DOD facilities. Opportunity #3 – DOD Specific Automated Energy Auditing Tool Using
OpenStudio and EnergyPlus Several labs and private sector companies are developing new features and front-end user interfaces for Energy Plus. However, a comprehensive front end that is free to the public does not exist. The Open Studio Tool is discussed here because it is the only free tool currently offered through DOE’s Energy Plus Web site (http://apps1.eere.energy.gov/buildings/energyplus/openstudio.cfm) and through an NREL Web site (openstudio.nrel.gov). The recommendations and benefits listed here could be potentially satisfied by another program or tool as they are released in the future. NREL is developing a suite of energy modeling tools that provides an easy-to-use front end to creating Energy Plus energy models. The first tool is called OpenStudio, and is a new, easy-to-use and free software tool created by NREL that seamlessly combines the building energy simulation of EnergyPlus with the popular drawing interface of Google’s SketchUp (http://apps1.eere.energy.gov/buildings/energyplus/openstudio.cfm).
In the past, entering building geometry data in EnergyPlus was tedious and time-consuming. Now users can quickly sketch a computerized 3-D drawing of a building and run a fast simulation to analyze the energy performance of the facility or DOD base. A visual rendering of a facility created in EnergyPlus is shown in Figure 58.

146
Figure 58. OpenStudio facility rendering (Source: U.S. DOE OpenStudio Software)
Open Studio currently allows the user to:
Create and edit EnergyPlus zones and surfaces
Launch EnergyPlus and view the results without leaving SketchUp
Match inter-zone surface boundary conditions
Search for surfaces and sub-surfaces by object name
Add internal gains, schedules, and simple outdoor air for load calculations
Add the ideal HVAC system for load calculations
Set and change default constructions
Add daylighting controls and illuminance map
Get help from tutorials and documentation.
NREL has also created a number of additional applications that will expedite the EnergyPlus modeling process, including a Results Viewer, System Outliner, and Building Component Library. All of these new features are available to the general public, other than the Building Component library which will be released in phases through the next series of public releases. The System Outliner lets the user develop HVAC systems through a graphical interface. A sample single-zone air delivery system is depicted in Figure 59.

147
Figure 59. Single zone air delivery system (Source: U.S. DOE EnergyPlus Software)
This will be the first graphical interface for developing HVAC systems in EnergyPlus that is free to the public. This is a revolutionary improvement to developing HVAC systems, which is currently one of the major prohibitors of EnergyPlus being used by the general public. This tool is currently limited to single zone air delivery systems, but additional system types and functionality are currently under development. The Building Component Library is another significant addition that will serve as an open database of building components that can be assessed and used by anyone. The database will contain the following information:
Weather files and water mains temperature data
Building materials
HVAC system performance curves
Lighting systems (lamps, ballasts, fixtures)
Motors
Plug load equipment
Building components (desks, cubicles, etc.).
A screenshot of the Building Component Library is shown in Figure 60.

148
Figure 60. Building component library screenshot (Source: NREL)
All of these modeling components serve as the precursor for the creation of a holistic energy auditing analysis tool that could be tailored to DOD. This tool has not yet been created, but a DOD-specific tool could be created that would be designed for use on a mobile device (e.g., an iPad) and serve as a fully automated, existing building modeling and analysis program. The proposed features of the tool include:
A photomatch feature that allows the auditor to take a picture of the facility and transform it into an energy model (Figure 61)
The feature will include material-inferencing capabilities to automatically detect the material properties of building components.
The photomatch feature was recently released through NREL’s openstudio Web site and the material-inferencing features are in the beta testing phase at NREL.

149
Figure 61. Google SketchUp / EnergyPlus model using PhotoMatch (Source: NREL)
The goal for the fully automated energy auditing tool is it will let the user easily develop internal zones, schedules, control features, etc. through an intuitive user interface and include the following:
A drag-and-drop interface will be created and linked to the Building Component Library that allows the user to build the energy model during the walkthrough energy audit.
The model will automate a number of manual steps in the auditing process. An example work flow for inputting lighting system data is as follows:
Drag-and-drop light fixtures, lamps, and ballasts during the walkthrough audit
Auto-calculate fixture wattage with ballast factor
Pre-assemble photometric files linked to Radiance lighting analysis tool
Auto-calculate lighting power density per zone
Auto-calculate switch cycles based on control strategy and schedule
Auto-calculate heat load allocation to space/plenum
Add specific daylighting sensors/occupancy sensor controls
Popup-based schedules per zone (if requested).

150
The tool will automatically link EnergyPlus files to a utility rate database (http://en.openei.org/wiki/Gateway:Utilities), greenhouse gas database (http://cfpub.epa.gov/egridweb/), building life-cycle costing factors and utility escalation rates (EIA) (http://www1.eere.energy.gov/femp/information/download_blcc.html).
The tool will upload utility bills and let the user quickly move through the model calibration process.
Be accessible for use through a handheld laptop or similar device.
Have pre-defined capital cost data for DOD buildings.
Have pre-defined building data for DOD facility types (commissary, barracks, offices, etc.).
Automatically identify energy conservation measures and develop a list of potential measures.
Include the Opt-E-Plus optimization framework for optimizing results.
A tool like this would reduce the energy auditing time by ~75% for DOD facilities and has the potential to save DOD millions of dollars a year in auditing costs. It would also let an auditor conduct investment-grade assessments of a larger number of facilities in a shorter period of time and has the potential to facilitate appropriate energy-conservation measure implementation in DOD buildings, with the potential to save billions of dollars per year in energy costs. The tool would also ensure that the latest modeling tools are built off the most robust platform, EnergyPlus, and are fully automated, from building inputs, life-cycle cost inputs, to energy conservation measure identification. Applicable DOD Market:
All existing commercial DOD buildings. The new, fully automated energy auditing tool could be packaged into a workforce development plan and used to train DOD energy managers, resource efficiency managers, and subcontractors performing audits of DOD facilities. The methodology could revolutionize the speed, scale, and accuracy of existing building renovations. Based on the incorporation of the Opt-E-Plus framework, it would also ensure the optimum mixture of life-cycle cost-effective projects are selected for each building.
Energy Savings Potential: The cost savings associated with expediting the speed of energy audits could potentially save
DOD millions of dollars per year, and the energy savings potential is on the order of 30% – 75% relative to current energy use per square foot.
Potential Commercialization Date: Currently Available Contact information: Nicholas Long, 303-384-6183, [email protected] Jesse Dean, 303-384-7539, [email protected]

151
Demonstration Potential: 5 The demonstration potential for this new, fully automated energy auditing tool was ranked high based on the cost savings and energy savings potential of the new approach for DOD. The modeling technique can also set the framework for a new standard of energy modeling for existing DOD facilities. This new modeling technique has the potential to save DOD more money than any specific new technology demonstration discussed below. Building Envelope Research and Development In 2006, 39% of the total U.S. energy consumption was attributed to the buildings sector alone. (U.S. DOE/EERE 2010) Typically, buildings consume energy through heating and cooling losses and gains in the building envelope: doors, windows, walls, roofs, floors, etc. Advances in building envelope technology are important to reduce energy consumption in buildings. Figure 62 illustrates the percentage of heat loss typically found in residential buildings through building envelope construction elements (Action 21 2010).
Figure 62. Heat loss through residential building envelope (Source: NREL)

152
The DOE’s R&D programs are focusing on the building envelope, specifically a) walls, roofs and foundations; b) windows and doors; and c) whole building design. These programs are detailed below. Research relating to building envelope systems is being conducted on the thermal performance of wall, roof, and foundation systems exposed to realistic field conditions at various national laboratories, including NREL and Oak Ridge National Laboratory (ORNL). Modeling and testing facilities generate results, which are disseminated by ASHRAE. One DOE research center is the Building Envelope Research User Center, which works with private industry through cooperative research and development agreements and user agreements. The Building Envelope Research User Center develops more efficient low-sloped roofs, attics, and above-grade wall and foundation systems, and then makes the results available through an internet-accessible research laboratory for the building industry. Advanced envelope systems are intended to establish the technology base to accelerate the use of sustainable, high-thermal-performance wall systems through a partnership with the building industry, manufacturers, and code groups. Test facilities are being used to determine the efficiency of innovative wall systems, such as replacement of non-hydrofluorocarbon (HFC) or chlorofluorocarbon-blown, closed-cell foam products, thermally broken steel-stud wall systems, and establishing whole-wall performance database and rating procedures. Opportunity #1 – High Performance (Triple-Paned) Window Bulk Purchase
Program Conventional windows are estimated to consume 4.4 quadrillion Btu (quads) of energy in the United States each year through increased heating and air conditioning loads. The windows and doors R&D program focuses on technology development and design tools/technology support. The projects are intended to catalyze private investments in energy efficiency by reducing uncertainty and risk and to address high-risk activities that are unlikely to attract private investments. It also includes strategies to drive the marketplace toward more widespread use of advanced technologies by creating an accurate and unbiased information base for decision-makers, providing technical underpinnings for the development of standards, and supporting voluntary programs to encourage use of more effective window systems. Activities are highly leveraged by partnerships with the fenestration industry, government laboratories, universities, utilities, and consumer groups as well as other relevant DOE programs. Advances in low-e coatings for windows are estimated to have saved $8 billion in the United States alone. This is one result of the DOE’s windows and doors programs. Technology support is currently being addressed through the DOE’s coordination of a bulk purchase of R-5 (U-value of 0.22 or less) windows and low-e storm windows to expand the market for high efficiency windows. High performance and triple paned window products are available for bulk purchase orders through mid-2011. It is recommended that DOD collaborate with the DOE in this arena through the purchase of triple-paned windows for both renovation and new construction projects. Over 40 qualified vendors are listed through the program. The program offers more information on products and vendors, as well as an energy savings calculator.

153
Applicable DOD Market:
All commercial and residential buildings.
Energy Savings Potential:
The technology has the ability to significantly reduce energy loss and gain through residential and commercial windows.
Potential Commercialization Date: Currently available Contact information: www.windowsvolumepurchase.org Demonstration Potential: 5 The demonstration potential for this technology was ranked high based on the fact that a successful field demonstration of triple-paned windows that can prove to be cost effective with the DOE bulk purchase program could lead to universal acceptance of the technology and potential development of standardized procurement specifications requiring the use of triple-paned windows in all of DOD’s new construction and renovation projects. Opportunity #2 – Aerogel-Based Spaceloft Insulation for General Building
Applications An innovate insulation with remarkable thermal performance characteristics has been developed by Aspen Aerogels, Inc., with assistance from DOE’s Industrial Technologies Program. The aerogel-based insulation was redesigned for use in residential and commercial building applications. The insulation was fabricated into a nanoporous aerogel blanket that has the ability to reduce interior insulation thickness requirements and significantly reduce energy loss through walls, roofs, and floors. The insulation, Spaceloft, has the highest R-value per inch of any building material, as indicated in Figure 63.

154
Figure 63. Insulation value per inch comparison (Source: NREL)
The thermal properties of this insulation are over two times greater than a common fiberglass or mineral wool insulation. For example, if this insulation was installed in a 3.5 inch cavity of a 2 x 4 wall, the cavity R value would be 36.05 with the Spaceloft insulation and 11.9 with traditional fiberglass bat insulation. Applicable DOD Market: The number one application of the technology in its current state is in space-constrained commercial building renovations over existing concrete construction. In this scenario, the insulation has a significant advantage in that it can be installed at a low thickness (Figure 64) and provide superior thermal performance (Aspen Aerogels 2007).

155
Figure 64. Aerogel insulation material (Source: NREL PIX 08754)
Energy Savings Potential:
Significantly better thermal performance than any other building insulation material
Reduced space volume and insulation density
Hydrophobic and breathable at the same time.
Potential Commercialization Date: Currently available Contact information: (www.aerogel.com) Demonstration Potential: 4 The demonstration potential for this technology was ranked high based on the fact that a successful case study demonstrating that this product can achieve better life-cycle cost effectiveness than traditional insulation technologies in space-constrained commercial building renovations can lead to wide acceptance of the technology and development of a new procurement specification for specific applications.

156
Opportunity #3 – Sunlight Responsive Thermochromic Windows A new high-performance window capable of variable tint is being developed that combines dynamic sunlight control, high insulation values, and low solar gain. The Sunlight Responsive Thermochromic windows can reversibly change light transmission based on thermochromic materials activated solely by the heating effect of the sun. The window design allows for good daylighting, a low solar heat gain coefficient, a low U-value, and a high insulation value. Energy savings up to 30% are estimated compared with traditional window systems. This technology received a grant through the DOE’s Industrial Technologies Program, and the current status of the technology and potential commercialization date is unknown. Applicable DOD Market:
All commercial and residential buildings.
Energy Savings Potential: The technology has the ability to significantly reduce energy loss and gain through
residential and commercial windows.
Potential Commercialization Date: Unknown Contact information: www.pleotint.com Demonstration Potential: 4 The demonstration potential for this technology was ranked high based on the fact that a successful case study demonstrating that this product can achieve better life-cycle cost effectiveness than traditional windows in specific applications can lead to wide acceptance of the technology. Opportunity #4 – Cool Roofs Energy transmission through roofs can be mitigated by increasing insulation levels and using non-traditional building materials for roofing. Traditional dark roofs can reach temperatures of 150°F (66°C) or more in the summer. A cool roof under the same conditions could stay more than 50°F (28°C) cooler, thus they are called “cool roofs.” Cool roofs reflect sunlight (have high “solar reflectance”) and efficiently emit thermal radiation (have high “thermal emittance”). By cooling the roof and reducing heat transfer into the building, cool roofs reduce the cooling load of the facility’s HVAC system, thereby saving energy and money while minimizing greenhouse gas emissions. The DOE cool roof program encompasses white roofs, green roofs and roofs with solar PV panels and/or solar hot water systems. While cool roofs often reduce cooling loads caused by solar gains on a building’s roof, it is important to develop predictive energy models to ensure optimum results. Cool roofs may increase energy consumption in high-altitude or northern-latitude areas. DOE recommends that agencies conduct site-specific modeling during the cool roof assessment phase. It is highly recommended that cool roofs be considered in areas with high cooling loads.

157
The DOE has prepared guidelines for cool roofs and identified locations for placement of these roofs. A cool roof calculator is available online, and a number of other resources can be found at: http://www1.eere.energy.gov/buildings/cool_roofs.html. Contact information: Ronnen Levinson, Lawrence Berkeley National Laboratory [email protected] Demonstration Potential: 1 The demonstration potential for this technology was ranked low based on the fact that this is a widely accepted commercialized technology. The DOD should develop standardized procurement specifications requiring the use of cool roofs for all facility modernization projects or new construction projects in warm climates. Opportunity #5 – Electrochromic Windows Windows are often inefficient in existing buildings and are responsible for heat loss in cold months and solar heat gain in warm months. Summer sunlight entering a home building increases cooling loads, and the glare from sunlight can make it difficult to see a computer or other liquid crystal display (LCD) screen and can fade materials, such as furniture and carpets. Building occupants often close drapes or blinds to block intense summer sun, which reduces beneficial natural daylighting. SAGE Electrochromics, Inc., with assistance from DOE’s Inventions and Innovation Program, developed SageGlass® product technology to create windows and skylights that switch from clear to dark. By pushing a button or using a daylight sensor, the electrochromic feature of the window is activated. Within 5–10 minutes, electrochromic glass darkens to a pre-set level, depending on the size and temperature of the pane. The variable tint feature of the glass prevents glare, fading, and heat gain without the loss of a view. This electrochromic glass modulates light transmission and solar heat gain by sending an electrical charge through the glass. The glass is made up of five separate layers of ceramic materials; when voltage is introduced, the glass lightens or darkens as needed. The electricity used to operate 1,500 square feet of SageGlass window is less than a 60-W light bulb. The glass can be altered manually via a wall switch or as part of an integrated building management system so that windows can be programmed to tint depending on input from timers, motion sensors, or similar controls. Developed by SAGE Electrochromics, Inc. (www.sage-ec.com) Contact information: Jim Wilson, Chief Marketing Officer, [email protected], 770-617-2208 Demonstration Potential: 3 The demonstration potential for this technology was ranked medium due to the fact that it is only used on commercial building applications. The costs are prohibitive in residential buildings. This technology can serve a niche market in DOD facilities where direct sun /glare issues cause problems during certain parts of the day. This technology is currently being used on the east and west windows of NREL’s Research Support Facilities to prohibit glare during low sun angles.

158
Opportunity #6 – Phase Change Materials Phase change materials (PCMs) have been considered for thermal storage in buildings for the last 30 years. With the advent of PCMs implemented in gypsum board, plaster, concrete, or other wall covering materials, thermal storage can be part of the building structure even for light weight buildings. PCM prototype systems have been developed and tested to enhance the thermal energy storage (TES) capacity of standard building materials with the goal of shifting peak loads and maximizing solar energy utilization. NREL is currently developing new analytical models to characterize the performance of PCM in energy modeling programs, but was not able to acquire specific information on new systems or technologies that are receiving funding through the DOE BTP. Outside of the DOE BTP, the California Energy Commission Public Interest Energy Research (PIER) program is one of the larger energy efficiency R&D programs in the country. Active PCM research projects are listed below (taken directly from the California Energy Commission PIER Web site):
Phase-Change Frame Walls (PCFWs) for Peak Demand Reduction, Load Shifting, and Energy Conservation in California
http://www.energy.ca.gov/pier/portfolio/Content/06/EISG/Phase%20Change%20Frame%20Walls%20PCFWs.htm
Improved Insulation for Buildings and Refrigeration
http://www.energy.ca.gov/pier/portfolio/Content/06/EISG/Improved%20Insulation%20for%20Buildings.htm/
Contact information: Deputy Director: Laurie ten Hope, 916-654-4878 http://www.energy.ca.gov/research/contactus.html Demonstration Potential: 4 The demonstration potential for this technology was ranked medium-high due to the emerging nature of this technology and the need for field testing to prove its commercial validity. Opportunity #7 – PV Facades Building-integrated photovoltaics (BIPV) is an emerging field in PV products. BIPV combines PV modules into the building envelope, typically in the roof, glazing, or facade. Savings in materials and electricity costs can be realized through BIPV systems, which serve as building envelope materials and power generators. The demand for BIPV systems is expanding, and the DOE estimates that up to 50% of the United States’ energy needs could be met by using BIPV systems if they were fully deployed in building construction. PV facades can be constructed using traditional thick crystal products mounted in fixed positions or on tracking systems as part of an external shading system, or they can be BIPV where a thin-film product is incorporated into the building material. Commercial thin-film materials currently deliver 4 – 5W/ft2 of PV area under full sun. The technology type utilized is dependent upon the construction application. Fixed, thick crystal products could be used in renovations or on existing buildings, whereas facades incorporating

159
PV materials as BIPV could be designed during new construction. More information is available on the Whole Building Design Guide Web site: http://www.wbdg.org/resources/bipv.php#ar Demonstration Potential: 3 The demonstration potential for this technology was ranked medium due to commercial building application and overseas buildings where technology advances have been made (such as in Germany and Japan). Opportunity #8 – Integrated Roof Systems (Generation, Cool Roofs, Water
Catchment) Integrated roof systems that combine both thermal and electrical generation, reduce solar heat gains into the building, and utilize water catchment systems demonstrate an integrated approach to sustainable and high-performance building design. Often, the high initial cost of PV and solar thermal systems prevents them from being included in new construction or roof replacement projects. However, with better incentives, technological improvements, and rising conventional power prices, energy from solar sources will become more cost competitive. It is NREL’s recommendation that DOD develop two new roof specifications: one that integrates the technologies described above, and another that ensures that the roof is “solar ready” and can easily take advantage of an environment more favorable to renewable energy. Without the forethought to make roofs solar ready, solar installation may not be technically possible or the added costs of making infrastructure changes may make solar applications economically prohibitive. The general guidelines for constructing a solar ready roof are provided below:
Avoid shading from trees, buildings, etc. (especially during peak sunlight hours).
Determine where a future solar array might be placed.
If the roof is sloped, the south-facing section will optimize the system performance; keep the south-facing section obstruction-free if possible.
Minimize rooftop equipment to maximize available open area for solar collector placement
The type of roof installed can greatly affect the cost of installing solar later
The roof must be capable of carrying the load of the solar equipment. (PV – between 3 and 6 lb/ft2, solar thermal – between 2 and 5.5 lb/ft2)
The wind loads on rooftop solar equipment must be analyzed in order to ensure that the roof structure is sufficient. See the American Society of Civil Engineers International Building Code 7-05 for the method to calculate these loads.
Add additional safety equipment for solar equipment access and installation.
The best roof for a flat application is a white (cool) fully adhered thermoplastic olefin or polyolefin membrane roof. This roof is often an excellent choice for commercial applications, being both cost-effective and more environmentally friendly than some other options. Other membrane roofs can also work well with solar such as ethylene propylene diene monomer or polyvinyl chloride (PVC). It is important to avoid river rock ballasted membrane roofs. The determination for where it is cost effective to install integrated roofs with renewable energy technologies should be made based on local energy costs, solar resource, and incentives. Both roof systems should come equipped with the same roof water catchment specification.

160
Demonstration Potential: 4 – 5 The demonstration potential for this technology was ranked high based the need to prove that it can work in multiple climates to ensure its adoption into standardized roof replacement specifications for DOD. Opportunity #9 – Low-Cost Solar Water Heaters for Mild Climates Solar water heating is a relatively mature technology that can meet significant load in housing and some commercial buildings. However, conventional technology uses relatively expensive metal and glass technology, and the systems do not have good payback against natural gas, even with the existing federal, state, and/or utility incentives. With single-family system pre-rebate cost in the $5,000 -$12,000 range and savings on order of $100/year against natural gas backup, simple paybacks can be more than 70 years. It is thus of interest that two new low-cost solar water heating systems for mild climates have been introduced to the U.S. market that can be installed at pre-rebate costs under $2,000. The collectors and piping in both systems are low-cost polymeric materials, with hardware cost reductions of order 50%–80% depending on the distribution and marketing channels used. In both low-cost systems, unit-area performance is lower than the best active systems, depending on the solar fraction. The lower performance stems from design compromises to limit overheating of the polymeric materials, being unglazed in one case and un-insulated in the other. At high solar fractions, unit-area performance is down about 40%, which can be compensated for by increasing the area of the low-cost collectors. At low solar fractions, the performance is comparable to the best systems. Given that EISA 2007 requires federal facilities to meet 30% of their hot water demand with solar energy, at these low solar fractions the low-cost systems are a new opportunity for cost-effectively lowering water heating costs as required. Applicable DOD Market:
All federal housing facilities and commercial DOD buildings with significant water heating loads, such as hospitals, recreation centers, and washing facilities. Particularly attractive are any facilities with electric heat.
Energy Savings Potential:
Across the federal sector, water heating costs were around $650 million in 2009. The low-cost systems will typically meet 30% – 80% of the water heating load, depending on context and load.
Potential Commercialization Date: Currently available in the U.S. market. Contact information: Jay Burch, 303-384-7508, [email protected]

161
Appliances Research & Development Appliances account for 20% of the primary energy use in residential buildings (U.S. DOE/EERE 2010). The appliances market provides a wide range of choice for consumers, including a number of energy efficient technologies. The DOE’s Appliance Technology R&D program develops and demonstrates technologies to enable manufacturers to improve upon their appliance efficiency. DOE’s Appliances R&D are currently taking place in the following areas:
Refrigerators
Clothes washers and dryers
Water heaters
Appliance integration and controls.
Examples within each R&D area are provided below.
Opportunity #1 – Grid-Friendly Appliance Controllers Appliance integration and controls is another area in which DOE is investing research and funds. One specific example is “Grid Friendly ApplianceTM Controller” developed by PNNL. The Grid Friendly Appliance Controller developed at PNNL senses grid conditions by monitoring the frequency of the system and provides automatic demand response in times of disruption.Within the North American power grid, a disturbance of 60-Hz frequency is an indicator of serious imbalance between supply and demand that, if not addressed, leads to a blackout. This simple computer chip can be installed in household appliances and turn them off for a few minutes or even a few seconds to allow the grid to stabilize. The controllers can be programmed to autonomously react in fractions of a second when a disturbance is detected, whereas power plants take minutes to come up to speed. They can even be programmed to delay restart instead of all coming on at once after a power outage to ease power restoration. The Grid Friendly Appliance Controller has been developed and tested at PNNL. It is ready for licensing and installation in the next generation of appliances. PNNL is currently working with appliance manufacturers and utilities to use Grid Friendly Appliances in a variety of test-bed and demonstration projects. Applicable DOD Market:
All buildings with residential appliances. This type of grid stabilization technology can serve as an integral part of a localized smart grid that is powered by onsite, distributed renewable energy systems.
Energy Savings Potential:
The technology has relatively limited energy savings potential but has significant grid stabilization potential that is vital to DOD mission-critical electrical loads during periods of blackouts or potential power loss.
Potential Commercialization Date: Currently available for commercialization

162
Contact information: Peter Christensen, 509-371-6159, [email protected] Demonstration Potential: 3–5 The demonstration potential for this technology was ranked relatively high based on the novel approach to grid stability and the need for field testing to validate the technology. The reason it was not rated 5 is it has relatively little energy savings potential and is only valuable to DOD installations that have onsite generation and distribution. Opportunity #2 – Low-Energy-Use Refrigerators Within the refrigerators R&D program, there is a cooperative agreement with the Association of Home Appliance Manufacturers Appliance Research Consortium and the DOE. Researchers designed and demonstrated an advanced refrigerator-freezer that uses less than 1kWh per day (half as much as currently allowed under government standards). The technology uses vacuum insulation panels in the freezer and double insulation thickness on the doors, more efficient DC motors and an adaptive defrost control system that operates only when required. Contact information: http://www.aham.org/industry/ht/d/sp/i/1575/pid/1575 Demonstration Potential: 1 The demonstration potential for this technology was ranked low based on the general acceptance of Energy Star Refrigerators and the fact that laboratory testing is considered sufficient to verify performance. Opportunity #3 – Low Energy Use Clothes Washers Clothes washers and dryers are being improved through projects such as the one at ORNL. ORNL is demonstrating the benefits of horizontal-axis clothes washers in cooperation with Maytag. A demonstration project in Bern, Kansas, resulted in energy savings of 60% and water savings of 40% compared to traditional washing machines. Contact information: Phillip D. Fairchild, 865-574-2020, [email protected] http://www.ornl.gov/sci/btc/apps/appl_randd.htm Demonstration Potential: 1 The demonstration potential for this technology was ranked low based on the general acceptance of Energy Star clothes washers and the fact that a large number of field demonstrations have already been conducted.
Opportunity #4 – Heat Pump Domestic Water Heaters Water heaters are currently being improved through projects such as the “drop-in” residential heat pump water heater research at ORNL. Heat pump water heaters have a much higher efficiency than conventional electric water heaters. ORNL and a private industry partner have been developing a “drop-in” replacement for 50- or 80-gallon electric water heaters. The new heat pump water heaters have the same footprint as the original water heater and an identical electrical hookup. The project has demonstrated that the heat pump water heater saves annual

163
energy, contributes to peak load shaving, and provides cool, dehumidified air to help condition the surrounding space in summer, spring, and fall. Contact information: Phillip D. Fairchild, 865-574-2020, [email protected] http://www.ornl.gov/sci/btc/apps/appl_randd.htm Demonstration Potential: 1 The demonstration potential for this technology was ranked low based on the general acceptance of heat pump water heaters and the fact that a large number of field demonstrations have already been conducted.
Advanced Cooling Technologies Today’s air conditioning is primarily based on the direct expansion or refrigeration process, which was invented by Willis Carrier more than 100 years ago. It is now so prevalent and entrenched in many societies that it is considered a necessity for maintaining efficient working and living environments. Direct expansion air conditioning has also had 100+ years to be optimized for cost and thermodynamic efficiency, both of which are nearing their practical limits. However, the positive impact of improved comfort and productivity does not come without consequences. Each year, air conditioning uses approximately four out of 41 quads of source energy for electricity production in the United States alone, which results in the release of about 380 million metric tons of carbon dioxide into the atmosphere. Opportunity #1 – Desiccant-Based Indirect Evaporative Cooling System (DEVap) NREL has developed the novel concept of a desiccant-enhanced evaporative air conditioner (DEVap) with the objective of combining the benefits of liquid desiccant and evaporative cooling technologies into an innovative “cooling core.” Liquid desiccant technologies have extraordinary dehumidification potential, but require an efficient cooling sink. Today’s advanced indirect evaporative coolers provide powerful and efficient cooling sinks, but are fundamentally limited by the moisture content in the air. Alone, these coolers can achieve temperatures that approach the dew point of the ambient air without adding humidity; however, they cannot dehumidify. Use of stand-alone indirect evaporative coolers is thus relegated to arid or semiarid geographical areas. Simply combining desiccant-based dehumidification and indirect evaporative cooling technologies is feasible, but has not shown promise because the equipment is too large and complex. Attempts have been made to apply liquid desiccant cooling to an indirect evaporative cooler core, but no viable design has been introduced to the market. DEVap attempts to clear this hurdle and combine, in a single cooling core, evaporative and desiccant cooling. DEVap’s crucial advantage is the intimate thermal contact between the dehumidification and the cooling heat sink, which makes dehumidification many times more potent.

164
This leads to distinct optimization advantages, including cheaper desiccant materials and a small cooling core. The novel design uses membrane technology to contain liquid desiccant and water. When used to contain liquid desiccant, it eliminates desiccant entrainment into the airstream. When used to contain water, it eliminates wet surfaces, prevents bacterial growth and mineral buildup, and avoids cooling core degradation. DEVap’s thermodynamic potential overcomes many shortcomings of standard refrigeration-based direct expansion cooling. DEVap decouples cooling and dehumidification performance, which results in independent temperature and humidity control. The energy input is largely switched away from electricity to low-grade thermal energy that can be sourced from fossil fuels such as natural gas, waste heat, solar, or biofuels. Thermal energy consumption correlates directly to the humidity level in the operating environment. Modeling at NREL has shown that the yearly combined source energy for the thermal and electrical energy required to operate DEVap is expected to be 30% – 90% less than state-of the-art direct expansion cooling (depending on whether it is applied in a humid or a dry climate). Furthermore, desiccant technology is a new science with unpracticed technology improvements that can reduce energy consumption an additional 50%. And unlike most HVAC systems, DEVap uses no environmentally harmful fluids, HFCs, or chlorofluorocarbons; instead, it uses water and concentrated salt water. Applicable DOD Market:
All commercial DOD buildings in humid climates with significant dehumidification requirements. This cooling strategy has the potential to drastically reduce cooling energy use in humid climates.
Energy Savings Potential:
Modeling at NREL has shown that the yearly combined source energy for the thermal and electrical energy required to operate DEVap is expected to be 30% – 90% less than state-of-the-art direct expansion cooling (depending on whether it is applied in a humid or a dry climate).
Potential Commercialization Date: 1-Ton Prototype – 2011, full commercialization occurring in 2012 or beyond Contact information: Eric Kozubol, 303-384-6155, [email protected] Demonstration Potential: 5 The demonstration potential for this technology was ranked high based on the revolutionary approach to space cooling and the need for field testing to prove the commercial validity of the product.

165
Opportunity #2 – Advanced Rooftop Air-Conditioning Units NREL is tasked, through funding from the DOE Office of Building Technology, to evaluate the performance of advanced cooling concepts that meet or exceed the performance criteria developed by the Western Cooling Efficiency Center (WCEC) (http://wcec.ucdavis.edu/). The WCEC has developed a set of criteria for test conditions, minimum energy, and water use performance for prototype cooling equipment. The WCEC has identified these conditions as indicative of western state climates. These criteria, named the Western Cooling Challenge (WCC), have been set forth as a challenge to manufacturers to improve the state-of-the-art space cooling products. NREL is to verify these criteria through laboratory testing at its HVAC test facility (www.nrel.gov/dtet/lab_capabilities.html) in Golden, Colorado, which is uniquely suited to accurately measure the cooling performance, energy, and water use of advanced cooling systems. The facility provides flexibility to test prototype equipment and develop subsequent test methodology. Data are analyzed and reported to reflect performance at sea level elevation. NREL tested a prototype rooftop unit manufactured by the Coolerado Corporation. The unit, an advanced ultra-cooler that uses the patented “M-cycle” process, is a hybrid indirect evaporative cooling and refrigeration direct expansion system. An airflow schematic of the rooftop unit is shown in Figure 65. Return air and outdoor air are brought into the unit and cooled by an indirect evaporative medium. Between 43% and 46% of this air is used as an indirect evaporative cooling stream. The balance is then passed through a refrigerant evaporator coil and supplied to the space by a high-efficiency fan. The exhaust air from the evaporative process is generally cooler than the ambient air and is therefore used for the heat sink air flow going through the refrigerant condenser coil. Outdoor air and exhaust air flow rates were matched during testing. The return air and supply air flow rates are also equal, thus there is no make-up air to the space supplied by the unit. The mode of operation can be described as recirculation and ventilation air cooling with no makeup air.

166
Figure 65. Schematic and photo of the Coolerado H-80 hybrid rooftop unit (Courtesy of Coolerado,
reprinted with permission)
The H-80 is a brand new product with the first unit produced in May 2009. The product was created for a competition put together by the WCEC (http://wcec.ucdavis.edu/). The H-80 unit was the first entry and first “winner” of the WCC– (http://wcec.ucdavis.edu/content/view/92/110/). Table 29 presents an excerpt of the WCC summary. Testing was done by NREL for this entry. The testing showed that the peak power savings was 60% over DOE’s 2010 standard, with an estimated annual energy saving of 80% over DOE’s standard in western climates (WCEC Web site). All results exceeded the expectations of the challenge.
Return Air
(RA)
Supply Air
(SA)
Outdoor Air
(OA)
Evaporative Exhaust Air
Exhaust Air
(EA)
Condensing Coil
DX Evaporator Coil
DX Condenser Coil
Indirect Evaporative Cooling Cores

167
Table 29. Excerpt of WCC summary for the Coolerado H-80 (Source: Coolerado)
Specification Performance Units
Peak Conditions (105°F/73°F)
Sensible Cooling – 56.9 kBtu/h
Sensible EER ≥14.0 20.1 Btu/Wh
* Water Use – 1.83 gal/ton·h (sensible)
Surrogate Annual Conditions (90°F/64°F)
Sensible Cooling – 45.6 kBtu/h
Sensible EER ≥17.0 41.1 Btu/Wh
* Water Use ≤4.0 1.85 gal/ton·h (sensible)
Coolerado Corporation has recently received $750k in funds from the DOE to expand their manufacturing capabilities in Colorado (Coolerado Web site, January 2010). The company already has the evaporative cooling technology, and H-80 systems are available for purchase. Applicable DOD Market: Small commercial and large residential buildings in western dry/monsoon climates. Energy Savings Potential:
The Coolerado H-80 technology will work best in western dry/monsoon climates. Annual cooling energy savings of up to 80% are expected in these climates. Furthermore, this technology can be expanded beyond western climates in situations where light cooling and dehumidification is necessary. The combination of evaporative and direct expansion cooling allows the system to be applied to areas with wet-bulb temperatures of 70°F –75°F.
Potential Commercialization Date: Currently available Contact information: Eric Kozubol, 303-384-6155, [email protected] Demonstration Potential: 5 The demonstration potential for this technology was ranked high based on the revolutionary approach to space cooling and the need for field testing to prove the commercial validity of the product.

168
Opportunity #3 – Multiple Opportunities through the California Energy Commission PIER Program
The California Energy Commission PIER program is one of the larger energy efficiency R&D programs in the country. Active research projects applicable to advanced cooling systems are provided below (taken directly from the California Energy Commission PIER Web site):
Advanced Roof Top Air Conditioning Unit
http://www.energy.ca.gov/pier/portfolio/Content/06/Buildings/Advanced%20Roof%20Top%20Air%20Conditioning.htm
A New Physical Water Treatment Technology for Energy-Efficient Water-Cooled Air Conditioning Systems
http://www.energy.ca.gov/pier/portfolio/Content/06/EISG/A%20New%20Physical%20Water%20Treatment.htm
In addition to the active projects, there are a number of completed projects that could serve as appropriate DOD demonstrations. Contact information: Deputy Director: Laurie ten Hope, 916-654-4878 http://www.energy.ca.gov/research/contactus.html Geothermal Heat Pumps Geothermal heat pumps, or ground source heat pumps (GSHPs), are a highly efficient renewable energy technology that is gaining wide acceptance for use in buildings. These heat pumps can be used for space heating and cooling and water heating at low grade temperatures. Geothermal heat pumps produce heat that utilizes the constant temperature below the Earth’s surface year-round: warmer than the above-ground air temperature during winter and cooler in the summer. Heat pumps transfer stored heat from the Earth or ground water into a building during the winter and transfer it out of the building back into the ground in the summer. The system includes three principal components:
Earth connection subsystem involving a series of pipes (or a loop) that is buried in the ground or submersed in groundwater either vertically or horizontally, circulating a fluid (water or an antifreeze mixture) to transfer heat
Heat pump subsystem to pump the fluid through the loop
Heat distribution subsystem to pump the heat through the building.
In addition to space conditioning, geothermal heat pumps can be used to provide domestic hot water. Often, hot water is provided only when the space is being conditioned (i.e., summer or winter) through a de-superheater. The de-superheater transfers excess heat from the geothermal heat pump’s compressor to the hot water tank. Opportunity #1 – Ground Source Integrated Heat Pump (GS-IHP) ORNL has been collaborating with ClimateMaster under a cooperative research and development agreements to develop the GS-IHP, which provides all the space conditioning and water heating needed by a household within one packaged unit and is expected to be significantly more energy efficient than conventional residential space conditioning and water

169
heating equipment. Prototype GS-IHP units are being tested at several residences. ClimateMaster anticipates launching a new Trilogy water source heat pump product line based on the GS-IHP technology in 2011. Applicable DOD Market:
All residential and small commercial DOD buildings.
Energy Savings Potential:
The technology has significant energy savings potential at DOD bases throughout the country.
Specific energy-performance data were not provided to NREL and therefore cannot be directly reported.
Potential Commercialization Date: Currently available Contact information: Dr. Xiaobing Liu, 865-574-2593, [email protected] Demonstration Potential: 5 The demonstration potential for this technology was ranked high based on the energy savings potential of this technology. Opportunity #2 – New Foundation Heat Exchanger ORNL and its partners are several years into a research project designed to reduce cost of residential GSHP systems. Cost reduction is being addressed through evaluation of a concept called the foundation heat exchanger, which utilizes the existing excavations made during the course of housing construction (e.g., the overcut for the basement/foundation and utility trenches for water supply) for the installation of a ground-coupled heat exchanger. This technology applies only to new construction or additions to existing homes. The foundation heat exchanger has been installed in two experimental high-performance single-family residential homes operated under simulated occupancy conditions in Tennessee over a period of one year. The initial experiential data showed the system performs as expected. Applicable DOD Market: All new residential buildings.
Energy Savings Potential:
The technology has significant energy savings and installed cost reduction potential at DOD bases throughout the country. Specific energy performance data were not provided to NREL and therefore cannot be directly reported in this report.
Potential Commercialization Date: Currently available Contact information: Dr. Xiaobing Liu, 865-574-2593, [email protected]

170
Demonstration Potential: 5 The demonstration potential for this technology was ranked high based on the energy savings potential of this technology. Opportunity #3 – Compact Prefabricated New Foundation Heat Exchanger Several compact prefabricated ground heat exchangers with potential for reducing the cost and uncertainty of GSHP systems were introduced in the 2010 Expo of the International Ground Source Heat Pump Association. These new designs include the HyperLoop developed by Maytal Tech, LLC (www.geohyperloop.com), which is a prefabricated multi-channel heat changer designed for surface water bodies (e.g., pond and lake); a prefabricated and pre-grouted coaxial ground heat exchanger for vertical bore installation developed by Amasond (http://www.AmasondUSA.com); and a nano-particle enhanced high-density polyethylene pipe, which could double the thermal conductivity of the high-density polyethylene pipe according to the manufacturer, IPL, Inc. (http://www.ipl-plastics.com) Applicable DOD Market:
All new GSHP projects.
Energy Savings Potential:
The technology has significant energy savings and installed cost reduction potential at DOD bases throughout the country. Specific energy performance data were not provided to NREL and therefore cannot be directly reported in this report.
Potential Commercialization Date: Currently available Contact information: Dr. Xiaobing Liu, 865-574-2593, [email protected] Demonstration Potential: 5 The demonstration potential for this technology was ranked high based on the energy savings potential of this technology. Opportunity #4 – Ongoing GSHP-Related Demonstration and R&D Projects
Funded by DOE In October 2009, DOE awarded a total of $63 million in ARRA funds to support the sustainable growth of the U.S. GSHP industry though actions in three areas:
• Demonstrating innovative business and financing strategies and/or technical approaches designed to overcome barriers to the commercialization of GSHPs
• Gathering data, conducting analyses, and developing tools to assist consumers in determining project feasibility and achieving lowest-life-cycle-cost GSHP applications
• Creating a national certification standard for the GSHP industry to increase consumer confidence in the technology, reduce the potential for improperly installed systems, and ensure product quality and performance.

171
ORNL has been collaborating with five of the 36 awardees on various projects, including developing design and simulation tools for various hybrid ground source heat pump systems, creating the first national certification program for GSHP related professionals, and evaluating the energy-saving performance of several hybrid GSHP systems in Tennessee. Contact information: Dr. Xiaobing Liu, 865-574-2593, [email protected] Advanced Controls and Integrated Commissioning and Diagnostics R&D Advanced building controls play a significant role in improving building energy performance. Advanced controls promise unprecedented levels of sensing and automated response to changes in the internal and external environment. The delivery of continuous, up-to-date information on building system and component performance will enable more cost-effective equipment servicing and optimized building operation. Building owners and operators will see lower maintenance and operating costs, and building occupants will enjoy greater levels of comfort and personalized control. Suboptimal building operation due to a lack of advanced controls or existing control faults currently account for between 2% and 11% of all energy consumed by commercial buildings. The BTP has been involved in a process of developing R&D plans for advanced control technologies for building applications. The goal of the process is to identify opportunities for targeted R&D that will result in significantly increased use of control technologies that yield energy savings. Through this research, a number of novel technological and analytical software solutions are currently being developed and refined by a number of national laboratories, universities, and private sector companies to address these issues for a variety of building systems. Opportunity #1 - Self-Correcting and Self-Configuring HVAC Controls The objective of the project is to develop and test techniques and algorithms for control systems to automatically correct and compensate for faults occurring in HVAC systems and their components. Industry partners will be leveraged to integrate these capabilities with building control systems to ensure that new and existing commercial buildings continuously operate near peak efficiency. Successful development and deployment of this technology will save an average of up to 30% of the energy used for HVAC in commercial buildings with a potential for transfer to residential systems. PNNL is the lead laboratory for this project with NREL providing technical support on PNNL-led tasks and serving as a major contributor in laboratory and field-testing. Broken, degraded, and incorrectly configured systems are pervasive throughout the commercial buildings sector. Manual approaches to remedy issues are too costly and inconsistent and have failed to penetrate the market significantly. Persistent performance is critical to capturing savings of 30% and more across the commercial sector and to produce buildings that will actually achieve deep and persistent energy savings. Increased use of automation presents an opportunity to solve this problem by better leveraging the human capital for operating and maintaining buildings, as it has in other fields such as manufacturing and transportation. Self-correcting technology can overcome many of the impediments to better operation and maintenance of building systems by using automation to solve many common problems in HVAC systems,

172
alerting building operation staff to problems requiring human action, and alleviating the need for staff to manually address the majority of problems, freeing them to repair the faults that actually require human intervention. The project objectives and outputs will include fully laboratory- and field-tested, characterized, and documented algorithms for self-correction, self-compensating and self-configuring controls for an array of building HVAC systems and equipment. The algorithms will be transferred to industry partners to whom the technical team will provide assistance with commercialization. A technical guide for implementing the algorithms in control code will also be produced to assist commercializers. Deployment of the algorithms produced will transform the installation, operation, and maintenance of HVAC systems and equipment by enabling automatic configuration of this equipment, self-healing when many common faults that degrade performance efficiency occur, and compensation for physical faults in system components to maximize efficiency until repairs can be made. These capabilities will remedy many of the problems that pervade HVAC equipment in commercial buildings. The overall project will start in FY11 by identifying and prioritizing opportunities for application of self-correcting, self-compensating, and self-configuring controls to HVAC systems and their components to determine the opportunities with the greatest potential for energy savings, cost savings and peak-power demand reductions. This task will be led by PNNL with assistance provided by NREL. In parallel with the prioritization analysis, an industry advisory group will be established to benefit from guidance that industry can provide to ensure the relevance of project results to the marketplace and to share information with interested companies, who will likely become the initial commercializers of the technology. Both NREL and PNNL will participate in recruiting members for the advisory group. Following selection of equipment/systems and faults on which to focus first, PNNL will begin development of self-correction algorithms. Algorithms designed by PNNL will be implemented and tested in facilities on the NREL campus in accordance with a jointly developed test plan. NREL will also seek partners representing a small sample of additional buildings to begin field-testing of the most-mature self-correcting controls in FY11. This work will continue and expand in FY12. Future work at NREL will involve completing development of self-correcting, self-compensating, and self-configuring controls; completion of laboratory testing in conjunction with development; and field-testing the technology in partner buildings to provide evidence of their value and reliability in practice. NREL will play a lead role in field-testing. Throughout the project, industry partners will be sought to participate in development, testing, field demonstrations, and commercialization. Applicable DOD Market:
All commercial DOD buildings with operational building automation systems (BASs).

173
Energy Savings Potential: Identification of self-correctable HVAC system faults showing potential for savings of at
least 15% of HVAC unit/system energy consumption.
Potential Commercialization Date: 4th Quarter 2012 Contact information:
Michael Brambley, 509-375-6875, [email protected]
Larry Brackney, 303-384-7443, [email protected]
Demonstration Potential: 5 The demonstration potential for this technology was ranked high based on the need for extensive field testing to prove the validity of the approach to implementing self-correcting HVAC system fault control algorithms. Opportunity #2 - Image Processing Occupancy Sensor Controls Cost-effective, embedded image processing techniques are currently being developed at NREL to address fundamental deficiencies in occupancy sensing technologies, while simultaneously creating entirely new information that may be exploited by BASs for temperature, ventilation, and daylighting control. As the lead laboratory on this project, NREL is responsible for integrating imaging processing algorithm recommendations from ORNL into the embedded system design, performing control demonstrations, and establishing industry partnerships for commercialization of the technology in FY2012. Building occupancy sensing technologies have been readily available for decades; however, the fundamental operating principles have remained unchanged. Performance deficiencies that impact occupant comfort are substantial and generally result in related controls being disabled or severely under-tuned if they are included at all. This two-year project is designed to allow BTP to demonstrate a paradigm shift that eliminates present shortcomings of the technology, creates entirely new information for the next generation of building control, and creates a broader value proposition for building owners through integration of building control with security systems. The first year will result in a demonstration of a cost-effective prototype, while year two will focus on deployment. In FY10, NREL began exploratory work to investigate the state of the art of occupancy sensing and study potential embedded hardware platforms for an image processing approach to occupancy estimation. Preliminary hardware experiments began at the end of FY10 and are based around commercially available, production-like components that support open source software development. A number of tasks are currently underway that will result in a proof-of-concept demonstration of an image processing-based occupancy sensor in FY2012. Applicable DOD Market:
All commercial DOD buildings with an emphasis on commercial buildings with operational BASs.

174
Energy Savings Potential: Significant reduction in lighting and HVAC energy use through the use of occupancy
sensor-based controls in applications that are not currently utilizing occupancy
sensor-based controls or applications that have disabled the current occupancy
sensor-based controls due to the high failure rates of the given application.
Potential Commercialization Date: Fourth Quarter 2012 Contact information: Larry Brackney, 303-384-7443, [email protected] Demonstration Potential: 5 The demonstration potential for this technology was ranked high based on the novel approach to occupancy sensor based control that has a general applicability to a number of building control functions. In addition, this type of technology will need to be fully vetted through a number of field demonstrations to prove its effectiveness, ease of integration, and overall life-cycle cost effectiveness. Opportunity #3 - Building-Wide, Proactive Energy Management Systems for High-
Performance Buildings Advances in energy management systems are needed to achieve energy savings beyond the current 30% whole-building energy savings targets. A new multi-year project was developed to build a proactive energy management system that has the ability to exploit next-generation sensing technology. This system will use adaptive building-wide predictive models to forecast interactions between zonal energy consumption, ambient conditions, prices, and distributed occupant trends. The project will deploy cost-effective, next-generation sensors (occupancy, thermometry, etc.). In addition, the energy management system will be deployed using state-of-the-art optimization algorithms and personal computers. A recent DOE BTP award to Johnson Controls funds work to develop a proof-of-concept interface with utility providers to react to demand response pricing. Ongoing work at Argonne National Laboratory and NREL complements that work by extending it into a proactive, multi-dimensional optimization space with additional variables of weather and occupancy. The perceived computational complexity of building-wide energy management systems limits their industrial deployment. This fundamental research will push “smart building” concepts by creating a closer connection between the occupants, their working space, and the energy management system. The use of proactive systems can substantially improve energy savings, occupant comfort, and responsiveness. The system will use models constructed automatically using basic building topology and sensor data and fast optimization algorithms to enable implementations in standard computers. Applicable DOD Market:
All commercial DOD buildings with operational BASs that are currently served by utilities that have a significant peak demand pricing rate structures.

175
Energy Savings Potential: The main purpose of the project is to develop an interface with specific utilities that has the
ability to significantly reduce peak demand charges for individual military bases. In addition, the control schemas being developed will have ancillary benefits that will allow for additional energy savings during non peak demand periods.
Potential Commercialization Date: Second Quarter 2011 Contact information: Larry Brackney, 303-384-7443, [email protected] Demonstration Potential: 5 The demonstration potential for this technology was ranked high based on the need for extensive field testing to prove the validity of the approach to addressing peak demand response signals from local utilities. Opportunity #4 – Demonstration of an Enterprise Energy Management System
using New Standardized Data Schemas to Assist with Operational Decisions
DOD bases throughout the country typically have multiple BAS control vendors operating on a single military base due to the fact the base is required to competitively bid out each BAS project and different controls vendors will win different contracts. Consequently DOD bases have the means to collect massive amounts of building data through the existing BASs, but have difficulty transforming the data into usable information and energy saving actions. The challenges include the following:
There is too much data to manage with current technology.
There is too little action as a result.
Assignment of descriptive information (metadata) to raw data and making this metadata accessible to the end user (point mapping) is currently a tedious, manual, and error-prone process.
New products continue to enter the market, but they do not address the underlying problems specific to this business model.
The Commercial Building Energy Alliances initiative sponsored by the DOE’s BTP is currently working through the Whole Building Systems Subcommittee to produce feature specifications for enterprise energy management systems. Enterprise energy management systems have the ability to centralize the functions of all BAS systems on a military base to a central control system and incorporate innovative fault detection and diagnostic capabilities. Although applications exist today that offer some sophisticated features at the enterprise level, members of the Commercial Building Alliance report inconsistent success in matching enterprise energy management system capabilities to owner needs. Major concerns include distillation of numerous data, translation of data into actions, and communication between Building Energy Management Systems of varying ages.

176
NREL has developed proposals with a series of private sector clients to perform a demonstration of a newly created and enhanced communication protocol for the transfer of building operational data to a central operating center. The primary of focus of the project is to establish a standardized data schema that provides the necessary descriptive information for retail building control and monitoring points. This would allow current and future algorithms to transform raw data into actionable information and insights. Existing standards do not specifically address this challenge but can serve as a starting point and be enhanced to meet this need. Candidates include: Building Automation and Control Network (BACnet) Web Services (Addendum) and BACnet XML (Addendum); oBIX; and others. If the tremendous growth in the energy information systems market were to continue without first establishing a standardized data schema, users would continue to face problems with extracting useful direction from the numerous data made available by these products. An improved mapping of points would also increase the scalability of Fault Detection and Diagnostic solutions and the linking of building operational data to Computerized Maintenance Management Systems. This standardized data schema could be used for retrofit projects that include BAS upgrades. Applicable DOD Market:
All commercial DOD buildings with operational BASs.
Energy Savings Potential: Centralization of BASs and implementation of basic automated fault detection and
diagnostics shows potential for savings of at least 10% of HVAC unit/system energy consumption
Potential Commercialization Date: Unknown Contact information: Bill Livingood, 303-384-7490, [email protected] Demonstration Potential: 5 The demonstration potential for this technology was ranked high based on the need for extensive field testing to prove the validity of the approach to centralizing BAS functionalities through an enterprise energy management that uses standardized data schemas. Opportunity #5 – Augmented Reality Building Operations Tool (ARBOT) Building system faults are often difficult to diagnose and thus interfere with the proper operation of commercial buildings. Underperformance of building components is a common and widespread contributor to poor energy efficiency and often goes undiagnosed because the systems are complex, training for building owners and operators is lacking, or the diagnostic procedure is difficult to execute. NREL has developed a new concept to address the need for developing and demonstrating a novel diagnostic tool based on augmented reality technology that is highly integrated with BASs This tool will transform how operators achieve maximum building efficiencies by making key information readily available in relevant context that is easy to use and understand by building operators.

177
AR represents a combination of technologies used to blend digital information with real-time images, creating a richer experience for users than if they look at the live images. Compelling uses of augmented reality have recently begun to appear on mobile “smart phone” platforms. Typical applications employ the embedded geographical positioning system, compass, and video camera capabilities of the smart phone to place contextually relevant and useful information over live video. Examples include overlaying realtor listing data when pointing the phone at a house or showing restaurant or point-of-interest information when panning the camera across storefronts. A few potential use cases for augmented reality technology in a building system diagnostics context are described in the appendix attached to this proposal. These use cases illustrate only a few ways in which the ARBOT would work in concert with BASs and enterprise-level operation and maintenance tools. This project is currently an unfunded activity, but has the potential to lay the groundwork for realizing these and other use cases to create a technology demonstration involving an augmented reality visualization client on a smart phone platform alongside a database server connected to a production BAS in the Research Support Facilities. The server will leverage the BACnet standard to enable interoperability with a range of vendor EMS products. A number of sample use cases will be developed and implemented as part of the technology demonstration. NREL has submitted a provisional patent application to protect the ARBOT concept. This internet protocol could be licensed to companies that operate in the building automation space. This project is expected to run over a period of two years. The first year will be spent developing the client and server architecture and software for the prototype. The balance of the project will be spent implementing and demonstrating specific use cases in the Research Support Facilities using the existing BAS. Use Case 1: During a routine walkthrough of a shopping mall, a building operator pans her iPhone across the SA diffusers. She points her phone at each diffuser, and a graphic appears allowing her to quickly visualize SA temperature and flow information (see Figure 66). Panning back and forth, she notes that one diffuser flow is lower than the others. She taps the screen near the diffuser, and a window with more detailed diagnostic information about a related variable-air volume box appears. Although no fault flag is indicated, one pressure point appears low. She checks a box on the graphical user interface (GUI) to note the potential problem on her phone. This is automatically registered with the issue tracking database, along with a repair priority code, time, date, part description, and the location of the sensor.

178
Figure 66. Mockup of augmented reality use case for variable-air volume box diagnostic (Source:
NREL)
Use Case 2: An engineer is checking the results of his advanced daylighting system several weeks after it was deployed. He was confident in the results at the time of commissioning, but he has received complaints from several occupants about light quality. The engineer sweeps his PDA across the open plan office space. In addition to the office, he sees graphical indication of the relative luminous power and power consumption from the smart ballasts in his field of view, along with a record of the number of bulb changes and clear indications of occupancy or vacancy (see Figure 67). Moving around the space he notes that the luminous power indicated in a heavily occupied corner of the office is low. He taps the light on his screen with a stylus to pull up a daylighting control GUI. He continues to adjust the gain until he and the occupants are satisfied with the level of illumination. Before moving to another section of the office, he makes a note to check this area later in the day.
Figure 67. Mockup of augmented reality use case for daylighting (Source: NREL)

179
Use Case 3: A technician is responding to a temperature complaint from an occupant. He shows up at the occupant’s office and uses his smart phone to quickly determine that the space temperature is indeed high. He walks down a hallway from the office using his phone to “see” temperatures, pressures, and flows in the ductwork by periodically pointing his phone at the wall or ceiling, noting higher than normal temperatures along the way. He soon traces a path to a chiller unit. He “looks” at the chiller through his phone (see Figure 68), and decides it is working normally. He inspects other temperatures and flows in the vicinity and suspects that a specific economizer damper has stuck open. He taps the screen to put the damper in hand, verifying that it is stuck. Another tap on the GUI brings up a list of parts, tools, and instructions he needs to make a repair. He was able to quickly diagnose the problem by himself, even though the BAS terminal was located far from the problem area and the points he effectively checked were scattered throughout the terminal’s database.
Figure 68. Mockup of augmented reality use case for chiller diagnostic (Source: NREL)
Applicable DOD Market:
All commercial DOD buildings with operational BAS systems. This type of control has the potential to revolutionize the way building operators evaluate the operation of building systems, identify system faults, identify maintenance tasks, and retro-commission buildings. The easy-to-use and understand platform has the potential to save hundreds of hundreds of thousands of dollars a year at all military bases throughout the country.
Energy Savings Potential:
Identification of self-correctable HVAC system faults showing potential for savings of at least 15% of HVAC unit/system energy consumption
Potential Commercialization Date: Unknown

180
Contact information: Larry Brackney, 303-384-7443, [email protected] Demonstration Potential: 5 The demonstration potential for this technology was ranked high based on the need for extensive field testing to prove the validity of the approach to analyzing the operation of a variety of types of building systems. Opportunity #6 – Multiple Opportunities through PNNL’s Fault Detection and
Diagnostics and Wireless Controls Programs In addition to the PNNL projects listed above, PNNL currently has a number of fault detection and diagnostics and wireless controls projects funded by DOE’s BTP. Active research projects are listed below:
Fault Detection and Diagnostics
Whole Building Diagnostician
Automated Diagnostic Algorithms for Chiller, Boilers, Cooling Towers, and Chilled Water Distribution
Web Based Automated Diagnostics
Diagnostics for Packaged HVAC Units
Wireless End-Use Metering
Ambient Power Harvesting
Wireless Terminal Box Sensing and Control.
NREL does not have specific information on additional research projects, but would recommend contacting Michael Brambley for additional information on other opportunities. Contact information: Michael Brambley, 509-375-6875, [email protected] Opportunity #7 – Demand Response Research Center at Lawrence Berkeley
National Laboratory Lawrence Berkeley National Laboratory has an active demand response research program with potential research applications to DOD bases, two of the main sub-programs are provided below.
Characterization and Demonstration of Demand Responsive Control Technologies and Strategies in Commercial Buildings
Automated Facility Demand Response. Contact information: [email protected], http://drrc.lbl.gov/ The following opportunities are briefly mentioned in an attempt to provide contact information to the organizations outside of the DOE BTP that are currently working on Advanced Controls and Integrated Commissioning and Diagnostics R&D projects.

181
Opportunity #8 – Multiple Opportunities through the California Energy Commission PIER Program
The California Energy Commission PIER program is one of the larger energy efficiency R&D programs in the country. The RD&D Division administers a total of $83.5 million in public interest energy research funds annually – $62.5 million for electricity and $21 million for natural gas; a portion of this funding then goes to Building Efficiency Research. Active research projects are listed below (taken directly from the California Energy Commission PIER Web site):
Automated AHU and Variable-Air Volume Box Diagnostics (http://www.archenergy.com/pier-
fdd/ahu_vavbox_diagnostics/ahu_vavbox_diagnostics.htm) Automating Window Sunshade Control: Toward the Zero Energy House
(http://www.energy.ca.gov/pier/portfolio/PIERwrite-ups.htm)
Advanced Onboard Diagnostics for Air Conditioners and Heat Pumps (http://www.energy.ca.gov/pier/portfolio/Content/06/EISG/Advanced%20Onboard%20Diagnostics.htm)
Self-Optimized Controllers for Air Conditioners (http://www.energy.ca.gov/pier/portfolio/Content/06/EISG/Self%20Optimized%20Controllers.htm)
Development of a Wireless Lighting Control Network (http://www.energy.ca.gov/pier/portfolio/Content/06/EISG/Development%20of%20a%20Wireless.htm).
In addition to the active projects, there are a number of completed projects that could serve as appropriate DOD demonstrations. Contact information: Deputy Director: Laurie ten Hope, 916-654-4878 http://www.energy.ca.gov/research/contactus.html Opportunity #9 – Multiple Opportunities through the University of Colorado’s
Building Systems Program The University of Colorado is currently developing a number of new self-optimizing control strategies through partnerships with private sector companies under the leadership of Professor Gregor Henze. His current research projects are listed below (taken directly from his Web site):
Model-based predictive optimal control and model-free reinforcement learning control of building energy systems and building thermal mass
Model-based benchmarking of building operational performance
Whole-building fault detection and diagnosis
Building occupancy detection using distributed sensor belief networks
Design and control strategies for mixed-mode buildings that incorporate both natural and mechanical ventilation
Time-series prediction and forecasting.

182
Contact information: Gregor Henze, Professor in the Building Systems Program, 303-492-1094, [email protected] (http://ceae.colorado.edu/dept/?nid=73) Opportunity #10 – Multiple Opportunities through the California Lighting
Technology Center The California Lighting Technology Center is currently managed by the University of California–Davis and has a number of applicable research projects (taken directly from the Web site).
Self Commissioning Dual Loop Sensor Dimming Technology for Daylight Harvesting (http://cltc.ucdavis.edu/content/view/142/164/)
Ubiquitous Communication by Light (http://cltc.ucdavis.edu/content/view/819/411/)
Cost Effective Demand Response (CEDR) (http://cltc.ucdavis.edu/content/view/87/89/).
Contact information: 530-747-3838, http://cltc.ucdavis.edu/content/view/23/64/ Opportunity #11 – Potential Opportunities through Texas A&M Energy Systems
Laboratory and University of Nebraska’s School of Architectural Engineering
The Texas A&M Energy Systems Laboratory and Nebraska School of Architectural Engineering were the founders of the continuous commissioning procedures and have active R&D programs.
University of Nebraska School of Architectural Engineering (http://engineering.unl.edu/academicunits/architectural-engineering/index.shtml)
Texas A&M Energy Systems Laboratory (http://esl.eslwin.tamu.edu/esl.html).
Lighting Lighting currently accounts for 25% of the electricity used in the federal sector and represents a significant opportunity for energy savings. The DOE partners with industry, universities, and national laboratories to accelerate improvements in solid state lighting technology. These collaborative, cost-shared efforts focus on developing an energy-efficient, full spectrum, white light source for general illumination. DOE supports solid state lighting research in six key areas: quantum efficiency, longevity, stability and control, packaging, infrastructure, and cost reduction. DOE’s long-term R&D goal calls for white-light light-emitting diodes (LEDs) producing 160 lm/W in cost-effective, market-ready systems by 2025. Currently, LEDs can only perform similarly to fluorescent lamps and only make sense for specific applications. The majority of the DOE BTP’s R&D investments in new technologies are going to solid state lighting R&D. In 2009, the total BTP investment was $30.64 million with a $10.8 million cost share (U.S. DOE/EERE undated). Current demonstrations are listed in Table 31 and Table 32.

183
Table 30. DOE solid-state lighting R&D projects (Source: U.S. DOE Solid State Lighting Program)
Project Title Investigating Organization DOE Share Contractor
Share Contract Period
Core Technology II Epitaxial Growth of GaN Based Led Structures on Sacrificial Substrates
Georgia Institute of Technology
$756,050 $277,639 10/01/06 – 12/31/09
Low-Cost Substrates for High-Performance Nanorod Array LEDs
Purdue University $899,948 $225,195 05/01/06 – 04/30/09
High-Performance Green LEDs by Momoepitaxial MOVPE
Rensselaer Polytechnic Institute
$1,830,075 $1,137,475 08/22/06 – 08/23/09
Photoluinescent Nanofibers for High-Efficiency Solid-State Lighting Phosphors
Research Triangle Institute
$1,509,903 $377,475 09/01/06 – 03/31/10
Innovative Strain-Engineered InGaN Materials of High-Efficiency Deep-Green Light Emission
Sandia National Laboratories
$1,797,000 10/01/06 – 09/30/09
High-Efficiency Nitride-Based Photonic Crystal Light Sources
University of California, Santa Barbara
$1,200,000 $300,000 08/01/06 – 07/31/09
Totals $7,992,976 $11,317,366 Product Development II
An Integrated Solid-State LED Luminaire for General Lighting
Color Kinetics Incorporated
$1,741,444 $581,942 10/01/06 – 03/31/09
Phosphor Systems for Illumination Quality Solid-State Lighting Products
General Electric Global Research
$2,495,744 $1,343,878 10/01/06 – 09/30/09
Totals $4,237,218 $1,925,820 Core Technology II
Novel Heterostructure Designs for Increased Internal Quantum Efficiencies in Nitride LEDs
Carnegie Mellon University
$1,426,184 $363,638 10/01/07 – 09/30/10
High-Efficiency Non-Polar GaN-Based LEDs
Inlustra Corporation $1,440,000 $360,000 10/01/07 – 11/30/10
Improved InGaN epitaxial Quality by Optimizing Growth Chemistry
Sandia National Laboratories
$785,000 08/01/07 – 08/31/09
Multicolor, High-Efficiency, Nanotextures LEDs
Yale University $900,000 $225,153 10/01/07 – 09/30/10
Totals $1,231,877 $948,791 Product Development III
LED Chips and Packaging for 120 LPW SSL Component
Cree Inc. $1,231,877 $410,624 10/01/07 – 09/30/09

184
Table 31. U.S. DOE solid-state lighting R&D projects
Project Title Investigating Organization DOE Share Contractor
Share Contract Period
Core Technology IV GaN-Ready Aluminum Nitride Substrates for Cost-Effective, Very Low Dislocation Density III-Nitride LEDs
Crystal IS Inc. $1,029,343 $257,337 05/01/08 – 04/30/10
Fundamental Studies of Higher Efficiency III-N LEDs for High-Efficiency High-Power Solid-State Lighting
Georgia Institute of Technology
$1,503,626 $698,473 09/01/08 – 08/30/11
High Extraction Luminescent Materials for Solid-State Lighting
Phosphortech Corporation
$1,404,645 $351,277 06/01/08 – 05/31/11
Novel Defect Spectroscopy of InGaN Materials for Improved Green LEDs
Sandia National Laboratories
$1,340,000 04/01/08 – 03/31/11
Totals $5,277,614 $1,307,087 Product Development IV
Efficient White SSL Component for General Illumination
Cree Inc. $1,995,988 $562,971 04/01/08 – 03/31/10
Affordable High-Efficiency Solid-State Downlight Luminaires with Novel Cooling
General Electric Global Research
$2,164,530 $721,510 07/15/08 – 04/30/10
Enhancement of Radiative Efficiency with Staggered InGaN Quantum Well Light-Emitting Diodes
Lehigh University $598,445 $150,481 06/01/08 – 05/31/11
High-Quality Down Lighting Luminaire with 73% Overall System Efficiency
OSRAM SYLVANIA Development Inc.
$873,526 $218,381 07/01/08 – 06/30/10
100 Lumen per Watt 800 Lumen Warm White LED for Illumination
Philips Lumileds Lighting, LLC
$2,649,900 $2,649,900 09/15/08 – 09/14/10
Totals $8,282,389 $4,303,2423 Other Efforts
Sintered Conductive Adhesives for HB-LED Thermal Management
Aguila Technologies Inc.
$99,889 06/01/08 – 01/30/09
Thermal Management for High-Brightness LEDs
Aqwest LLC $99,358 08/29/08 – 03/30/09
Built-in Electrofluidic Thermo-Management of Solid-State Illumination Arrays
Physical Optics Corporation
$99,992 06/01/08 – 01/30/09
Totals $299,239

185
Based on the technical nature of the demonstrations and the fundamental manufacturing R&D associated with a number of these projects it is difficult to point to specific technologies that will spin out of these R&D programs. Additional information on each project is available through the solid state lighting R&D Web site (http://www1.eere.energy.gov/buildings/ssl/projects.html#2008portfolio) The DOE solid state lighting program also has a number of innovative market-based programs (http://www1.eere.energy.gov/buildings/ssl/), one of which includes a “GATEWAY Demonstration” program. The completed new-technology demonstration projects are listed below:
LED Retrofit Lamps: San Francisco, California
LED Museum Accent Lighting: Chicago, Illinois
LED Parking Lot Lighting: Manchester, New Hampshire
LED Roadway Lighting: Palo Alto, California
LED Street Lighting: Lija Loop, Portland
LED Freezer Case Lighting: Albertson’s Grocery
LED Roadway Lighting: I-35W Bridge
LED Parking Lot Lighting: Raley’s Supermarket
LED Street Lighting: City of San Francisco
LED Parking Garage Lighting: Providence Portland Medical Center (PPMC)
LED Residential Downlights and Undercabinet Lights: 2008 Eugene Tour of Homes
LED Walkway Lighting: Federal Aviation Administration (FAA) Technical Center
LED Street Lighting: City of Oakland.
The first step for DOD would be to transfer the lessons learned from these new SSL demonstration projects to DOD energy managers and resource efficiency managers at military bases throughout the country. The next step would be to reach out to the program manager and understand what potential opportunities exist to partner with the current program moving forward. This program is administered out of PNNL by Bruce Kinzey. Contact information: Bruce Kinzey, 503-417-7564, [email protected] In addition to the new technology demonstration projects administered by PNNL, the DOE solid state lighting program also hosts two annual lighting competitions “Lighting for Tomorrow” http://www.lightingfortomorrow.org/ and “Next Generation Luminaires” http://www.ngldc.org/. There are a number of technologies that need field testing that are performing well in these design competitions. It is beyond the scope of this report to characterize all of the solid state lighting technologies that will need field testing in the future. Thus, two of the general categories of lamp replacements and fixture replacements that are starting to emerge as legitimate replacements for screw incandescent or compact fluorescent light lamps and general space lighting of linear fluorescent technologies are provided. These two lighting markets are two of

186
the larger end-use markets and have the potential to significantly reduce lighting energy use at DOD facilities. Opportunity #1 – 2010 Solid State Lighting Competition – Winner (EnduraLED A19
Lamp, by Philips Lighting) “A new dimmable 12 watt EnduraLED A19 lamp is the industry's first LED replacement for a 60 watt incandescent light bulb. Facility Managers and Property Owners will now have an alternative for the most common bulb that delivers the same soft white light and shape they are familiar with. Replacing a standard 60 watt bulb with the EnduraLED A19, which uses just 12 watts of power and delivers an industry benchmark of 806 lumens, could save a business or commercial property up to $120 over the course of the life of the lamp.” (Lighting for Tomorrow 2010).
Demonstration Potential: 5 The demonstration potential for this type of technology was ranked high based on the need for field testing to prove the validity and longevity of the technology. Dimming compact fluorescent light bulbs have proven to be problematic and are not widely used by building managers because of premature failures and changes in color temperature. These new LED lamps are most appropriate for dimming applications and UV sensitive applications such as museums and could also be applied to general space lighting applications. Opportunity #2 – 2010 Next Generation Luminaires Indoor – General Illumination
Lighting Winner (“CAREENA LED” by Zumtobel Lighting, Inc.) “CAREENA is a 2x2 luminaire with high light output and efficacy for its size. CAREENA achieves generally uniform luminosity and good brightness control through a multi-layered, micro-pyramidal optic. The LED board and driver are field replaceable. The 5" deep luminaire is available in for either recessed (not lay-in) or surface installation.”
Figure 69. 12-W LED replacement of 60-W incandescent (Courtesy of Zumtobel, reprinted with
permission)
187
The light fixture has an efficiency of 63.9 lm/W. As the efficiency of these light fixtures continues to increase (above 80 lm/W) and the installed costs continue to decrease, these LED fixtures will begin to emerge as the better solution to general space lighting applications. Demonstration Potential: 5 The demonstration potential for this type of technology was ranked high based on the need for extensive field testing to prove the validity and longevity of the technology. General space lighting with LED fixtures that replace linear fluorescent fixtures is the next major lighting market that LED fixtures will start to take over. Successfully demonstrating their cost effectiveness in a DOD facility is needed to ensure their adoption into the future. Opportunity #3 – Novel Lighting Control Opportunities In addition to the novel lighting control system solutions currently being developed at NREL, a number of commercial products exist that have the potential to drastically reduce energy use of commercial lighting systems. The major advancement of addressable ballasts allows lighting designers to integrate dimming, occupancy sensor control, and detailed scheduling at the ballast level. Addressable ballasts provide an I/O point for the ballast that is connected to a centralized computer that makes it easy to track energy savings, set schedules, and diagnose operational problems. NREL has worked in federal facilities that have realized a 30% – 50% reduction in lighting energy use through these advanced control systems and Lawrence Berkeley National Laboratory worked with the GSA to demonstrate over 40% savings at a few GSA buildings (Rubenstein and Enscoe 2010). A few vendors of advanced lighting control systems are listed below:
http://www.daintree.net/index.php
http://www.lutron.com/Pages/Default.aspx
http://www.encelium.com/
Demonstration Potential: 5 The Environmental Security Technology Certification Program has a similar demonstration with Phillips, but NREL would recommend testing the same approach with a number of different vendors to understand the strengths and weaknesses of each vendor. This approach has significant energy savings potential at DOD bases, and DOD could use the results of these tests to develop a standardized lighting system control specification. Opportunity #4 – Multiple Opportunities through the California Energy
Commission PIER Program The California Energy Commission PIER program is one of the larger energy efficiency R&D programs in the country. Active research projects that are applicable to advanced lighting systems are listed below (taken directly from the California Energy Commission PIER Web site):
Development of a Wireless Lighting Control Network

188
http://www.energy.ca.gov/pier/portfolio/Content/06/EISG/Development%20of%20a%20Wireless.htm
Development of an Energy-Efficient, Ultra-Thin LED Luminaire
http://www.energy.ca.gov/pier/portfolio/Content/06/EISG/Development%20of%20an%20energy%20Efficient.htm
In addition to the active projects, there are a number of completed projects that could serve as appropriate DOD demonstrations. Contact information: Deputy Director: Laurie ten Hope, 916-654-4878 http://www.energy.ca.gov/research/contactus.html Recommendations This study shows that whole building design and retrofit strategies should take precedence over single technology applications and retrofits. The top recommendations are to pursue energy modeling, model optimization, and energy auditing tools as recommended in the Whole Building Design Section to support a whole-building design approach. Beyond that, several technologies are seen as high priority for investment (rating level 5) and these topics have been expanded upon above. These high-priority topics include:
Triple-Paned Window Bulk Purchase Program
Integrated Roof Systems (Generation, Cool Roofs, Water Catchment)
Desiccant Based Indirect Evaporative Cooling System (DEVap)
Advanced Rooftop Air-Conditioning Units
Ground Source Integrated Heat Pump (GS-IHP)
New Foundation Heat Exchanger
Compact Prefabricated New Foundation Heat Exchanger
Self-Correcting and Self-Configuring HVAC Controls
Image Processing Occupancy Sensor (IPOS) Controls
Building-Wide, Proactive Energy Management Systems for High-Performance Buildings
Demonstration of an Enterprise Energy Management System using New Standardized Data Schemas to Assist with Operational Decisions
2010 Solid State Lighting Competition – Winner (EnduraLED A19 Lamp, by Philips Lighting)
2010 Next Generation Luminaires Indoor – General Illumination Lighting Winner (“CAREENA LED” by Zumtobel Lighting, Inc.)
Novel Lighting Control Opportunities

189
References
Aabakken, J. (ed.). (2006). Power Technologies Energy Data Book. NREL/TP-620-39728. Golden, CO: National Renewable Energy Laboratory. http://www.nrel.gov/analysis/power_databook/; accessed September 2010.
Action 21. (2010). “Building Envelope Loss Diagram.” http://www.action21.co.uk/; accessed December 2010.
Aldridge, T.; AlLee, G.; Dupy, D.; Kumar, P.; and Pratt, A. (2010). “Evaluating 400V Direct-Current [380V Nominal] for Data Centers: A Case Study Comparing 400 Vdc [Now Named 380VDC] with 480-308 Vac Power Distribution for Energy Efficiency and Other Benefits.” Portland, OR: Intel Labs. http://www.intel.com/technology/eep/data-center-efficiency/index.htm); accessed December 2010.
American Wind Energy Association (AWEA). (2010). Small Wind Turbine Global Market Study. http://www.awea.org/documents/2010_AWEA_Small_Wind_Turbine_Global_Market_Study.pdf; accessed December 2010.
Anderson, K.; Markel, T. (2010). Targeting Net Zero Energy at Fort Carson: Assessment and Recommendations. Final Report. Fort Carson, Colorado Springs, Colorado. Prepared by National Renewable Energy Laboratory. Appendix A—Electrical Vehicle Grid Integration; pp. 119–150. Golden, CO: National Renewable Energy Laboratory.
Argonne National Laboratory (ANL). (2010). “Overview of Solar Energy Power Production Technologies, Development, and Regulation.” Chapter 3, Draft Programmatic Environmental Impact Statement for Solar Energy Development in Six Southwestern States; pp. 3-1–3-58. http://solareis.anl.gov/documents/dpeis/Solar_DPEIS_Chapter_3.pdf; accessed December 2010.
Arsova, L.; van Haaren, R.; Goldstein, N.; Kaufman, S.; Themelis, N. (2008). “The State of Garbage in America.” BioCycle (49:12); p. 22. http://www.jgpress.com/archives/_free/001782.html; accessed December 2010.
Aspen Aerogels. 2007. “Case Study: Aerogel Interior Wall Insulation Reduces U-Values by 44% and Lowers Energy Use and Carbon Emissions.” http://www.aerogel.com/markets/c_wall.html; accessed December 2010.
Augustine, C.; Falkenstern, D. (In Prep.). “Co-Produced Water Resource Estimate.” Golden, CO: National Renewable Energy Laboratory.
Baldwin, R. (2010). Principal Scientist and Group Manager, Thermochemical Process R&D and Biorefinery Analysis. Internal presentation, National Renewable Energy Laboratory.
Blackwell, D. and Richards, M. (2004). Geothermal Map of North America. Amer. Assoc. Petroleum Geologists, Tulsa, Oklahoma, 1 sheet, scale 1:6,500,000.

190
Brown, D.; Dirks, J. (undated). Can the Federal Energy Efficiency Goals Be Achieved Through Retrofits? Richland, WA: Pacific Northwest National Laboratory. http://eere.pnl.gov/femp/publications/EfficiencyGoalsRetrofits.pdf; accessed December 2010.
Carlisle, N.; Elling, J.; Penney, T. (2008). Renewable Energy Community: Key Elements. NREL/TP-540-42774. Golden, CO: National Renewable Energy Laboratory; 35 pp.
Christensen, C.; Barker, G. (2001). “Effects of Tilt and Azimuth on Annual Incident Solar Radiation for United States Locations.” Presented at 2001 Solar Energy Forum, Washington, D.C.
Circeo, L. (2005). “Engineering and Environmental Applications of Plasma Arc Technology.” Presented at Georgia Tech Research Institute, Atlanta, Georgia.
Cleantech Open. (2010). Driving Innovation, Trends, Technology and Investment, Preliminary Report 2010. http://www.cleanenergypipeline.com/Resources/CleantechOpen2010-Report.pdf; accessed December 2010.
ClimateMaster. (2005). “Fort Polk Demonstrates Potential for GHP Systems.” Oklahoma City, OK: ClimateMaster.
Cochran, B. and Robischau, R. and (2010) "Wind Resource Assessment for the Hart Senate Building." As noted in Federal Energy Management report on Hart Senate Building Wind Turbine Project to the Architect of the Capitol, internal report supported by ARRA funds supporting work from national laboratories to Federal Agencies.
County of Los Angeles Department of Public Works. (2007). Los Angeles County Conversion Technology Evaluation Report, Phase II Assessment. Prepared for the County of Los Angeles Department of Public Works by Alternative Resources, Inc., Concord, Massachusetts; pp. 5–111.
Cromie, R.; Neenan, B.; Wheat, T. (2010). Characterizing Consumers’ Interest in and Infrastructure Expectations for Electric Vehicles: Research Design and Survey Result. Palo Alto, CA and Rosemead, CA: Electric Power Research Institute and Southern California Edison.
Cushman, M. (26 October 2010). Personal communication. Infoscitex, Waltham, MA.
Dahle, D.; Anderson, E.; Booth, S.; Davis, J.; McGeown, G. (2010). Implement Tiger Team Report Recommendations for Fort Bliss Energy Security. American Recovery and Reinvestment Act (ARRA) Report.
Davis, J. (October 2010). Personal communication. Biomass Heat & Power, National Renewable Energy Laboratory, Golden, CO.
Denholm, P.; Ela, E.; Kirby, B.; Milligan, M. (2010). The Role of Energy Storage with Renewable Electricity Generation. NREL/TP6A247187. Golden, CO: National Renewable Energy Laboratory.

191
Denholm, P.; Markel, T.; Kuss, M. (2009). “Communication and Control of Electric Drive Vehicles Supporting Renewables.” Presented at 2009 Institute of Electrical and Electronics Engineers (IEEE) Vehicle Power and Propulsion Systems Conference.
Denholm, P.; Markel, T.; Parks, K. (2007). Costs and Emissions Associated with Plug-In Hybrid Electric Vehicle Charging in the Xcel Energy Colorado Service Territory. NREL/TP-640-41410. Golden, CO: National Renewable Energy Laboratory.
Saleem, A.; Lind, M. (2010). “Requirements analysis for autonomous systems and intelligent agents in future Danish electric power systems.” International Journal of Engineering, Science and Technology (2:3); pp. 60 – 68.
Diltz, R. (25 October 2010). Personal communication. Air Force Research Laboratory, Bioenergy, Dayton, OH.
DiPippo, R. (2005). Geothermal Power Plants: Principles, Applications, Case Studies and Environmental Impact. New York: Elsevier; p. 80.
Dutton, A.G.; Halliday, J.A.; Blanch, M.J. (2005). “Feasibility of Building-Mounted/Integrated Wind Turbines (BUWTs): Achieving Their Potential for Carbon Emission Reductions.” Energy Research Unit, Council for the Central Laboratory of the Research Councils (CCLRC), Oxfordshire, UK.
EERE, http://www1.eere.energy.gov/femp/information/download_blcc.html#blcc; accessed December 2010.
Elliot, D. (2010). “Wind Resource Assessment.” Presented at Bureau of Land Management Wind Energy Applications Technology Symposium, National Renewable Energy Laboratory, Golden, CO.
Encraft. (2009). Warwick Wind Trials Final Report. Leamington Spa, UK: Encraft. http://www.warwickwindtrials.org.uk/resources/Warwick+Wind+Trials+Final+Report+.pdf; accessed August 2010.
European Communities (2002). Atlas of Geothermal Resources in Europe. Plate 1: Heat Flow Density. Luxembourg: European Communities.
European Deep Geothermal Energy Programme (2010). What Is HDR? Soultz, France: European Deep Geothermal Energy Programme. http://www.soultz.net/fr_what_eng/frame_what.htm; accessed December 2010.
Farah-Stapleton, M.; Amabile, M. (2008). “PM C4ISR OTM—Enabling the Future Force by Supporting S&T.” Army AL&T Online. http://www.usaasc.info/alt_online/printer_friendly.cfm?iid=0811; accessed October 2010.
Gasification News. (2008). “Special Report: Waste-to-Energy Projects Stir Hopes, Controversies.” vol. 11, issue 24, dec. 10, 2008.

192
http://www.usstcorp.com/pdf/gasification_news_waste-to-energy_projects_stir_hopes,_controversies_121008.pdf; accessed October 2010.
Genivar, Ramboll, Jacques Whitford, Deloitte, and URS. (2007). “The Regional Municipality of Halton, Step 1b: EFW Technology Overview.” Report to Regional Municipality of Halton, Ontario, Canada. Work performed by Genivar, Ramboll, Jacques Whitford, Deloitte, and URS.
GeoHeat Center (2010). GeoHeat Center at the Oregon Institute of Technology. Klamath Falls, OR: GeoHeat Center. http://geoheat.oit.edu/; accessed December 2010.
Geothermal Energy Association (GEA) (2010). “Geothermal Power Plants – USA”. Washington, D.C.: Geothermal Energy Association. http://www.geo-energy.org/; accessed December 2010.
Geothermal Research Society of Japan (GRSJ). (2010). Geothermal Energy: Japan Resources and Technologies. Tokyo: Geothermal Research Society of Japan. http://wwwsoc.nii.ac.jp/grsj/index-e.html; accessed December 2010.
Grama, S.; Wayman, E.; Bradford, T. (2008). Concentrating Solar Power—Technology, Cost, and Markets. Cambridge, MA: Prometheus Institute for Sustainable Development and Greentech Media. (from 2008 Solar Technologies Market Report, http://www1.eere.energy.gov/solar/pdfs/46025.pdf
Green House Gas Reporting Guidelines, Technical Support Document. Prepared by NREL April 2010.
GreenAir Online. (2010). “Solena Jet Biofuel Project with British Airways on Track, Says CEO, As the Airline Seeks Further Supplies for Engine Testing.” http://www.greenaironline.com/news.php?viewStory=893; accessed October 2010.
Hau, E. 2006. Wind Turbines: Fundamentals, Technologies, Application, Economics.Berlin, Heidelberg: Springer-Verlag.
Hirst, E.; Kirby, B. (1995). “Ancillary Services.” Washington, D.C.: Federal Energy Regulatory Commission (FERC).
Hughes, P. J. (2008). Geothermal (Ground-Source) Heat Pumps: Market Status, Barriers to Adoption, and Actions to Overcome Barriers. Washington D.C.: U.S. Department of Energy Office of Energy Efficiency and Renewable Energy Geothermal Technology Program.
Illindala, M.; Lasseter, R.; Piagi, P.; Venkataramanan, G.; Zhang, H. (2004). Hardware Development of a Laboratory-Scale Microgrid Phase 2: Operation and Control of a Two-Inverter Microgrid. NREL/SR-560-35059. Golden, CO: National Renewable Energy Laboratory. http://www.nrel.gov/docs/fy04osti/35059.pdf; accessed December 2010.
International Energy Association (IEA). (2010). Energy Conversion Through Energy Storage. Paris: IEA. http://www.iea-eces.org; accessed November 2010.

193
International Ground Source Heat Pump Association (IGSHPA) (2008). Fort Polk—U.S. Army Saves $44 Million in Residential GHP Retrofit. Stillwater, OK: IGSHPA.
Johnson, U.S. Sen. Tim. (2010). “Defense Fiscal Year 2011 Appropriations Requests.” http://johnson.senate.gov/public/index.cfm?p=DefenseAppropriations; accessed October 2010.
Jones, S. (October 2010). Personal communication. Jaap-Orr Company, Cincinnati, OH.
Jost, W.; Ka’iliwai, G. (2009). “SPIDERS Energy Security JCTD Proposal.” http://www1.eere.energy.gov/femp/pdfs/fupwg_fall2009_jost.pdf; accessed December 2010.
KEMA. (2009). “Emerging Renewables Program [ERP] Small Wind Study: Market Infrastructure, Economics, and Market Barriers.” Presented at ERP workshop, Sacramento, California. http://www.energy.ca.gov/renewables/02-REN-1038/documents/2009-07-21_workshop/presentations/KEMA_Presentation-ERP_Small_Wind_Study.pdf; accessed December 2010.
Kroposki, B.; Lasseter, R.; Ise, T.; Morozumi, S.; Papatlianassiou, S.; Hatziargyriou, N. (May-June 2008). “Making Microgrids Work.” IEEE Power & Energy Magazine (6:3); pp. 40–53.
Kroposki, B.; Martin, G. (1985). Hybrid Renewable Energy and Microgrid Research Work at NREL. www.gbv.de/dms/tib-ub-hannover/638539234.pdf; accessed December 2010.
Kurtz, S. (2010). Opportunities and Challenges for Development of a Mature Concentrating Photovoltaic Power Industry. NREL/TP-520-43208. Golden, CO: National Renewable Energy Laboratory.
Lambert, T., Windographer Help, Mistaya Engineering, Inc. http://www.windographer.com/; accessed December 2010.
Lauber, J.; Morris, M.; Ulloa, P.; Hasselriis, F. (2006). “Local Waste-to-Energy Vs. Long Distance Disposal of Municipal Waste.” Presented at Air and Waste Management Association Conference, New Orleans, Louisiana.
Lawrence Berkeley National Laboratory (LBNL). (February 2009). CERTS Microgrid Laboratory Test Bid. Berkeley, CA: LBNL. http://certs.lbl.gov/pdf/certs-mgtb-report.pdf; accessed December 2010.
Lee, Y.; Park, S.; Kim, J.; Chan Kim, H.; Koo, M. (2010). “Geothermal Resource Assessment of Korea.” Renewable and Sustainable Energy Reviews (14); pp. 2392–2400.
Li, L. (2010). “A New Vanadium Redox Flow Battery Using Mixed Acid Electrolytes.” Presented at U.S. Department of Energy, Energy Storage Systems Program Review, Washington, D.C.
Lighting for Tomorrow. (2010). “EnduraLED A19 Lamp, 2010 Solid-State Lighting Competition Winner.”

194
http://www.lightingfortomorrow.org/2010/winners/ssl_philips_endura.shtml; accessed December 2010.
Markel, T. (2010). Plug-In Electric Vehicle Infrastructure: A Foundation for Electrified Transportation. Presented at MIT Energy Initiative Transportation Electrification Symposium, Cambridge, MA. NREL/CP-540-47951. Golden, CO: National Renewable Energy Laboratory.
Markel, T.; Smith, K.; Pesaran, A. (2009). Improving Petroleum Displacement Potential of PHEVs Using Enhanced Charging Scenarios. Presented at EVS-24 International Battery, Hybrid and Fuel Cell Electric Vehicle Symposium, Stavanger, Norway. NREL/CP-540-45730. Golden, CO: National Renewable Energy Laboratory.
Maron, D.; Climatewire. (2010). “Can Renewable Energy Make U.S. Military Bases More Secure?” Scientific American online. http://www.scientificamerican.com/article.cfm?id=can-renewable-energy-make-us-military; accessed December 2010.
McGeown, D. (19 October 2010). Personal communication. Sentech Inc., Washington, DC.
McLaughlin, L. (6 October 2010). Personal communication. Navy Region Southwest Sustainable Solid Waste Program, Leemore, CA.
Menicucci, D.; Ortiz-Moyet, J. (2009). Advanced Concepts for Controlling Energy Surety. Unpublished. Albuquerque, NM: Sandia National Laboratories.
Mitchell, T. (2010). Los Angeles County Department of Public Works. Presentation to 2nd annual Waste to Energy Finance and Investment Summit, San Diego, California.
Mols, B. (2005). “Turby—Sustainable Urban Wind Power from the Roof Top.” Delft, Netherlands: Delft University of Technology. http://www.tudelft.nl/live/binaries/32943b78-dabd-4087-9cd9-b071f0c96cd3/doc/Outlook052-18-22.pdf; accessed September 2010.
National Institute of Standards and Technology (NIST). (2010). “Smart Grid Homepage.” http://www.nist.gov/smartgrid; accessed December 2010.
National Renewable Energy Laboratory (NREL). (2010). Fort Irwin Solar Power Project. http://www.nrel.gov/csp/solarpaces/project_detail.cfm/projectID=78; accessed December 2010.
NREL PVWATTS. (2010). “A Performance Calculator for Grid-Connected PV Systems.” Version 1. http://rredc.nrel.gov/solar/calculators/PVWATTS/version1/; accessed December 2010.
North American Electric Reliability Corporation (NERC). (2009). 2009 Long-Term Reliability Assessment: 2009–2018. Princeton, NJ: NERC.
Oak Ridge National Laboratory (ORNL). (2005). Big Savings from the World’s Largest Installation of Geothermal Heat Pumps at Fort Polk, LA. Oak Ridge, TN: ORNL. http://www.ornl.gov/sci/femp/pdfs/fortpolk.pdf; accessed December 2010.

195
Oak Ridge National Laboratory (ORNL). (2010). http://www.ornl.org/sci/engineering_science_technology/cooling_heating_power/Restructuring/Ancillary_Services.pdf; accessed December 2010.
Ontario Ministry of Agriculture Food and Rural Affairs. (2010). “Electricity Generation Using Small Wind Turbines at Your Home or Farm.” Figure 8, Diagram of a Grid-Tied Wind Electric System, Phantom Electron Corporation. http://www.omafra.gov.on.ca/english/engineer/facts/03-047.htm; accessed December 2010.
People of Guam. (2010). Geography of Guam. Hagåtña, Guam. http://ns.gov.gu/geography.html; accessed December 2010.
PLascoEnergy Group. (2008). “Recovering Maximum Value from Ottawa’s Waste.” http://www.zerowasteottawa.com; accessed October 2010.
Power from the Sun. (2001). “Central Receiver Systems.” http://www.powerfromthesun.net/Chapter10/Chapter10new.htm; accessed December 2010. Presented at the Massachusetts Institute of Technology Energy Initiative Transportation Electrification Symposium, Cambridge, MA.
Price, S.; Margolis, R. (2010). 2008 Solar Technologies Market Report. DOE/GO-102010-2867. Washington, DC: U.S. Department of Energy. http://www1.eere.energy.gov/solar/pdfs/46025.pdf; accessed December 2010.
Provance, D. (20 October 2010). Personal communication. Concurrent Technologies Corporation, Johnstown, PA.
Psomopoulos, C.; Bourka, A.; Themelis, N. (2009). “Waste-to-Energy: A Review of the Status and Benefits in USA.” Waste Management (29:5); pp. 1718–1724.
PV FAQs. (2005). NREL/FS-520-36542. Golden, CO: National Renewable Energy Laboratory, http://www.nrel.gov/docs/fy05osti/36542.pdf; accessed December 2010.
Ramanathan, K.; Keane, J.; Noufi, R. (2005). Properties of High-Efficiency CIGS Thin-Film Solar Cells. Prepared for 31st IEEE Photovoltaics Specialists Conference and Exhibition, Lake Buena Vista, FL. NREL/CP-520-37404. Golden, CO: National Renewable Energy Laboratory.
Rocky Mountain Oilfield Testing Center (RMOTC) (2010). “Rocky Mountain Oilfield Testing Center—Geothermal.” Casper, WY: RMOTC. http://www.rmotc.doe.gov/geothermal.html; accessed November 2010.
Rubinstein, F., Enscoe, A., 2010. Achieving Energy Savings with Highly Controlled Lighting in an Open Plan Office. Berkeley, CA: Lawrence Berkeley National Laboratory. http://www.osti.gov/bridge/purl.cover.jsp;jsessionid=46388ED2A29CA26BFCD5DC4F48CCAFA5?purl=/986324-LKIY1S/; accessed December 2010.
Sabin A.; Bjornstad, S.; Lazaro, M.; Meade, D.; Page, C.; Alm, S.; Tiedeman, A.; Huang, W. (2010). “Navy's Geothermal Program Office: Overview of [American] Recovery [and

196
Reinvestment] Act –Funded Exploration in California and Nevada and Other Exploration Projects." Prepared for the 2010 Geothermal Resource Council Annual Meeting, Sacramento, California.
Sanner, B.; Karytsas, C.; Mendrinos, D.; Rybach, L. (2003). “Current Status of Ground Source Heat Pumps and Underground Thermal Energy Storage in Europe.” Geothermics (32:4–6); pp. 579–588.
Seibt, P.; Kabus, F.; Hoth, P. (2005). “The Neustadt-Glewe Geothermal Power Plant—Practical Experience in the Reinjection of Cooled Thermal Waters into Sandstone Aquifers.” Prepared for the World Geothermal Conference, Antalya, Turkey.
Sjrecycles, http://www.sjrecycles.org/conversion-technology/Summary-of-Findings.xls; accessed October 2010.
Society of Automotive Engineers (SAE) International. (2010). “SAE Electric Vehicle and Plug-In Hybrid Electric Vehicle Conductive Charge Coupler.” Product Code J1772. Warrendale, PA: SAE International.
Strategic Environmental Research and Development Program (SERDP)/Environmental Security Technology Certification Program (ESTCP). (2010). “50-kW Demonstration of SolarPoint Power System—A Concentrating Photovoltaic System for Distributed, Low-Cost Power Production.” http://serdp-estcp.org/Program-Areas/Energy-and-Water/Energy/Distributed-Generation/EW-200930/EW-200930/(modified)/04Aug2010; accessed December 2010.
Serpen, U.; Aksoy, N.; Ongur, T. (2010). “Present Status of Geothermal Energy in Turkey.” Prepared for the 35th Workshop on Geothermal Reservoir Engineering, Stanford, California.
Smith Electric Vehicles. (2009). www.smithelectric.com; accessed December 2010.
Steward, D.; Saur, G.; Penev, M.; Ramsden, T. (2009). Lifecycle Cost Analysis of Hydrogen Versus Other Technologies for Electrical Energy Storage. NREL/TP-560-46719. Golden, CO: National Renewable Energy Laboratory.
Stewart, J. (2010). Chair, Bioenergy Producers Association. Remarks presented July 19, 2010, at 2nd annual Waste to Energy Finance and Investment Summit, San Diego, California.
Torres, J. (2010).“Energy Surety Microgrids™.” Presented at IEEE Transactions Power Systems. https://renewable-energy-rodeo.com/agenda/Presentations/SmartGrids_topic1.pdf; accessed December 2010.
U.S. Department of Defense (DOD). (2007). Ground-Source Heat Pumps at Department of Defense Facilities. Washington, DC: U.S. DOD.
U.S. Department of Defense (DOD). (2010). Annual Energy Management Report Fiscal Year 2009. Office of the Deputy Under Secretary of Defense (Installations and Environment). Washington, DC: U.S. DOD.

197
U.S. Department of Energy (DOE). 2007. Annual Report to Congress on Federal Government Energy Management and Conservation Programs FY 2007. http://www1.eere.energy.gov/femp/pdfs/annrep07.pdf; accessed December 2010.
U.S. Department of Energy (DOE). (no date). Building Technologies Program: Planned Program Activities for 2008–2012. Office of Energy Efficiency and Renewable Energy. http://apps1.eere.energy.gov/buildings/publications/pdfs/corporate/myp08complete.pdf; accessed December 2010.
U.S. Department of Energy (DOE). (2008). Buildings Energy Data Book, 2009. Office of Energy Efficiency and Renewable Energy. http://buildingsdatabook.eren.doe.gov/; accessed December 2010.
U.S. Department of Energy (DOE). (2008). Multi Year Program Plan 2008–2012. Solar Technologies Program. Washington, DC: U.S. DOE. http://www1.eere.energy.gov/solar/pdfs/solar_program_mypp_2008-2012.pdf; accessed December 2010.
U.S. Department of Energy (DOE). (2008). “Solar FAQs—Photovoltaics—The Basics.” Solar Energy Technologies Program. http://apps1.eere.energy.gov/solar/cfm/faqs/third_level.cfm/name=Photovoltaics/cat=The%20Basics; accessed December 2010.
U.S. Department of Energy (DOE). (2009). “FY 2010 Congressional Budget Request.” http://www.cfo.doe.gov/budget/10budget/Content/Volumes/Volume3.pdf; accessed December 2010.
U.S. Department of Energy (DOE). (2009). Solar Technologies Program FY2008 Annual Report. DOE/GO-102009-2662. Washington, DC: DOE. http://www.nrel.gov/docs/fy09osti/43987.pdf; accessed December 2010.
U.S. Department of Energy (DOE). (2010). “Building Life-Cycle Cost (BLCC) Programs.” Energy Efficiency & Renewable Energy Federal Energy Management Program. Washington D.C.: U.S. DOE.
U.S. Department of Energy (DOE). (2010). “Concentrating Solar Power Industry Projects.” Solar Energy Technologies Program. http://www1.eere.energy.gov/solar/csp_industry_projects.html;
U.S. Department of Energy (DOE). (2010). “Energy Efficiency & Renewable Energy.”
accessed December 2010.
http://www.eere.energy.gov/; accessed December 2010.
U.S. Department of Energy (DOE). (2010). “FY 2011 Statistical Table by Appropriation.” www.mbe.doe.gov/budget/11budget/Content/Approstat.pdf; accessed December 2010.
U.S. Department of Energy (DOE). (2010). Geothermal Energy Production with Co-Produced and Geopressured Resources. Energy Efficiency and Renewable Energy Geothermal Technologies Program. Washington, DC: DOE.

198
http://www1.eere.energy.gov/geothermal/pdfs/low_temp_copro_fs.pdf; accessed November 2010.
U.S. Department of Energy (DOE). (2010). Geothermal Technologies Program Projects Database. Energy Efficiency and Renewable Energy Geothermal Technologies Program. Washington, DC: DOE. http://www1.eere.energy.gov/geothermal/projects/; accessed November 2010.
U.S. Department of Energy (DOE). (2010). “Solid-State Lighting Research and Development Projects.” Energy Efficiency and Renewable Energy. http://www1.eere.energy.gov/buildings/ssl/projects.html#2008portfolio; accessed December 2010.
U.S. Department of Energy (DOE). (2010). “Photovoltaic Goal of $1 per Watt.” Solar Energy Technologies Program. http://www1.eere.energy.gov/solar/dollar_per_watt.html; accessed December 2010.
U.S. Energy Information Administration (EIA). (2010). “Average Retail Price of Electricity to Ultimate Customers by End-Use Sector, by State.” http://www.eia.doe.gov/cneaf/electricity/epm/table5_6_b.html; accessed December 2010.
U.S. Energy Information Administration (EIA). (2010). “Net Generation by Energy Source: Total (All Sectors).” www.eia.doe.gov/cneaf/electricity/epm/table1_1.html; accessed December 2010.
U.S. General Services Administration (GSA). (2010). “Important Fleet Publications.” www.gsa.gov/portal/content/104230; accessed August 2010.
U.S. Geological Survey (USGS). (1975). “Assessment of Geothermal Resources in the United States—1975.” Circular 726. Arlington, VA: USGS; p. 160.
U.S. Geological Survey (USGS). (2008). “Assessment of Moderate- to High-Temperature Geothermal Resources.” Fact Sheet 2008-3082. Menlo Park, CA: USGS; p. 4.
U.S. Government Accountability Office (GAO). (2010). “Afghanistan and Iraq: DOD Should Improve Adherence to Its Guidance on Open Pit Burning and Solid Waste Management.” Washington, DC: GAO. http://www.gao.gov/new.items/d1163.pdf; accessed October 2010.
U.S. Government Printing Office (GPO). (2010). “Federal Energy Management and Planning Programs.” Electronic Code of Federal Regulations. http://ecfr.gpoaccess.gov/cgi/t/text/text-idx?c=ecfr&tpl=/ecfrbrowse/Title10/10cfr436_main_02.tpl; accessed December 2010.
UTC Power (2005). “UTC Power’s Zero-Emission PureCycle™ 200 System Gains Class I Renewable Resource Status from Connecticut DPUC.” Press release. South Windsor, CT: UTC Power. http://www.utcpower.com/fs/com/bin/fs_com_Page/0,11491,088,00.html; accessed November 2010.

199
van Dam, C.; Shiu, H.; Johnson, S. (2008). “Wind at Community and Building/Industrial Scale.” Presented at the California Energy Commission Integrated Energy Policy Report Workshop. http://www.energy.ca.gov/2008_energypolicy/documents/2008-07-31_workshop/presentations/Building_Industrial_Scale-Van%20Dam.pdf; accessed December 2010.
van Haaren, R.; Themelis, N.; Goldstein, N. (2010). “The State of Garbage in America.” BioCycle (51:10); p. 16. http://www.jgpress.com/archives/_free/002191.html#more; accessed December 2010.
Walt, R. (2010). “Possible Biomass Gasification Environmental Security Technology Certification Program.” Presentation by president of Community Power Corporation to Fort Carson, Colorado Department of Public Works staff.
Warner, J.; Haggerson, C.; Knoeller, S.; Craig, B.; Fink, C. (2009). “Tactical Renewable Energy Production: Converting Waste and Biomass to Energy and Fuel.” Advanced Materials, Manufacturing, and Testing Information Analytsis Center (AMMTIAC) Quarterly (4:3). http://ammtiac.alionscience.com/pdf/AQV4N3_ART01.pdf; accessed October 2010.
Wasson, B. (24 January 2006). “Navy Plans 30-Megawatt Power Plant at NAS Fallon.” Lahontan Valley News, Fallon, Nevada.
Waste-to-Energy Research and Technology Council (WTERT). (no date). “Energy Recovery: United States.” http://www.seas.columbia.edu/earth/wtert/globalwte_US.html; accessed October 2010.
Wood, J. (2010) “Large-Scale Energy Storage Technology Overviews” presented at U.S. Department of Energy, Energy Storage Systems Program Review, Washington, D.C.
Young, G. (2010). Municipal Solid Waste to Energy Conversion Processes. Hoboken, NJ: John Wiley and Sons; pp. 202–203.

200
Appendix A: Sampling of Small Wind Turbine Manufacturers
Source: Windustry Web site. http://www.windustry.org/
Name DescriptionAbundant Renewable Location: Oregon
Turbine sizes: 2.5 kW and 10 kWAbundant Renewable Energy Website
Bergey Windpower Location: OklahomaTurbine sizes: 1 kW to 10 kWBergey Windpower Website
Endurance Wind Power Turbine sizes: 5kW, 35kW and 50kW, Machines assembled in Canada.1-888-440-4451Endurance Wind Power
Energy Maintenance Service Location: South DakotaTurbine sizes: 35 kW and 65 kWEnergy Maintenance Service Website
Entegrity Wind Systems Location: CanadaTurbine size: 50 kWEntegrity Wind Systems Website
Fuhrlaender Location: Germany. Lorax Energy in New YorkTurbine sizes: 250 & 600 kW, 1.25, 1.5 & 2.5 MWLorax EnergyFuhrlaender Website
Gaia - Wind Location(s): United Kingdom, Denmark Turbine Types: Grid-connect, stand alone, wind/diesel, and other productsGaia-Wind's Website
Next Generation Power Next Generation Power Systems1502 17th St SEPipestone, MN [email protected] of small wind systems and SolarBank System
Northern Power Systems 29 Pitman RoadBarre, Vermont 05641 schools, farms, businesses, municipalities, remote villages, and rural [email protected]
Proven Energy Location: Wardhead Park, Stewarton, Ayrshire, KA3 5LH, Scotland, UK.Turbine size: 3.2 kW, 6 kW, and 15 kWProven Energy Website
ReDriven Power Inc. Turbine sizes: 2-20 kWReDriven Power Inc.24 Bath Rd, Iroquois, OntarioCanada, K0E 1K0www.redriven.net
Southwest Windpower Location: ArizonaTurbine size: 400 W, 900 W, 1 kW, and 1.8 kWSouthwest Windpower Website
Wind Energy Solutions
Location: OntarioTurbine sizes: 2.5 kW, 80 kW and 250 kWWind Energy Solutions (WES) Canada Website
Wind Turbine Industries, Location: MinnesotaTurbine sizes: 10-17 kW and 20 kWWind Turbine Industries Website
Windmatic Location: OregonTurbine size: 65 kWWindmatic Website
Windward Engineering Location: UtahTurbine size: 3.75 kWWindward Engineering Website

201
Appendix B: Sampling of Small Wind Turbine Manufacturing Specification Sheets
The following are examples of some of the small wind turbines available for use in the built environment, though not necessarily designed for rooftop applications, and not specifically recommended by NREL. Source information: Windspire http://windspireenergy.com/wp-content/uploads/WindspireSpecSheet.pdf Urban Green Energy http://www.urbangreenenergy.com/distributor_downloads/2nd_gen/specs/4K_Specs.pdf Tangarie http://www.tangarie.com/files/specs/Master_GALE_5_08_24_09.pdf Skystream http://www.windenergy.com/documents/spec_sheets/3-CMLT-1338-01_Skystream_spec.pdf Bergey http://www.genproenergy.com/cutsheet/bergey/Excel.Spec.Frt.pdf http://www.genproenergy.com/cutsheet/bergey/Excel.Spec.Bk.pdf

202

203

204

205

206

207
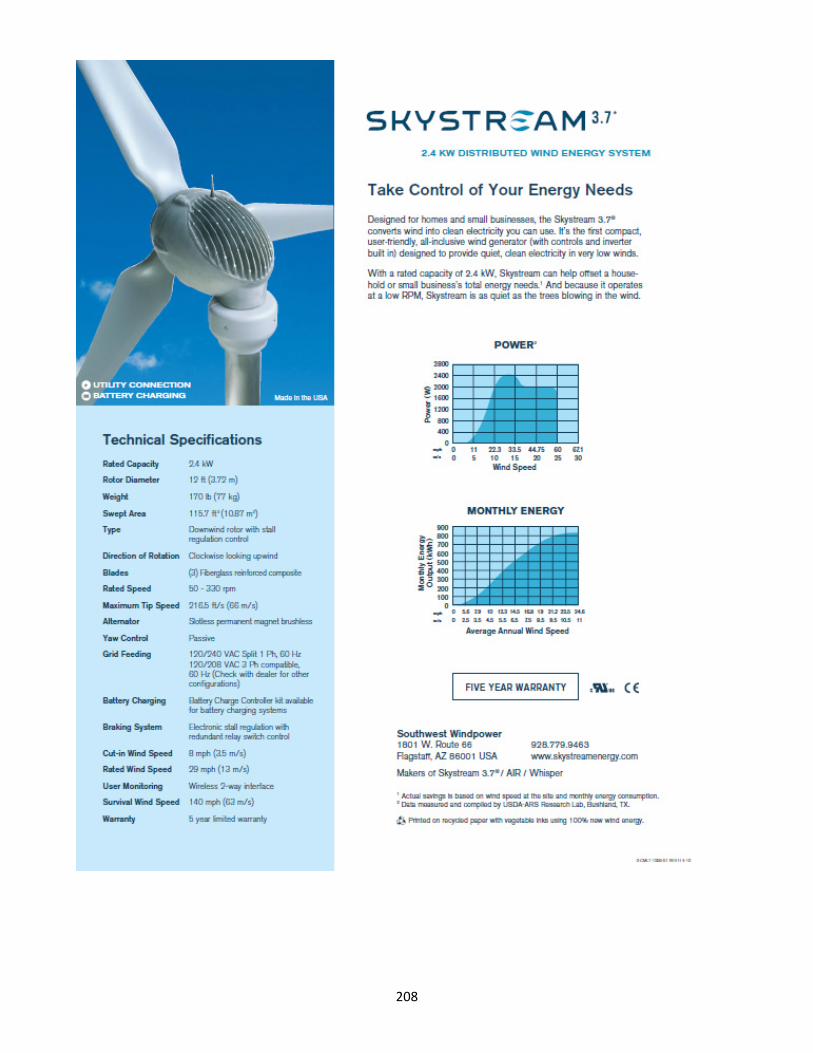
208
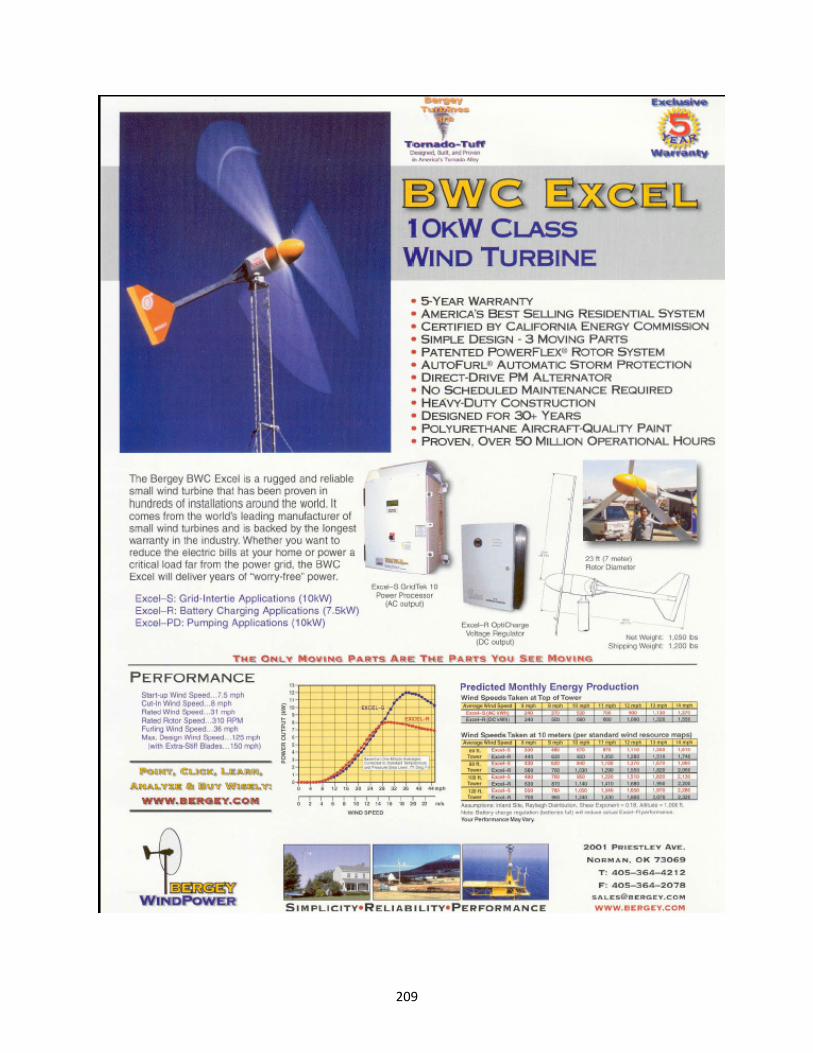
209

210

211
Appendix C: Partial List of Consultants for Wind Modeling
Source: Windustry Web site. http://www.windustry.org/
Name Description Type3TIER Environmental Forecast Group Wind Resource Consultant Wind Resource
2001 6th Avenue, Suite 2100Seattle, WA 98121(206) 325-1573www.3tiergroup.com
AWS Truewind Wind resource assessment: Atmospheric modeling and measurement, and engineering services. Wind mapping.
Wind Resource Assessment Providers and Equipment Suppliers | Wind Resource Assessment Computer Modeling Specialists
AWA Truewind WebsiteWindLogics Inc. Wind Resource Assessment, Site
Assessment, and ForecastingWind Resource Assessment Computer Modeling Specialists
1217 Bandana Blvd NSt. Paul, MN 55108(651) 556-4200WindLogics Website

212
Appendix D: Waste-to-Energy Projects
Municipality Project Description Goals/Drivers
City of Los Angeles
Developing a plan to process MSW with waste-to-energy and conversion technologies. Diversion goal of 70%
Los Angeles County
Seeking approval from the Los Angeles County Board of Supervisors to develop demonstration
projects with three short-listed vendors (IES (pyrolysis), EnTech (gasification), and Arrowbio
(anaerobic digestion)), with the goal of developing commercial-scale projects within Los
Angeles County.
Sustainability Diversify solid waste management
practices Diversion/AB 939 goals
2013 Puente Hills landfill closure
Salinas Valley Solid Waste
Authority
In the beginning stages of negotiation (for nonbinding MOU) with two vendors: Plasco
Energy (gasification) and Urbaser (AD + gasification).
Diversion goal of 75%
City and County of Santa Barbara
Pursuing the development of a conversion facility at Tejiguas landfill. They are open to all
conversion technologies.
Increase diversion, reduce environmental impact of landfilling,
energy production, and financial stability. Political will changed.
City of Sacramento
Abandoned plasma arc gasification project. Developing a strategic plan for a waste technology park that will feature multiple
conversion technologies that convert MSW into energy.
Cost savings. Currently ship MSW to Nevada, which is costly and undermines green efforts.
New York City Identifying a site for a CT project through a
siting task force. Planning to release an RFP in 12-18 months. Have yet to identify a technology.
20-year Solid Waste Management Plan
City of San Diego
Included a conversion technologies evaluation within Long Term Resource Management
Options Strategic Plan. Taking a “watch and see others” approach before taking the next step
toward developing a project.
Long Term Resource Management Options Strategic Plan
Saint Lucie County, FL
Developing a 750 TPD plasma arc gasification facility on landfill using GEOPLASMA as
vendor. Diversion

213
Municipality Project Description Goals/Drivers
City of Tallahassee, FL
Vendor approached municipality with a plasma arc gasification proposal for MSW. PPA
approved in June 2007. Currently identifying sites, but estimating that facility will be
operational in 2013.
Energy generation, already generating energy and wanted to diversify
City of Toronto Anaerobic digestion facility using BTA as vendor. Diversion
City of Ottawa, Quebec, CA
Currently operating a pilot facility for 85 TPD, but developing a commercial facility for 400TPD using plasma gasification with Plasco Energy.
Diversion
Dufferin County, Ontario, CA
A 200 TPD plasma arc gasification facility expected to produce 7.5MW. Diversion
Gilroy, CA and London, UK
Plasma arc gasification (using Solena technology) with FT conversion of syngas to jet
biofuel. Diversion