brochure - azienda ospedaliero-universitaria di ferrara · international quality indicator project...
TRANSCRIPT

How to Par t ic ipate Joining the IQIP
Health care organizations typically join the IQIP through a sponsoring organization, or system, in their country or region. In some countries, the sponsoring system is hospital or university-based; in others, it is govern-ment-sponsored. The system serves as the liaison between participants and Center for Performance Sciences (CPS). Typically the system retains at least one person as the “system coordinator,” trained by CPS staff, to assist IQIP participants with data issues, training, and interpretation and application
of reports. The system coordina-tor in turn receives assistance and support from CPS’ staff. This structure promotes the local na-ture of the Project (it becomes a local initiative rather than an American program). To find a sponsoring system in your country or region, consult the IQIP web site at www.internationalqip.com. If there is not a sponsoring system in your area, or your organization is interested in becoming a sponsor, please contact CPS.
Introduct ion The Quality Indicator Project® began in the United States in 1985 to assist hospitals in identifying opportunities for improvement in patient care. Initiated by the Maryland Hos-pital Association to help its member hospi-tals, the Project quickly gained popularity. It now includes more than 500 health care organizations worldwide.
Health care organizations outside of the United States have participated in the Qual-ity Indicator Project since 1991. As global interest in the Project increased, the Mary-land Hospital Association decided in 1997 to create a separate initiative to focus on the needs of international par-ticipants. The International Qual-ity Indicator Project (IQIP) offers health care organizations outside of the United States the ability to participate in the Quality Indica-tor Project, enhanced by the flexi-bility to customize the Project to meet their local requirements and independent needs.
Using the same rigorously-defined clinical and administrative indica-tors with field-demonstrated va-lidity as the Quality Indicator Project, the IQIP allows hospitals, psychiatric care (behavioral health) facilities, long-term care facilities, and home health care agencies to measure
themselves against both their own perform-ance over time as well as an aggregate data-base. The motivating factor behind the IQIP is not the data, but discovering the “why” behind the data. To this end, the IQIP encompasses much more than data collection software and reports. The IQIP provides educational mate-rials, conducts user groups and training ses-sions, shares case studies of other IQIP partici-pants, and assists in participants’ benchmark-ing and networking activities.
Much of the IQIP’s success stems from the collaborative nature of the relationship be-
tween staff and participants. Soliciting and incorporating participant feedback has enabled the IQIP to create and maintain an effective performance measurement program.
The IQIP is offered through the Center for Performance Sciences (CPS), the research subsidiary of the Maryland Hospital Associa-tion that focuses on performance measure-ment activities.
I N T E R N A T I O N A L Q U A L I T Y I N D I C A T O R P R O J E C T
Informational Brochure
Contact Information
Center for Performance Sciences 6820 Deerpath Road
Elkridge, Maryland 21075 USA
tel: +1.410.379.9540 [email protected]
Portugal (20)
United Kingdom
(4)
Germany (4)
Austria(19)
Taiwan (85)
Singapore (4)
The IQIP is currently being used in the countries marked on the map below(The number of facilities using the IQIP in each country is in parenthesis)
United States (270+)
Ireland(3)
Italy(7)
Switzerland(13)
Luxembourg(1)
Japan (5)
CONTENTS
Introduction 1 How to Participate 1 Materials & Services 2 Frequently Asked Questions 2 Why the IQIP? 3 IQIP Reports 3 Indicators 4 List of Indicators 8

Getting started
The IQIP offers four different sets of meas-ures, called indicator sets. Each indicator set contains multiple measures focused on a different site of care: acute care (including hospital-based ambulatory care); psychiatric care (behavioral health); long term care; and home health care. Participants choose the indicator sets for which they would like to submit data.
Each participant receives password-protected access to the secure portion of the IQIP web site, where the data collection and reporting software resides. There, participants can select measures for which they would like to submit data; enter data; graph data; retrieve reports; and find links to relevant journal articles and other reference materials.
Participants enter data monthly and receive a report within ten days following the end of each data collection quarter. The quarterly report shows their hospital’s performance over time for each selected measure, as well as how their hospital compares to the aggre-gate database (United States and non-USA). In addition, participants can request “peer group comparison reports,” which compare their organization to organizations with simi-lar characteristics, such as geographic loca-tion, discharge volume, teaching status, and clinical services offered.
Mater ia l s & Ser vices Data entry software
The IQIP provides web-based data entry in a secure, password-protected environment. The web-based software allows participants to access the application from multiple loca-tions and allows multiple users within an organization to access the site at the same time. Moreover, since reports are posted to the password-protected site, participants can retrieve reports more quickly and at their convenience. The IQIP software supports multiple languages and includes data collec-tion forms, data entry screens, data quality reports, comparative graphing tools, statisti-cal process control graphs, data export func-tions, and other resources to help our par-ticipants understand their data.
Data quality
All data are subject to a series of stringent quality checks at the time of data entry to ensure accuracy. These live, web-based re-ports flag any potential data problems and aberrant rates, giving users an opportunity to investigate the data and make corrections.
Reporting functions
IQIP generates a facility-specific report each quarter for each participant. This report in-cludes comparative and historical data in a combination of tables and graphs for each measure for which the participant submits data. Participants are free to specify the com-parative groups included in their quarterly reports.
In addition, participants can request real-time “peer group reports,” which enable partici-pants to compare their organization’s per-formance with a customized subset of par-ticipants in the database. The characteristics of the subset, such as teaching status or pa-tient and procedure volumes, are determined by the requesting organization and are gener-ally tailored to produce a peer group. If translations are available, participants re-ceive the reports in their native language. All reports are posted to the secure portion of the IQIP web site for easy access and downloading.
To review samples of IQIP reports, please contact CPS.
Graphing functions
The IQIP software includes a graphing func-tion that displays aggregate data, run charts, and control charts. The tool allows partici-pants to graph their own data alongside Pro-ject-Wide, system-wide, and regionally or nationally specific groups. Participants also have the ability to apply Statistical Process Control methodology through the creation of run charts and control charts. To review samples of IQIP graphs, please contact CPS. Training & support
All participants receive training prior to the start of their participation. Sponsoring sys-tems provide on-going education and support through user group meetings and individual-ized work with participants. In addition, CPS staff with clinical and research backgrounds are available to all international participants for on-site training, programmatic assistance, and support in integrating the IQIP philoso-phy and data effectively into quality improve-ment activities. Educational materials
Participants receive detailed implementation manuals for each indicator set in which they are registered. The implementation manuals contain indicator overviews, implementation rules, data elements, exclusion criteria, for-mulas, and optional patient-level variables
that help identify factors that may influence participant performance. Additional materi-als include a Data Analysis Guide, a quarterly newsletter with case studies from both United States and non-USA participants, resources for understanding the context of the data, and tools for implementing internal performance improvement initiatives. User group meetings
Sponsoring systems convene at least one annual user group meeting of participating facilities for the purpose of discussing the IQIP, including its policies, measure devel-opment, reporting, analysis, and other re-lated IQIP updates. IQIP website
The IQIP web site gives participants and sponsors instant access to software, materials and services, and networking capabilities in a password-protected section of the site. These include: data collection and graphing software, quarterly and customized peer group reporting, recent IQIP publications, case studies, IQIP news and events, links to related sites, and e-mail access to IQIP staff. The site is located at: www.internationalqip.com. To access a demonstration copy of the IQIP software, please contact CPS. Hardware & software requirements Participants and system coordinators must have the following:
• VGA color monitor
• High speed Internet access (cable, fiber optic, DSL, T1, or T3)
• MS Internet Explorer 6.0 or higher
• Adobe Acrobat Reader 7.0 or higher
• The ability to download files
• The ability to download and open zipped files
• The ability to send and receive e-mail attachments
Familiarity with:
• MS Excel or other spreadsheet software is highly recommended
Frequently Asked Quest ions What do we get from the IQIP? IQIP participants receive quarterly reports that provide both comparisons to aggregate data as well as longitudinal trending. In addi-
PAGE 2

tion, participants may take advantage of the IQIP’s peer group reporting capabilities, to compare themselves with self-defined peer groups based on such characteristics as dis-charge volume, geographic location, and teaching status. For a review of items pro-vided, please refer to the “Materials & Ser-vices” section of this brochure.
How is training structured? Training is an integral part of the IQIP pro-gram. All participants must attend an initial training session that provides in-depth re-views of indicator definitions, the user’s manual, and the data collection and graphing software, as well as an explanation of how to interpret and use the IQIP reports. Addi-tional opportunities for training occur at user group meetings and other functions. In addi-tion, system coordinators are available by telephone and e-mail to respond to specific participant questions.
Are our data confidential? The IQIP’s password-protected data entry site ensures that IQIP participants do not have access to other participants’ data at any time. For added protection, all IQIP partici-pants receive a unique, randomly-assigned identification number. The IQIP uses these numbers rather than the participating organi-zations’ names in the password-protected data entry site as well as on all reports. Neither the sponsoring system nor Center for Performance Sciences can release partici-pant-specific data for any reason without first obtaining written permission of the partici-pating organization. How can IQIP fit into an accredita-tion model? Although the IQIP is not intended to serve as an “accreditation system,” an accreditation program is most successful when there is a uniform performance measurement system in place. Participation in the IQIP enables health care organizations to fulfill internal performance improvement and assessment objectives while also meeting external ac-creditation requirements. Can IQIP data be used publicly? The IQIP is a tool for measuring and under-standing internal performance. IQIP meas-ures are best suited for use on an internal basis for quality improvement purposes; they are not intended to establish performance thresholds or standards of care. For that reason, participating hospitals can only re-lease or disseminate IQIP aggregate data and statistics with prior written permission from CPS.
PAGE 3
Some participants may find value in sharing their own organization’s performance with external audiences for educational purposes. Decisions regarding with whom and how to share participant-specific data are entirely at the discretion of each individual participant. What role do participating systems and health care organizations play in determining the research direc-tion of the IQIP? The IQIP employs a very strict methodology for researching and testing new measures prior to implementation. This methodology includes extensive literature searches, expert panel involvement in developing definitions, and rigorous pilot tests among an appropri-ate group of health care providers. A critical component of the pilot testing process hinges on obtaining feedback from pilot sites—the participating facilities themselves. The IQIP research department welcomes inquiries about development methodology and future plans for indicator development. Which indicators should we use? The IQIP contains four indicator sets: acute care (including ambulatory care measures), psychiatric care (behavioral health), home care, and long term care. Participants can choose to submit data for one or more indi-cator sets. Each indicator set has numerous clinical performance measures for which a facility can submit data and receive compara-tive feedback. Participants choose which measures to use, depending upon each participant’s perform-ance measurement and improvement priori-ties. Some participating facilities may elect to report data for all the measures within a particular indicator set, while others may select a subset of measures. It is common for new participants to select a handful of meas-ures for the first few reporting periods, and then to add more measures as they gain ex-perience in the IQIP and the data collection process. Can we view a demo of the IQIP software? To access a demonstration copy of the IQIP software, please contact CPS.
Why the Inter nat ional Qual i ty Indicator Project? Over the last decade, health care organiza-tions worldwide have made great strides in providing services that meet their national and local needs. However, there are several
recent trends that may play a significant role in the shaping of health care systems world-wide. The IQIP assists its participants in meeting these challenges by defining com-mon health-related indicators; establishing a system which enables health care organiza-tions to collect and submit data electroni-cally; and providing a variety of services including data analysis, educational materi-als, and networking forums.
Public accountability The IQIP indicators are designed to help participants ask the right questions about their organization’s performance and ulti-mately improve their understanding of that performance. Feedback from the IQIP helps health care organizations facilitate internal collaboration and respond to the increasing call for accountability from internal and ex-ternal audiences.
Comparative abilities & longitudinal trending
The IQIP provides participants the ability to compare performance to over 500 health care organizations on nearly 700 clinical indicators. Participants can also request peer group reports which enable them to specify a subset of the aggregate data for each measure for which they submitted data. Additionally, IQIP participants receive the benefit of rate and pattern trending, which can help them better understand and improve their per-formance.
Customization & educational focus Participants can choose from a variety of IQIP customization options, including indi-cator selection, peer group comparisons, and specific indicators customized for a particular country or region. Center for Performance Sciences can provide additional customiza-tion and/or consultation services based on participant-specific needs. A forum for better practices Many countries have recognized the impor-tance of learning from the successful efforts of other countries. Participation in the IQIP enables health care organizations to collect and share information about performance and the factors that influence it both locally and with all participants worldwide.
IQIP Repor ts Providing feedback to participants is an es-sential part of the International Quality Indi-cator Project's mission to help facilities un-derstand their own performance. As part of the web-based application itself, the IQIP offers users the ability to produce real-time
facility gains experience in the IQIP and the data collection process. Participants receive detailed training imple-mentation manuals for each indicator set in which they are registered. The implementa-tion manuals contain indicator rationale statements, inclusions and exclusions, and suggested data sources. The IQIP employs a very strict method for researching and testing new measures prior to implementation. This method includes extensive literature searches, expert panel involvement in developing definitions, and rigorous pilot tests among an appropriate group of health care providers. A critical component of the pilot testing process hinges on obtaining feedback from pilot sites. Our research department welcomes inquiries about our development methodology and future plans for indicator development. An up-to-date list of all measures and meas-ure sets can be found beginning on Page 8.
PAGE 4
graphs, run charts, and control charts for each measure for which the facility submits data. In addition, participants can request reports and analyses which allow them to view their own performance in the context of a larger group of participants and peer groups. Quarterly reports and aggregate data are made available to participants within ten days following the end of each data collec-tion quarter and are posted to the password-protected portion of the IQIP web site for easy access and download. Data quality
All data are subject to a series of stringent quality checks at the time of data entry to ensure accuracy. These live, web-based re-ports flag any potential data problems and aberrant rates, giving users an opportunity to investigate the data and make corrections. The IQIP Quarterly Report
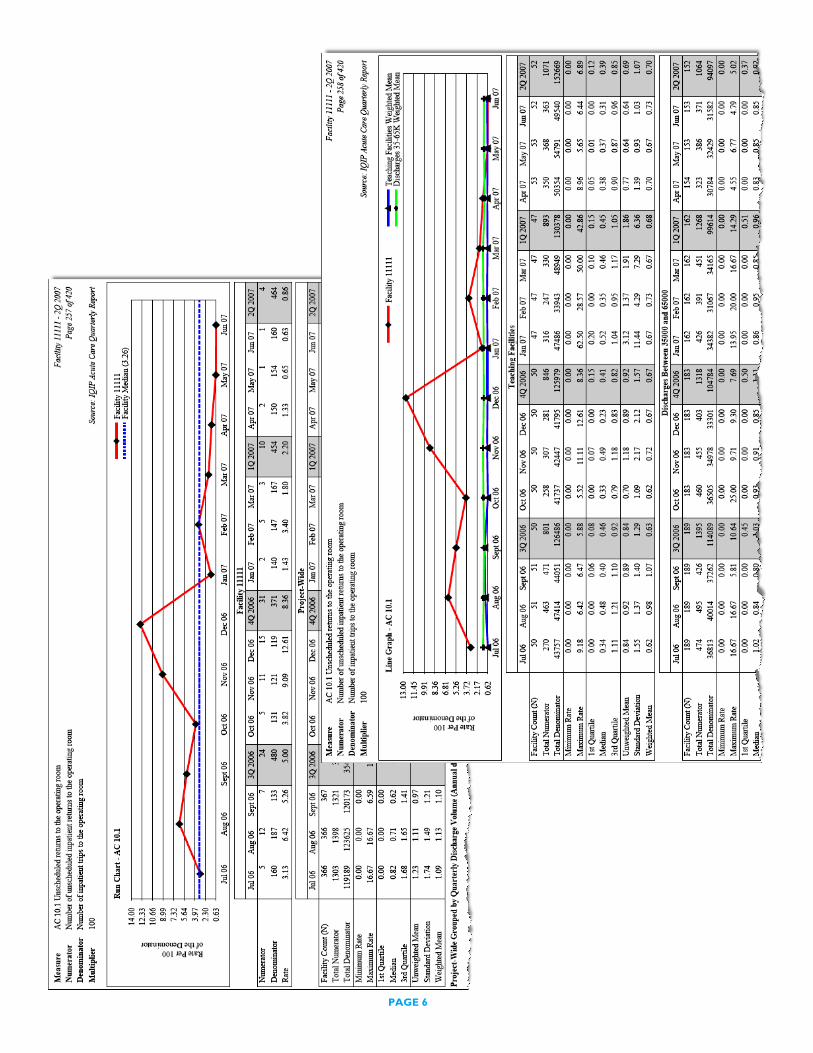
Each participating facility receives an IQIP Quarterly Report within ten days following the end of each data collection quarter. The report provides organization-specific and Project-Wide data trended over time as well as comparisons to regional, national, local, and peer hospital groups for each measure for which the facility submits data. Partici-pants are free to specify the comparative groups included in their quarterly reports. If translations are available, hospitals will re-ceive the quarterly report in their native language. (See examples of report on Page 6.)
IQIP Measure Set reports
Each participating facility receives Measure Set reports within ten days following the end of each data collection quarter. Measure Set reports are copies of pages from the quar-terly report that are organized by and limited to specific procedures, diseases, or topics. The purpose is to create sub-reports that can be shared easily with individuals or depart-ments based on area of expertise, such as orthopedics, infection control, cardiac care, emergency care, patient safety, etc. Next Steps documents
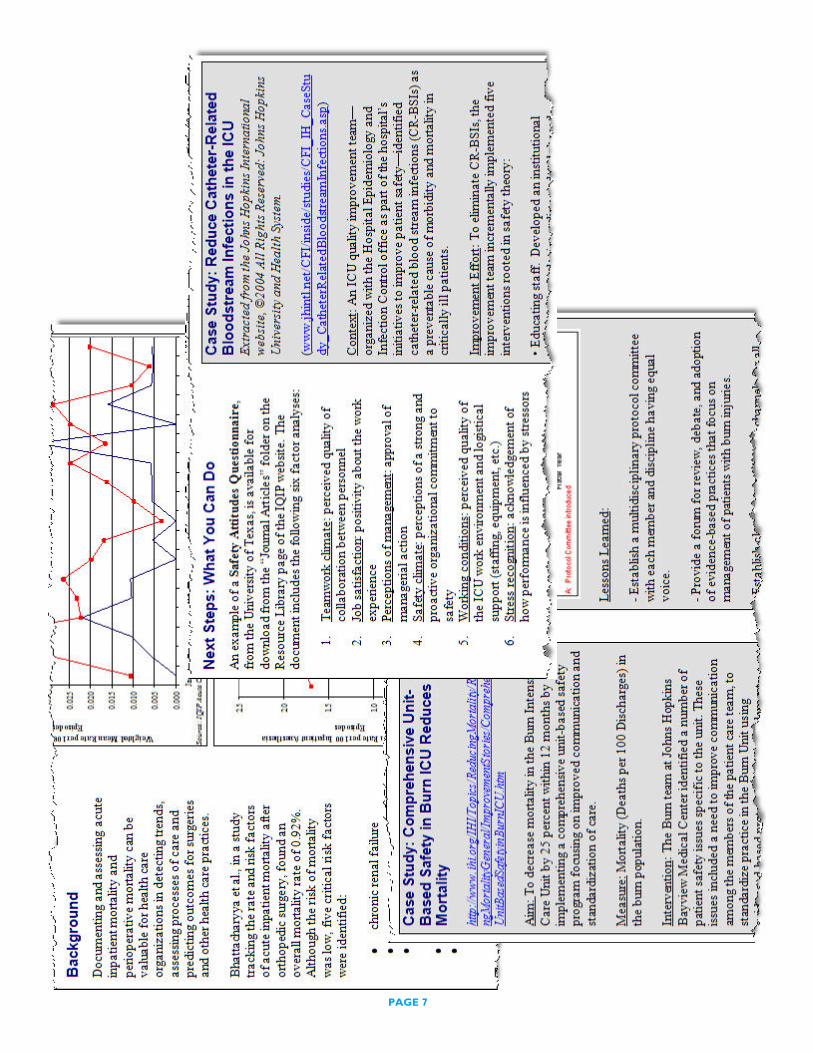
The Next Steps documents support the roles of sponsors who actively provide hospitals with data analysis and performance improve-ment by listing factors that may influence performance, and offering suggestions for further study. The documents provide hospi-tals with the information needed to under-stand the context of the data or why, for example, c-section rates tend to be higher in the US or Asia compared with Europe. The
purpose is to provide resources and tools for how the data can be used for performance improvement. (See examples of Next Steps document on page 7.)
Peer Group Reports
The purpose of a Peer Group Report is to assist in understanding the influence of hospi-tal characteristics on performance prior to embarking on a performance improvement process and provides a first-level "drill-down" that can help participants begin to isolate factors that may affect their perform-ance. If translations are available, hospitals will receive the peer group report in their native language.
A Peer Group Report, or custom report, provides IQIP participants with aggregate statistics for one or two comparison groups. Peer groups are based on characteristics chosen by the requester of the custom re-port. Peer groups can be restricted to facili-ties with any single or combination of char-acteristics such as annual discharge volume, teaching status, and/or urban, suburban, or rural setting. The software also allows users to define a peer group based on measure numerator or denominator values (i.e., data elements), such as the number of deliveries, number of inpatient days, or the number of central line days.
For each peer group, the report presents comparative descriptive statistics tables in-cluding facility counts, total numerator and denominator values, minimum and maxi-mum reported rates for the measure, 1st, 2nd, and 3rd quartile values, unweighted mean, standard deviation, and weighted mean.
Indicator s The IQIP comprises sets of performance indicators for four different pattern care settings: acute care, psychiatric (behavioral health) care, long term care, and home care. Each indicator set has numerous measures for which a facility can submit data and re-ceive feedback. Participants can use any or all of the measures in an indicator set. Deci-sions regarding which measures to use are made by the participating facility and depend upon each facility's performance measure-ment and improvement priorities - some facilities may elect to report data for all the measures in a particular indicator set, while others may select a subset of measures. It is common for new participants to select a handful of measures for the first few report-ing periods, then add more measures as the

PAGE 5
PAGE 6
PAGE 7
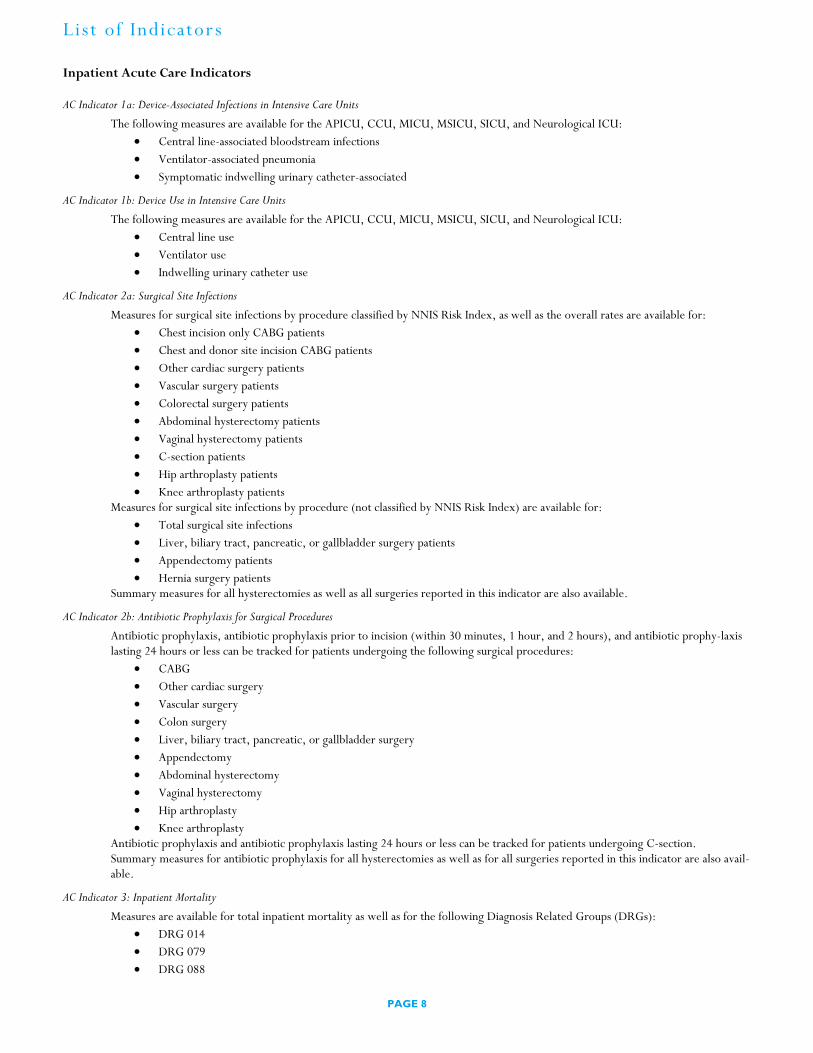
List of Indicator s
Inpatient Acute Care Indicators
AC Indicator 1a: Device-Associated Infections in Intensive Care Units
The following measures are available for the APICU, CCU, MICU, MSICU, SICU, and Neurological ICU: • Central line-associated bloodstream infections • Ventilator-associated pneumonia • Symptomatic indwelling urinary catheter-associated
AC Indicator 1b: Device Use in Intensive Care Units The following measures are available for the APICU, CCU, MICU, MSICU, SICU, and Neurological ICU:
• Central line use • Ventilator use • Indwelling urinary catheter use
AC Indicator 2a: Surgical Site Infections Measures for surgical site infections by procedure classified by NNIS Risk Index, as well as the overall rates are available for:
• Chest incision only CABG patients • Chest and donor site incision CABG patients • Other cardiac surgery patients • Vascular surgery patients • Colorectal surgery patients • Abdominal hysterectomy patients • Vaginal hysterectomy patients • C-section patients • Hip arthroplasty patients • Knee arthroplasty patients
Measures for surgical site infections by procedure (not classified by NNIS Risk Index) are available for: • Total surgical site infections • Liver, biliary tract, pancreatic, or gallbladder surgery patients • Appendectomy patients • Hernia surgery patients
Summary measures for all hysterectomies as well as all surgeries reported in this indicator are also available. AC Indicator 2b: Antibiotic Prophylaxis for Surgical Procedures
Antibiotic prophylaxis, antibiotic prophylaxis prior to incision (within 30 minutes, 1 hour, and 2 hours), and antibiotic prophylaxis lasting 24 hours or less can be tracked for patients undergoing the following surgical procedures:
• CABG • Other cardiac surgery • Vascular surgery • Colon surgery • Liver, biliary tract, pancreatic, or gallbladder surgery • Appendectomy • Abdominal hysterectomy • Vaginal hysterectomy • Hip arthroplasty • Knee arthroplasty
Antibiotic prophylaxis and antibiotic prophylaxis lasting 24 hours or less can be tracked for patients undergoing C-section. Summary measures for antibiotic prophylaxis for all hysterectomies as well as for all surgeries reported in this indicator are also avail-able.
AC Indicator 3: Inpatient Mortality Measures are available for total inpatient mortality as well as for the following Diagnosis Related Groups (DRGs):
• DRG 014 • DRG 079 • DRG 088
PAGE 8
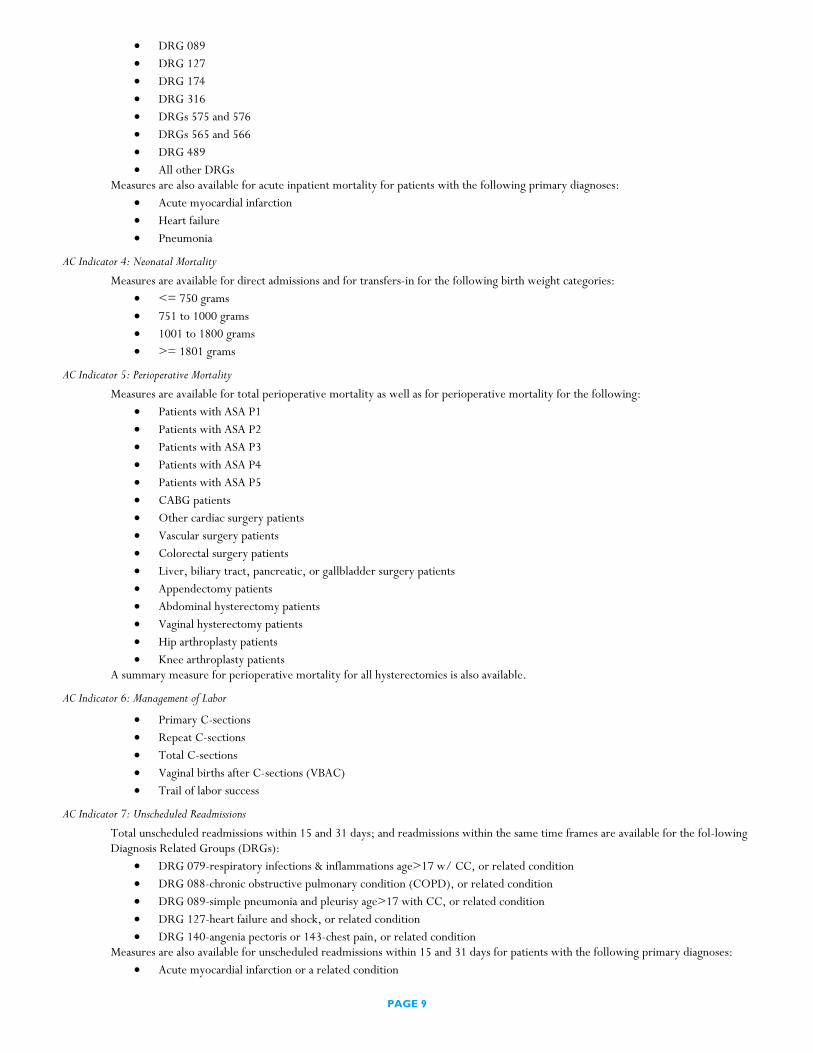
• DRG 089 • DRG 127 • DRG 174 • DRG 316 • DRGs 575 and 576 • DRGs 565 and 566 • DRG 489 • All other DRGs
Measures are also available for acute inpatient mortality for patients with the following primary diagnoses: • Acute myocardial infarction • Heart failure • Pneumonia
AC Indicator 4: Neonatal Mortality Measures are available for direct admissions and for transfers-in for the following birth weight categories:
• <= 750 grams • 751 to 1000 grams • 1001 to 1800 grams • >= 1801 grams
AC Indicator 5: Perioperative Mortality Measures are available for total perioperative mortality as well as for perioperative mortality for the following:
• Patients with ASA P1 • Patients with ASA P2 • Patients with ASA P3 • Patients with ASA P4 • Patients with ASA P5 • CABG patients • Other cardiac surgery patients • Vascular surgery patients • Colorectal surgery patients • Liver, biliary tract, pancreatic, or gallbladder surgery patients • Appendectomy patients • Abdominal hysterectomy patients • Vaginal hysterectomy patients • Hip arthroplasty patients • Knee arthroplasty patients
A summary measure for perioperative mortality for all hysterectomies is also available. AC Indicator 6: Management of Labor
• Primary C-sections • Repeat C-sections • Total C-sections • Vaginal births after C-sections (VBAC) • Trail of labor success
AC Indicator 7: Unscheduled Readmissions Total unscheduled readmissions within 15 and 31 days; and readmissions within the same time frames are available for the following Diagnosis Related Groups (DRGs):
• DRG 079-respiratory infections & inflammations age>17 w/ CC, or related condition • DRG 088-chronic obstructive pulmonary condition (COPD), or related condition • DRG 089-simple pneumonia and pleurisy age>17 with CC, or related condition • DRG 127-heart failure and shock, or related condition • DRG 140-angenia pectoris or 143-chest pain, or related condition
Measures are also available for unscheduled readmissions within 15 and 31 days for patients with the following primary diagnoses: • Acute myocardial infarction or a related condition
PAGE 9
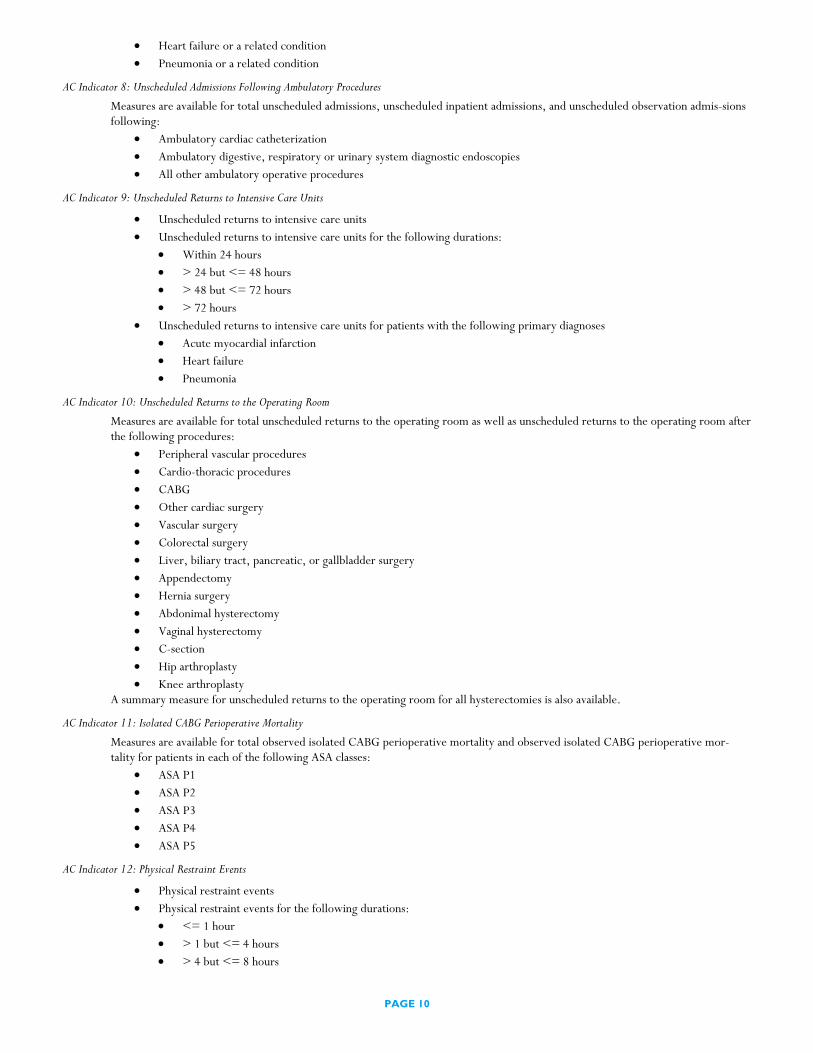
• Heart failure or a related condition • Pneumonia or a related condition
AC Indicator 8: Unscheduled Admissions Following Ambulatory Procedures Measures are available for total unscheduled admissions, unscheduled inpatient admissions, and unscheduled observation admissions following:
• Ambulatory cardiac catheterization • Ambulatory digestive, respiratory or urinary system diagnostic endoscopies • All other ambulatory operative procedures
AC Indicator 9: Unscheduled Returns to Intensive Care Units • Unscheduled returns to intensive care units • Unscheduled returns to intensive care units for the following durations:
• Within 24 hours • > 24 but <= 48 hours • > 48 but <= 72 hours • > 72 hours
• Unscheduled returns to intensive care units for patients with the following primary diagnoses • Acute myocardial infarction • Heart failure • Pneumonia
AC Indicator 10: Unscheduled Returns to the Operating Room Measures are available for total unscheduled returns to the operating room as well as unscheduled returns to the operating room after the following procedures:
• Peripheral vascular procedures • Cardio-thoracic procedures • CABG • Other cardiac surgery • Vascular surgery • Colorectal surgery • Liver, biliary tract, pancreatic, or gallbladder surgery • Appendectomy • Hernia surgery • Abdonimal hysterectomy • Vaginal hysterectomy • C-section • Hip arthroplasty • Knee arthroplasty
A summary measure for unscheduled returns to the operating room for all hysterectomies is also available. AC Indicator 11: Isolated CABG Perioperative Mortality
Measures are available for total observed isolated CABG perioperative mortality and observed isolated CABG perioperative mortality for patients in each of the following ASA classes:
• ASA P1 • ASA P2 • ASA P3 • ASA P4 • ASA P5
AC Indicator 12: Physical Restraint Events • Physical restraint events • Physical restraint events for the following durations:
• <= 1 hour • > 1 but <= 4 hours • > 4 but <= 8 hours
PAGE 10
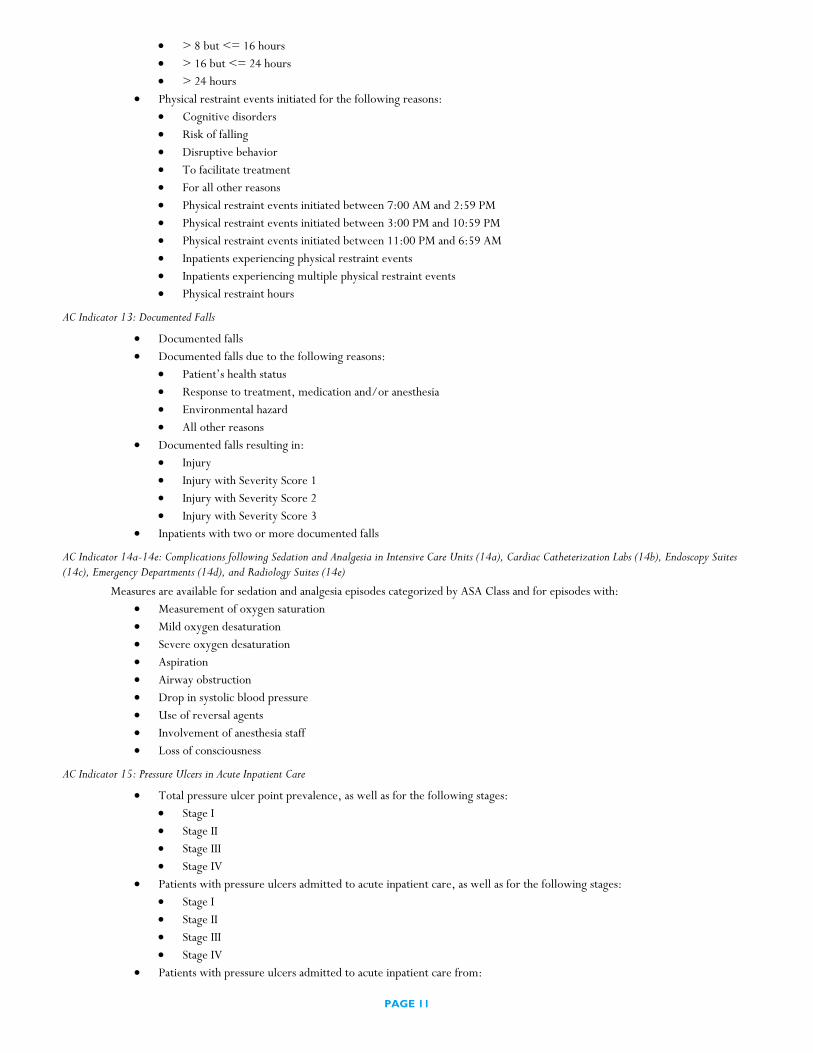
• > 8 but <= 16 hours • > 16 but <= 24 hours • > 24 hours
• Physical restraint events initiated for the following reasons: • Cognitive disorders • Risk of falling • Disruptive behavior • To facilitate treatment • For all other reasons • Physical restraint events initiated between 7:00 AM and 2:59 PM • Physical restraint events initiated between 3:00 PM and 10:59 PM • Physical restraint events initiated between 11:00 PM and 6:59 AM • Inpatients experiencing physical restraint events • Inpatients experiencing multiple physical restraint events • Physical restraint hours
AC Indicator 13: Documented Falls • Documented falls • Documented falls due to the following reasons:
• Patient’s health status • Response to treatment, medication and/or anesthesia • Environmental hazard • All other reasons
• Documented falls resulting in: • Injury • Injury with Severity Score 1 • Injury with Severity Score 2 • Injury with Severity Score 3
• Inpatients with two or more documented falls
AC Indicator 14a-14e: Complications following Sedation and Analgesia in Intensive Care Units (14a), Cardiac Catheterization Labs (14b), Endoscopy Suites (14c), Emergency Departments (14d), and Radiology Suites (14e)
Measures are available for sedation and analgesia episodes categorized by ASA Class and for episodes with: • Measurement of oxygen saturation • Mild oxygen desaturation • Severe oxygen desaturation • Aspiration • Airway obstruction • Drop in systolic blood pressure • Use of reversal agents • Involvement of anesthesia staff • Loss of consciousness
AC Indicator 15: Pressure Ulcers in Acute Inpatient Care • Total pressure ulcer point prevalence, as well as for the following stages:
• Stage I • Stage II • Stage III • Stage IV
• Patients with pressure ulcers admitted to acute inpatient care, as well as for the following stages: • Stage I • Stage II • Stage III • Stage IV
• Patients with pressure ulcers admitted to acute inpatient care from:
PAGE 11

• Home • Nursing facilities • Another hospital • Any other admission source
• Total pressure ulcer incidence in acute inpatient care, as well as for the following locations: • Sacral • Ischial bone • Trochanterian • Calcaneal • Malleolar • Scapular • Occipital • Other • Total multiple pressure ulcer incidence in acute inpatient care
AC Indicator 16a: Deep Vein Thrombosis and Pulmonary Thromboembolism Following Surgery Measures are available for total deep vein thrombosis and pulmonary thromboembolism following surgery, and for deep vein throm-bosis and pulmonary thromboembolism following these procedures:
• CABG • Other cardiac surgery • Vascular surgery • Colorectal surgery • Liver, biliary tract, pancreatic, or gallbladder surgery • Abdominal hysterectomy • Vaginal hysterectomy • Sum of abdominal and vaginal hysterectomies • C-section • Hip arthroplasty • Knee arthroplasty
AC Indicator 16b: Thromboprophylaxis for Surgery Measures are available for total thromboprophylaxis, and thromboprophylaxis for the following procedures:
• CABG • Other cardiac surgery • Vascular surgery • Colorectal surgery • Liver, biliary tract, pancreatic, or gallbladder surgery • Abdominal hysterectomy • Vaginal hysterectomy • Sum of abdominal and vaginal hysterectomies • Hip arthroplasty • Knee arthroplasty
A summary measure for thromboprophylaxis for all surgeries is also available. AC Indicator 17a: Device-Associated Infections in Intensive Care Units Due to Methyllin Resistant Staphyllococcus Aureus (MRSA)
Measures are available for the APICU, CCU, MICU, MSICU, SICU, and Neurological ICU: • Central line-associated bloodstream infections due to MRSA • MRSA central line-associated bloodstream infections • Ventilator-associated pneumonia due to MRSA • MRSA ventilator-associated pneumonia • Symptomatic indwelling urinary catheter-associated UTIs due to MRSA • MRSA symptomatic indwelling urinary catheter-associated UTIs
Summary measures for each device-associated infection for all ICUs in this indicator are also available.
AC Indicator 17b: Multidrug-resistant Organisms (MDROs) • Total incidence of MRSA infections
PAGE 12

• Incidence of nosocomial MRSA infections • MRSA prevalence on admission • Average daily MRSA loads • MRSA inpatient-day associated nosocomial MRSA infections • Total surgical site infections due to MRSA • MRSA bacteraemias • MRSA isolates • Clostridium difficile associated disease • ICD-code-associated Clostridium difficile associated disease • Total incidence of VRE infections
AC Indicator 17c: Active Surveillance Cultures (ASC) for Methyllin Resistant Staphyllococcus Aureus (MRSA)
• Patients screened for MRSA with active surveillance culture upon admission • Patients who were identified as MRSA positive through active surveillance culture upon admission • Patients who were already known to be MRSA positive upon admission • Total number of patients MRSA positive on admission
Ambulatory Acute Care Indicators
AC Indicator A1: Unscheduled Returns to the Emergency Department • Related unscheduled returns to the ED, those resulting in an inpatient admission, and those resulting in an observation
admission, are available for the following durations: • Within 24 hours • Within 48 hours • Within 72 hours
• Related unscheduled returns to the ED within 72 hours are available for patients with the following primary diagnoses: • Acute myocardial infarction • Heart failure • Pneumonia
• Unscheduled returns (related or unrelated) to the ED, those resulting in an inpatient admission and those resulting in an observation admission, are available for the following durations: • Within 7 days • Within 14 days • Within 30 days
• Patients with two or more unscheduled returns to the ED within 30 days (related or unrelated)
AC Indicator A2: Length of Stay in the Emergency Department Measures are available for registered patients in the emergency department with LOS <= 2 hours, LOS > 2 but <= 4 hours, LOS > 4 but <= 6 hours, and LOS > 6 hours by the following discharge dispositions:
• Total • Discharged home • Admitted as an inpatient • Admitted to observation status • Transferred to another acute care facility • For all other dispositions
AC Indicator A3: X-Ray Study Discrepancies in the Emergency Department Requiring a Change in Patient Management • ED X-ray study discrepancies requiring a change in patient management
Indicator A4: Patients Leaving the Emergency Department Before Completion of Treatment • Patients leaving the emergency department prior to completion of treatment
AC Indicator A5: Cancellation of Scheduled Ambulatory Procedures Measures are available for day-of-the-procedure cancellations by the facility or by the patient, as well as the total number of day-of-the procedure cancellations, for these procedures:
• Ambulatory cardiac catheterizations
PAGE 13

• Ambulatory diagnostic digestive system endoscopies • Other ambulatory procedures
AC Indicator A6: Documented Falls in Ambulatory Care • Documented falls in ambulatory care • Documented falls in ambulatory care due to the following reasons:
• Patient’s health status • Response to treatment, medication and/or anesthesia • Environmental hazard • All other reasons
• Documented falls in ambulatory care resulting in: • Injury • Injury with Severity Score 1 • Injury with Severity Score 2 • Injury with Severity Score 3
• Ambulatory care patients with two or more documented falls
Acute Care Measure Sets
• Acute Myocardial Infarction • Heart Failure • Pneumonia • Cardiac Surgery • Vascular Surgery • Colorectal Surgery • Liver, Biliary Tract, Pancreatic, or Gallbladder Surgery • Appendectomy • Hernia Surgery • Hysterectomies • Orthopedic Surgery • Maternity and Childbirth • Emergency Care • Patient Safety • Intensive Care Units • Infection Control • Internal Medicine • Ambulatory Care • Methyllin Resistant Staphyllococcus Aureus (MRSA)
PAGE 14
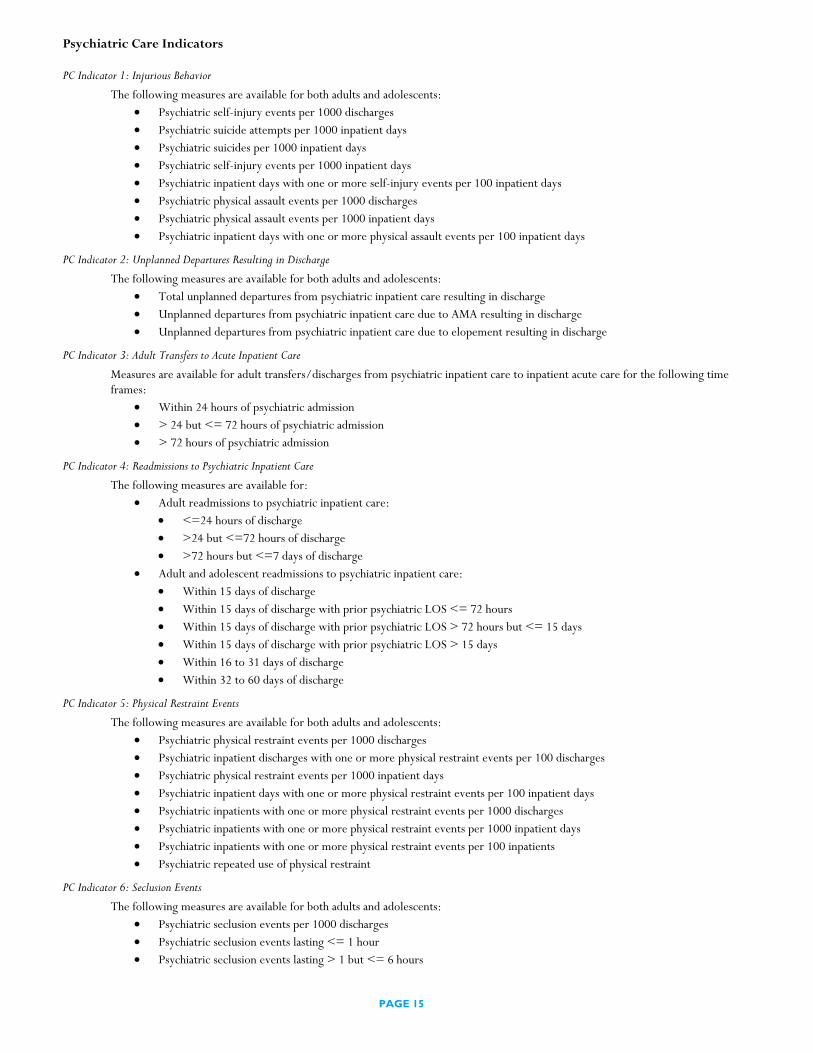
Psychiatric Care Indicators
PC Indicator 1: Injurious Behavior The following measures are available for both adults and adolescents:
• Psychiatric self-injury events per 1000 discharges • Psychiatric suicide attempts per 1000 inpatient days • Psychiatric suicides per 1000 inpatient days • Psychiatric self-injury events per 1000 inpatient days • Psychiatric inpatient days with one or more self-injury events per 100 inpatient days • Psychiatric physical assault events per 1000 discharges • Psychiatric physical assault events per 1000 inpatient days • Psychiatric inpatient days with one or more physical assault events per 100 inpatient days
PC Indicator 2: Unplanned Departures Resulting in Discharge The following measures are available for both adults and adolescents:
• Total unplanned departures from psychiatric inpatient care resulting in discharge • Unplanned departures from psychiatric inpatient care due to AMA resulting in discharge • Unplanned departures from psychiatric inpatient care due to elopement resulting in discharge
PC Indicator 3: Adult Transfers to Acute Inpatient Care Measures are available for adult transfers/discharges from psychiatric inpatient care to inpatient acute care for the following time frames:
• Within 24 hours of psychiatric admission • > 24 but <= 72 hours of psychiatric admission • > 72 hours of psychiatric admission
PC Indicator 4: Readmissions to Psychiatric Inpatient Care The following measures are available for:
• Adult readmissions to psychiatric inpatient care: • <=24 hours of discharge • >24 but <=72 hours of discharge • >72 hours but <=7 days of discharge
• Adult and adolescent readmissions to psychiatric inpatient care: • Within 15 days of discharge • Within 15 days of discharge with prior psychiatric LOS <= 72 hours • Within 15 days of discharge with prior psychiatric LOS > 72 hours but <= 15 days • Within 15 days of discharge with prior psychiatric LOS > 15 days • Within 16 to 31 days of discharge • Within 32 to 60 days of discharge
PC Indicator 5: Physical Restraint Events
The following measures are available for both adults and adolescents: • Psychiatric physical restraint events per 1000 discharges • Psychiatric inpatient discharges with one or more physical restraint events per 100 discharges • Psychiatric physical restraint events per 1000 inpatient days • Psychiatric inpatient days with one or more physical restraint events per 100 inpatient days • Psychiatric inpatients with one or more physical restraint events per 1000 discharges • Psychiatric inpatients with one or more physical restraint events per 1000 inpatient days • Psychiatric inpatients with one or more physical restraint events per 100 inpatients • Psychiatric repeated use of physical restraint
PC Indicator 6: Seclusion Events
The following measures are available for both adults and adolescents: • Psychiatric seclusion events per 1000 discharges • Psychiatric seclusion events lasting <= 1 hour • Psychiatric seclusion events lasting > 1 but <= 6 hours
PAGE 15

• Psychiatric seclusion events lasting > 6 but <= 12 hours • Psychiatric seclusion events lasting > 12 hours • Psychiatric seclusion events per 1000 inpatient days • Psychiatric inpatient days with one or more seclusion events per 100 inpatient days • Psychiatric inpatients experiencing one or more seclusion events per 100 discharges • Psychiatric inpatients experiencing one or more seclusion events per 1000 inpatient days • Repeated use of psychiatric seclusion
PC Indicator 7: Partial Hospitalization Programs
• PHP discharges to inpatient psychiatric or substance abuse unit/facility: • Total • For patients with <= 1 PHP visit • For patients with > 1 but <= 5 PHP visits • For patients with > 5 but <= 15 PHP visits • For patients with > 14 PHP visits • Due to initial inappropriate discharge to PHP • Due to patient non-compliance with treatment and/or medication • Due to return or exacerbation of symptoms not related to patient non-compliance • Due to medical or psychiatric complication of treatment including medication adjustment • For substance abuse treatment • For all other reasons
• PHP discharges: • To intensive outpatient programs (IOP) • To mental health centers or clinics • To private outpatient practitioners • Due to no shows, AMAs, or elopements • With no mental health follow-up • For all other discharge dispositions • For patients with <= 1 PHP visit • For patients with > 1 but <= 5 PHP visits • For patients with > 5 but <= 14 PHP visits • For patients with > 14 PHP visits
PC Indicator 8: Documented Falls
The following measures are available for adults only: • Documented falls in inpatient psychiatric care • Documented falls in inpatient psychiatric care due to the following reasons:
• Patient’s health status • Medication • Environmental hazard • All other causes
• Documented falls in inpatient psychiatric care resulting in: • Injury • Injury with Severity Score 1 • Injury with Severity Score 2 • Injury with Severity Score 3
PAGE 16
Long Term Care Indicators
LTC Indicator 1: Unplanned Weight Change
• Unplanned weight loss in LTC • Unplanned weight gain in LTC
LTC Indicator 2: Pressure Ulcers
Measures are available for total pressure ulcer point prevalence in LTC and for the following stages of pressure point prevalence in LTC:
• Stage I • Stage II • Stage III • Stage IV
LTC Indicator 3: Documented Falls
• Documented falls in LTC • Documented falls in LTC due to the following reasons:
• Resident/patient health status • Response to treatment, medication, and/or anesthesia • Environmental hazard • All other causes
• Documented falls in LTC resulting in: • Injury • Injury with Severity Score 1 • Injury with Severity Score 2 • Injury with Severity Score 3
• LTC resident/patient experiencing falls
LTC Indicator 4: Unscheduled Transfers/Discharges to Inpatient Acute Care
• Unscheduled LTC transfers/discharges to inpatient acute care within 72 hours of admission • Unscheduled LTC transfers/discharges to inpatient acute care • Unscheduled LTC transfers/discharges to inpatient acute care for the following reasons:
• Cardiovascular decompensation • Evaluation or treatment of fractures • Gastrointestinal bleeding • Infection • All other reasons
LTC Indicator 5: Nosocomial Infections
• Lower respiratory tract infections treated in LTC • LTC resident/patient days in which lower respiratory tract infections were treated • Symptomatic UTIs treated in LTC • Symptomatic UTIs treated in LTC residents/patients with indwelling urinary catheters • Symptomatic UTIs treated in LTC residents/patients without indwelling urinary catheters • LTC residents/patients treated for one or more symptomatic UTIs • LTC residents/patients with indwelling urinary catheters treated for one or more symptomatic UTIs • LTC residents/patients without indwelling urinary catheters treated for one or more symptomatic UTIs
LTC Indicator 6: Physical Restraint Use
• Physical restraint events in LTC • Physical restraint events in LTC for the following durations:
• Lasting <= 1 hour • Lasting > 1 but <= 4 hours • Lasting > 4 but <= 8 hours • Lasting > 8 but <= 16 hours
PAGE 17

• Lasting > 16 but <= 24 hours • Lasting > 24 hours
• Physical restraint events in LTC initiated for the following reasons: • Cognitive disorder • Risk of falling • Disruptive behavior • To facilitate treatment • For all other reasons
• Physical restraint events in LTC initiated between 7:00 AM and 2:50 PM • Physical restraint events in LTC initiated between 3:00 PM and 10: 59 PM • Physical restraint events in LTC initiated between 11:00 PM and 6:59 AM • LTC residents/patients experiencing physical restraint events • LTC residents/patients experiencing multiple physical restraint events
PAGE 18

Home Care Indicators
HC Indicator 1: Unscheduled Transfers to Inpatient Acute Care
Measures are available for the following unscheduled transfers: • To inpatient acute care • Due to cardiac problems • Due to catheter-related UTIs • Due to endocrine problems • Due to gastrointestinal problems • Due to injuries • Due to medication problems • Due to mental health problems • Due to neurological problems • Due to respiratory problems • Due to skin infections • For all other reasons
HC Indicator 2: Use of Emergent Care Services
Measures are available for home care patients experiencing one or more emergent care visits, for the total number of emergent care visits and for emergent care visits to:
• Hospital emergency departments • Doctor’s offices or house calls • Outpatient departments or clinics
HC Indicator 3: Discharge to Nursing Home Care
Measures are available for the total number of home care discharges to nursing home care and for the following reasons for home care discharges to nursing home care:
• For therapy services • For permanent placement • Because unsafe at home • For all other reasons
HC Indicator 4: Acquired Infections
• Symptomatic UTIs for home care patients with indwelling urinary catheters • Symptomatic UTIs for home care patients with indwelling urinary catheters: age < 75 • Symptomatic UTIs for home care patients with indwelling urinary catheters: age >= 75 • Surgical site infections • IV site infections • Sepsis in home care patients receiving TPN
PAGE 19