broiler industry stats summary for 2017 · broiler industry stats summary for 2017 ... table 5:...
TRANSCRIPT
1 | P a g e
BROILER INDUSTRY STATS SUMMARY FOR 2017
INDUSTRY STATISTICS
1. Price comparison of protein sources
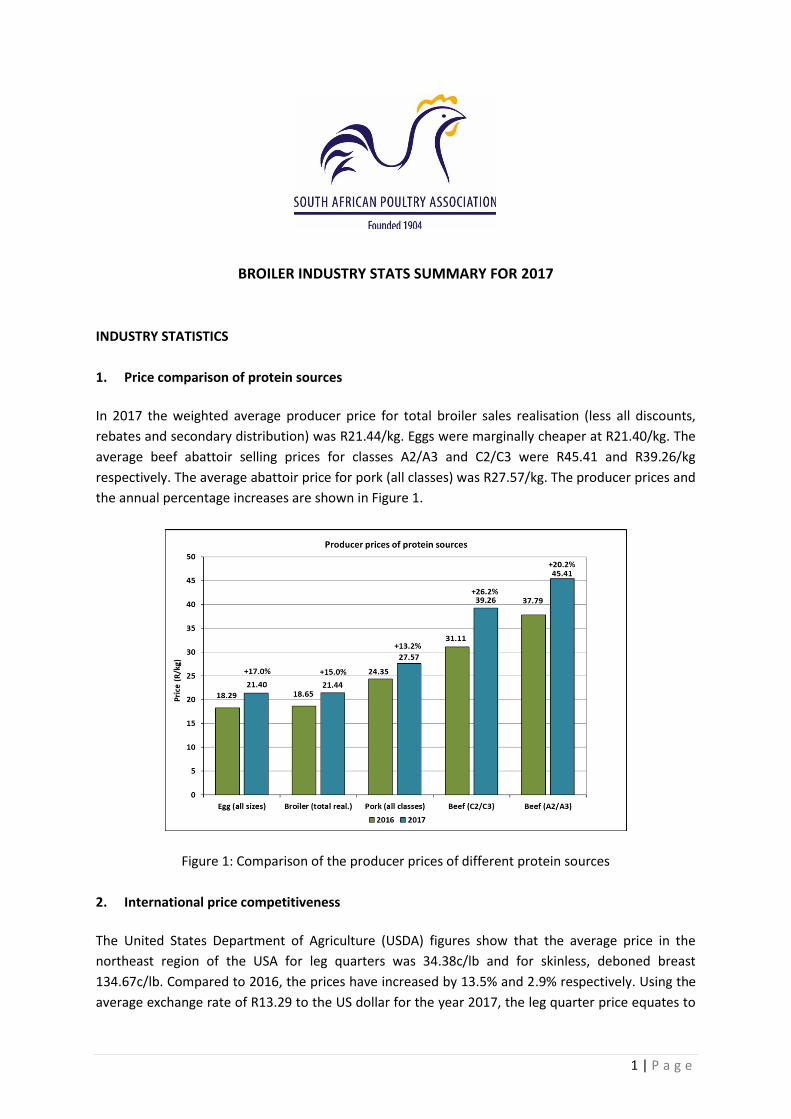
In 2017 the weighted average producer price for total broiler sales realisation (less all discounts,
rebates and secondary distribution) was R21.44/kg. Eggs were marginally cheaper at R21.40/kg. The
average beef abattoir selling prices for classes A2/A3 and C2/C3 were R45.41 and R39.26/kg
respectively. The average abattoir price for pork (all classes) was R27.57/kg. The producer prices and
the annual percentage increases are shown in Figure 1.
Figure 1: Comparison of the producer prices of different protein sources
2. International price competitiveness
The United States Department of Agriculture (USDA) figures show that the average price in the
northeast region of the USA for leg quarters was 34.38c/lb and for skinless, deboned breast
134.67c/lb. Compared to 2016, the prices have increased by 13.5% and 2.9% respectively. Using the
average exchange rate of R13.29 to the US dollar for the year 2017, the leg quarter price equates to
2 | P a g e
R10.07/kg and the skinless, deboned breast price to R39.46/kg. The South African price for mixed
individually quick-frozen portions was R21.73/kg and for fresh and frozen filleted breast R39.21/kg
and R32.72/kg respectively.
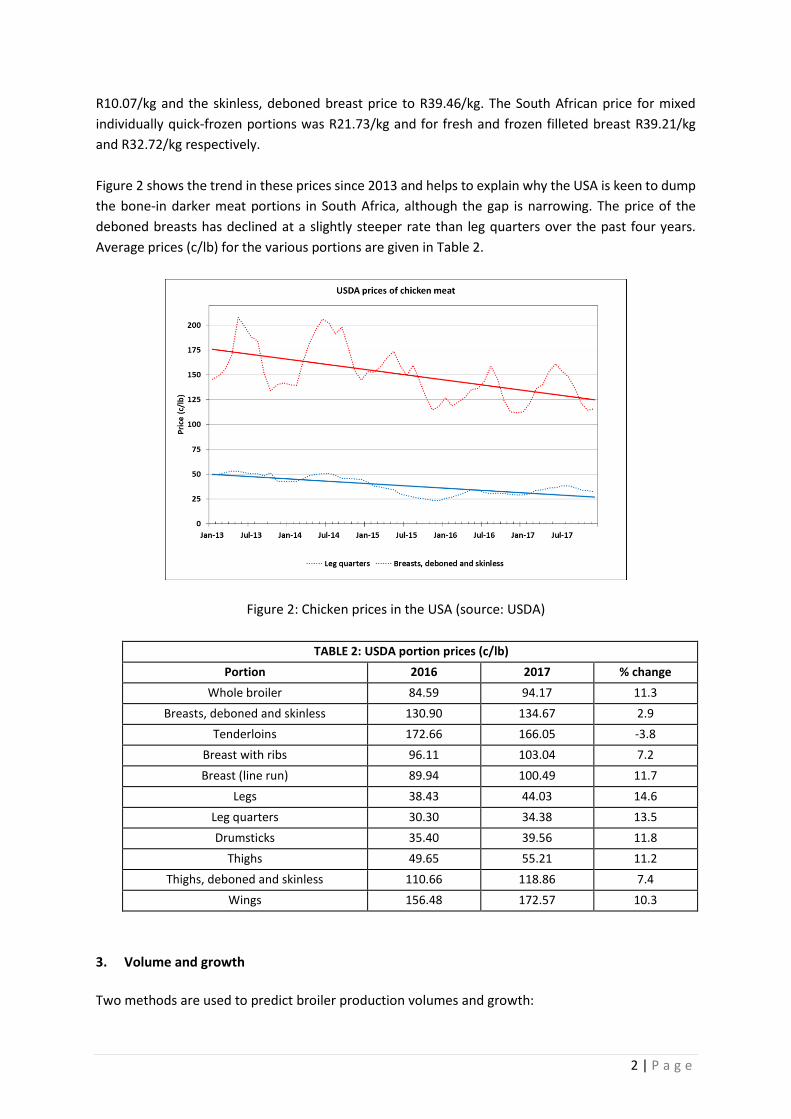
Figure 2 shows the trend in these prices since 2013 and helps to explain why the USA is keen to dump
the bone-in darker meat portions in South Africa, although the gap is narrowing. The price of the
deboned breasts has declined at a slightly steeper rate than leg quarters over the past four years.
Average prices (c/lb) for the various portions are given in Table 2.
Figure 2: Chicken prices in the USA (source: USDA)
TABLE 2: USDA portion prices (c/lb)
Portion 2016 2017 % change
Whole broiler 84.59 94.17 11.3
Breasts, deboned and skinless 130.90 134.67 2.9
Tenderloins 172.66 166.05 -3.8
Breast with ribs 96.11 103.04 7.2
Breast (line run) 89.94 100.49 11.7
Legs 38.43 44.03 14.6
Leg quarters 30.30 34.38 13.5
Drumsticks 35.40 39.56 11.8
Thighs 49.65 55.21 11.2
Thighs, deboned and skinless 110.66 118.86 7.4
Wings 156.48 172.57 10.3
3. Volume and growth
Two methods are used to predict broiler production volumes and growth:

3 | P a g e
• Model 1: The broiler forecasting model uses the number of day-old female parent placements supplied by the industry to predict the size of the breeder flocks, the number of day-old broiler chicks hatched and the number of broilers slaughtered;
• Model 2: A simpler model uses the number of day-old broiler chicks hatched supplied by the industry to predict the number of broilers slaughtered.
Both models are reliant on accurate and regular statistics being submitted by the industry.
4. Broiler breeders
The average number of parent males and females in rearing during 2017 was 3.535 million per week;
a decrease of 343 000 birds (-8.9%) compared to 2016. Using a genetic pyramid, the estimated number
of grandparent and great-grandparent stock (males and females) in South Africa was 244 000.
An average broiler breeder laying flock of 6.491 million hens was estimated for 2017; a decrease of
605 000 hens (-8.5%) compared to 2016. Figure 3 shows the changes in the size of the broiler breeder
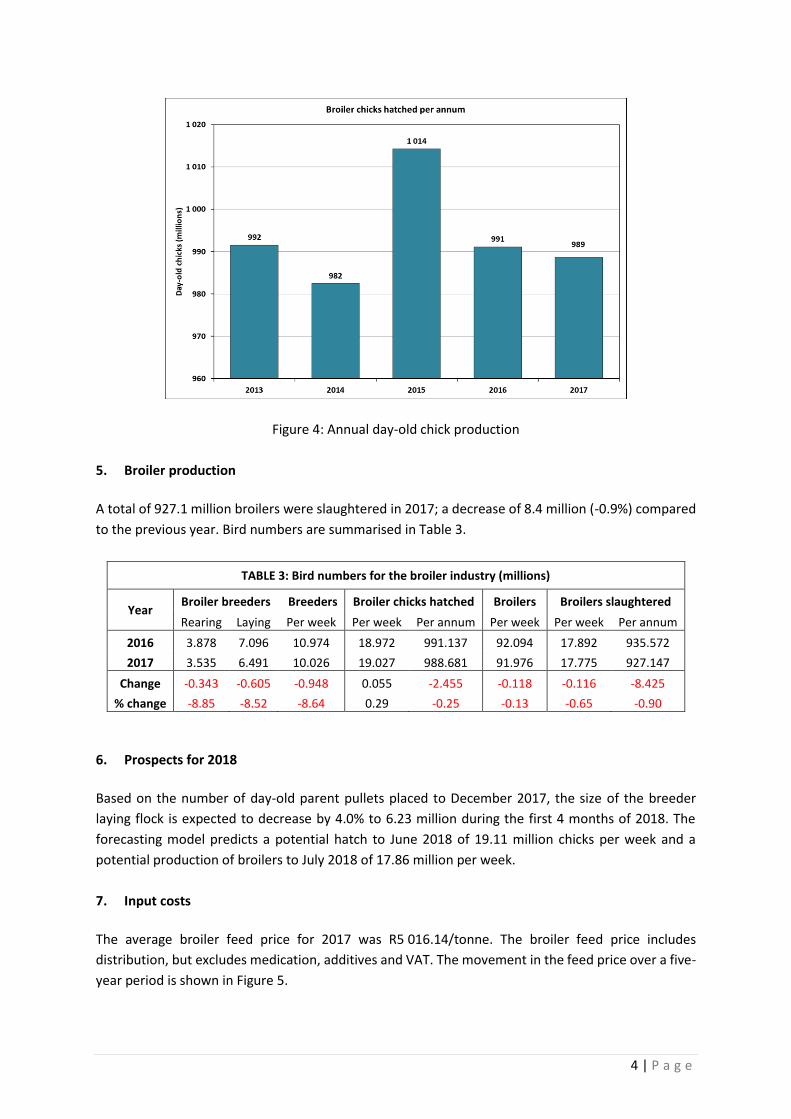
laying flock since 2013. Figure 4 illustrates the total number of day-old broiler chicks hatched annually.
In 2017 a total of 988.7 million day-old chicks were hatched; a 0.3% annual decrease.
Figure 3: The size of the broiler breeder flock
4 | P a g e
Figure 4: Annual day-old chick production
5. Broiler production
A total of 927.1 million broilers were slaughtered in 2017; a decrease of 8.4 million (-0.9%) compared
to the previous year. Bird numbers are summarised in Table 3.
TABLE 3: Bird numbers for the broiler industry (millions)
Year Broiler breeders Breeders Broiler chicks hatched Broilers Broilers slaughtered
Rearing Laying Per week Per week Per annum Per week Per week Per annum
2016 3.878 7.096 10.974 18.972 991.137 92.094 17.892 935.572
2017 3.535 6.491 10.026 19.027 988.681 91.976 17.775 927.147
Change -0.343 -0.605 -0.948 0.055 -2.455 -0.118 -0.116 -8.425
% change -8.85 -8.52 -8.64 0.29 -0.25 -0.13 -0.65 -0.90
6. Prospects for 2018
Based on the number of day-old parent pullets placed to December 2017, the size of the breeder
laying flock is expected to decrease by 4.0% to 6.23 million during the first 4 months of 2018. The
forecasting model predicts a potential hatch to June 2018 of 19.11 million chicks per week and a
potential production of broilers to July 2018 of 17.86 million per week.
7. Input costs
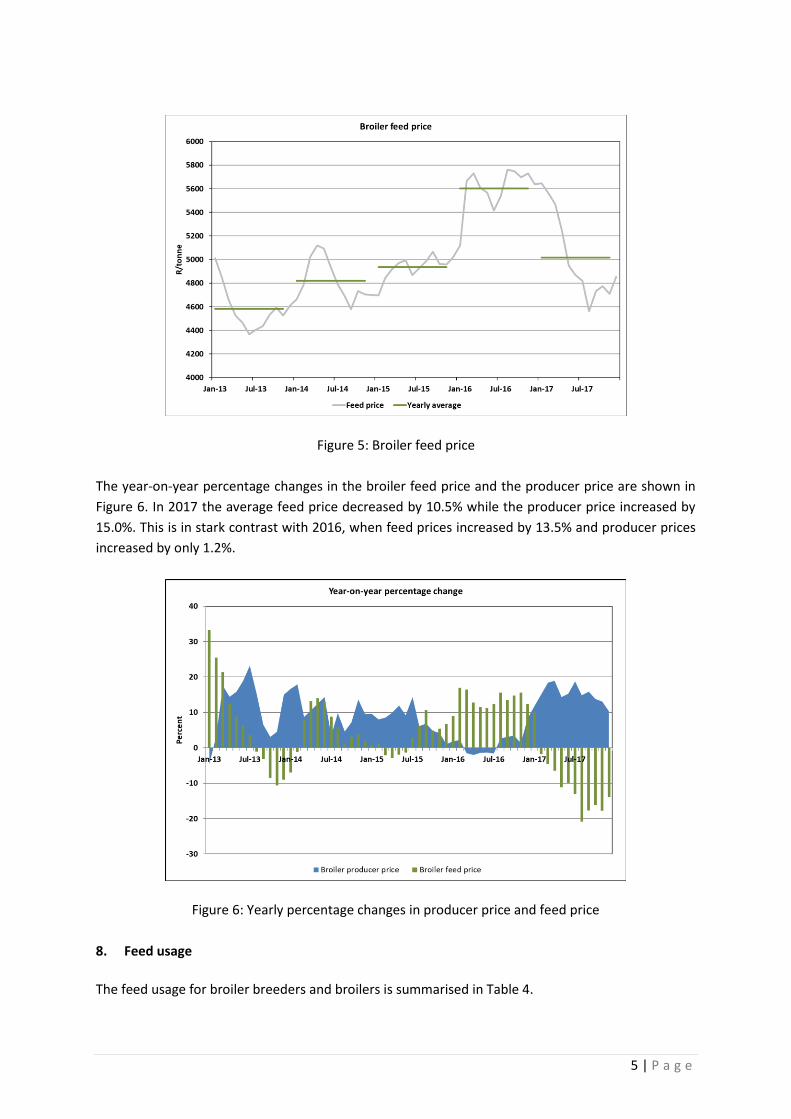
The average broiler feed price for 2017 was R5 016.14/tonne. The broiler feed price includes
distribution, but excludes medication, additives and VAT. The movement in the feed price over a five-
year period is shown in Figure 5.
5 | P a g e
Figure 5: Broiler feed price
The year-on-year percentage changes in the broiler feed price and the producer price are shown in
Figure 6. In 2017 the average feed price decreased by 10.5% while the producer price increased by
15.0%. This is in stark contrast with 2016, when feed prices increased by 13.5% and producer prices
increased by only 1.2%.
Figure 6: Yearly percentage changes in producer price and feed price
8. Feed usage
The feed usage for broiler breeders and broilers is summarised in Table 4.
6 | P a g e
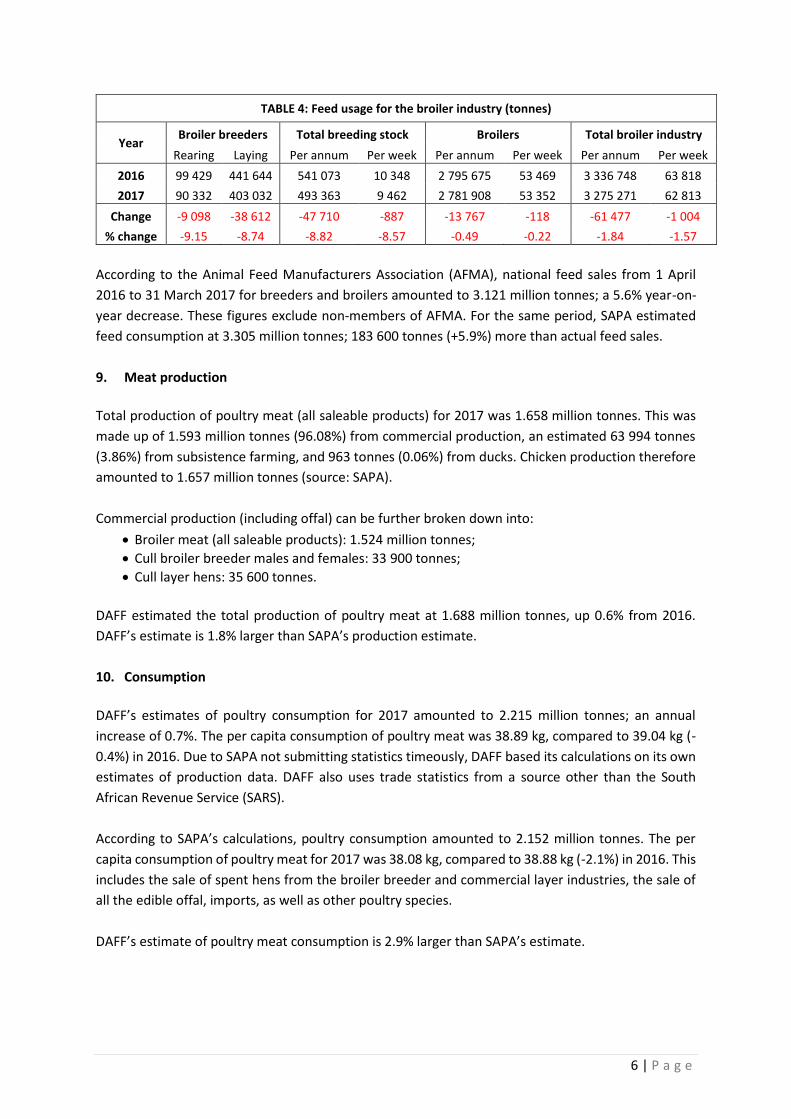
TABLE 4: Feed usage for the broiler industry (tonnes)
Year Broiler breeders Total breeding stock Broilers Total broiler industry
Rearing Laying Per annum Per week Per annum Per week Per annum Per week
2016 99 429 441 644 541 073 10 348 2 795 675 53 469 3 336 748 63 818
2017 90 332 403 032 493 363 9 462 2 781 908 53 352 3 275 271 62 813
Change -9 098 -38 612 -47 710 -887 -13 767 -118 -61 477 -1 004
% change -9.15 -8.74 -8.82 -8.57 -0.49 -0.22 -1.84 -1.57
According to the Animal Feed Manufacturers Association (AFMA), national feed sales from 1 April
2016 to 31 March 2017 for breeders and broilers amounted to 3.121 million tonnes; a 5.6% year-on-
year decrease. These figures exclude non-members of AFMA. For the same period, SAPA estimated
feed consumption at 3.305 million tonnes; 183 600 tonnes (+5.9%) more than actual feed sales.
9. Meat production
Total production of poultry meat (all saleable products) for 2017 was 1.658 million tonnes. This was
made up of 1.593 million tonnes (96.08%) from commercial production, an estimated 63 994 tonnes
(3.86%) from subsistence farming, and 963 tonnes (0.06%) from ducks. Chicken production therefore
amounted to 1.657 million tonnes (source: SAPA).
Commercial production (including offal) can be further broken down into:
• Broiler meat (all saleable products): 1.524 million tonnes;
• Cull broiler breeder males and females: 33 900 tonnes;
• Cull layer hens: 35 600 tonnes.
DAFF estimated the total production of poultry meat at 1.688 million tonnes, up 0.6% from 2016.
DAFF’s estimate is 1.8% larger than SAPA’s production estimate.
10. Consumption
DAFF’s estimates of poultry consumption for 2017 amounted to 2.215 million tonnes; an annual
increase of 0.7%. The per capita consumption of poultry meat was 38.89 kg, compared to 39.04 kg (-
0.4%) in 2016. Due to SAPA not submitting statistics timeously, DAFF based its calculations on its own
estimates of production data. DAFF also uses trade statistics from a source other than the South
African Revenue Service (SARS).
According to SAPA’s calculations, poultry consumption amounted to 2.152 million tonnes. The per
capita consumption of poultry meat for 2017 was 38.08 kg, compared to 38.88 kg (-2.1%) in 2016. This
includes the sale of spent hens from the broiler breeder and commercial layer industries, the sale of
all the edible offal, imports, as well as other poultry species.
DAFF’s estimate of poultry meat consumption is 2.9% larger than SAPA’s estimate.
7 | P a g e
Consumption of broiler (chicken) meat (all saleable products) amounted to 2.122 million tonnes in
2017; a 0.6% annual decrease. The per capita consumption of chicken meat for the year was 37.55 kg,
compared to 38.38 kg in 2016; a 2.2% decrease (source: SAPA).
Poultry imports made up 26% of poultry meat consumption; the same as in 2016.
11. Gross value
The gross value of primary agricultural production from poultry meat (inclusive of all types of poultry)
for the period 2017 was R44.04 billion, reflecting an annual increase of 20.1% (source: DAFF). Poultry
meat contributed 32.1% to the gross value of animal products (up from 30.7% in 2016) and 15.9% to
all agricultural production (up from 14.3% in 2016).
The gross value for 2017 was calculated by DAFF based on its own estimations of poultry meat
production, in the absence of industry data from SAPA.
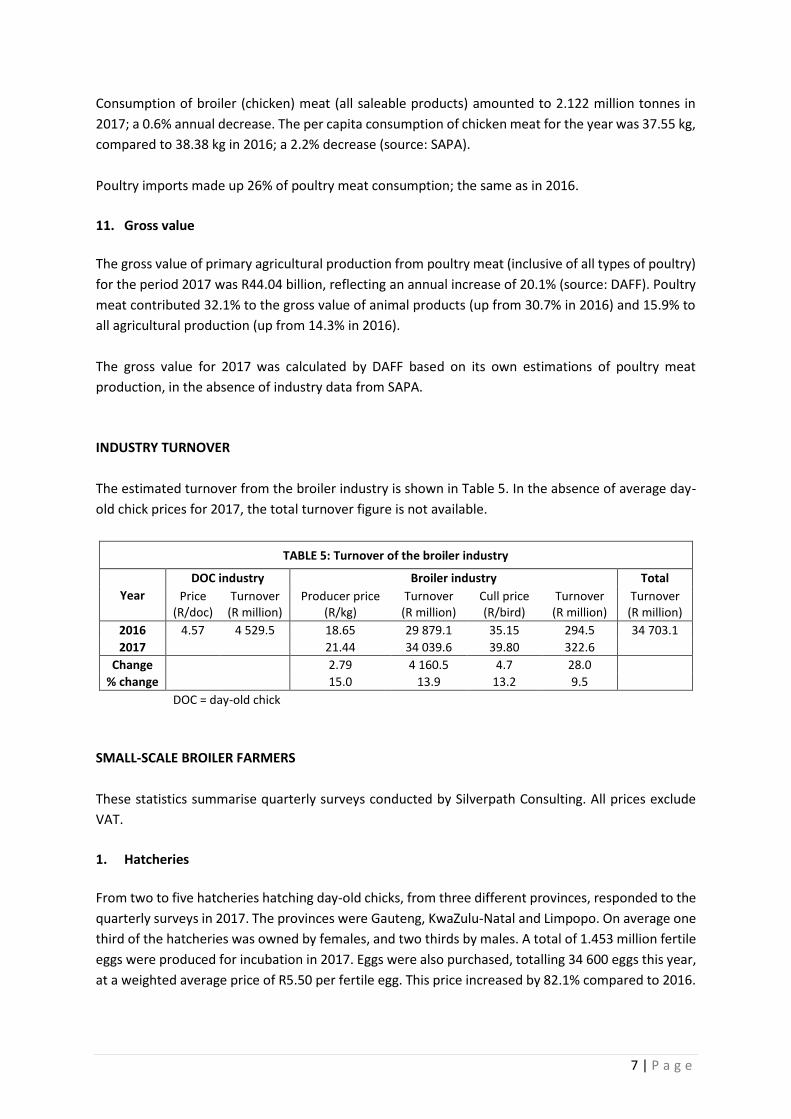
INDUSTRY TURNOVER
The estimated turnover from the broiler industry is shown in Table 5. In the absence of average day-
old chick prices for 2017, the total turnover figure is not available.
TABLE 5: Turnover of the broiler industry
Year
DOC industry Broiler industry Total
Price (R/doc)
Turnover (R million)
Producer price (R/kg)
Turnover (R million)
Cull price (R/bird)
Turnover (R million)
Turnover (R million)
2016 4.57 4 529.5 18.65 29 879.1 35.15 294.5 34 703.1
2017 21.44 34 039.6 39.80 322.6
Change 2.79 4 160.5 4.7 28.0
% change 15.0 13.9 13.2 9.5
DOC = day-old chick
SMALL-SCALE BROILER FARMERS
These statistics summarise quarterly surveys conducted by Silverpath Consulting. All prices exclude
VAT.
1. Hatcheries
From two to five hatcheries hatching day-old chicks, from three different provinces, responded to the
quarterly surveys in 2017. The provinces were Gauteng, KwaZulu-Natal and Limpopo. On average one
third of the hatcheries was owned by females, and two thirds by males. A total of 1.453 million fertile
eggs were produced for incubation in 2017. Eggs were also purchased, totalling 34 600 eggs this year,
at a weighted average price of R5.50 per fertile egg. This price increased by 82.1% compared to 2016.
8 | P a g e
The total number of broiler chicks sold in 2017 was 877 700 at a weighted average selling price of
R6.61 per chick; a 14.1% annual increase in price. The total value of the broiler chick sales was R5.802
million in 2017. The turnover dropped by 46.7% compared to last year.
2. Broiler producers
An average of 173 broiler farmers (down from 209 in 2016), from all 9 provinces, responded to the
survey in 2017. The average provincial representation of small-scale broiler farms across the quarters
was in Limpopo (59), Gauteng (41), KwaZulu-Natal (33), Mpumalanga (10), Eastern Cape (11), Free
State (9), North West (6), Northern Cape (4) and Western Cape (1). On average the farms had greater
female (60%) than male (40%) ownership.
• Day-old chicks
The average purchase price of a day-old chick in 2017 was R6.82; a 3% increase compared to 2016.
(Note: these purchases were not necessarily made from the hatcheries taking part in the survey.) The
sum of chicks placed per cycle in each quarter was 1.015 million (-14.6%), and the average across the
quarters of chicks placed per cycle was 1 453. The average utilisation of the broiler farms in 2017 was
30.2% of capacity; down from 43.3% the previous year. The average mortality rate per cycle was 6.7%.
• Broiler feed
Ninety-eight percent of the respondents bought feed in bags in 2017, while 1% bought in bulk and 1%
manufactured their own feed. The prices are summarised in Table 6 and exclude VAT and transport.
The annual percentage changes are reflected in brackets.
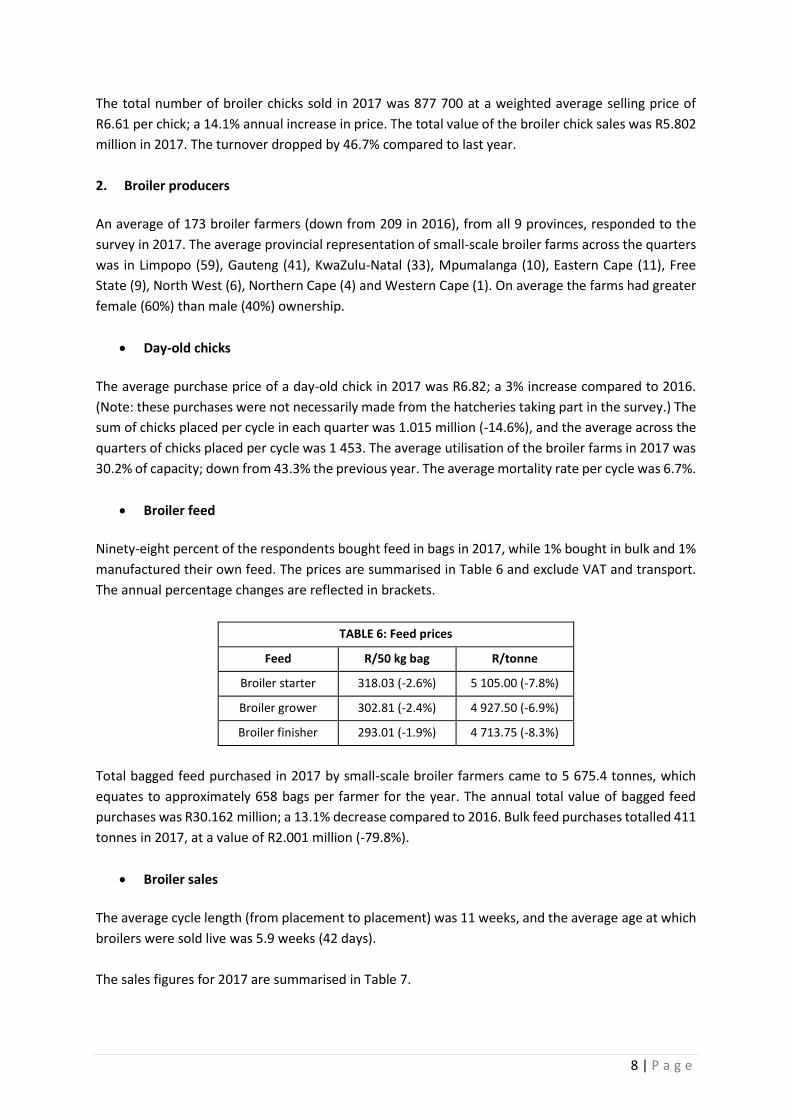
TABLE 6: Feed prices
Feed R/50 kg bag R/tonne
Broiler starter 318.03 (-2.6%) 5 105.00 (-7.8%)
Broiler grower 302.81 (-2.4%) 4 927.50 (-6.9%)
Broiler finisher 293.01 (-1.9%) 4 713.75 (-8.3%)
Total bagged feed purchased in 2017 by small-scale broiler farmers came to 5 675.4 tonnes, which
equates to approximately 658 bags per farmer for the year. The annual total value of bagged feed
purchases was R30.162 million; a 13.1% decrease compared to 2016. Bulk feed purchases totalled 411
tonnes in 2017, at a value of R2.001 million (-79.8%).
• Broiler sales
The average cycle length (from placement to placement) was 11 weeks, and the average age at which
broilers were sold live was 5.9 weeks (42 days).
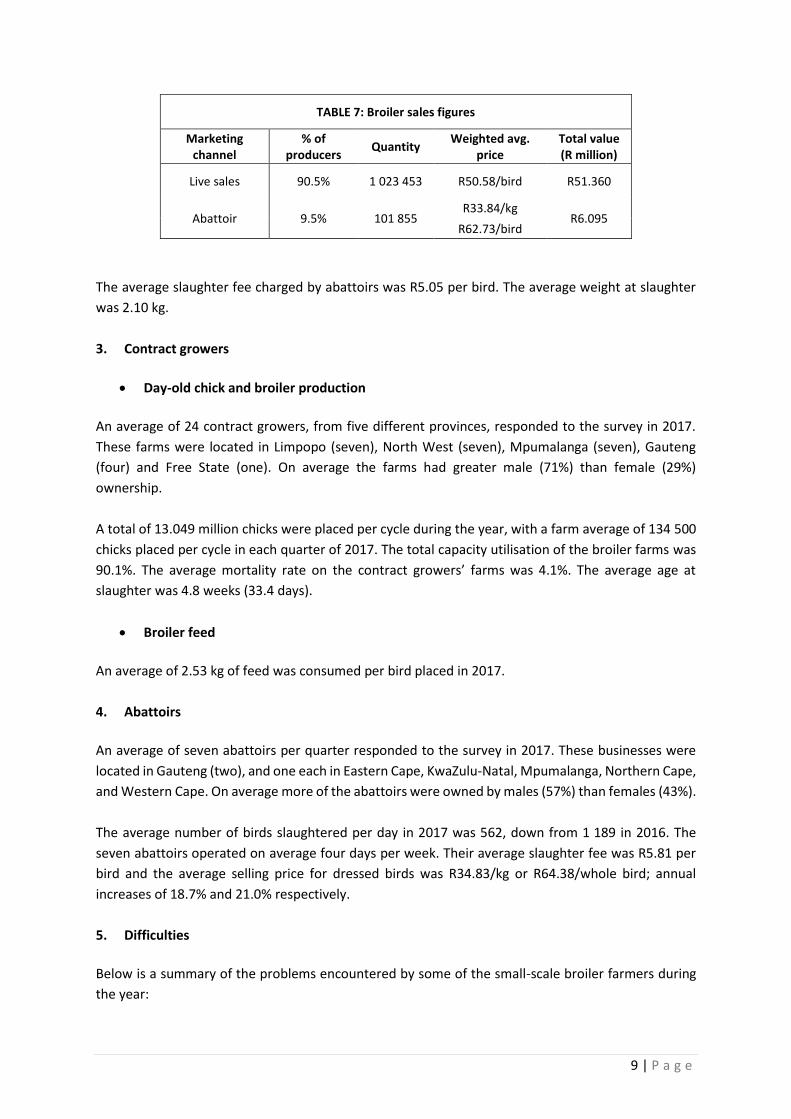
The sales figures for 2017 are summarised in Table 7.
9 | P a g e
TABLE 7: Broiler sales figures
Marketing channel
% of producers
Quantity Weighted avg.
price Total value (R million)
Live sales 90.5% 1 023 453 R50.58/bird R51.360
Abattoir 9.5% 101 855 R33.84/kg
R6.095 R62.73/bird
The average slaughter fee charged by abattoirs was R5.05 per bird. The average weight at slaughter
was 2.10 kg.
3. Contract growers
• Day-old chick and broiler production
An average of 24 contract growers, from five different provinces, responded to the survey in 2017.
These farms were located in Limpopo (seven), North West (seven), Mpumalanga (seven), Gauteng
(four) and Free State (one). On average the farms had greater male (71%) than female (29%)
ownership.
A total of 13.049 million chicks were placed per cycle during the year, with a farm average of 134 500
chicks placed per cycle in each quarter of 2017. The total capacity utilisation of the broiler farms was
90.1%. The average mortality rate on the contract growers’ farms was 4.1%. The average age at
slaughter was 4.8 weeks (33.4 days).
• Broiler feed
An average of 2.53 kg of feed was consumed per bird placed in 2017.
4. Abattoirs
An average of seven abattoirs per quarter responded to the survey in 2017. These businesses were
located in Gauteng (two), and one each in Eastern Cape, KwaZulu-Natal, Mpumalanga, Northern Cape,
and Western Cape. On average more of the abattoirs were owned by males (57%) than females (43%).
The average number of birds slaughtered per day in 2017 was 562, down from 1 189 in 2016. The
seven abattoirs operated on average four days per week. Their average slaughter fee was R5.81 per
bird and the average selling price for dressed birds was R34.83/kg or R64.38/whole bird; annual
increases of 18.7% and 21.0% respectively.
5. Difficulties
Below is a summary of the problems encountered by some of the small-scale broiler farmers during
the year:
10 | P a g e
• Receiving no assistance from DAFF;
• Required training on how to raise chicks and administer antibiotics;
• Hatchery was not vaccinating chicks so they were experiencing very high mortalities. In addition, there was a belief that hatcheries were supplying very poor-quality chicks to smaller farmers and that this was causing higher levels of mortality and large losses in profit;
• Difficulty sourcing day-old chicks due to the shortage caused by AI;
• High mortalities, and a few respondents made special note of AI;
• Poor quality feed and chicks. Some respondents were forced to buy second-grade chicks;
• Late feed deliveries and collection;
• Battling to deliver chicks to clients or locate an abattoir nearby;
• Battling to find a place nearby to buy good quality chicks, medication or feed;
• Battling to locate a supplier of sawdust;
• Struggling to find reliable transport to collect the day-old chicks and feed;
• High feed, transport and chick costs;
• Cash flow problems and unable to source funding to expand the business or renovate poultry buildings;
• Unable to sell birds for cash due to poverty, which forced the farmers to give birds on credit. There was invariably non-payment of accounts by clients;
• Poor water and electricity supply. Some respondents had no access to electricity, or could not afford it, so had to resort to using gas, which was also costly;
• Not making sufficient profit;
• Experiencing a problem with theft of the chickens due to the poor condition of the chicken houses allowing easy access;
• Insufficient equipment to raise the chicks;
• Poor growth of the birds during winter. Some respondents did not have any way to heat new batches of chicks;
• Could not afford to buy vaccines;
• Struggling for market share due to the high level of imports;
• Struggling with a rat infestation; and
• High cost of processing birds at the abattoir.
TRADE
1. Annual poultry imports
SARS reported that annual poultry imports for 2017 totalled 556 877 tonnes; a decrease of 3 278
tonnes (-0.6%) compared to 2016. Chicken imports amounted to 524 259 tonnes; 4 247 tonnes less (-
0.8%) than 2016. This represented 94.1% of total poultry imports. Of the total chicken meat imported,
99.8% was frozen.
Brazil was the main country of origin of poultry imports, accounting for a massive 60.6% or 337 476
tonnes. With AI bans affecting EU trade, the USA was the second largest, with 15.6% or 87 059 tonnes;
followed by Argentina (5.9% or 32 816 tonnes); Ireland (4.4% or 24 746 tonnes); and Belgium (4.2% or
23 451 tonnes). As a whole the EU contributed 14.0% to total poultry imports, compared to 48.1% in
2016 and 41.7% in 2015.
Poultry imports were equivalent to 34% of domestic poultry production, compared to 33% in 2016.
11 | P a g e
2. Frozen broiler meat imports
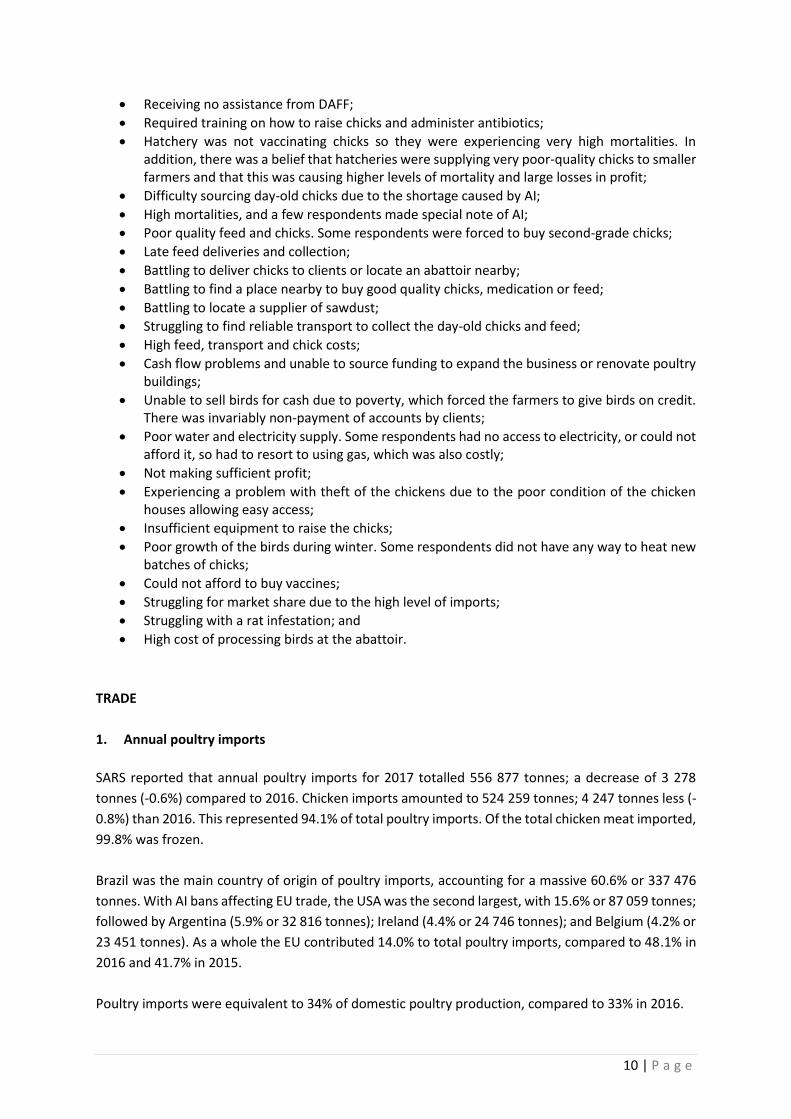
Frozen broiler (chicken) meat imports totalled 523 428 tonnes; a decrease of 4 681 tonnes, or -0.9%,
compared to the 2016 imports of 528 108 tonnes (Figure 7).
Figure 7: Annual frozen broiler meat imports from all countries
Table 8 reflects the different products in term of tonnage and value, and their percentage changes
compared to 2016. Of the 233 046 tonnes of bone-in portions, 72.7% were leg quarters, 12.2%
drumsticks, 8.3% wings, 3.5% thighs and 3.3% other bone-in cuts.
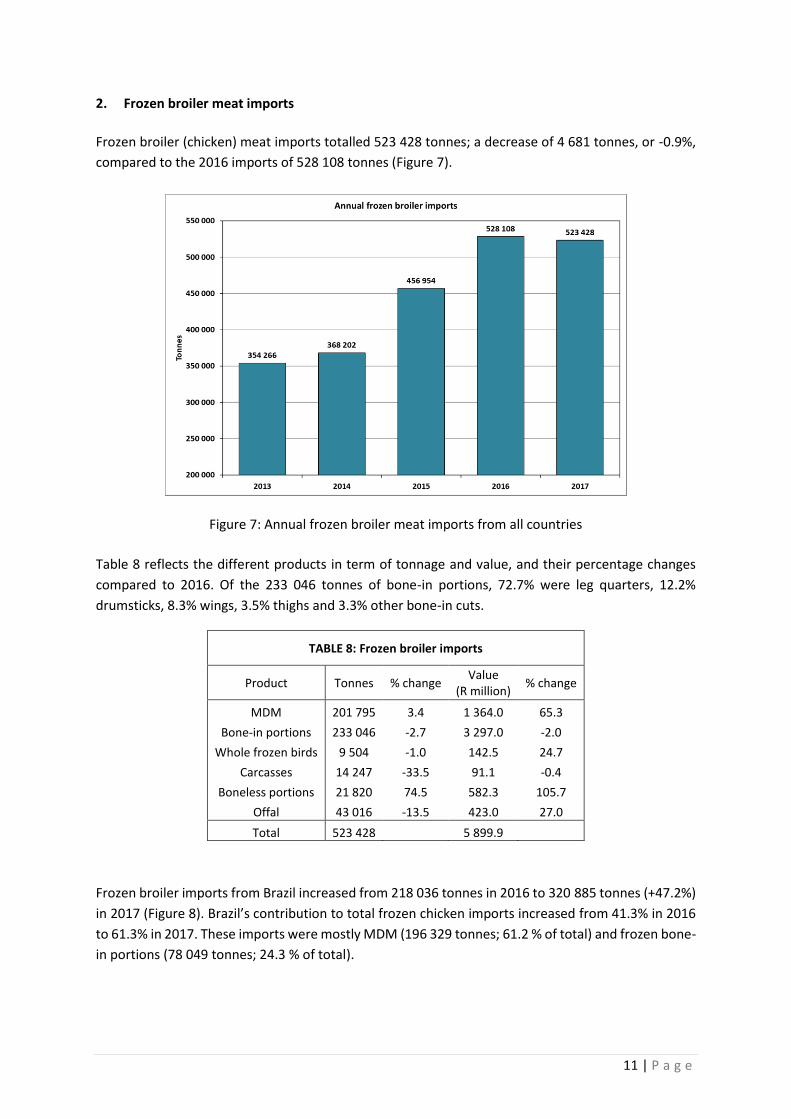
Frozen broiler imports from Brazil increased from 218 036 tonnes in 2016 to 320 885 tonnes (+47.2%)
in 2017 (Figure 8). Brazil’s contribution to total frozen chicken imports increased from 41.3% in 2016
to 61.3% in 2017. These imports were mostly MDM (196 329 tonnes; 61.2 % of total) and frozen bone-
in portions (78 049 tonnes; 24.3 % of total).
TABLE 8: Frozen broiler imports
Product Tonnes % change Value
(R million) % change
MDM 201 795 3.4 1 364.0 65.3
Bone-in portions 233 046 -2.7 3 297.0 -2.0
Whole frozen birds 9 504 -1.0 142.5 24.7
Carcasses 14 247 -33.5 91.1 -0.4
Boneless portions 21 820 74.5 582.3 105.7
Offal 43 016 -13.5 423.0 27.0
Total 523 428 5 899.9
12 | P a g e
Figure 8: Frozen broiler imports from Brazil
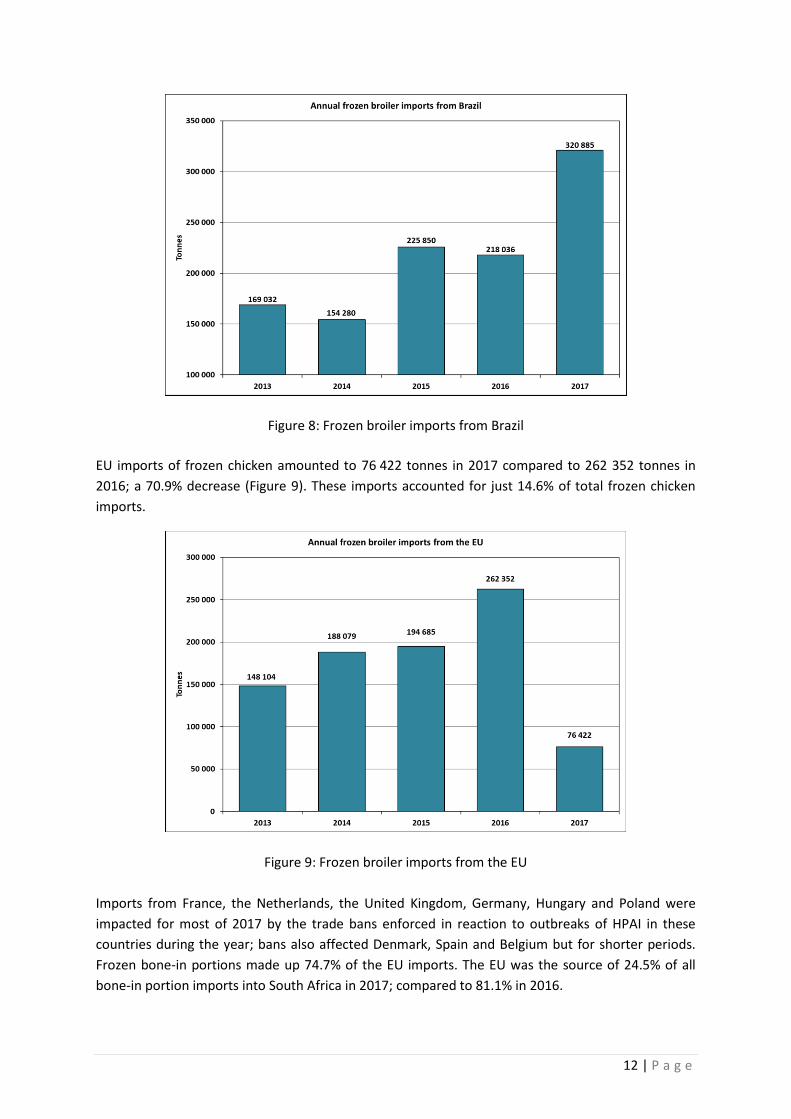
EU imports of frozen chicken amounted to 76 422 tonnes in 2017 compared to 262 352 tonnes in
2016; a 70.9% decrease (Figure 9). These imports accounted for just 14.6% of total frozen chicken
imports.
Figure 9: Frozen broiler imports from the EU
Imports from France, the Netherlands, the United Kingdom, Germany, Hungary and Poland were
impacted for most of 2017 by the trade bans enforced in reaction to outbreaks of HPAI in these
countries during the year; bans also affected Denmark, Spain and Belgium but for shorter periods.
Frozen bone-in portions made up 74.7% of the EU imports. The EU was the source of 24.5% of all
bone-in portion imports into South Africa in 2017; compared to 81.1% in 2016.
13 | P a g e
In 2017, Brazil and the USA were the two biggest contributors to frozen bone-in portion imports (both
33.5%), followed by Belgium (9.5%), Ireland (6.6%), Argentina (6.2%), Denmark (5.8%), Spain (2.3%)
and Canada (1.8%).
3. Value of imports
In 2017 the free on board (FOB) value of poultry imports amounted to R6.44 billion; an increase of
R0.957 billion (+17.5%) in comparison with the value of total poultry imports for 2016.
The value of chicken imports amounted to R5.923 billion; an 18.0% increase over the value of 2016
imports. The main contributors were frozen bone-in portions at R3.297 billion and frozen MDM at
R1.364 billion; 55.7% and 23.0% of the value of chicken imports respectively. Total frozen chicken
imports had a value of R5.90 billion; up 17.8% on 2016.
4. Poultry exports
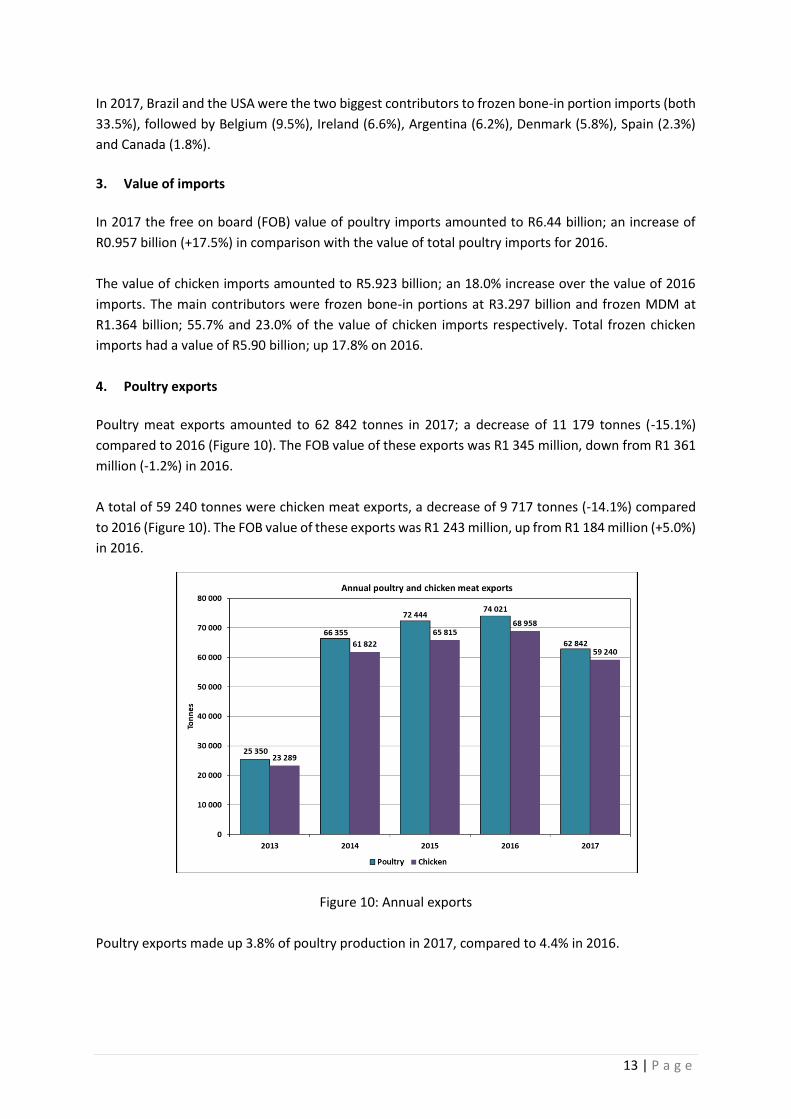
Poultry meat exports amounted to 62 842 tonnes in 2017; a decrease of 11 179 tonnes (-15.1%)
compared to 2016 (Figure 10). The FOB value of these exports was R1 345 million, down from R1 361
million (-1.2%) in 2016.
A total of 59 240 tonnes were chicken meat exports, a decrease of 9 717 tonnes (-14.1%) compared
to 2016 (Figure 10). The FOB value of these exports was R1 243 million, up from R1 184 million (+5.0%)
in 2016.
Figure 10: Annual exports
Poultry exports made up 3.8% of poultry production in 2017, compared to 4.4% in 2016.
14 | P a g e
The main destination countries for poultry exports were Lesotho (31.0%), Mozambique (28.4%),
Namibia (21.4%), Botswana (5.4%), Swaziland (3.4%), Zimbabwe (2.6%), and Zambia (1.7%). The
remaining 41 destination countries collectively received 6.1% of the exports.
THE GLOBAL BROILER INDUSTRY
Global production of poultry meat is forecasted to increase from 117.2 million tonnes in 2016 to 118.2
million tonnes in 2017; a 0.9% change (source: Food and Agriculture Organization (FAO), November
2017. Food Outlook.). Trade in poultry meat is expected to increase by 2.0%, from 12.8 to 13.1 million
tonnes. Poultry meat prices will increase by almost 7%. Production in China in 2017 was badly affected
by HPAI outbreaks and the forced closure of live bird markets, so its output is expected to decrease
by an estimated 5.2% to 16.3 million tonnes – the lowest level since 2009. Despite extensive outbreaks
of HPAI in the EU, poultry production should reach 14.8 million tonnes (+1%) in 2017.
Most of the growth in the production of poultry meat is expected to come from the USA, Brazil, the
EU, Russia, India, Thailand and Mexico. A record-breaking 22 million tonnes (+1.8%) is forecasted by
the FAO for the USA in 2017. Brazil is expected to capitalise on its HPAI-free status and stable feed
prices and expand production by 2.6% (source: FAO, November 2017. Food Outlook.).
Countries expected to show an increase in imports are Angola, Cuba, Japan, Iraq, and the United Arab
Emirates. A decline in imports for 2017 is anticipated in the EU, China, Vietnam, Mexico, Saudi Arabia,
and the Philippines. Most of the increased exports, on the other hand, will be seen from the USA,
Thailand, Brazil, Ukraine, Argentina, Russia, and China. The USA was able to boost exports to Cuba,
Angola and South Africa owing to competitive international prices, increased output and, since August
2017, its HPAI-free status. Exports are expected to decline in Iran, Chile and the EU (source: FAO,
November 2017. Food Outlook.).
The USDA predicts that US broiler production will increase by 2.1% in 2017 to 18.84 million tonnes
and by 1.8% to 19.18 million tonnes in 2018. Per capita consumption of chicken meat is expected to
be 41.2 kg and 41.7 kg in 2017 and 2018 respectively. Broiler meat exports are expected to reach 3.04
million tonnes in 2017 and 3.13 million tonnes in 2018; a growth of 2.9%.
EMPLOYMENT
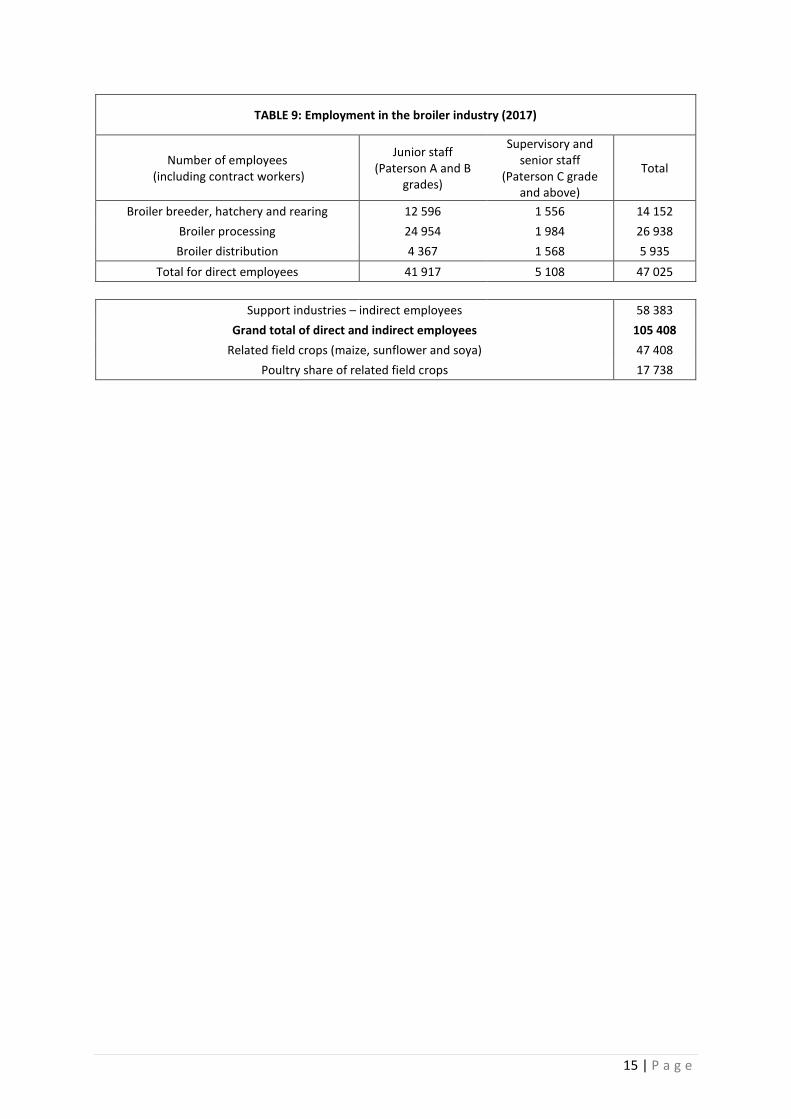
The survey results of 2012 were used as a base to estimate the employment numbers for 2017, taking
into account the negative growth in the industry. The results are summarised in Table 9.
SAPA estimates that for every 10 000 tonnes of chicken meat imported, 1 000 direct and indirect jobs
are lost in South Africa. The grand total for direct and indirect employees for 2016 was estimated to
be 106 130; thus 722 jobs may have been shed in the past year.
15 | P a g e
TABLE 9: Employment in the broiler industry (2017)
Number of employees (including contract workers)
Junior staff (Paterson A and B
grades)
Supervisory and senior staff
(Paterson C grade and above)
Total
Broiler breeder, hatchery and rearing 12 596 1 556 14 152
Broiler processing 24 954 1 984 26 938
Broiler distribution 4 367 1 568 5 935
Total for direct employees 41 917 5 108 47 025
Support industries – indirect employees 58 383
Grand total of direct and indirect employees 105 408
Related field crops (maize, sunflower and soya) 47 408
Poultry share of related field crops 17 738