brood ecology and thesis submitted to the college of in
TRANSCRIPT

BROOD ECOLOGY AND
POPULATION DYNAMICS
OF KING EIDERS
Thesis Submitted to the College of
Graduate Studies and Research
in Partial Fulfillment of the Requirements
for the Degree of Doctor of Philosophy,
in the Department of Biology
University of Saskatchewan Saskatoon
By
Katherine Rose Mehl
©Copyright Katherine Rose Mehl, 2004. All rights reserved.
i

PERMISSION TO USE
In presenting this thesis in partial fulfillment of the requirements for a Postgraduate
degree from the University of Saskatchewan, I agree that the Libraries of this
University may make it freely available for inspection. I further agree that permission
for copying of this thesis in any manner, in whole or in part, for scholarly purposes
may be granted by the professor or professors who supervised my thesis work or, in
their absence, by the Head of the Department or the Dean of the College in which my
thesis work was done. It is understood that any copying or publication or use of this
thesis or parts thereof for financial gain shall not be allowed without my written
permission. It is also understood that due recognition shall be given to me and to the
University of Saskatchewan in any scholarly use which may be made of any material
in my thesis.
Requests for permission to copy or to make other use of the material in this thesis in
whole or part should be addressed to:
Head of the Department of Biology
112 Science Place
University of Saskatchewan
Saskatoon, Saskatchewan S7N 5E2
Canada
i

ABSTRACT
Birth and death processes and the extent of dispersal directly affect population
dynamics. Knowledge of ecological factors that influence these processes provides
insight into natural selection and understanding about changes in population size. King
eiders (Somateria spectabilis) breed across the arctic region of North America and
winter in polar oceanic waters of the western and eastern regions of the continent. Here I
studied a local population of King Eiders at Karrak Lake, Nunavut, where I used
analysis of naturally-occurring stable isotopes (13C, 15N) from feathers, in conjunction
with banding data, to investigate the extent of dispersal among winter areas and the
influence of winter area on subsequent breeding. In addition, I used capture-mark-
recapture methods to (1) investigate the relative contributions of survival and
recruitment probabilities to local population dynamics, and (2) to test hypotheses about
the influence of specific ecological factors on those probabilities or their components,
e.g., nest success, duckling survival. Isotopic data suggested that female King Eiders
were not strongly philopatric to wintering areas between years. Individuals that wintered
in western seas initiated nests earlier and had slightly larger clutch sizes during early
nest initiation relative to females that wintered in the east. Female condition during
incubation did not vary by winter area.
Female King Eiders of known breeding age were at least 3-years-old before their
first breeding attempt. Age of first successful breeding attempt did not appear to be
influenced by body size. However, after reaching breeding age, larger females
apparently experienced greater breeding propensity. Adult survival rate (1996-2002)
was estimated as 0.87 and recapture probabilities varied with time and ranged from 0.31
to 0.67. There is no evidence of survival advantages related to larger size. Population
growth for this local study area was high, estimated at 20%/year with larger females
contributing more to the population growth than smaller females. With continued
population growth, density-dependent effects on components of recruitment appeared to
ii

emerge; the proportion of the female population that nested successfully declined with
increasing
iii

population size. The probability of breeding successfully did not correlate with Mayfield
estimates of nest success.
To gain insight into King Eider brood ecology I, respectively, monitored 111 and
46 individually-marked ducklings from broods of 23 and 11 radio-marked King Eiders
during 2000 and 2001. Total brood loss accounted for 84% of all duckling mortality
with most brood loss (77%) less than 2 days after hatch. Estimated apparent survival
rates of ducklings to 22 days of age were 0.10 for those that remained with radio-
marked females, 0.16 for all ducklings, including those that had joined other broods,
and 0.31 for broods. Ducklings brooded by larger females experienced higher survival
than those brooded by smaller females, and ducklings that hatched earlier in the
breeding season survived at higher rates. Overland brood movements of 1 km or more
occurred in both years, and survival was greatest for ducklings that dispersed from
Karrak Lake to smaller ponds than on Karrak Lake itself, the central nesting area.
Estimates of duckling survival, combined with relative contributions to the population
by adults, suggest that ecological factors such as body size can influence population
growth. Furthermore, low duckling survival and delayed maturity, emphasize the need
of high adult survival for population growth to occur. These data, in combination with
evidence of dispersal among wintering areas have helped contribute to a broader
understanding of North American King Eider demographics.
iv

ACKNOWLEDGMENTS
There are many people that contributed significantly toward the completion of this
thesis. I would like to thank my advisor, Dr. Ray Alisauskas, for giving me this
opportunity. I am sincerely grateful for the guidance, encouragement, and support that
he gave throughout and for allowing me to use a longer-term data set on King Eider
captures from Karrak Lake Research Station, Nunavut. I thank my committee members
Drs. Gary Bortolotti, Bob Clark, and Yves Plante for their helpful comments and insight.
Special thanks to Mark Gloutney for allowing me the opportunity to begin a new career
while finishing my thesis and, to my advisor and committee members for supporting me
during this process.
The following agencies provided financial support for the research: Nunavut
Wildlife Management Board, Polar Continental Shelf Project, Canadian Wildlife
Service, Institute for Wetlands and Waterfowl Research (Ducks Unlimited), Delta
Waterfowl Foundation, University of Saskatchewan, and Arctic Institute of North
America. The Canadian Wildlife Service, University of Saskatchewan, and Ducks
Unlimited also supplied logistical support. I would like to thank Kevin Dufour for his
endless assistance and the many other people at the Canadian Wildlife Service for
thoughtful discussions and generosity with their time.
Clearly, this research would not have been possible without the help and dedication
of many researchers and field assistants at the Karrak Lake Research Station. There are
more names than the allowed space but I am grateful to each and cherish the laughter,
friendship, and memories that they gave. I give special thanks to Cindy Swoboda for the
long hours marking ducklings and to Credence Wood for going that extra mile and
filling in to help with transmitter application.
I am grateful to my family for believing in me and to Lea Craig-Moore for helping
me stand upright when I didn’t know if I had the strength to do so on my own. Lastly, I
thank Robert de Carle for his enduring support and humor.
v

TABLE OF CONTENTS
PERMISSION TO USE................................................................................................. I ABSTRACT................................................................................................................... II ACKNOWLEDGMENTS ............................................................................................ V TABLE OF CONTENTS.............................................................................................VI LIST OF TABLES .......................................................................................................IX LIST OF FIGURES ..................................................................................................XIV 1. GENERAL INTRODUCTION................................................................................. 1
1.1 POPULATION DYNAMICS AND THE INFLUENCE OF LIFE HISTORY ATTRIBUTES........................................................................................................ 1
1.2 STUDY SPECIES ................................................................................................ 3 1.3 STUDY OBJECTIVES ....................................................................................... 5
2. TO WINTER EAST OR WEST? HETEROGENEITY IN WINTER PHILOPATRY IN A CENTRAL ARCTIC KING EIDER POPULATION............ 7
2. 1 INTRODUCTION............................................................................................... 7 2.2 METHODS........................................................................................................... 8
2.2.1 Feather Collection and Isotopic Analysis..................................................... 8 2.3 STATISTICAL ANALYSES............................................................................. 10 2.4 RESULTS........................................................................................................... 12
2.4.1 Delineation of Breeding Population by Winter Area ................................. 12 2.4.2 Winter Philopatry........................................................................................ 13 2.4.3 Affects of Winter Area on Breeding Performance ..................................... 16
2.5 DISCUSSION..................................................................................................... 16 2.6 CONCLUSION .................................................................................................. 24
3. LOCAL KING EIDER SURVIVAL AND POPULATION GROWTH: POTENTIAL INFLUENCE OF BODY SIZE........................................................... 25
3.1 INTRODUCTION.............................................................................................. 25 3.2 METHODS......................................................................................................... 26
3.2.1 Study Area and Data Set............................................................................. 26 3.3 STATISTICAL ANALYSES............................................................................. 27
3.3.1 Model Selection.......................................................................................... 29 3.3.2 Analysis For Trap Dependent Behavior ..................................................... 31
3.4 RESULTS........................................................................................................... 31 3.4.1 Captures and Body Size.............................................................................. 31 3.4.2 Apparent Survival, Capture Probability and Seniority............................... 34
3.5 DISCUSSION..................................................................................................... 37 3.6 CONCLUSION .................................................................................................. 39
4. KING EIDER NEST SUCCESS AND BREEDING CONDITION: RELATIONSHIPS BETWEEN FUTURE SURVIVAL AND BREEDING .......... 41
4.1 INTRODUCTION.............................................................................................. 41 4.2 METHODS......................................................................................................... 43
vi

4.2.1 Study Area and Captures ............................................................................ 43 4.3 STATISTICAL ANALYSES............................................................................. 43
4.3.1 Body Condition........................................................................................... 43 4.3.2 Patterns in and Costs to Nest Success and Condition................................. 44 4.3.3 Model Selection.......................................................................................... 44 4.3.4 Model Assumptions .................................................................................... 45 4.3.5 Annual trends in nest success and condition .............................................. 48
4.4 RESULTS........................................................................................................... 49 4.4.1 Nest success and condition ......................................................................... 49
4.5 DISCUSSION..................................................................................................... 52 5. KING EIDER BROOD ECOLOGY: INFLUENCE OF ABIOTIC AND BIOTIC FACTORS..................................................................................................................... 57
5.1 INTRODUCTION.............................................................................................. 57 5.2 STUDY AREA................................................................................................... 58 5.3 METHODS......................................................................................................... 59
5.3.1 Nest Search and Trapping........................................................................... 59 5.4 STATISTICAL ANALYSES............................................................................. 60
5.4.1 Covariates for Survival Analyses ............................................................... 60 5.4.2 Modeling Apparent Survival ...................................................................... 61 5.4.3 Survival and Movements Among Habitats................................................. 63
5.5 RESULTS........................................................................................................... 64 5.5.1 Marked Individuals and Brood Size ........................................................... 64 5.5.2 Covariates of Duckling Survival ................................................................ 66 5.5.3 Variation in Apparent Survival of Ducklings and Broods ......................... 66 5.5.4 Dispersal and Duckling Survival ................................................................ 75
5.6 DISCUSSION..................................................................................................... 77 5.7 CONCLUSION .................................................................................................. 81
6. SYNTHESIS ............................................................................................................. 82 7. LITERATURE CITED............................................................................................ 88 APPENDIX A. INFLUENCE OF SUBCUTANEOUS MOUNT TRANSMITTERS AND USE OF PROPOFOL ON NEST SUCCESS OF BREEDING FEMALE KING EIDERS ........................................................................................................... 105
A.1 INTRODUCTION........................................................................................... 105 A.2 METHODS...................................................................................................... 106
A.2.1 Captures ................................................................................................... 106 A.3 STATISTICAL ANALYSIS ........................................................................... 107 A.4 RESULTS........................................................................................................ 110 A.5 DISCUSSION.................................................................................................. 114 B.1 INTRODUCTION ........................................................................................... 117 B.2 METHODS ...................................................................................................... 119 B.3 STATISTICAL ANALYSES .......................................................................... 121 B.4 RESULTS ........................................................................................................ 122
vii

B.5 DISCUSSION.................................................................................................. 126 APPENDIX D. BODY SIZE: PARENT OFFSPRING ESTIMATES OF HERITABILITY........................................................................................................ 131
B.1 RATIONAL AND METHODS ....................................................................... 131 B.1 ESTIMATES OF HERITABILITY................................................................. 131
viii

LIST OF TABLES Table 2.1 Based on 20 female King Eiders analyzed in both 2001 and 2002, six
were classified as wintering in different areas among years. Differing degrees of classification probability among individuals and between years yielded variable confidence but at least four eiders appeared to have a high likelihood of switching wintering areas between years. Classification was based on quadratic discriminant function analysis of stable-isotope ratios for female eiders nesting at Karrak Lake, Nunavut, Canada. Classification probability of switching among wintering areas was defined as the product of annual winter classification probabilities.................................................................15
Table 2.2 Akaike’s Information Criterion (AICc) values for all candidate models explaining condition of incubating female King Eiders. Models are based on ANOVA with female condition as the dependent variable and winter location (determined from stable-isotope analysis) and year as independent variables. Values are based on 163 females nesting at Karrak and Adventure Lakes, Nunavut, Canada during 2001 and 2002. AICc weight reflects the relative support of each model given the model set, and sums to one. .................................17
Table 2.3 Akaike’s Information Criterian (AICc) values for all candidate models explaining nest initiation dates for King Eiders. Models are based on ANOVA with nest initiation date as the dependent variable and winter location (determined from stable-isotope analysis) and year as independent variables. Values are based on 165 females nesting at Karrak and Adventure Lakes, Nunavut, Canada during 2001 and 2002. AICc weight represents the relative support of each model given the model set, and sums to one.....................18
Table 2.4 Akaike’s Information Criterion (AICc) values for all candidate models explaining King Eider clutch size, including all clutch sizes. Models are based on analysis of covariance with clutch size as the dependent variable adjusted for nest initiation date, winter-site location (determined from stable-isotope analysis), and year. Values are based on 165 clutches for females nesting at Karrak and Adventure Lakes, Nunavut, Canada, during 2001 and 2002. AICc weight represents relative support of each model given the model set, and sums to one. ................................................................................................19
Table 2.5 Akaike’s Information Criterion (AICc) values adjusted for small sample size for all candidate models explaining King Eider clutch size, including only clutch sizes with <7 eggs (i.e., nests in which brood parasitism was unlikely). Models are based on analysis of covariance with clutch size as the dependent variable adjusted for nest initiation date, winter-site location (determined from stable-isotope analysis), and year. Values are based on 143 clutches for females nesting at Karrak and Adventure Lakes, Nunavut,
ix

Canada, during 2001 and 2002. AICc weight represents relative support of each model given the model set, and sums to one. ..................................................20
Table 3.1 Candidate models used to investigate the influence of body size (BS) on apparent survival (φ), and recapture probability (p) of 264 breeding King Eider females at Karrak Lake, Nunavut, from 1996 - 2002. Parameter estimates included full time effects, where time varied annually (t), linear trend with time (T), and no time variation (.). Covariates included linear effects of body size (BS), body size as pseudothreshold relationship (BSln), and as quadratric relationship (BSTT) with the estimated parameters. Models are ranked in accordance to QAICc values and are denoted as additive (+) or interaction (*) models. .............................................................................................30
Table 3.2 Candidate models used to investigate the influence of body size (BS) on apparent survival (φ), recapture probability (p), and seniority (γ) of breeding King Eider females at Karrak Lake, Nunavut from 1996- 2002. Parameter estimates included full time effects, where time varied annually (t), linear trend with time (T), and no time variation (.). Body size was considered to affect parameters linearly (BS), in a pseudothreshold relationship (BSln) and in a quadratric relationship (BSTT). Models are ranked in accordance to QAICc values and are denoted as additive (+) or interaction (*) models. .............................................................................................32
Table 3.3 Number of King Eider nests found and number of adult female King Eiders and ducklings (both sexes) banded during 1995 to 2002 on islands within Karrak Lake and Adventure Lake, Nunavut.................................................33
Table 4.1 Top 10 of 26 candidate models used to investigate nest success terms of apparent survival (φ), recapture probability (p), and transition probability (ψ) for female King Eider that nested successfully or failed in their breeding attempts at Karrak Lake, Nunavut, from 1996 - 2002. Models included group affects where parameters varied with nest success (g) or held constant (.), and time effects, where time varied annually (t), linear trend with time (T), or with no time variation (.). Covariates included annual median nest initiation date. Models are ranked in accordance to QAICc values and are denoted as additive (+) or interaction (*) models. .....................................................................46
Table 4.2 Top 17 of 34 candidate models used to investigate effects of female body condition on apparent survival (φ), recapture probability (p), and transition probability for female King Eider that nested successfully or failed in their breeding attempts at Karrak Lake, Nunavut, from 1996 - 2002. Models included group effects where parameters varied among females in good and poor condition (g) or remained constant (.), and time effects, where time varied annually (t), linear trend with time (T), or with no time variation (.). Covariates included annual median nest initiation date. Models are
x

ranked in accordance to QAICc values and are denoted as additive (+) or interaction (*) models. .............................................................................................47
Table 5.1 Top 14 of 40 candidate models used to investigate covariates to apparent survival (φ) and resighting probability (p) of King Eider ducklings at Karrak Lake, Nunavut in 2000 and 2001. Models are based on observations of marked ducklings brooded by radio-females. Parameter estimates included year and age effects, where time varied annually and with age (yr,t), linearly with age (T), in a pseudothreshold relationship with age (Tln), and no time or year variation (.). Model covariates included: hatch date (hd), brood size (bs), duckling body size (ds), duckling condition (dc), female size (fs) and female condition (fc), distance moved from the nest during the first week (dist), and principal components of weather during the first week after hatch (w1, w2). Hatch date, distance moved, brood size, and female and duckling size were also entered as a pseudothreshold relationship (Xln), and hatch date and brood size in a quadratic relationship (XTT). Models are ranked in accordance QAICc values and are denoted as additive models (+) or models with interaction (*). ...........................................................................67
Table 5.2 Top 14 of 24 candidate models used to investigate covariates to apparent survival (φ) and resighting probability (p) of King Eider ducklings at Karrak Lake, Nunavut in 2000 and 2001. Models are based on observations of individually marked ducklings that remained with radio-marked females and marked ducklings that mixed with non-radio-marked broods. Parameter estimates included year and age effects, where time varied annually and with age (yr,t), linearly with age (T), in a pseudothreshold relationship with age (Tln), and no time or year variation (.). Model covariates included: hatch date (hd), duckling body size (ds), duckling condition (dc), and principal components of weather during the first week after hatch (w1, w2). Hatch date and duckling size were also entered as a pseudothreshold relationship (Xln), and hatch date in a quadradic relationship (XTT). Models are ranked in accordance QAICc values and are denoted as additive models (+) or models with interaction (*). ................................................68
Table 5.3 Top 14 of 30 candidate models used to investigate brood-level apparent survival (φ) and resighting probability (p) of King Eiders at Karrak Lake, Nunavut in 2000 and 2001. Models are based on observations of marked broods with radio-marked females. Parameter estimates included year and age effects, where time varied annually and with age (yr,t), linearly with age (T), in a pseudothreshold relationship with age (Tln), and no time or year variation (.). Model covariates included: hatch date (hd), brood size (bs), female size (fs) and female condition (fc), distance moved from the nest during the first week (dist), and principal components of weather during the first week after hatch (w1, w2). Hatch date, distance moved, brood size, and
xi

female size were also entered as a pseudothreshold relationship (Xln), and hatch date and brood size in a quadradic relationship (XTT). Models are ranked in accordance QAICc values and are denoted as additive models (+) or models with interaction (*)..................................................................................69
Table 5.4 Top 9 of 17 candidate models used to investigate apparent survival (φ), resighting probability (p), and movement (Ψ) of marked King Eider broods that moved from Karrak Lake, the primary brood area, to other lakes, ponds, or rivers away from Karrak Lake. Models are based on observations of marked broods resighted with radio-marked females at Karrak Lake, Nunavut in 2000 and 2001. Parameter estimates included year and full time effects where time varied annually and with duckling age (yr,t), linearly with time (T), in a pseudothreshold relationship with time (Tln) and no time or year variation (.). φ and p were estimated for ducklings observed on Karrak Lake (K) or on other habitats (O) and movement of ducklings from Karrak to other habitats (K-O) or movements back to Karrk Lake (O-K). Models are ranked in accordance QAICc values and are denoted as additive models (+) or models with interaction (*)..................................................................................70
Table 5.5 Mean number of days after hatch or nest failure that radio-marked female King Eiders at Karrak Lake, Nunavut, were resighted during 2000-2001..........................................................................................................................78
Table A.1 Candidate models used to investigate influence of subcutaneous anchor-mount transmitters and use of propofol at Karrak and Adventure Lakes, Nunavut, 2001. Nest success was modelled for female King Eiders (1) fitted with subcutaneous anchor-mount transmitters and sedated with propofol (transmitter group), (2) sedated with propofol without transmitter attachment (control group), and (3) females captured, banded and released without transmitter attachment or use of propofol (release group). Parameters were modelled as time constant using the following covariates: relative nest initiation date (initiation), clutch size, female body size, female condition (cond), incubation stage at capture (inc), handling time from capture to time of release (handling), and if the individual was a recapture from previous years (recap). Models are ranked in accordance AICc values and are denoted as additive models (+) or models with interaction (*). ..........................................108
Table A.2 Top 15 candidate models used to investigate the combined effects of subcutaneous anchor-mount transmitters and propofol on annual nesting success of female King Eiders captured and banded at Karrak and Adventure Lakes, Nunavut, during 2000 and 2001. Nest success was modelled for females marked with transmitters and sedated with propofol (group T) and for females banded and released without transmitter attachment or use of propofol (group R). All parameter estimates were modeled as time constant within a season. Nest success was allowed to vary among years (00, 01) and
xii

held constant (00-01). Models considered the following as covariates to nest success: relative nest initiation date, clutch size, female body size, female condition, incubation stage at capture, and if the individual was a recapture from previous years (recapture). Models are ranked in accordance to AICc values and are denoted as additive models (+) or models with interaction (*). ....109
Table A.3 Sample size (n) and nest fate (successful or failed attempt) for nesting female King Eiders marked with (1) subcutaneous anchor-mount transmitters and sedated with propofol, (2) propofol controls, females sedated with propofol but not marked with transmitters, and (3) nesting females banded and released without transmitter attachment or use of propofol. Eggs of transmitter marked and propofol controls were replaced with color- dyed chicken eggs at time of female capture and eider eggs artificially incubated at camp. Release birds were allowed to incubate and naturally hatch their respective clutches. ................................................................................................111
Table B.1 Mean isotoptic values of δ15N and δ13C of feathers collected from hunter-killed King Eiders that were shot near the coast of Greenland (east) and Holman Island, Nunavut (west). .....................................................................124
Table B.2 Classification success (%) of quadratic discriminate function analysis for isotopic values of δ13C δ15N from King Eider feathers of eastern and western populations. Feather tract(s) are listed in order of classification success for eastern populations. Bias represents % Successwest - % Successeast where bias represents favor toward the western population. .................................125
xiii

LIST OF FIGURES Figure 1.1. Conceptual life-cycle for King Eiders, where S = probability of
survival and a = age at first breeding. In situ recruitment equals the product of all components of the life cycle. ............................................................................2
Figure 2.1 Study area of Karrak Lake and Adventure Lakes, Nunavut, Canada, where incubating female King Eider feathers were collected for stable isotope analysis during 2001 and 2002. King Eiders wintered in either the northern Pacific (Chukchi or Bering Sea) or northern Atlantic, including the Labrador Sea. .............................................................................................................9
Figure 2.2 Proportional occurrence of classification probabilities for adult female King Eiders breeding at Karrak and Adventure Lakes, Nunavut, Canada, and wintering in the eastern (a) and western seas (b) during 2001 and 2002. Classification probabilities were based on predictive equations derived from Mehl et al. (2004) and reflect the probability that an individual King Eider wintered in that region. ............................................................................................14
Figure 2.3 ANCOVA estimates of mean clutch size (95% CI) scaled to midpoints of the early (14 June), middle (20 June), and late (27 June) incubation periods for female King Eiders that nested at Karrak and Adventure Lakes during 2001 and 2002 and were predicted to have wintered within western (Pacific) or eastern (Atlantic) seas during the winter preceding that breeding season. Estimates are for nests of all clutch sizes, including those where (a, b) more than one female likely contributed to the overall clutch size and (c, d) for only those clutches with <7 eggs. ..................................................................21
Figure 3.1 Age of first capture relative to body size and hatch year for female King Eiders of known breeding age. Females were marked as ducklings and later recaptured as breeding adults at Karrak Lake, Nunavut 1997-2003................35
Figure 3.2 Predicted influence of body size on apparent survival (a), recapture probability (b), and seniority (c) of female King Eiders returning to breed at Karrak and Adventure Lakes, Nunavut. Values shown have been backtransformed from the logit function. Slope estimates are based on weighted model averaged estimates are as follows: 1)φ : =
lnˆ
femalesizeβ 0.09 (95%CI= -0.17 to 0.36); 2) p : =
lnfemalesizeβ 0.21 (95%CI=0.01 to 0.42), and 3) γ : =
TTfemalesizeβ 0.14 (95%CI =-0.05 to 0.32) + 0.14 (95%CI =-0.03 to 0.30). ........................................................................................................................36
Figure 4.1 Estimated number (± 95% CI) of King Eider resident females to have successful breeding attempts at Karrak Lake, Nunavut during 1995 – 2002, relative to those that failed or did not breed (a), proportion of the population estimated to be successful (b), and relative to Mayfield nest success estimates for the same population during this period (c). Nest success
xiv

estimates are from Kellett et al. (2003; 1995-2001) and Alisauskas, unpubl. data (2002). ..............................................................................................................50
Figure 4.2 Estimated number (± 95% CI) of nesting King Eider resident females to have been in relative good or poor body condition at Karrak Lake, Nunavut during 1995 – 2002 (a) and the annual variability in the proportion of the population estimated to be in good condition (b). .........................................51
Figure 4.3 Probability (± 95% CI) that successful and failed nesters at Karrak Lake, Nunavut during 1995 – 2002, were able to nest successfully during the subsequent year. As long as the probability of remaining a successful breeder is ≥ probability of moving from failed to successful breeding status, there are assumed to be no costs in terms of future reproductive efforts incurred (Nichols and Kendall 1994). ....................................................................................53
Figure 5.1 Frequency distribution of relative hatch dates of King Eider broods marked on Karrak and Adventure Lakes, Nunavut during 2000 (solid bars) and 2001 (open bars). Hatch dates are relative to the median hatch date for a given year. ................................................................................................................65
Figure 5.2 Estimates of apparent survival and 95% CI for King Eider duckling and broods marked on Karrak Lake and Adventure Lakes, Nunavut, during July and August, 2000 and 2001. Values were calculated using the logit-link function and are the weighted averages based on candidate models. Averages were weighted according to QAICc values. Open circles = brood survival, closed triangles = survival of marked ducklings, including those associated with non-natal females, and open squares = duckling survival for ducklings that remained with radio-marked females................................................................72
Figure 5.3 Age dependent resighting probability and 95% CI based on weighted model averages for ducklings that were marked on Karrak and Adventure Lakes, Nunavut during summers of 2000 (solid circles) and 2001 (open circles), and resighted with radio-marked females. .................................................73
Figure 5.4 Influence of female size and hatch date on duckling apparent survival as predicted by models for ducklings that remained with radio-marked females for the first 24 days after hatch at Karrak Lake, Nunavut during 2001 and 2002. The relationship is based on weighted model averages and expresses the interaction between female size and hatch date, additive among age categories. Data are backtransformed from a logit scale (
lnˆ
femalesizeβ = 0.54 [95%CI = 0.19 to 90], ln
ˆhatchdate
β = -0.33 [95%CI = -0.65 to
0.00], lnln *
ˆhatchdatefemalesize
β = -0.48 [95%CI = -0.03 to –0.92])....................................74
Figure 5.5 Estimated number of individually marked King Eider ducklings surviving by age for broods that remained at Karrak Lake, Nunavut (solid
xv

circles) and those that moved to smaller freshwater ponds and other nearby habitats (open circles) during 2000-2001. ...............................................................76
Figure A.1 Frequency of captures, according to the number of days until ducklings hatched from the nest, of transmitter-marked females captured at Karrak and Adventure Lakes, Nunavut during the summers of 2000 and 2001........................................................................................................................112
Figure B.1 Spatial distribution of summer δ15N values estimated for copepods from marine waters of northern North America (Hobson and Welch 1992, Schell et al. 1998, Hobson et al. 2001, Hobson et al. 2002a,b). Values for the Chukchi and Bering Seas are means for samples collected off the coast of Alaska and Russia (Shell et al. 1998). Isotope value given for the north coast of Newfoundland is from northern shrimp (Pandalus borealis; Lawson and Hobson 2000) corrected for trophic level (-3.4‰; Fry 1988, Hobson and Welch 1992), and the mid-Atlantic isotopic value is for copepods collected on the Georges Bank (Fry 1988). Also shown are locations (open circles) where king eiders were shot near Holman, NWT, and southwestern Greenland. Arrows indicate likely and known migration routes of king eiders. Isotope values for δ13C are not shown, as these values contributed only 4% more precision in delineating between eastern and western wintering eiders......................................................................................................120
Figure B.2 Isotopic values from head, back, chest, and primary wing feathers of hunter- killed king eiders that wintered in eastern (n=49) or western seas (n=94) of northern North America. Open circles are values from western populations, closed circles are values from eastern populations. ..........................123
Figure D.1 Relationship between body size of known age breeding adults and body size of maternal females. Body sizes are derived from principal components analysis based on the correlation matrix of mean metric measurements of each individual. ..........................................................................132
xvi
1. GENERAL INTRODUCTION
1.1 POPULATION DYNAMICS AND THE INFLUENCE OF LIFE HISTORY
ATTRIBUTES
The aim of population ecology is to understand which factors are most influential to life
history traits (i.e., birth, death, dispersal, and migration) and how these factors affect
changes in population size over time and space. Knowledge about ecological processes
that affect population size is essential to ultimately understand why populations change
through time. Research from this thesis was motivated by the desire to gain a greater
understanding of such factors that might influence population change in King Eiders, a
sea duck that occupies the northern extreme of the waterfowl continuum. Understanding
life history traits for species that experience different selection pressures help to provide
the ecological framework to better understand how various life histories have evolved.
Inferences about population ecology are influenced by the spatial scale of study.
Changes in population size are primarily determined by birth and death (meta-
population level), or they can be defined by smaller subunits (local or sub-populations)
where immigration and emigration directly affect local population size (Endler 1977,
Slatkin 1987, Berryman 2002). Therefore, a convenient metric (λ) for characterizing
temporal change in spatially-defined populations is the number of individuals in the
population (N) from one year (i) to the next (i+1), as expressed by λ = Ni+1/Ni. Such
changes in population size, Nt+i = λi,Ni, result from the sum of population additions,
through births (Bi) and immigration (Ii), minus the number of losses through death (Di)
and emigration (Ei). The number of births and deaths from one year (i) to the next (i+1)
depend on the number of individuals (Ni) alive in the population at time i. Consequently,
these processes are most often expressed as per capita change in numbers; Bi = (bi)(Ni),
Di = (di)(Ni), Ei = (ei)(Ni), and Ii = (gi)(Ni) where bi, di, ei, and gi equal the change in
numbers between time i and i+1, resulting from birth, death, emigration and immigration
rates,
1

respectively (Williams et al. 2002). Accordingly, the annual rate of population change,
λi,, equals the sum of the four per capita rates, bi + di + ei + gi.
If research attention is focused on a single subpopulation without knowledge about
other subpopulations, as in this study, then permanent emigration from the focal
subpopulation is confounded with death rate (Nichols 1992), and birth rates confounded
with immigration (Nichols et al. 2000). Sampling marked individuals through time
allows for unbiased estimates of individual vital rates and their contributions to λ
because this approach also simultaneously estimates detection probability (p), or the
probability that an individual is observed on a study area given that it is present (Nichols
1992, Nichols et al. 2000). Unless all individuals are observed (pi = 1), estimation of p is
necessary to calculate both population size and individual vital rates. For example,
estimation of population size requires a count (C) of the number of individuals in a
given area. However, a complete count of all free-ranging individuals present is seldom
possible because some individuals are inevitably present but undetected, i.e., pi < 1. If
detection probabilities remained constant through time, counts could serve as an index to
population size. However, pi generally varies with environmental conditions, animal
behavior, and among observers (Nichols 1992, MacKenzie and Kendall 2002).
Therefore, unbiased estimates of population size (N) must account for changes in both,
C and p, as expressed by: N = C / p.
Estimates of true survival require the recovery of marked dead individuals (Seber
1970, Brownie et al. 1985) because without these recoveries, mortality is confounded
with permanent emigration. When marked recoveries are not possible, apparent survival,
φi, can be estimated in lieu of true survival, where φi is the product of the probability that
an individual survives (S) and the complement of permanent emigration, or philopatry
(F) to the study area (Cormack, 1964, Jolly1965, Lebreton et al. 1992). Fundamentally,
without marked individuals that are re-encountered through time, estimates of p remain
unknown and all estimates of vital rates will likely be biased. When based on mark-
recapture data, ecologically-based variation in vital rates can be estimated, leading to
knowledge of processes relevant to population change. These changes can affect any
portion of the life-cycle (Figure 1.1).
1

Adult Hatch Fledge Nest Clutch
Size
Breeding probability Seggs Sduckling
Sub-Adult
Sjuvenile
Ssub-adult(a-1)
Sadult
Figure 1.1. Conceptual life-cycle for King Eiders, where S = probability of survival and a = age at first breeding. In situ recruitment equals the product of all components of the life cycle.
2

In long-lived species, adult survival has the greatest impact on population size because
adult survival ultimately determines how often individuals will breed over a lifetime
(Rockwell et al. 1997, Nichols et al. 2000, Crone 2001). However, recruitment is more
variable than adult survival, especially in long-lived species, and can often have the
greatest influence on fluctuations in population size (Coulson 1984, Gaillard et al. 1998,
Cooch et al. 2001). Differential variation in contributions of adult survival and
recruitment to population growth are consistent with Fisher’s fundamental theorem,
which states that an increase in fitness (i.e., greater contribution to population growth) is
equal to the genetic variance (as demonstrated by greater fluctuations) of fitness at that
time (Falconer and Mackay 1989).
Current information about factors that influence survival, recruitment and resulting
population dynamics of ducks are primarily from relatively short-lived and readily
hunted species such as Northern Pintails Anas acuta (Flint et al. 1998), Mallards Anas
platyrhynchos (Dufour and Clark 2002, Hoekman et al. 2002), and Canvasbacks Athya
valisineria (Anderson et al. 1997, Anderson et al. 2001). Far less is known about
estimates of such population parameters in sea ducks (tribe Mergini), a group
characterized by higher adult survival and delayed maturity. Discrepancies in
information available for these groups of species are due to (1) use of habitats by prairie-
nesting waterfowl that are relatively easily accessed by researchers, (2) early breeding at
one to two years of age that offers a continuous opportunity to collect data from pre-
fledgling to adult stage, and (3) reliable band returns from hunter-killed birds that allow
for the estimation of true survival (Barker 1997).
1.2 STUDY SPECIES
King Eiders (Somateria spectabilis) breed across the arctic region of North America
and winter in northern waters of the western and eastern regions of the continent.
Unlike most avian species, King Eiders remain at polar latitudes throughout the annual
cycle (Bellrose 1976) where they rely heavily on stored nutrients during both the non-
breeding (Frimer 1994) and breeding periods (Kellett and Alisauskas 2000). King
Eiders exhibit seasonal monogamy (Suydam 2000), with pairs forming before spring
migration occurs (Parmelee 1967).
3

Theoretically, larger individuals should show advantages in thermoregulation,
proportionally greater storage of fat reserves, and greater fasting endurance relative to
smaller conspecifics (Kendeigh 1969, Kendeigh 1970, Fretwell 1972, Calder 1974).
Thus, King Eiders represent an appropriate species for studying the interplay between
nutrition, body size, survival and recruitment because they are near the extremes of the
waterfowl continuum in severity of climate and reliance on nutrient reserves. In
addition, King Eiders have high adult survival and do not breed until they are at least 3
years old (this study). Harsh polar environments may create a threshold, where only
older females with ample nutrient reserves are able to breed (Kellett and Alisauskas
2000). King Eiders have a relatively small clutch size (x = 5.4; Kellett and Alisauskas
1997) and arctic environments produce boom and bust years for reproduction (Coulson
1984; Gaillard et al. 1998). Therefore, recruitment is likely to rely heavily on high
adult survivorship to produce enough young over a lifetime for population growth to
occur (see Crone 2001).
King Eiders that breed in North America are thought to be from two separate
populations, defined by their use of discrete wintering areas (Atlantic and Pacific;
Suydam 2000). However, recent analyses of King Eider population genetics show no
phylogeographic structure, suggesting that regular gene flow occurs among these
populations (Pearce et al 2004). The extent and timing of population mixing are
unknown. Because population estimates are based on count surveys at key migration
corridors (Suydam et al. 1997), if individuals are not philopatric to wintering areas and
the respective migration corridors, this would likely bias population estimates and
population trends. Importantly, King Eider populations appear to have declined
(Suydam et al. 1997) despite high probability of annual survival among adults (~0.87,
this study) and high nest success (50%; Moitoret et al. in Suydam 2000, 48.5%; Kellett
et al. 2003). Juvenile survival may, therefore, be a limiting factor to population growth
(Coulson 1984), emphasizing the potential importance of the brood-rearing period to
population dynamics.
I set out to estimate and test ecological predictions about population dynamics,
recruitment and survival in a local population of King Eiders nesting at Karrak Lake,
Nunavut, in Canada’s central arctic. I was particularly interested in the relative
4

contributions of survival and recruitment probabilities on local population dynamics,
and on ecological factors that influence those probabilities or their components, i.e.,
duckling survival.
1.3 STUDY OBJECTIVES
To define the local King Eider population of study, in reference to the North American
King Eider population(s) (Suydam 2000), and to investigate the extent of movement
among wintering areas, I combined capture-mark-recapture techniques with analysis of
naturally occurring stable isotopes (δ13C, δ15N). Isotope analysis allowed me to delineate
the local population by wintering area (western or eastern seas)
In this thesis, I also address the influence of recruitment toward dynamics of this
local population of King Eiders. Recent techniques of reverse-time capture models
(Pradel 1996, Nichols et al. 2000) offer opportunities to estimate and assess relative
contributions of survival and recruitment to changes in population size. I used a long-
term data set to model vital rates that contributed to King Eider population growth. I
also consider some aspects of variation in annual survival of breeding King Eider
females. Specifically, I estimated the relationship between body size and survival
probability. However, most of my research was focused on the influence of ecological
variables on specific components of recruitment, with special attention to sources of
variation in adult and duckling survival. Many aspects of annual variation in nesting
success have been addressed elsewhere (Kellett and Alisauskas 1997, 2000, Kellett et al.
2002), but I used a novel approach for comparing breeding success through use of
multistate analysis. I also estimated the survival of ducklings before fledging using
radio-telemetry, and examined ecological sources of variation in such survival
probabilities.
The specific objectives of this study were:
1. Delineate eastern and western populations of King Eiders using naturally occurring
δ15N and δ13C isotope ratios.
2. Estimate repeatability and heritability of external morphology in King Eider females.
3. Estimate female survival and recruitment into the breeding population, in relation to
body size.
5

4. Investigate reproductive patterns of breeding females to determine if the probability
of successful nesting affects the breeding success during the following year.
5. Investigate patterns of female condition during multiple years.
6. Investigate factors that may influence duckling and brood survival.
6

2. TO WINTER EAST OR WEST? HETEROGENEITY IN WINTER
PHILOPATRY IN A CENTRAL ARCTIC KING EIDER POPULATION
2. 1 INTRODUCTION
Extent of dispersal defines the spatial boundaries of a population (Berryman 2002).
Therefore, estimates of philopatry, or the probability that individuals use the same area
in sequential years, are necessary to understand population boundaries. When pairs form
on breeding areas alone, the amount of emigration influences estimates of breeding
philopatry. However, pair formation by waterfowl occurs on wintering areas (Rohwer
and Anderson 1988), so philopatry to both breeding and wintering areas can influence
mixing between areas (Cooke et al. 1975, Rockwell and Barrowclough 1987, Cooke et
al. 2000). Shifts in areas used by birds can have profound effects on interpretations
about population trends and overall demography because changes in area use could be
misinterpreted as changes in population size if inferences are drawn from unmarked
birds (Mosbech and Boertmann 1999, Suydam et al. 2000).
Linkage between breeding and wintering areas is also important for understanding
population dynamics because weather and habitat conditions encountered by birds
during the winter can cause severe mortality (Fournier and Hines 1994, Dierschke 1998)
or influence subsequent breeding success (Alisauskas 2002). Individuals from the same
breeding area often share wintering areas, so entire cohorts could be affected by
ecological factors on either of these areas (Esler 2000). Thus, knowledge of linkages
between wintering and breeding areas will improve understanding of population biology
over a species’ annual cycle (Webster et al. 2002).
King Eider (Somateria spectabilis) populations in North America are presumably
of two distinct groups that winter in either Northern Atlantic or Northern Pacific regions
(Suydam 2000). Lack of genetic differentiation between these eastern and western
populations suggests that these populations may interbreed (Pearce et al. 2004). Band
7

recoveries from hunter-killed birds indicate that individuals from the Pacific and
Atlantic populations share the same breeding grounds within the central Arctic (Bird
Banding Laboratory, Canadian Wildlife Service, Quebec, Canada, unpubl. data).
However, the extent and timing of population mixing remain unknown.
Previous isotopic analyses of zooplankton indicated an east-west gradient in the
incidence of 15N and 13C in the arctic marine environment of North America, with the
Bering and Chukchi Seas more enriched relative to the arctic waters of eastern North
America (Dunton et al. 1989, Schell et al. 1998). Because eiders grow body feathers on
their wintering areas (Suydam 2000), and isotopic ratios within feathers reflect the food
webs where they were grown (Hobson 1999), stable-isotope ratios are useful in
identifying the wintering locations of King Eiders. Naturally occurring stable isotopes
from King Eider head feathers have proven successful in stratifying western and eastern
winter King Eider populations based on known winter origin (99% and 94% correct
classification for western and eastern seas, respectively; Mehl et al. 2004). Head feathers
provided the best discrimination over other feather tracts (Mehl et al. 2004). Here my
objective was to use naturally occurring stable isotope values from head feathers of
individually marked female King Eiders to evaluate extent of winter philopatry.
Secondly, to understand if winter choice of influenced breeding biology, I tested
whether nest initiation date, clutch size, and body condition differed for individuals that
wintered in Pacific compared to Atlantic waters. This study was motivated by apparent
declines in King Eider populations (Suydam et al. 2000) and the need for a better
understanding of linkages between breeding and wintering areas.
2.2 METHODS
2.2.1 Feather Collection and Isotopic Analysis
During 2001 and 2002, I systematically searched for King Eider nests on islands in
Karrak and Adventure Lakes (67º14´N, 100º15´W; Figure 2.1), about 60 km south of
Queen Maud Gulf, Nunavut, Canada. These islands support one of the highest known
densities of breeding King Eiders (Kellett et al. 2003; see Kellett 1999 for detailed
descriptions of the study area). I began nest searches in mid-June and revisited nests
8

Beaufort Sea
UNITED STATES
CANADA
ALASKA
Study Area
GREENLAND
Labrador Sea
Bering Sea Chukchi Sea
Figure 2.1 Study area of Karrak Lake and Adventure Lakes, Nunavut, Canada, where incubating female King Eider feathers were collected for stable isotope analysis during 2001 and 2002. King Eiders wintered in either the northern Pacific (Chukchi or Bering Sea) or northern Atlantic, including the Labrador Sea.
9

every 4 to 7 days to determine clutch size, egg attrition rate, and nest fate. I calculated
nest initiation dates by backdating from known laying dates, or from incubation stages
estimated by candling eggs (Weller 1956), assuming an incubation length of 23 days
(Parmelee et al. 1967) and a laying interval of one egg per day (Lamothe 1973). I
captured nesting female King Eiders during late incubation (≥16 days incubation) using
either mist nets placed over nesting females or with self-triggered bow nets. I marked
females with standard Canadian Wildlife Service–U.S. Fish and Wildlife Service leg
bands and weighed each with a Pesola spring scale to the nearest 10g. I also recorded the
following measurements (twice for each female): head and tarsus length using dial
calipers to the nearest 0.1 mm, and flattened wing chord using a flat ruler (Dzubin and
Cooch 1993). Mean measures were used to obtain indices of size. I also collected 3–10
feathers from the crown, and stored feathers from each bird in separate paper envelopes.
Feathers were rinsed in a 2:1 chloroform:methanol solution and allowed to air dry.
Weighed (1 mg), dry feather samples were then placed into tin cups and each was
combusted in a RoboPrep elemental analyzer interfaced with a Europa 20:20
continuous-flow isotope-ratio mass spectrometer (Europa Scientific, Crewe, UK;
Hobson and Schell 1998). All stable isotope values are reported in δ notation relative to
Pee Dee Belemnite (PDB) and atmospheric air standards for δ13C and δ15N
measurements, respectively. Measurement precision, based on thousands of
measurements of albumen lab standard, is estimated to be ±0.1‰ for δ13C measurements
and ±0.3‰ for δ15N measurements.
2.3 STATISTICAL ANALYSES
I classified individuals as wintering in eastern or western areas using predictive
equations derived from quadratic discriminant function analysis (QDFA) based on
isotope-ratios of eider feathers of known winter origin (Mehl et al. 2004). Using chi-
square analysis, I investigated possible local breeding segregation by testing if observed
nesting locations (islands and lakes) of King Eiders that wintered in eastern and western
seas differed from expected ratios. I grouped individuals by year and assessed the
proportion of individuals that were estimated to have wintered in eastern or western seas
during the preceding winter. I then compared those results with the proportion of
10

individuals that wintered in eastern and western seas, as indicated by band recoveries
(Canadian Wildlife Service Bird Banding Laboratory, unpubl. data), to determine
possible differences in hunting pressure between wintering areas. I calculated 95% CI
for wintering-area classifications based on random binomial variance (Zar 1999). I
assessed the proportion of individuals that returned to the same area during consecutive
winters based on breeding females captured in both 2001 and 2002, and from band
recoveries for birds whose previous year’s wintering area I had inferred from stable-
isotope analysis. Estimates of philopatry were contingent upon classification
probabilities in both 2001 and 2002. When an individual was judged to have switched to
an alternate wintering site during the second year, I calculated a classification
probability for the switch among wintering areas as the product of both annual winter-
area classification probabilities for that individual.
I estimated (1) body condition during incubation, (2) nest initiation date, and (3)
clutch size for females classified as having wintered in eastern compared to western seas
during the preceding winter. I used principal components analysis (PCA) with mean
body measurements to establish an index of female size (Rising and Somers 1989,
Alisauskas and Ankney 1990). I regressed eider weight on the size index (PC1),
incubation stage at capture, and nest initiation date to adjust these parameters (Kellett
and Alisauskas 2000) and then used residuals as an index of body condition
(Weatherhead and Brown 1996). I tested for differences in female condition and nest
initiation date using separate ANOVAs, by comparing models with single effects of year
and wintering area, an additive model with year and area effects, and a global model that
included the year * wintering area interaction. I confirmed that variances associated with
nest initiation dates and body condition were normally distributed, based on the most
saturated model using the Shapiro-Wilk statistic (Zar 1999). I chose the most
parsimonious of four candidate models for each response variable using Akaike’s
Information Criterion corrected for sample size (AICc; Akaike 1985, Burnham and
Anderson 1992). I did not correct for overdispersion as each observation was based on a
separate individual female and therefore not likely affected by overdispersion (Burnham
and Anderson 2002). I estimated mean condition and nest initiation date, along with
associated 95% CI adjusted for year and wintering area, using least-squared means in
11

PROC GLM (SAS Institute 1996).
I compared clutch size between years and wintering area using an analysis of
covariance (ANCOVA), with nest initiation date as a continuous covariate. I tested for
normal distribution of variances associated with clutch size using the most saturated
model with the Shapiro-Wilk statistic (Zar 1999). Log-transformed clutch size resulted
in normally distributed variances and was used for all clutch size analyses. Clutches
with more than six eggs are likely the result of nest parasitism (Anderson 2000), so I
considered two sets of ANCOVA models, each with eight candidate models: one set that
included all clutch sizes and another that included only clutches of less than seven eggs.
Candidate models included interactions of nest initiation date * year, wintering area *
year, and nest initiation date * wintering area. I chose the most parsimonious models
using AICc (Akaike 1985, Burnham and Anderson 1992), and estimated 95% CI of
mean clutch size adjusted for nest initiation date, year, and wintering area during early,
middle, and late nest initiation dates using the ESTIMATE option in PROC GLM (SAS
1996). Estimates of early, middle, and late nest initiation date included only those dates
when individuals that wintered in both areas nested simultaneously. I did not compare
estimates of nest success for birds between wintering areas because capture of
individuals and subsequent acquisition of feather samples was only possible in late
incubation periods, after which most nest failures had already occurred (Kellett et al.
2003).
2.4 RESULTS
2.4.1 Delineation of Breeding Population by Winter Area
I collected feathers from 85 and 82 female King Eiders during 2001and 2002,
respectively. Based on QDFA classification, about 69% (117 of 167; 95% CI = 63–77%)
of these individuals wintered to the west, in Pacific waters, and 31% (51 of 167; 95% CI
= 24–38%) wintered to the east, in Atlantic waters. The estimated proportion of
individuals wintering to the west was slightly higher during 2002 (73%; 60 of 82; 95%
CI = 52–82%), relative to 2001 (66%; 56 of 85; 95% CI = 56–77%). Precision around
the classification estimates was greater during 2002, with 87% (71 of 82) of all
individuals having >90% probability of wintering in the respective eastern or western
12

areas, compared with 71% (60 of 85) of individuals with >90% probabilities during
2001 (Figure 2.2). In contrast, about half (56%, 5 of 9) of hunter-killed King Eiders
(Canadian Wildlife Service Bird Banding Laboratory, unpubl. data) marked at Karrak
Lake were recovered in eastern wintering areas. Wintering area did not appear to
influence local breeding locations, as King Eiders at Karrak Lake nested among islands
(χ225 = 23.0, P = 0.58) and lakes (χ2
1 = 0.9, P = 0.35) independently of wintering area.
2.4.2 Winter Philopatry
Based on stable isotope values from feathers of individuals captured during both 2001
and 2002 (n = 20), I calculated that six females may have switched between eastern and
western wintering areas among years, and that at least four females probably did so
(Table 2.1). Classification probabilities for wintering area varied among years and
individuals (Table 2.1). I collected feather samples from four of eight King Eiders
banded at Karrak Lake that were eventually shot by hunters. Based on classification
results from isotope data, three of these individuals were shot in the same wintering area
as they predicted to have wintered during the previous year. The remaining individual
was classified as wintering in the west during 2001 (91% classification probability) but
was shot near the Greenland coast the following winter. Collectively, these two data sets
indicated that up to 29% (7 of 24; 95% CI = 11–47%) of King Eiders switched among
wintering areas. Only 13% (3 of 24; 95% CI = 0–26%) of females had >80%
classification probability of having switched between western and eastern wintering
areas. I collected feather samples from only one mother-daughter pair and both
individuals were classified as having wintered in the east during the previous winter
(79% and 91% classification probability, respectively).
13

1.0
0.8
0.6
0.4
0.2
0.0
b. 2001 (n = 56)2002 (n = 60)
0.50-0.59 0.60-0.69 0.70-0.79 0.80-0.89 0.90- 1.0
0.8
0.6
0.4
0.2
0.0
2001 (n = 29)
2002 (n =
1.0 a.
Prop
ortio
nal o
ccur
renc
e .
Prop
ortio
nal o
ccur
renc
e .
0.90- 1.0.89.79.69.590.50-0 0.60-0 0.70-0 0.80-0
Classification
Figure 2.2 Proportional occurrence of classification probabilities for adult female King Eiders breeding at Karrak and Adventure Lakes, Nunavut, Canada, and wintering in the eastern (a) and western seas (b) during 2001 and 2002. Classification probabilities were based on predictive equations derived from Mehl et al. (2004) and reflect the probability that an individual King Eider wintered in that region.
14

Table 2.1 Based on 20 female King Eiders analyzed in both 2001 and 2002, six were classified as wintering in different areas among years. Differing degrees of classification probability among individuals and between years yielded variable confidence but at least four eiders appeared to have a high likelihood of switching wintering areas between years. Classification was based on quadratic discriminant function analysis of stable-isotope ratios for female eiders nesting at Karrak Lake, Nunavut, Canada. Classification probability of switching among wintering areas was defined as the product of annual winter classification probabilities. 2001 2002 Classification probability of Individual Classification Winter Classification Winter switching among Probability Location Probability Location winter areas
1 0.93 East 0.95 West 0.88 2 0.88 West 0.94 East 0.83 3 0.78 East 0.87 West 0.68 4 0.66 West 0.89 East 0.59 5 0.56 West 0.73 East 0.41 6 0.76 West 0.51 East 0.39
15

2.4.3 Affects of Winter Area on Breeding Performance
PC1 accounted for 51% of variation in structural size, with loadings of 0.76, 0.52, and
0.43 for head, tarsus, and wing lengths, respectively. Size accounted for half of the
variation in body mass (F3,168 = 76.7, r2 = 0.50, P < 0.01). AICc model weight (0.53)
suggested that female condition varied more between years than between wintering
areas (Table 2.2) but the 95% CI of all four estimates of relative size overlapped (mean
PC1 scores [95% CI]: 2001, western area: –5.1 [–25.2 to 15.1]; eastern area: –8.2 [–36.5
to 20.1]; 2002, western area: 7.8 [95% CI = –11.6 to 27.3]; eastern area: –7.8 [–39.7 to
24.1]).
Nest initiation date varied by both winter location and year (Table 2.3). During
2002, nest initiation date was 3.4 days earlier for females that wintered to the west (95%
CI [Julian dates]: western area: 169.3–171.7; eastern area: 171.9–175.9), with
overlapping confidence intervals during 2001 (western area: 169.3–171. 8; eastern area:
168.8–172.4). When I included all clutches in analyses, models showed support for
clutch-size variation among wintering area, timing of nest initiation, and years (Table
2.4). Clutch size was greater for females that wintered in the west, but these differences
existed only during the early initiation period when nest parasitism (i.e., clutches with
>6 eggs) was more frequent (Figure 2.3). Estimated mean clutch size and associated
95% CI adjusted for nest initiation date during early, middle, and late nest initiation
dates are shown in Figure 2.3. When considering only clutch sizes with <7 eggs, clutch
size models supported similar effects of year, timing of nest initiation, and wintering
area, with support for nest initiation * year and nest initiation date * winter location
(∆AICc < 2; Burnham and Anderson 1992; Table 2.5). Estimated mean clutch sizes and
95% CI for clutches smaller than 7 eggs, adjusted for nest initiation date, are shown in
Figure 2.3 for each of the three nest initiation categories.
2.5 DISCUSSION
Use of stable-isotopic measurements from head feathers of King Eiders offer a useful
method of distinguishing wintering areas (Mehl et al. 2004). When combined with local
banding efforts, this technique provided insight into winter philopatry not otherwise
16

Table 2.2 Akaike’s Information Criterion (AICc) values for all candidate models explaining condition of incubating female King Eiders. Models are based on ANOVA with female condition as the dependent variable and winter location (determined from stable-isotope analysis) and year as independent variables. Values are based on 163 females nesting at Karrak and Adventure Lakes, Nunavut, Canada during 2001 and 2002. AICc weight reflects the relative support of each model given the model set, and sums to one.
No. of AICc
Model RSSa parameters ∆AICcb weight
Year 922143 3 0.00 0.53 Location year 918748 4 1.84 0.21 Location 950778 3 2.19 0.18 Location year location*year 917396 5 3.86 0.08 aRSS = Residual sums of squares from ANOVA. bLowest AICc value was 624.46.
17

Table 2.3 Akaike’s Information Criterian (AICc) values for all candidate models explaining nest initiation dates for King Eiders. Models are based on ANOVA with nest initiation date as the dependent variable and winter location (determined from stable-isotope analysis) and year as independent variables. Values are based on 165 females nesting at Karrak and Adventure Lakes, Nunavut, Canada during 2001 and 2002. AICc weight represents the relative support of each model given the model set, and sums to one.
No. of AICc
Model RSSa parameters ∆AICcb weight
Location 3851 3 0.00 0.45 Location year 3815 4 1.42 0.22 Location year location*year 3719 5 1.73 0.19 Year 3983 3 2.42 0.14 aRSS = Residual sums of squares from ANOVA. bLowest AICc value was 231.90.
18

Table 2.4 Akaike’s Information Criterion (AICc) values for all candidate models explaining King Eider clutch size, including all clutch sizes. Models are based on analysis of covariance with clutch size as the dependent variable adjusted for nest initiation date, winter-site location (determined from stable-isotope analysis), and year. Values are based on 165 clutches for females nesting at Karrak and Adventure Lakes, Nunavut, Canada, during 2001 and 2002. AICc weight represents relative support of each model given the model set, and sums to one.
No. of AICc
Model RSSa parameters ∆AICcb weight
Initiation, location, year, initiation*location, initiation*year 11.6 7 0.00 0.39 Initiation, location, initiation*location 12.2 6 1.65 0.17 Initiation, year, initiation*year 12.2 6 1.65 0.17 Initiation, location, year, initiation*location, initiation*year, location*year 11.6 8 2.20 0.13 Initiation, location 13.4 4 3.25 0.08 Initiation, location, year 13.2 5 5.25 0.03 Initiation, year 13. 8 4 5.96 0.02 Initiation, location, year, location* year 13.2 6 7.33 0.01 aRSS = Residual sums of squares from ANOVA. bLowest AICc value was –175.63.
19
19

Table 2.5 Akaike’s Information Criterion (AICc) values adjusted for small sample size for all candidate models explaining King Eider clutch size, including only clutch sizes with <7 eggs (i.e., nests in which brood parasitism was unlikely). Models are based on analysis of covariance with clutch size as the dependent variable adjusted for nest initiation date, winter-site location (determined from stable-isotope analysis), and year. Values are based on 143 clutches for females nesting at Karrak and Adventure Lakes, Nunavut, Canada, during 2001 and 2002. AICc weight represents relative support of each model given the model set, and sums to one.
No. of AICc MODEL RSSa Parameters ∆AICc weight Initiation, location, year, initiation*year 6.9 6 0.00 0.45 Initiation, location, year, initiation*location, initiation*year 6.9 7 1.35 0.23 Initiation, location 7.9 4 3.35 0.08 Initiation, location, year, initiation*location, initiation*year, location*year 6.8 8 3.49 0.08 Initiation, location, year, initiation*location 7.4 6 3.89 0.06 Initiation, location, year 7.7 5 4.33 0.05 Initiation, location, year, location* year 7.7 6 6.38 0.02 Initiation, year 8.3 4 6.42 0.02 aRSS = Residual sums of squares from ANOVA. bLowest AICc value was –175.27.
20
20

0
2
4
6
8
10
0
2
4
6
8
10
0
2
4
6
8
10
Early Middle Late0
2
4
6
8
10
Early Middle Late
b
c d
a
Eastern (n = 25)Western (n = 50)
Eastern (n = 22)Western (n = 60)
Eastern (n = 20)Western (n = 49)
Eastern (n = 28)
2001
Western (n = 56)
2002
Clu
tch
size
Figure 2.3 ANCOVA estimates of mean clutch size (95% CI) scaled to midpoints of the early (14 June), middle (20 June), and late (27 June) incubation periods for female King Eiders that nested at Karrak and Adventure Lakes during 2001 and 2002 and were predicted to have wintered within western (Pacific) or eastern (Atlantic) seas during the winter preceding that breeding season. Estimates are for nests of all clutch sizes, including those where (a, b) more than one female likely contributed to the overall clutch size and (c, d) for only those clutches with <7 eggs.
21

possible by more conventional approaches. Alternative methods, such as resighting
color-marked individuals on wintering areas, is difficult because King Eiders winter at
sea several kilometers from shore (Mosbech and Johnson 1999, Suydam 2000), battery
lifespan for satellite transmitters is too short to allow for estimates of philopatry among
years, and differential hunting pressures among regions can bias band recovery data
(Robertson and Cooke 1999). My results suggest that inference about winter
distributions based on band recoveries from hunters was biased for King Eiders. Isotope
analyses showed that most King Eiders at Karrak Lake wintered in the Pacific (66–
73%), whereas limited band recoveries for the same breeding population suggested that
only about 44% wintered there. I suggest that intensive hunting along the coast of
Greenland (Christensen and Falk 2001) resulted in more band recoveries from that area.
Some female King Eiders switched between wintering areas, and must have used
completely different migration pathways among years. This suggests that winter
philopatry among King Eiders is low, despite high rates of philopatry to breeding areas
(Kellett 1999). Benefits and consequences of philopatry and dispersal are generally
assessed relative to breeding areas (Greenwood 1980, Rohwer and Anderson 1988).
Unlike most birds, waterfowl are thought to exhibit female-biased breeding philopatry
(Greenwood 1980, Rohwer and Anderson 1988, but see Doherty et al. 2002). Robertson
and Cooke (1999) suggested that in waterfowl, the normal avian pattern of male-biased
philopatry was likely selected for on wintering, as opposed to breeding areas, due to the
tendency for waterfowl to form pairs during winter. However, there have been few
studies of winter philopatry in waterfowl, leaving hypotheses largely untested
(Robertson et al. 1999). Nevertheless, low philopatry to wintering areas could lead to
increased gene flow (Cooke et al. 1975, 2000), and even if male King Eiders exhibit
high winter philopatry (Robertson et al. 1999), winter dispersal by females alone would
provide ample gene flow for population mixing to occur (see Slatkin 1987). This may
explain lack of phylogeographic structure among eastern and western populations
(Pearce et al. 2004).
Dispersal by female King Eiders among wintering areas may be facilitated by
gregarious behavior and group migration. Females congregate on breeding areas before
fall migration; I observed such flocks of up to 46 females at Karrak Lake during late
22

summer. King Eiders migrate in groups (Suydam 2000), so individuals from one
wintering area may follow those of another to an alternate wintering site. Potential
benefits of female philopatry include familiarity with local food resources and predators
(Anderson et al. 1992). Winter philopatry may be less important to female King Eiders if
flocking during winter (Suydam 2000) allows for information exchange on productive
foraging areas (Brown 1988) and if lack of predators in open oceanic waters lessens the
need for familiarity with local predators (Rohwer and Anderson 1988).
Dispersal among areas is most likely if movement is favorable in both directions
(Bull et al. 1987); otherwise, geographic variation in selection can partially block gene
flow (Barton 1983). Although my results show benefits in the form of earlier nest
initiation and larger clutches for females that wintered in the west, these benefits are
likely not consistent among years and thus may not constitute a strong force of selection.
For instance, differences in nest initiation dates likely reflect differential spring
conditions among western and eastern seas and the availability of open water along
migration routes (Abraham and Finney 1986, Suydam 2000). Late springs generally
result in lower nest densities because a greater number of females are suspected to forgo
breeding opportunities (Coulson 1984). I suspect that a late eastern spring during 2002
may have delayed spring migration and hence nesting attempts and decreased breeding
probability for eastern birds, compared to 2001. If so, western seas are also likely to
experience late seasons, as trends in diminished sea ice indicate similar long-term (18-
year) trends for both eastern (Labrador Sea, Davis Strait) and western (Bering and
Chukchi Seas) wintering areas (Parkinson 2000).
Females that wintered in the Pacific appeared to reap increased benefits with
larger clutch sizes, but they also showed a greater prevalence for apparent nest
parasitism compared to females from the Atlantic. However, high frequency of apparent
nest parasitism during early nest initiation may counter these benefits if parasitism leads
to decreased egg success or offspring survival (Eadie and Anstey 1999). Unfortunately, I
was unable to test for differences in nest success with respect to preceding wintering
area. Assuming that lack of winter philopatry by female King Eiders results in
population mixing between eastern and western populations, increased nest parasitism
by individuals that wintered in the west should not reflect genetic differences between
23

these local populations. Without genetic analysis of young, identification of parasitic
females, and hence their winter origin (west or east) remains unknown.
Despite apparent differences in clutch size and nest initiation date, female
condition of breeders was similar among individuals that wintered in eastern and
western areas. Such similarities are likely related to a minimum threshold of endogenous
nutrients, which females must exceed as a precondition for breeding (Kellett and
Alisauskas 2000). Given that a greater proportion of this local population of female
King Eiders wintered in the west despite the longer migration distances, there may be
greater benefits to wintering in the west, as opposed to the eastern seas. Adult survival
may also differ among wintering areas due to differential hunting pressures. However,
data that incorporate isotope analysis with mark-recapture methods collected over a
longer term than that of this study period, are needed before movement and subsequent
survival probabilities can be estimated directly (Lindberg et al. 1995).
2.6 CONCLUSION
Collection and isotopic analysis of feathers has recently gained the attention of many
ecologists (Webster et al. 2002, Smith et al. 2003). My results show that isotope analysis
of feathers can be of further use when combined with local banding efforts and that
these data allow for broad-scale inferences useful for modeling demography. This
method also offers a means of monitoring potential for gene flow directly through
dispersal and subsequent breeding success. Evidence for movement among wintering
areas and lack of segregation on the breeding area according to winter distribution
suggest that King Eiders wintering in Atlantic and Pacific seas may behave as one
population rather than two (see Berryman 2002). These data also emphasize the need to
use caution when interpreting band recoveries for purposes of movement and dispersal
due to differences in hunting pressures among areas. Finally, I hope that this study will
encourage researchers to incorporate, where appropriate, stable-isotope analysis with
local banding efforts. Future work should incorporate similar isotope and banding
studies, particularly near the eastern and western limits of the species’ breeding areas.
24

3. LOCAL KING EIDER SURVIVAL AND POPULATION GROWTH:
POTENTIAL INFLUENCE OF BODY SIZE
3.1 INTRODUCTION
Fisher’s fundamental theorem predicts that traits closely connected to fitness have low
heritability, as fitness benefits would reduce additive genetic variance and lead to
evolutionary equilibrium (Price and Schluter 1991). In contrast, variation in body size
often correlates with variation in life-history traits (Sauer and Slade 1984, Blanckenhorn
2000, Rotella et al. 2003) despite high heritability of external morphological traits (Boag
1983, Boag and Grant 1978, Grant and Grant 1994). Price and Schulter (1991) suggest
that most support for Fisher’s fundamental theorem has come from low heritability of
life-history traits (i.e., survival and fecundity) and that such low heritability would occur
regardless of evolutionary equilibrium because environmental and nonadditive genetic
variance has a greater influence on life-history traits than on morphological traits. For
example, nonadditive genetic characters, and factors such as weather (Davidson 1981)
and predation (Sargent et al. 1984) can largely influence survival.
Here, I was interested in the influence of body size and its contributions to
population growth. If benefits to body size exist, it is likely that the magnitude of
benefits vary geographically. For example, larger-bodied birds are generally able to
withstand cooler temperatures, store proportionately more fat reserves, and fast for
longer periods of time relative to smaller conspecifics because of lower body surface
area to volume ratios, and greater feather insulation (Kendeigh 1969, Kendeigh 1970,
Calder 1974). However, overall nutrient demands, risk of heat stress, and juvenile
growth periods also increase with body size (Kendeigh 1969, Blanckenhorn 2000).
Additionally, larger body size may reduce agility, leaving larger individuals more
susceptible to predation (Blanckenhorn 2000, Rotella et al. 2003). Thus, there can exist
increased costs, as well as benefits, with increased body size and such costs can act as
25

partial stabilizing mechanisms that impede the achievement of exceptionally large body
size. Given such cost and benefits, Fretwell (1972) hypothesized that larger body size
would be favored in the presence of (1) limited breeding resources, (2) cold
temperatures, (3) reduced photoperiod, and (4) consumption of foods that are difficult to
digest. Therefore, species that breed and winter in polar regions should benefit the most
from larger size compared to species with more temperate provenances.
King Eiders are a suitable study species for assessing effects of body size because
they breed in arctic regions and, unlike most arctic-breeding species, which migrate to
southern latitudes during the nonbreeding period, King Eiders remain in northern
latitudes throughout the annual cycle (Bellrose 1976). Winter foraging is primarily
during daylight of reduced duration and intensity (Frimer 1994). In addition, King
Eiders do not breed until they are at least 3 years old (this study) and breeding females
rely heavily upon stored nutrients, losing an average of 30% of their pre-incubation
body mass during incubation (Kellett and Alisauskas 2000). Lastly, King Eider diets
include about 50% bivalves with non-digestible shells (Frimer 1997), which likely
requires a longer gut system. In accordance to Fisher’s fundamental theorem, with body
size being highly heritable (Appendix D), I predicted that if size benefits exist, these
benefits would have the greatest influence on recruitment as opposed to survival,
because recruitment contributes less to population growth (i.e., fitness) relative to
survival (Rockwell et al. 1997, Crone 2001).
3.2 METHODS
3.2.1 Study Area and Data Set
This study was conducted on islands in Karrak and Adventure Lakes and mainland
habitats near these lakes (67° 14’ N, 100° 15’ W). Kellett and Alisauskas (2000)
provided detailed descriptions of the study area. Islands at Karrak (1995-2002) and
Adventure Lakes (1996-2002) were systematically searched for King Eider nests
beginning in mid-June. King Eider nest initiation dates were calculated by back-dating
from known laying dates, or from estimated incubation stages by candling eggs (Weller
1956), assuming an incubation length of 23 days (Parmelee et al. 1967) and a laying
interval of one egg per day (Lamothe 1973). About 7 days before predicted hatch,
26

female King Eiders were trapped by placing mistnets over nesting females or by use of
self-triggered bow-nets. Captured females were marked with standard CWS/USFWS leg
bands and morphometric measurements (+1.0 mm) of head length and tarsus using dial
calipers, and wing chord using a flat ruler (Dzubin and Cooch 1993) were recorded. In
addition, uniquely numbered web-tags and plasticine-filled metal bands (Blums et al.
1994) were used to mark ducklings at nests. Information gained from marked ducklings
allowed me to obtain age of first breeding and heritability estimates for body size among
parent and offspring.
3.3 STATISTICAL ANALYSES
I used principal components analysis (PCA) of the correlation matrix of mean metric
measurements of individual females to establish indices of female structural size (PC1)
(SAS Institute Inc. 1996). I did not include mass in my measurement of size, as mass is
known to vary among years (Johnson et al. 1985, Alisauskas and Ankney 1990). I
assessed measurement error (%ME), i.e., proportion of measurement variation due to
observers, assuming that individual structural size was constant, by using repeated
measurements for the same individuals over multiple years (Lessells and Boag 1987,
Lougheed et al. 1991). I used general linear models (GLM) to test for age related size
effects. Although this method lacks robustness due to small sample size (n = 24 adult
females of known size and breeding age), given our data set, this was the only method
available to examine potential age and size effects.
I investigated the influence of body size on population dynamics using both Pradel
seniority models (Pradel 1996) and Cormack-Jolly-Seber models (CJS; Lebreton et al.
1992) within Program MARK (White and Burnham 1999). Pradel models use forward
capture histories to estimate apparent survival ( ); the probability that a female
survived from year i to i+1, and returned to the study area, and recapture probability
( ); the probability that a marked female alive in year i was captured in year i. In
addition, Pradel models also use reverse order capture histories to estimate seniority (
iφ
ip
iγ )
or the probability that an individual in the population at time i was also in the population
during the previous year, i-1 (Pradel 1996, Nichols et al. 2000). Because of the
27
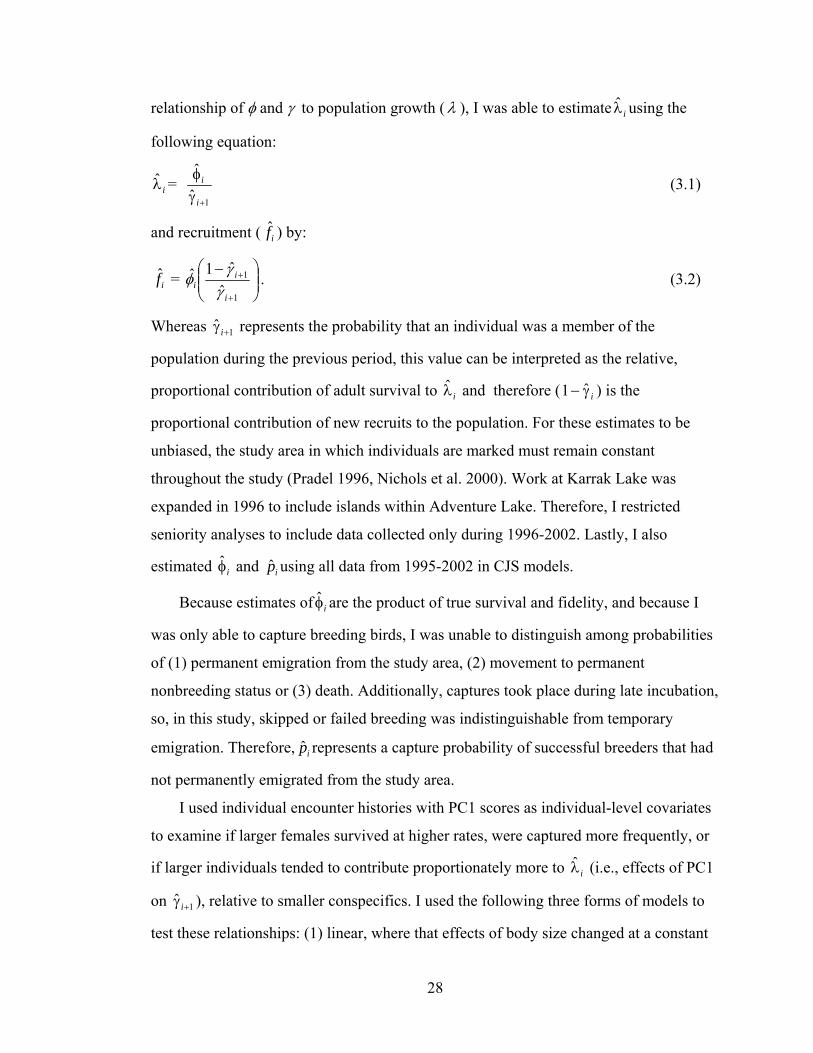
relationship of φ and γ to population growth ( λ ), I was able to estimate using the
following equation:
iλ
iλ = 1ˆ
ˆ
+γφ
i
i (3.1)
and recruitment ( ) by: if
if = ⎟⎟⎠
⎞⎜⎜⎝
⎛ −
+
+
1
1
ˆˆ1ˆ
i
ii γ
γφ . (3.2)
Whereas 1ˆ +γ i represents the probability that an individual was a member of the
population during the previous period, this value can be interpreted as the relative,
proportional contribution of adult survival to and therefore (iλ iγ− ˆ1 ) is the
proportional contribution of new recruits to the population. For these estimates to be
unbiased, the study area in which individuals are marked must remain constant
throughout the study (Pradel 1996, Nichols et al. 2000). Work at Karrak Lake was
expanded in 1996 to include islands within Adventure Lake. Therefore, I restricted
seniority analyses to include data collected only during 1996-2002. Lastly, I also
estimated and using all data from 1995-2002 in CJS models. iφ ip
Because estimates of are the product of true survival and fidelity, and because I
was only able to capture breeding birds, I was unable to distinguish among probabilities
of (1) permanent emigration from the study area, (2) movement to permanent
nonbreeding status or (3) death. Additionally, captures took place during late incubation,
so, in this study, skipped or failed breeding was indistinguishable from temporary
emigration. Therefore, represents a capture probability of successful breeders that had
not permanently emigrated from the study area.
iφ
ip
I used individual encounter histories with PC1 scores as individual-level covariates
to examine if larger females survived at higher rates, were captured more frequently, or
if larger individuals tended to contribute proportionately more to (i.e., effects of PC1
on
iλ
1ˆ +γ i ), relative to smaller conspecifics. I used the following three forms of models to
test these relationships: (1) linear, where that effects of body size changed at a constant
28

rate [β0 + β1(x1) + …+ βn(xn)], (2) quadratic, where an intermediate size benefits [β0 +
β1(x1) + β2(x12) + … βn(xn) + βn+1(xn+1
2)], or (3) pseudothreshold, where size effects
increase at a constant rate to a point at which the effects of size approach, but do not
reach, an asymptote [β0 + β1ln(x1+ 4.0) + …+ βnln(xn+ 4.0)]. For each, β0 is the intercept,
and xi is the body size covariate. To adjust for negative and zero values in
pseudothreshold models, I added 4.0 to PC1 scores before multiplying each value by the
natural log. I used the logit link function when testing covariates and the sine link for
non-covariate models (White and Burnham 1999). I was interested in overall structural
size, so I did not incorporate univariate measurements as covariates in my models.
3.3.1 Model Selection
I tested goodness-of-fit of the most general CJS model using the parametric bootstrap
method in Program MARK (White and Burnham 1999). I adjusted the variance inflation
factor (ĉ) to account for lack of model fit (Burnham and Anderson 2002). The adjusted ĉ
(1.08) was calculated by dividing the deviance of the most general model by the mean
deviance from 1,000 bootstrap iterations (White and Burnham 1999). I assumed ĉ = 1
for Pradel Survival and Seniority Models in Program MARK because Pradel model
estimates are conditioned on the full encounter history, rather than portion following the
first capture (Franklin 2001), therefore use of CJS estimates for ĉ are inappropriate for
this method (White and Burnham 1999). I chose the most parsimonious model(s) using
quasi-likehood Akaike’s Information Criterion (QAICc) adjusted for sample size
(Akaike 1985, Burnham and Anderson 2002).
I considered 13 candidate CJS models for and (Table 3.1). I began model
selection by first reducing the number of parameters for the most general, fully time-
dependent model beginning with time constraints on . For seniority models, I began
model selection by initially adding time constraints to
iφ ip
ip
1ˆ +γ i , followed by ip , and then
iφ . After obtaining the most parsimonious model without covariates, I added body size
covariates to the model and tested for interactions between body size and year. I
29
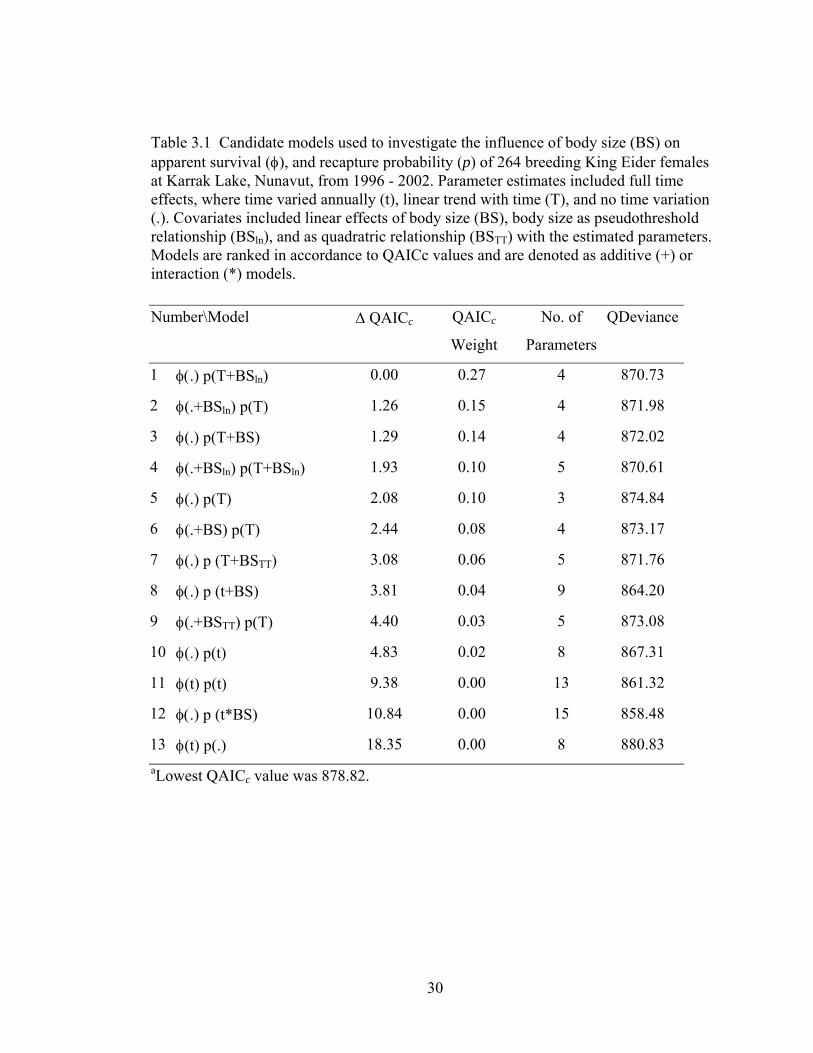
Table 3.1 Candidate models used to investigate the influence of body size (BS) on apparent survival (φ), and recapture probability (p) of 264 breeding King Eider females at Karrak Lake, Nunavut, from 1996 - 2002. Parameter estimates included full time effects, where time varied annually (t), linear trend with time (T), and no time variation (.). Covariates included linear effects of body size (BS), body size as pseudothreshold relationship (BSln), and as quadratric relationship (BSTT) with the estimated parameters. Models are ranked in accordance to QAICc values and are denoted as additive (+) or interaction (*) models. Number\Model ∆ QAICc QAICc
Weight
No. of
Parameters
QDeviance
1 φ(.) p(T+BSln) 0.00 0.27 4 870.73
2 φ(.+BSln) p(T) 1.26 0.15 4 871.98
3 φ(.) p(T+BS) 1.29 0.14 4 872.02
4 φ(.+BSln) p(T+BSln) 1.93 0.10 5 870.61
5 φ(.) p(T) 2.08 0.10 3 874.84
6 φ(.+BS) p(T) 2.44 0.08 4 873.17
7 φ(.) p (T+BSTT) 3.08 0.06 5 871.76
8 φ(.) p (t+BS) 3.81 0.04 9 864.20
9 φ(.+BSTT) p(T) 4.40 0.03 5 873.08
10 φ(.) p(t) 4.83 0.02 8 867.31
11 φ(t) p(t) 9.38 0.00 13 861.32
12 φ(.) p (t*BS) 10.84 0.00 15 858.48
13 φ(t) p(.) 18.35 0.00 8 880.83 aLowest QAICc value was 878.82.
30
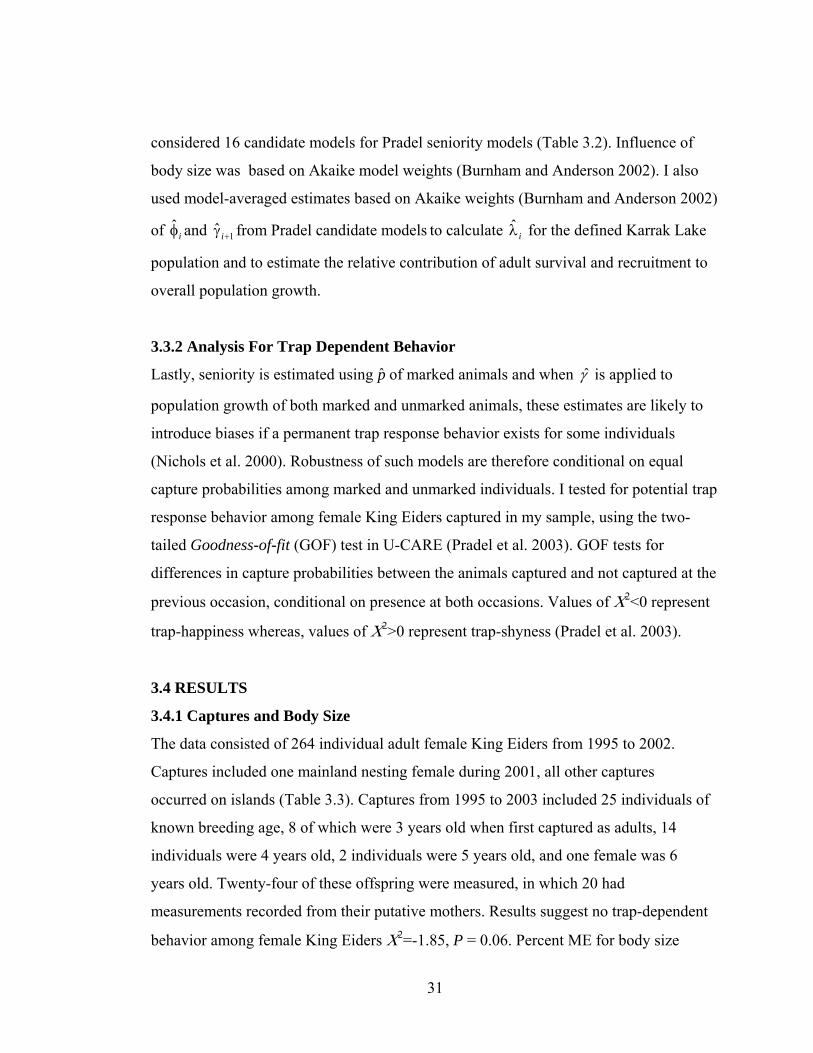
considered 16 candidate models for Pradel seniority models (Table 3.2). Influence of
body size was based on Akaike model weights (Burnham and Anderson 2002). I also
used model-averaged estimates based on Akaike weights (Burnham and Anderson 2002)
of and iφ 1ˆ +γ i from Pradel candidate models to calculate for the defined Karrak Lake
population and to estimate the relative contribution of adult survival and recruitment to
overall population growth.
iλ
3.3.2 Analysis For Trap Dependent Behavior
Lastly, seniority is estimated using of marked animals and when p γ is applied to
population growth of both marked and unmarked animals, these estimates are likely to
introduce biases if a permanent trap response behavior exists for some individuals
(Nichols et al. 2000). Robustness of such models are therefore conditional on equal
capture probabilities among marked and unmarked individuals. I tested for potential trap
response behavior among female King Eiders captured in my sample, using the two-
tailed Goodness-of-fit (GOF) test in U-CARE (Pradel et al. 2003). GOF tests for
differences in capture probabilities between the animals captured and not captured at the
previous occasion, conditional on presence at both occasions. Values of Χ2<0 represent
trap-happiness whereas, values of Χ2>0 represent trap-shyness (Pradel et al. 2003).
3.4 RESULTS
3.4.1 Captures and Body Size
The data consisted of 264 individual adult female King Eiders from 1995 to 2002.
Captures included one mainland nesting female during 2001, all other captures
occurred on islands (Table 3.3). Captures from 1995 to 2003 included 25 individuals of
known breeding age, 8 of which were 3 years old when first captured as adults, 14
individuals were 4 years old, 2 individuals were 5 years old, and one female was 6
years old. Twenty-four of these offspring were measured, in which 20 had
measurements recorded from their putative mothers. Results suggest no trap-dependent
behavior among female King Eiders Χ2=-1.85, P = 0.06. Percent ME for body size
31
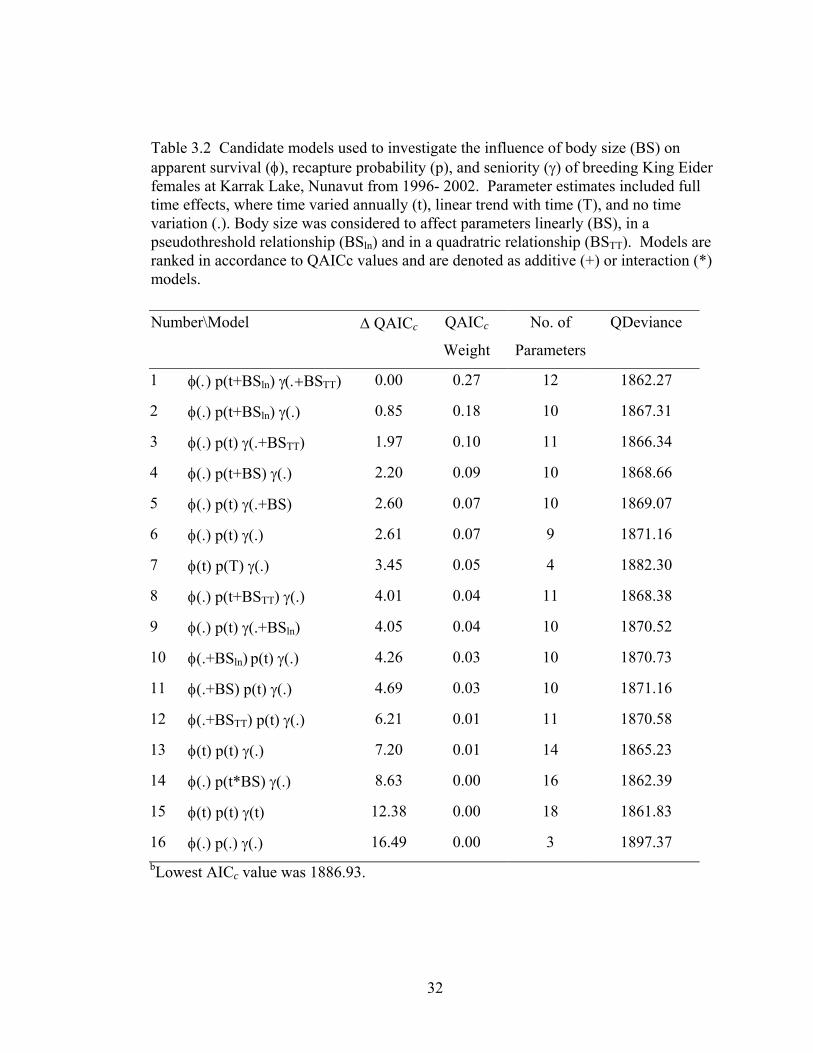
Table 3.2 Candidate models used to investigate the influence of body size (BS) on apparent survival (φ), recapture probability (p), and seniority (γ) of breeding King Eider females at Karrak Lake, Nunavut from 1996- 2002. Parameter estimates included full time effects, where time varied annually (t), linear trend with time (T), and no time variation (.). Body size was considered to affect parameters linearly (BS), in a pseudothreshold relationship (BSln) and in a quadratric relationship (BSTT). Models are ranked in accordance to QAICc values and are denoted as additive (+) or interaction (*) models. Number\Model ∆ QAICc QAICc
Weight
No. of
Parameters
QDeviance
1 φ(.) p(t+BSln) γ(.+BSΤΤ) 0.00 0.27 12 1862.27
2 φ(.) p(t+BSln) γ(.) 0.85 0.18 10 1867.31
3 φ(.) p(t) γ(.+BSTT) 1.97 0.10 11 1866.34
4 φ(.) p(t+BS) γ(.) 2.20 0.09 10 1868.66
5 φ(.) p(t) γ(.+BS) 2.60 0.07 10 1869.07
6 φ(.) p(t) γ(.) 2.61 0.07 9 1871.16
7 φ(t) p(T) γ(.) 3.45 0.05 4 1882.30
8 φ(.) p(t+BSTT) γ(.) 4.01 0.04 11 1868.38
9 φ(.) p(t) γ(.+BSln) 4.05 0.04 10 1870.52
10 φ(.+BSln) p(t) γ(.) 4.26 0.03 10 1870.73
11 φ(.+BS) p(t) γ(.) 4.69 0.03 10 1871.16
12 φ(.+BSTT) p(t) γ(.) 6.21 0.01 11 1870.58
13 φ(t) p(t) γ(.) 7.20 0.01 14 1865.23
14 φ(.) p(t*BS) γ(.) 8.63 0.00 16 1862.39
15 φ(t) p(t) γ(t) 12.38 0.00 18 1861.83
16 φ(.) p(.) γ(.) 16.49 0.00 3 1897.37 bLowest AICc value was 1886.93.
32

Table 3.3 Number of King Eider nests found and number of adult female King Eiders and ducklings (both sexes) banded during 1995 to 2002 on islands within Karrak Lake and Adventure Lake, Nunavut.
Year No. of nests No. of adult Adult females No. of ducklings
found females marked captured (%) marked
1995 41a 25 61.0% 0
1996 100b 63 63.0% 23
1997 123 62 50.4% 185
1998 146 60 41.1% 193
1999 191 71 37.2% 260
2000 191 56 29.3% 175
2001 208 91 43.8% 186
2002 221 84 38.0% 174 aKellett and Alisauskas 1997 bKellett et al. 2003 (1996-2001)
33

when calculated annually (1995 to 2002) was 17% (repeatability = 83%). My index of
size (PC1) accounted for 53% of variation in body measures, with PC1 loadings of
0.72, 0.76. 0.71 for head length, tarsus, and wing, respectively. Body size was
unrelated to age (F3,23 = 0.96, r2 = 0.12, P = 0.43) and did not appear to affect age of
first capture (Figure 3.1). Mean measurements for head length was 106.3mm (95% CI
= 106.5 to 106.0), mean tarsus was 47.1mm (95% CI = 47.3 to 46.9), and mean wing
length was 275.6 mm (95% CI = 276.4 to 274.8)
3.4.2 Apparent Survival, Capture Probability and Seniority
Results from CJS models suggest that φ remained stable and decreased linearly
through time from 1995 to 2002 (Table 3.1). In contrast, with the exclusion of 1995
from the data set, Pradel 1996-2002 models suggested that varied non-linearly with
time (Table 3.2). Model average estimate of during 1996-2002 from Pradel seniority
models was 0.87 (95% CI = 0.81 to 0.91), varied with time (range = 0.31 to 0.67), and
ˆ p
p
φ
p
γ was 0.72 (95% CI = 0.67 to 0.77). Based on model averaged estimates of γ ,
contribution of survivors to the Karrak Lake population of breeding females was 72%,
meaning that local survival within the population was 2.6 times more important to the
annual population growth than was the addition of new recruits. Average for the
Karrak Lake population was estimated at 0.34 (95% CI = 0.27 to 0.40) and at
1.20 (95% CI = 1.05 to 1.36). Low sample size of known maternal female and locally-
produced offspring precluded separation of recruitment into ‘in situ recruits’ and
immigrants.
20021996ˆ
−f
20021996ˆ
−λ
Relationship of body size to φ and were similar among CJS and Pradel models.
Based on the candidate set of models used, I found no relationship between and body
size. However, I did find a pseudothreshold trend in the effects of body size on , and a
quadratic trend with
ˆ p
φ
p
γ and body size (Figure 3.2). Based on model weights, body size
had the greatest influence and the greatest precision relative to other parameters. p
34
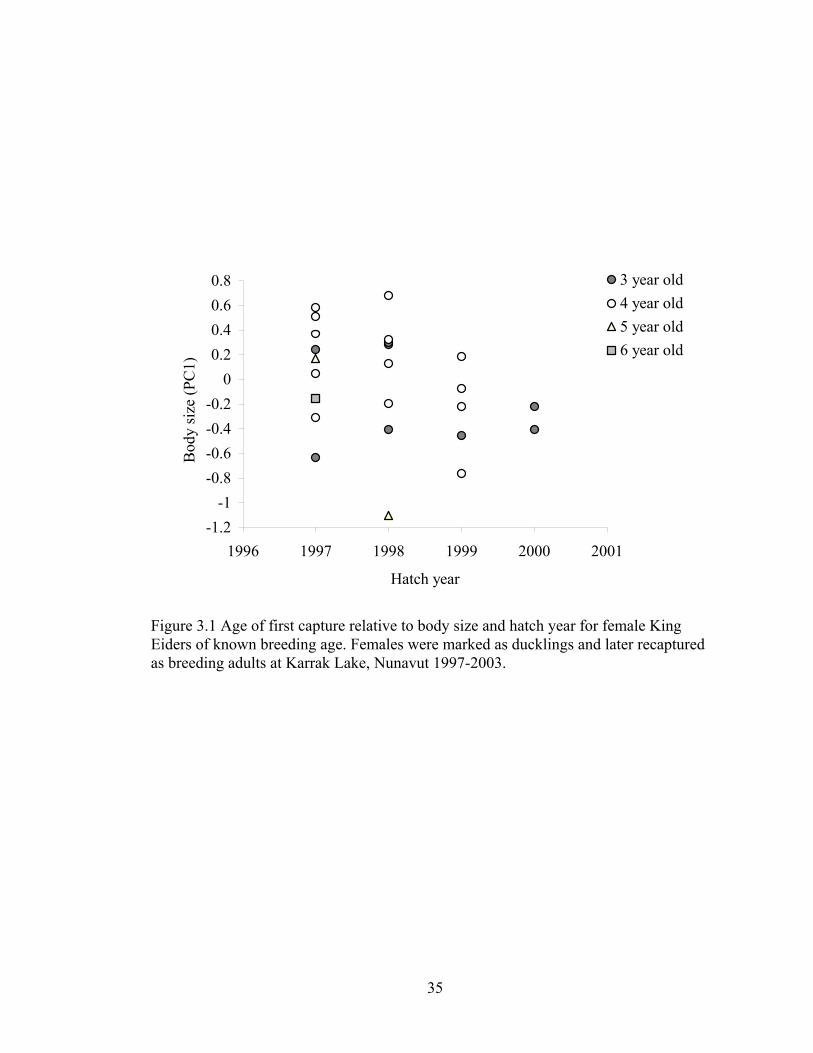
-1.2-1
-0.8-0.6-0.4-0.2
00.20.40.60.8
1996 1997 1998 1999 2000 2001
Hatch year
Bod
y si
ze (P
C1)
m
3 year old4 year old5 year old6 year old
Figure 3.1 Age of first capture relative to body size and hatch year for female King Eiders of known breeding age. Females were marked as ducklings and later recaptured as breeding adults at Karrak Lake, Nunavut 1997-2003.
35

0
0.2
0.4
0.6
0.8
1
-4.00 -2.00 0.00 2.00 4.00
Body Size
App
aren
t Sur
viva
a)
0
0.2
0.4
0.6
0.8
1
Rec
aptu
re P
roba
bilit
y .
b)
0
0.2
0.4
0.6
0.8
1
-4.00 -2.00 0.00 2.00 4.00
Body Size
Seni
ority
c)
Figure 3.2 Predicted influence of body size on apparent survival (a), recapture probability (b), and seniority (c) of female King Eiders returning to breed at Karrak and Adventure Lakes, Nunavut. Values shown have been backtransformed from the logit function. Slope estimates are based on weighted model averaged estimates are as follows: 1) : 0.09 (95%CI= -0.17 to 0.36); 2) :φ ˆ =
lnfemalesizeβ p =lnfemalesizeβ 0.21
(95%CI=0.01 to 0.42), and 3) γ : =TTfemalesizeβ 0.14 (95%CI =-0.05 to 0.32) + 0.14
(95%CI =-0.03 to 0.30).
36

3.5 DISCUSSION
My results suggest that body size had little influence on apparent survival of adult
female King Eiders once they have successfully bred for the first time. Ideally, I would
have measured individuals at hatch and followed their survival from fledging through all
breeding attempts. Female King Eiders are 3-5 years of age before they nest
successfully, so selection against the smallest individuals may have occurred before the
sampling period. For example, early mortality of smaller-sized young occurs in Ross’s
geese (C. rossii; Slattery and Alisauskas 2002) and Ruddy Ducks (Oxyura jamaiccensis
rubiada; Pelayo 2001). If the smallest individuals died during the first 3-5 years of life,
or failed to be recruited into the breeding population, the remaining measured breeding
individuals may already have been above a minimum threshold of larger body size (Hill
et al. 2003).
Several factors may have contributed to differences in recapture probabilities
between small and large-bodied females. Female King Eiders rely heavily on
endogenous reserves for breeding (Kellett and Alisauskas 2000), and if larger
individuals are more efficient at using these reserves due to lower surface area to
volume ratio (Calder 1974), these individuals may be in better condition relative to
smaller conspecifics. Several studies have documented positive relationships between
female condition and nest success (Gloutney and Clark 1991, Mallory and Weatherhead
1993, Kellett and Allisauskas 2000). Most King Eider nest failures occur during early
incubation (Kellett and Allisauskas 2000); short arctic breeding seasons and heavy
reliance on stored nutrient reserves likely prevent renesting after nest loss in the same
season (Korschegen 1977, Suydam 2000). Therefore, if smaller individuals nested less
successfully than larger individuals, the probability of capturing smaller individuals
would have been reduced. Furthermore, intermittent breeding can be extensive among
eiders (Coulson 1984). If larger individuals are more efficient at using nutrient reserves,
this may enable these individuals to breed more regularly, whereas smaller females may
refrain from breeding during some years. Alternatively, smaller individuals may have
flushed from nests more readily than large individuals, and therefore smaller females
37

may have simply been more difficult to capture than large individuals, which generally
have higher incubation constancy (Skutch 1962, Afton and Paulus 1992). Regardless,
lower recapture probability for smaller females is consistent with a positive influence of
larger size on breeding effort.
Estimation of γ using Pradel models provided additional insights. Effects of body
size on γ suggest that larger individuals contributed more to growth of the local
population than smaller individuals. In other words, the likelihood of being a previous
member of the population increased with body size. Given that my sample of marked
birds was restricted to breeding female eiders, the relationship between seniority and
body size suggests that large females show greater consistency from year to year in
being members of the breeding cohort than did smaller females. Estimation of seniority
was conditional on detection or capture probability, suggesting that higher capture
probability estimated from CJS models were related more to increased breeding
probability rather than to any direct influence of body size on likelihood of capture
given presence.
Influence of body size appears to have the greatest influence on γ for small and
medium-sized individuals, with a threshold-type relationship where γ remains relatively
constant for individuals larger than medium body size (Figure 3). Annual entry into the
breeding population was greater for smaller females and I suggest this is because smaller
individuals show less consistency in membership in the breeding population, with higher
frequency of leaving and re-entering this cohort. Contributions of both large and small-
bodied individuals to growth of the breeding population (quadratic time trend) may
likely act to maintain body size variation within the population. Furthermore, benefits of
body size may fluctuate under variable conditions. For instance, during spring, King
Eiders rely on nutrient-rich leads in the ice and polynyas with limited open water in
which to feed. Natural closures of these areas can leave King Eiders unable to forage
during critically low temperatures (Fournier and Hines 1994). Therefore, selection
pressures on body size may be most pronounced during these periods, as larger
individuals should be more efficient at using stored reserves and withstand fasting for
longer duration (Kendeigh 1969, Kendeigh 1970, Calder 1974). However, large size
38

requires increased energy requirements to meet daily energetic maintenance (Kendeigh
1969), so if individuals are forced to fast before nutrient reserves are acquired, then
smaller-bodied individuals may be at an ecological advantage. This may help to explain
the large variability in recorded body size of breeding female King Eiders, as selection
for an optimal size should deplete genetic variance (Gibson and Bradley 1974).
Ideally, study populations should have low immigration rates of individuals exposed
to different selection pressures (Larsson et al. 1998). Results from isotope analysis of
King Eider feathers indicate that individuals from this population winter in both western
and eastern seas and that nest initiation dates and clutch size varied by wintering area,
suggesting that variable selective pressures may occur among wintering sites (Mehl et
al. 2004). However, I suggest that these selection pressures vary through time and are
likely not consistent among sites. I also acknowledge that body size is likely a polygenic
trait and that selection may act on other correlated or unmeasured traits such as heavier
feather insulation, hormone actions, or enzyme systems (see Kendeigh 1969).
3.6 CONCLUSION
In conclusion, model-averaged estimates suggest that larger individuals show higher
probability of previous membership in the breeding cohort of King Eiders at Karrak
Lake, and have greater fitness from more frequent successful nesting attempts.
Population growth for the study area was high, with an estimated overall growth of 20%.
These growth rates were similar to those exhibited by Common Eiders (Somateria
mollissima), where most of the growth seemed to occur in a step-wise growth pattern
attributed to boom and bust production years (Coulson 1984). Assuming that King
Eiders also follow a step-wise growth pattern, some years may allow successful
production unconstrained by size and thus, maintain a high degree of phenotypic
plasticity and heritability within the population. Lastly, caution should be taken when
interpreting local estimates of population growth. Overall population trends indicate
declining abundance of King Eiders throughout much of their range (Suydam et al.
2000). My data did not allow separation of immigration and in situ recruits and, at the
metapopulation level, local areas such as Karrak Lake may exhibit population increases
while other areas simultaneously decline. Furthermore, my estimates λ may be biased
39

high if a large proportion of young recruits has recently shifted the age-structure toward
recruits (Cooch et al. 2001). Studies need to focus on marking young at nests to establish
a marked population of known breeders. Such data are necessary to separate
contributions to the population by in situ recruits from contributions through
immigration, and to better understand factors that contribute to fitness benefits. In
addition, similar studies to that presented here are needed to establish comparison data at
local sites throughout the species’ range so that we can begin to understand geographical
variation in local rates of population growth.
40

4. KING EIDER NEST SUCCESS AND BREEDING CONDITION:
RELATIONSHIPS BETWEEN FUTURE SURVIVAL AND BREEDING
4.1 INTRODUCTION
Natural selection is a consequence of differences in fitness (e.g., reproductive effort
and longevity). It is through such fitness differences that the evolution of trade-offs
between various life history traits evolved (Williams 1966, Renzick 1985, Stearns
1992, Cooch et al. 2002). For instance, allocation of resources for reproduction may
reduce future reproductive efforts if body reserves are depleted to such a degree that
survival or future breeding attempts are diminished (Clutton-Brock et al.1982), via
increase vulnerability to disease (Korschgen et al. 1978, Wobeser 1981) or if breeding
leads to increased likelihood of mortality from predation (Sargeant et al. 1984, Dufour
and Clark 2002). For species that rely heavily on nutrient reserves for breeding,
individuals with lower relative nutrient reserves may incur greater costs to future
reproductive efforts, relative to those individuals in better condition. The presence of
such trade-offs may not be ubiquitous (Tuomi et al. 1983, Harris and Wanless 1995,
Cam et al. 1998). However, if present, detection of such trade-offs is an important step
toward understanding ecological pressures and the evolution of life-history traits.
Relative nest initiation date is often linked to components of recruitment, where
recruitment is greatest for nests of early relative hatch date (Cook et al. 1984, Dawson
and Clark 2000, Reed et al. 2003). If such trade-offs exist, relative nest initiation date
may also influence the magnitude of trade-offs among life history traits,. For instance,
in seasonal environments, annual median nest initiation dates reflect differential spring
conditions and habitat availability (Suydam 2000, Reed et al. 2003). For species that
rely heavily on nutrient reserves for successful breeding, delayed nest initiation due to
late onset of spring conditions may cause individuals to deplete their stored nutrients
before breeding begins, resulting in fewer birds nesting during late breeding years
41

(Chapter 2). Therefore, reproductive costs to individuals that breed in late years may
be greater relative to early years, in terms of reduced survival or probability to breed
during the subsequent year.
Multistate models are useful tools to understand ecological pressures that shape life
history traits, as these models allow ecologists to estimate costs of reproduction in
terms of survival or future reproductive efforts, and provide insights into time variation
in such costs (Nichols et al. 1994, Nichols and Kendall 1995). Life history traits vary
over space and time, therefore, if trade-offs among life history traits exist, such trade-
offs may vary with factors such as environmental fluctuations (Franklin et al. 2000),
resource availability (Nichols and Kendall 1994), and population density (Frederiksen
et al. 2001).
Here I use multistate models to investigate annual patterns in nest success and
breeding condition of female King Eiders (Somateria spectabilis) in relation to (1)
costs of reproduction and relative nutrient reserves, and (2) measure the effects of
annual nest initiation on breeding success and nutrient reserves. King Eiders are a good
study species to test costs associated with reproduction and nutrient reserves as they
are a long-lived (Chapter 3), breed and winter in northern latitudes (Suydam 2000),
and rely heavily on stored nutrients for reproduction, losing about 30% of their pre-
incubation body mass during incubation (Kellett and Alisauskas 2000). I predict that
nesting attempts and nutrient reserves during incubation pose few costs to survival, as
females with nutrient reserves below an adaptive threshold required for nesting likely
forego breeding attempts or abandon nests (see Kellett and Alisauskas 2000).
Furthermore, arctic habitats and the occurrence of island nesting likely to pose few
predation threats to incubating females (Sargeant and Raveling 1992). Heterogeneity in
quality among individuals is important underlying factor to population dynamics
(Cooch et al. 2002). To my knowledge, this is the first use of multistate models to
investigate such factors of female quality.
42

4.2 METHODS
4.2.1 Study Area and Captures
This study took place on island habitats within Karrak and Adventure Lakes and
mainland habitats near these lakes, located about 60 km south of the Queen Maud
Gulf, Nunavut (67° 14’ N, 100° 15’ W). Kellett and Alisauskas (1997) provide
detailed descriptions of the study area.
Islands on Karrak Lake (1995-2002) and Adventure Lake (1996-2002) were
systematically searched for King Eider nests beginning in mid-June. King Eider nests
on the mainland were found opportunistically when females flushed during research
activities with Lesser Snow Goose (Chen caerulescens) and Ross’s Goose (C. rossii)
(Kellett et al. 2003). Nest initiation dates were calculated by back-dating from known
laying dates, or from incubation stage by candling eggs (Weller 1956), assuming a
laying interval of one egg per day (Lamothe 1973) and incubation of 23 days
(Parmelee et al. 1967). Nesting female King Eiders were captured within about 7 days
of predicted hatch, using mistnets or self-triggered bownets. Captured females received
standard metal leg bands, each was weighed using a Pesola scale (+10g), and
measurements of head length, and tarsus recorded using dial calipers (+1.0 mm), and
wing chord (±1.0 mm) recorded using a flat ruler (Dzubin and Cooch 1993).
4.3 STATISTICAL ANALYSES
4.3.1 Body Condition
I used the correlation matrix of mean annual metric measurements for each individual
as an index of female structural size (PC1; SAS Institute Inc. 1996). I excluded body
weight from this index, as body mass can be highly variable among and within years
(Johnson et al. 1985, Alisauskas and Ankney 1990). I used general linear models
(GLM) to regress body weight on PC1 and incubation stage at capture, and used
residuals as an index of adult female condition. Condition indices thus, represent body
weight corrected for structural size (PC1) and incubation stage at capture (Alisauskas
and Ankney 1990, Hochachka and Smith 1991). I used general linear models to test if
clutch size has varied over time, assuming that annual correlations may exist between
female condition and clutch size (Alisauskas and Ankney 1990),
43

4.3.2 Patterns in and Costs to Nest Success and Condition
I used multistate models in Program MARK (Brownie et al. 1993, White and Burnham
1999), where encounter histories were coded by the different states that an individual
occupied at time of capture (i.e., successful or failed nester and good or poor condition;
Brownie et al. 1993, Nichols et al. 1994). To examine potential costs and patterns in
nest success data, I organized encounter histories of nesting females such that each
capture was coded according to nest success after capture. Females with hatched nests
were coded as successful (S), while those with failed nesting attempts after capture
were coded as failures (F). To investigate costs and patterns in female condition, I
reorganized encounter histories to reflect females that were in good (G) or poor (P)
condition, relative to other individuals captured during the same year. Residuals of the
condition index >0, represented those individuals in good condition, and residuals < 0
represented individuals in poor condition. I used multistate models to estimate the
following: (1) apparent survival, , the probability that an individual alive and in
state r at time i was alive in state s at time i+1 and did not emigrate permanently from
the study area; (2) recapture probability, , the probability that an individual was
recaptured at time i and was in state r, provided that the individual was alive and in the
study area at time i; and (3) movement or transition probability, , the probability
that a female in state r at time i changed to state s at i+1 (Brownie et al. 1993, Nichols
et al. 1994). The probability that an individual did not change states (i.e., ) is equal
to 1 - . For all nest success analyses, females marked with transmitters during
2001 were censored from the analysis (n = 29), as transmitters during this year lead to
high nest loss (Appendix A).
rsiφ
rip
rsiΨ
rriΨ
rsiΨ
4.3.3 Model Selection
I tested goodness-of-fit of nest success and condition models using U-CARE (Pradel et
al. 2003) and calculated Quasi-Akaike’s Information Criterion (QAICc) from AICc
using a variance inflation factor df
c2
ˆ χ= to correct for small sample size and over-
44

dispersion (Akaike 1985, Burnham and Anderson 2002). I considered 26 candidate
models for patterns of nest success ( = 1.30; see Table 4.1 for top 10 candidate
models) and 34 candidate models to investigate patterns in female condition ( =
1.82; see Table 4.2 for top 17 candidate models). I investigated models for temporal
variation or constancy for each estimated parameter and chose the most parsimonious
models using QAIC
c
c
c (Akaike 1985, Burnham and Anderson 2002). After obtaining the
most parsimonious time constrained model, I added median annual nest initiation
directly into the PIMs as an annual-level covariate (White and Burnham 1999). Median
nest initiation date was scaled so that the year with the earliest median nest initiation
date was equal to one. Scaled annual, median nest initiation dates ranged from 1 – 10,
as median nest initiation varied by up to 10 days among years.
4.3.4 Model Assumptions
Because most nest failure occurs during the laying period (Kellett et al. 2003) and my
sample of female King Eiders was comprised of females captured during mid- to late
incubation, encounters of King Eiders were biased toward successful nesters. Despite
these biases, inclusion of recapture probability within multistate models still allows for
non-biased estimates in regards to the costs of reproduction if the data meet the
following assumptions (Brownie et al. 1993, Nichols et al. 1994): 1) All individuals
nest successfully at least once (i.e., there are no individuals that are not available for
capture because they are never successful); 2) individuals within the same state have
equal recapture probability (i.e., all females that were in good condition were equally
available for capture); and 3) costs of reproducing at time i occurred during the
subsequent interval before the next encounter (i+1).
45

Table 4.1 Top 10 of 26 candidate models used to investigate nest success terms of apparent survival (φ), recapture probability (p), and transition probability (ψ) for female King Eider that nested successfully or failed in their breeding attempts at Karrak Lake, Nunavut, from 1996 - 2002. Models included group affects where parameters varied with nest success (g) or held constant (.), and time effects, where time varied annually (t), linear trend with time (T), or with no time variation (.). Covariates included annual median nest initiation date. Models are ranked in accordance to QAICc values and are denoted as additive (+) or interaction (*) models.
Model Number/Name
∆QAICc ∆QAICc Weight No. of
Parameters
Deviance
1 φ(.) p(g) ψ(g*T) 0.00 0.45 6 672.18
2 φ(g) p(g) ψ(g*T) 1.92
0.17 7 672.01
3 φ(.) p(g+T) ψ(g*T) 2.03 0.16 7 672.12
4 φ(.) p(g*T*initiation) ψ(g*T) 3.65 0.07 8 671.63
5 φ(g) p(g+T) ψ(g*T) 4.01 0.06 8 671.99
6 φ(g) p(g) ψ(g*initiation) 6.71 0.02 7 676.80
7 φ(.) p(g*T*initiation) ψ(g+initiation*T) 7.11 0.01 10 670.84
8 φ(.) p(g*T*initiation) ψ(g*T*initiation) 7.25 0.01 10 670.97
9 φ(g) p(g+T) ψ(g+T) 7.69 0.01 8 675.67
10 φ(g) p(g+T) ψ(g*t) 9.23 0.00 13 666.46
∗Lowest QAICc value = 684.46
46
47
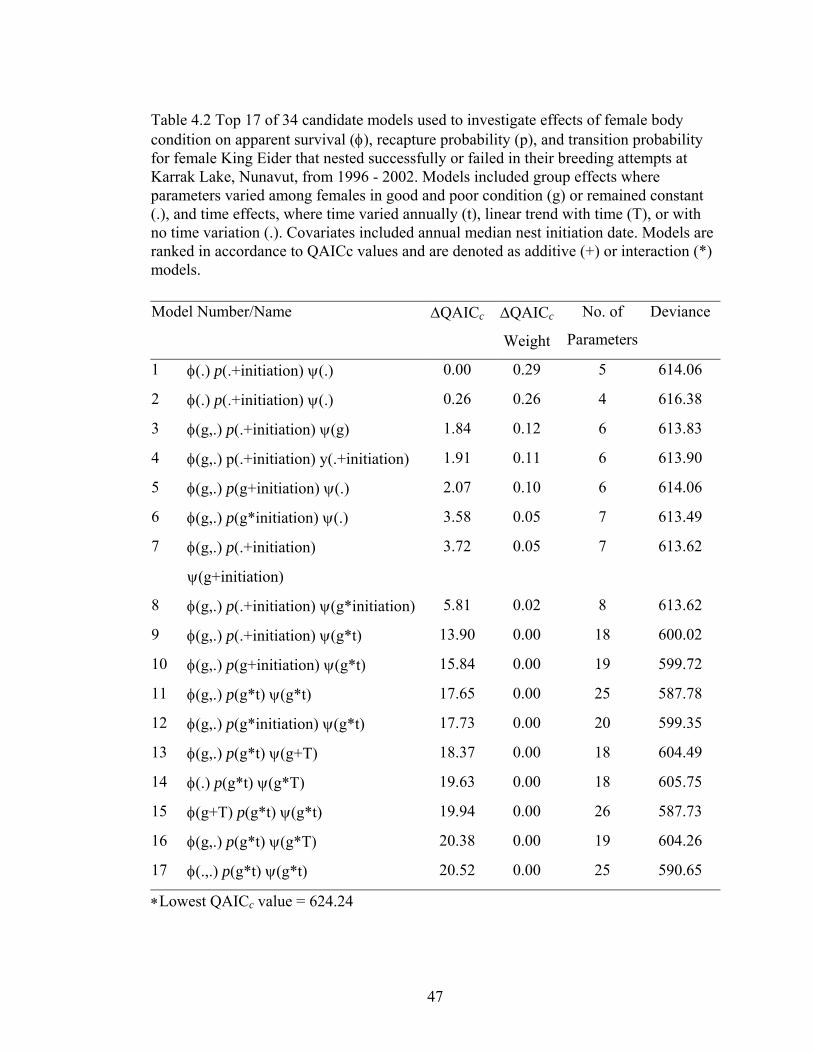
Table 4.2 Top 17 of 34 candidate models used to investigate effects of female body condition on apparent survival (φ), recapture probability (p), and transition probability for female King Eider that nested successfully or failed in their breeding attempts at Karrak Lake, Nunavut, from 1996 - 2002. Models included group effects where parameters varied among females in good and poor condition (g) or remained constant (.), and time effects, where time varied annually (t), linear trend with time (T), or with no time variation (.). Covariates included annual median nest initiation date. Models are ranked in accordance to QAICc values and are denoted as additive (+) or interaction (*) models. Model Number/Name ∆QAICc ∆QAICc
Weight
No. of
Parameters
Deviance
1 φ(.) p(.+initiation) ψ(.) 0.00 0.29 5 614.06
2 φ(.) p(.+initiation) ψ(.) 0.26 0.26 4 616.38
3 φ(g,.) p(.+initiation) ψ(g) 1.84 0.12 6 613.83
4 φ(g,.) p(.+initiation) y(.+initiation) 1.91 0.11 6 613.90
5 φ(g,.) p(g+initiation) ψ(.) 2.07 0.10 6 614.06
6 φ(g,.) p(g*initiation) ψ(.) 3.58 0.05 7 613.49
7 φ(g,.) p(.+initiation)
ψ(g+initiation)
3.72 0.05 7 613.62
8 φ(g,.) p(.+initiation) ψ(g*initiation) 5.81 0.02 8 613.62
9 φ(g,.) p(.+initiation) ψ(g*t) 13.90 0.00 18 600.02
10 φ(g,.) p(g+initiation) ψ(g*t) 15.84 0.00 19 599.72
11 φ(g,.) p(g*t) ψ(g*t) 17.65 0.00 25 587.78
12 φ(g,.) p(g*initiation) ψ(g*t) 17.73 0.00 20 599.35
13 φ(g,.) p(g*t) ψ(g+T) 18.37 0.00 18 604.49
14 φ(.) p(g*t) ψ(g*T) 19.63 0.00 18 605.75
15 φ(g+T) p(g*t) ψ(g*t) 19.94 0.00 26 587.73
16 φ(g,.) p(g*t) ψ(g*T) 20.38 0.00 19 604.26
17 φ(.,.) p(g*t) ψ(g*t) 20.52 0.00 25 590.65
∗Lowest QAICc value = 624.24
47

4.3.5 Annual trends in nest success and condition
I estimated (1) the number of females that nested successfully and (2) the number of
individuals in good condition ( ) based on: riN
ri
rri p
mN i
ˆˆ = (4.1)
where rim is the number of individuals captured in state r (i.e., number of captures
where females nested successfully or were in good condition at capture) at time i,
divided by the corresponding recapture probability ( ). I used estimates of state-
specific capture probabilities based on the top model to calculate the approximate
variance of the proportion of the population that nested successfully (Nichols et al.
1994). I did not use parameter estimates from weighted model averages to calculate
these variances because (1) QAICc weight for this model was relatively high (ω = 0.45
out of 1.0), and (2) the variance approximation is already biased high when recapture
probabilities vary among states (Nichols et al. 1994). For the proportion of the
population in good condition, I calculated the variance based on model average equal
capture probabilities among condition states as outlined by Nichols et al. (1994).
Mark-recapture do not provide recapture probabilities for the first year of any study
(White and Burnham 1999), therefore, for the above population proportions, I used the
annual patterns denoted by my models to project recapture rates for 1995.
rip
I investigated trends in nest success and female condition using linear regressions
weighted by the variance-1 of population proportion that nested successfully and in
good condition. I used the slope as the best linear unbiased estimate for annual trends
(SAS 1996). Lastly, I used Pearson correlation coefficients to test for correlations
between the proportion of the population that nested successfully and estimates of
Mayfield nest success during the same time period. Nest success data were based on
that of Kellett et al. (2003). Costs associated with nest success or condition were
calculated as the difference between probabilities of remaining in the same state and
changing states (i.e., vs rrΨ srΨ ; Nichols et al. 1994).
All results are reported as ± SE and all parameter estimates reflect weighted model
average estimates (Burnham and Anderson 2002) unless otherwise noted.
48
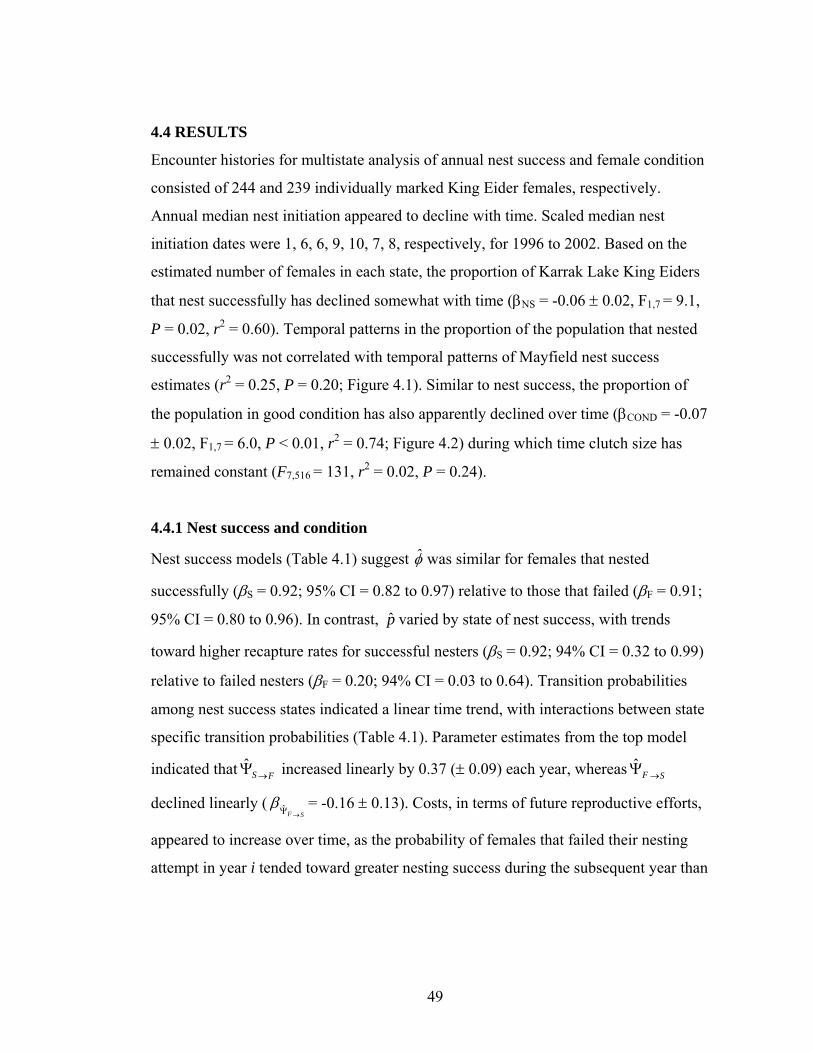
4.4 RESULTS
Encounter histories for multistate analysis of annual nest success and female condition
consisted of 244 and 239 individually marked King Eider females, respectively.
Annual median nest initiation appeared to decline with time. Scaled median nest
initiation dates were 1, 6, 6, 9, 10, 7, 8, respectively, for 1996 to 2002. Based on the
estimated number of females in each state, the proportion of Karrak Lake King Eiders
that nest successfully has declined somewhat with time (βNS = -0.06 ± 0.02, F1,7 = 9.1,
P = 0.02, r2 = 0.60). Temporal patterns in the proportion of the population that nested
successfully was not correlated with temporal patterns of Mayfield nest success
estimates (r2 = 0.25, P = 0.20; Figure 4.1). Similar to nest success, the proportion of
the population in good condition has also apparently declined over time (βCOND = -0.07
± 0.02, F1,7 = 6.0, P < 0.01, r2 = 0.74; Figure 4.2) during which time clutch size has
remained constant (F7,516 = 131, r2 = 0.02, P = 0.24).
4.4.1 Nest success and condition
Nest success models (Table 4.1) suggest φ was similar for females that nested
successfully (βS = 0.92; 95% CI = 0.82 to 0.97) relative to those that failed (βF = 0.91;
95% CI = 0.80 to 0.96). In contrast, varied by state of nest success, with trends
toward higher recapture rates for successful nesters (β
p
S = 0.92; 94% CI = 0.32 to 0.99)
relative to failed nesters (βF = 0.20; 94% CI = 0.03 to 0.64). Transition probabilities
among nest success states indicated a linear time trend, with interactions between state
specific transition probabilities (Table 4.1). Parameter estimates from the top model
indicated that increased linearly by 0.37 (± 0.09) each year, whereas
declined linearly (
FS →Ψ SF →Ψ
SF →Ψβ = -0.16 ± 0.13). Costs, in terms of future reproductive efforts,
appeared to increase over time, as the probability of females that failed their nesting
attempt in year i tended toward greater nesting success during the subsequent year than
49

0
50
100
150
200
250
300
350
No.
of f
emal
es.
Failed or nonbreedingSuccessful
a
0
0.2
0.4
0.6
0.8
1
Prop
ortio
n su
cces
sful
mm
0
0.2
0.4
0.6
0.8
1
May
field
succ
ess.
Figure 4.1 Estimsuccessful breethose that failedsuccessful (b), aduring this periand Alisauskas,
b.
c.
1995 1996 1997 1998 1999 2000 2001 2002
ated number (± 95% CI) of King Eider resident females to have ding attempts at Karrak Lake, Nunavut during 1995 – 2002, relative to or did not breed (a), proportion of the population estimated to be nd relative to Mayfield nest success estimates for the same population
od (c). Nest success estimates are from Kellett et al. (2003; 1995-2001) unpubl. data (2002).
50

020406080
100120140160180200
Estim
ated
no.
of f
emal
es . Poor condition
Good condition
a.
0.0
0.2
0.4
0.6
0.8
1.0
1995 1996 1997 1998 1999 2000 2001 2002
Prop
ortio
n in
goo
d co
nditi
on
.
b.
Figure 4.2 Estimated number (± 95% CI) of nesting King Eider resident females to have been in relative good or poor body condition at Karrak Lake, Nunavut during 1995 – 2002 (a) and the annual variability in the proportion of the population estimated to be in good condition (b).
51

were females that nested successfully during the previous year (Figure 4.3). Annual
median nest initiation date had no apparent affect on nest success state for any of the
modeled parameters (QAICc > 3; Burnham and Anderson 1992).
Weighted model averages from models for female condition (Table 4.2) suggest φ
did not differ for females in good (βG = 0.95; 95% CI = 0.84 to 0.99) and poor
condition (βP = 0.88; 95% CI = 0.75 to 0.95). Similarly, models suggest that did not
differ among state of condition, with declining in years of late nest initiation (β = -
0.26; 95% CI = -0.10 to -0.41). Transition probabilities among states of body condition
was constant across time and states, (
p
p
GPPG →→ ,β = 0.31; 95% CI = 0.23 to 0.42), such
that females in good condition tended to remain in good condition and those in poor
condition tended to be in poor condition during subsequent captures ( = 0.69
probability of remaining in the same state).
Ψ− ˆ1
4.5 DISCUSSION
I did not detect either reduced survival or increased permanent emigration that resulted
from successful nesting by King Eiders. However, the data suggest that successful
nesters bred more frequently or, at least experienced more frequent success, as
indicated by higher recapture probabilities. Part of the difference in capture
probabilities between successful and failed nesters likely resulted from nest failure
before capture. Other studies have shown that individuals with higher reproductive
effort are likely higher quality individuals, with no phenotypic costs associated with
increased reproductive effort (Meadow voles Microtus pennsylvanicus, Nichols et al.
1994; Common Guillemots Uria aalge, Harris and Wanless 1995; Black-legged
Kittiwake Rissa tridactyla, Cam et al. 1998; Common Eiders Somateria mollissima,
Yoccoz et al. 2002). Moreover, if survival costs associated with reproduction do exist,
such costs may reflect environmental pressures (Price and Schluter 1991). For
example, in ground-nesting prairie waterfowl, the greatest annual mortality risk is
generally predation during the nesting period (Sargent et al. 1984). In order for long-
lived species to have adapted high survival, mortality risks during the breeding season
52

0.0
0.1
0.2
0.3
0.4
0.5
0.6
0.7
0.8
0.9
1.0
1995 1996 1997 1998 1999 2000 2001 2002
Tran
sitio
n pr
obab
ility
failed to successfulsuccessful to successful
Figure 4.3 Probability (± 95% CI) that successful and failed nesters at Karrak Lake, Nunavut during 1995 – 2002, were able to nest successfully during the subsequent year. As long as the probability of remaining a successful breeder is ≥ probability of moving from failed to successful breeding status, there are assumed to be no costs in terms of future reproductive efforts incurred (Nichols and Kendall 1994).
53

must be low. Accordingly, King Eiders in this study nested primarily on islands where
mortality risks to females and their nests are low relative to mainland areas where
probability of encounters by mammalian predators are higher (Kellett et al. 2003).
However, caution must be used when applying these results to other nesting
populations, as King Eider nesting populations elsewhere are thought to nest primarily
on mainland habitats (Suydam 2000).
The probability that successful nesters became unsuccessful in the next year
increased during the course of this study, while the probability that failed nesters
became successful declined. As a result, a smaller proportion of the population nested
successfully each year. Over the same period of study, local population size of nesting
females (defined as those that ever nested but may have temporarily emigrated) grew
by about 20% (Chapter 3). Thus, the increasing propensity of previously successful
nesters to become unsuccessful, and a decrease in the proportion of the population
nesting successfully is consistent with density-dependence. Such density dependent
costs may occur, for example, if higher densities lead to greater conspicuousness of the
nests to predators (Anderson and Titman 1992), or decreased nest success resulting
from brood parasitism (Eadie and Anstey 1999). Alternatively, decreased proportional
nest success may represent a shift in age-structure. If a larger proportion of the
population has shifted toward younger individuals that are less successful at nesting
(Raveling 1981, Aldrich and Raveling 1983). Importantly, temporal patterns of
Mayfield nest success estimates (probability of successful nesting given that an
individual tried to nest) did not coincide with the declining probability of successful
nesting, given that and individual had not permanently emigrated (i.e., product of
breeding probability and nest success). Current population projection studies
incorporate Mayfield nest success and not proportional breeding (Flint et al. 1998,
Hoekman et al. 2002). These results emphasize the importance of incorporating
multistate approaches into projection models (Fujiwara & Caswell 2002), specifically,
the importance of accounting for the proportion of breeders breeding individuals as this
would have a greater effect on recruitment and population dynamics than Mayfield
nest success alone.
54

Nest initiation date had no apparent affect on state of nest success or apparent
nutrient reserves, as the proportion of individuals moving from failed nest success or
poor condition did not improve in years of earlier breeding. Late arctic springs
generally result in reduced nest densities (Coulson 1984, Babcock et al. 2002).
Recapture probability for female condition models was lowest in years when nest
initiation was delayed and I suggest this resulted from either early nest failure or a
greater number of individuals forgoing breeding attempts in these years, either of
which would leave fewer marked birds available for capture. Conversely, recapture
probability for states of nest success varied more among success states than with
annual nest initiation dates, inferring that successful nesting had a greater influence on
local breeding probability (or fidelity) during the following year than did late spring
conditions.
I found that apparent survival and recapture probabilities were similar among
females of good and poor condition, implying no condition-related phenotypic costs.
However, if females of poorest condition abandon their nests during laying or early
incubation, or forgo breeding attempts altogether, my indices of poor and good
condition would more accurately represent females in average and above average
condition. Regardless, the probability of remaining in the same relative body condition
among years was more than double that of changing condition states, suggesting
variations in individual quality. I discount that varying condition is due to wintering
regions, as most individuals from the local population winter in the west and condition
indices did not differ by wintering area even when nest initiation dates did (Mehl. et al.
2004).
Finally, these results provided insight on density dependent nest success and have
shown the usefulness of multistate analysis to investigate patterns of individual
variation, and the need to account for these patterns when addressing demographics.
Intermittent breeding can be extensive within populations and its occurrence can have
a profound influence on population dynamics (Coulson 1984, Cam et al. 1998). Future
work is needed to identify heterogeneity of failed nesters. Use of memory models are
data hungry and although data presented here are too sparse for use in such models,
longer-term data collected with these methods in mind are important if we are to
55

understand if long-term changes are a function of individual heterogeneity (Cooch et
al. 2002). In addition, use of permanent individual markers that allow for resighting
individuals without recapture, or use multiple captures within the same season (i.e.,
robust design), are needed to directly estimate breeding propensity and assess breeding
propensities with prior nest success (Kendall et al. 1997, Anderson et al. 2001, Cooch
et al. 2002).
56

5. KING EIDER BROOD ECOLOGY: INFLUENCE OF ABIOTIC AND BIOTIC
FACTORS
5.1 INTRODUCTION
Knowledge of survival, movements and habitat requirements of waterfowl broods is
essential, as duckling survival constitutes an important component of recruitment
(Johnson et al. 1992, Sedinger 1992). After nest success, duckling survival is typically
the most limiting factor on recruitment (Johnson et al. 1992, Cowardin and Blohm
1992) because, despite successful nesting, entire broods may be lost (Ringelman and
Longcore 1982, Mauser et al. 1994, Korschgen et al. 1996). Consequently, the brood-
rearing period may act as an important bottleneck in annual productivity (Flint et al.
1998).
Estimation of probabilities for transition between sequential states in an organism’s
life cycle, including up to recruitment into the breeding cohort, is important for
understanding population dynamics of long-lived species, as this parameter can
contribute greatly to population growth (Coulson 1984). Adult survival constitutes the
greatest proportion of annual rate of population change in long-lived species (Rockwell
et al. 1997, Crone 2001), but long-lived species tend to show constant adult survival
(Coulson 1984, Gaillard et al. 1998, Harris and Wanless 1995). Moreover,
retrospective analyses indicate that high variability in recruitment rates can be the
underlying cause of fluctuations in population size (Coulson 1984, Gaillard et al. 1998,
Cooch et al. 2001).
Several abiotic and biotic factors are correlated with prefledgling survival of
precocial young, to include weather (Mendenhall 1979), hatch date (Cooke and
Findlay 1982), dispersal distance of broods (Ball et al. 1975, Sedinger 1992), and
offspring and female attributes such as size and condition (Afton and Paulus 1992,
57

Christensen 1999). Previous research has focused on these relationships in terms of
only a few correlates at once, and was restricted to pooling survival estimates from
multiple weeks to establish composite estimates for the brood-rearing period (Dzus and
Clark 1997, Flint et al. 1997). Capture-mark-resight (CMR) methodologies permit
greater flexibility when modeling survival estimates, and allow partitioning the amount
of variation in survival that can be attributed to each of these potential correlates
(White and Burnham 1999, Pelayo and Clark 2003). Furthermore, if data are sampled
appropriately, these techniques provide estimates of variable daily survival rates
(Lebreton et al. 1992).
My objectives were to use CMR techniques, combined with radio-telemetry, to
investigate potential covariates of King Eider offspring survival. By following radio-
marked females and resighting individually-marked ducklings, I gained insight about
the importance of brood-rearing habitats on brood survival and, in turn, the influence
of brood loss on residency in such habitats by females with young and those without.
Based on previous observations, I predicted that offspring mortality would be greatest
during the first week after hatch, and that females with young would disperse from the
study area by using the rivers to reach the sea before fledging (Parmelee et al. 1967).
5.2 STUDY AREA
The study was conducted on Karrak and Adventure Lakes and on freshwater habitats
surrounding these lakes. The study area is about 60 km south of the Queen Maud Gulf,
Nunavut, Canada (67° 14’ N, 100° 15’ W). Karrak and Adventure Lakes support the
highest known density of nesting King Eiders (Kellett and Alisauskas 1997). Karrak
Lake averages about 1.2 m in depth, with an area of 16.1 km2 and contains 2.5 km2 of
various-sized islands; Adventure Lake is about 300m east of Karrak Lake, and
averages about 2.5 m in depth, is 8.8 km2 in size and contains 0.2 km2 of islands
(Kellett and Alisauskas 2000). Surrounding wetland habitats vary in size, with most
nearby wetlands being smaller than either Karrak or Adventure Lakes. A weather
station at the Karrak Lake research camp recorded daily maximum and minimum
ambient temperatures, precipitation, and wind speed.
58

5.3 METHODS
5.3.1 Nest Search and Trapping
I systematically searched islands within Karrak and Adventure Lakes for King Eider
nests beginning in mid-June. Islands were searched 2-3 times to increase my odds of
finding most nests. I calculated nest initiation date, defined as the date the first egg was
laid in a nest, by back-dating from known laying dates or from estimated incubation
stages by candling eggs (Weller 1956), assuming an incubation length of 23 days
(Parmelee et al. 1967) and a laying interval of one egg per day (Lamothe 1973). About
4-7 days before predicted hatch dates, I trapped nesting female King Eiders by laying
mist nets over incubating females or by use of self-triggered bow nets. Upon capture, I
marked females with standard CWS/USFWS leg bands, and weighed each with Pesola
scale (+10g). I recorded (twice for each female) morphometric measurements of head
length, and tarsus using dial calipers (+1.0 mm), and wing chord (±1.0 mm) using a
flat ruler (+1.0 mm) (Dzubin and Cooch 1993). I attached subcutaneous anchored
transmitters (Advanced Telemetry Systems™; Mauser and Jarvis 1991) to a subset of
captured females (n = 30, every 2nd captured female in 2000; n = 29 every 3rd capture
in 2001) and using surgical sutures attached a uniquely colored combination of nasal
tags through the nares for individual identification. Use of dissolving sutures permitted
nasal tags to break away from the nares before winter. Before releasing newly radio-
marked females, I removed all eggs from nests, and replaced them with an equal
number of color-dyed chicken eggs. I administered 1-1.5 ml Propofol in the tarsal vein
of the female to reduce nest abandonment after radio-attachment (Machin and Caulkett
2000). King Eider eggs were artificially incubated in a portable incubator at camp. At
hatch, I weighed ducklings using a digital scale (±0.1g), recorded head length and
tarsus measurements (twice each) using digital calipers (± 0.5 mm), and marked each
with a plasticine leg band (Blums et al. 1994) and a uniquely-colored nape-marker
(Taber 1949, Gullion 1951, Pelayo 2001). I then returned marked ducklings to their
original nests loosely wrapped in a paper-towel envelope so that they would remain in
the nest until the female returned (Korschgen et al. 1996).
59

Nests of 6 radio-marked females were depredated in 2000, and one nest was
abandoned before ducklings could be returned to nests. I divided ducklings from the 6
failed nests among 4 different radio-marked females whose broods had hatched on the
same day, artificially increasing brood size for 4 of 23 radio-marked females. Brood
enlargements consisted of 3, 5, 6, and 7 extra ducklings for a total brood size of 5, 10,
11, and 11, respectively. Six radio-marked females abandoned their nests in 2001, and
another 12 nests were depredated before duckling hatch. I did not manipulate brood
size of radio-marked females in 2001.
I located radio-marked females and associated ducklings once every 2-days over a
24-day period and recorded total number of adult female King Eiders present, number
of ducklings and corresponding color codes of nape tags, status of brood (amalgamated
or not), and habitat type (pond [<1km2], lake [>1km2], or river). To minimize observer
disturbance to broods that would lead to possible gull predation, I did not attempt to
record nape tag colors when foraging gulls (Larus spp.) were near broods. To better
understand differences in habitat use and movements of brood and non-brood females,
I also monitored radio-marked females that had failed their nesting attempt or had
experienced total brood loss.
The Animal Care Committee - University of Saskatchewan approved methods on
behalf of the Canadian Council on Animal Care.
5.4 STATISTICAL ANALYSES
5.4.1 Covariates for Survival Analyses
I used principal component analysis (PCA) of the correlation matrix of mean
individual measurements to establish an index of structural size (SAS Institute Inc.
1996). I used residuals from general linear models (GLM) to obtain indices of (1) adult
female body weight corrected for structural size (PC1adult), and incubation stage at
capture, and (2) duckling weight corrected for duckling size (PC1duckling) and hatch date
(Alisauskas and Ankney 1990, Hochachka and Smith 1991). I tested for brood size
variation among years and hatch dates using GLM. To examine if larger females
produced larger, better-conditioned ducklings, I assessed correlations between
duckling size and condition with female size. I also used PCA to derive indices of
60

weather (PC1weather, PC2weather) from the correlation matrix of mean maximum relative
humidity, minimum ambient temperature, and maximum wind speed for first 7 days
after hatch.
I considered the following effects as sources of variation in survival: year, hatch
date (adjusted for median hatch of the colony in a given year), brood size, natal female
size and condition, duckling size and condition, PC scores of weather, and distance
traveled from the nest site during the first week after hatch. In addition, I investigated
presence of an optimal hatch date and brood size using quadratic relationships of these
covariates with survival and investigated psuedothreshold relationships among other
covariates (excluding weather and body condition). I assessed correlations of female
size and hatch date, using hatch date relative to median hatch date among years in my
analyses. Models that assessed survival of ducklings that remained with radio-marked
females included all 16 covariates above. Survival models based on all ducklings,
including those that joined other broods, did not include covariates of brood
movements, brood size, or natal female, as these covariates would theoretically have
no affect on ducklings that did not remain with the natal brood (n = 8 covariates).
Brood-level models excluded individual-level covariates of duckling size and
condition (n = 13 covariates).
5.4.2 Modeling Apparent Survival
I estimated apparent survival (φi) and recapture probability (pi) of marked ducklings
using Cormack-Jolly-Seber (CJS) models (Lebreton et al. 1992) in Program MARK
(White and Burnham 1999). I was unable to obtain estimates of true survival (S),
because I could not locate all ducklings at specific intervals due to early transmitter
failure and because I did not record all nape tag colors in the presence of foraging
gulls. Therefore, my estimates of represent the product of true survival and fidelity
to study area during brood-rearing. I confirmed identities of radio-marked females with
failed transmitters, by observing nasal-tag combinations. I modeled and for (1)
marked ducklings that remained with radio-marked females, and for (2) all marked
ducklings, including ducklings that joined other broods. Fates among broodmates
iφ
iφ ip
61

likely were not independent because of complete brood loss, so I also modeled (3)
brood-level survival for all broods associated with radio-marked females. Nape-
markers were placed too low on necks of ducklings from 2 broods (n=1 brood/year),
rendering color-combinations unreadable. Hence, these ducklings were excluded from
analyses of individual duckling survival.
I tested model fit using the global time dependence model ( , ) and the
parametric bootstrap method in Program MARK (White and Burnham 1999). I
adjusted the variance inflation factor ( ) to account for lack of model fit by dividing
the deviance of the most general model by the mean deviance from 1000 bootstrap
iterations (Burnham and Anderson 2002). All models were chosen subsequently based
on parsimony using quasi-likehood Akaike’s Information Criterion (QAIC
iφ ip
c
c) to correct
for small sample size and lack of fit due to overdispersion (Akaike 1985, Burnham and
Anderson 2002).
In addition to my global, time dependence model, I considered models with
constancy in resighting and survival probabilities. I chose the most parsimonious
model without covariates and used this model to investigate age trends with survival.
Age trends included survival modeled as (1) a linear function and (2) natural log of a
linear relationship (pseudothreshold model) of duckling age, whereby offspring
survival increased with age, eventually approaching but not reaching 100%. After
obtaining the model with the most parsimonious trend in survival with age, I
considered possible covariates as tests of specific hypotheses. I then verified the
significance of the slope ( ) for each covariate. When the 95% CI encompassed zero,
I considered the precision of the estimator to be poor and did not re-enter the covariate
back into the model. I entered each covariate singularly and combined with other
covariates. I tested for interactions between univariate variables, and interactions of all
covariates with age. I considered the following 6 covariates important (i.e., 95% CI did
not encompass zero) to survival of ducklings that remained with radio-marked females:
(1) hatch date, (2) pseudothreshold hatch date, (3) duckling size, (4) pseudothreshold
duckling size, (5) female size, and (6) pseudothreshold female size.
1β
62

I observed radio-marked females only once during each two-day period, so survival
estimates represent a combined two-day rate. Lastly, to account for model
uncertainty, I used model-averaging with QAIC
φ
c weights to estimate survival and
recapture probabilities for the study period (Burnham and Anderson 2002). Apparent
survival for the duration of my study was defined as the product of the 11 two-day
intervals between 12 observational periods, based on weighted averages. Variances for
model-averaged estimates were calculated using the delta method to account for
covariance between estimates across survival periods. Parameter estimates represent
the maximum-likelihood and corresponding 95% CI based on the SIN (identity
matrices) and logit link function (non-identity matrices) in Program MARK (White
and Burnham 1999). Covariates were scaled [ SDxxi /)( − ] automatically by Program
MARK.
5.4.3 Survival and Movements Among Habitats
To assess how dispersal and habitat use influenced survival, I used multi-state models
(Lebreton et al. 1999) where encounters were classified as one of two states: (K)
Karrak or Adventure Lake, where most ducklings were hatched, or (O) all other
habitats, such as lakes, ponds, or rivers away from Karrak or Adventure Lakes.
Probabilities estimated from multistate models included: (1) apparent survival, ; (2)
resighting probability, ; and (3) conditional transition probability, (Brownie et
al. 1993, Nichols et al. 1994).
riφ
rip rs
iΨ
I tested goodness-of-fit of habitat models using U-CARE (Pradel et al. 2003) and
calculated Quasi-Akaike’s Information Criterion (QAICc) from AICc to correct for
small sample size using a variance inflation factor df
c2
ˆ χ= to correct for over
dispersion (Akaike 1985, Burnham and Anderson 2002). Model selection proceeded as
above, by first adding time constraints to resighting probabilities, then transition
probabilities, and lastly time constraints to survival. I did not model multistate data
with covariates. Finally, to compare habitat use between females with and without
63

broods, I examined frequency of habitat use by both groups of females using
analysis weighted by sample size for each group. 2χ
5.5 RESULTS
5.5.1 Marked Individuals and Brood Size
I monitored 111 and 46 individually-marked ducklings from broods of 23 and 11 radio-
marked King Eiders in 2000 and 2001, respectively. I encountered individually-marked
ducklings 252 and 128 times and radio-marked broods 86 and 50 times in 2000 and
2001, respectively. I also encountered radio-marked females following total brood loss
119 and 54 times and radio-marked females with failed nesting attempts 30 and 138
times in 2000 and 2001, respectively.
Brood size did not vary among years or hatch dates (F10,32 = 1.77, P = 0.13). Brood
size, to include artificially enlarged broods, ranged from 3-11 in 2000, and 3-6 in 2001.
Median hatch date for the nesting colony was 2 days earlier in 2001 (n = 176 nests)
than in 2000 (n = 164 nests). Marked ducklings represented mostly early and mid-
hatched nests (Figure 5.1).
Brood amalgamations occurred within 2 days of hatch (n = 5 broods in 2000; 3
broods in 2001) with a mean of 3 females and 9 ducklings, and 4 females and 7
ducklings in 2000 and 2001, respectively. Amalgamated broods ranged from 2
females:7 ducklings to as large as 10 females:29 ducklings. Amalgamations appeared
to remain stable through time (i.e., broods did not group together and later disband),
although females with recorded total brood-loss, appeared to join broods temporarily. I
also observed temporary brood abandonment. In this case, I returned three
individually-marked ducklings to one radio-marked female. This specific female had
no young during the first two observations after hatch. However, on the 3rd
observation, she was accompanied by three young, only one of which hatched from her
nest. One other marked duckling from this female was observed in a separate brood
with a non-marked female. I never observed more than one marked duckling in
unmarked broods.
64

0
5
10
15
20
25
30
35
40
-7 -6 -5 -4 -3 -2 -1 0 1 2 3 4 5 6 7
Relative Hatch Date
Freq
uenc
y
Figure 5.1 Frequency distribution of relative hatch dates of King Eider broods marked on Karrak and Adventure Lakes, Nunavut during 2000 (solid bars) and 2001 (open bars). Hatch dates are relative to the median hatch date for a given year.
65

5.5.2 Covariates of Duckling Survival
My index of duckling size (PC1duckling) accounted for 73% of variation in body
measures, with PC1 loadings of 0.86 for both head and tarsus. Adult female size
(PC1adult) accounted for 66% of the variation in female body measures, with loadings
of 0.80, 0.78. 0.84 for head length, tarsus, and wing, respectively. Larger structural size
was positively correlated with body weight of both ducklings (F2,156 = 15.82, r2 = 0.17,
P < 0.01) and adults (F2,33 = 15.50, r2 = 0.50, P < 0.01). Larger adult female size
correlated with hatch of larger ducklings (r = 0.36, n = 157, P < 0.01) and ducklings of
better condition (r = 0 .17, n = 157, P = 0.03), but nests of larger females did not hatch
earlier (n = 34, P > 0.73).
Weather (PC1weather) accounted for 57% of the variation in maximum relative
humidity, minimum ambient temperature, and maximum wind speed for the first week
of hatch, with respective loadings of –0.82, 0.90, and 0.49. Positive PC1weather scores
represented drier, warmer and blustery days, while negative scores represented
damper, cooler and calmer days. PC2weather accounted for an additional 31% of total
variation in weather data, i.e., 88% cumulative variation for PC1weather and PC2weather,
with loadings of 0.43, -0.08, and 0.86 for maximum relative humidity, minimum
temperature, and maximum wind speed, respectively. Thus, positive PC2weather scores
represented damp, windy days, while negative scores represented dry, calm days.
5.5.3 Variation in Apparent Survival of Ducklings and Broods
Bootstrap results suggest that duckling and brood encounter data were overdispersed,
so I applied variance inflation factors ( ) to models for respective groups of analyses. I c
considered 40 candidate models ( c = 1.34) for ducklings accompanied only by radio-
marked females (Table 5.1), 24 models ( = 1.27) for all ducklings, including those
associated with non-natal females (Table 5.2), and 30 models ( c = 1.35) for analyses
of brood survival (Table 5.3). I also considered 17 multistate models for estimation of
movement and survival probabilities between habitat types ( = 1.51; Table 5.4).
Model results suggested that estimates of both duckling and brood survival were
ˆ
c
ˆ
c
66

Table 5.1 Top 14 of 40 candidate models used to investigate covariates to apparent survival (φ) and resighting probability (p) of King Eider ducklings at Karrak Lake, Nunavut in 2000 and 2001. Models are based on observations of marked ducklings brooded by radio-females. Parameter estimates included year and age effects, where time varied annually and with age (yr,t), linearly with age (T), in a pseudothreshold relationship with age (Tln), and no time or year variation (.). Model covariates included: hatch date (hd), brood size (bs), duckling body size (ds), duckling condition (dc), female size (fs) and female condition (fc), distance moved from the nest during the first week (dist), and principal components of weather during the first week after hatch (w1, w2). Hatch date, distance moved, brood size, and female and duckling size were also entered as a pseudothreshold relationship (Xln), and hatch date and brood size in a quadratic relationship (XTT). Models are ranked in accordance QAICc values and are denoted as additive models (+) or models with interaction (*). Number/Model ∆QAICc
a QAICc
Weights
No. of
Parameters
QDeviance
1 φ(.,Tln fsln*hdln) p(yr,t) 0.00 0.57 23 578.84
2 φ(.,Tln+ fsln*hdln+dc) p(yr,t) 0.96 0.36 24 577.55
3 φ(.,Tln fsln+hdln) p(yr,t) 4.32 0.07 22 585.39
4 φ(.,Tln+fsln) p(yr,t) 12.69 0.00 21 595.98
5 φ(.,Tln+fs) p(yr,t) 12.88 0.00 21 596.17
6 φ(.,Tln+ fsln+dc) p(yr,t) 13.63 0.00 22 594.69
7 φ(.,Tln*fs) p(yr,t) 14.61 0.00 22 595.68
8 φ(.,Tln+ fsln*dc) p(yr,t) 15.51 0.00 23 594.35
9 φ(.,Tln+hdln) p(yr,t) 16.11 0.00 21 599.39
10 φ(.,Tln+ hdln*dc) p(yr,t) 17.68 0.00 23 596.52
11 φ(.,Tln+ hd) p(yr,t) 18.14 0.00 21 601.42
12 φ(.,Tln*hd) p(yr,t) 20.15 0.00 22 601.22
13 φ(.,Tln+dist) p(yr,t) 24.82 0.00 21 608.10
14 φ(.,Tln*dsln) p(yr,t) 25.28 0.00 22 606.35 alowest QAICc value = 627.52
67

Table 5.2 Top 14 of 24 candidate models used to investigate covariates to apparent survival (φ) and resighting probability (p) of King Eider ducklings at Karrak Lake, Nunavut in 2000 and 2001. Models are based on observations of individually marked ducklings that remained with radio-marked females and marked ducklings that mixed with non-radio-marked broods. Parameter estimates included year and age effects, where time varied annually and with age (yr,t), linearly with age (T), in a pseudothreshold relationship with age (Tln), and no time or year variation (.). Model covariates included: hatch date (hd), duckling body size (ds), duckling condition (dc), and principal components of weather during the first week after hatch (w1, w2). Hatch date and duckling size were also entered as a pseudothreshold relationship (Xln), and hatch date in a quadradic relationship (XTT). Models are ranked in accordance QAICc values and are denoted as additive models (+) or models with interaction (*). Model Number/Name ∆QAICc
a QAICc
Weights
No. of
Paramters
QDeviance
1 φ(.,Tln*dc+hdln) p(yr,t) 0.00 0.46 23 755.00
2 φ(.,Tln+hdln+dc) p(yr,t) 0.81 0.31 22 758.04
3 φ(.,Tln+hdln*dc) p(yr,t) 2.69 0.12 23 757.69
4 φ(.,Tln+hdln) p(yr,t) 3.97 0.06 21 763.40
5 φ(.,Tln+hd) p(yr,t) 6.74 0.02 21 766.18
6 φ(.,Tln+*dc) p(yr,t) 7.09 0.01 22 764.31
7 φ(.,Tln+dc) p(yr,t) 7.48 0.01 21 766.92
8 φ(.,Tln*hd) p(yr,t) 8.82 0.01 22 766.05
9 φ(.,Tln) p(yr,t) 10.71 0.00 20 772.35
10 φ(.,Tln+w2) p(yr,t) 12.28 0.00 21 771.72
11 φ(.,Tln+hdTT) p(yr,t) 12.29 0.00 21 771.73
12 φ(.,Tln+w1) p(yr,t) 12.84 0.00 21 772.28
13 φ(.,Tln+distln) p(yr,t) 12.86 0.00 21 772.30
14 φ(.,Tln+dist) p(yr,t) 12.90 0.00 21 772.33 alowest QAICc value = 803.62
68

Table 5.3 Top 14 of 30 candidate models used to investigate brood-level apparent survival (φ) and resighting probability (p) of King Eiders at Karrak Lake, Nunavut in 2000 and 2001. Models are based on observations of marked broods with radio-marked females. Parameter estimates included year and age effects, where time varied annually and with age (yr,t), linearly with age (T), in a pseudothreshold relationship with age (Tln), and no time or year variation (.). Model covariates included: hatch date (hd), brood size (bs), female size (fs) and female condition (fc), distance moved from the nest during the first week (dist), and principal components of weather during the first week after hatch (w1, w2). Hatch date, distance moved, brood size, and female size were also entered as a pseudothreshold relationship (Xln), and hatch date and brood size in a quadradic relationship (XTT). Models are ranked in accordance QAICc values and are denoted as additive models (+) or models with interaction (*).
Model Number/Name ∆QAICca QAICc
Weights
No. of
Parameters
QDeviance
1 φ(.,Tln+fs) p(.,.) 0.00 0.10 4 236.06
2 φ(.,Tln) p(.,.) 0.05 0.10 3 238.21
3 φ(.,Tln+fsln) p(.,.) 0.56 0.08 4 236.62
4 φ(.,Tln+hdln) p(.,.) 0.89 0.07 4 236.95
5 φ(.,Tln+hd) p(.,.) 1.19 0.06 4 237.25
6 φ(.,t) p(.,.) 1.39 0.05 7 231.01
7 φ(.,Tln+fc) p(.,.) 1.40 0.05 4 237.46
8 φ(.,Tln+w2) p(.,.) 1.51 0.05 4 237.57
9 φ(.,Tln*w2) p(.,.) 1.58 0.05 5 235.52
10 φ(.,Tln*fs) p(.,.) 1.92 0.04 5 235.86
11 φ(.,Tln+hdTT) p(.,.) 2.10 0.04 4 238.17
12 φ(.,Tln+bs) p(.,.) 2.11 0.04 4 238.18
13 φ(.,Tln+bsln) p(.,.) 2.12 0.04 4 238.19
14 φ(.,Tln+bsTT) p(.,.) 2.12 0.04 4 238.19 alowest QAICc value = 244.30
69

Table 5.4 Top 9 of 17 candidate models used to investigate apparent survival (φ), resighting probability (p), and movement (Ψ) of marked King Eider broods that moved from Karrak Lake, the primary brood area, to other lakes, ponds, or rivers away from Karrak Lake. Models are based on observations of marked broods resighted with radio-marked females at Karrak Lake, Nunavut in 2000 and 2001. Parameter estimates included year and full time effects where time varied annually and with duckling age (yr,t), linearly with time (T), in a pseudothreshold relationship with time (Tln) and no time or year variation (.). φ and p were estimated for ducklings observed on Karrak Lake (K) or on other habitats (O) and movement of ducklings from Karrak to other habitats (K-O) or movements back to Karrk Lake (O-K). Models are ranked in accordance QAICc values and are denoted as additive models (+) or models with interaction (*). Model Number/Name ∆QAICc
a QAICc
Weights
No. of
Parameters
QDeviance
1 φK(.,Tln) φO(.,t) pK(yr,t) pO(.,t) ΨK-O(yr,t) ΨO-K(yr,t) 0.00 0.52 30 197.93
2 φK(.,t) φO(.,t) pK(yr,t) pO(.,t) ΨK-O(yr,t) ΨO-K(yr,t) 1.30
0.27 34 189.93
3 φK(.,t) φO(yr,t) pK(yr,t) pO(.,t) ΨK-O(yr,t) ΨO-K(yr,t) 3.46 0.09 35 189.72
4 φK(.,T) φO(.,t) pK(yr,t) pO(.,t) ΨK-O(yr,t) ΨO-K(yr,t) 4.05 0.07 30 201.98
5 φK(yr,t) φO(yr,t) pK(yr,t) pO(.,t) ΨK-O(yr,t) ΨO-K(yr,t) 7.09 0.01 38 186.22
6 φK(yr,t) φO(yr,t) pK(yr,t) pO(.,t) ΨK-O(yr,t) ΨO-K(yr,2000t, 2001.) 7.09 0.01 38 186.22
7 φK(.,Tln) φO(.,t) pK(yr,t) pO(.,t) ΨK-O(yr,t) ΨO-K(yr,t) 7.95 0.01 30 205.88
8 φK(.,t) φO(.,.) pK(yr,t) pO(.,t) ΨK-O(yr,t) ΨO-K(yr,t) 8.79 0.01 34 197.41
9 φK(.,Tln) φO(.,Tln) pK(yr,t) pO(.,t) ΨK-O(yr,t) ΨO-K(yr,t) 9.19 0.01 31 204.81alowest QAICc value = 611.84
71
70

similar among years. Total brood loss was detected in 65% of 34 broods and accounted
for 84% of 126 ducklings. Most (77%) of the total brood loss occurred within two days
of hatch (Figure 5.2). No mortality occurred after 14 days of age, but, due to high
mortality of very young ducklings, composite survival to 24 days of age was estimated
as 0.10 (95%CI = 0.05 to 0.15) for ducklings accompanied by radio-marked females,
0.16 (95%CI = 0.12 to 0.22) for all ducklings, and 0.31 (95% CI=0.13 to 0.50) for
broods. My data set included 6 ducklings that were abandoned by their putative
mothers, and fostered by other females with broods. In addition, I resighted four
marked ducklings (n = 3 broods) that had joined other broods, but whose putative
mothers continued to accompany siblings of the fostered ducklings.
Resighting probability of ducklings, dp , varied between years, and among duckling
ages. For ducklings that remained with radio-marked females, dp = 0.63 (95%CI=0.42
to 0.80) in 2000, and 0.75 (95%CI=0.53 to 0.92) in 2001 (Figure 5.3). For all
ducklings, dp = 0.57 (95%CI=0.37 to 0.73) in 2000, and 0.73 (95%CI=0.53 to 0.90)
in 2001. Resighting probability of broods was similar among age and years, bp = 0.76
(95%CI=0.66 to 0.83).
For analyses of ducklings that remained with radio-marked females, the best model
(QAICc weight ≈ 1.0) included combined additive effects of female size and hatch
date, and interactions between these covariates, as important contributors to variation
in duckling (Table 5.1). In general, ducklings brooded by larger females tended to
have higher survival ( = 0.54, 95% CI = 0.19 to 0.90), as did ducklings that
hatched earlier ( = -0.33, 95% CI = 0.00 to –0.65; Figure 5.4). Models also
suggested ducklings that hatched in better condition survived at a higher rate (∆QAIC
φ
fsizeβ
hatchdateβ
c
< 2; Table 5.1); however, model-averaged estimates were less precise because of
model uncertainty, and thus lacked precision ( =0.06, 95%CI=-0.15 to
0.28). Hence, I did not consider this to be an overwhelming influence on duckling
survival. For analyses of all duckling resightings, which excluded effects of adult
attributes, the top three models that included combined effects of hatch date and
duckling condition
nditionducklingcoβ
71
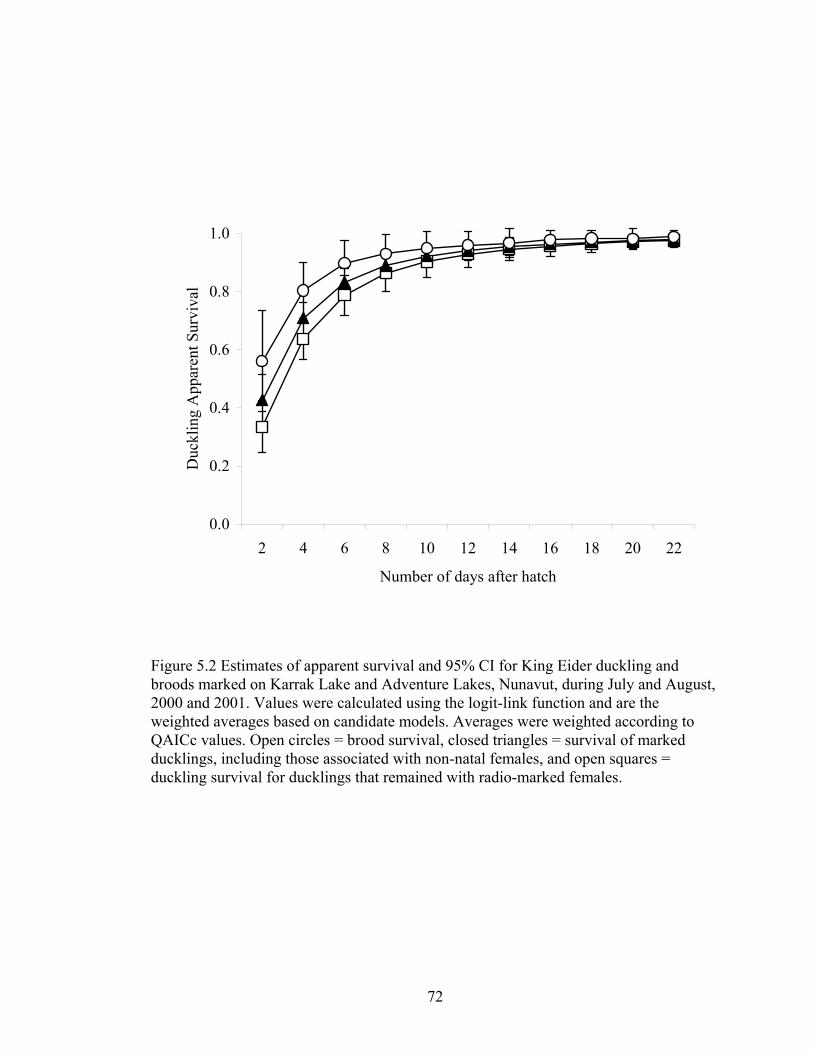
0.0
0.2
0.4
0.6
0.8
1.0
2 4 6 8 10 12 14 16 18 20 22
Number of days after hatch
Duc
klin
g A
ppar
ent S
urvi
val
Figure 5.2 Estimates of apparent survival and 95% CI for King Eider duckling and broods marked on Karrak Lake and Adventure Lakes, Nunavut, during July and August, 2000 and 2001. Values were calculated using the logit-link function and are the weighted averages based on candidate models. Averages were weighted according to QAICc values. Open circles = brood survival, closed triangles = survival of marked ducklings, including those associated with non-natal females, and open squares = duckling survival for ducklings that remained with radio-marked females.
72

0
0.2
0.4
0.6
0.8
1
1.2
2 4 6 8 10 12 14 16 18 20 22
2-day Age Interval
Res
ight
ing
Prob
abili
tym
Figure 5.3 Age dependent resighting probability and 95% CI based on weighted model averages for ducklings that were marked on Karrak and Adventure Lakes, Nunavut during summers of 2000 (solid circles) and 2001 (open circles), and resighted with radio-marked females.
73

Relative female size (PC1)
small
-0.5
-2.5
8
-1.5
1.5
0.5 large
2.5
0 2
-2
-6
Relative Hatch Date
early
6
late
1.0 0.8 0.6 0.4 0.2 0.0
-4
4
Duc
klin
g ap
pare
nt su
rviv
al
Figure 5.4 Influence of female size and hatch date on duckling apparent survival as predicted by models for ducklings that remained with radio-marked females for the first 24 days after hatch at Karrak Lake, Nunavut during 2001 and 2002. The relationship is based on weighted model averages and expresses the interaction between female size and hatch date, additive among age categories. Data are backtransformed from a logit scale ( = 0.54 [95%CI = 0.19 to 90], = -0.33 [95%CI = -0.65 to
0.00], = -0.48 [95%CI = -0.03 to –0.92]).lnfemalesizeβ ˆ
ˆlnhatchdate
β
lnln *hatchdatefemalesizeβ
74

accounted most of the model weight (weight = 0.88; Table 5.2). Model-averaged
estimates suggested improved survival with increasing duckling condition
( =0.41, 95%CI=-0.06 to 0.88), but these lacked precision in predicting
interactions with duckling condition with age ( =-0.21, 95%CI = -0.75 to
0.33). There was a negative influence of late hatching dates on survival ( = -
0.34, 95%CI = -0.08 to 0.61), an inference, although weak, was similar to that from
analyses of ducklings that remained with radio-marked females. Brood-level models
showed some support for female size and hatch date (∆QAIC
nditionducklingcoβ
ln*ˆ
Tnditioducklingcoβ
lnˆ
hatchdateβ
c < 2); however, 95% CI
for slope estimates of all covariates included zero (Table 5.3).
5.5.4 Dispersal and Duckling Survival
Brood movements > 1 km overland, i.e., no direct water link from the main lake to the
destination ponds, occurred in both years. Mean distance moved from nest locations
during the first week was similar between years ( x = 2.0 km, range = 0.1 – 4.2 km, n =
9 broods 2000; x = 2.3 km, range = 0.7 – 4.6 km, n = 6 broods 2001). Model-averaged
estimates from multistate models suggested higher survival for broods that moved to
habitats away from Karrak Lake (0.81, 95%CI = 0.60 to 1.02) than those that remained
on Karrak Lake (0.09, 95%CI = -1.70 to 1.88). All marked broods that nested on
Adventure Lake moved to Karrak Lake (n = 7) or other habitats (n = 2) within 2 days
after hatch; no broods, marked or unmarked, were observed using Adventure Lake
thereafter. Despite higher survival when using other habitats (Figure 5.5), most
ducklings remained on Karrak Lake ( OtherKarrak −Ψ = 0.05, 95%CI = -0.04 to 0.13) and
those that moved from Karrak Lake tended to remain on small ponds ( KarrakOther −Ψ =
0.04; 95%CI = -0.01 to 0.09) more often than they returned to Karrak Lake. Movement
to other habitats generally occurred during the early part of brood rearing. Lastly,
radio-marked females with broods tended to use ponds or lakes other than Karrak or
Adventure Lakes more often (35% [30/86; 2000, = 5.03, P = 0.02] 20% 2χ
75
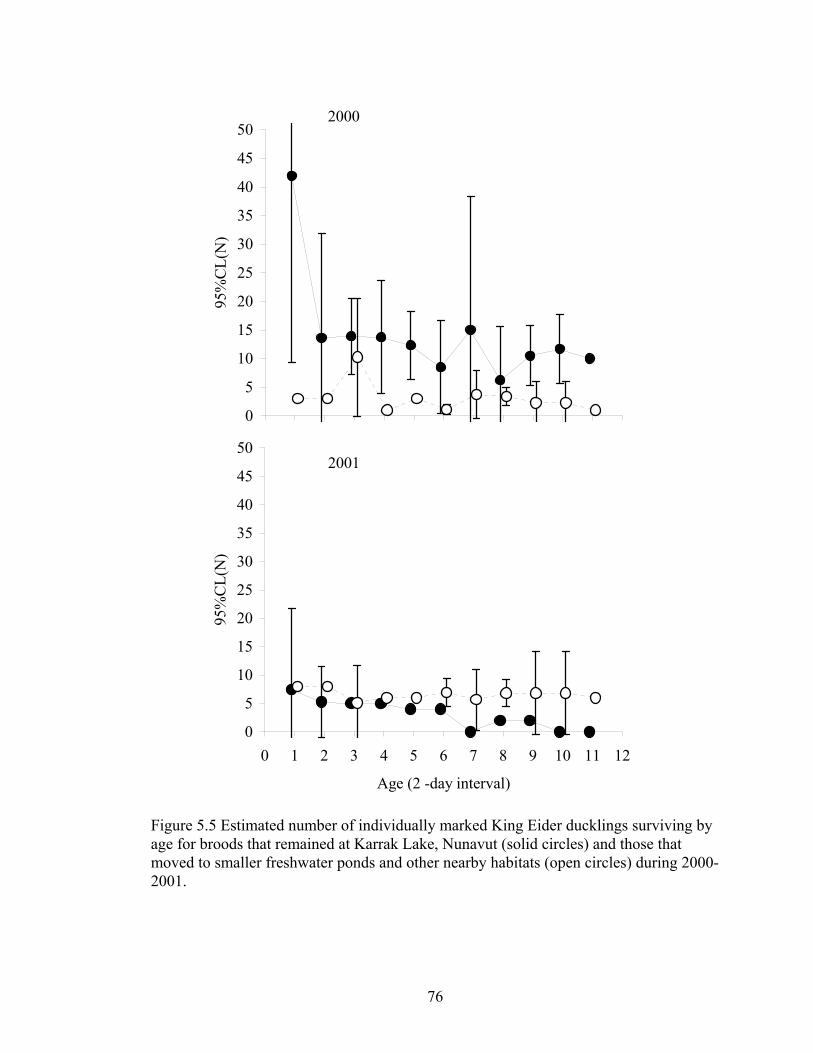
0
5
10
15
20
25
30
35
40
45
50
0 1 2 3 4 5 6 7 8 9 10 11 12
Age (2-day interval)
95%
CL(
N)
2000
0
5
10
15
20
25
30
35
40
45
50
0 1 2 3 4 5 6 7 8 9 10 11 12
Age (2 -day interval)
95%
CL(
N)
2001
Figure 5.5 Estimated number of individually marked King Eider ducklings surviving by age for broods that remained at Karrak Lake, Nunavut (solid circles) and those that moved to smaller freshwater ponds and other nearby habitats (open circles) during 2000-2001.
76

[10/50;2001, = 129.92, P < 0.01] of brood resightings) than females that
experienced total brood loss (22% [26/119;2000] and 3% [2/54;2001] of resightings)
or failed nesters (12% [7/30;2000] and 11% [15/138;2001]of resightings). Nest failure
and total brood loss resulted in females leaving the study area before those with
surviving ducklings (Table 5.5).
2χ
5.6 DISCUSSION
These estimates are the first for duckling survival in King Eiders, which were similar
to survival rates reported for closely-related Common Eiders Somateria mollissima (17
yr x =10%, Mendenhall and Milne 1987; 1 yr estimate = 19%, Flint et al. 1998). Most
duckling mortality in King Eiders occurred shortly after hatch and was largely the
result of total brood loss, as is common in most waterfowl (Campbell 1975, Talent et
al. 1983, Orthmeyer and Ball 1990, Mauser et al. 1994). Comparatively, King Eider
duckling survival was considerably lower than that estimated for Spectacled Eider
ducklings Somateria fischeri in Alaska (3 year estimate = 34%; Flint and Grand 1997).
Such differences may reflect fluctuations in annual productivity rates, in that some
years yield considerable higher fledging rates relative to other years (Mendenhall
1974, Coulson 1984, Mendenhall and Milne 1985). As well, predator communities
likely differ between areas and may contribute to differences in duckling survival.
Similar to Common Eiders (Campbell 1975, Mawhinney and Diamond 1999), gull
predation (Larus hyperboreus, Larus argentatus) was likely the greatest cause of
mortality for King Eider ducklings. King Eider ducklings inhabit tundra lakes with no
emergent aquatic vegetation in which to escape predators. This leaves diving by
ducklings, or active defense of broods by attending females, as the only means of
escape from or deterrence to foraging gulls. Duckling motor skills are least developed
shortly after hatch (Anderson 2000), rendering the youngest ducklings most vulnerable
to predation (Campbell 1975, Mendenhall and Milne 1985). Survival to fledging may
be lower than that reported in this study if mortality continued to occur after 24 days
following hatch. However, as in most other studies of duckling survival (Orthmeyer
and Ball 1990, Mauser et al. 1994, Flint and Grand 1997), I found that most mortality
occurred
77

Table 5.5 Mean number of days after hatch or nest failure that radio-marked female King Eiders at Karrak Lake, Nunavut, were resighted during 2000-2001. 2000 2001
Status Mean
(n)
95%
CI
Mean
(n)
95% CI
Brooding females 25 (9) 22 - 26 22 (4) 15-27
Females with total brood loss 16 (14) 14 - 17 17 (8) 15-20
Failed nesters 10 (7) 5 - 14 15 (17) 12-17
78

early during the brood-rearing period and I observed no mortality between 14 and 24
days of duckling age. Moreover, ducklings closely resembled adults on the water and
did not dive or try to elude gulls by the end of the study period.
Ducklings brooded by larger females survived at a higher rate than ducklings
brooded by smaller females. I suggest such size related advantages were due to a
composite of different factors, to include (1) more efficient use of reserves (Kendeigh
1969, Kendeigh 1970, Calder 1974) that enabled larger females to spend less time
foraging (Goudie and Ankney 1986) and more time in vigilance to detect impending
gull attacks; (2) a correlation with greater physical strength and increased
maneuverability, improving the success of larger females at defending against
predation attempts by gulls; or (3) an indirect effect of size related to the tendency for
larger females to be more experienced breeders. Previous breeding experience has been
linked with increased breeding success (Raveling 1981, Aldrich and Raveling 1983)
and greater breeding propensity by larger females, suggests these individuals breed
more often, relative to smaller females (Chapter 3). However, I observed no correlation
between hatch date and female size, suggesting that, if larger females are more
experienced breeders, then experience does not influence nest initiation date. Finally,
these data suggest that advantages of female size may be reduced if nesting is delayed
(Figure 5.4). I suggest that larger females may have greater success at defending
against gull predation and that this has the greatest impact on offspring survival earlier
in the season when gull attacks are fewest (Bedard and Munro 1976) . I also consider
that advantages of female size may, in part, be due to maternal effects if King Eiders
exhibit natal philopatry to brood-rearing sites. For instance, larger adult size may have
been due to use of nutrient rich brood-rearing areas during the early stages of life and,
the return of females to raise their own broods in these nutrient rich areas may lead to
higher duckling survival (Sedinger et al. 1995, Cox et al. 1998).
Alternatively, larger females may have been more likely to brood their own young,
relative to smaller females. Such abandonment by smaller females may have increased
mortality among their ducklings until acceptance by foster females and their broods.
However, observations of marked ducklings that had mixed with non-marked broods,
while natal females continued to independently care for marked siblings, suggest that
79

accidental brood mixing is likely to occur. Brood amalgamation among King Eiders
was relatively uncommon compared to that observed in Common Eiders (Bedard and
Munro 1976) and White-winged Scoters Melanitta fusca deglandi (Brown and Brown
1981, Traylor 2003). Although the significance of amalgamations remains unclear, my
data did not provide evidence that King Eiders abandon their young entirely to the care
of others. Rather, evidence for temporary abandonment suggests that King Eider
females may leave their broods for short periods of foraging or in search of better
brood-rearing areas (see Afton and Paulus 1992). During periods of temporary
abandonment, ducklings may join with other broods that share the same habitat and, if
female-young recognition is not developed, brood mixing may lead to some natal
females brooding young other than their own, as suggested by observations of one
female caring for the correct number of ducklings, but where only one was her own.
Total brood loss by a natal female, in the presence of marked ducklings that had joined
other broods, may give the false impression of abandonment. If so, estimates of
duckling survival for those that remained with radio-marked females are likely to be
most accurate.
I found that King Eider broods remain on freshwater habitats throughout the first
24 days of the brood-rearing period, contrary to movements by coastal-nesting
conspecifics toward marine habitats after hatch (at sea ~15 days after hatch; Parmelee
et al. 1967). Residents on local freshwater ponds may realize benefits from familiarity
with local predators and safe roosting sites (Greenwood 1980). I did not continue
observations until the fledgling stage, so females and broods may have used rivers to
reach marine habitats after my observations ceased. Data suggest that females without
young leave breeding areas earlier than those females with young, suggesting that
unsuccessful females may have moved toward ocean habitats (~60 km) to molt
(Suydam 2000). In contrast, I observed brood females molting on freshwater habitats.
Brood movements away from the main nesting lakes resulted in increased duckling
survival, because smaller freshwater ponds (1) provided improved foraging (see Cox et
al. 1998), (2) had lower densities of foraging gulls than Karrak or Adventure Lakes, or
(3) provided sheltered areas from the wind, as winds on larger lakes may separate
broods and aid in gull attacks (see Gilchrist et al. 1998, Traylor 2003). With such
80

disadvantage in remaining on large lakes, I wonder why more broods did not disperse
to ponds. However, most overland movements to ponds occurred soon after hatch
when duckling motor skills were least developed, so overland movement may have
increased mortality (see Ball et al. 1975). Nevertheless, once broods reached ponds,
they survived at a far greater rate than on either Karrak or Adventure Lake.
5.7 CONCLUSION
My results suggest that adult female body size can have an important influence on
duckling survival. Use of individually-marked ducklings and nesting hens, and use of
models that account for detection probability provided a useful approach to estimation
of survival while accounting for brood abandonment. Furthermore, use of radio-
telemetry allowed continued detection of ducklings that had dispersed to smaller ponds
away from the primary nesting by King Eiders. Otherwise, my estimates of true
duckling survival would have been seriously biased low if my attention remained
focused solely on the large lakes from which ducklings hatched. Without complete
ability to detect live ducklings that had dispersed from Karrak and Adventure Lakes,
disappearance of ducklings from the study area due to brood dispersal would have
been considered as mortality. Research that combines these approaches is needed to
provide unbiased estimates for which proper inferences about variation in offspring
survival can be drawn. Future studies that incorporate cross-fostering experiments are
needed to help tease apart maternal effects on covariates to survival.
81

6. SYNTHESIS
My main research objectives were to examine (1) population dynamics and (2) brood
ecology of King Eiders in order to better understand factors responsible for growth of a
local population. The study focused on: 1) linking breeding and wintering areas in an
effort to understand cross-seasonal effects of winter area on subsequent breeding
success; 2) estimating female adult survival and assessing the influence of survival and
recruitment on population growth; 3) examining potential costs to breeding; and lastly,
4) estimating duckling and brood survival and investigating factors that influence this
vital parameter.
At the start of this research, there was little information available about the
breeding ecology of King Eiders, other than estimates of nest success (Kellett and
Alisauskas 1997, 2000, Kellett et al. 2003). Estimates of other vital rates are critical
prerequisites for understanding apparent declines in range-wide abundance of North
American breeding populations (Suydam et al. 2000, Mosbech and Boertmann 1999).
Improved knowledge about factors that influence population growth, or its component
vital rates, permits prediction about population response to future ecological change
(Berryman 2002). The goal of this research therefore, was to evaluate ecological
processes underlying observed dynamics of a free-ranging population, using
empirically based models from which prescriptions for conservation and management
of King Eiders could be drawn.
Information on movements among wintering areas is imperative to understand King
Eider population boundaries and thereby, population demographics (Berryman 2002,
Pulliam 1988). In chapter 2, I discuss migration patterns and winter philopatry of
female King Eiders breeding in the central arctic and demonstrate the implications to
North American King Eider populations. King Eiders that breed in North America are
currently thought to be from two separate breeding populations whose boundaries are
82

based on discrete wintering areas in the Northern Pacific and Northern Atlantic regions
(Suydam 2000). However, analyses of King Eider population genetics suggest that
these populations are not genetically distinct, implying that population mixing occurs
(Pearce et al 2004), but the timing and extent of mixing remained unknown.
I found that female King Eiders do not exhibit strong philopatry to wintering areas
and show about 30% dispersal among winter areas annually. Pair formation by King
Eiders occurs on the wintering areas (Suydam 2000), and evidence of dispersal are
consistent with lack of phylogeographic structure between Atlantic and Pacific
populations. Consequently, I suggest that North American King Eiders that winter in
Atlantic and Pacific seas be treated as one metapopulation rather than two (see
Berryman 2002). Low winter philopatry suggests that familiarity with local food
resources and predators (Bustnes and Erikstad 1993, Anderson et al. 1992) are not as
important for female eiders. Higher dispersal may be mediated by gregarious flocking
behavior during winter (Suydam 2000) which may be adaptive if such flocks serve as
information-centers about productive foraging areas (Brown 1988, Dall 2002).
Analysis of stable isotopes in feathers, combined with banding efforts, offer a method
of monitoring gene flow directly through dispersal and subsequent breeding success
thus, allowing for broad-scale inferences useful for understanding population
demography.
In Chapter 3, I discuss results from mark-recapture data from Karrak Lake,
Nunavut, during 1995-2002. Based on recaptures of female King Eiders of known
breeding age, King Eiders were at least 3-5 years old at the time of their first breeding
attempt. Such delayed maturity places greater importance on adult survival for
population growth and stability as it creates a lag time for recruitment (Rockwell et al.
1997, Crone 2001). Thus, if populations decline, recovery periods are slower relative
to species with early maturity. Despite apparent population declines across North
America, my study population of individually-marked females grew by about 20%
year-1 from 1995-2002 (Chapter 3). For most long-lived species, adult survival
probability represents a greater fraction of population growth rate than does
recruitment/female partly because adult survival governs how often individuals will
breed over a lifetime (Rockwell et al. 1997, Nichols et al. 2000, Crone 2001). I found
83

that King Eider adult survival was high (87%) and was a greater component (72%) of
population growth rate than was recruitment (28%). I found no evidence that body size
influenced survival or age of first successful breeding. However, survival was a greater
contributor to population growth rate in larger individuals than it was in smaller
conspecifics, suggesting that larger individuals tend to remain in the population with
greater consistency than did smaller birds. In contrast, smaller individuals are likely to
show greater probability of recruitment. I suggest that contributions to population
growth by larger sized females may reflect more frequent and successful breeding
attempts, as recapture rates were highest for larger females. Because I was only able to
capture females on the nest during mid-late incubation, failed or missed nesting
attempts led to lower recapture rates.
Given that an individual decides to breed, life-history theory assumes that trade-
offs exist between various traits. For instance, increased breeding effort is assumed to
decrease survival (Williams 1966, Renzick 1985, Stearns 1992). In Chapter 4, I
investigated patterns in King Eider nest success and female breeding condition related
to potential reproductive costs and investigated the influence of annual median nest
initiation on parameter estimates. I used annual nest initiation dates as these dates act
as a surrogate to annual weather patterns (Schamel 1977, Abraham and Finney 1986,
Suydam 2000). I found no evidence that nest initiation influenced transition to
successful state or greater probability of being in good condition. Also, I found no
evidence for reproductive costs in terms of future survival. However, I did find that
successful nesters were easier to capture. Because I captured individuals only during
mid-late incubation, nonbreeding or early nest failure were confounded, either of
which can be viewed as temporary emigration from those available for capture.
Consequently, I suggest that individuals that nested successfully bred more frequently
or, at least were more frequently successful relative to failed nesters. In addition, I
found that the proportion of the population that nested successfully declined over the
course of the study. Given population growth rate of 20% (Chapter 3) over the same
period, these declines are consistent with density-dependence or possible changes in
local population age-structure. Moreover, temporal patterns in Mayfield nest success
(defined as the probability of nesting successfully given that an attempt was made)
84

differed from the proportion of the population that nested successfully. This has
important implications to population dynamics, as the proportion of successful nesters
affects recruitment directly. This suggests that Mayfield nest success estimates
currently used in population projections (Flint et al. 1998, Hoekman et al. 2002) may
not reflect proportional success. These results emphasize the importance of
incorporating multi-state approaches to population models (Fujiwara & Caswell 2002)
in order to account for the proportion of breeders and ultimately, lead to a better
understanding of demographics.
Lastly, brood ecology may be a key component of population dynamics because
this period is an important to recruitment (Johnson et al 1992, Sedinger 1992). Thus, in
chapter 5, I modeled duckling and brood survival to gain a better understanding of
factors that affect this component of the life cycle. As found in most waterfowl studies,
mortality (84%) was largely the outcome of total brood loss (Ringelman and Longcore
1982, Mauser et al 1994, Korschgen et al 1996). Furthermore, 77% of complete brood
losses occurred within 2 days of hatch. Relatively few (about 10-16%) King Eider
ducklings fledged. Nevertheless, such low levels of duckling survival may still be
sufficient to result in local population growth with comparatively high probabilities of
annual adult survival (Mendenhall and Milne 1987). In general, ducklings brooded by
larger females had higher survival than did ducklings from earlier hatching nests. I
suggest that if larger females successfully breed more frequently (see Chapter 2), they
would have greater experience and experience may increase their likelihood of
fledging young. Unfortunately, the two years of data from this study supply little
information on temporal variation in duckling survival. Therefore, longer-term studies
are necessary to better understand this variation. In addition, increased effort to mark
ducklings at the nest and at the juvenile stage are required for improved estimation of
juvenile survival and in situ recruitment.
In conclusion, results from this study have contributed to a more comprehensive
understanding of waterfowl demography in general, and of King Eider ecology in
particular. I combined banding data with isotope analysis to address theories on
waterfowl dispersal patterns, and link breeding and wintering areas. This information
is crucial to understand demography of King Eider, as it provided evidence of changes
85

in migration pathways, in turn leading to gene flow among populations. This study also
uncovered key information on adult survival and proportional contributions (survival
and recruitment) to growth of a local population. I was able to address theories
concerning benefits of size in northern climates (Fretwell 1978). Such knowledge is
important as it provides insight into selection pressures. In addition, I demonstrated the
occurrence of potential nonbreeding and showed trends in declining probabilities of
nesting successfully, as well as declining proportion of individuals in good condition.
This information is of special importance as it has implications to density-dependent
regulation, and it emphasizes the need to account for proportions of individuals
breeding if we are to better understand population dynamics. Lastly, my data about
duckling survival and habitat use offered insight about events that affect King Eider
productivity. For example, I found benefits to larger maternal body size in terms of
duckling production and show the importance of habitat choice on duckling survival.
Overall, my study emphasizes the complexities of population dynamics and provided
insight into ecological pressures that have helped to shape King Eider ecology. My
data indicate that larger females have a higher frequency of successful nesting and that
ducklings raised by larger females, provided a relative early hatch date, survive at a
higher rate. This suggests some support for Fretwell’s body size hypothesis, that larger
size is favored; however, such fitness benefits occur through recruitment only, with
recruitment contributing fewer overall benefits to fitness, relative to that of survival.
Fitness benefits incurred only through recruitment would have lower selection pressure
and this may partially explain the maintenance of high heritability of this trait.
Future information needs for conservation of King Eiders include gaining more
precise estimates of trend data specifically, monitoring population growth at multiple
breeding colonies to establish comparison data at local sites elsewhere. Data from
multiple colonies can provide data on immigration rates (Nichols et al. 2000) while
continued efforts to mark young at the nest site are important to separate in situ
recruitment from immigration, and understand those factors that ultimately affect
recruitment. Lastly, dispersal among eastern and western populations and the
importance of adult survival to population growth highlights the need for management
86

efforts to monitor adult mortality through careful regulation of hunting and other
factors that may limit adult survival rates throughout the population.
87

7. LITERATURE CITED
Abraham, K. F., and G. H. Finney. 1986. Eiders of the Eastern Canadian Arctic, p. 55-73. In A. Reed [ed.]. Eider ducks in Canada. Canadian Wildlife Service Report Series 47. Ottawa, ON, Canada.
Afton, A.D. and S.T. Paulus. 1992. Incubation and brood care. Pages 62-108 in
Ecology and Management of Breeding Waterfowl (B. D. J. Batt, A. D. Aftton, M. G. Bellrose, F. C. 1976. Ducks, geese, and swans of North America. Stackpole books, Harrisburg, Pennsylvania.
Akaike, H. 1985. Prediction and entropy. Pages 1-24 in A.C. Atkinson and S. E.
Fienberg, eds. A celebration of statistics: the ISI centenary volume. Springer-Verlag, New York.
Aldrich, T. W. and D. G. Raveling. 1983. Effects of experience and body weight on
incubation behavior of Canada Geese. Auk 100:670-679. Alexander, St. A. , D. L. Dicdson, and S. E. Westover. 1997. Spring migration of
eiders and other waterbirds in offshore areas of the western Arctic. Pages 67 – 74 in D. L. Dickson, editor. King and common eiders of the western Canadian Arctic. Canadian Wildlife Service, Occasional Paper No. 94.
Alisauskas, R.T., and C. Ankney. 1990. Body size and fecundity in Lesser Snow
Geese. Auk 107: 440-446. Alisauskas, R. T. 2002. Arctic climate, spring nutrition, and recruitment in mid-
continent Lesser Snow Geese. Journal of Wildlife Management 66:181–193. Anderson, D. J. and P.J. Hodum. 1993. Predator behavior favors clumped nesting in
oceanic seabirds. Ecology 74:2462-2464. Anderson, M. G., and R. D. Titman. 1992. Spacing patterns. Pages 251-289 in B.
Anderson, M. G., M. S. Lindberg, R. B. Emery. 2001. Probability of survival and breeding for juvenile female canvasbacks. Journal of Wildlife Management 65:385-397.
Anderson, M. G., R. B. Emery, and T. W. Arnold. 1997. Reproductive success and female survival affect local population density of canvasbacks. Journal of Wildlife Management 61: 1174-1191.
88

Anderson, V. R. 2000. Egg size, duckling composition, growth and motor performance in King Eiders (Somateria spectabilis). M.Sc. thesis, University of Saskatchewan, Saskatoon, SK, Canada.
Ankney, C. D. 1979. Does the wing molt cause nutritional stress in lesser snow geese?
Auk 96:68-72. Babcock, CA, Fowler, AC, and Ely, CR. 2002. Nesting ecology of Tundra Swans on
the coastal Yukon-Kuskokwim Delta, Alaska. Waterbirds 25:236-241. Suppl. 1 Ball, I. J., D.S. Gilmer, L. M. Cowardin, and J. H. Riechman. 1975. Survival of wood
duck and mallard broods in north-central Minnesota. Journal of Wildlife Management 39:776-780.
Barker, R. J. 1997. Joint modeling of live recapture, tag-resight, and tag-recovery data.
Biometrics. 53: 666-677. Barry, T. W. 1986. Eiders of the western Canadian Arctic. Pages 74-80 in A. Reed,
editor. Eider Ducks in Canada. Canadian Wildlife Service Report Series No. 47. Barton, N. H. 1983. Multilocus clines. Evolution 37:454–471. Batt, B. J., A. D Afton, M. G. Anderson, C. D. Ankney, D. H. Johnson, J. A. Kadlec,
and G. L. Krapu, eds. Ecology and management of breeding waterfowl. University of Minnesota Press, Minnesota.
Bedard, J. and J. Munro. 1976. Brood and crèche stability in the common eider of the
St. Lawrence Estuary. Behaviour 60:221-235. Bellrose, F. C. 1980. Ducks, geese, and swans of North America. Stackpole books,
Harrisburg, Pennsylvania. Berryman, A. A. 2002. Population: a central concept for ecology? Oikos 97:2002. Blackenhorn, W. U. 2000. The evolution of body size: what keeps organisms small?
Quarterly Review of Biology 75:385-407. Blums, P., A. Mednis, and J. D. Nichols. 1994. Retention of web tags and plasticine-
filled leg bands applied to day-old ducklings. Journal of Wildlife Management 58:76-81.
Boag, P. T. 1983.The heritability of external morphology in Darwin’s finches
(Geospiza) on Isla Daphne Major, Galápagos. Evolution 37:877-894. Boag, P. T. and Grant. 1978. Heritability of external morphology in Darwin’s finches.
Nature 274:793-794.
89

Brook, R. W., and R. G. Clark. 2002. Retention and effects of nasal markers and subcutaneously implanted radio transmitters on breeding female Lesser Scaup. Journal of Field Ornithology 73:206-212.
Brown, P. W., and M. A. Brown. 1981. Nesting biology of the white-winged scoter.
Journal of Wildlife Management 45:38-45. Brown, C. R. 1988. Enhanced foraging efficiency through information centers: a
benefit of coloniality in Cliff Swallows. Ecology 69:602–613. Brownie, C., D. R. Anderson, K. P. Burnham and D. S. Robson 1985. Statistical
inference from band recovery data – a handbook, 2nd edition. U.S. Fish and Wildlife Service, Resources Publication 156. Washington, DC.
Brownie, C., J. E. Hines, J. D. Nichols, K. H. Pollock, and J. B. Hestbeck. 1993.
Capture-recapture studies for multiple strata including non-Markovian transitions. Biometrics 49: 1173-1187.
Bull, J. J., C. Thompson, N. Ng, and R. Moore. 1987. A model for natural selection of
genetic migration. American Naturalist 129:143–157. Burnham, K. P., and D. R. Anderson. 1992. Data-based selection of an appropriate
biological model: the key to modern data analysis, p. 16–30. In D. R. McCullough and R. H. Barrett [eds.], Wildlife 2001 populations. Elsevier, New York.
Burnham, K. P., and D. R. Anderson. 2002. Model selection and multimodel
inference: a practical information-theoretic approach – 2nd edition. Springer-Verlag, New York, Inc. New York, New York.
Byers, T. and D. L. Dickson. 2001. Spring migration and subsistence hunting of king
and common eiders at Holman, Northwest Territories, 1996-1998. Arctic 54:122-134.
Calder, W. A., III. 1974. Consequences of body size for avian energetics. Pages 86-151
in Avian energetics (R.A. Paynter, Jr., Ed.). Nuttall Ornithological Club Publication 15.
Cam, E., J. E. Hines, J-Y Monnat, J. D. Nichols, and E. Danchin. 1998. Are adult non-
breeders prudent parents? The kittiwake model. Ecology 79: 2917-2930. Campbell, L. H. 1975. Predation on eiders Somateria mollissima by the glaucous gull
Larus hyperboreus in Spitsbergen. Ornis Scand. 6:27-32. Clutton-Brock, T. H., E. F. Guinness, and S. D. Albon. 1982. Red Deer – behavior and
ecology of two sexes. University Chicago Press, Chicago.
90

Christensen, T. K. 1999. Effects of cohort and individual variation in duckling body condition on survival and recruitment in the Common Eider Somateria mollissima. Journal of Avian Biology.
Christensen, K. D., and K. Falk. 2001. Status of the Common Eider breeding in the
municipality of Avanersuaq (Thule) north-west Greenland. Polar Research 20:109–114.
Cooch, E. G. 2002. Fledging size and survival in snow geese: timing is everything (or
is it?). Journal of Applied Statistics 29:143-162. Cooch, E, R. F. Rockwell, and S. R. Brault. 2001. Retrospective analysis of
demographic responses to environmental change: A Lesser Snow Goose example. Ecological Monographs 71:377-400.
Cooke, F., C. D. MacInnes, and J. P. Prevett. 1975. Gene flow between breeding
populations of Lesser Snow Geese. Auk 92:493–510. Cooke F, and C. S. Findlay. 1982. Polygenic variation and stabilizing selection in a
wild population of lesser snow geese (Anser caerulescens caerulescens). American Naturalist 120:543-547.
Cooke F, C. S. Findlay, R. F. Rockwell. 1984. Recruitment and timin of reproduction
in lesser snow geese (Chen caerulescens caerulescens). Auk 101: 451-458. Cooke, F., G. J. Robertson, C. M. Smith, R. I . Goudie, and W. S. Boyd. 2000.
Survival, emigration and winter population structure of Harlequin Ducks. Condor 102:137–144.
Cormack, R. M. 1964. Estimates of survival from the sighting of marked animals.
Biometrika. 51:429-438. Cotter, R. C., D. L. Dickson, and C. J. Gratto. 1997. Breeding biology of the king eider in
the western Canadian Arctic. In King and common eiders of the western Canadian Arctic (D.L. Dickson, Ed.), pages 51-57. Canadian Wildlife Service Occasional Paper, No. 94
Coulson, J. C. 1984. The population dynamics of the eider duck Somateria mollissima
and evidence of extensive non-breeding by adult ducks. Ibis 126: 525-543. Cowardin, L. M. and R. J. Blohm. 1992. Breeding population inventories and measures
of recruitment. Pages 423-445 in B. D. J. Batt, A. D. Afton, M. G. Anderson, C. D. Ankney, D. H. Johnson, J. A. Kadlec, and G. L. Krapu, eds. Ecology and management of breeding waterfowl. University of Minnesota Press, Minneapolis.
91

Cox, R. R., M. A. Hanson, C. C. Roy, N. H. Euliss, jr, D. H. Johnson, M. G. Butler. 1998. Mallard duckling growth and survival in relation to aquatic invertebrates. Journal of Wildlife Management 62:124-133.
Crone, E. E. 2001. Is survivorship a better fitness surrogate than fecundity? Evolution
55:2611-2614. Davidson, N.C. 1981. Survival of shorebirds (Charadrii) during severe weather: the
role of nutritional reserves. Pages 231-249 in N.V. Jones, W.J.Wolf, editors. Feeding and survival strategies of estuarine organisms. Plenum Press, New York, USA.
Dawson, R. D., and R. G. Clark. 2000. Effects of hatching date and egg size on growth,
recruitment, and adult size of Lesser Scaup. Condor 102:930-935. DeNiro, M.J., S. Epstein. 1978. Influence of diet on the distribution of carbon
isotopes in animals. Geochimica et Cosmochimica Acta 42:341-351. Dierschke, V. 1998. Site fidelity and survival of Purple Sandpipers Calidris maritima
at Heligoland (SE North Sea). Ringing and Migration 19:41–48. Dinsmore, S. J., G. C. White, and F. L. Knopf. 2002. Advanced techniques for
modeling avian nest survival. Ecology 83:3476-3488. Doherty, P. F., J. D. Nichols, J. Tautin, J. F. Voelzer, G. W. Smith, D. S. Benning, V.
R. Bentley, J. D. Bidwell, K. S. Bollinger, A. R. Brazda, E. K. Buelna, J. R. Goldsberry, R. J. King, F. H. Roetker, J. W. Solber, P. P. Thorpe, and J. S. Wortham. 2002. Sources of variation in breeding-ground fidelity of Mallards (Anas platyrhynchos). Behavioral Ecology 13:543–550.
Drake, K. R., J. E. Thompson, K. L. Drake, and C. Zonick. 2001. Movements, habitat
use, and survival of nonbreeding Piping Plovers. Condor 103:259-267. Dufour, K. W. and R. G. Clark. 2002. Differential survival of yearling and adult female
mallards and its relation to breeding habitat conditions. Condor 104:297-308. Dunton, K. H., S. M. Saupe, A. N. Golikov, D. M. Schell, and S. V. Schonberg. 1989.
Trophic relationships and isotopic gradients among arctic and subarctic marine fauna. Marine Ecology Progress Series 56:89-97.
Dzubin, A. and E. G. Cooch. 1993. Measurements of geese: general field methods.
California Waterfowl Association, Sacramento 20 pp. Dzus, E. H., And R. G. Clark. 1997. Brood size manipulation in mallard ducks:
Effects on duckling survival and brooding efficiency. Ecoscience 4:437-445.
92

Eadie, J. M., and D. Anstey. 1999. Parasitism, population dynamics, and hybridization in cavity-nesting sea ducks, p. 80. In R. I. Goudie, M. R. Petersen, and G. J. Robertson [eds.], Behaviour and ecology of sea ducks. Canadian Wildlife Service Occasional Paper No. 100.
Endler, J. A. 1977. Geographic variation, speciation, and clines. Princeton University
Press. Princeton, New Jersey.Flint, P. L., J. B. Grand, and R. F. Rockwell. 1998. A model of Northern Pintail productivity and population growth rate. Journal of Wildlife Management 62:1110-1118.
Esler, D. 2000. Applying metapopulation theory to conservation of migratory birds.
Conservation Biology 14:366–372. Evans, P.R., M.W. Pienkowski. 1984. Population dynamics of shorebirds. Pages 83-
112, in J. Burger and B. L. Olla, editors. Behavior of marine animals. Vol. 5. Plenum Press, New York, USA.
Falconer, D.S., and T.F.C. Mackay 1989. Introduction to quantitative genetics.
Longman Scientific & Technical and John Wiley & Sons, Inc. New York. Flint, P. L. And J. B. Grand. 1997. Survival of spectacled eider adult females and
ducklings during brood rearing. Journal of Wildlife Managment 61:217-221. Flint, P. L., C. L. Moran, And J. L. Schamber. 1998. Survival of common eider
Somateria mollissima adult females and ducklings during brood rearing. Wildfowl 49:103-109.
Fournier, M. A., and J. E. Hines. 1994. Effects of starvation on muscle and organ mass
of King Eiders Somateria spectabilis and the ecological and management implications. Wildfowl 45:188–197.
France, R.L. 1995. Differentiation between littoral and pelagic foodwebs in lakes using
stable carbon isotopes. Limnology Oceanography 40:1310-1313. Franklin, A. B. 2001. Ecological relationship and Program MARK. Pages 350-356, in
D. J. Decker, T. L. Brown, W. F. Siemer, editors. Human dimensions of wildlife management in North America. Wildlife Society, Bethesda, Maryland.
Franklin, A. B., D. R. Anderson, R. J. Gutierrez, and K. P. Burnham. 2000. Climate,
habitat quality, and fitness in northern Spotted Owl populations in northwestern California. Ecological Monographs 70:539-590.
Frederiksen, M. J. D. Lebreton, T. Bregnballe. 2001. The interplay between culling and
density dependence in the Great Cormorant: a modelling approach. Journal of Applied Ecology 38:617-627.
93

Fretwell, S. D. 1972. Populations in a seasonal environment. Princeton University Press, Preinceton, New Jersey.
Frimer, O. 1994. The behaviour of moulting King Eiders Somateria spectabilis.
Wildfowl 45:176-187. Frimer, O. 1997. Diet of moulting King Eiders Somateria spectabilis at Disko Island,
West Greenland. Ornis Fennica 74:187-194. Fry, E.B. 1988. Food web structure on Georges Bank from stable C, N, and S isotopic
compositions. Limnology and Oceanography 33:1182-1190. Fry, E.B. Sherr. 1984. δ13C measurements as indicators of carbon flow in marine and
freshwater ecosystems. Contributions in Marine Science 27:13-47. Fujiwara, M. and H. Caswell. 2002. Estimating population projection matrices from
multi-stage mark-recapture data. Ecology 83:3257-3265. Gaillard, J-M., M. Festa-Bianchet, and N. G. Yoccoz. 1998. Population dynamics of
large herbivores: variable recruitment with constant adult survival. Trends in Evolutionary Ecology 13:58-63.
Gilchrist, H. G., A. J. Gaston, and J. N. M. Smith. 1998. Wind and prey nest sites as
foraging constraints on an avian predator, the glaucous gull. Ecology 79:2403-2414.
Gloutney, M. L., and R. G. Clark. 1991. The significance of body mass to female
dabbling ducks during late incubation. Condor 93:811-816. Gibson, J. B. and Bradley, B. P. 1974. Stabilizing selection in constant and fluctuating
environments. Heredity 33:293-302. Götmark, F. 1992. The effect of investigator disturbance on nesting birds. Current
Ornithology 9:63-104. Goudie, R. I., and C. D. Ankney. 1986. Body size, activity budgets, and diets of sea
ducks wintering in Newfoundland. Ecology 67:1475-1482. Grant, P. R., and B. R. Grant. 1995. Predicting microevolutionary responses to
directional selection on heritable variation. Evolution 49:241-251. Grant, P. R., and B. R. Grant. 1994. Phenotypic and genetic effects of hybridization in
Darwin’s finces. Evolution 48:297-316. Greenwood. P. J. 1980. Mating systems, philopatry and dispersal in birds and
mammals. Animal Behaviour 28:1140–1162.
94

Gullion, G. W. 1951. A marker for waterfowl. Journal of Wildlife Management
15:222-223. Haig, S.M., J.H. Plissner. 1993. Distribution and abundance of Piping Plovers: results
and implications of the 1991 International Census. Condor 95:145-156. Hanssen, SA, I. Folstad, K.E. Erikstad, KE. 2003. Reduced immunocompetence and
cost of reproduction in common eiders. Oecologia, 136 (3): 457-464. Harris, M. P. and S. Wanless. 1995. Survival and non-breeding of adult Common
Guillemots Uria aalge. Ibis 137:192-197. Heitmeyer, M.E. 1986. The prebasic moult and basic plumage of female mallards
(Anas platyrhynchos). Canadian Journal of Zoology 65:2248-2261. Hestbeck, J.B. 1995. Bias in transition-specific survival and movement probabilities
estimated using capture-recapture data. Journal of Applied Statistics 22:737-750. Hill, 2003. influence of body size and condition on harvest and survival of juvenile
Canada geese. Journal of Wildlife Management 67:530-541. Hobson, K.A. 1995. Reconstructing avian diets using stable-carbon and nitrogen
isotope analysis of egg components: patterns of isotopic fractionation and turnover. Condor 97:752-762.
Hobson, K. A., 1999a. Tracing origins and migration of wildlife using stable isotopes:
a review. Oecologia 120:314–326. Hobson, K. A.. 1999b. Progress report on the use of stable-isotope analysis (δ13C and
δ15N) of King and Common eider flight feathers to link breeding origins and location of moult. Canadian Wildlife Service, Saskatoon. 7 pp.
Hobson, K. A.. and R.W. Clark. 1992. Assessing avian diets using stable isotopes II:
factors influencing diet-tissue fractionation. Condor 94:189-197. Hobson, K. A., and L.I Wassenaar. 1997. Linking breeding and wintering grounds of
neotropical migrant songbirds using stable hydrogen isotopic analysis of feathers. Oecologia109:142-148.
Hobson, K. A., and D. M. Schell. 1998. Stable-carbon and nitrogen isotope patterns in
baleen from eastern Arctic bowhead whales (Balaena mysticetus). Canadian Journal of Fisheries and Aquatic Science 55:1–7.
95

Hobson, K. A., K.P. McFarland, L.I. Wassenaar, C.C. Rimmer, and J.E. Goetz. 2001. Linking breeding and wintering grounds of Bicknell’s Thrushes using stable isotope analyses of feathers. Auk 118: 16-23.
Hobson, K. A., G. Gilchrist, K. Falk. 2002a. Isotopic investigations of seabirds of the
North Water Polynya: contrasting trophic relationships between the eastern and western sectors. Condor 104:1-11.
Hobson, K. A., A.T Fisk, N. Karnovsky, M. Holst, J.M. Gagnon, M. Fortier. 2002b. A
stable isotope (13C, 15N) model for the North Water Polynya foodweb: implications for evaluating trophodynamics and the flow of energy and contaminants. Deep Sea Research Part II: Topical Studies in Oceanography 49:5131-5150.
Hochachka, W., and Smith, J. N. M. 1991. Determinants and consequences of nestling
condition in Song Sparrows. Journal of Animal Ecology 60:995-1008. Hoekman, S. T. L. S. Mills, D. W. Howerter, J. H. Devries, and I. J. Ball. 2002.
Sensitivity analyses of the life cycle of mid-continent Mallards. Journal of Wildlife Management 55:883-900.
Johnson, D. H., G. L. Krapu, K. J. Reinecke, D. G. Jorde. 1985. An evaluation of
condition indices for birds. Journal of Wildlife Management 49:569-575. Johnson, D. H., J. D. Nichols, and M. D. Schwartz. Population dynamics of breeding
waterfowl. 1992. Pages 446-485 in B. D. J. Batt, A. D. Afton, M. G. Anderson, C. D. Ankney, D. H. Johnson, J. A. Kadlec, and G. L. Krapu, eds. Ecology and management of breeding waterfowl. University of Minnesota Press, Minneapolis.
Jolly, G. M. 1965. Explicit estimates from capture-recapture data with both dead and
immigration stochastic model. Biometrika 52: 225-247. Kellett, D. K. 1999. Causes and consequences of variation in nest success of king
eiders (Somateria spectabilis) at Karrak Lake, Northwest Territories. M.Sc. Thesis, University of Saskatchewan, Saskatoon. 85 pp.
Kellett, D. K. And R. T. Alisauskas. 1997 Breeding biology of king eiders nesting on
Karrak Lake, Northwest Territories. Arctic 50:47-54. Kellett, D. K., and R. T. Alisauskas. 2000. Body-mass dynamics of King Eiders during
incubation. Auk 117:812-817. Kellett, D. K., R. T. Alisauskas, and K. R. Mehl. 2003. Nest-site selection,
interspecific associations, and nest success of King Eiders. Condor 105: 373-378.
96

Kendall, W. L., J. D. Nichols, and J. E. Hines. 1997. Estimating temporary emigration using capture-recapture datea with Pllock’s robust design. Ecology 78:563-578.
Kendeigh, S. C. 1969. Tolerance of cold and Bergmann’s rule. Auk:86:13-25. Kendeigh, S. C. 1970. Energy requirements for existence in relation to size of bird.
Condor 60-65. Korschegen, C. E. 1977. Breeding stress of female eiders in Maine. Journal of Wildlife
Management 41:360-373. Korschgen,C. E., H. C. Gibbs, and H. L. Mendall. 1978. Avian cholera in eider ducks
in Maine. Journal of Wildlife Disease. 14:254-258. Korschgen, C. E., K. P. Kenow, W. L. Green, D. H. Johnson, M. D. Samuel, And L.
Sileo. 1996. Survival of radiomarked canvasback ducklings in northwestern Minnesota. Journal of Wildlife Management 60:120-132.
Lamothe, P. 1973. Biology of the king eider (Somateria spectabilis) in a fresh water
breeding area on Bathurst Island, N.W. T. M.Sc. Thesis, University of Alberta, Edmonton.
Lande, R. 1976. The maintenance of genetic variability by mutation in a plygenic
character with linked loci. Genetical Research 26:221-235. Lawson, J.W. and K.A. Hobson. 2000. Diet of harp seasls (Pagophilus groenlandicus)
in nearshore northeast newfoundland: inferences from stable-carbon (δ13C) and nitrogen (δ15N) isotope analysis. Marine Mammal Science 16:578-591.
Larsson, K, H. P. Van Der Jeugd, I. T. Van der Veen, and P. Forslund. 1998. Body size
declines despite positive directional selection on heritable size traits in a barnacle goose population. Evolution 52:1169-1184.
Lebreton, J. D., K. P. Burnham, J. Clobert and D. R. Anderson. 1992. Modeling
survival and testing biological hypotheses using marked animals: a unified approach with case studies. Ecological Monographs. 62: 67-118.
Lebreton, J.-D., T. Almeras, and R. Pradel. 1999. Competing events, mixtures of
information and multistratum recapture models. Bird Study 46S:39-46. Lessells, C. M., and P. T. Boag. 1987. Unrepeatable repeatabilities: a common
mistake. Auk 104:116-121.. Lindberg, M. S., J. S. Sedinger, and E. A. Rexstad. 1995. Estimating nest site fidelity
of adult female Black Brant with multi-state modeling and geographic information systems. Journal of Applied Statistics 22:725–735.
97
Lougheed, S. C., T. W. Arnold, and R. C. Bailey. 1991. Measurement error of
external and skeletal variables in birds and its effect on principal components. Auk 108:432- 436.
Machin, KL and N.A. Caulkett. 2000. Evaluation of isoflurane and propofol anesthesia
for intraabdominal transmitter placement in nesting female canvasback ducks Journal of Wildlife Diseases 36:324-334.
MacKenzie, D. I. And W. L. Kendall. 2002. How should detection probability be
incorporated into estimates of relative abundance? Ecology 83: 2387-2393. Mallory, M. L., and P. J. Weatherhead. 1993. Incubation rhythms and mass loss of
Common Goldeneyes. Condor 95:849-859. Mauser, D. M. And R. L. Jarvis. 1991. Attaching radio transmitters to 1-day-old
mallard ducklings. Journal of Wildlife Management 55:488-491. Mauser, D. M., R. L. Jarvis, D. S. Gilmer. 1994. Survival of radio-marked mallard
ducklings in northeastern California. Journal of Wildlife Management 58:82-87. Mawhinney, K, And A. W. Diamond. 1999. Using radio-transmitters to improve estimates of gull predation on common eider ducklings. Condor 101: 823-831.
Mehl, K. R., R. T. Alisauskas, K. A. Hobson, and D. K. Kellett. 2004. To winter east
or west? Heterogeneity in winter site philopatry in a central-arctic population of King Eiders. Condor in press.
Mendenhall, V. M. 1979. Brooding of young ducklings by female eiders Somateria
mollissima. Ornis Scand. 10:94-99. Mendenhall, V. M. and H. Milne. 1985. Factors affecting duckling survival of eiders
Somateria mollissima in northeast Scotland. Ibis 127:148-158. Merkel, F.R., A. Mosbech, D. Boertmann, and L. Grøndahl. 2002. Winter seabird
distribution and abundance off south-western Greenland, 1999. Polar Research 21 (1):17-36.
Michener, R.H., D.M. Schell. 1994. Stable isotope ratios as tracers in marine and
aquatic food webs. Pages 138-157 in K. Lajtha, and R.H. Michener RH, editors. Stable isotopes in ecology and environmental science. Blackwell Scientific Publications, Oxford, England.
Mizutani, H., M. Fukuda MY. Kabaya, E. Wada. 1990. Carbon isotope ratio of
feathers reveals feeding behavior of cormorants. Auk 107:400-403.
98

Mosbech, A., and D. Boertmann. 1999. Distribution, abundance and reaction to aerial surveys of post-breeding King Eiders (Somateria spectabilis) in western Greenland. Arctic 52:188–203.
Mosbech, A., and S. R. Johnson. 1999. Late winter distribution and abundance of sea-
associated birds in south-western Greenland, the Davis Strait and southern Baffin Bay. Polar Research 18:1–17.
Murphy, M.E. 1996. Energetics and nutrition of molt. Pages 31-60 in C. Carey, editor.
Avian energetics and nutritional ecology. Chapman and Hall, New York. Nichols, J. D. 1992. Capture-recapture models using marked animals to study
population dynamics. BioScience 42: 94-102.Nichols, J. D., J. E. Hines, K. H. Pollock, R. L. Hinz, and W. A. Link. 1994. Estimating breeding proportions and testing hypotheses about costs of reproduction with capture-recatpure data. Ecology. 75:2052-2065.
Nichols, J. D., J. E. Hines, K. H. Pollock, R. L. Hinz, and W. A. Link. 1994.
Estimating breeding proportions and testing hypotheses about costs of reproduction with capture-recapture data. Ecology 75:2052-2065.
Nichols, J. D. and W. I. Kendall. 1995. The use of multi-state capture-recatpure models
to address questions in evolutionary ecology. Journal of Applied Statistics, 22:835-846.
Nichols, J. D., J. E. Hines, J. D. Lebreton, and R. Pradel. 2000. Estimation of
contributions to population growth: a reverse-time capture-recapture approach. Ecology 81: 3362-3376.
O’Connor, R. J. 1984. The Growth and Development of Birds. John Wiley & Sons,
New York. Orthmeyer, D. L., and I. J. Ball. 1990. Survival of mallard broods on Benton Lake
National Wildlife Refuge in northcentral Montana. Journal of Wildlife Management 54:62-66.
Parkinson, C. L. 2000. Variability of arctic sea ice: the view from space, an 18-year
record. Arctic 53:341–358. Paquette, G. A., J. H. Devries, R. B. Emery, D. W. Howerter, B. L. Joynt, T. P.
Sankowski. 1997. Effects of transmitters on reproduction and survival of wild mallards. Journal of Wildlife Management 61:953-961.
Parmelee, D. F., H. A. Stephens, and R. H. Schmidt. 1967. The birds of southeastern
Victoria Island and adjacent small islands. National Museum of Canada Bulletin 222.
99

Pearce, J. M. S. L. Talbot, B. J. Pierson, M. R. Peteresen, K. T. Scribner, D. L. Dickson, and A. Mosbech. 2004. Population genetics of breeding and wintering King Eiders. Condor in press.
Pelayo, J. T. 2001. Correlates and consequences of egg size variation in wild ruddy ducks (Oxyura jamaicensis). M.S. thesis, University of Saskatchewan, Saskatoon. Pradel, R. 1996. Utization of cature-mark-recapture for the study of recruitment and population growth rate. Biometrics,. 53: 703-709. Pelayo, J.T., and R.G. Clark. 2003. Consequences of egg size for offspring survival: A
cross-fostering experiment in Ruddy Ducks (Oxyura jamaicensis). Auk 120:384-393.
Pietz, P. J., G. L. Krapu, R. J. Greenwood, and J. T. Lokemoen. 1993. Effects of
harness transmitters on behavior and reproduction of wild mallards. Journal of Wildlife Management 57: 696-703.
Pradel, R., C. M. A. Winterbert.T, and O. Gimenez. 2003. A proposal for a goodness-
of-fit test to the Arnason-Schwarz multisite capture-recapture model. Biometrics 59(1): 43-53
Price, T., M. Kirkpatrick, S. J. Arnold. 1988. Directional selection and the evolution of
breeding date in birds. Science. 240:798-799. Price, T.( D.) and D. Schluter. 1991. On the low heritability of life-history traits.
Evolution 45:853-861. Price, T. and T. Langen. 1992. Evolution of correlated characters. Trends in
Evolutionary Ecology. 7:307-310. Pulliam, H. R. 1988. Sources, sinks, and population regulation. American Naturalist
132:652-661. Raveling, D. G. 1981. Survival, experience, and age in relation to breeding success of
Canada geese. Journal of Wildlife Management45:817-829. Reed, E. T. G. Gauthier, R. Pradel, and J-D. Lebreton. 2003. Age and environmental
conditions affect recruitment in Greater Snow Geese. Ecology 84:219-230. Reznick, D. 1985. Cost of reproduction: an evaluation of the empirical evidence. Oikos
44:257-267. Ringelman, J. K., And J. R. Loncore. 1982. Survival of juvenile black ducks during
brood rearing. Journal of Wildlife Management 46:622-628.
100

Rising, J. D., and K. M. Somers. 1989. The measurements of overall body size in birds. Auk 106:666-674.
Robin, JP, C. Fayolle, F. Decrock, M.A. Thil, S.D. Cote, S. Bernard, R. Groscolas.
2001. Restoration of body mass in King Penguins after egg abandonment at a critical energy depletion stage: early vs late breeders. Journal of Avian Biology 32: 303-310.
Robertson, G. J., and F. Cooke. 1999. Winter philopatry in migratory waterfowl. Auk
116:20–34. Robertson, G. J., F. Cooke, R. I. Goudie, and W. S. Boyd. 1999. Within-year fidelity of
Harlequin Ducks to a moulting and wintering area, p. 45–51. In R. I. Goudie, M. R. Petersen, and G. J. Robertson [eds.], Behaviour and ecology of sea ducks Canadian Wildlife Service Occasional paper No. 100.
Rockwell, R. F., E. G. Cooch, and S. Brault. 1997. Dynamics of the mid-continent
population of Lesser Snow Geese-projected impacts of reduction in survival and fertility on population growth rates. Pages 73-100 in Arctic ecosystems in peril: report of the Arctic Goose Habitat Working Group (B. D. J. Batt, Ed). CanadianWildlife Service, Ottawa, Ontario, and U.S. Fish and Wildlife Service, Washington, D.C. SAS Institute. 1996.
Rockwell, R. F., and G. F. Barrowclough. 1987. Gene flow and the genetic structure of
populations, p. 223–255. In F. Cooke and P. A. Buckley [eds.], Avian genetics. Academic Press, London.
Rohwer, F. C., and M. G. Anderson. 1988. Female-biased philopatry, monogamy, and
the timing of pair formation in migratory waterfowl. Current Ornithology 5:187–221.
Rotella, J. J., D. W. Howerter, T. P. Sankowski, J. H. Devries. 1993. Nesting effort by
wild mallards with 3 types of radio transmitters. Journal of Wildlife Management 57:690-695.
Rotella, J. J., R. G. Clark, and A. D. Afton. 2003. Survival of female lesser scaup:
effects of body size, age, and reproductive effort. Condor 105:336-347. Rubenstein, D.R., C.P. Chamberlain, R.T. Holmes, M.P. Ayres J.R. Waldbauer, G.R.
Graves, and N.C. Tuross. 2002. Linking breeding and wintering ranges of a migratory songbird using stable isotopes. Science 295: 1062-1065.
Sargeant, A. B. S. H. Allen, and R. T. Eberhardt. 1984. Red fox predation on breeding
ducks in mid-continent North America. Wildlife Monographs 89.
101

Sargeant, A. B. and D. G. Raveling. 1992. Mortality in the breeding season. Pages 396-422 in B. D. J. Batt, A. D. Afton, M. G. Anderson, C. D. Ankney, D. H. Johnson, J. A. Kadlec, and G. L. Krapu, eds. Ecology and management of breeding waterfowl. University of Minnesota Press, Minneapolis..
SAS Institute. 1996. SAS/STAT User’s Guide, version 6, 4th ed. SAS Institute, Inc.
Cary, North Carolina, USA. Sauer. J. R. and N. A. Slade. 1987. Size-based demography of vertebrates. Annual
Review of Ecology and Systematics. 18:71-90. Saupe, S.M., D.M. Schell, W.B. Griffiths. 1989. Carbon-isotope gradients in the
western arctic zooplankton. Mar Biol 103:427-432 Schamel, D. 1977. Breeding of the common eider (Somateria mollissima) on the
Beaufort Sea coast of Alasksa. Condor:478-485. Schell, D. M., B. A. Barnett, K. A. Vinette. 1998. Carbon and nitrogen isotope ratios in
zooplankton of the Bering, Chukchi and Beaufort Seas. 162:11–23. Schell, D. M., S.M. Saupe, N. Haubenstock. 1989. Natural isotope abundances in
bowhead whale (Balaena mysticetus) baleen: markers of aging and habitat usage. Pages 231-251, in P.W. Rundel, J.R. Ehleringer, K.A. Nagy, editors. Stable isotopes in ecological research. Springer Verlag New York, USA.
Seber, G. A. F. 1970. Estimating time-specific survival and reporting rates for adult
birds from band returns. Biometrika 57: 313-318. Sedinger. J. S. 1992. Ecology of prefledging waterfowl. Pages 109-127 in B. D. J.
Batt, A. D. Afton, M. G. Anderson, C. D. Ankney, D. H. Johnson, J. A. Kadlec, and G. L. Krapu, eds. Ecology and management of breeding waterfowl. Univ. Minn. Press, Minneapolis.
Slatkin, M. 1987. Gene flow and the geographic structure of natural populations.
Science 236: 787-793. Slattery, S. M., and R. T. Alisauskas. 2002. Use of the Barker model in an experiment
examining covariate effects on first-year survival in Ross’s geese (Chen rossii): A case study. Journal of Applied Statistics 29:497-508.
Skutch. A. F. 1962. The constancy of incubation. Wilson Bulletin 74:115-152. Smith, T. B., P. P. Marra, M. S. Webster, I. Lovette, H. Gibbs, R. T. Holmes, K. A.
Hobson, and S. Rohwer. 2003. A call for feather sampling. Auk 120:218–221.
102

Stearns, S. C. 1992. The evolution of life histories. Oxford University Press, Oxford, UK.
Suydam, R.S. 2000. King eider. In A. Poole, P. Stettenheim, F. Gill [eds.], The birds
of North America, No 491. Academy of Natural Sciences, Philadelphia, and American Ornithologists’ Union, Washington, DC.
Suydam, R. S., D. L. Dickson, J. B. Fadely, and L. T. Quakenbush. 2000. Population
declines of king and common eiders of the Beaufort Sea. Condor 102:219-222. Taber, R. D. 1949. A new marker for game birds. Journal of Wildlife Mangement
13:228-231. Talent, L. G., G. L. Krapu, And R. L. Jarvis. 1982. Habitat use by mallard broods in
south central North Dakota. Journal of Wildlife Management 46:629-635. Thompson, J.E., R.D. Drobney. 1996. Nutritional implications of molt in male
canvasbacks: variation in nutrient reserves and digestive tract morphology.Condor 98:512-526.
Traylor, J. J. 2003. Nesting and duckling ecology of white-winged scoters (Melanitta
fusca deglandi) at Redberry Lake, Saskatchewan. M. Sc. Thesis, University of Saskatchewan, Saskatoon. 76 pp.
Tuomi, J., T. Hakala, E. Haukioja. 1983. Alternative concepts of reproductive effort,
costs of reproduction, and selection in Life-history evolution. American Zoologist 23:25-34.
Via, S., R. Gomulkiewicz, G. D. Jong, S. M. Scheiner, C. D. Schlichting, P. H. Van
Tienderen. 1995. Adaptive phenotypic plasticity: Consensus and controversy. Trends in Evolutionary Ecology 10:212-217.
Vince, M. A. 1969. How quail embryos communicate. Ibis: 111:441. Wassenaar, L.I., K.A. Hobson. 2000. Stable-carbon and hydrogen isotopes ratios
reveal breeding origins of red-winged blackbirds. Ecological Applications 10:911-916.
Webster, M.S., P. P. Marra, S. M. Haig, S. Bensch, and R.T. Holmes. 2002. Links
between worlds: unraveling migratory connectivity. Trends in Evolutionary Ecology 17:76-80.
Weller, M W. 1956. A simple field candler for waterfowl eggs. Journal of Wildlife
Management 20:111-113.
103

Weller, M.W. 1976. Molts and plumages of waterfowl. Pages 37-39 in F.C. Bellrose, editor. Ducks, geese, and swans of North America Stackpole Books, Harrisburg, PA, USA.
Weatherhead, P. J., and G. P. Brown. 1996. Measurement versus estimation of
condition in snakes. Canadian Journal of Zoology. 74:1617–1621. Webster, M. S., P. P. Marra, S. M. Haig, S. Bensch, and R. T. Holmes. 2002. Links
between worlds: unraveling migratory connectivity. Trends in Ecology & Evolution 17:76–80.
White, G. C. and R. A. Garrott. 1990. Analysis of wildlife radio-tracking data.
Academic Press Limited, London. White, G. C. and K. P. Burnham. 1999. Program MARK: survival estimation from
populations of marked animals. Bird Study 46: S120-139. White, G. C., K. P. Burnham, and D. R. Anderson. 1999. Advanced Features of
Program Mark. WWW.cnr.colostate.edu/~gwhite/mark/mark.htm#Documentation Williams, G. C. 1966. Natural selection, the cost of reproduction, and a refinement of
Lack’s principle. American Naturalist. 100: 687-690. Williams, B. K., J. D. Nichols, and M. J. Conroy. 2001. Analysis and management of
animal populations moldeling, estimation, and decision making. Academic Press, San Diego, California.
Wobeser, G. A. 1981. Diseases of wild waterfowl. Plenum Press, New York, New
York. Woodby, D. A., and G. J. Divoky. 1982. Spring migration of eiders and other
waterbirds at Point Barrow, Alaska. Arctic 35:403-410. Yoccoz, N. G., K. E. Erikstad, J. O. Bustnes, S. A. Hanssen, and T. Tveraa. 2002.
Costs of reproduction in common eiders (Somateria mollissima): an assessment of relationships between reproductive effort and future survival and reproduction based on observational and experiemental studies. Journal of Applied Statistics 29:57-64.
Zar, J. H. 1999. Biostatistical analysis fourth edition. Prentice-Hall, Inc. Upper Saddle
River, NJ.
104

APPENDIX A. INFLUENCE OF SUBCUTANEOUS MOUNT TRANSMITTERS
AND USE OF PROPOFOL ON NEST SUCCESS OF BREEDING FEMALE
KING EIDERS
A.1 INTRODUCTION
Radio telemetry is an effective tool useful for understanding movements and survival
rates. Information gained from its use can lead to less biased results when estimating
survival, if marked individuals undertake permanent movements to habitats where they
would otherwise be unobserved (see Lebreton et al. 1992). Telemetry can also be
essential in obtaining reliable estimates of habitat use (Drake et al. 2001). However,
information gained from these studies is useful only if radio-marks do not change
individual behavior during time of data collection (White and Garrott 1990).
Subcutaneous anchor-mount transmitters (Mauser and Jarvis 1991) are beneficial
because they are easy to apply, cost effective, require only local anesthesia and sutures,
and transmit over greater distances than transmitter implants (Rotella et al. 1993;
Paquette et al. 1997). However, their use has lead to some question over their effects
on reproduction and subsequent survival for prairie-nesting Mallards (Anas
platyrhynchos; Paquette et al. 1997).
Use of propofol for temporary sedation of newly transmitter-marked individuals
may reduce potential negative effects (Machin and Caulkett 2000), but its use has not
been widely evaluated. Here I evaluate effects of subcutaneous anchor-mount
transmitters and use of propofol on nesting effort of King Eiders (Somateria
spectabilis) in the central Arctic. This evaluation was motivated by my use of
subcutaneous anchor-mount transmitters to study brood ecology in this species. I also
evaluate effects of possible covariates to nest success, such as incubation stage at
capture and female specific attributes for various treatment groups.
105

King eiders are long-lived sea ducks and differences in life history traits, relative to
previously-evaluated transmitter effects on shorter-lived prairie nesting species, may
lead to differences in nesting behavior after transmitter attachment. For instance, long-
lived species typically lay smaller clutches and renest less frequently within the same
season. Thus, relative to shorter-lived species, each individual nesting attempt
contributes less to overall life-time reproductive success. Females with less relative
annual investment, may abandon individual nesting attempts more readily, if
disturbance is perceived as a mortality risk.
A.2 METHODS
The study took place during the summers of 2000 – 2001 at Karrak and Adventure
Lakes, Nunavut (67° 14’ N, 100° 15’ W), located within the Queen Maud Gulf Bird
Sanctuary. See Kellett and Alisauskas (2000) for detailed descriptions of the study
area.
A.2.1 Captures
About 7-10 days before predicted hatch dates, I trapped nesting female King Eiders
by laying mist nets over them. Predicted hatch dates were based on known laying dates
or estimated incubation stage by candling eggs (Weller 1956), assuming a 23-day
incubation period (Parmelee et al. 1967) and a laying interval of one egg per day
(Lamothe 1973). I banded all captured females with standard metal leg bands and
weighed each with a Pesola spring scale (+10g). I measured and recorded twice for
each female: head length and tarsus length using dial calipers (+0.1 mm), and flattened
wing chord using a flat ruler (Dzubin and Cooch 1993). I later used the average of both
measurements to obtain indices of structural size.
During 2000 I attached subcutaneous anchor-mount transmitters (Advanced
Telemetry Systems™; Mauser and Jarvis 1991) to every other captured female. I
injected 0.1-0.2 ml of Buvipicaine subdermally at several sites around the area of
anchor attachment before implanting the transmitter anchor subcutaneously.
Transmitters were secured with 3 sutures (3-0 Prolene). I then sedated transmitter-
marked females with 1.5 ml of propofol, via tarsal vein, before placing her near her
106

nest. At capture, eggs of transmitter-marked females were replaced with an identical
number of non-fertile chicken eggs, and natural eggs were artificially incubated using
portable air-circulating incubators. Upon hatch, I replaced chicken eggs with newly
hatched and individually marked natal ducklings. During 2001 I attached subcutaneous
anchor-mount transmitters, sedated each with propofol and artificially incubated eider
eggs as noted above, to every 3rd captured female. In addition, I created a control group
of females captured subsequent to transmitter-marked individuals. For the control
group, I artificially incubated eider eggs and sedated captured females with propofol
but did not affix transmitters. The 3rd group, females captured subsequent to controls,
were banded and released without transmitter attachment or use of propofol. Birds
within the band and release group were allowed to naturally incubate their own eggs. I
recorded handling time for all captures during 2001.
A.3 STATISTICAL ANALYSIS
I established an index of female structural size using principal component analysis
(PCA) based on the correlation matrix of head length, wing length, and tarsus (SAS
Institute Inc. 1996). I regressed body weight on structural size (PC1) and incubation
stage at capture and used the residuals from general linear models (GLM) as an index
to female condition (Alisauskas and Ankney 1990, Hochachka and Smith 1991).
I evaluated transmitter and propofol effects on nesting effort by estimating nest success
of captured females in Program MARK (White and Burnham 1999, Dinsmore et al.
2002). I considered a total of 15 candidate models (Table A.1) to assess nest success
based on the following attribute groups from 2001: (1) nasal-marked females with
transmitters and sedated with propofol (transmitter-marked group), (2) nasal-marked
females sedated with propofol but not marked with transmitters (propofol control
group), and (3) nasal-marked females banded and released without transmitter
attachment or use of propofol (band/release group). I also modeled nest success among
years for groups 1 and 3, above, based on a set of 19 candidate models (Table A.2).
For both analyses I began model selection using time constant models because nest
success
107

Table A.1 Candidate models used to investigate influence of subcutaneous anchor-mount transmitters and use of propofol at Karrak and Adventure Lakes, Nunavut, 2001. Nest success was modelled for female King Eiders (1) fitted with subcutaneous anchor-mount transmitters and sedated with propofol (transmitter group), (2) sedated with propofol without transmitter attachment (control group), and (3) females captured, banded and released without transmitter attachment or use of propofol (release group). Parameters were modelled as time constant using the following covariates: relative nest initiation date (initiation), clutch size, female body size, female condition (cond), incubation stage at capture (inc), handling time from capture to time of release (handling), and if the individual was a recapture from previous years (recap). Models are ranked in accordance AICc values and are denoted as additive models (+) or models with interaction (*). Model Number/Name ∆AICc
a AICc
Weights
No. of
Parameters
Deviance
1 (control-transmitter, release)+inc+cond 0.00 0.18 4 172.62
2 (control-transmitter, release)+inc 0.23 0.16 3 174.95
3 (control-transmitter, release) 0.61 0.14 2 177.41
4 (control-transmitter, release)+cond 0.71 0.13 3 175.43
5 (control-transmitter, release)+initiation 1.65 0.08 3 176.37
6 (control, transmitter, release) 1.74 0.08 3 176.47
7 (control-transmitter, release)+handling 2.08 0.06 3 176.80
8 (control-transmitter, release)+clutch size 2.55 0.05 3 177.27
9 (control-transmitter, release)+female
size
2.62 0.05 3 177.35
10 (control-release, transmitter) 2.72 0.04 2 179.52
11 (control-transmitter, release)*initiation 2.81 0.04 4 175.44
12 (control-transmitter, release)* handling 4.07 0.02 4 176.70
13 (control-transmitter, release)*clutch size 558.4 0.00 4 731.02
14 (control-transmitter, release)*recap 568.1 0.00 3 742.79
15 (control-transmitter, release)+recap 952.4 0.00 2 1129.15 alowest AICc = 180.87
108
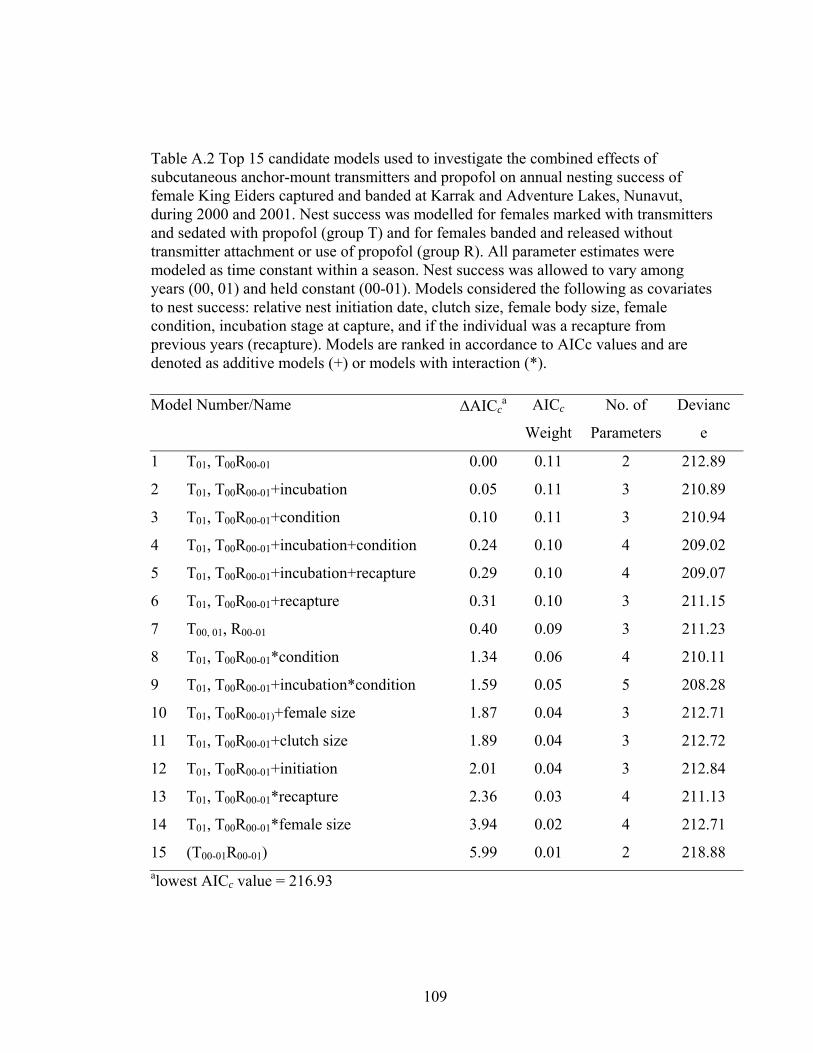
Table A.2 Top 15 candidate models used to investigate the combined effects of subcutaneous anchor-mount transmitters and propofol on annual nesting success of female King Eiders captured and banded at Karrak and Adventure Lakes, Nunavut, during 2000 and 2001. Nest success was modelled for females marked with transmitters and sedated with propofol (group T) and for females banded and released without transmitter attachment or use of propofol (group R). All parameter estimates were modeled as time constant within a season. Nest success was allowed to vary among years (00, 01) and held constant (00-01). Models considered the following as covariates to nest success: relative nest initiation date, clutch size, female body size, female condition, incubation stage at capture, and if the individual was a recapture from previous years (recapture). Models are ranked in accordance to AICc values and are denoted as additive models (+) or models with interaction (*). Model Number/Name ∆AICc
a AICc
Weight
No. of
Parameters
Devianc
e
1 T01, T00R00-01 0.00 0.11 2 212.89
2 T01, T00R00-01+incubation 0.05 0.11 3 210.89
3 T01, T00R00-01+condition 0.10 0.11 3 210.94
4 T01, T00R00-01+incubation+condition 0.24 0.10 4 209.02
5 T01, T00R00-01+incubation+recapture 0.29 0.10 4 209.07
6 T01, T00R00-01+recapture 0.31 0.10 3 211.15
7 T00, 01, R00-01 0.40 0.09 3 211.23
8 T01, T00R00-01*condition 1.34 0.06 4 210.11
9 T01, T00R00-01+incubation*condition 1.59 0.05 5 208.28
10 T01, T00R00-01)+female size 1.87 0.04 3 212.71
11 T01, T00R00-01+clutch size 1.89 0.04 3 212.72
12 T01, T00R00-01+initiation 2.01 0.04 3 212.84
13 T01, T00R00-01*recapture 2.36 0.03 4 211.13
14 T01, T00R00-01*female size 3.94 0.02 4 212.71
15 (T00-01R00-01) 5.99 0.01 2 218.88 alowest AICc value = 216.93
109

did not vary before capture opportunity (i.e., nests were all successful until mid to late
in incubation). Model selection was based on parsimony using Akaike’s Information
Criterion (AICc) to correct for small sample size (Akaike 1985, Burnham and
Anderson 2002). I reduced the number of attribute groups and used the best group
model to investigate further the influence of covariates on nest success. I used the
following covariates to examine sources of variation in nest success: year, relative nest
initiation date, clutch size, female structural size and condition, incubation stage at
capture, bivariate code to designate if the capture was the first recorded capture for that
individual, and for 2001 data, I incorporated handling time for capture events. I
included recapture history to better understand if captures affect first time captures
differently. Lastly, I used AICc weighted model averaging within Program MARK to
calculate estimates of daily nest survival rates for each group and covariate effects on
nest success after capture (Burnham and Anderson 2002).
A.4 RESULTS
I considered nest success for a total of 56 and 89 captured female King Eiders during
2000 and 2001, respectively (Table A.3). Adult female size (PC1) incorporated 66% of
the variation in female body measures, with PCA loadings of 0.80, 0.78. 0.84 for head
length, tarsus, and wing, respectively. In general, King Eider captures occurred later in
incubation in 2000, relative to 2001 (Figure A.1). Capture dates, relative to incubation
stage, varied among years. However, capture dates were similar within years for
transmitter-marked groups ( x = 5.7 days before hatch in 2000, 95% CI = 4.8-6.6; x =
8.5 days before hatch in 2001, 95% CI = 7.6-9.3) and control groups ( x = 5.0 days
before hatch in 2000, 95% CI = 3.6-6.4; x = 8.1 days before hatch in 2001, 95% CI =
6.9-9.3).
Model results indicate that nest success of transmitter-marked and propofol
controls was similar, with nest success varying from the band/release group (Table
A.1). However, models also show some support for variability among all groups
(∆AICc < 2; Burnham and Anderson 2002). Models suggest incubation stage at
capture, female condition, and nest initiation date influenced nest success (∆AICc <2;
110

Table A.3 Sample size (n) and nest fate (successful or failed attempt) for nesting female King Eiders marked with (1) subcutaneous anchor-mount transmitters and sedated with propofol, (2) propofol controls, females sedated with propofol but not marked with transmitters, and (3) nesting females banded and released without transmitter attachment or use of propofol. Eggs of transmitter marked and propofol controls were replaced with color- dyed chicken eggs at time of female capture and eider eggs artificially incubated at camp. Release birds were allowed to incubate and naturally hatch their respective clutches.
2000 (n) 2000 (n)
Attribute Group Successfu
l
Failed Total Successful Failed Total
Transmitter-marked 23 7 30 11 18 29
Propofol controls NA NA NA 8 6 14
Band and release 23 3 26 39 7 46
111

0
1
2
3
4
5
6
7Fr
eque
ncy
FailedSuccessful
0
1
2
3
4
5
6
7
2 3 4 5 6 7 8 9 10 11 12 13
Number of days until hatch
Freq
uenc
y
2001
2000
Figure A.1 Frequency of captures, according to the number of days until ducklings hatched from the nest, of transmitter-marked females captured at Karrak and Adventure Lakes, Nunavut during the summers of 2000 and 2001.
112

however, weighted model averages lacked precision, with all > and all 95% CI
encompassing zero. Effects for the top model suggested females captured later in
incubation ( = 0.40, 95% CI = -0.08 to 0.88) and females in better condition
( = 0.30, 95% CI = -0.09 to 0.69) experienced higher nest success. Weighted
model average daily survival rates (DSR) of transmitter-marked females was 0.97
(95% CI = 0.95-0.98), propofol control females was 0.97 (95% CI = 0.95-0.98), while
DSR for females banded and released without transmitter attachment or use of
propofol was 0.99 (95% CI = 0.98-1.0).
ES β
incstageβ
condβ
When considering annual effects and the combined effects of transmitters and use
of propofol, transmitters and propofol appeared to affect nest success only during 2001
(Table A.2). Model average DSR of nests for both, the transmitter-marked group and
the band and release group, was 0.99 (95% CI = 0.99-1.00) in 2000, while DSR in
2001 was 0.97 (95%CI=0.95-0.98) for the transmitter-marked group and 0.99 (95% CI
= 0.99-1.00) for the band and release group. My results show some support for
influence of covariates on nest success (Table A.3) with model average estimates
indicating a general trend for females captured later in incubation, ( = 0.11,
95% CI = -0.23 to 0.45), females in better condition ( = 0.09, 95% CI = -0.19 to
0.37), and females with a previous capture history to experience higher nest success
( = -0.14, 95% CI = -0.14 to 0.24). No trend occurred with other covariates (i.e.,
> ). Lack of precision around slope estimates was likely a consequence of small
sample size.
incstageβ
condβ
recapβ
ES β
Sutures from two transmitters became detached early in the study: one female was
recaptured on the nest (2000) and sutures were retied; a second female was observed
with a transmitter hanging to her side during the brood-rearing period (2001). Some
transmitters remained attached well after the breeding season had ended. For example,
one female marked with a transmitter during 2000 was captured on the nest the
following breeding season with the transmitter still attached by the wire prong only
(i.e., no sutures remained). Another marked with a transmitter (July 2001) was shot >
113

200 days later (April 2002) with transmitter still attached. I observed no mortality of
transmitter-marked females during the breeding season.
A.5 DISCUSSION
My results suggest that use of propofol and subcutaneous, anchor-mount transmitters
may negatively affect nesting behavior of King Eiders. Paquette et al. (1997) found
that wild Mallard females fitted with subcutaneous mount transmitters spent fewer, but
non-significant, number of days nesting. In King Eiders, the primary nest predators are
Larus gulls, with eggs from unattended nests being most vulnerable to gull predation
(Campbell 1975, Kellett 1999). If transmitter-marked females spent more time engaged
in preening activities away from the nest site, as found in Mallards (Pietz et al. 1993),
then reduced nest attendance may have contributed to greater nest loss.
Annual variation in the effect of transmitters suggests that female King Eiders may
assess mortality risks differently according to prevailing annual conditions. Female
King Eiders rely heavily on endogenous reserves (Kellett and Alisauskas 2000) and if
spring conditions vary, such that individuals arrive on the breeding grounds in variable
condition among years, individuals may chose to abandon nests more readily in years
of poorer condition. For instance, female eiders that begin incubation with lower body
reserves may exhibit immunosuppression during late incubation, which may lead to
increased abandonment when stressed (Hanssen et al. 2003). I suggest that greater nest
abandonment or, decreased nest attendance that left eggs vulnerable to gulls, likely
contributed to greater nest loss by female King Eiders in lower body condition. I also
found some evidence that females captured for their first time experience greater nest
loss. Banding at the study site has been continuous since 1995 (Kellett et al. 2003),
with about 30-60% of nesting females captured each year (Mehl unpubl. data). Thus,
females captured for the first time likely represent young breeders or, at least new
recruits into the local breeding population. Assuming that new captures represent a
large proportion of young breeders, my results suggest age related effects to King
Eider nest success. Age related effects may be, in part, due to younger females having
lower incubation constancy (Yerkes 1998). Disturbance to females with lower
incubation constancy, may result in greater to nest abandonment when stress of capture
114

and handling is present. Unfortunately, the marked population at the study area
contains only a few birds of known breeding age, which are necessary to determine
age-related nest abandonment rates.
King Eiders are long-lived species with small clutch size, relative to most ducks.
Short arctic summers, combined with physiological requirements for nutrient reserves
in egg-laying, do not likely allow for renesting (Korschegen 1977). Therefore, each
annual nesting attempt contributes relatively little to overall life-time reproductive
success. Because greater time spent in incubation, increases the relative time invested
in an individual nesting attempt (Götmark 1992, Robin et al. 2001), I suggest that
improved nest success for females captured later in incubation was likely because these
females were less willing to abandon after having invested a greater amount of time
into incubation.
Previous work on wild Mallards (Paquette et al. 1997) and Lesser Scaup (Brook
and Clark 2002) found that subcutaneous type transmitters remained attached for only
about 40 days. This study required only a short retention period for transmitters (<40
days). I suspect that the 2 transmitters for which sutures became detached was due to
improper knots tied in the sutures, as radios were retained on all other individuals
throughout the study period. Subcutaneous anchor-mount transmitters did not appear to
influence adult survival, as suggested for wild Mallards with subcutaneous anchor-
mount transmitters (Paquette et al. 1997).
I acknowledge that exchange of eider eggs for color-dyed chicken eggs, and the
artificial incubation of viable eggs, may have influenced nest success for transmitter-
marked and propofol control females. However, I suspect that artificial incubation had
little to no effect on nest attendance since egg recognition is apparently absent in most
avian species (O’Connor 1984) and female King Eiders readily incubate small eggs of
Long-tailed Ducks (Clangula hyemalis), as well as rocks (pers. obs). Communication
of offspring through the shell (Vince 1969, O’Connor 1984) may encourage females
that are in relatively poor condition from abandoning. Thus, if lack of communication
among unviable eggs lead to increased nest abandonment, I would have expected
female condition to be an important covariate to females that incubated chicken eggs;
however, these results showed no such support.
115

Importantly, reduced nest success among eiders that received only propofol and no
transmitter, suggest this drug may not be appropriate for use on King Eiders or other
species. This association should be taken into account when designing studies that use
radio-telemetry. I suggest that future studies address affects of transmitters without use
of propofol and simultaneously evaluate time allocation of transmitter-marked
individuals to nesting activities in order to help researchers understand potential effects
of transmitter use on behavior, and biases in data collected on these individuals.
116

APPENDIX B. LINKING BREEDING AND WINTERING GROUNDS OF
KING EIDERS: MAKING USE OF POLAR ISOTOPIC GRADIENTS
B.1 INTRODUCTION
Linking wintering and breeding areas of migratory wildlife can be important for
understanding their population dynamics (Fretwell 1972, Evans and Pienkowski 1984,
Webster et al. 2002) because habitat conditions associated with winter or migration
areas can directly affect reproduction (Alisauskas 2002) and annual survival (Davidson
1981, Fournier and Hines 1994, Dierscheke 1998). For most waterfowl species,
connectivity between breeding and wintering areas can be inferred using band
recoveries of hunter-killed birds. However, for sea ducks such as king eiders
(Somateria spectabilis) that remain in northern latitudes throughout the annual cycle,
few birds are marked and available for recovery. For example, from 1940 to 2002, 804
adult king eiders were banded in North America, of which only 24 had been recovered
(Bird Banding Office, Laurel, MD). Alternative methods, such as resighting color-
marked individuals on breeding and wintering areas (Haig and Plissner 1993), are not
easily accomplished because this species winters at sea several kilometers from shore
(Mosbech and Johnson 1999, Suydam 2000, Merkel et al. 2002). Satellite telemetry is
expensive and so relatively few birds can be marked, thereby compromising ability to
draw robust inferences about movements at the population level.
Populations of king eiders appear to have declined in Western North America by
about 50% over the last 20 years (Suydam et al. 2000) and numbers of moulting king
eiders off the coast of Greenland have declined by about 50% over the last 40 years
(Mosbech and Boertmann 1999). King eiders that breed in North America winter along
the northwestern and northeastern coasts of the continent, including portions of the
Bering Sea near Russia in the west and waters near southwest Greenland in the east
(Abraham and Finney 1986, Suydam 2000, L. Dickson, pers. com.). Limited band
117

recovery data indicate that allopatric winter populations share breeding areas - at least
in Canada’s central Arctic (Alisauskas upubl. data). Ability to assign individual
breeders reliably to specific winter populations enables avenues of research for
understanding the relative influence of ecological effects in different winter areas on
recruitment and survival estimated from studies on shared breeding areas.
Naturally-occurring stable isotopes of several elements in animal tissues reflect
local food webs (DeNiro and Epstein 1978, Fry and Sherr 1984, Hobson and Welch
1992, Michener and Schell 1994). Different biogeochemical processes produce
variation in baseline isotopic signatures of foodwebs and present the opportunity to
infer origins of organisms within those foodwebs. Thus, by choosing appropriate
tissues for analysis, origins of migratory individuals can be delineated (reviewed by
Hobson 1999a). This approach has been used to link breeding and wintering areas of
several terrestrial species (Hobson and Wassenaar 1997, Webster et al. 1999,
Wassenaar and Hobson 2000, Hobson et al. 2001, Rubenstein et al. 2002). Geographic
patterns in stable isotope ratios are less well documented in marine areas.
Nevertheless, previous analyses of zooplankton in polar marine environments of North
America indicate an east-west gradient in 15N and 13C (Figure B.1), with relative
enrichment in portions of the Bering and Chukchi seas, and depletion in arctic waters
of eastern North America (Dunton et al. 1989, Saupe et al. 1989, Schell et al. 1998). A
portion of this isotopic gradient was used to trace seasonal migration of the western
North American population of Bowhead Whales (Balaena mysticetus) as they moved
between the eastern Beaufort and the Bering/Chukchi region (Schell et al. 1989). The
cause of this isotopic gradient is not well understood but is, in part, likely driven by
more enriched isotopic values of the Bering Sea, resulting from nutrient-rich
upwellings specific to this region. Oceanic currents disperse enriched isotopic waters
from the Bering Sea north and eastward and the gradient from the Beaufort Sea
eastward is thought to be linked to attenuation of inputs from the Bering Sea (see
Schell et al. 1998). Less information is available about isotopic patterns in foodwebs
near western Greenland or other eastern wintering areas of king eiders. However,
recent work by Hobson et al. (2002a,b) has shown generally depleted values of
118

δ15N and δ13C values of zooplankton from there compared to those from the Bering
Sea.
As with other waterfowl species, female king eiders undergo two body molts, of
which basic plumage present during breeding is acquired on previous wintering areas
(Weller 1976, Heitmeyer 1986, Suydam 2000). Wing moult occurs once annually,
during summer or fall (Weller 1976, Suydam 2000). King eider contour feathers
should, thus, reflect isotopic signatures of foodwebs associated with winter regions
where feather growth occurs (Mizutani et al. 1990, Hobson and Clark 1992, Hobson et
al. 2001). In a preliminary investigation based only on flight feathers, Hobson (1999b)
found evidence for isotopic segregation between eastern and western populations of
king and common (Somateria mollisima) eiders that reflected the expected isotopic
gradient in foodwebs across the Canadian Arctic. This encouraged us to investigate
this more extensively for king eiders. The objectives of this study were to investigate
variations in isotopic signatures of king eider feathers of known winter location to
determine if this technique would be useful in determining North American wintering
area of breeding king eiders of unknown winter origin. Based on an expected east-west
isotopic gradient in polar waters used by wintering king eiders, (e.g. Figure B.1), I
predicted that δ15N and δ13C values for feathers from western king eiders would be
more enriched, relative to those of feathers from king eiders wintering off western
Greenland.
B.2 METHODS
During 2000-2001, contour feathers (back intra-scapular, center chest, top of head, and
an outer primary flight feather) were collected from hunter-killed king eiders of both
eastern and western populations. King eiders were shot near Holman Island, NWT
(70°43’ N 117 °45’W) during spring (n=94; 23 males and 71 females; 6-15 Jun 2001)
and near the coast of Greenland (60°47’N 47 °31’W to 67 °30’N 54 °00’W) during
winter (n=22; 12 males and 10 females 13 Nov 2000 – 26 Feb 2001) and spring (n=28;
18 males and 10 females; 16 Mar – 4 Apr 2001; Figure B.1). Feathers collected in
119

RUSSIA
Figure B.1 Spatial distribution of summer δ15N values estimated for copepods from marine waters of northern North America (Hobson and Welch 1992, Schell et al. 1998, Hobson et al. 2001, Hobson et al. 2002a,b). Values for the Chukchi and Bering Seas are means for samples collected off the coast of Alaska and Russia (Shell et al. 1998). Isotope value given for the north coast of Newfoundland is from northern shrimp (Pandalus borealis; Lawson and Hobson 2000) corrected for trophic level (-3.4‰; Fry 1988, Hobson and Welch 1992), and the mid-Atlantic isotopic value is for copepods collected on the Georges Bank (Fry 1988). Also shown are locations (open circles) where king eiders were shot near Holman, NWT, and southwestern Greenland. Arrows indicate likely and known migration routes of king eiders. Isotope values for δ13C are not shown, as these values contributed only 4% more precision in delineating between eastern and western wintering eiders.
120

Greenland were taken from 11 hunter-killed king eiders, 2 mistnet captures, and 37
king eiders that collided with navy ship lanterns. Samples taken in Greenland are
centrally located and likely representative of isotopic values from the eastern arctic and
mid-Atlantic. Samples from Holman were taken from only one geographic location,
but represent individuals that wintered over a larger western geographic region because
1) Sea ice prevents eiders from overwintering near Holman and king eider migration is
highly synchronous and occurs over a short period of time (Woodby and Divoky 1982,
Suydam 2000) for which dates of hunter-killed birds coincide with arrival of king
eiders to the eastern Beaufort Sea (Suydam 2000); 2) The most important spring
staging areas are located within polynyas west of Holman, near the Amundsen Gulf
(southwest Banks Island and Balillie Islands; Alexander et al. 1997). It is expected that
90% of the western wintering king eiders stage in this area during spring (Barry 1986)
with about 20% of all western wintering king eiders passing near Holman Island en
route to more easterly breeding areas (see Byers and Dickson 2001, Suydam et al.
2000).
Feathers collected for stable isotope analyses were rinsed in a 2:1
chloroform:methanol solution and allowed to air dry. Samples (1 mg) were then
weighed in tin cups and combusted in a Robo Prep elemental analyzer interfaced with
a Europa 20:20 continuous-flow isotope ratio mass spectrometer (CFIRMS, Hobson
and Schell 1998). Stable isotope values are expressed in δ notation relative to the Pee
Dee Belemnite (PDB) and atmospheric air standards for 13C and 15N measurements,
respectively. Based on thousands of measurements of albumen lab standard, I estimate
measurement precision to be ± 0.1‰ for δ13C measurements and ± 0.3‰ for δ 15N
measurements.
B.3 STATISTICAL ANALYSES
I plotted values of δ 13C and δ 15N from each feather tract to interpret amount of
overlap between western and eastern populations. I assessed my ability to discriminate
between western and eastern populations based on isotopic ratios from one or more
feather tract(s), using discriminate function analysis (DFA; SAS Institute 1996). I
tested for homogeneity of within-covariance matrices using a chi-square test of
121

homogeneity (POOL=TEST option with SAS) and used quadratic discriminate
function analysis (QDFA) when heterogeneous variances were present. I set prior
probabilities equal to sample sizes for each group and performed separate DFAs using
values of δ15N and δ13C from all four feather tracts combined and all possible
combinations of feather tracts, including each tract independently. To find the most
informative feather tract(s) to best discriminate king eider populations, the
performance of each DFA was evaluated based on the error rate from cross-validation.
I performed a separate DFA using isotope data from all feather samples (male and
female), and on data from females only. Lastly, graphical representation of the data
revealed that most variation between populations occurred with δ15N values. Thus,
using the most informative feather tract(s), I tested my ability to delineate populations
using only δ15N values. All statistical analyses were performed using SAS (SAS
Institute 1996).
B.4 RESULTS
Degree of segregation in isotopic values between eastern and western populations
varied with respect to feather tract with differences of as much as 10‰ for all feather
tracts of both populations (Figure B.2). I found that δ 15N and δ13C values were
enriched for king eiders that wintered in seas of western North America relative to
those of king eiders that wintered in seas of eastern North America (Table B.1).
Within-class covariance matrices were unequal for all feather tracts (P<0.01),
motivating use of quadratic discriminate function analysis (QDFA). All QDFAs
resulted in greater misclassification of eastern birds than western birds (Table B.2).
Head feathers provided the best discrimination between king eiders from different
winter areas (Table B.2). When both males and females were included in the QDFA,
three of 50 eastern individuals were misclassified (6% error). Two of three
misclassified individuals were females, resulting in slightly higher error rates when
only female data were considered (2/21; 10% error). Use of only female data resulted
in 100% correct classification of western king eiders (Table B.2). Use of both δ 15N
and δ 13C values led to slightly greater classification success (99% west, 94% east),
122

compared to use of δ 15N alone (94% west, 92% east). Classification equations from
QDFA for δ 15N and δ 13C values of king eider head feathers are in Appendix C.
Figure B.2 Isotopic values from head, back, chest, and primary wing feathers of hunter- killed king eiders that wintered in eastern (n=49) or western seas (n=94) of northern North America. Open circles are values from western populations, closed circles are values from eastern populations.
Primary Feathers
δ13
C
-24 -22 -20 -18 -16 -14 -12
10
12
14
16
18
20
22
Chest Feathers
δ13
C
-24 -22 -20 -18 -16 -14 -12
δ15N
10
12
14
16
18
20
22
Back Feathers
-24 -22 -20 -18 -16 -14 -12
10
12
14
16
18
20
22
Head Feathers
d 13 C
-24 -22 -20 -18 -16 -14 -12
δN
10
12
14
16
18
20
22
15
123

Table B.1 Mean isotoptic values of δ15N and δ13C of feathers collected from hunter-killed King Eiders that were shot near the coast of Greenland (east) and Holman Island, Nunavut (west).
Feather tract Population Feather δ 15N Feather δ 13C
n Mean + SD Mean + SD
Back East 47 13.44 1.18 -18.45 0.99
West 94 15.79 1.15 -16.91 1.15
Chest East 48 13.31 1.22 -18.46 1.13
West 94 15.96 1.31 -16.95 1.31
Head East 48 13.27 1.05 -17.65 0.51
West 94 15.80 0.98 -16.64 1.05
Wing East 50 13.49 1.08 -18.58 1.19
West 94 15.80 0.98 -16.84 0.98 † Sample sizes varied, as I was missing feathers from some tracts for a few
individuals.
124

Table B.2 Classification success (%) of quadratic discriminate function analysis for isotopic values of δ13C δ15N from King Eider feathers of eastern and western populations. Feather tract(s) are listed in order of classification success for eastern populations. Bias represents % Successwest - % Successeast where bias represents favor toward the western population. Male and Female Female Only
Feather Tract(s) East West Biasa East West Bias
n % n % n % n %
Head 48 94 94 99 5 21 90 71 100 10
Head, Wing
48 94 94 99 5 21 86 71 99 13
Chest, Head 47 94 94 100 6 21 81 71 100 19
Back, Chest, Head, Wing 47 91 94 98 6 21 62 71 99 37
Back, Head 47 89 94 98 9 21 86 71 100 14
Chest, Head, Wing 47 89 94 98 9 21 81 71 97 16
Back, Head, Wing. 47 89 94 99 10 21 76 71 99 22
Back, Head, Chest 47 87 94 98 11 21 86 71 99 13
Wing 50 80 94 93 13 21 67 71 96 29
Chest 48 79 94 94 14 21 71 71 96 24
Back 47 79 94 90 12 21 62 71 96 34
Back, Wing 47 79 94 90 12 21 67 71 94 28
Back, Chest 47 74 94 87 13 21 71 71 93 22
127
125

B.5 DISCUSSION
I have determined that naturally-occurring stable isotope ratios in feathers can be used
with considerable success to assign king eiders to western and eastern North American
wintering populations. My results clearly indicate that the greatest distinction between
isotopic values of feathers from eastern and western king eiders was due to differences
in δ15N values, as only 4% of the bias for eastern and western classifications was
corrected by inclusion of δ13C measurements. These results are consistent with
available information about geographic patterns in isotopic signatures of lower trophic
levels (i.e., copepods) in marine foodwebs between western (Bering) and eastern
(Greenland) seas (Figure 1). However, complete information about stable isotope ratios
of eider winter diet from western and, in particular, eastern foodwebs is not yet
available. Hence, it is unclear to what extent signatures from king eider feathers are
due to differences in predominant trophic levels of winter diet. Nevertheless, these
findings offer an opportunity for assigning arctic-breeding king eiders to the broad
winter areas in question. These results could have wider applicability to other marine-
associated species with similar dichotomous wintering distributions. For example,
ongoing research on white-winged scoters (Melanitta fusca deglandi) shows this same
western vs. east trend in feather isotope values (Swoboda et al., unpubl. data) at lower
latitudes than investigated in the current study. I found that δ15N values varied by as
much as 8‰ for feathers grown within the same winter area (i.e., eastern or western
seas). Several factors may have influenced stable isotope composition of these feathers
within and between wintering areas. In addition to potential differences in trophic level
of king eider prey between winter areas noted above, variation within winter areas may
have resulted from individual birds foraging on foods of different trophic levels.
Feathers grown during consumption of foods from higher trophic levels would have
more enriched δ 15N values relative to feathers grown during the consumption of foods
from lower trophic levels (DeNiro and Epstein 1978, Hobson and Welch 1992). King
eiders forage on a number of prey items including algae, polychaetes (Pectinaria spp),
gastropods, (Oenopota spp) bivalves, and fish eggs (Suydam 2000, Frimer 1997);
however, the extent and timing of factors that influence winter/spring dietary
composition are unknown. King eiders also winter over a broad geographical range
126

and variation in molt location might involve isotopic changes in foodweb signatures at
local or regional scales (Dunton et al. 1989, Schell et al. 1998). Finally, use of
endogenous reserves can cause isotope signatures to drift from their geographic
specific signatures (Hobson 1995), but I expect that this had little impact on my
results, as feather synthesis occurs primarily from exogenous sources (Ankney 1979,
Murphy 1996).
Discrimination of 13C between trophic levels is conservative, so variations in
observed δ13C values (about 6 ‰ for western and eastern king eider feathers) are likely
due to spatial differences rather than diet per se. Enrichment in 13C generally is greater
in benthic vs. pelagic foodwebs (Hobson and Welch 1992, France 1995) and so feeding
in the water column or epontic foraging around sea ice might result in considerably
depleted eider δ13C values compared to those feeding exclusively on benthic foods. My
data suggest that some contour feathers are occasionally grown from nutrients acquired
on freshwater habitats. One female western king eider had chest feather isotope
profiles that strongly suggest freshwater input during feather growth (e.g., Mizutani et
al. 1990). δ15N and δ13C values for the chest feather of this individual (δ13C =-24.17‰,
δ15N=10.00‰; Figure 2) were lower than those expected from marine habitats.
Alternatively, growth of this feather may have occurred near a river delta where fresh
water inputs are greater than marine inputs (see Schell et al. 1998). Head feathers
provided the best discrimination between populations likely because these feathers are
small relative to feathers from other tracts. Nutrient requirements for growth of small
feathers are more easily met through daily diet than for larger feathers (see Thompson
and Drobney 1996), thereby more likely reflecting local diet signatures. Moreover,
completion of growth for the lightest feathers should be most rapid, thereby reducing
the influence of variation in diet from (1) changes in trophic level of principal king
eider prey, and (2) movement of King Eiders during the time of feather growth. Spring
migration begins in late April to early May, depending on sea ice conditions, with
growth of head feathers often complete by mid-May (Suydam 2000). Nutrients for
head feathers worn in the spring may be acquired in more geographically confined
areas such as nutrient-rich polynyas with correspondingly narrower ranges in isotopic
signature associated with local foodwebs. In contrast, flight feathers provided less
127

accuracy in discriminating between eastern and western populations, as also
determined by Hobson (1999b). This is likely because flight feathers are grown during
fall when most king eiders undergo a molt migration to marine habitats which may not
necessarily coincide with wintering areas.
In addition to further research on isotopic patterns in winter foodwebs of eiders, I
recommend future research to include collection of head feathers from king eiders
captured on breeding areas in conjunction with local banding efforts. My classification
equation derived from head feathers of king eiders from known winter location
(Appendix A), used with δ15N and δ13C values obtained from head feathers of breeding
king eiders, allows assignment of breeding birds to either western or eastern winter
location. Such an approach using birds from several breeding areas would allow
estimation of degree of breeding overlap between eastern and western winter
populations. Furthermore, use of isotopic measurements in conjunction with multistate
models based on capture-recapture of breeding birds could be used for direct
estimation of probabilities of survival for each winter area, and philopatry to winter
areas as defined herein (e.g., Hestbeck et al. 1995). For example, encounter histories of
a marked individual could be coded as one of two wintering states, west or east. Such
multistate models permit estimation of (1) survival, (2) recapture probability, and (3)
the transition probability of moving among wintering areas (Lebreton et al. 1999). If
both young and adults are marked, the extent to which adults and their offspring winter
in the same areas can also be investigated. Because pair formation occurs on staging
areas away from breeding areas (Barry 1986), dispersal between winter areas would
result in gene flow between western and eastern populations. Knowledge of philopatry
to wintering area is especially important for king eider management, given their
declining population trends. Population trends of king eiders are based on count
surveys at key migrational areas (Suydam et al. 2000), so regular movement between
western and eastern wintering areas would bias interpretations of true population
trajectory. In conjunction with use of stable isotopes, information on dispersal and
migration would increase understanding of King Eider population structure, and of the
effects of mortality in multiple winter areas on dynamics of breeding populations.
128

Finally, I suggest that much remains to be learned despite my success at
discrimination of king eiders from two important winter areas. Isotopic ratios of food
webs that include king eiders are poorly known for marine wintering sites in general
and these may vary through time. As well, in years of heavy sea ice, king eiders may
be forced south of areas which my data represent. I suggest that future studies
investigate molt chronology more thoroughly in order to better understand age and sex
specific feather growth periods. Furthermore, investigation of isotopic ratios in
feathers of eiders that winter south of my samples would help to understand isotopic
variability and the applicability of this method to king eiders during heavy ice years.
The success in delineating populations of northern wintering king eiders, and support
of the western vs. eastern trend in feather isotope values at lower latitudes (Swoboda et
al., unpubl. data), indicate that stable isotopic analysis is a viable method that may be
useful to other marine species.
129

APPENDIX C. PREDICTIVE EQUATIONS FOR DELINEATING BETWEEN
EASTERN AND WESTERN POPULATIONS OF KING EIDERS.
Quadratic discriminate function equation was based on isotopic values from King
eiders killed near the coasts of Holman Island, NWT (n=94) and Greenland (n=50).
The quadratic classification equation using isotopic ratios was
[ ] [ ] ⎥⎦
⎤⎢⎣
⎡⎥⎦
⎤⎢⎣
⎡−
−+⎥
⎦
⎤⎢⎣
⎡−+−=
i
iii
i
ieast C
NCN
CN
D 13
151315
13
15
*47.215.1
15.135.2**51.172202.10351.1722
(C.1)
[ ] [ ]DNC
N CNCwest
i
ii i
i
i
= − + −⎡
⎣⎢
⎤
⎦⎥ +
−−
⎡
⎣⎢
⎤
⎦⎥
⎡
⎣⎢
⎤
⎦⎥210 37 10 08 1564
0 30 0 020 02 0 45
15
1315 13
15
13. . . * *. .
. .*
(C.2)
Where 15NI and 13CI = δ 15N and δ 13C values for observation i, respectively. If Deast >
Dwest, the individual is then classified as wintering in the east
The equation used to calculate the probability of belonging to each population was
Denominator = exp(Deast) + exp(Dwest)
Probabilityeast = exp (Deast)/denominator
Probabilitywest = exp(Dwest)/denominator
130
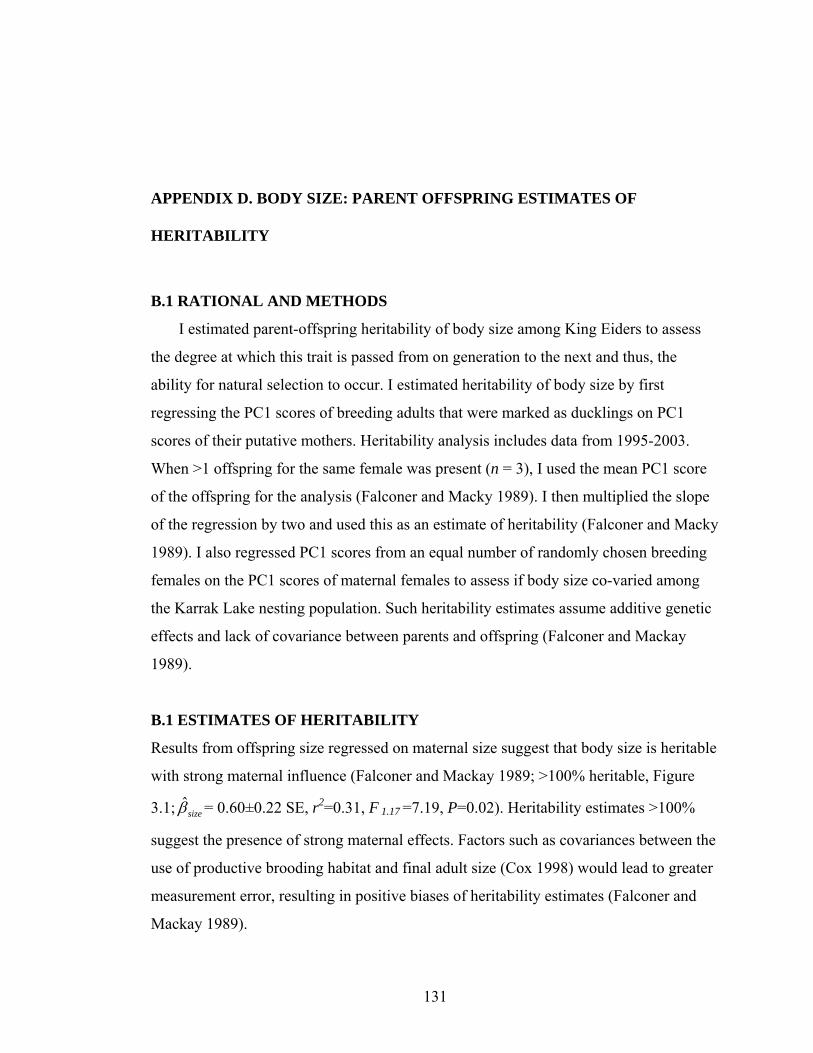
APPENDIX D. BODY SIZE: PARENT OFFSPRING ESTIMATES OF
HERITABILITY
B.1 RATIONAL AND METHODS
I estimated parent-offspring heritability of body size among King Eiders to assess
the degree at which this trait is passed from on generation to the next and thus, the
ability for natural selection to occur. I estimated heritability of body size by first
regressing the PC1 scores of breeding adults that were marked as ducklings on PC1
scores of their putative mothers. Heritability analysis includes data from 1995-2003.
When >1 offspring for the same female was present (n = 3), I used the mean PC1 score
of the offspring for the analysis (Falconer and Macky 1989). I then multiplied the slope
of the regression by two and used this as an estimate of heritability (Falconer and Macky
1989). I also regressed PC1 scores from an equal number of randomly chosen breeding
females on the PC1 scores of maternal females to assess if body size co-varied among
the Karrak Lake nesting population. Such heritability estimates assume additive genetic
effects and lack of covariance between parents and offspring (Falconer and Mackay
1989).
B.1 ESTIMATES OF HERITABILITY
Results from offspring size regressed on maternal size suggest that body size is heritable
with strong maternal influence (Falconer and Mackay 1989; >100% heritable, Figure
3.1; = 0.60±0.22 SE, rsizeβ 2=0.31, F 1.17 =7.19, P=0.02). Heritability estimates >100%
suggest the presence of strong maternal effects. Factors such as covariances between the
use of productive brooding habitat and final adult size (Cox 1998) would lead to greater
measurement error, resulting in positive biases of heritability estimates (Falconer and
Mackay 1989).
131

-1
-0.8
-0.6
-0.4
-0.2
0
0.2
0.4
0.6
-0.6 -0.4 -0.2 0 0.2 0.4 0.6
Maternal body size (PC1)
Off
sprin
g bo
dy si
ze (P
C1)
.
Figure D.1 Relationship between body size of known age breeding adults and body size of maternal females. Body sizes are derived from principal components analysis based on the correlation matrix of mean metric measurements of each individual.
132