bs-6 washcoat technology durability simulation and obd-ii
TRANSCRIPT

Page 1
BS-6 washcoat Technology
&
Durability Simulation and OBD-II approach
Two Wheeler
Dinesh K Gogia
Air Purification-Automotive
12th International Conference & Exhibition ECT – 2019

Page 2
The Durability of exhaust after treatment for Two wheeler is
defined as 20K and 35 K for vehicle Class 1-2 and class 3
respectively
OBD-II for Two wheeler shall be implemented from April 2023
In AIS-137, on road /CD durability is defined in SRC and it’s
simulation on ED as SBC
Automotive catalyst are subjected to physical, chemical
and thermal aging mechanism with different intensity
This presentation covers, BS-6 washcoat Technology, aging
test set-up and results as per SBC for catalyst durability for
two wheelers
Catalyst Durability
Presented at ECMA's 12th International Conference & Exhibition-2019

Page 3
Mileage Accumulation on Vehicle
(SRC)
Accelerated Engine-bench Aging
(SBC)
Real world aging of after treatment system It is different in terms of chemical interaction
and physical phenomenon
Catalyst deterioration due to thermal aging,
poisoning due to fuel and oil are more
realistic
Deterioration may not be adequately
accounted
Components responsible for after treatment
systems are tested simultaneously
Generally it is for catalytic converter
Higher cost and time Lower cost and time
If vehicle driven on road/test track, difficult
to control variability
Well controlled engine operation and good
repeatability
If tested on Chassis Dynamometer, long
term engagement of test setup
Shorter duration, multiple catalyst can be
aged simultaneously
Pros & Cons of Catalyst aging on vehicle and accelerated
aging on engine test bed
Presented at ECMA's 12th International Conference & Exhibition-2019
Page 4
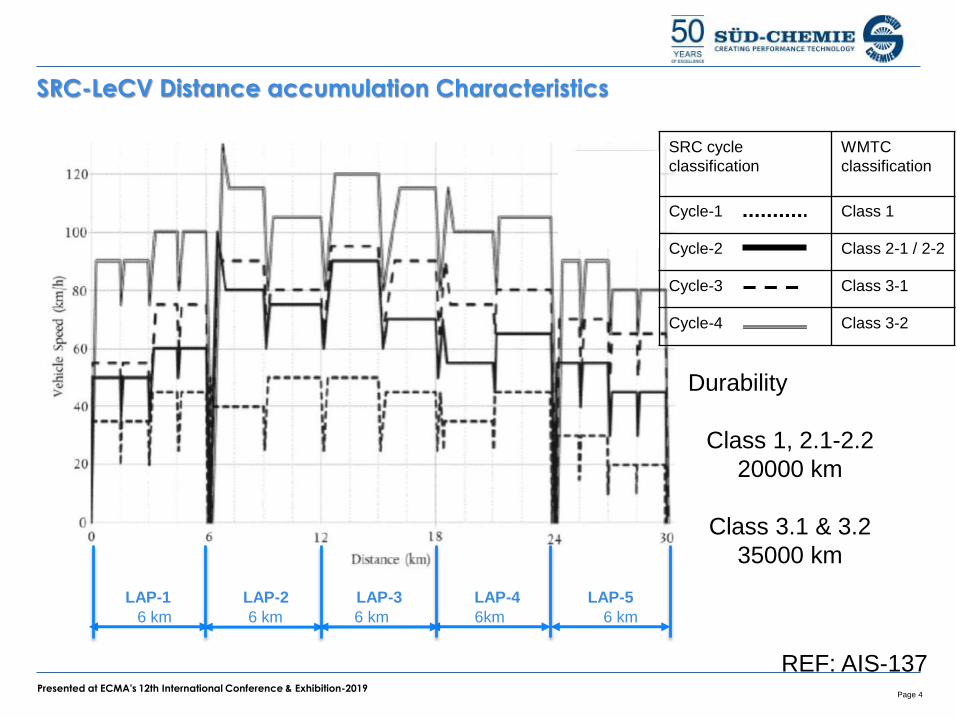
SRC-LeCV Distance accumulation Characteristics
SRC cycle
classification
WMTC
classification
Cycle-1 Class 1
Cycle-2 Class 2-1 / 2-2
Cycle-3 Class 3-1
Cycle-4 Class 3-2
LAP-1 LAP-2 LAP-3 LAP-4 LAP-5
6 km 6 km 6 km 6km 6 km
REF: AIS-137
Durability
Class 1, 2.1-2.2
20000 km
Class 3.1 & 3.2
35000 km
Presented at ECMA's 12th International Conference & Exhibition-2019

Page 5
Time, s Engine Air/Fuel RatioSecondary
Air
01-40 s
Stoichiometric, A/F Engine Condition
to achieve a minimum catalyst
temperature of 800 °C
None
41-45 s “Rich” A/F ratio to achieve a
maximum catalyst temperature 890 °C
or 90 ° C higher to minimum controlled
temp
None
46-55 s 3 % O2
56-60 s
Stoichiometric, A/F Engine Condition
to achieve a minimum catalyst
temperature of 800 °C
3 % O2
Standard Bench Cycle (SBC)
Presented at ECMA's 12th International Conference & Exhibition-2019

Page 6
Standard Bench Cycle (SBC)
0
1
2
3
4
0 10 20 30 40 50 60 70
Air
Inje
ctio
n ,
O2
%
Air
/Fu
el R
atio
Time,sAir/Fuel Ratio Air Injection
Stoichiometric
Control Catalyst Temperature
Time duration on SBC is calculated by Bench Aging Time (BAT) Eq. to equate
Desired kms. Run on SRC
Presented at ECMA's 12th International Conference & Exhibition-2019
Page 7
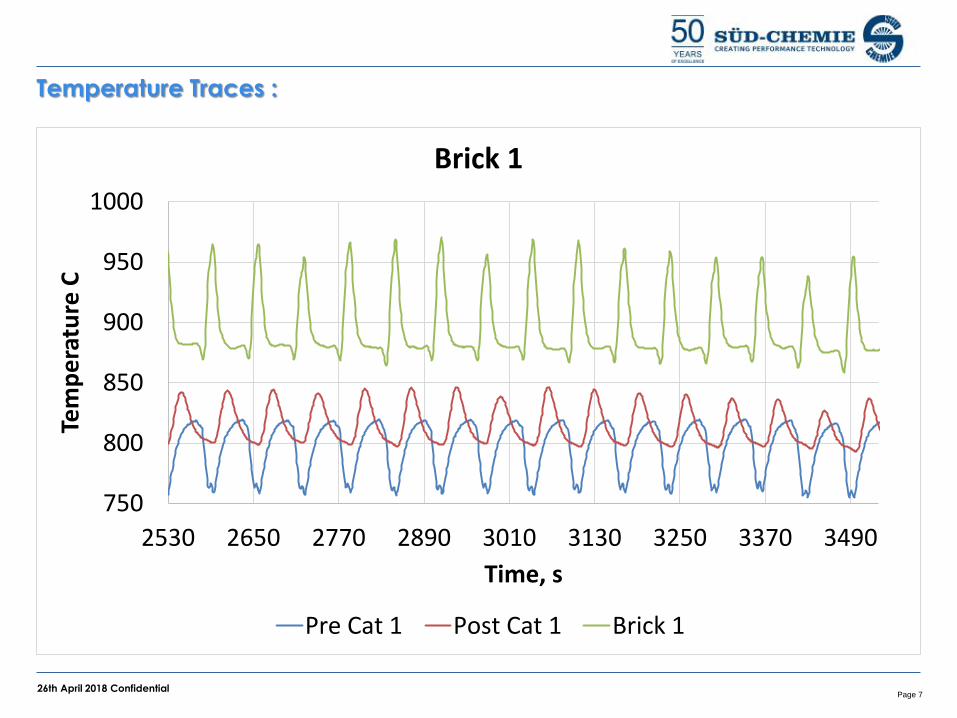
Temperature Traces :
750
800
850
900
950
1000
2530 2650 2770 2890 3010 3130 3250 3370 3490
Tem
pe
ratu
re C
Time, s
Brick 1
Pre Cat 1 Post Cat 1 Brick 1
26th April 2018 Confidential

Page 8
Bench Aging Time (BAT) Eq.
• BAT Eq. calculates the aging time
duration on engine dynamometer
for SBC to simulate equivalence to
SRC aging on CD
• BAT Eq. Requires -
Time vs Temperature data
measured at 1Hz at the hottest
point in the catalyst over SRC
The measured temperature data
shall be tabulated into a
histogram with temperature bins
For each temperature-bin the
equivalent ageing time (in
hours) is calculated as follows:
0
50
100
0 500 1000 1500 2000
Veh
icle
Sp
eed
, km
/h
Tem
per
atu
re °
K
Time,s
T_PRE_CAT K T_CAT_BRICK K
Vehicle Speed, km/h
Presented at ECMA's 12th International Conference & Exhibition-2019
0
50
100
150
200
Tim
e,h
rs
Mid Point Brick Temp ° K BIN

Page 9
Bench Aging Time (BAT) Equation
𝒕𝒆 = 𝒕𝒉𝒆𝒙𝒑[𝑹𝟏
𝑻𝒓−
𝟏
𝑻𝒗]
BAT = A * 𝒕𝒆𝒕𝒆 : Equivalent aging time for each temp bin
𝒕𝒉 : Measured time in hrs with in temperature bin adjusted for full life
𝑻𝒓 : Effective Reference temp. (°K) for Catalyst design and on engine bench
𝑻𝒗 : Mid point Temperature (°K) of each temperature bin
A : 1.1 to factor other deterioration e.g. thermal, chemical poisoning etc
BAT : Bench Aging Time in hrs
R : 17500 Catalyst Thermal reactivityPresented at ECMA's 12th International Conference & Exhibition-2019

Page 10
Engine Aging Set-up @ SCIL Vadodara
• Engine Specification;
• EngineCapacity : 1298 cc
• No of cylinder : 4 inline
• Bore & Stroke : 74 & 75.5 mm
• Compression Ratio : 9: 1
• Max Power : 87 bhp @ 6000rpm
• Max Torque : 113Nm @4500rpm
• Fuel Distribution : MPFI
• ECU : DENSOO 32 Bit
Presented at ECMA's 12th International Conference & Exhibition-2019

Page 11
Modification in Aging setup for Two Wheeler Catalyst
Catalytic Converter size : Dia 40 * 60 or 74.5 mm Length
No of Catalyst to be aged simultaneously : 8 nos.
Presented at ECMA's 12th International Conference & Exhibition-2019

Page 12
Hydrothermal Aging Set up
Gas Mass Flow Controller
Temperature Controller
Water Flow Controller
Gas / N2 /
Water Inlet
Maximum Oven Temp. : 1300 C
0
500
1000
1500
Te
mp
era
ture
C
Time, hrRoom Temp. C
Presented at ECMA's 12th International Conference & Exhibition-2019
Page 13
OBD-II Strategy
Presented at ECMA's 12th International Conference & Exhibition-2019

Page 14
Pollutant
BS-6
Norms
(DF)
V1
Limit
Typical % Conversion Efficiency
RequirementOBD –II Limit
WMTC 2.1 WMTC 2.2 WMTC 3.2
CO1000
(1.3)538 80 77 82 1900
NMHC68
(1.3)37 96 94 95 250
NOx60
(1.3)32 92 96 97 300
Durability km 20000 30000
Emission Norms and OBD-II Emission thresholds for BS-VI mg/km
Most Stringent Target : NMHC
BS-4 THC+NOx : 790 mg/km NOx : 390 mg/km
Presented at ECMA's 12th International Conference & Exhibition-2019

Page 15
OBD
Monitoring Items OBD-Stage-I1
stApril 2020
OBD-Stage-II1
stApril 2023
Circuit continuity for all emission related powertrain
component (if equipped) √ √
Distance Travelled since MIL ON √ √
Electrical disconnection of Electronic Evaporative purge
control device ( if equipped & if active) √ √
Catalytic Converter Monitoring X √
EGR system Monitoring √ √
Misfire Detection X √
Oxygen Sensor Deterioration X √
OBD in automotive terms refers to a Vehicle’s self Diagnostic and reporting
capability. OBD for emission control detects the likely area of malfunction by
means of fault codes stored in the computer memory
Presented at ECMA's 12th International Conference & Exhibition-2019

Page 16
OBD Simulation on Synthetic Gas Reactor of
by measuring OSC
Presented at ECMA's 12th International Conference & Exhibition-2019
Page 17
• For OSC assessment on vehicle, procedure followed by some EMS
supplier is
– Deplete stored oxygen in catalyst at Rich A/F
– Leaning A/F
– Time delay in pre and post lambda sensor or amplitude corresponding
to threshold ME limit
• Same procedure is simulated on Synthetic gas for OBD calibration
• Procedure has been established to quantify OSC by using Broad
Band Lambda sensors
OSC Measurement and simulation on Synthetic Gas Reactor
Presented at ECMA's 12th International Conference & Exhibition-2019

Page 18
OSC measurement on synthetic Gas Rig
Presented at ECMA's 12th International Conference & Exhibition-2019
• Temperature Setting 550 °C
• Cycle Timing 120 sec/120 sec R/L/R/L/R/L/R/L/R/…..
Duration: 4.5 cycles; 120sec settling time
l
Time
L
R
L
R
L
R
L
R R
Space Velocity (hr-1) per catalyst: 60k
Monolithic Catalysts
Post cat heated O2 sensorPre cat heated O2 sensor

Page 20
Methodology for OSC Estimation
% age OSC of aged Catalyst
w.r.t Fresh
Pre Cat signal
Presented at ECMA's 12th International Conference & Exhibition-2019
FA
𝐎𝐒𝐂% =𝑨𝒓𝒆𝒂 𝒐𝒇 𝑨𝒈𝒆𝒅 𝑪𝒂𝒕𝒂𝒍𝒚𝒔𝒕 (𝑨)
𝑨𝒓𝒆𝒂 𝒐𝒇 𝑭𝒓𝒆𝒔𝒉 𝑪𝒂𝒕𝒂𝒍𝒚𝒔𝒕 (𝑭)∗ 𝟏𝟎𝟎
Post Cat Signal – Fresh
Post Cat Signal- Aged
Page 21
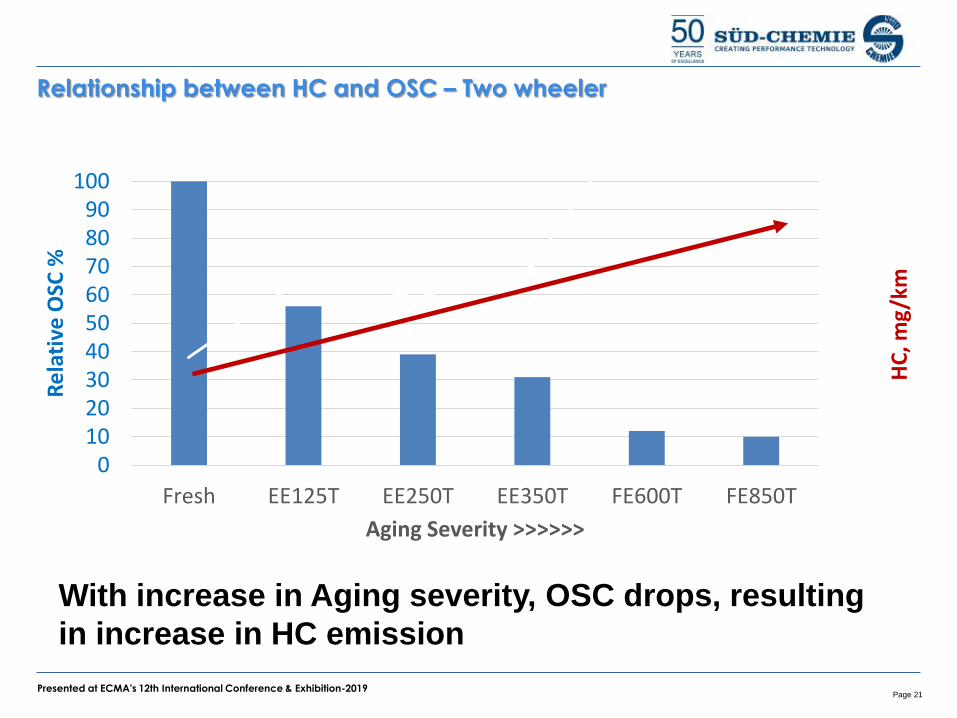
Relationship between HC and OSC – Two wheeler
0102030405060708090
100
Fresh EE125T EE250T EE350T FE600T FE850T
HC
, mg/
km
Re
lati
ve O
SC %
Aging Severity >>>>>>
With increase in Aging severity, OSC drops, resulting
in increase in HC emission
Presented at ECMA's 12th International Conference & Exhibition-2019

Page 22
Test Results on BS-VI washcoat Technology
Presented at ECMA's 12th International Conference & Exhibition-2019

Page 23
Effect of WC on Light-off @ 0.97 lambda
Presented at ECMA's 12th International Conference & Exhibition-2019
0
100
200
300
CO-LOT HC-LOT NOx-LOT
LOT,
deg
C
60 g/cft WC-L 60 g/cft WC-M
All catalysts prepared with same PGM ratio
HC-LOT lowered with change of wash coat chemistry

Page 24
HC-LOT vs WC’s @ 1.0 Lambda (GHSV 100,000 1/h)
Presented at ECMA's 12th International Conference & Exhibition-2019
0
50
100
150
200
250
860C2-60 910C2-60 901C2-60
HC
-LO
T &
%C
on
.
Wash Coat & PGM Loading
HC-LOT @ 1.0 lambda & %Con. @ 450 deg C
HC-LOT HC%
All pristine samples are loaded with the PGM of 60 g/cft

Page 25
NMHC dilute emission comparison Gen-1 & Gen-2
0
20
40
60
80
100
0100200300400500600700
0 100 200
Veh
icle
Sp
eed
Km
ph
NM
HC
pp
m
Time (Sec)
0
50
100
150
Phase-1 Phase-2 Combined(30:70)
Mas
s Em
issi
on
, mg
/km
0
20
40
60
80
100
120
0
10
20
30
40
50
0 100 200 300 400 500 600 700 800 900 1000 1100 1200
Veh
icle
Sp
eed
Km
ph
NM
HC
Cu
mu
lati
ve
mg
/km
Time (Sec)
THC __Gen_1 THC __Gen_2 Speed (Kmph)
Presented at ECMA's 12th International Conference & Exhibition-2019
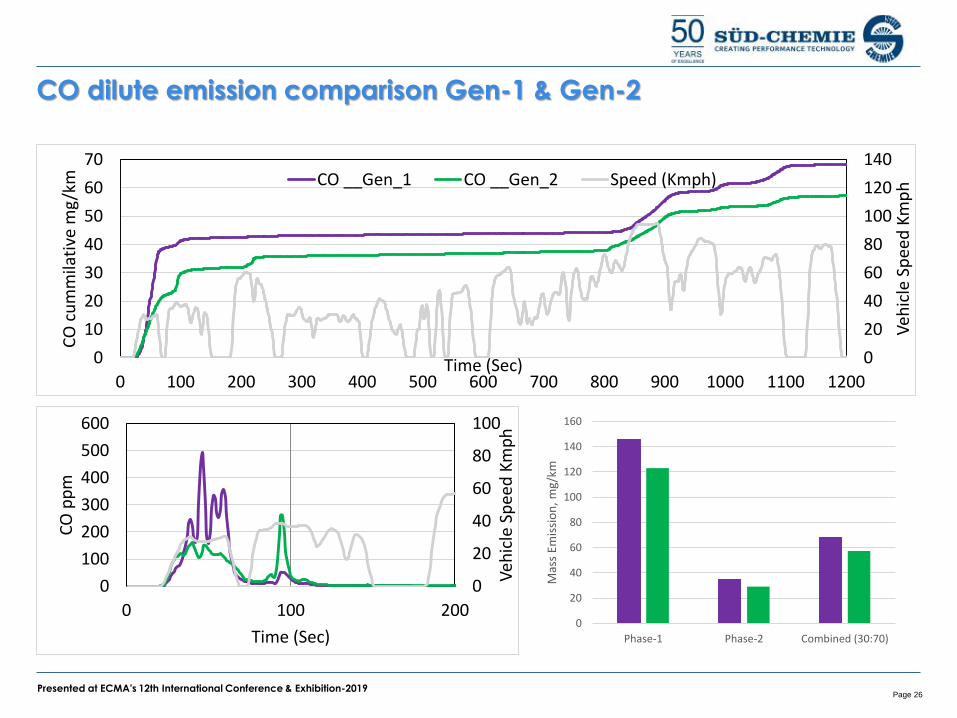
Page 26
CO dilute emission comparison Gen-1 & Gen-2
0
20
40
60
80
100
120
140
0
10
20
30
40
50
60
70
0 100 200 300 400 500 600 700 800 900 1000 1100 1200
Veh
icle
Sp
eed
Km
ph
CO
cu
mm
ilati
ve m
g/k
m
Time (Sec)
CO __Gen_1 CO __Gen_2 Speed (Kmph)
0
20
40
60
80
100
0
100
200
300
400
500
600
0 100 200
Veh
icle
Sp
eed
Km
ph
CO
pp
m
Time (Sec)0
20
40
60
80
100
120
140
160
Phase-1 Phase-2 Combined (30:70)
Mas
s Em
issi
on
, mg/
km
Presented at ECMA's 12th International Conference & Exhibition-2019

Page 27
NOx dilute emission comparison Gen-1 & Gen-2
0
20
40
60
80
100
120
140
0
2
4
6
8
10
12
14
0 100 200 300 400 500 600 700 800 900 1000 1100 1200
Veh
icle
Sp
eed
Km
ph
NO
x C
um
mila
tive
m
g/k
m
Time (Sec)
NOX _Gen_1 NOX _Gen_2 Speed (Kmph)
0
20
40
60
80
100
0
20
40
60
80
100
0 100 200
Veh
icle
Sp
eed
, km
ph
No
x, p
pm
Time,s
0
5
1015
2025
30
35
Phase-1 Phase-2 Combined(30:70)
Mas
s em
issi
on
, mg
/km
Presented at ECMA's 12th International Conference & Exhibition-2019

Page 28
Mass emission performance for Fresh and Aged Catalysts
Presented at ECMA's 12th International Conference & Exhibition-2019
0
10
20
30
40
50
60
CO/10 THC NMHC NOx
Mas
s em
issi
on
, mg
/km
BS-6 V-1 Limit Fresh Ageing-2 Ageing-3

Page 29
BS-4 Catalyst aging comparison on Class 2.1 Motorcycle
ED Aging Condition
Mode Condition
BrickTemperature ,Degc
Time, Hr
Avg.Lambd
a
CO (% Vol)
O2(% Vol)
1 Stoichiometric 850-870 50 1.014 3.79 1
Road Aging HT Aging
Presented at ECMA's 12th International Conference & Exhibition-2019
0.0
0.5
1.0
1.5
2.0
Fresh HT Aged 900C/ 4h
50 Hrs EDAged
Aged_Veh@15000km
Emis
sio
n, g
/km
y = -1E-06x + 1.4319R² = 0.0135
y = 5E-06x + 0.2903R² = 0.641
y = 3E-06x + 0.1047R² = 0.8698
0
0.5
1
1.5
2
2.5
0 10000 20000 30000
Emis
sio
n, g
/km
Vehicle run, km
CO HC NOx

Page 30
BS-6 Catalyst Durability of WMTC Class 2.2 Vehicle over SRC
0 2000 4000 6000 8000 10000 12000 14000 16000 18000 20000
CO
/10
, HC
, No
x, N
MH
C
mg
/km
Kms over SRC
THC NOx NMHC CO/10Linear (THC) Linear (NOx) Linear (NMHC) Linear (CO/10)
BS-6 Limits: CO, HC NOx, NMHC
Presented at ECMA's 12th International Conference & Exhibition-2019

Page 31
New Generation low LOT washcoat has met BS-VI engineering
Target including durability across various models with different
OEM
SCIL is equipped to perform accelerated catalyst aging on
Engine Dynamometer as per the procedure defined in AIS-137
for two wheeler
Developed methodology to measure OSC of catalyst on
Synthetic Gas reactor in a similar manner as followed on
vehicle for OBD-II simulation
Conclusions
SCIL is equipped to work closely with OEM’s on After
treatment system - complying to OBD-II
Presented at ECMA's 12th International Conference & Exhibition-2019

Page 32Presented at ECMA's 12th International Conference & Exhibition-2019