bsi afs 2009.pdf - sharedata steel_ar_mar09.doc · web viewbsi steel limited group of companies...
TRANSCRIPT

LIMITED
ANNUAL REPORT 2009

2
ProfileBSi Steel Limited group of companies (“BSi Steel” or “BSi” or “BSI” OR “the Company” or “the Group”), operates in the steel and
associated industries with strategically located operations in South Africa, the Democratic Republic of Congo (DRC), Zimbabwe
and Zambia servicing the southern African markets.
The operations are grouped into four distinct activities:-
Processing: providing a primary processing service to the BSi operational businesses;
Stockists: providing a just in time (JIT) service to localized clients;
Bulk Sales: bulk sales to larger end users; and
Exports
The South African and Zimbabwean operations focus on the manufacturing and construction industries, whilst the Zambian and
DRC are largely focused towards mining.
The main products that the group sells are:-
Flat products (hot rolled, cold rolled, galvanized and plate);
Long products (light, medium and heavy mill sections, tubing) and
Structural steel sections
2
ContentsPAGE
Administration 4
Financial Highlights 5
Directorate 6
Chairman’s Report 8
Chief Executive Officer’s Report 11
Human Capital Sustainability Report 14
Corporate Governance Report 17
Remuneration Report 22
Directors Responsibility and Approval Statement 26
Secretarial Certification 26
Independent Auditors Report 27
Directors’ Report 28
Balance Sheets 30
Income Statements 31
Statements of Changes in Equity 32
Cash Flow Statements 34
Notes to the Annual Financial Statements 35
Shareholders Analysis 82
Notice of Annual General Meeting 83
Form of Proxy 87

2
Administration
Company Secretary and registered officeS Hackett, B.Com.
46 Eden Park Drive, Murrayfield ParkMkondeni, Pietermaritzburg, 3201PO Box 101096, Scottsville, 3209
Telephone: (033) 846 2208Facsimile: (033) 346 0870
Transfer SecretariesComputershare Investor Services (Pty) Limited
(Registration number 2004/003647/07)Ground Floor, 70 Marshall Street
Johannesburg, 2001PO Box 61051, Marshalltown, 2107
Telephone: (011) 370 5000Facsimile: (011) 688 5210
Designated AdviserVunani Corporate Finance
Trading as a division of Vunani Capital (Proprietary) Limited (Registration number 1998/001469/07)
Vunani House Block CAthol Ridge Office Park, 151 Katherine Street
Sandown, Sandton, 2196PO Box 652419, Benmore, 2010
Telephone: (011) 263 9500Facsimile: (011) 784 1989
AttorneysVenn Nemeth & Hart Inc.
(Registration number 1994/003593/21)281 Pietermaritzburg Street,
Pietermaritzburg, 3201PO Box 600, Pietermaritzburg, 3200
Telephone: (033) 355 3100Facsimile: (033) 394 1947
Auditors and reporting accountantsDeloitte and Touche
(Practice Number 901482)81 Hoosen Haffejee Street,
Pietermaritzburg, 3201PO Box 365, Pietermaritzburg, 3200
Telephone: (033) 345 0271Facsimile: (033) 345 0285
Commercial BankerNedbank Limited
(Registration number 1951/000009/06)90 Braam Fischer Road, Durban, 4001PO Box 10267, Marine Parade, 4000
Telephone: (031) 364 1111Facsimile: (031) 364 2479

2
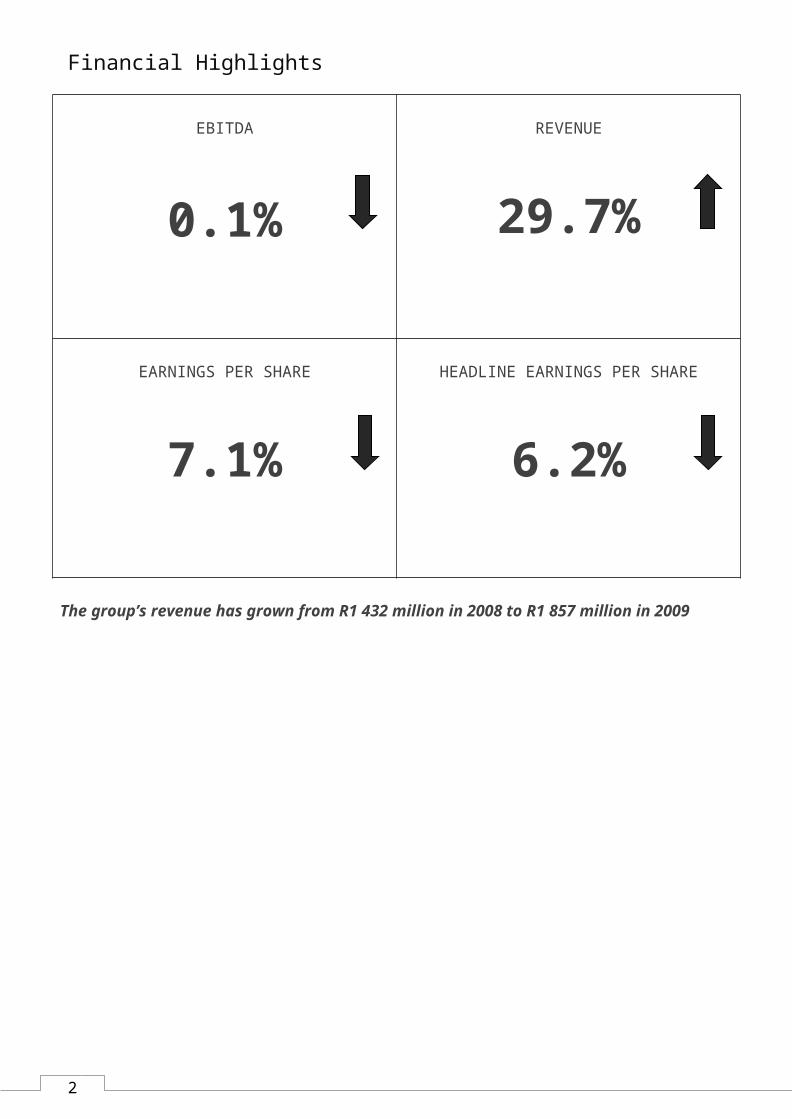
Financial Highlights
EBITDA
0.1%
REVENUE
29.7%
EARNINGS PER SHARE
7.1%
HEADLINE EARNINGS PER SHARE
6.2%
The group’s revenue has grown from R1 432 million in 2008 to R1 857 million in 2009

2
DirectorateWilliam Battershill – Executive Director: Group Chairman (48)
William left school aged 17 and commenced his working career with his father, John Battershill, at his manufacturing and
agricultural supply company in Zimbabwe. He immigrated to RSA in 1981 and worked for Way Industries, a manufacturing
company in Qwa Qwa, where he was appointed as a Director at the age of 23. In May 1985, William resigned from Way Industries
and started Discount Steel. This was the founding company from which BSi was spawned. William’s strengths are his broad based
understanding of business and his ability to recognize and convert business opportunities.
Grant Mackenzie – (MBChB) Executive Director: Group CEO (44)
Grant started his working career at a subsidiary of Anglovaal in 1994, after a 5 year stint as a medical doctor (UCT 1989). In 1995
he moved to Lusaka, Zambia, where he was instrumental in starting Discount Steel Zambia in 1997. He returned to South Africa in
2006 as the Managing Director of the Exports Division, and continued to expand the exports operations into overland Africa. Grant
was appointed as the Chief Operating Officer of BSi in May 2007, Joint CEO in April 2008 and Group CEO in April 2009.
James Waller – (BCompt Hons) Executive Director: Group CFO (45)
James completed his articles with KPMG Inc. before moving into commerce. He worked as Financial Director of Positron, Purdon
Murdock and Waller, ATM (Pty) Limited and Terrafin Management Services (Pty) Limited. In 2001 he was appointed as Financial
Director at BSi. James comes with a wealth of experience gained in the industry and has been instrumental in managing the
group’s growth.
Ross Teichmann – Executive Director: BSi STEEL Gauteng (44)
Ross started a fencing business in Pietermaritzburg in 1987. In 1990 he joined McNaughtans where he ran the Empangeni branch
for 18 months and then moved back to Durban as the Sales Manager for the region. Ross joined Discount Steel in 1991 as a Sales
Representative and was responsible for the Durban region for 3 years. He relocated to Johannesburg in 1995 to start Garrison
Steel. Ross has been with BSi for the last 18 years and has contributed to the success of the steel business through his extensive
experience of the steel industry. Ross was appointed as the Executive Director of the SA based BSi Steel Stockists in April 2008.
Craig Parry – Executive Director: BSi STEEL Bulk Sales (40)
Craig commenced his working career at Nampak Limited as the Production Planner for laminated and coated products. Craig
joined Discount Steel in 1992 taking responsibility of the trading division of the group. He has now been with the group for 16 years
and has a wealth of experience in the steel industry. Craig was appointed as the Executive Director of BSi Steel Bulk Sales in April
2008.
Directorate (continued)
2
Nigel Payne – (B.Com (Hons), CA (SA), MBL) Independent Non-Executive Director (49)
Joined the board in 2007. Nigel is an experienced independent non-executive director who currently serves on the boards of a
number of other listed companies, namely the JSE Limited, the Bidvest Group Limited, the Mr Price Group Limited and Glenrand
MIB Limited, where he generally chairs the audit and/or risk committees. He also serves on the boards of some significant non-
listed entities. Nigel is a member of the King Committee on Corporate Governance.
Dr Richard Lewis – (B.A., LL.B., MBA., D.JURIS) Alternate Non-Executive Director (50)
Appointed 12 May 2008. Richard is the principal associate of Richard Lewis, Smith & Associates CC, a firm specialising in
strategic planning, human resources, and leadership development. Richard completed his BA, LLB degrees at the University of
Natal where after he became an advisor with the Natal Chamber of Industries for two years. He then went to live in Germany to
lecture at the Euro-Akademie, Cologne. Whilst there, he completed an MBA degree and a Doctorate in Law. Primarily a strategist,
Richard is also specialised in corporate governance. He is a member of the SA Board of Personnel Practitioners, and was also
past ‘Director: South Africa’, of the German SA Trade Organization. He is a member of the SA Society for Labour Law and the Vice
Chairperson of the Wildlife Society of SA with the Strategy and Corporate Governance portfolio responsibility. Richard is a non-
executive Director of Wynleigh International (a quality compliance management systems company) and of The Evolution
Consulting Group.
Butana Khoza –(B.Com, PGDA, CA(SA)) Independent Non-Executive Director (42)
Appointed 13 June 2008. Butana qualified as chartered accountant in 1994 and has worked in various capacities in the financial
services sector over the last 13 years, first within the Southern Life group and subsequently with African Harvest. He was one of
the founding members of African Harvest’s investment banking subsidiary and a member of the team that led to a management
buyout of African Harvest Limited’s operating businesses that culminated in the establishment of the diversified financial services
group Vunani Limited. He is an executive director of Vunani Limited, responsible for the group asset management cluster.
Mark Anderson - (B.Com (Hons),CA (SA)) Alternate Independent Non-Executive Director (48)
Appointed 13 May 2008. Mark has been involved in corporate finance activities since 1991. Mark joined African Harvest Capital in
1998 and was involved in a management buyout in 2004 which led to the formation of Vunani. He has headed up Vunani’s
investment activities since 2004. Mark is a Director of Vunani Limited, a company listed on the JSE’s AltX.

2
Chairman’s ReportPerformance Overview
Revenue - Up 29.7%
Attributable earnings - Up 1.0% to R100. 3m
Earnings per share - Down 7.1%
HEPS - Down 6.2%
Net tangible asset value - Up 41.0% to R397. 7m
The last 12 months ending March 2009 are recognised as the most volatile period in the history of the steel industry; from extraordinary demand and unprecedented profits from April to August 2008, the world saw a dramatic slump in volumes and pricing, causing massive losses by steel mills and distributors alike.
BSi Steel managed these difficult times by cutting back on inventories, reducing costs and focusing on ex-stock trade. Our stock replenishment program was aimed at ‘same month sales’, thereby ameliorating inventory losses on the back of ongoing steel price drops. Nevertheless, the H2 was characterised by severe stock losses and low trade volumes. Given the extraordinary circumstances, I feel that BSi posted an acceptable profit for the period.
International Steel Industry Outlook
The only certainty at this juncture is uncertainty; volatility will prevail in world markets for at least 12 months. The period will be punctuated by a few false-starts, where pricing will increase, only to slump back within 2 to 5 weeks. Severe production cut backs have already begun to take effect – up to 75% in some regions. Prices seem to have stabilised towards the middle of May, with some products edging up a few percentage points. It is likely that there will be some short-term shortages in certain sectors/products as mills try to balance production with demand. An ongoing reduction in price seems unlikely at this stage, as most mills are losing money and would sooner cut production than sell at a loss.
Prospects for the year ahead
Despite the prevailing sense of gloom and doom, we believe these tough times present BSi with some excellent opportunities. Our new Klipriver operation now provides us with a much needed platform to grow the business for many years, with relatively low future CAPEX requirements.
Our 5-point growth program remains unchanged, albeit with a shift of emphasis from last year:
1. Organic Growth:
Remains central to our growth program. Relative to other growth initiatives, it provides us with the lowest risk and highest return.
2. New Products and Services:
Are extensions of organic growth. Adding new products to our marketing platform is relatively easy to do. This includes ongoing growth in structural sections and plate, with the addition of corrugated roofing, slit strip and blanks this year. The processing plant bears special mention; as we intend to increase our value proposition through increasing the capacity and variety of our processing equipment. We have now installed our RBI cut-to-length line, the refurbished slitting line and batch blanking line.

2
Chairman’s Report (continued)
Our 3 new roofing lines will be installed in June/July, followed by our new 2000 x 6mm cut-to-length line in Sept/Oct 2009. This additional capacity and new processes will give us the tools to support an ongoing growth campaign, both in existing and new lines.
3. Geographic:
We continue to drive geographic growth, aiming at increasing our US Dollar based earnings. Our new office in Mauritius offers us a platform to grow our USD balance sheet.We opened an operation in Zimbabwe on 1st May and will continue to increase our direct export trading markets.
4. Acquisitions:
The climate for successful acquisitions is upon us and is likely to prevail for at least 12 months. Price expectations will be moderated significantly from previous unrealistic highs.We will target companies offering us geographic diversity, a synergistic fit, good management and a proven profit record.We will pay special attention to how such companies have performed in the tough conditions.
5. BBBEE:
Opportunities will kick in this year, now we are officially compliant (level 7). It is our intention to improve our rating over the next 3 to 4 years.
This growth drive will be for new business, where we were previously unable to quote BBBEE sensitive buyers and markets.
Directorate
The following changes were made to the Board:
Name Change
W L Battershill 01 April 2009: Steps down as Joint CEO, remains as Group Chairman
G D G Mackenzie 01 April 2009: Takes over as Group CEO, was Joint CEO
The remaining Board members retain their positions.
Note of appreciation
It is in tough times that the true mettle of a man is tested; I can say without reservation that the Directors and staff of BSi have resolutely stuck to their posts whilst the business world as we know it deteriorated before our eyes.
I convey my heartfelt and sincere appreciation to each and every one of you for your unstinting efforts; you are an inspiration to me and pleasure to work with.
To our clients; I thank you for your support, especially during our move, where service levels were not up to our desired standards. We remain committed to improving our service and quality to ensure we remain your supplier of choice.
Chairman’s Report (continued)

2
To the shareholders, a special thanks for standing by us through these turbulent times. We have promised you long-term growth and we will deliver; be assured of this. Your investment remains in the hands of a capable, dedicated and ambitious team.
We remain committed to building a centre of excellence in the steel industry. These tough times will not dull our blade, merely reinforce our will and serve to hone our skills.
Mine’s a Hansa,
Love Will
W L BattershillCHAIRMAN

2
Chief Executive Officer’s Report
Introduction
BSI Steel Limited is a distributor of primary steel products within South Africa and the Southern African region. We play a buying, importing, coil processing, stocking, distribution, financing and exporting role within the value chain.
Our business is divided into three segments:
1. Bulk sales
2. RSA Stockists
3. Exports
These segments are under-pinned by our growing investment in the primary processing of steel coils. This value-added service allows us to access more customers and therefore more volume.
Bulk Sales
This division based in Pietermaritzburg acts as a wholesaler and volume trader of steel to larger end-users right across South Africa. Material is procured from both local and international sources and offers an alternative to mill supply to our customers.
RSA Stockists
This division comprises two stocking operations, BSI Gauteng based in Klipriver (south of Johannesburg) and BSI KZN in Pietermaritzburg in Kwazulu Natal. These merchants typically offer a just-in-time service to our customers delivering same or next day, with our own fleet of trucks. Emphasis is on high service levels and customer loyalty. Product diversification is an important theme of our growth strategy for these businesses, particularly borne out of our increasing capacity from our processing division.
Exports
We divide this segment into stockists and export trading:
The stockists are based in Zambia (Lusaka and Kitwe) and the Democratic Republic of Congo, (Lubumbashi and Kolwezi), and recently in Zimbabwe (Harare and Bulawayo). These businesses provide a JIT service to their customers and source from SA and regional mills and occasionally from blue-water imports. Their customer mix is both cash sale walk-in trade as well corporate customers requiring credit. The DRC and Kitwe customer base is predominantly mining, while Lusaka is construction, manufacturing and agribusiness. BSI Klipriver provides the logistics service in getting the steel consolidated and shipped to the African operations.
The export trading division handles bulk sales of steel for the larger users within overland Africa, including Namibia, Botswana, Zimbabwe, Zambia, DRC, Malawi and Mozambique. They complement the stocking operations and typically have a different client mix and handle a much wider range of products. Each region has specialist traders concentrating on those markets and regular trips into Africa are made by these traders to maintain customer loyalty and keep abreast of developments. The new office in Mauritius plays a sourcing role for our African operations, buying from South Africa, regional African mills as well as blue-water imports. It will also look for export opportunities into the Indian Ocean Island markets in due course.
Chief Executive Officer’s Report (continued)

2
The year in reviewThe year April 2008 to March 2009 can be divided into 2 markedly different trading environments. The first half was characterised by unprecedented steel price increases and a huge surge in apparent demand. This demand was not able to be met by the mills resulting in significant rationing of product by the steel mills.
The second half sparked by the global financial crisis saw steel prices collapse and apparent demand drop severely as a result of aggressive de-stocking right through the steel supply chain. Sectors most severely affected were automotive, mining, white goods, housing and certain sub-sectors within manufacturing. Only those manufacturers exposed to the government infrastructural spend continued relatively unaffected.
While BSI Steel endeavoured to maximise the favourable trading conditions between April and August 2008, the severe supply constraints from the mills prevented us from meeting customer demand to our satisfaction. While this was mitigated by imports and regional buying, this did result in some lost opportunity. Nevertheless we did manage to post a record after tax profit for the period to September 30th of R127m.
When world steel prices started decreasing in September 2008, the local mills started cutting prices in unison and this continued for the remainder of our financial year until March 2009. This resulted in BSI incurring significant and successive stock write downs in the second half of the financial year. In addition due to severe industry-wide de-stocking, our margins came under pressure as the stockists competed with one another to dump depreciating stock. Stock in fact became a liability – the more stock one carried at month-end, the more one wrote down. The de-stocking exercise took longer than projected due to the lag in the mill pipeline and this hit us and our competitors further, the material arriving at historically high prices further aggravating the write-downs and depressing margins.
We have thus had a very interesting and challenging year from a trading point of view! We remain, however, a company committed to sustainable growth, and are continually looking to improve our product offering and our geographic footprint.
During the frenetic trading activity of F2009, we managed three significant projects that will give us the platform to continue growing sustainably in South Africa and Africa.
1. We relocated all our Gauteng-based operations to a purpose-built 23 ha site in the south of Johannesburg. This comprises a new office block for all our employees, 20,000 square metres of warehousing, housing both our stock and our expanding processing facility
2. We moved our cut to length & blanking line and installed our refurbished slitting line within the new facility. We are now gearing up to install our second CTL line in August 2009.
3. We did a full new ERP implementation across the group which will give us the business intelligence to properly manage our business and drive our growth strategy. In addition, all our African operations are being linked to our single instance via VSAT allowing greater control, rationalising staff functions and costs and improving synergies with the rest of the group.
The distracting nature of these projects cannot be under-estimated and we probably lost opportunity and some efficiencies as a result. However, they are now completed and we can now look forward to the competitive edge they will give us.
Broad Based Black Economic EmpowermentWe remain fully committed to BBBEE and see it as an important mechanism for creating opportunity for the previously
disadvantaged sectors of our society. We also see it as an opportunity and we will endeavour to improve on our level 7 score,
targeting level 4 within 4 years.
Chief Executive Officer’s Report (continued)
Health and safety

2
With our move to our purpose-built processing and distribution centre in Klipriver, we have a world class facility that is staff-friendly, ergonomic and has huge potential for expansion. It also allows us to expand on our vision of excellence, quality and safety.
Health and safety in particular is an absolute priority at BSI Steel at all our branches and sites.
Word of thanksI’d like to thank the staff of BSI for the way you have remained positive in what have been very difficult times both from a business point of view, but also I am sure, in your own personal situations. Recessions are like winter – they are harsh and severe and tough to live through; but there is also a sense of renewal that comes from the die-off, the old leaves making way for the new. All things in life are cyclical and economies are no different. Things will get better and we need to prepare ourselves for the next growth cycle.
Thank you to our shareholders who have also been through very challenging times. Your support has been much appreciated and I can assure you that BSI Steel remains a driving force within the SA and SADC steel fraternity. Your executive and management team remain committed to growing this business sustainably and profitably.
Lastly, thank you to our customers. We have had a very volatile year with much change and thankfully the big projects are behind us. We will continue to expand our product offering and strive to exceed your expectations of service and quality.
Yours,
G D G MackenzieGROUP CEO

2
Human Capital Sustainability ReportIntroduction
BSi Steel has the vision to build our reputation with all our key stakeholders as being the “employer of choice” within the steel industry. It’s with this vision in mind that we have contextualised the unique, unprecedented challenges that have been faced by the company in recent times and the impact these changes are having on the performance and sustainability of our human capital.
On the local front the steel market has moved from an artificially buoyant position of high demand and high profit down to a sluggish trading market in under six months. This sudden change in operating condition has resulted in immediate action being taken to boost staff morale and provide secure, inspirational leadership in these changing times. The positive attitude and proactive behaviour of our people is as important to the business in these difficult trading conditions as prudently managing our stock levels and cash flow.
Our steadfast commitment to continue undeterred with transformation and B-BBEE initiatives, company culture unification, skills transfer and development, talent sourcing and retention, diligent performance management, health and safety awareness and employee well being programs have given us the competitive edge over the rest of the market to face these operational pressures head on at full speed with a supportive team behind us.
BSi Steel Culture
At the forefront of our human capital intervention is to ensure that the True North principals contained in our Vision, Mission and Behaviour Code are positively reinforced on a regular basis across the Group. It’s through this approach that we have continued to build a proactive, empowered, positive and synergistic team spirit within BSi Steel, despite tough trading conditions.
All our new staff go through Covey’s “personal effectiveness” training during their induction to make sure that the way we operate throughout each division of the business is centered on teamwork values and principles.
Our feedback and communication with staff is frequent and informal, allowing them insight into future plans for the organisation so that a sense of belonging is fostered within our work teams. Our company magazine, “Steel Talking”, is published to all staff with the intention of making sure that everyone feels involved and informed with regard to company performance and that they build a sense of community spirit across all our regions, both on the local and export markets.
Annual perception surveys are run by the HR Team to gauge exactly how engaged staff are within the various teams and to help identify any weak areas, which are then actively targeted for improvement by corrective action plans.
Talent sourcing and retention
BSi Steel is critically aware that the competition for talent is of primary importance to our future success. It’s imperative that we bring the best people into the organisation and make sure that we retain them in a fiercely competitive market.
The company prides itself on a rigorous recruitment process wherein every attempt is made to match potential recruits to the job function as well as to the culture of the business. Much success has been achieved by making use of referral based recruitment and other more creative recruitment strategies.
We have recently introduced a graduate development programme, where young talent is brought into the business to gain valuable work experience and at the same time for the company to have the ideal opportunity to select those graduates with the most potential to fill any vacancies. This is a win-win initiative for both parties and ensures that we build our leadership and priority skills pipeline today so that we have no shortfall in the future.
Retention of talent is as complex and difficult as sourcing the talent and as such we have put in place mechanisms such as career paths, regular performance measurement and feedback, incentives, recognition bonuses and aggressive development plans to ensure that we retain our talent and don’t have them leave to join other employers.
2
Human Capital Sustainability Report (continued)
Leadership development
In order for our staff to have a meaningful, fulfilling experience working at BSi Steel we need to ensure that staff have the best leaders possible. All our leaders from middle management level and above have a uniquely tailored Personal Development Plan, are mentored regularly by a personal coach and are continually evaluated on the impact of their leadership effectiveness through our strong focus on leadership in our performance management system.
Succession planning
At BSi Steel we believe in preparing for the future today and as such we have recently undertaken to introduce a comprehensive Succession Plan for each position in the Group on a middle management and above level.
All key performance area, itemised per position, is outlined in this plan with a breakdown of which other person within the business is capable of assuming this function in time to come. The exact timeline is then plotted out in terms of when the successor will be ready to fill the role so that we can co-ordinate the urgency of such placements to coincide with when these people are operationally needed to take over the reins.
Training and Development plans are geared around this information to ensure alignment to group strategy and if a gap is identified where no candidate is seen as a possibility from within the company relevant recruitment measures are indentified and projected according to time frame to make certain of no manpower planning shortfalls in any key position throughout our operations.
Employment equity
As an organisation we subscribe to the unique, dynamic richness of a diverse workforce equitably representative of the national demographic profiles of the countries we operate in. We believe in employing the best person for the job, irrespective of race, gender, age, or any other classification. Our behavior code guides us in selecting people with a positive attitude and strength of personal character that elevate them above the masses out there on the job market. Strong target areas that we would like to improve on will be to recruit and develop African Female and Disabled employees across all levels.
We have an Employment Equity Committee, which sits once a quarter to give feedback to top management on the progress made towards the EE Plan targets, as well as to discuss any attitudes/perceptions in the workplace to do with employment equity. A mutually beneficial relationship with our Trade Union, NUMSA, is utilised to embark on meaningful conversations on how to ensure that there is no discrimination in any policy or practice within the business. Our current Employment Equity Plan runs through to October of 2010, at which time the next 5 year plan and equity targets will be established by the committee.
Transformation and Broad Based Black Economic Empowerment
A stable, demographically representative economic market in South Africa is fundamental to the sustainability of the business and our future growth on the local market. BSi Steel has embraced transformation within the organisation and we are proud to have been independently rated by EMEX as a LEVEL 7 B-BBEE contributor as at April 2009.
Most important to us is that Transformation is not a stand-alone strategy/committee and therefore we have woven our Transformation and B-BBEE strategic plan into our overall Company Strategy so that the alignment of the two strategies is guaranteed to make business sense at all times.
It is our intention to work toward achieving a LEVEL 6 rating in our next assessment at the end of the 2010 fiscal. In order to achieve this improved rating we will be prioritising skills development initiatives (learnerships, internships, experiential learning and disabled training) and undertaking more synergistic enterprise development initiatives that feed directly into the business synergies. With our commitment to Employment Equity and Skills Development our objective is to improve our management control scorecard element over time and continue to look at economically sound B-BBEE ownership measures.
Our preferential procurement practices will continue to focus on developing business links with black owned and black SMME suppliers and further to this we hope to see Arcelor Mittal coming through with a B-BBEE rating before our next rating is concluded mid 2010.
Human Capital Sustainability Report (continued)
2
BSi Steel is a community focused business and we have always contributed extensively to non-profit organisations across our operating regions. Beneficiaries include Hospice, Reach out with Love, PMB Community Chest, Icare, Little Eden, the Starfish Foundation and many more.
It’s our intention to continue helping those in need over the coming year, however in addition for the coming year we are going to be awarding bursaries to under privileged students and making sure that such bursary awards feed sustainably into our graduate development programme wherever possible.
Skills development and training
In order to remain competitive, stay abreast with current technology and be seen as an employer of choice, BSi has recognised the utmost importance of strategically aligned skills development and training for all our staff. Of primary focus within our training and development strategy is to ensure that we facilitate the advancement of staff to reach their own personal stretch goals of developing within the company over a long term career.
Much of our training budget is spent on the training of interns and learners, on leadership development, ERP systems and on staff in the lower echelons of the business who need basic education skills training (ABET) in order to improve their quality of life. Our Skills Development Committee ensures that all training is approved by line management and our trade union representatives in order to offer meaningful training to uplift all levels of the organisation.
Our challenge for the coming year is the introduction of internally created training interventions for every position in the organisation to increase efficiency and knowledge base at core level within the company without having to rely exclusively on generic external training programs. Our vision is to be a centre of excellence and in order to do so we need to have a system of continual evaluation and improvement with appropriate learning interventions that maximise the transfer of skills and competencies.
Safety, health and the environment
Working with steel products and heavy machinery requires that we put safety first at all times. Our safety procedures have recently been fully audited and our documentation updated to reflect current best practice that is being rolled out to all staff via our health and safety committees on each base.
In addition we take care of employee well being by offering wellness campaign free medical testing, stress management, counseling, HIV and AIDS awareness and give advice on matters of personal finance.
New HR information system
Over the course of the last year BSi Steel has invested in developing, testing and installing a new HR Information System – VIP Genesis. This new system will automate and standardise HR reporting and at the same time give line managers direct access to staff information in order to make quick, empowered decisions with regard to their Human Capital.
BSi Steel has had a challenging 2009 year with many peaks and troughs, but one thing that has remained constant throughout this last year and will remain unchanged as we look forward into the coming year is that our people make BSi Steel what it is and what we invest into our people is the level of success we can expect to see from our results.
A very simple concept, but then again one of our main Behaviour Code elements at BSi Steel is to KEEP IT SIMPLE!
Chantal LombaardGROUP HR EXECUTIVE

2
Corporate Governance ReportIntroduction
The Board of directors subscribe to the principles of good corporate governance including discipline, independence, accountability and responsibility as set out in the 2002 King Report on Corporate Governance for South Africa (King II). BSI has complied in all material respects with the recommendations contained in King II and the requirements for corporate governance of the JSE Limited.
Board of directors
The Board operates in terms of a formally approved charter which sets out its role and responsibilities including:
retain full and effective control of the company
give strategic direction to the company
ensuring that an adequate and effective process of corporate governance is established and maintained
identify and regularly monitor key risk areas and key performance indicators of the business
ensure that the group communicates with shareowners and relevant stakeholders openly and promptly
regularly review processes and procedures to ensure effectiveness of internal systems of control and accept responsibility for
the total process of risk management
assessing the performance of the Board, its committees and its individual members on a regular basis
appointments to and removals from the Board including the appointment of the chairman, chief executive officer, executive
directors and non-executive directors, and the approval of nominations of alternate directors
the formulation if recommended of policies in relation to equal opportunity employment, black empowerment, environment,
health and safety
As at 1 April 2009 Mr. WL Battershill relinquished the role of joint of Joint CEO, and Mr. G D G Mackenzie was appointed CEO.
There have been no other changes to the Board.
The Board has a unitary structure, and at the time of publishing this report, comprised an executive chairman, W L Battershill, four executive directors, G D G Mackenzie (CEO), C Parry, W R Teichmann, and J R Waller (CFO), and two independent non- executive directors, N G Payne (alternate R G Lewis) and B M Khoza (alternate N M Anderson). All directors have attended the AltX Directors Induction programme. King II recommends that the majority of a Board of directors should consist of non-executive directors; however the Board considers the BSI structure to be appropriate for a company of this size and nature. A brief CV of each director can be found on page 6 and 7 of this report.
The non-executive directors hold shares directly and indirectly in the company, and receive no benefits from the company other than director’s fees. They are high calibre individuals with a wealth of knowledge and experience, and are fully independent of management.
A clear division of responsibility is maintained across the Board, precluding any one director from exercising unfettered powers of decision making.
Current executive director’s service contracts are for a period of 5 years and non-executives for two years. In terms of the articles of association of the company, Messrs G D G Mackenzie, N G Payne and C Parry retire by rotation at the annual general meeting, but being eligible will offer themselves for re-election.
The Board meets quarterly, and where considered necessary ad-hoc meetings are convened. The Designated Adviser attends Board meetings.

2
Corporate Governance Report (continued)
The following is a schedule of Board and Board committee meetings held and attended by the directors during the year ended 31 March 2009. The number in brackets denotes the number of meetings attended.
Directors Board Audit Committee
Risk Committee Remuneration Committee
W L Battershill 5 (5) 4 (4) ^ 3 (3) 5 (4)G D G Mackenzie 5 (5) 4 (4)^ 3 (3) 5 (5)J R Waller 5 (5) 4 (4)^ 3 (3) 5 (4)W R Teichmann 5 (5) 1 (1)^C Parry 5 (5) 1 (1)^N G Payne*# 5 (5) 4 (4) 3 (3)N M Anderson* (alt) 1(1) 1 (1)B M Khoza* 4 (4) 3 (3)R G Lewis*@ (alt) 5(5) 1 (1)^ 5 (5)
*Non-executive# Chairman Audit and Risk Committees@ Chairman Remuneration Committee^ Invitee to committee meetings
Board Processes
Board Appointments
The Board from time to time assesses the skills and experience within the Board and when deemed necessary may wish to appoint new Board members.
The Chairman in consultation with the non-executive directors identifies suitable candidates and makes recommendations to the Board. All new Board members that have not already done so are required to attend the AltX Directors Induction programme.
Share dealings
Directors are required to obtain clearance from the Chairman before trading in the company’s shares. The company secretary together with the Designated Adviser ensures that these trades are published on SENS as required by the JSE Listing Requirements.
Directors, and management and staff with access to financial information and other price sensitive information, may not trade in the company’s shares during a closed period. The company secretary informs directors and staff via email when these periods are in effect.
Self-evaluation
The Board has conducted its first self-evaluation exercise reviewing its performance and strategic planning, board composition, relationship with management and other stakeholders, and succession planning. Areas requiring improvement have been identified, and these are receiving attention.
Corporate Governance Report (continued)
Company Secretary
2
The duties and responsibilities of the company secretary are set out in Section 238G of the Companies Act. The Board has appropriately empowered the company secretary to fulfill these duties. Where necessary, the company secretary will involve the Designated Adviser and other experts in this regard.
All directors have access to the advice and services of the company secretary. All directors are entitled to obtain independent professional advice regarding the company’s affairs at the expense of the company.
Board Committees
1. Risk Committee
The risk committee comprises the Chairman, CEO, CFO, Company Secretary and is chaired by independent non-executive director N G Payne. This risk committee meets three times per annum.
The terms of reference of the Risk Committee include the following:
to assist the Board in setting risk strategy policies in liaison with management and in the discharge of its duties relating to
corporate accountability and associated risk in terms of management assurance and reporting
to review and assess the quality, integrity and effectiveness of the risk management systems and ensure that the risk policies
and strategies are effectively managed
to ensure that the company has implemented an effective ongoing process to identify risk, to measure its potential impact
against a broad set of assumptions and then to activate what is necessary to pro-actively manage these risks, and to decide
the company’s appetite or tolerance for risk
to oversee formal reviews of activities associated with the effectiveness of risk management and internal control processes. A
comprehensive system of control should be established to ensure that risks are mitigated and that the company’s objectives
are attained
to review processes and procedures to ensure the effectiveness of internal systems control so that decision-making capability
and accuracy of reporting and financial results are always maintained at an optimal level
A risk matrix recording significant risks, the probability of occurrence, potential impact on the company and steps taken to mitigate these risks is maintained on an ongoing basis. The risk committee reports to the Board.
2. Audit Committee
The Audit Committee comprises the two independent non-executive directors and the Designated Adviser and is chaired by N G Payne. The committee meets four times per annum and ad-hoc meetings are called when deemed necessary. The Chairman of the Board, CEO and CFO are invited to attend audit committee meetings.
The terms of reference of the Audit committee include the following:
assist the Board in discharging its duties relating to the safeguarding of assets, the operation of adequate systems, control
procedures, and the preparation of accurate financial reporting and statements in compliance withal legal requirements and
accounting standards
recommend to the Board which firm should be appointed as external auditors
evaluate the independence and effectiveness of the external auditors and consider any non- audit services rendered by such
auditors as to whether this substantially impairs their independence, and to pre-approve any such services
Corporate Governance Report (continued)
review the interim and annual financial statements, as well as any announcement of results ensure that financial statements are prepared on appropriate accounting policies consistently applied and supported by
reasonable and prudent judgments and estimates

2
review the accounting policies and procedure adopted by the company and any changes made or contemplated thereto review the effectiveness of management information, the annual audit, the internal audit function and other systems of internal
control
The audit committee members have unrestricted access to all information and reports necessary to discharge their duties.
The audit committee has considered the appropriateness and is satisfied with the expertise and experience of the financial director.
The external auditors have unrestricted access to the audit committee and the chairman, and are given opportunities for discussion with the audit committee without executives present.
A qualified CA (SA) internal auditor has recently been appointed. He reports to the audit committee and is responsible to the CFO on day to day matters.
The audit committee reports to the Board.
3. Remuneration Committee
See Remuneration report on page 22 of this report.
Auditing and Accounting
1. External Audit
The audit committee recommends the appointment of external auditors to the Board. It considers the independence of the external auditors and is required to pre-approve the use of the external auditors for non-audit services.
The external auditors provide an independent assessment of internal financial controls, and are responsible for reporting whether the financial statements are fairly presented in accordance with IFRS. The preparation of the financial statements is the responsibility of the directors.
Subject to shareholder approval, Deloitte and Touche (Partner – C Sagar) have been re-appointed as external auditors for the year ending 31 March 2010
2. Internal Audit
The Board has decided to implement an internal audit function.
A qualified CA (SA) internal auditor has recently been appointed. He reports to the audit committee and is responsible to the CFO on day to day matters.
An internal audit charter is to be drawn up and will define the responsibility, scope and authority of the internal audit function.
3. Internal Control
The Board is responsible for the company’s systems of financial and operating controls and monitoring their effectiveness. These systems are designed to provide reasonable, but not absolute assurance as to the integrity of the financial statements, and to safeguard the company’s assets.
During the year under review, nothing has come to the attention of management to indicate any material failure of the internal control systems.
Corporate Governance Report (continued)
4. Going Concern
The Board has every reason to believe that the company has adequate resources in place to continue in operation for the foreseeable future, and accordingly the financial statements were prepared on the going concern basis.

2
5. Stakeholder Communication
The company is committed to open and timely communication with all stakeholders. Company results and announcements are published on SENS and are available on the company’s website, and there have been a number of presentations of the company’s results and strategy to investors.
6. Code of Ethics
The Group is committed to a policy of fair dealing and integrity in the conduct of its business. This commitment, which is endorsed by the Board, is based on the fundamental belief that business should be conducted honestly, fairly and legally. The company expects all employees to share its commitment to high moral, ethical and legal standards.
A formal Code of Ethics has been adopted by the Board and includes the following:
Compliance with laws and regulations
Conflicts of interest
Anti-competitive behaviour
Employment equity
Safety, health and environment
Social responsibility
Privacy and confidentiality
All directors and employees are expected to comply with the code. A process to deal with possible contraventions of the code is included.
Stephen HackettCOMPANY SECRETARY

2
Remuneration Report
During the past year, the Remuneration Committee, which is an executive committee with approved Terms of Reference, has been extremely active in ensuring that BSi has been able to secure and retain the right people in order to ensure its continued success. As in the past, the Committee has continued to maintain that the company’s directors and senior executives are fairly rewarded for their individual contributions to the company’s overall performance, whilst applying its mind to various other issues pertaining to the annual salary increase, performance incentive schemes and other benefits.
The Remuneration Committee is chaired by Dr. Richard Lewis, a non-executive director, who is a strategy and human resources specialist.
The current members are:
Dr. Richard Lewis – non-executive director – Chair
Mr. William Battershill – Group Executive Chairman
Mr. Grant Mackenzie – Group CEO
Mr. James Waller – Group CFO
Ms. Chantal Lombaard – Group HR Executive
Mr. Steve Hackett – Committee Secretary – Group Secretary
During this past year, the Committee met five times and applied its mind in particular to the following:
The determination of the annual staff salary and wage increases
The assessment of director’s increases according to national survey benchmark data
The drawing up and approval of a Remuneration Policy
The implementation of a flexible discretionary profit share bonus for staff
The determination of appropriate elements of evaluation for the Director’s profit share
The development and approval of a Key Staff Retention Scheme
The implementation of a Warehouse bonus scheme – based on a scorecard of both personal and company performance to
pay out a target related bonus each quarter
The review of the earnings of all staff as compared to the market median.
The approval of a new Travel Policy, and travel rates were reviewed
The introduction of a new BSI Share Appreciation Rights Scheme and a new MTIP/LTIP executive director incentive scheme
to replace the old long term “BSI Share Incentive” scheme.
At listing, BSI initiated a long term incentive scheme that senior managers participated in. The long term scheme was a “share purchase scheme” administered by a share trust and trustees, and essentially allowed the participant to buy shares at the current share price, on extended credit of three years, with interest.
On discussion with Price Waterhouse Coopers our tax advisers as well as independent legal opinion and specialist advice, Remco discovered significant anomalies that made the scheme unworkable, particularly in the context of a recent change in JSE rules with respect to share schemes. In addition it was found to be tax-inefficient and proved very complex to administrate.
It was therefore felt that this scheme would not serve its original intentions, which were principally to retain senior staff by providing a long-term investment in the company and to allow new ‘rising stars’ to make a significant long-term contribution to the company.
The Remuneration Committee recognises its responsibility for ensuring due compliance with the King Code of Corporate Practice and Conduct in respect of remuneration and related matters, and for reporting thereon to the Board.
Remuneration Report (continued)

2
Remuneration Policy and Philosophy
The remuneration philosophy of BSI Steel is to attract, develop and retain high performing individuals while also reinforcing, encouraging and promoting superior performance. Remuneration policies are aligned with the strategic direction and operational objectives of the business.
The objective is to establish a level of guaranteed remuneration that is competitive, short-term incentives that reward directors and management for achieving profit targets and medium and long-term share incentive schemes that serve as a retention and motivational mechanism for directors and senior management, and align them with shareholders’ interests.
The most important challenge facing BSI Steel is how to attract and RETAIN quality employees that will grow with the company and stick with the team. The world is becoming more fluid and mobile, and people (especially the younger generation) are more inclined to leave jobs on a whim. We therefore need sound retention mechanisms that give people the upside of an appreciating share price to give them long term value and share ownership in return for their service.
Senior Executive Incentive and Retention Performance Plans
Four executive directors, Grant Mackenzie (CEO), James Waller (CFO), Ross Teichmann and Craig Parry qualify.
Objectives of the performance plans
1. The objectives of these plans are - to encourage, recognise and reward entrepreneurial flair, to more closely align the interests of the executive with those of shareholders in the medium and long term, and as part of the company’s risk management retention strategy to retain a highly competent and motivated team at the helm of the company’s operations on an ongoing basis.
2. Two incentive plans were introduced with effect from 1st April 2008 recommended by Remco and approved by the board, to be referred to respectively as the Medium Term Incentive Plan and the Long Term Incentive Plan.
The Medium Term Incentive Plan (MTIP)
Equity growth units (‘equity units’) are allocated annually by the Board on the first day of each financial year to senior executives as defined who are in the employ of the company on that date. Determination of ‘share price’ for allocation purposes will always be at the volume weighted average price (VWAP) for the month of March (the last month of the financial year).
Allocations are made in respect of a calculated grant value of equity units equal to an approved multiple, being a nominated ratio of equity unit value to guaranteed pay for each position.
The equity units will have a value per unit during the holding period which is equal to the share price ruling from day to day.
The grantee is entitled to a cash bonus on a future date equal to the escalation in value of the equity units in to the extent that this exceeds the movement in the Consumer Price Index over the holding period.
For these purposes, the future date will be deemed to be -
1. the end of a period of three years from the date of allocation, provided that the grantee remains in employment on that date, or
2. on an earlier date, being the date of termination of employment where such termination occurs as a result of retrenchment for operational reasons, ill-health or incapacity, or death, in each case under and in terms of the employment contract applying on that date, or
3. at the option of the company the date of a change of control of the company
4. The ‘share price’ for exercise purposes will in all cases be at the March VWAP.
The grantee is therefore not able to “time” the market and is limited to exercising at the March VWAP at the end of each 3 year holding period.
Remuneration Report (continued)

2
The Long Term Incentive Plan
Earnings growth units (‘earnings units’) have been allocated by the Board to the above senior executives on a once-off basis in lieu of compensation for agreeing to enter into a fixed-term restraint agreement with the company in grant values to be nominated and approved by the Board.
The earnings units allocated have a value per unit at the outset equal to the share price ruling at the effective date of grant. The value per unit is revalued thereafter at the end of each financial year on the basis of the headline earnings per share (HEPS) for that year, the value equalling the value of the units in the base year multiplied by the ratio of the inflation-adjusted HEPS in the most recent financial year divided by the HEPS in the base year.
The grantee is entitled to a bonus on the agreed future date equal to the escalation in value of the earnings units, but however subject to compliance with the performance condition defined in below.
The agreed future date will be the earlier of –
1. the date of the expiry of the restraint agreement, provided that the grantee remains in employment on that
date, or
2. the date of earlier termination of employment where such termination occurs as a result of retrenchment for
operational reasons, ill-health or incapacity, or death, in each case under and in terms of the restraint
agreement, or
3. at the option of the company the date of a change of control of the company.
No bonus will accrue unless the HEPS growth during the holding period has exceeded the movement in the Consumer Price Index over the holding period by more than 10% (ten percent) per annum; provided that, if the grantee so elects before the end of the holding period, and if the grantee remains in employment for a further year after the expiry of the restraint agreement, the holding period may be extended by one year, namely for the financial year following the expiry of the restraint agreement, and if the HEPS growth rate exceeds the stated 10% (ten percent) condition over the extended holding period, the cash bonus will be calculated in respect of the extended holding period and paid out on that basis.
Summary of allocations:
1st April 2008 1st April 2009Long Term Incentive PlanHEPS at grant 14.91 13.99
Medium Term Incentive PlanShare price at grant R1.00 R0.76
Grant MackenzieLTIP 13 592 064
MTIP 3 398 016 3 750 864
James WallerLTIP 9 952 416
MTIP 1 866 078 1 865 255
Craig ParryLTIP 9 470 208
MTIP 1 775 664 1 810 244
Ross TeichmannLTIP 9 401 568
MTIP 1 762 794 1 917 782
Remuneration Report (continued)
Senior Management Incentive and Retention Scheme

2
Shareholder approval was obtained on 27 March 2009 for a Share Appreciation Rights Scheme for senior managers and key staff as both a retention and incentive scheme and to create better alignment with shareholders.
Herewith some details of the scheme:
1. The Share Appreciation Right Scheme includes participation by divisional executives and selected senior employees of the
Group to ensure that the Group attracts and retains the core competencies required for formulating and implementing the
Group’s business strategies.
2. As the primary intent of the new share incentive plan will be to purchase shares in the market to settle the benefits, the new
share incentive plan will not be as dilutive as conventional share option schemes.
3. The new share incentive plan also supports the principle of alignment of management and shareholder interests with
Performance Conditions governing the vesting of instruments.
4. Employees will receive annual Grants of Share Appreciation Rights, which are conditional rights to receive Shares equal to the
value of the difference between the Exercise Price and the Grant Price. Vesting of the Share Appreciation Rights is subject to
Performance Conditions.
5. Upon exercise by a Participant the relevant Employer Company will settle the value of the difference between the Exercise
Price and the Grant Price by delivering Shares, alternatively, as a fall back provision only, by settling the value in cash. Share
Appreciation Rights not exercised within the SAR period will lapse.
In terms of the rules of the Share Appreciation Right Scheme, a maximum of 73 000 000 shares may be allotted.
The first SAR awards were made on the 31st March 2009. A total of 6 072 500 SAR were awarded at a Grant price of R 0.76
As at 31 March 2009 assuming that every two SAR awards result in the allotment of one share, a total of 3 036 250 shares are reserved, leaving a balance of 69 963 750 shares available to be allotted.
Not all of the vesting conditions relating to any of these schemes have been met during the current financial year and no provisions have therefore been made in the financial statements.
Directors’ Responsibility and Approval StatementThe directors are required by the Companies Act of South Africa, 1973, to maintain adequate accounting records and are responsible for the content and integrity of the annual financial statements and related financial information included in this report.

2
It is their responsibility to ensure that the annual financial statements fairly present the state of affairs of the group as at the end of the financial year and the results of its operations and cash flows for the period then ended, in conformity with International Financial Reporting Standards. The external auditors are engaged to express an independent opinion on the annual financial statements.
The annual financial statements are prepared in accordance with International Financial Reporting Standards and are based upon appropriate accounting policies consistently applied and supported by reasonable and prudent judgments and estimates.
The directors acknowledge that they are ultimately responsible for the system of internal financial control established by the group and place considerable importance on maintaining a strong control environment. To enable the directors to meet these responsibilities, the board sets standards for internal control aimed at reducing the risk of error or loss in a cost effective manner. The standards include the proper delegation of responsibilities within a clearly defined framework, effective accounting procedures and adequate segregation of duties to ensure an acceptable level of risk. These controls are monitored throughout the group and all employees are required to maintain the highest ethical standards in ensuring the group’s business is conducted in a manner that in all reasonable circumstances is above reproach. The focus of risk management in the group is on identifying, assessing, managing and monitoring all known forms of risk across the group. While operating risk cannot be fully eliminated, the group endeavors to minimise it by ensuring that appropriate infrastructure, controls, systems and ethical behaviour are applied and managed within predetermined procedures and constraints.
The directors are of the opinion, based on the information and explanations given by management that the system of internal control provides reasonable assurance that the financial records may be relied on for the preparation of the annual financial statements. However, any system of internal financial control can provide only reasonable, and not absolute, assurance against material misstatement or loss.
The directors have reviewed the group’s cash flow forecast for the year to 31 March 2010 and, in the light of this review and the current financial position, they are satisfied that the group has or has access to adequate resources to continue in operational existence for the foreseeable future.
The external auditors are responsible for independently reviewing and reporting on the group's annual financial statements. The annual financial statements have been examined by the group's external auditors and their report is presented on page 27.
The annual financial statements set out on pages 28 to 81, which have been prepared on the going concern basis, were approved by the board on 19 June 2009 and were signed on its behalf by:
WL Battershill JR Waller
Pietermaritzburg19 June 2009
Secretarial Certification I certify, to the best of my knowledge and belief, that the company has, in respect of the period under review, lodged with the Registrar of Companies all returns that are required by a Public Company, and that all returns are true, correct and up to date.
SJ HackettCompany Secretary
Pietermaritzburg19 June 2009
2
Independent Auditors ReportTo the members of BSI Steel Limited
Report on the Financial StatementsWe have audited the annual financial statements and group annual financial statements of BSI Steel Limited which comprise the directors’ report, the balance sheet and consolidated balance sheet as at 31 March 2009, the income statement and consolidated income statement, the statement of changes in equity and consolidated statement of changes in equity and cash flow statement and consolidated cash flow statement for the year then ended, a summary of significant accounting policies and other explanatory notes, as set out on pages 28 to 81.
Directors’ Responsibility for the Financial StatementsThe company’s directors are responsible for the preparation and fair presentation of these financial statements in accordance with International Financial Reporting Standards and in the manner required by the Companies Act of South Africa. This responsibility includes: designing, implementing and maintaining internal control relevant to the preparation and fair presentation of financial statements that are free from material misstatement, whether due to fraud or error; selecting and applying appropriate accounting policies; and making accounting estimates that are reasonable in the circumstances.
Auditor’s ResponsibilityOur responsibility is to express an opinion on these financial statements based on our audit. We conducted our audit in accordance with International Standards on Auditing. Those standards require that we comply with ethical requirements and plan and perform the audit to obtain reasonable assurance whether the financial statements are free from material misstatement.
An audit involves performing procedures to obtain audit evidence about the amounts and disclosures in the financial statements. The procedures selected depend on the auditor’s judgement, including the assessment of the risks of material misstatement of the financial statements, whether due to fraud or error. In making those risk assessments, the auditor considers internal control relevant to the entity’s preparation and fair presentation of the financial statements in order to design audit procedures that are appropriate in the circumstances, but not for the purpose of expressing an opinion on the effectiveness of the entity’s internal control. An audit also includes evaluating the appropriateness of accounting policies used and the reasonableness of accounting estimates made by the directors, as well as evaluating the overall financial statement presentation.
We believe that the audit evidence we have obtained is sufficient and appropriate to provide a basis for our audit opinion.
OpinionIn our opinion, the financial statements present fairly, in all material respects, the financial position of the company and the group as at 31 March 2009 and the results of their operations and their cash flows for the year then ended in accordance with International Financial Reporting Standards, and in the manner required by the Companies Act of South Africa.
Deloitte & TouchePer CA Sagar PietermaritzburgPartner 19 June 2009
National Executive: GG Gelink (Chief Executive), AE Swiegers (Chief Operating Officer), GM Pinnock (Audit), DL Kennedy (Tax & Legal and Financial Advisory), L Geeringh (Consulting), L Bam (Corporate Finance), CR Beukman (Finance), TJ Brown (Clients & Markets), NT Mtoba (Chairman of the Board), CR Qually (Deputy Chairman of the Board).
Regional Leader: GC Brazier
Pietermaritzburg19 June 2009Directors’ Report

2
The directors submit their report for the year ended 31 March 2009
1. Review of activities - Main business and operations
The group is engaged in sale, processing and distribution of steel and allied products and operates principally in South Africa, Zambia and the Democratic Republic of Congo.
The operating results and state of affairs of the company are fully set out in the attached annual financial statements and do not in our opinion require any further comment.
Net profit of the group was R 100,311,697 (2008: profit R 99,367,479), after taxation of R 25,129,264 (2008: R 34,166,758).
2. Going concern
The annual financial statements have been prepared on the basis of accounting policies applicable to a going concern. This basis presumes that funds will be available to finance future operations and that the realisation of assets and settlement of liabilities, contingent obligations and commitments will occur in the ordinary course of business.
3. Post balance sheet events
Steel prices decreased by R500 and R1, 000 per ton on 1 April 2009 and 1 May 2009 respectively and is to increase by R250 per ton effective 1 July 2009. The net realisable value of inventory at year end has been adjusted accordingly.
Business activities have been extended to Zimbabwe as from 1 May 2009 and the operation will constitute a subsidiary of BSI Steel Africa Limited.
Land and buildings classified as held for sale at year end as per note 16 have been disposed of after year end.
4. Authorised and issued share capital
Refer to note 9 of this report and note 17 of the annual financial statements for details of the changes in the above during the year.
5. Dividends Paid
No dividends were declared or paid to shareholders during the year as the directors decided that more value would be added to shareholders wealth given the current economic climate by utilising cash resources in buying back shares during the current financial year and will continue to do so during the following financial year if the current circumstances continue.
6. Directors
The directors of the company during the year and to the date of this report are as follows:
Name Nationality Changes
WL Battershill South AfricanJR Waller South AfricanC Parry South African Appointed 1 April 2008GDG MacKenzie South AfricanNG Payne (Non Executive) South AfricanEG Dube (Non Executive) South African Resigned 13 June 2008WR Teichmann South African Appointed 1 April 2008RG Lewis (Alternate Non Executive) South African Appointed 12 May 2008BM Khoza (Non Executive) South African Appointed 12 May 2008NM Anderson (Alternate Non Executive) South African Appointed 13 May 2008
Directors’ Report (continued)

2
7. Secretary
The secretary of the company is Stephen Hackett of:
Business Address: Eden Park DriveMurrayfield ParkMkondeniPietermaritzburg3201
Postal Address: P.O. Box 101096ScottsvillePietermaritzburg3209
8. Interest in subsidiaries
Details of the company's investment in subsidiaries are set out in note 8.
9. Special Resolutions
At a general meeting of the shareholders on 12 December 2008 it was resolved that the property described as erf number 710, Alrode Ext 4, Johannesburg be sold.
At a general meeting of the shareholders on 11 September 2008 the following resolutions were approved:
the name of the company be changed from BSI (SA) Limited to BSI Steel Limited;the company increase its existing authorised ordinary share capital from R10,000 divided into 1,000,000,000 ordinary shares of 0.001 cent to R100,000 divided into 10,000,000,000 ordinary share of 0.001 cent each by the creation of 9,000,000,000 ordinary shares of 0.001 cent each; and
the directors of the company be authorised until the next annual general meeting of the company to acquire the company's own shares, upon such terms and conditions and in such amounts as the directors may from time to time decide.
At a general meeting of the shareholders on 26 March 2009 it was resolved that the company would repurchase from the BSI Share Incentive Trust 17,620,232 ordinary shares with a par value of 0.001 cent each at an average price of 89.5 cents per share and to cancel such shares.
10.Directors interest in shares

2
GROUP COMPANY2009 2008 2009 2008 R R R R
Directly beneficialNG Payne 5,526,000 1,606,176 5,526,000 1,606,176WL Battershill 1,081,953 574,914 1,081,953 574,914GDG Mackenzie 9,755,937 11,437,434 9,755,937 11,437,434JR Waller 3,000,000 3,000,000 3,000,000 3,000,000WR Teichmann 21,782,165 - 21,782,165 - NM Anderson 86,000 - 86,000 -RG Lewis 100,000 - 100,000 -
Indirectly beneficialE Dube and associates - 50,240,000 - 50,240,000WL Battershill and associates 336,075,214 328,727,332 336,075,214 328,727,332GDG Mackenzie and associates 81,331,349 84,949,740 81,331,349 84,949,740JR Waller and associates 9,213,469 8,967,178 9,213,469 8,967,178C Parry and associates 56,195,147 - 56,195,147 -BM Khoza and associates 50,390,000 - 50,390,000 -
574,537,234 489,502,774 574,537,234 489,502,774
Between the year end and the date of this report Mr. C Parry and associates have sold 1,500,000 shares leaving a balance of 54,695,147 shares. There have been no other changes in directors’ interest in shares.

Balance Sheetsas at 31 March 2009
GROUP COMPANYNote(s) 2009 2008 2009 2008
R R R R
Assets
Non-Current AssetsProperty, plant and equipment 5 193,427,366 103,082,234 121,841,576 26,507,691Goodwill 6 13,442,080 13,442,080 - - Intangible assets 7 4,768,448 1,527,489 4,754,141 1,527,497Investments in subsidiaries 8 - - 29,040,703 59,699,153Other financial assets 10 - - - 1,920,232Deferred tax 12 3,447,406 2,859,549 - -
215,085,300 120,911,352 155,636,420 89,654,573
Current AssetsInventories 13 244,757,617 188,440,437 188,702,740 134,155,794Loans to group companies 9 - - 46,594,253 27,915,989Other financial assets 10 - 837,445 - 837,445Current tax receivable 6,946,650 1,337,228 6,722,275 - Trade and other receivables 14 320,055,031 380,314,204 245,645,659 294,226,160Cash and cash equivalents 15 35,087,685 26,235,946 10,163,282 15,073,425
606,846,983 597,165,260 497,828,209 472,208,813
Non-current assets held for sale 16 19,416,346 - - -
Total Assets 841,348,629 718,076,612 653,464,629 561,863,386
Equity and Liabilities
EquityShare capital and share premium 17 117,433,439 124,301,168 124,301,165 126,221,396Reserves 37,811,463 12,373,001 - - Accumulated profit 260,716,690 160,404,993 159,810,460 50,878,606
415,961,592 297,079,162 284,111,625 177,100,002
Liabilities
Non-Current LiabilitiesOther financial liabilities 20 111,965,130 43,836,319 91,811,055 15,763,175Deferred tax 12 3,534,084 6,101,235 419,063 214,934
115,499,214 49,937,554 92,230,118 15,978,109
Current LiabilitiesLoans from group companies 9 - - 5,736,278 - Other financial liabilities 20 10,596,706 16,131,253 9,360,262 8,626,535Current tax payable 6,374,042 23,668,998 - 8,446,837Finance lease obligation 21 1,202,840 1,989,400 - - Trade and other payables 23 165,854,339 188,314,635 161,116,269 245,185,941Provisions 22 - 1,202,211 - 1,202,211Bank overdraft 15 119,736,255 139,753,399 100,910,077 105,323,751
303,764,182 371,059,896 277,122,886 368,785,275
Non-current liabilities held for sale 16 6,123,641 - - -
Total Liabilities 425,387,037 420,997,450 369,353,004 384,763,384Total Equity and Liabilities 841,348,629 718,076,612 653,464,629 561,863,386
Income Statementsfor the year ended 31 March 2009
GROUP COMPANY

Note(s) 2009 2008 2009 2008 R R R R
Revenue 25 1,856,988,671 1,432,302,478 1,565,069,073 404,438,359Cost of sales 26 (1,497,974,467) (1,135,268,482) (1,344,729,171) (316,645,436)
Gross (loss) profit before exceptional items 359,014,204 297,033,996 220,339,902 87,792,923Exceptional items 26 (51,443,768) - (41,692,659) -
Gross profit 307,570,436 297,033,996 178,647,243 87,792,923
Other income 780,013 3,322,951 912,013 3,164,454Operating expenses (154,912,010) (145,923,374) (95,444,048) (45,586,829)
Operating profit before interest and taxation 27 153,438,439 154,433,573 84,115,208 45,370,548
Investment income 28 1,358,188 1,487,349 63,645,726 11,885,662Finance costs 29 (29,355,666) (22,386,685) (18,907,674) (12,166,653)
Profit before taxation 125,440,961 133,534,237 128,853,260 45,089,557
Taxation 30 (25,129,264) (34,166,758) (19,921,406) (12,987,559)
Profit for the year attributable to BSi Steel Limited shareholders 100,311,697 99,367,479 108,931,854 32,101,998
Basic and diluted earnings per share (cents) 40 13.98 15.05
Statements of changes in equityfor the year ended 31 March 2009
Share capital Share premium Foreign currency translation
Revaluation reserve
Accumulated profit
Total attributable to equity holders
Minority interest
Total shareholders
equity
R R
reserve
R R R
of the group
R R R
GroupBalance at 01 April 2007 1,000 - 2,834,731 1,473,616 60,521,785 64,831,132 18,621,575 83,452,707
Profit for the year - - - - 99,367,479 99,367,479 - 99,367,479Issue of shares 6,221 127,377,655 - - - 127,383,876 - 127,383,876Purchase of own / treasury shares
(19) (1,920,213) - - - (1,920,232) - (1,920,232)
Purchase of minority interests - - - 532,444 - 532,444 (18,188,242) (17,655,798)Reversal of NDR to accumulated profit
- - - (515,729) 515,729 - - -
Listing expenses - (1,163,476) - - - (1,163,476) - (1,163,476)Revaluation of property, plant and equipmentPurchase of Discount SteelZambia Limited
- - - 4,650,625 - 4,650,625 - 4,650,625
- - 2,827,451 569,863 - 3,397,314 - 3,397,314
Dividends paid - - - - - - (433,333) (433,333)
Total changes 6,202 124,293,966 2,827,451 5,237,203 99,883,208 232,248,030 (18,621,575) 213,626,455
Balance at 01 April 2008 7,202 124,293,966 5,662,182 6,710,819 160,404,993 297,079,162 - 297,079,162
Revaluation of property, plantand equipment
- - - 2,900,000 - 2,900,000 - 2,900,000
Currency translation differences - - 22,538,462 - - 22,538,462 - 22,538,462Profit for the year - - - - 100,311,697 100,311,697 - 100,311,697Issue of shares 157 13,848,843 - - - 13,849,000 - 13,849,000Purchase of treasury shares (157) (13,848,843) - - - (13,849,000) - (13,849,000) Purchase of own shares (75) (6,867,654) - - - (6,867,729) - (6,867,729)Total changes (75) (6,867,654) 22,538,462 2,900,000 100,311,697 118,882,430 - 118,882,430
Balance at 31 March 2009 7,127 117,426,312 28,200,644 9,610,819 260,716,690 415,961,592 - 415,961,592
Note(s) 17 17 18 19
Statements of changes in equityfor the year ended 31 March 2009
Share capital Share premium Foreign currency
translation reserve
Revaluation reserve
Accumulated profit
Total attributable to equity holders of the company
Minority interest
Total equity
R R R R R R R R
CompanyBalance at 01 April 2007 1,000 - - 295,360 18,481,248 18,777,608 - 18,777,608
Realisation of non-distributablereserve
- - - (295,360) 295,360 - - -
Profit for the year - - - - 32,101,998 32,101,998 - 32,101,998Issue of shares 6,218 127,377,655 - - - 127,383,873 - 127,383,873Share issue expenses - (1,163,477) - - - (1,163,477) - (1,163,477)
Total changes 6,218 126,214,178 - (295,360) 32,397,358 158,322,394 - 158,322,394
Balance at 01 April 2008 7,218 126,214,178 - - 50,878,606 177,100,002 - 177,100,002
Profit for the year - - - - 108,931,854 108,931,854 - 108,931,854Issue of shares 157 13,848,843 - - - 13,849,000 - 13,849,000Employees share option scheme cancelled
(176) (15,769,055) - - - (15,769,231) - (15,769,231)
Total changes (19) (1,920,212) - - 108,931,854 107,011,623 - 107,011,623
Balance at 31 March 2009 7,199 124,293,966 - - 159,810,460 284,111,625 - 284,111,625
Note(s) 17 17 18 19

Cash Flow Statementsfor the year ended 31 March 2009
GROUP COMPANYNote(s) 2009 2008 2009 2008
R R R R
Cash flows from operating activities
Cash receipts from customers 1,934,969,250 1,253,161,898 1,610,393,404 137,080,418Cash paid to suppliers and employees (1,770,667,512) (1,316,975,666) (1,583,994,911) (335,157,124)
Cash generated from (used in) operations 31 164,301,738 (63,813,768) 26,398,493 (198,076,706) Interest income 1,358,188 1,487,349 1,277,376 10,758,995Dividends received - - 62,368,350 1,126,667Finance costs (27,413,759) (20,403,683) (17,752,681) (11,803,549)Tax paid 32 (47,592,930) (18,689,908) (34,886,389) (4,773,395) Cash flows of held for sale asset 33 - 3,000,000 - -
Net cash from / (used in) operating activities
90,653,237 (98,420,010) 37,405,149 (202,767,988)
Cash flows used in investing activities
Purchase of property, plant and equipment 5 (110,121,395) (52,685,450) (97,965,168) (26,990,522) Disposal of property, plant and equipment 5 215,216 4,908,033 200,278 582,032Purchase of other intangible assets 7 (3,675,914) (1,499,379) (3,658,782) (1,502,662) Disposal of other intangible assets 7 - 97,735 - 97,733Acquisition of businesses 34 - (22,304,686) - (22,304,686) Loans to group companies repaid - - (12,941,986) - Purchase of minority interest - - - (24,929,649) Proceeds from loans from group companies - - - 37,541,338Purchase of financial assets - - - (1,920,232) Disposal of financial assets 837,445 - 837,445 - Disposal of financial assets - 300,000 - -
Net cash used in investing activities (112,744,648) (71,183,747) (113,528,213) (39,426,649)
Cash flows from financing activities
Proceeds on share issue 17 - 126,220,396 - 126,220,396Reduction of share capital or buy back of shares
17 (6,867,729) (1,920,232) (19) -
Other financial liabilities raised 63,974,777 43,333,135 76,781,607 24,356,328Repayment of shareholders loan - (8,357,567) - (7,915,317) Finance lease (disposed of) / acquired (1,941,553) 6,688 (1,154,993) - (Repayment) / proceeds from finance leases (786,560) 1,989,400 - -
Net cash from financing activities 54,378,935 161,271,820 75,626,595 142,661,407
Total cash movement for the year 32,287,524 (8,331,937) (496,469) (99,533,230)Cash at the beginning of the year (113,517,453) (105,321,520) (90,250,326) 9,282,904Effect of exchange rate movement on cash balances
(3,418,641) 136,004 - -
Total cash at end of the year 15 (84,648,570) (113,517,453) (90,746,795) (90,250,326)

Notes to the Annual Financial Statementsfor the year ended 31 March 2009
1. Accounting policies
Presentation of annual financial statements
The annual financial statements have been prepared in accordance with International Financial Reporting Standards, and the Companies Act of South Africa, 1973. The annual financial statements have been prepared on the historical cost basis, as modified by the revaluation of land and buildings, available for sale financial assets and financial liabilities at fair value through profit and loss. They incorporate the principal accounting policies set out below.
These accounting policies are consistent with the previous period.
1.1 Significant judgements
In preparing the annual financial statements, management is required to make estimates and assumptions that affect the amounts represented in the annual financial statements and related disclosures. Use of available information and the application of judgement is inherent in the formation of estimates. Actual results in the future could differ from these estimates which may be material to the annual financial statements. Significant judgements include:
Trade receivables and loans and receivables
The group assesses its trade receivables and loans and receivables for impairment at each balance sheet date. In determining whether an impairment loss should be recorded in the income statement, the group makes judgements as to whether there is observable data indicating a measurable decrease in the estimated future cash flows from a financial asset.
The impairment for trade receivables and loans and receivables is calculated on a portfolio basis, based on historical loss ratios, adjusted for national and industry-specific economic conditions and other indicators present at the reporting date that correlate with defaults on the portfolio. These annual loss ratios are applied to loan balances in the portfolio and scaled tothe estimated loss emergence period.
Allowance for slow moving, damaged and obsolete stock
An allowance for stock is held in order to write stock down to the lower of cost or net realisable value. Management reviews the stock ageing report regularly; with the policy that stock should always be sold. There are limited circumstances where stock is sold below cost. Stock obsolescence is reviewed on a stock item basis with any unrealisable stock being written off in the relevant period. The write down is included in the operation profit note.
Value determination of inventory on hand
Inventory carrying a lower net realisable value than cost due to the turn in the steel market have been revalued on balance sheet date. The net realisable value has been calculated by taking into account the effects of steel price decreased from April to May 2009. The inventory value was determined by using current replacement cost and increasing it by an average gross profit percentage based on sales made after balance sheet date.
Fair value estimation
The fair value of financial liabilities for disclosure purposes is estimated by discounting the future contractual cash flows at the current market interest rate that is available to the group for similar financial instruments.
Impairment testing
The recoverable amounts of cash-generating units and individual assets have been determined based on the higher of value-in-use calculations and fair values. These calculations require the use of estimates and assumptions.
The group reviews and tests the carrying value of assets when events or changes in circumstances suggest that the carrying amount may not be recoverable. In addition, goodwill is tested on an annual basis for impairment. Assets are grouped at the lowest level for which identifiable cash flows are largely independent of cash flows of other assets and liabilities.

Notes to the Annual Financial Statementsfor the year ended 31 March 2009
1. Accounting policies (continued)
1.1 Significant judgements (continued)
If there are indications that impairment may have occurred, estimates are prepared of expected future cash flows for each group of assets. Expected future cash flows used to determine the value in use of goodwill and tangible assets are inherently uncertain and could materially change over time.
ProvisionsProvisions were raised and management determined an estimate based on the information available. Additional disclosures of these estimates of provisions are included in note 22 - Provisions.
Contingent provisions on business combinations
Contingencies recognised in the current year required estimates and judgements.
Taxation
Judgement is required in determining the provision for income taxes due to the complexity of legislation. There are many transactions and calculations for which the ultimate tax determination is uncertain during the ordinary course of business. The group recognises liabilities for anticipated tax audit issues based on estimates of whether additional taxes will be due. Where the final tax outcome of these matters is different from the amounts that were initially recorded, such differences will impact the income tax and deferred tax provisions in the period in which such determination is made.
The group recognises the net future tax benefit related to deferred income tax assets to the extent that it is probable that the deductible temporary differences will reverse in the foreseeable future. Assessing the recoverability of deferred income tax assets requires the group to make significant estimates related to expectations of future taxable income. Estimates of future taxable income are based on forecast cash flows from operations and the application of existing tax laws in each jurisdiction. To the extent that future cash flows and taxable income differ significantly from estimates, the ability of the group to realise the net deferred tax assets recorded at the balance sheet date could be impacted.
1.2 Property, plant and equipmentCosts include costs incurred initially to acquire or construct an item of property, plant and equipment and costs incurred subsequently to add to, replace part of, or service it. If a replacement cost is recognised in the carrying amount of an item of property, plant and equipment, the carrying amount of the replaced part is derecognised.
The initial estimate of the costs of dismantling and removing the item and restoring the site on which it is located is also included in the cost of property, plant and equipment.
Day-to-day expenses incurred on property, plant and equipment are expensed directly into profit or loss for the period. Maintenance that meets the recognition criteria is capitalised. Property, plant and equipment, except for owner-occupied property, is carried at cost less accumulated depreciation and any impairment losses.
Property, plant and equipment is carried at revalued amount, being the fair value at the date of revaluation less any subsequent accumulated depreciation and subsequent accumulated impairment losses. Revaluations are made with sufficient regularity such that the carrying amount does not differ materially from that which would be determined using fair value at the balance sheet date.
Any increase in an asset’s carrying amount, as a result of a revaluation, is credited directly to equity in the revaluation reserve. The increase is recognised in profit or loss to the extent that it reverses a revaluation decrease of the same asset previously recognised in profit or loss.
Notes to the Annual Financial Statementsfor the year ended 31 March 2009
1. Accounting policies (continued)
1.2 Property, plant and equipment (continued)
Any decrease in an asset’s carrying amount, as a result of a revaluation, is recognised in profit or loss in the current period. The decrease is debited directly to equity in the revaluation reserve to the extent of any credit balance existing in the revaluation surplus in respect of that asset.
Item Average useful lifeLand IndefinitePlant and machinery 1 to 12 yearsFurniture and fixtures 4 yearsMotor vehicles 1 to 5 yearsOffice equipment 3 yearsIT equipment 3 years
The residual value and the useful life of each asset are reviewed at each financial period-end.
Each part of an item of property, plant and equipment with a cost that is significant in relation to the total cost of the item shall be depreciated separately.
The depreciation charge for each period is recognised in profit or loss unless it is included in the carrying amount of another asset.
The gain or loss arising from the derecognition of an item of property, plant and equipment is included in profit or loss when the item is derecognised. The gain or loss arising from the derecognition of an item of property, plant and equipment is determined as the difference between the net disposal proceeds, if any, and the carrying amount of the item.
1.3 GoodwillGoodwill is initially measured at cost, being the excess of the business combination over the company's interest of the net fair value of the identifiable assets, liabilities and contingent liabilities.
Subsequently goodwill is carried at cost less any accumulated impairment. For the purpose of impairment testing, goodwill is allocated to each of the Group's cash-generating units expected to benefit from the synergies of the combination. Cash- generating units to which goodwill has been allocated are tested for impairment annually, or more frequently when there is an indication that the unit may be impaired. If the recoverable amount of the cash-generating unit is less than the carrying amount of the unit, the impairment loss is allocated first to reduce the carrying amount of any goodwill allocated to the unit and then to the other assets of the unit pro-rata on the basis of the carrying amount of each asset in the unit. An impairment loss recognised for goodwill is not reversed in a subsequent period.
The excess of the company’s interest in the net fair value of the identifiable assets, liabilities and contingent liabilities over the cost of the business combination is immediately recognised in profit or loss.
Internally generated goodwill is not recognised as an asset.
1.4 Intangible assetsIntangible assets are initially recognised at cost.
Intangible assets are carried at cost less any accumulated amortisation and any impairment losses.
An intangible asset is regarded as having an indefinite useful life when, based on all relevant factors, there is no foreseeable limit to the period over which the asset is expected to generate net cash inflows. Amortisation is not provided for these intangible assets. For all other intangible assets amortisation is provided on a straight line basis over their useful life, and tested for impairment if there is an indication that they may be impaired.
Notes to the Annual Financial Statementsfor the year ended 31 March 2009

1. Accounting policies (continued)
1.4 Intangible assets (continued)Amortisation is provided to write down the intangible assets, on a straight line basis, to their residual values as follows:
Item Useful life
Computer software 2 to 10 years
1.5 Investments in subsidiaries
Group annual financial statements
The group annual financial statements include those of the holding company and its subsidiaries. The results of the subsidiaries are included from the effective date of acquisition.
On acquisition the group recognises the subsidiary’s identifiable assets, liabilities and contingent liabilities at fair value, except for assets classified as held-for-sale, which are recognised at fair value less costs to sell.
Any deficiency of the cost of acquisition below the fair values of the identifiable net assets acquired, such as a discount on acquisition, is credited to profit and loss in the period of acquisition. The interest of minority shareholders is stated at the minority's proportion of the fair values of the assets and liabilities recognised. Subsequently, any losses applicable to the subsidiaries acquired or disposed of during the year are included in the consolidated income statement from the effective date of acquisition or up to the effective date of disposal, as appropriate. Where necessary, adjustments are made to the financial statements of subsidiaries to bring the accounting policies used in line with those used by the group.
All material intercompany balances and transactions are eliminated.
1.6 Financial Instruments
Initial recognition
The group classifies financial instruments, or their component parts, on initial recognition as a financial asset, a financial liability or an equity instrument in accordance with the substance of the contractual arrangement.
Financial assets and financial liabilities are recognised on the group's balance sheet when the group becomes party to the contractual provisions of the instrument.
Trade and other receivablesTrade receivables are measured at initial recognition at fair value, and are subsequently measured at amortised cost using the effective interest rate method. Appropriate allowances for estimated irrecoverable amounts are recognised in profit or loss when there is objective evidence that the asset is impaired. Significant financial difficulties of the debtor, probability that the debtor will enter bankruptcy or financial reorganisation, and default or delinquency in payments (more than 120 days overdue) are considered indicators that the trade receivable is impaired. The allowance recognised is measured as the difference between the asset’s carrying amount and the present value of estimated future cash flows discounted at the effective interest rate computed at initial recognition.
The carrying amount of the asset is reduced through the use of an allowance account, and the amount of the loss is recognised in the income statement within operating expenses. When a trade receivable is uncollectible, it is written off against the allowance account for trade receivables. Subsequent recoveries of amounts previously written off are credited against operating expenses in the income statement.
Trade and other receivables are classified as loans and receivables.
Notes to the Annual Financial Statementsfor the year ended 31 March 2009

1. Accounting policies (continued)
1.6 Financial Instruments (continued)
Trade and other payablesTrade payables are initially measured at fair value, and are subsequently measured at amortised cost, using the effective interest rate method.
Cash and cash equivalentsCash and cash equivalents comprise cash on hand and demand deposits and other short-term highly liquid investments that are readily convertible to a known amount of cash and are subject to an insignificant risk of changes in value. Theseare initially and subsequently recorded at fair value.
Bank overdraft and borrowingsBank overdrafts and borrowings are initially measured at fair value, and are subsequently measured at amortised cost, using the effective interest rate method. Any difference between the proceeds (net of transaction costs) and the settlement or redemption of borrowings is recognised over the term of the borrowings in accordance with the group’s accounting policy for borrowing costs.
Other financial liabilities are measured initially at fair value and subsequently at amortised cost, using the effective interest rate method.
Other loans and receivables
Other financial assets classified as loans and receivables are initially recognised at fair value plus transaction costs, and are subsequently carried at amortised cost less any accumulated impairment.
Financial assets at fair value through profit or loss
Investments are measured initially and subsequently at fair value, gains and losses arising from changes in fair value are included in profit or loss for the period.
DerivativesThe group enters into derivative financial instruments (forward exchange contracts) in order to manage its exposure to interest rate and foreign exchange rate risk which have a cash flow impact. Changes in the fair value of derivative financial instruments are recognised in profit or loss as they arise.
1.7 Tax
Current tax assets and liabilitiesCurrent tax for current and prior periods is, to the extent unpaid, recognised as a liability. If the amount already paid in respect of current and prior periods exceeds the amount due for those periods, the excess is recognised as an asset.
Current tax liabilities (assets) for the current and prior periods are measured at the amount expected to be paid to (recovered from) the tax authorities, using the tax rates (and tax laws) that have been enacted or substantively enacted by the balance sheet date.
Deferred tax assets and liabilities
A deferred tax liability is recognised for all taxable temporary differences, except to the extent that the deferred tax liability arises from:
the initial recognition of goodwill; or the initial recognition of an asset or liability in a transaction which:
- is not a business combination; and- at the time of the transaction, affects neither accounting profit nor taxable profit (tax loss).

Notes to the Annual Financial Statementsfor the year ended 31 March 2009
1. Accounting policies (continued)
1.7 Tax (continued)
Current tax assets and liabilities
A deferred tax liability is recognised for all taxable temporary differences associated with investments in subsidiaries, branches and associates, and interests in joint ventures, except to the extent that both of the following conditions are satisfied:
the parent, investor or venturer is able to control the timing of the reversal of the temporary difference; and it is probable that the temporary difference will not reverse in the foreseeable future.
A deferred tax asset is recognised for all deductible temporary differences to the extent that it is probable that taxable profit will be available against which the deductible temporary difference can be utilised, unless the deferred tax asset arises from the initial recognition of an asset or liability in a transaction that:
is not a business combination; and at the time of the transaction affects neither accounting profit nor taxable profit (tax loss).
A deferred tax asset is recognised for all deductible temporary differences arising from investments in subsidiaries, branches and associates, and interests in joint ventures, to the extent that it is probable that:
the temporary difference will reverse in the foreseeable future; and taxable profit will be available against which the temporary difference can be utilised.
A deferred tax asset is recognised for the carry forward of unused tax losses and unused STC credits to the extent that it is probable that future taxable profit will be available against which the unused tax losses and unused STC credits can be utilised.
Deferred tax assets and liabilities are measured at the tax rates that are expected to apply to the period when the asset is realised or the liability is settled, based on tax rates (and tax laws) that have been enacted or substantively enacted by the balance sheet date.
Tax expenses
Current and deferred taxes are recognised as income or an expense and included in profit or loss for the period, except to the extent that the tax arises from:
a transaction or event which is recognised, in the same or a different period, directly in equity, or a business combination.
Current tax and deferred taxes are charged or credited directly to equity if the tax relates to items that are credited or charged, in the same or a different period, directly to equity.
1.8 Leases
A lease is classified as a finance lease if it transfers substantially all the risks and rewards incidental to ownership. A lease is classified as an operating lease if it does not transfer substantially all the risks and rewards incidental to ownership.
Finance leases - lessor
The group recognises finance lease receivables on the balance sheet.
Finance income is recognised based on a pattern reflecting a constant periodic rate of return on the group’s net investmentin the finance lease.

Notes to the Annual Financial Statementsfor the year ended 31 March 2009
1. Accounting policies (continued)
1.8 Leases (continued)
Finance leases – lessee
Finance leases are recognised as assets and liabilities in the balance sheet at amounts equal to the fair value of the leased property or, if lower, the present value of the minimum lease payments. The corresponding liability to the lessor is included in the balance sheet as a finance lease obligation.
The discount rate used in calculating the present value of the minimum lease payments is the .
The lease payments are apportioned between the finance charge and reduction of the outstanding liability.The finance charge is allocated to each period during the lease term so as to produce a constant periodic rate of on the remaining balance of the liability.
Operating leases – lessee
Operating lease payments are recognised as an expense on a straight-line basis over the lease term. The difference between the amounts recognised as an expense and the contractual payments are recognised as an operating lease asset. This liability is not discounted.
Any contingent rents are expensed in the period they are incurred.
1.9 Inventories
Inventories are measured at the lower of cost and net realisable value.
Net realisable value is the estimated selling price in the ordinary course of business less the estimated costs of completion and the estimated costs necessary to make the sale.
The cost of inventories comprises of all costs of purchase, costs of conversion and other costs incurred in bringing the inventories to their present location and condition.
The cost of inventories of items that are not ordinarily interchangeable and goods or services produced and segregated for specific projects is assigned using specific identification of the individual costs.
The cost of inventories is assigned using the weighted average cost formula. The same cost formula is used for all inventories having a similar nature and use to the entity.
When inventories are sold, the carrying amounts of those inventories are recognised as an expense in the period in which the related revenue is recognised. The amount of any write-down of inventories to net realisable value and all losses of inventories are recognised as an expense in the period the write-down or loss occurs. The amount of any reversal of anywrite-down of inventories, arising from an increase in net realisable value, are recognised as a reduction in the amount of inventories recognised as an expense in the period in which the reversal occurs.
1.10 Non-current assets held for sale
Non-current assets and disposal groups are classified as held for sale if their carrying amount will be recovered through a sale transaction rather than through continuing use. This condition is regarded as met only when the sale is highly probable and the asset is available for immediate sale in its present condition. Management must be committed to the sale, which should be expected to qualify for recognition as a completed sale within one year from the date of classification.
Non-current assets held for sale are measured at the lower of its carrying amount and fair value less costs to sell.
A non-current asset is not depreciated while it is classified as held for sale, or while it is part of a disposal group classified as held for sale.
Interest and other expenses attributable to the liabilities of a disposal group classified as held for sale are recognised in profit or loss.
Notes to the Annual Financial Statements

for the year ended 31 March 2009
1. Accounting policies (continued)
1.11 Impairment of assets
The group assesses at each balance sheet date whether there is any indication that an asset may be impaired. If any such indication exists, the group estimates the recoverable amount of the asset.
Irrespective of whether there is any indication of impairment, the group also: tests intangible assets with an indefinite useful life or intangible assets not yet available for use for impairment
annually by comparing its carrying amount with its recoverable amount. This impairment test is performed during the annual period and at the same time every period.
tests goodwill acquired in a business combination for impairment annually.
If there is any indication that an asset may be impaired, the recoverable amount is estimated for the individual asset. If it is not possible to estimate the recoverable amount of the individual asset, the recoverable amount of the cash-generating unit to which the asset belongs is determined.
If the recoverable amount of an asset is less than its carrying amount, the carrying amount of the asset is reduced to its recoverable amount. That reduction is an impairment loss.
An impairment loss of assets carried at cost less any accumulated depreciation or amortisation is recognised immediately in profit or loss. Any impairment loss of a revalued asset is treated as a revaluation decrease.
Goodwill acquired in a business combination is, from the acquisition date, allocated to each of the cash-generating units, or groups of cash-generating units, that are expected to benefit from the synergies of the combination.
An impairment loss is recognised for cash-generating units if the recoverable amount of the unit is less than the carrying amount of the units. The impairment loss is allocated to reduce the carrying amount of the assets of the unit in the following order:
first, to reduce the carrying amount of any goodwill allocated to the cash-generating unit and then, to the other assets of the unit, pro rata on the basis of the carrying amount of each asset in the unit.
An entity assesses at each reporting date whether there is any indication that an impairment loss recognised in prior periods for assets other than goodwill may no longer exist or may have decreased. If any such indication exists, the recoverable amounts of those assets are estimated.
The increased carrying amount of an asset other than goodwill attributable to a reversal of an impairment loss does not exceed the carrying amount that would have been determined had no impairment loss been recognised for the asset in prior periods.
A reversal of an impairment loss of assets carried at cost less accumulated depreciation or amortisation other than goodwill is recognised immediately in profit or loss. Any reversal of an impairment loss of a revalued asset is treated as a revaluation increase.
1.12 Share capital and equity
An equity instrument is any contract that evidences a residual interest in the assets of an entity after deducting all of its liabilities.
If the group reacquires its own equity instruments, the consideration paid, including any directly attributable incremental costs (net of income taxes) on those instruments are deducted from equity until the shares are cancelled or reissued. No gain or loss is recognised in profit or loss on the purchase, sale, issue or cancellation of the group’s own equity instruments. Consideration paid or received shall be recognised directly in equity.
Notes to the Annual Financial Statementsfor the year ended 31 March 2009

1. Accounting policies (continued)
1.13 Employee benefits
Short-term employee benefits
The cost of short-term employee benefits, (those payable within 12 months after the service is rendered, such as paid vacation leave and sick leave, bonuses, and non-monetary benefits such as medical care), are recognised in the period in which the service is rendered and are not discounted.
The expected cost of compensated absences is recognised as an expense as the employees render services that increase their entitlement or, in the case of non-accumulating absences, when the absence occurs.
The expected cost of profit sharing and bonus payments is recognised as an expense when there is a legal or constructive obligation to make such payments as a result of past performance.
Defined contribution plans
Payments to defined contribution retirement benefit plans are charged as an expense as they fall due.
Payments made to industry-managed (or state plans) retirement benefit schemes are dealt with as defined contribution plans where the group’s obligation under the schemes is equivalent to those arising in a defined contribution retirement benefit plan.
1.14 Provisions and contingencies
Provisions are recognised when:
the group has a present obligation as a result of a past event;
it is probable that an outflow of resources embodying economic benefits will be required to settle the obligation; and
a reliable estimate can be made of the obligation.
The amount of a provision is the present value of the expenditure expected to be required to settle the obligation.
After their initial recognition contingent liabilities recognised in business combinations that are recognised separately are
subsequently measured at the higher of:
the amount that would be recognised as a provision; and
the amount initially recognised less cumulative amortisation.
Contingent assets and contingent liabilities are not recognised. Contingencies are disclosed in note 36.
1.15 Revenue
Revenue from the sale of goods is recognised when all the following conditions have been satisfied:
the group has transferred to the buyer the significant risks and rewards of ownership of the goods;
the group retains neither continuing managerial involvement to the degree usually associated with ownership nor
effective control over the goods sold;
the amount of revenue can be measured reliably;
it is probable that the economic benefits associated with the transaction will flow to the group; and
the costs incurred or to be incurred in respect of the transaction can be measured reliably.
Notes to the Annual Financial Statementsfor the year ended 31 March 2009
1. Accounting policies (continued)

1.15 Revenue (continued)
When the outcome of the transaction involving the rendering of services cannot be estimated reliably, revenue shall be recognised only to the extent of the expenses recognised that are recoverable.
Revenue is measured at the fair value of the consideration received or receivable and represents the amounts receivable for goods and services provided in the normal course of business, net of trade discounts and volume rebates, and value added tax. Turnover comprises of sales to customers and services rendered to customers. Turnover is stated at the invoice amount and is exclusive of value added taxation.
Royalties are recognized on the accrual basis in accordance with the substance of the relevant agreements. Dividends are recognized in profit or loss, when the company’s right to receive payment has been established.
Interest is recognised, in profit or loss, using the effective interest rate method.
Service fees included in the price of the product are recognised as revenue over the period during which the service is performed.
1.16 Cost of sales
When inventories are sold, the carrying amount of those inventories is recognised as an expense in the period in which the related revenue is recognised. The amount of any write-down of inventories to net realisable value and all losses of inventories are recognised as an expense in the period the write-down or loss occurs. The amount of any reversal of any write-down of inventories, arising from an increase in net realisable value, is recognised as a reduction in the amount of inventories recognised as an expense in the period in which the reversal occurs.
The related cost of providing services recognised as revenue in the current period is included in cost of sales.
1.17 Borrowing Costs
Borrowing costs that are directly attributable to the acquisition, construction or production of a qualifying asset are capitalised as part of the cost of that asset until such time as the asset is ready for its intended use. The amount of borrowing costs eligible for capitalisation is determined as follows:
Actual borrowing costs on funds specifically borrowed for the purpose of obtaining a qualifying asset less any
temporary investment of those borrowings.
Weighted average of the borrowing costs applicable to the entity on funds generally borrowed for the purpose of
obtaining a qualifying asset. The borrowing costs capitalised do not exceed the total borrowing costs incurred.
The capitalisation of borrowing costs commences when: expenditures for the asset have occurred;
borrowing costs have been incurred, and
activities that are necessary to prepare the asset for its intended use or sale are in progress.
Capitalisation is suspended during extended periods in which active development is interrupted.
Capitalisation ceases when substantially all the activities necessary to prepare the qualifying asset for its intended use or sale are complete.
All other borrowing costs are recognised as an expense in the period in which they are incurred.
Notes to the Annual Financial Statementsfor the year ended 31 March 2009
1. Accounting policies (continued)

1.18 Translation of foreign currencies
Foreign currency transactions
A foreign currency transaction is recorded, on initial recognition in Rands, by applying to the foreign currency amount the spot exchange rate between the functional currency and the foreign currency at the date of the transaction.
At each balance sheet date: foreign currency monetary items are translated using the closing rate; non-monetary items that are measured in terms of historical cost in a foreign currency are translated using the
exchange rate at the date of the transaction; and non-monetary items that are measured at fair value in a foreign currency are translated using the exchange rates at the date when the fair value was determined.
Exchange differences arising on the settlement of monetary items or on translating monetary items at rates different from those at which they were translated on initial recognition during the period or in previous annual financial statements are recognised in profit or loss in the period in which they arise.
When a gain or loss on a non-monetary item is recognised directly in equity, any exchange component of that gain or loss is recognised directly in equity. When a gain or loss on a non-monetary item is recognised in profit or loss, any exchange component of that gain or loss is recognised in profit or loss.
Cash flows arising from transactions in a foreign currency are recorded in Rands by applying to the foreign currency amount the exchange rate between the Rand and the foreign currency at the date of the cash flow.
Investments in subsidiaries, joint ventures and associates
The results and financial position of a foreign operation are translated into the functional currency using the following procedures:
assets and liabilities for each balance sheet presented are translated at the closing rate at the date of that balance sheet;
income and expenses for each income statement item are translated at exchange rates at the dates of the transactions; and
all resulting exchange differences are recognised as a separate component of equity.
Exchange differences arising on a monetary item that forms part of a net investment in a foreign operation are recognised initially in the translation reserve and recognised in profit or loss on disposal of the net investment.
Any goodwill arising on the acquisition of a foreign operation and any fair value adjustments to the carrying amounts of assets and liabilities arising on the acquisition of that foreign operation are treated as assets and liabilities of the foreign operation.
The cash flows of a foreign subsidiary are translated at the exchange rates between the functional currency and the foreign currency at the dates of the cash flows.
1.19 Segment reportingA business segment report is a group of assets and operations engaged in providing products of services that are subject to risks and returns that are different from those of other business segments. A geographical segment is engaged in providing products or services within a particular economic environment that are subject to risks and return that are different from those segments operating in other economic environments.
For management purposes, the group is currently organised into three main segments, namely merchanting, trading and exporting.

Notes to the Annual Financial Statementsfor the year ended 31 March 2009
1. Accounting policies (continued)
1.19 Segment reporting (continued)
This is the basis on which the group reports its primary segment information. The geographical split is a secondary segment, with the major geographical segments being South Africa and the balance of the African continent. Segment information is presented in Note 4.
1.20 Related parties
Parties are considered related if one party has the ability to control or exercise significant influence over the other party in making financial and operating decisions. The group enters into various related party transactions in the ordinary course of business. The terms and conditions of those related party transactions are no more favourable than those granted to third parties in arm's length transactions.
1.21 Financial guarantee contracts
Financial guarantee contracts are accounted for in terms of IFRS 4: Insurance Contracts and consequently are measured initially at cost and thereafter in accordance with IAS 37: Provisions, Contingent liabilities and contingent assets.
2. New standards and interpretations not yet adopted
The annual financial statements have been prepared in accordance with International Financial Reporting Standards on a
basis consistent with the prior year except for the adoption of the following new or revised standards.
IFRS5 Non-current Assets Held for Sale and Discontinued Operations
IAS1 Presentation of Financial Statements
IAS2 Inventories
IAS10 Events after the Balance Sheet Date
IAS17 Leases
IAS21The Effects of Changes in Foreign Exchange Rates
IAS24 Related Party Disclosures
IAS28 Investments in Associates
IAS32 Financial Instruments: Disclosure and Presentation
IAS33 Earnings per Share
IAS39 Financial Instruments: Recognition and Measurement
IFRIC15 Agreements for the Construction of Real Estate
IFRIC16 Hedges of a Net Investment in a Foreign Operation
IFRIC10 Interim Financial Reporting and Impairment
IFRIC11 IFRS2 - Group and Treasury Share Transactions
IFRIC12 Service Concession Arrangements
IFRIC13 Customer Loyalty Programmes
IFRIC14 IAS19 - The Limited on a Defined Benefit Asset, Minimum Funding Requirements and their interactions
Management is in the process of assessing the impact of the new and revised standards and interpretations.
Notes to the Annual Financial Statements

for the year ended 31 March 2009
3. Risk management
Foreign exchange risk
The group operates internationally and is exposed to foreign exchange risk arising from various currency exposures, primarily with respect to the US dollar. Foreign exchange risk arises from future commercial transactions, recognised assets and liabilities and net investments in foreign operations.
The group has certain investments in foreign operations, whose net assets are exposed to foreign currency translation risk. Currency exposure arising from the net assets of the group’s foreign operations is managed primarily through borrowings denominated in the relevant foreign currencies.
The group expects its foreign exchange contracts to hedge its exposure to foreign currency fluctuations. The group also purchases US Dollars on an ongoing basis to hedge its exposure. The balances arising on material transactions denominated in foreign currencies is immediately hedged through the use of foreign exchange contracts.
At 31 March 2009, if the currency had strengthened by 10% against the US dollar with all other variables held constant,post-tax profit for the year would have been R 3,593,103 (2008: R 2,647,716) lower, mainly as a result of foreign exchange gains/losses on translation of US dollar denominated trade receivables, financial assets at fair value through profit or loss, debt securities classified as available for sale and foreign exchange losses/gains on translation of US dollar denominated borrowings. If the currency had weakened by 10% against the US dollar with all other variables held constant, post-tax profit for the year would have been R3,593,103 (2008: R2,647,716) higher.
Profit is less sensitive to movement in Rand/US dollar exchange rates in 2009 than 2008 because of the decreased amountof US dollar-denominated borrowings.
GROUP COMPANY
2009 2008 2009 2008
R R R R
Foreign currency exposure at balance sheet date
Liabilities
Current, USD - loan (2008: USD 1,100,000) - 8,626,535 - 8,626,535
Accounts payable, USD 2,294,388 (2008: USD -)
22,302,602 - 22,302,602

Notes to the Annual Financial Statementsfor the year ended 31 March 2009
3. Risk management (continued)
Foreign exchange risk (continued)
GROUP COMPANY
2009 2008 2009 2008
R R R R
Exchange rates used for conversion of foreign items were:
USD 9.7205 8.1200 9.7205 8.1200
Forward exchange contracts which relate to future commitments
Amount in foreign currency purchased Forward exchange rate Maturity date
2,065,612 USD 1USD = R9.54 01 April 2009
875,000 USD 1USD= R 9.55 06 April 2009
695,000 USD 1USD - R9.67 02 June 2009
166,649 USD 1USD = R9.55 30 April 2009
207,176 USD 1USD = R9.57 08 May 2009
289,620 € 1EUR = R12.90 15 June 2009
Recognised in profit for the year
Foreign exchange variance - 837,445 - 837,445
The group reviews its foreign currency exposure, including commitments on an ongoing basis. The company expects its foreign exchange contracts to hedge foreign exchange exposure.
Price Risk
The group is not exposed to commodity price risk.
Interest rate risk
As the group has no significant interest-bearing assets, the group’s income and operating cash flows are substantially independent of changes in market interest rates.
The group analyses its interest rate exposure on a dynamic basis. Various scenarios are simulated taking into consideration refinancing, renewal of existing positions, alternative financing and hedging. Based on these scenarios, the group calculates the impact on profit and loss of a defined interest rate shift. For each simulation, the same interest rate shift is used for all currencies.
Notes to the Annual Financial Statements

for the year ended 31 March 2009
3. Risk management (continued)
Interest rate profile of the company
Financial instruments 2009 2008
R R
Cash in current banking institutions
Albion Trade Finance Resources Limited
Undisclosed debtors discounting facility
Overdraft facilities used
Bond over property - floating rate
Finance leases
10.00 %
- %
12.50 %
13.00 %
11.75 %
12.75 %
35,038,853
-
73,467,835
119,736,255
72,248,053
48,600,602
11.00 %
12.00 %
14.00 %
- %
12.50 %
13.75 %
26,203,143
5,086,363
139,753,398
-
26,578,968
21,665,106
Sensitivity analysis
At year-end the sensitivity to open to exposure of floating interest rates on the operating profit is as follows: 2009
R
+10% (3,593,103)
-10% 3,593,103
2008
R
+10% (2,647,716)
-10% 2,647,716
Credit risk
Credit risk is managed on a group basis.
Credit risk consists mainly of cash deposits, cash equivalents, derivative financial instruments and trade debtors. The company only deposits cash with major banks with high quality credit standing and limits exposure to any one counterparty.
Trade receivables comprise a widespread customer base. Management evaluated credit risk relating to customers on an ongoing basis. If customers are independently rated, these ratings are used. Otherwise, if there is no independent rating, risk control assesses the credit quality of the customer, taking into account its financial position, past experience and other factors. Individual risk limits are set based on internal or external ratings in accordance with limits set by the board. The utilisation of credit limits is regularly monitored. Sales to retail customers are settled in cash or using major credit cards.

Notes to the Annual Financial Statementsfor the year ended 31 March 2009
3. Risk management (continued)
Credit guarantee insurance is purchased when deemed appropriate.
No credit limits were exceeded during the reporting period, and management does not expect any losses from non- performance by these counterparties.
Liquidity risk
Prudent liquidity risk management implies maintaining sufficient cash and marketable securities, the availability of funding through an adequate amount of committed credit facilities and the ability to close out market positions. Due to the dynamic nature of the underlying businesses, group treasury maintains flexibility in funding by maintaining availability under committed credit lines.
The table below analyses the group’s financial liabilities and net-settled derivative financial liabilities into relevant maturity groupings based on the remaining period at the balance sheet to the contractual maturity date. The amounts disclosed in the table are the contractual undiscounted cash flows. Balances due within 12 months equal their carrying balances as the impact of discounting is not significant.
GROUP
At 31 March 2009 Less than 1year
Between 1 and
2 years
Between 2 and
5 years
Over 5 years
Borrowings 16,213,977 15,844,649 43,646,896 52,311,640
Trade and other payables 165,854,339 - - -
At 31 March 2008 Less than 1year
Between 1 and
2 years
Between 2 and
5 years
Over 5 years
Borrowings 1,402,089 1,496,557 5,896,255 17,317,780
Trade and other payables 188,314,635 - - -
COMPANY
At 31 March 2009 Less than 1year
Between 1 and
2 years
Between 2 and
5 years
Over 5 years
Borrowings 8,074,578 11,999,811 34,445,567 45,248,366
Trade and other payables 161,116,269 - - -
At 31 March 2008 Less than 1year
Between 1 and2 years
Between 2 and5 years
Over 5 years
Borrowings 403,692 458,629 1,829,286 6,119,170
Trade and other payables 245,185,941 - - -
Notes to the Annual Financial Statementsfor the year ended 31 March 2009
3. Risk management (continued)
Fair value estimation
The group is exposed to equity securities price risk because of investments held by the group and classified on the consolidated balance sheet either as available for sale or at fair value through profit or loss. The group is not exposed to commodity price risk. To manage its price risk arising from investments in equity securities, the group diversifies its portfolio. Diversification of the portfolio is done in accordance with the limits set by the group.
4. Segment reportingPrimary reporting format - primary business segments.
For management purposes the group is organised into three main business segments, namely Stockists, Bulk sales and Exporting.
Other group operations mainly comprise of the rental of property and the processing of plant. Neither of these constitutes a separately reportable segment.
The segment results for the year ended 31 March 2009 are as follows:
Stockists Bulk sales
2009
Exporting Other Total
R R R R R
Revenue - external 672,999,297 525,113,671 634,312,291 24,563,412 1,856,988,671 Revenue - internal 19,495,909 44,550,589 333,556,097 14,383,718 411,986,313
Total segment revenue 692,495,206 569,664,260 967,868,388 38,947,130 2,268,974,984
Operating profit before interestand taxation
40,580,284 32,003,388 81,786,991 (932,224) 153,438,439
Investment income 388,223 984 569,567 399,414 1,358,188Finance costs (9,779,621) (9,463,921) (4,035,462) (6,076,662) (29,355,666)
Profit before taxation 31,188,886 22,540,451 78,321,096 (6,609,472) 125,440,961
Taxation (11,216,603) (8,911,616) (12,191,651) 7,190,606 (25,129,264)
Profit for the year 19,972,283 13,628,835 66,129,445 581,134 100,311,697
Stockists Bulk sales
2008
Exporting Other Total
R R R R R
Revenue - external 510,844,432 452,260,170 453,087,004 16,110,872 1,432,302,478Revenue - internal 19,146,451 5,269,288 231,886,970 - 256,302,709
Total segment revenue 529,990,883 457,529,458 684,973,974 16,110,872 1,688,605,187
Operating profit before interestand taxation
41,239,570 40,723,870 67,070,437 5,399,696 154,433,573
Investment income 276,356 714,157 195,905 300,931 1,487,349Finance costs (6,517,021) (9,759,969) (2,387,130) (3,722,565) (22,386,685)
Profit before taxation 34,998,905 31,678,058 64,879,212 1,978,062 133,534,237Taxation (8,939,631) (9,027,663) (15,302,101) (897,363) (34,166,758)
Profit for the year 26,059,274 22,650,395 49,577,111 1,080,699 99,367,479

Notes to the Annual Financial Statementsfor the year ended 31 March 2009
4. Segment reporting (continued)
Inter-segment transfers or transactions are entered into under normal commercial terms and conditions that would have been available to unrelated third parties.
Segment assets consist primarily of property, plant and equipment inventories, trade and other receivables and cash and cash equivalents.
Unallocated assets comprise deferred taxation, intangible assets and other financial assets.
Segment liabilities comprise operating liabilities. Unallocated liabilities comprise items such as taxations and borrowings.
Capital expenditure comprises additions to property, plant and equipment (Note 5), including additions resulting from acquisitions through business combinations.
The segment assets and liabilities at 31 March 2009 for the year then ended are as follows:
Stockists Bulk sales
2009
Exporting Other Eliminations Total
R R R R R R
Assets 202,187,391 119,712,541 250,184,172 319,197,972 (49,933,447) 841,348,629
Liabilities (46,861,815) (36,806,109) (71,878,279) (319,029,667) 49,188,833 (425,387,037)
155,325,576 82,906,432 178,305,893 168,305 (744,614) 415,961,592
The segment assets and liabilities at 31 March 2008 for the year then ended are as follows:
Stockists Bulk sales
2008
Exporting Other Eliminations Total
R R R R R R
Assets 283,339,759 183,879,891 161,873,516 60,908,326 28,075,120 718,076,612
Liabilities (109,364,983) (143,396,625) (62,094,959) (38,374,051) (67,766,832) (420,997,450)
173,974,776 40,483,266 99,778,557 22,534,275 (39,691,712) 297,079,162
Notes to the Annual Financial Statementsfor the year ended 31 March 2009
4. Segment reporting (continued)
Secondary reporting format – geographical segments
The Group’s four biggest segments operate in two main geographical areas. The home country of the Company is the Republic of South Africa. The areas of operation are principally merchandising, trading and exporting of steel.
2009
RSA Africa Total
R R R
Revenue – external 1,222,676,380 634,312,291 1,856,988,671
Revenue - internal 78,430,216 333,556,097 411,986,313
Total segment revenue 1,301,106,596 967,868,388 2,268,974,984
Operating profit before interest and taxation 71,651,448 81,786,991 153,438,439
Investment income 788,621 569,567 1,358,188
Finance costs (25,320,204) (4,035,462) (29,355,666)
Profit before taxation 47,119,865 78,321,096 125,440,961
Taxation (12,937,613) (12,191,651) (25,129,264)
Profit for the year 34,182,252 66,129,445 100,311,697
2008
RSA Africa Total
R R R
Revenue - external 979,215,474 453,087,004 1,432,302,478Revenue - internal (18,204,169) 18,204,169 -
Total segment revenue 961,011,305 471,291,173 1,432,302,478
Operating profit before interest and taxation 87,363,136 67,070,437 154,433,573
Investment income 1,291,444 195,905 1,487,349Finance costs (19,999,555) (2,387,130) (22,386,685)
Profit before taxation 68,655,025 64,879,212 133,534,237Taxation (18,864,657) (15,302,101) (34,166,758)
Profit for the year 49,790,368 49,577,111 99,367,479

Notes to the Annual Financial Statementsfor the year ended 31 March 2009
4. Segment reporting (continued)
Revenue is allocated based on the country in which the customer is located.
The segment assets and liabilities at 31March 2009 for the year then ended are as follows:
2009
RSA Africa Eliminations Total
R R R R
Assets 641,097,904 250,184,172 (49,933,447) 841,348,629
Liabilities (402,697,591) (71,878,279) 49,188,833 (425,387,037)
Net Equity 238,400,313 178,305,893 (744,614) 415,961,592
2008
RSA Africa Eliminations Total
R R R R
Assets 528,127,976 161,873,516 28,075,120 718,076,612
Liabilities (291,135,659) (62,094,959) (67,766,832) (420,997,450)
Net Equity 236,992,317 99,778,557 (39,691,712) 297,079,162

Notes to the Annual Financial Statementsfor the year ended 31 March 2009
5. Property, plant and equipment
GROUP
2009 2008
Cost /
ValuationAccumulated
depreciation
Carrying value Cost /
Valuation
Accumulated
depreciation
Carrying value
R R R R R R
Land and Buildings 137,973,769 (402,281) 137,571,488 66,445,693 4 66,445,697
Plant and machinery 38,994,547 (2,737,680) 36,256,867 25,291,701 (1,508,614) 23,783,087
Furniture and fixtures 1,538,113 (450,345) 1,087,768 896,945 (173,424) 723,521
Motor vehicles 16,634,422 (2,574,113) 14,060,309 8,720,137 (453,564) 8,266,573
Office equipment 3,285,533 (726,602) 2,558,931 1,073,142 (448,854) 624,288
IT equipment 2,588,509 (1,445,344) 1,143,165 1,733,231 (1,013,158) 720,073
Leased assets 9,066,048 (8,317,210) 748,838 7,584,660 (5,065,665) 2,518,995
Total 210,080,941 (16,653,575) 193,427,366 111,745,509 (8,663,275) 103,082,234
COMPANY
2009 2008
Cost /
ValuationAccumulated
depreciation
Carrying value Cost /
Valuation
Accumulated
depreciation
Carrying value
R R R R R R
Land and Buildings 96,018,805 - 96,018,805 15,075,682 - 15,075,682
Plant and machinery 11,822,931 (408,482) 11,414,449 2,489,605 (144,584) 2,345,021
Furniture and fixtures 1,033,701 (283,871) 749,830 601,746 (101,870) 499,876
Motor vehicles 12,065,040 (1,512,281) 10,552,759 7,544,479 (242,851) 7,301,628
Office equipment 2,747,350 (662,651) 2,084,699 1,039,914 (441,891) 598,023
IT equipment 2,430,326 (1,409,292) 1,021,034 1,692,815 (1,005,354) 687,461
Leased assets - - - 10,965 (10,965) -
Total 126,118,153 (4,276,577) 121,841,576 28,455,206 (1,947,515) 26,507,691

Notes to the Annual Financial Statementsfor the year ended 31 March 2009
5. Property, plant and equipment (continued)
Reconciliation of property, plant and equipment – Group - 2009
OpeningBalance
Additions Disposals Classified asheld for sale
Transfers Revaluations Foreignexchange
movements
Depreciation Total
R R R R R R R R R
Land and Buildings 66,445,697 84,549,131 - (18,900,000) - 2,900,000 2,954,004 (377,344) 137,571,488Plant and machinery 23,783,087 14,269,352 - (516,346) 17,198 - 6,742 (1,303,166) 36,256,867Furniture and fixtures 723,521 561,732 (14,938) - 20,799 - 65,772 (269,118) 1,087,768Motor vehicles 8,266,573 7,646,775 (248,375) - - - 431,120 (2,035,784) 14,060,309Office equipment 624,288 2,232,389 - - (37,997) - 18,074 (277,823) 2,558,931IT equipment 720,073 862,016 (17,499) - - - 18,350 (439,775) 1,143,165Leased assets 2,518,995 - - - - - 283,188 (2,053,345) 748,838
103,082,234 110,121,395 (280,812) (19,416,346) 2,900,000 3,777,250 (6,756,355) 193,427,366
Reconciliation of property, plant and equipment – Group - 2008
OpeningBalance
Additions Additionsthrough
business combinations
Disposals Transfers Revaluations Foreignexchange
movements
Depreciation Total
R R R R R R R R R
Land and buildings 17,399,268 31,297,138 9,496,370 - - 7,521,066 731,855 - 66,445,697Plant and machinery 17,085,626 8,109,806 269,989 (383,115) (17,156) - (11,368) (1,270,695) 23,783,087Furniture and fixtures 242,245 415,694 267,513 (31,704) 17,156 - (17,181) (170,202) 723,521Motor vehicles 3,487,369 7,842,152 578,212 (1,957,529) - - (305,438) (1,378,193) 8,266,573Office equipment 111,430 1,040,267 - (244,617) - - 3,536 (286,328) 624,288IT equipment 585,088 455,339 273,232 (343,121) - - 16,219 (266,684) 720,073Leased assets - 3,525,054 2,672,921 (941,157) - - 168,940 (2,906,763) 2,518,995
38,911,026 52,685,450 13,558,237 (3,901,243) - 7,521,066 586,563 (6,278,865) 103,082,234

Notes to the Annual Financial Statementsfor the year ended 31 March 2009
5. Property, plant and equipment (continued)
Reconciliation of property, plant and equipment – Company - 2009
OpeningBalance
Additions Disposals Transfers Depreciation Total
R R R R R R
Buildings 15,075,682 80,943,123 - - - 96,018,805Plant and machinery 2,345,021 9,322,470 - - (253,042) 11,414,449Furniture and fixtures 499,876 445,626 - (2,536) (193,136) 749,830Motor vehicles 7,301,628 4,783,291 (248,375) - (1,283,785) 10,552,759Office equipment 598,023 1,707,437 - 2,536 (223,297) 2,084,699IT equipment 687,461 763,221 (17,499) - (412,149) 1,021,034
26,507,691 97,965,168 (265,874) - (2,365,409) 121,841,576
Reconciliation of property, plant and equipment – Company - 2008
OpeningBalance
Additions Additionsthrough
divisionalisation
Disposals Transfers Depreciation Total
R R R R R R R
Land and buildings 334,936 15,075,682 - (334,936) - - 15,075,682Plant and machinery 66,299 - 2,405,689 - - (126,967) 2,345,021 Furniture and fixtures 164,251 482,134 81,434 (25,116) (141,723) (61,104) 499,876Motor vehicles 10,141 - 7,729,274 (189,098) - (248,689) 7,301,628Office equipment - 468,400 157,189 (36,800) 141,723 (132,489) 598,023IT equipment 270,75I 175,560 415,160 (45,968) - (128,042) 687,461
846,378 16,201,776 10,788,746 (631,918) - (697,291) 26,507,691

Notes to the Annual Financial Statementsfor the year ended 31 March 2009
5. Property, plant and equipment (continued)
GROUP COMPANY 2009 2008 2009 2008 R R R R
Pledged as securityCarrying value of assets pledged as security:
Land and buildings 117,723,772 52,078,009 96,018,805 15,075,682
Motor vehicles 9,115,431 5,817,591 9,115,431 5,817,591
Plant and machinery 31,644,849 19,549,404 10,540,257 989,186
Office equipment 196,186 261,581 196,186 261,581
Other than the land and buildings, the above assets are all encumbered by instalment sale agreements, which bear interest at prime less 1%, are repayable over varying periods of 2 to 72 months and for which the monthly instalments total R2,894,178 (2008: R474,959).
The land and buildings are encumbered by mortgage bonds bearing interest at varying rates linked to prime (11.5% - 12.5%), are repayable on a ten year term in total monthly instalments of R999,245 (2008: R408,705).
Assets subject to finance lease (net carrying amount)
Property, plant and equipment - Zambia 748,838 2,518,995 - -
Revaluations
The Klipriver property was revalued by the company's directors and the value is deemed to equal the building costs spent on erection of the property. The Alrode property was similarly valued and the value is deemed to equal the revalued amount as per the prior year's financial statements.
Land and buildings are re-valued annually.
The valuations were performed using the discounted cash flow approach (other, describe, e.g. recent arms length transaction), and the following assumptions were used:Discount rate - 12%Current market related gross rentals were assumed; andIncreased demand for industrial land.
The effective date of revaluation of the properties in Zambia was 11 May 2007. The revaluations were performed by Mr Musonda Kasase of Anderson and Anderson International Valuation Surveyors. Anderson and Anderson are not connected to the group.
The carrying value of the revalued assets under the cost model would have been:
Land and buildings 128,747,437 51,639,104 - -
A register containing the information required by paragraph 22(3) of Schedule 4 of the Companies Act is available for inspection at the registered office of the company.

Notes to the Annual Financial Statementsfor the year ended 31 March 2009
6. Goodwill
GROUP
2009Cost / Valuation Accumulated Carrying
value amortizationCarrying value
R R R
13,442,080 - 13,442,080
2008Cost / Valuation Accumulated Carrying
value amortizationCarrying value
R R R
13,442,080 - 13,442,080
Reconciliation of goodwill – Group - 2009 Opening
Balance Total
R R
Goodwill 13,442,080 13,442,080
Reconciliation of goodwill – Group - 2008 Opening Balance
Additions through
divisionalisation
ForeignExchange
movements
Total
R R R R
Goodwill 3,772,862 9,257,059 412,159 13,442,080
Impairment testing of goodwill
The remaining goodwill was assessed by reference to the value-in-use of the cash-generating units. Discount factors ranging between 10% to 12% per annum (2008: 10% to 12% per annum) were applied in the value-in-use model.
Goodwill
Goodwill
Notes to the Annual Financial Statementsfor the year ended 31 March 2009
6. Goodwill (continued)
Allocation of goodwill to cash-generating unit
Goodwill has been allocated for impairment testing purposes to the underlying discreet business segments as they represent separately identifiable cash-generating units. The following cash-generating units, being the lowest level of asset for which there are separately identifiable cash flows, have carrying amounts of goodwill:
GROUP2009 2008
R R
Stockists 4,215,585 4,215,585Bulk sales 1,185,136 1,185,136Exporting 5,482,306 5,482,306Other 2,559,053 2,559,053
13,442,080 13,442,080
7. Intangible assetsGROUP 2009 2008
Cost / Valuation Accumulated
amortisationCarrying value Cost /
ValuationAccumulated amortisation
Carrying value
R R R R R R
Computer software 5,654,225 (885,777) 4,768,448 2,013,616 (486,127) 1,527,489
COMPANY 2009 2008
Cost / Valuation Accumulated
amortisationCarrying value Cost /
ValuationAccumulated amortisation
Carrying value
R R R R R R
Computer software 5,633,483 (879,342) 4,754,141 2,013,620 (486,123) 1,527,497
Reconciliation of intangible assets - Group - 2009
Opening Additions balance
Foreign Amortisation Total exchangemovements
R R R R R
Computer software 1,527,489 3,675,914 3,072 (438,027) 4,768,448
Reconciliation of intangible assets - Group - 2008
Opening Additions Foreign Amortisation Totalbalance exchange
movements R R R R R

Computer software 188,445 1,499,379 (97,735) (62,600) 1,527,489
Notes to the Annual Financial Statementsfor the year ended 31 March 2009
7. Intangible assets (continued)
Reconciliation of intangible assets – Company - 2009
Opening Balance
Additions Amortisation Total
R R R R
Computer software 1,527,497 3,658,782 (432,138) 4,754,141
Reconciliation of intangible assets – Company - 2008
Opening Balance
Additions Additionsthrough
business combinations
Disposals Amortisation Total
R R R R R R
Computer software 181,480 1,499,385 3,277 (97,733) (58,912) 1,527,497
8. Investments in subsidiariesName of company % holding % holding 2009 2008
2009 2008 R R
Garrison Steel (Pty) Ltd
Newcolab (Pty) Ltd
Red Chip Investments (Pty) Ltd
Shearcut (Pty) Ltd
Shearcut Precision Steel (Pty) Ltd
BSI Steel Zambia Ltd *
Doddleprops (Pty) Ltd
Discount Steel Africa (Pty) Ltd
Discount Steel KZN (Pty) Ltd
Discount Steel Trading (Pty) Ltd
- % 100%
100% 100%
100% 100%
100% 100%
- % 100%
100% 100%
100% 100%
- % 100%
- % 100%
- % 100%
- 15,779,781
1,000 1,000
2,460,968 2,460,968
100 100
- 1,000
25,339,512 25,339,512
1,239,123 1,239,023
- 7,589,081
- 1,471,602
- 5,817,086
29,040,703 59,699,153
* Indirect holding of BSI Steel Katanga SPRL and BSI Steel Africa Ltd - 100% (2008: 100%)
9. Loans to (from) group companiesCOMPANY
2009 2008 R R
SubsidiariesShearcut (Pty) Ltd 27,836,629 723,401
Discount Steel KZN (Pty) Ltd - 21,366,474
BSI Steel Zambia Ltd 17,329,935 5,826,113
Red Chip Investments (Pty) Ltd (1,541,274) -
Doddleprops (Pty) Ltd 1,427,689 -
Newcolab (Pty) Ltd (3,196,187) -
BSI Steel Katanga (Pty) Ltd (998,817) -
40,857,975 27,915,988
Notes to the Annual Financial Statementsfor the year ended 31 March 2009
9. Loans to (from) group companies (continued)
Intercompany loans are classified as loans and receivables and their carrying value approximates fair value. All intercompany loans are made in the ordinary course of business, are interest-free, unsecured and repayable within 30 days of statement issue.
GROUP COMPANY 2009 2008 2009 2008 R R R R
The above loans are disclosed as follows:
Current assets - - 46,594,253 27,915,989
Current liabilities - - (5,736,278) -
- - 40,857,975 27,915,989
10. Other financial assetsGROUP COMPANY
2009 2008 2009 2008 R R R R
Derivative financial instrumentsForeign exchange contract - 837,445 - 837,445
Loans and receivablesThe BSI Share TrustThe above loan is unsecured, interest free with no fixed terms of repayment.
- - - 1,920,232
Total other financial assets - 837,445 - 2,757,677
The financial assets are disclosed as follows:
Non-current assetsLoans and receivables - - - 1,920,232
Current assetsDerivative financial instruments - 837,445 - 837,445
- 837,445 - 2,757,677
The above loans and receivables are held at amortised cost and the carrying value is deemed to be the fair value.
There were no gains or losses realised on the disposal of held to maturity financial assets in 2009 and 2008, as all the financial assets were disposed of at their redemption date.
Notes to the Annual Financial Statements

for the year ended 31 March 2009
11. Financial assets by categoryThe accounting policies for financial instruments have been applied to the line items below:
GROUP - 2009
Loans andreceivables
Fair valuethrough profit or loss / held for trading
Financialderivatives
Held tomaturity
Available forsale

R R R R R
Trade and other receivables 320,055,031 - - - - Cash and cash equivalents 35,087,685 - - - -
355,142,716 - - - -
GROUP - 2008
Loans andreceivables
Fair valuethrough profit or loss - held for trading
Financialderivatives
Held tomaturity
Available forsale

R R R R R
Other financial assets - - 837,445 - - Trade and other receivables 380,314,204 - - - - Cash and cash equivalents 26,235,947 - - - -
406,550,151 - 837,445 - -

COMPANY - 2009
Loans andreceivables
Fair valuethrough profit or loss - held for trading
Financialderivatives
Held tomaturity
Available forsale
R R R R R
Loans to group companies 46,594,253 - - - - Trade and other receivables 245,645,659 - - - - Cash and cash equivalents 10,163,282 - - - -
302,403,194 - - - -
COMPANY - 2008
Loans andreceivables
Fair valuethrough profit or loss - held for trading
Financialderivatives
Held tomaturity
Available forsale
R R R R R
Loans to group companies 27,915,989 - - - - Other financial assets 1,920,232 - 837,445 - - Trade and other receivables 294,226,160 - - - - Cash and cash equivalents 15,073,425 - - - -
339,135,806 - 837,445 - -
Notes to the Annual Financial Statementsfor the year ended 31 March 2009
12. Deferred taxGROUP COMPANY
2009 2008 2009 2008 R R R R
Deferred tax asset (liability)
Accelerated capital allowances for taxpurposes
(339,751) (1,030,061) (419,063) (214,934)
Revaluation, net of related depreciation - (4,095,395) - -Tax losses available for set off against future taxable income
- 1,883,770 - -
Other deferred tax 253,073 - - -
(86,678) (3,241,686) (419,063) (214,934)
GROUP COMPANY2009 2008 2009 2008 R R R R
Reconciliation of deferred tax asset (liability)
At beginning of the year (3,241,686) 3,113,978 (214,934) (190,202) Reduction due to rate change - (114,764) - 7,700

Increase (decrease) in tax losses available for set off against future taxable incomeOriginating temporary difference on tangible fixed assets
(620,706) (2,419,598) - -
(1,000,871 (4,569,168) 54,802 171,767
Effect of exchange rate movement (68,955) - - - Prior year adjustment 2,708,854 10,333 (258,931) 101,492Acquisition of business - 737,533 - (305,691) Classification as held for sale 2,136,686 - - -
(86,678) (3,241,686) (419,063) (214,934)The above deferred tax balance is disclosed as follows:
Non-current assets 3,447,406 2,859,549 - -Non-current liabilities (3,534,084) (6,101,235) (419,063) (214,934)
(86,678) (3,241,686) (419,063) (214,934)
13. InventoriesWork in progress 1,819,439 12,064,668 1,819,439 12,064,668Merchandise 242,938,178 176,375,769 186,883,301 122,091,126
244,757,617 188,440,437 188,702,740 134,155,794
Carrying value of inventories carried at fairvalue less costs to sell
112,133,344 - 81,198,637 -
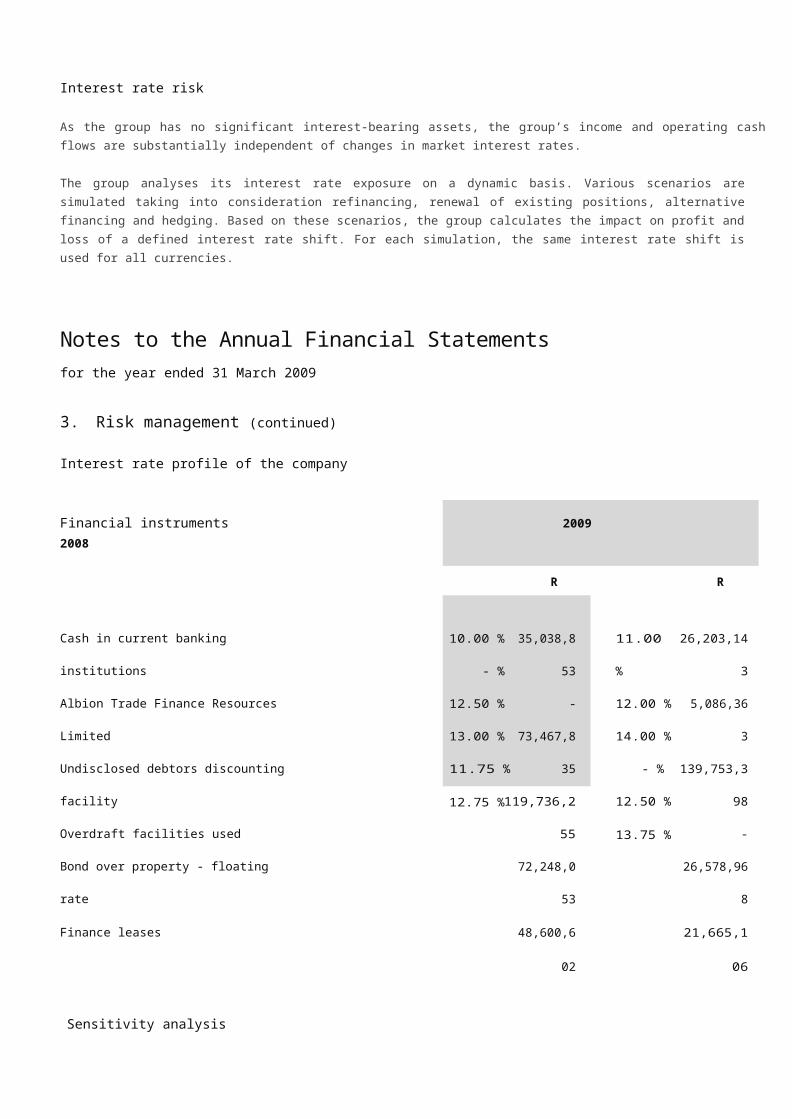
Notes to the Annual Financial Statementsfor the year ended 31 March 2009
13. Inventories (continued)
Inventory has been written down to fair value less costs to sell due to steel price decreases. Inventory write downs throughout the current financial year amounts to R51, 443,768 (2008: R-) of which R31, 144,738 (2008: R-) relates to inventory on hand at balance sheet date. The company write downs comprised R41, 692,659
GROUP COMPANY2009 2008 2009 2008 R R R R
Inventory pledged as security
Inventory pledged as security 75,000,000 25,000,000 75,000,000 25,000,000
Inventory was pledged as security for a credit facility with Arcelor Mittal, previously Nedbank Limited, on behalf of the group. At year end the facility amounted to R175, 000,000 (2008: R140, 000,000).
14. Trade and other receivables
Trade receivables (net of provision) 292,110,154 357,260,333 237,607,262 282,931,593
Prepayments 1,252,606 3,858,904 174,236 106,675
Deposits 316,106 239,714 31,750 31,750
VAT 4,067,999 14,022,008 2,618,168 7,897,973
Staff loans 298,777 157,730 137,960 109,508
Sundry debtors 22,009,389 4,775,515 5,076,283 3,148,661
320,055,031 380,314,204 245,645,659 294,226,160
Trade and other receivables are classified as loans and receivables at amortised cost and their carrying values approximate their fair value.
Trade and other receivables pledged as security
Trade and other receivables with a value of R237, 607,262 (2008: R278, 752,184) were pledged as security for the debtors discounting facility. At year end the outstanding balance on the facility amounted to R73, 467,835 (2008: 132,397,983).
Trade and other receivables past due and not impaired
The ageing of amounts past due and not impaired:
1 month past due 11,744,116 9,824,630 8,407,290 7,060,6802 and more months past due 42,055,781 17,006,548 24,651,089 13,377,425
Trade and other receivables impaired
As of 3I March 2009, trade and other receivables of R 7,574,511 (2008: R 5,618,144) were impaired and provided for. The carrying amount of trade and other receivables are denominated in the following currencies:
Rand 240,251,505 276,428,060 237,607,262 290,269,125US Dollar 51,858,649 4,059,874 - -
Notes to the Annual Financial Statements

for the year ended 31 March 2009
14. Trade and other receivables (continued)
GROUP COMPANY2009 2008 2009 2008 R R R R
Reconciliation of provision for impairment of trade and other receivables
Opening balance 5,618,145 858,540 2,640,559 - Provision for impairment 5,580,261 5,352,040 2,336,588 2,760,428Amounts written off as uncollectible (2,267,088) (687,968) (2,267,088) (73,647) Unused amounts reversed (1,356,807) (905,982) - (46,222) Acquisition of business - 1,001,515 - -
7,574,511 5,618,145 2,710,059 2,640,559
The maximum exposure to credit risk at the reporting date is the fair value of each class of trade and other receivables mentioned above. The group does not hold any collateral as security.
At year end trade and other receivables comprised 1,140 individual debtors (2008: 1,102).
15. Cash and cash equivalentsGROUP COMPANY
2009 2008 2009 2008 R R R R
Cash and cash equivalents consist of:
Cash on hand 48,832 32,803 33,003 25,287Bank balances 34,968,652 26,203,143 10,130,279 15,048,I38Short-term deposits 70,201 - - - Bank overdraft (119,736,255) (139,753,399) (100,910,077) (105,323,751)
(84,648,570) (113,517,453) (90,746,795 (90,250,326)
These have been disclosed as follows:Current assets 35,087,685 26,235,946 10,163,282 15,073,425Current liabilities (119,736,255) (139,753,399) (100,910,077) (105,323,751)
(84,648,570) (113,517,453) (90,746,795) (90,250,326)
The undisclosed debtor discounting facility is secured by:
- invoice discounting agreement incorporating a purchase of book debts;
- unlimited suretyship, exclusing cession of loans funds by:
Red Chip Investments (Proprietary) Limited
Newcolab (Proprietary) Limited
Shearcut (Proprietary) Limited
Doddleprops (Proprietary) Limited

Notes to the Annual Financial Statementsfor the year ended 31 March 2009
15. Cash and cash equivalents (continued)
- cession of Lombards Local and Export Policy No. SDC8720/D1 and 104045.
At 31 March 2009 the company had an overdraft facility from Stanbic Bank Zambia Limited of USDI,200,000 (2008: USD1,200,000) to secure working capital and an additional USDI50,000 guarantee for the supplier line. If called in the company would have an obligation to the bank in terms of counter indemnity of USD500,000 (2008: USD500,000). The guarantee is secured by way of a legal mortgage of USD600,000 (2008: USD600,000) on the company's properties and floating debenture over stocks and debtors for USD500,000 (2008: R500,000).
16. Non-current assets held for saleThe group has decided to dispose of one of its properties, namely Erf number 710, Alrode Ext 4, Johannesburg, measuring 1.6435 hectares consisting of factories and warehouses erected on it. The assets and liabilities of the disposal group are set out below and the revaluation reserve relating to the property, plant and equipment, which will be realised on sale, is disclosed in note 19. Other financial liabilities comprise a bond over the property which was previously disclosed under note 20.
The decision was made by the board to discontinue these operations due to the successful conclusion of a sale agreement for the above property. Transfer has taken place on 10 June 2009.
GROUP COMPANY2009 2008 2009 2008 R R R R
Non-current assets held for saleProperty, plant and equipment 19,416,346 - - -
Non-current liabilities held for saleOther financial liabilities 3,986,955 - - - Deferred tax 2,136,686 - - -
6,123,641 - - -
17. Share capital and share premiumAuthorised10,000,000,000 Ordinary shares of 0.001cents each
100,000 10,000 100,000 10,000
Issued712,728,151 Ordinary shares of 0.001cents each
7,127 7,202 7,199 7,218
Share premium 117,426,312 124,293,966 124,293,966 126,214,178
117,433,439 124,301,168 124,301,165 126,221,396
Reconciliation of number of sharesissued:Reported as at 1 April 2008 719,854,996 10,000 721,775,228 10,000Share conversion - 99,990,000 - 99,990,000Cancellation of shares (15,700,000) - (17,620,232) -Issue of ordinary shares 15,700,000 132,267,454 15,700,000 132,267,454Issue of ordinary shares to directors - 489,507,774 - 489,507,774Less: treasury shares held (7,126,845) (1,920,232) - -
712,728,151 719,854,996 719,854,996 721,775,228
Notes to the Annual Financial Statements
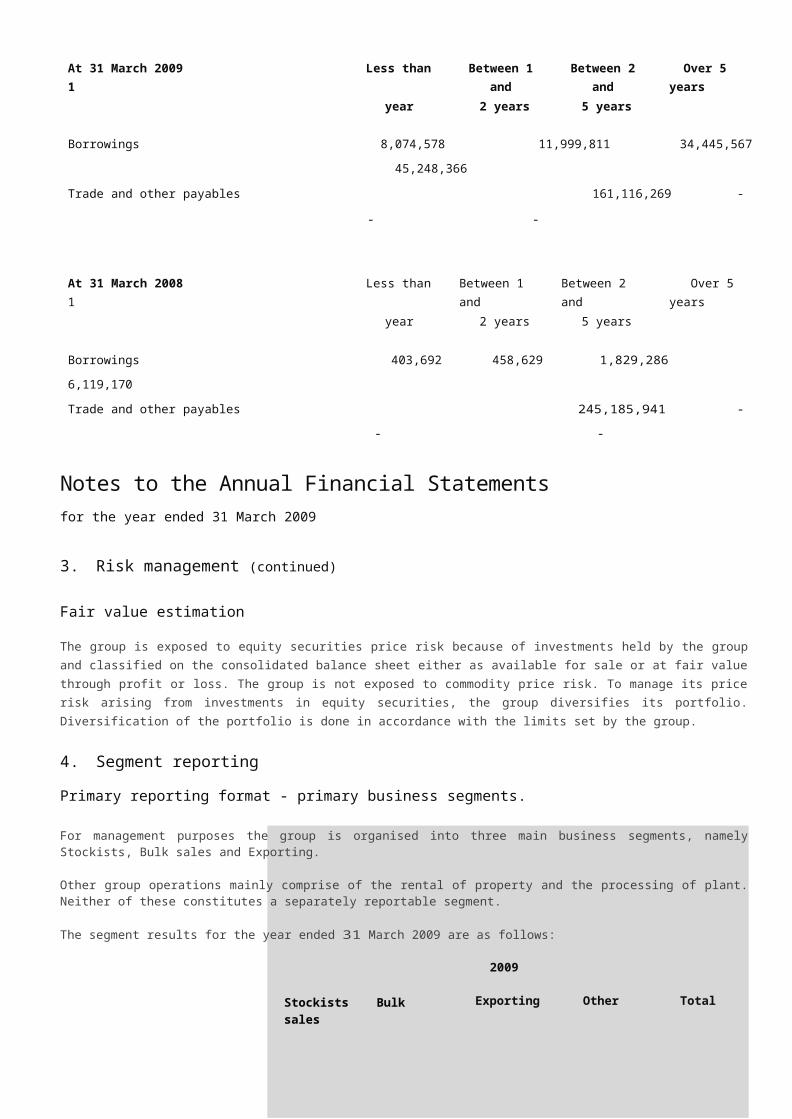
for the year ended 31 March 2009
17. Share capital and share premium (continued)
During the year under review the following share issues to the BSI Share Incentive Scheme were made:
4 April 2008 11 500 000 ordinary shares at R0.8513 August 2008 4 200 000 ordinary shares at R 0.97
These shares were repurchased by the company as disclosed in note 9 of the directors’ report.
Unissued ordinary shares are under the control of the directors in terms of a resolution of members passed at the last annual general meeting. This authority remains in force until the next annual general meeting.
GROUP COMPANY2009 2008 2009 2008 R R R R
Reconciliation of share premiumReported as at 1 April 2008 124,293,966 - 126,214,178 -Issue of shares - ordinary shares 13,848,843 127,377,655 13,848,843 127,377,655Cancellation of shares (13,848,843) - (15,769,055) - Share issue expenses - (1,163,476) - (1,163,477) Treasury shares held (6,867,654) (1,920,213) - -
117,426,312 124,293,966 124,293,966 126,214,178
18. Foreign currency translation reserveTranslation reserve comprises exchange differences on consolidation of foreign subsidiaries.
GROUP 2009 2008
R R
Acquisition of business - 2,827,451
Subsequent consolidation 28,200,644 2,834,731
28,200,644 5,662,182
19. Revaluation reserveIn terms of the articles of association, these reserves are distributable on realisation.
GROUP2009 2008
R R
Property revaluation reserves 9,610,819 6,710,819
The above revaluation reserves are inclusive of revaluations relating to Land and Buildings held for sale as per note 16 amounting to R6,140,957 and will be realised during the next financial year.
Notes to the Annual Financial Statementsfor the year ended 31 March 2009

20. Other financial liabilities GROUP COMPANY
2009 2008 2009 2008 R R R R
At fair value through profit or loss
Drawbridge Trading LimitedThe above loan was incurred on the purchase of Discount Steel Zambia Limited. It is unsecured, interest free and repayable on 30 June 2008.Derivative financial liabilities
- 8,626,535 - 8,626,535
Foreign exchange contract 1,713,181 - 1,402,995 -
1,713,181 8,626,535 1,402,995 8,626,535
Held at amortised cost
Albion Trade Finance Resources Limited The loan facility of USD 1,000,000 was obtained to finance working capital and the loan is repayable on demand. The loanattracts interest at a rate of 12% per annum, an annual arrangement fee of 3% of the facility and a commitment fee at 0.5% on the unutilised portion of the facility at eachmonth end. The facility is not secured.
Instalment sale agreementsThe above instalment sale agreements are secured over property, plant and equipment as per note 5. They are repayable over periods varying from 2 to 72 months andbear interest at varying rates linked to prime.
Mortgage bondThe above bonds are secured by land and building per note 5. They bear interest at varying rates linked to prime (11.5% - 12.5%), are repayable on a ten year term in total monthly instalments of R999,244.97.
- 5,086,363 - -
48,600,602 19,675,706 40,363,203 6,763,175
72,248,053 26,578,968 59,405,119 9,000,000
120,848,655 51,341,037 99,768,322 15,763,175Total other financial liabilities 122,561,836 59,967,572 101,171,317 24,389,710
The maturity of the above liabilities is disclosed per note 3.
Non-current liabilities
At amortised cost 111,965,130 43,836,319 91,811,055 15,763,175
Current liabilities
At fair value 1,713,181 8,626,535 1,402,995 8,626,535At amortised cost 8,883,525 7,504,718 7,957,267 -
10,596,706 16,131,253 9,360,262 8,626,535
122,561,836 59,967,572 101,171,317 24,389,710
The fair values of the financial liabilities approximate their carrying values.
The directors, in terms of the company’s Articles of Association, have unlimited borrowing powers.
Notes to the Annual Financial Statements
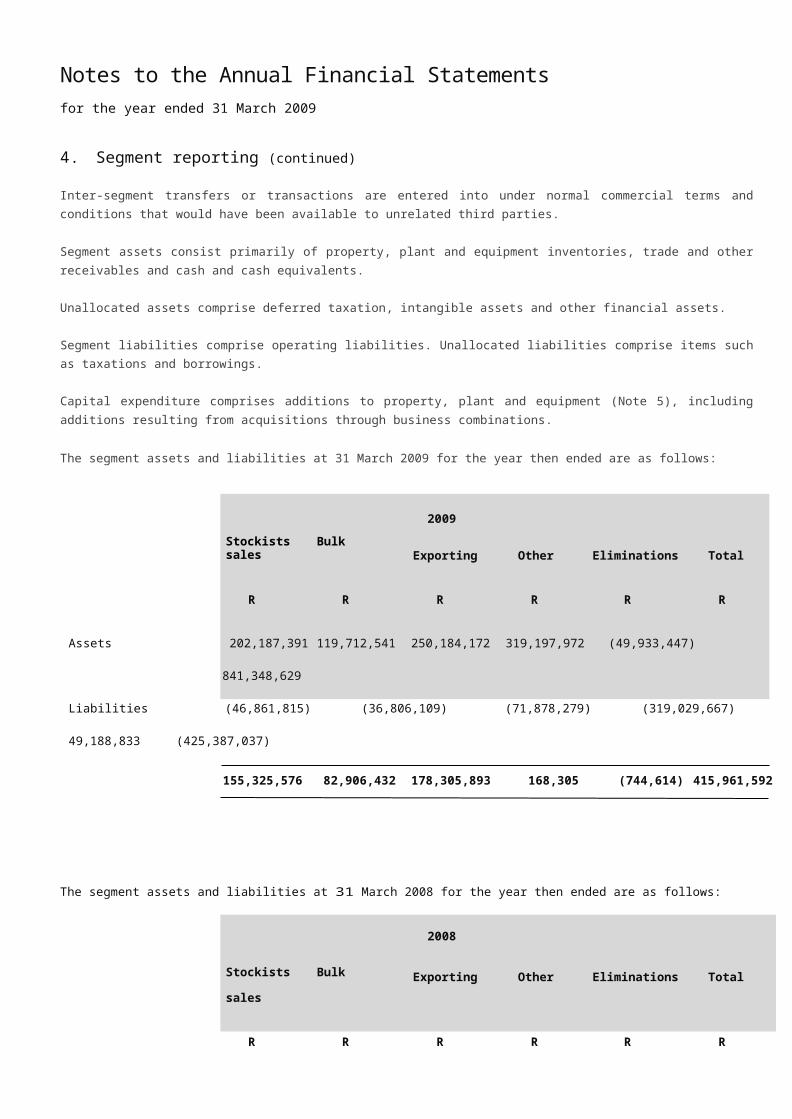
for the year ended 31 March 2009GROUP COMPANY
2009 2008 2009 2008 R R R R
21. Finance lease obligationMinimum lease payments due
- within one year 1,202,840 1,989,400 - -
The group policy is to lease certain motor vehicles, plant and equipment under finance leases.
The leases are all repayable in the next financial year and the average effective borrowing rate was 12% (2008: 13%). Interest rates are linked to prime at the contract date. All lease repayments vary with the interest rate and no arrangement has been entered into for contingent rent.
The group's obligations under finance leases are secured by the lessor's charge over the leased assets. Refer note 5. These liabilities are measured at amortised cost, and their carrying value approximates fair value.
22. ProvisionsReconciliation of provisions - Group - 2009
Opening Balance
Utilised during the year
Total
R R RProvision export rebates 1,202,211 (1,202,211) -
Reconciliation of provisions - Group - 2008
Opening Balance
Utilised during
the year
Total
R R R Provision export rebates 1,801,625 (599,414) 1,202,211
Reconciliation of provisions - Company - 2009
Opening Balance
Utilised the year
Total
R R RProvision export rebates 1,202,211 (1,202,211) -
Reconciliation of provisions - Company - 2008
Opening Balance
Additions Total
Provision export rebates - 1,202,211 1,202,211
This provision represents management's best estimate of the group's shortfall of export rebates already taken to income. There is an expectation that these export rebates will be received but due to the complexity of the qualifying regulations and past experience, it is expected that not all export rebates will be received.
The provision for export rebates is classified as a financial liability measured at amortised cost and its carrying value approximates fair value.
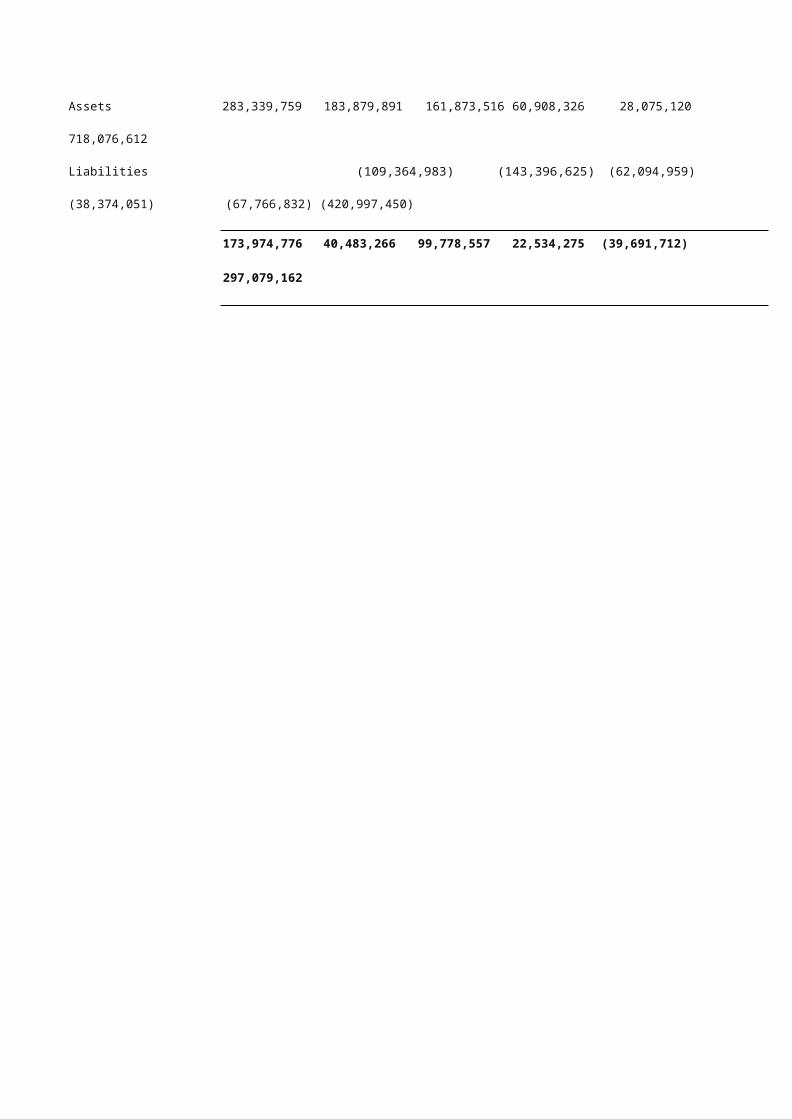
Notes to the Annual Financial Statementsfor the year ended 31 March 2009
23. Trade and other payables
GROUP COMPANY2009 2008 2009 2008 R R R R
Trade payables 156,548,493 158,497,208 154,034,161 132,286,217
VAT 1,117,836 38,228 - -
Accruals and other payables 7,429,816 29,086,250 6,942,660 17,839,529
Accrued expenses 31,085 20,488 - -
Other accrued expenses 139,448 126,548 139,448 171,944
Deposits received 587,661 545,913 - -
Intercompany investment loans - - - 94,888,251
165,854,339 188,314,635 161,116,269 245,185,941
Trade and other payables are held at amortised cost and their carrying value approximates fair value.
The intercompany investment loans arose on the divisionalisation of the following businesses into BSI Steel Limited
- Discount Steel Africa (Proprietary) Limited
- Discount Steel KZN (Proprietary) Limited
- Garrison Steel (Proprietary) Limited
- Discount Steel Trading (Proprietary) Limited
The company has a credit facility of R175,000,000 with Arcelor Mittal which is secured as follow:
- a bond over inventory to the value of R75,000,000;
- reversionary cession of debtors and
- guarantees by the following companies:
Red Chip Investments (Proprietary) Limited
Shearcut (Proprietary) Limited
Doddleprops 6 (Proprietary) Limited

Notes to the Annual Financial Statementsfor the year ended 31 March 2009
24. Financial liabilities by categoryThe accounting policies for financial instruments have been applied to the line items below:
GROUP - 2009
Financialliabilities at
amortised cost
Fair valuethrough profit or loss - held for trading
Fair valuethrough profit
or loss
Total
R R R R
Other financial liabilities 120,848,655 - 1,713,181 122,561,836Finance lease obligation 1,202,840 - - 1,202,840Trade and other payables 165,854,339 - - 165,854,339Bank overdraft 119,736,255 - - 119,736,255
407,642,089 - 1,713,181 409,355,270
GROUP - 2008
Financialliabilities at
amortised cost
Fair valuethrough profit or loss - held for trading
Fair valuethrough profit
or loss
Total
R R R R
Other financial liabilities 51,341,037 - 8,626,535 59,967,572Finance lease obligation 1,989,400 - - 1,989,400Trade and other payables 188,314,635 - - 188,314,635Bank overdraft 139,753,399 - - 139,753,399Provisions 1,202,211 - - 1,202,211
382,600,682 - 8,626,535 391,227,217
COMPANY - 2009
Financialliabilities at
amortised cost
Fair valuethrough profit or loss - held for trading
Fair valuethrough profit or loss - designated
Total

R R R RLoans from group companies 5,736,278 - - 5,736,278Other financial liabilities 99,768,322 - 1,402,995 101,171,317Trade and other payables 161,116,269 - - 161,116,269Bank overdraft 100,910,077 - - 100,910,077
367,530,946 - 1,402,995 368,933,941
COMPANY - 2008
Financialliabilities at
amortised cost
Fair valuethrough profit or loss - held for trading
Fair valuethrough profit or loss - designated
Total
R R R R
Other financial liabilities 15,763,175 - 8,626,535 24,389,710Trade and other payables 245,185,941 - - 245,185,941Bank overdraft 105,323,751 - - 105,323,751Provisions 1,202,211 - - 1,202,211
367,475,078 - 8,626,535 376,101,613
Notes to the Annual Financial Statementsfor the year ended 31 March 2009
25. RevenueGROUP COMPANY
2009 2008 2009 2008
R R R R
Sale of goods 1,856,988,671 1,432,262,338 1,565,069,073 404,438,359Rental Income - 40,140 - -
1,856,988,671 1,432,302,478 1,565,069,073 404,438,359
26. Cost of sales
Sale of goodsCost of goods sold 1,497,974,467 1,135,268,482 1,344,729,171 316,645,436Write down of inventories to net realiseable value
51,443,768 - 41,692,659 -
1,549,418,235 1,135,268,482 1,386,421,830 316,645,436
27. Operating profit before interest and taxationOperating profit before interest and taxation for the year is stated after accounting for the following:
Income from subsidiariesDividends received - - 62,368,350 1,126,667
Operating lease chargesPremises Contractual amounts 2,625,722 2,019,874 3,400,564 1,533,340Equipment Contractual amounts 161,417 100,736 - -
2,787,139 2,120,610 3,400,564 1,533,340
(Loss) profit on sale of property, plant and
equipment
(65,596) 1,011,310 (65,596) (49,886)

Profit on sale of other financial assets - 300,000 - 300,000
Foreign exchange gains 7,368,237 15,750,357 312,194 -
Auditors' remuneration - fees 1,720,898 984,370 1,437,940 207,250
Auditors'remuneration - consulting fees 275,696 56,247 267,836 14,800
Depreciation 6,756,355 6,278,865 2,365,409 697,291
Amortisation 438,027 62,600 432,138 58,912
Employee costs 88,998,066 50,494,448 56,721,139 7,795,011
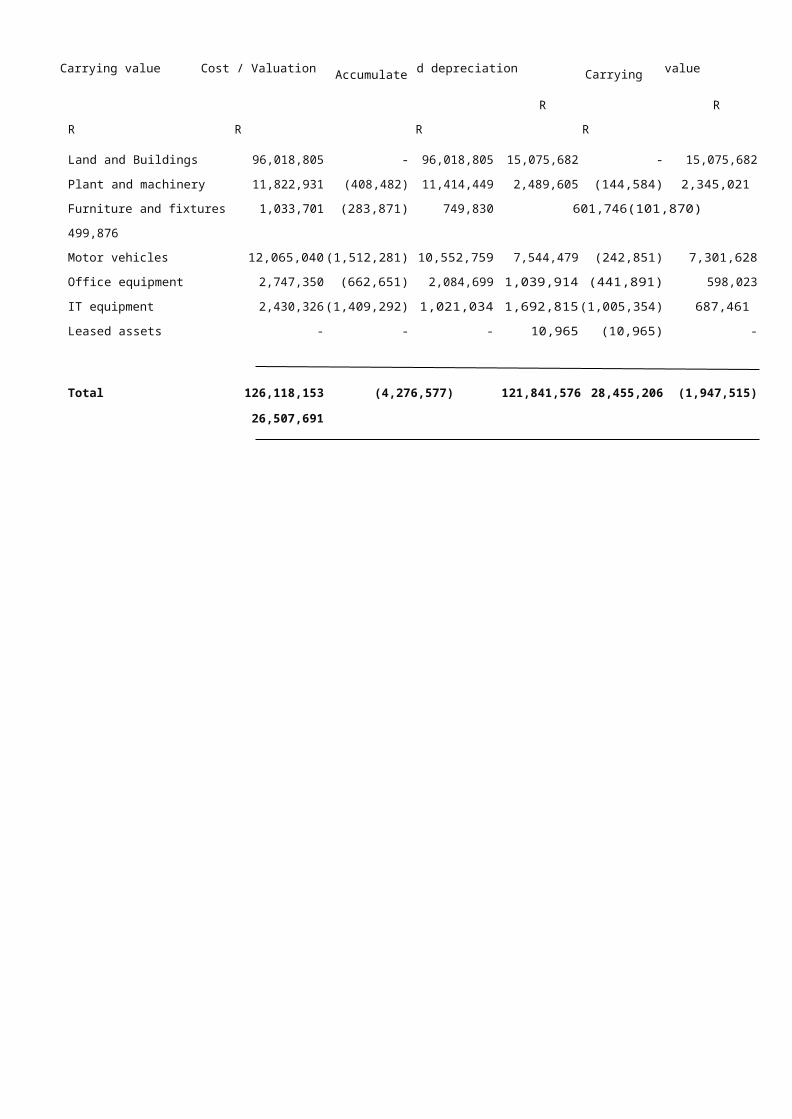
Notes to the Annual Financial Statementsfor the year ended 31 March 2009
27. Operating profit before interest and taxation (continued)GROUP COMPANY
2009 2008 2009 2008
R R R RExpenses by natureEmployee benefit expense (88,998,066) (50,494,448) (56,721,139) (7,795,011) Depreciation (6,756,355) (6,278,865) (2,365,409) (697,291) Amortisation (438,027) (62,600) (432,138) (58,912) Impairment charges (100) - (100) - Transportation expenses (1,906,314) (570,626) (5,243,000) (197,955) Advertising costs (1,960,055) (844,514) (990,747)(115,605) Operating lease payments (2,787,139) (2,120,610) (3,400,564) (1,533,340) Other expenses (1,601,484,189) (1,220,820,193) (1,412,712,781) (351,834,151)
Total cost of sales, distribution costs and administrative expenses
(1,704,330,245) (1,281,191,856) (1,481,865,878) (362,232,265)
28. Investment income
Dividend revenueSubsidiaries - local - - 62,368,350 1,126,667
Interest revenueBank 944,568 923,527 869,081 622,951Interest charged on trade and other receivables
358,261 288,287 358,261 60,190
Interest source - other 55,359 275,535 50,034 10,075,854
1,358,188 1,487,349 63,645,726 11,885,662
29. Finance costsNon-current borrowings - 874,983 - -Trade and other payables 191,844 4,386,788 191,844 6,993,891Finance leases 2,515,621 1,983,002 1,154,993 363,104Bank 2,128,922 9,111,401 1,617,113 10,649Current borrowings 22,304,364 3,780,238 15,926,580 2,993,848Interest paid - - - 772,413Other interest paid 2,214,915 2,237,377 17,144 1,032,748Shareholders loans - 12,896 - -
29,355,666 22,386,685 18,907,674 12,166,653
30. Taxation
Major components of the tax expense
CurrentLocal income tax - current period 24,688,552 31,540,047 19,717,277 12,922,987
DeferredOriginating and reversing temporary differences
1,636,555 2,522,280 (54,802) 24,732
Changes in tax rates - 114,764 - 7,700Effect of exchange rate movement 1,513,011 - - - Prior year adjustment (2,708,854) (10,333) 258,931 32,140
440,712 2,626,711 204,129 64,57225,129,264 34,166,758 19,921,406 12,987,559

Notes to the Annual Financial Statementsfor the year ended 31 March 2009
30. Taxation (continued)
Reconciliation of the tax expense
Reconciliation between applicable tax rate and average effective tax rate.
GROUP COMPANY
2009 2008 2009 2008
R R R RApplicable tax rate 28.00 % 29.00 % 28.00 % 29.00 %
Exempt incomeTax loss usedDecrease in tax ratePermanent differencesPrior yearOtherNon taxable foreign items
- %- %- %
(0.31)%0.45 %0.16 %
(8.27)%
20.03 %
- %(1.80)%(0.09)%(0.29)%
- %(0.47)%(0.76)%
25.59 %
(13.53)%- %- %
0.11 %0.72 %0.16 %
- %
15.46 %
- %- %
(0.02)%(0.07)%
- %(0.11)%
- %
28.80 %
31. Cash generated from (used in) operations
Profit before taxation 125,440,961 133,534,237 128,853,260 45,089,557
Adjustments for:
Depreciation and amortisation 7,194,382 6,341,468 2,797,547 756,203
Loss (profit) on sale of assets 65,596 (1,306,787) 65,596 (250,114)
Dividends received - - (62,368,350) (1,126,667)
Interest income (1,358,188) (1,487,349) (1,277,376) (10,758,995)
Finance costs 29,355,666 22,386,685 18,907,674 12,166,653
Impairment loss / realisation of investment - - 30,658,470 -
Movements in provisions (1,202,211) (599,414) (1,202,211) 1,202,211
Foreign exchange gain on forward exchange
contract
- (837,500) - (837,500)
Foreign exchange gains 7,368,237 (15,750,357) - -
Changes in working capital:
(Increase) in inventories (44,601,405) (81,088,052) (54,546,946) (133,329,309)
Decrease / (Increase) in trade and other
receivables
(Decrease) / increase in trade and other
payables
68,423,333 (170,432,152) 48,580,501 (277,213,564)
(26,384,633) 45,425,453 (84,069,672) 166,224,819
164,301,738 (63,813,768) 26,398,493 (198,076,706)

Notes to the Annual Financial Statementsfor the year ended 31 March 2009
GROUP COMPANY 2009 2008 2009 2008 R R R R
32. Tax paid
Balance at beginning of the year (22,331,770) (9,333,100) (8,446,837) (297,245)
Current tax for the year recognised in
income statement
Adjustment in respect of businesses sold
and acquired during the year including
exchange rate movements
(24,688,552) (31,540,047) (19,717,277) (12,922,987)
- (148,531) - -
Balance at end of the year (572,608) 22,331,770 (6,722,275) 8,446,837
(47,592,930) (18,689,908) (34,886,389) (4,773,395)
33. Cash flows of held for sale operations
Non-current assets held for sale - 3,000,000 - -
34. Acquisition of subsidiariesFair value of assets acquiredProperty, plant and equipment - 7,680,409 - 7,680,409
Deferred tax assets / liabilities - 15,198,911 - 15,198,911
Inventories - 8,281,149 - 8,281,149
Trade and other receivables - 20,657,556 - 20,657,556
Trade and other payables - (33,124,193) - (33,124,193)
Cash - 1,799,664 - 1,799,664
Bank overdraft - (2,053,422) - (2,053,422)
Current tax payable - (148,531) - (148,531)
Total net assets acquired - 18,291,543 - 18,291,543
Net assets acquired - 18,291,543 - 18,291,543
Fair value adjustments - 5,812,807 - 5,812,807
- 24,104,350 - 24,104,350
Consideration paid
Cash - (24,104,350) - (24,104,350)
Net cash outflow on acquisitionCash consideration paid - (24,104,350) - (24,104,350)
Cash acquired - 1,799,664 - 1,799,664
- (22,304,686) - (22,304,686)
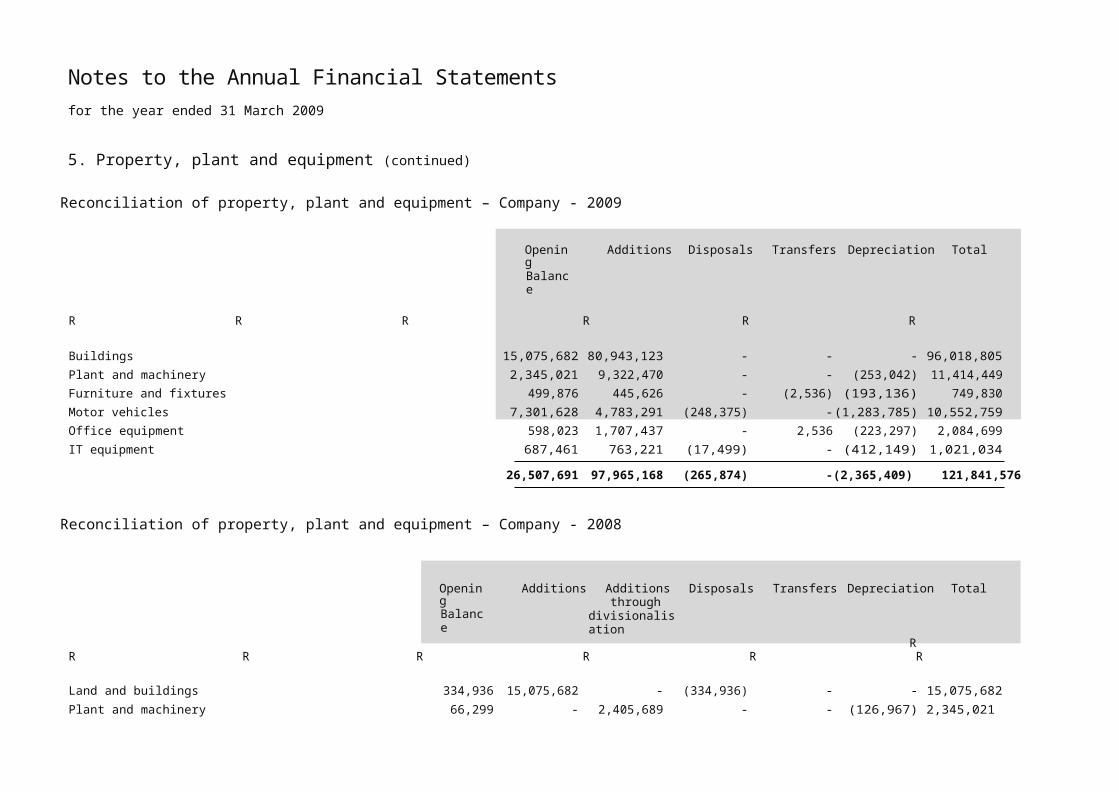
Notes to the Annual Financial Statementsfor the year ended 31 March 2009
GROUP COMPANY 2009 2008 2009 2008 R R R R
35. CommitmentsAuthorised capital expenditure
Not yet contracted for and authorised bydirectors
13, 995, 645 70,000,000 4,390,618 -
This committed expenditure relates to the establishment of the steel processing and distribution plant in Klipriver, Johannesburg and will be financed by available bank facilities and mortgage facilities and will be fulfilled within the next financial year.
Operating leases – as lessee (expense)
Minimum lease payments due
- within one year 1,301,343 1,087,128 - -- in second to fifth year inclusive 3,904,028 4,348,512 - -
5,205,371 5,435,640 - -
Operating lease payments represent rentals payable by the group for certain of its office properties. Leases are negotiated for an average term of seven years and rentals are fixed for an average of three years. No contingent rent is payable.
36. Contingencies
The group has issue cross-guarantees in the form of unlimited surety ships excluding loan sessions, in favour of Nedbank Corporate as per note 15.
37. Related parties
Relationships
Holding company BSI Steel Limited
Subsidiaries Refer to note 8
Shareholder with significant influence Refer to shareholding analysis
Entity under control of shareholder with indirect influence Drawbridge Trading Limited
Members of key management William Battershill
Grant Mackenzie
James Waller
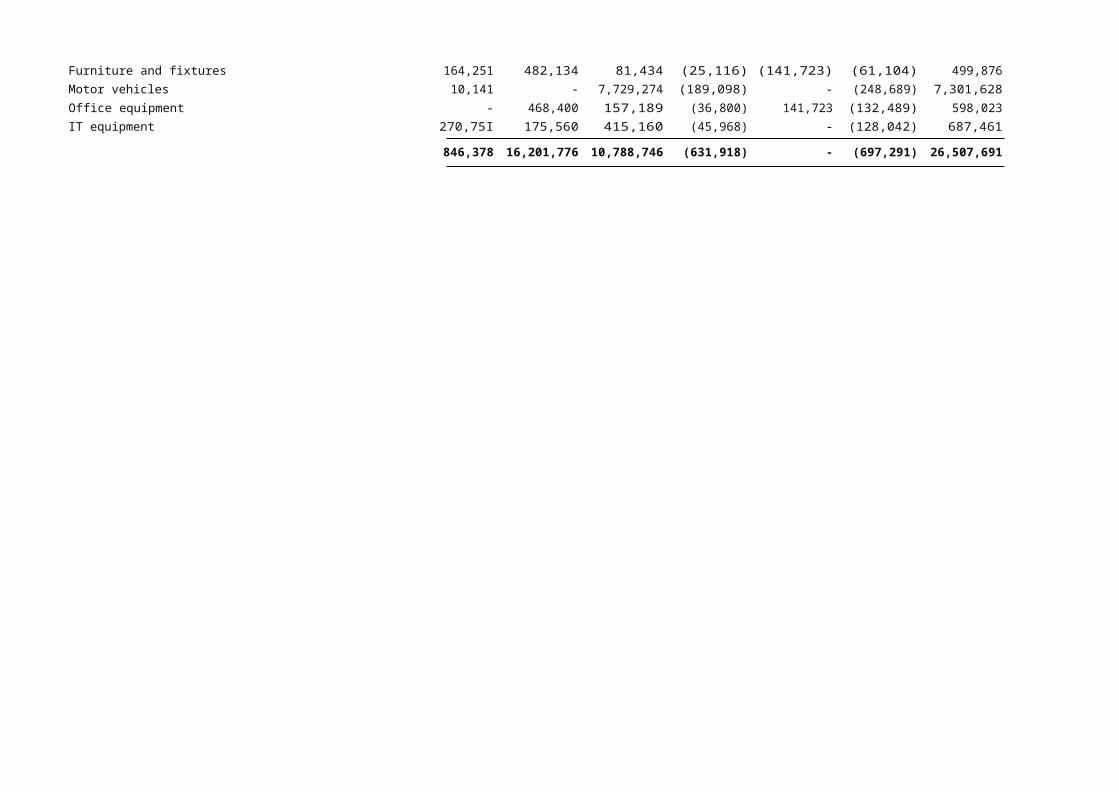
Notes to the Annual Financial Statementsfor the year ended 31 March 2009
37. Related parties (continued)`
Related party balancesCOMPANY
2009 2008 R R
Loan accounts - owing (to) by related partiesGarrison Steel (Proprietary) Limited - 38,686,570Newcolab (Proprietary) Limited (3,196,186) 3,615,233Shearcut Precision Steel (Proprietar) Limited - (131,904) Doddleprops (Proprietary) Limited 1,427,689 1,854,362Red Chip Investments (Proprietary) Limited (1,541,274) (3,729,514) Shearcut (Proprietary) Limited 27,836,629 7,008,280Discount Steel KZN (Proprietary) Limited - 25,273,223Discount Steel Africa (Proprietary) Limited - 44,571,600Discount Steel Trading (Proprietary) Limited - 100,511,828Drawbridge Trading Limited - 8,626,535BSI Steel Katanga SPRL (998,817) -BSI Steel Zambia Limited 17,329,935 -
Amounts included in trade receivable (trade payable) regarding related partiesShearcut (Proprietary) Limited (2,453,396) (1,925,424) Doddleprops 6 (Proprietary) Limited (78,222) - Red Chip Investments (Proprietary) Limited (446,291) - BSI Steel Zambia Limited 8,972,722 - BSI Steel Katanga SPRL 5,050,220 - Discount Steel Zambia Limited - 37,694,426Discount Steel Africa (Proprietary) Limited - 9,476,471
Related party transactions
Interest paid to (received from) related partiesDiscount Steel Africa (Proprietary) Limited - (327,394) Discount Steel Africa (Proprietary) Limited - 400,070Shearcut (Proprietary) Limited - (988,495) Doddleprops (Proprietary) Limtied - (158,418) Garrison Steel (Proprietary) Limited -(1,432,560) Discount Steel KZN (Proprietary) Limited -(659,774) Newcolab (Proprietary) Limited -(415,863) Newcolab (Proprietary) Limited - 102,826Discount Steel Trading (Proprietary) Limited - (443,925) Discount Steel Trading (Proprietary) Limited - 404,596Red Chip Investments (Proprietary) Limited - (42,719) Red Chip Investments (Proprietary) Limited - 299,810
Purchases from (sales to) related partiesShearcut (Proprietary) Limited 11,203,364 2,764,963Garrison Steel (Proprietary) Limited - 318,355BSI Steel Zambia Limited (209,922,634) -BSI Steel Katanga SPRL (40,537,549) -

Notes to the Annual Financial Statementsfor the year ended 31 March 2009
37. Related parties (continued)COMPANY
2009 2008 R R
Rent paid to (received from) related partiesDoddleprops 6 (Pry) Ltd 823,389 - Red Chip Investments (Pty) Ltd 1,894,584 -
Administration fees paid to (received from) related partiesDiscount Steel Africa (Proprietary) Limited - (360,495) Shearcut (Proprietary) Limited 1,799,047 (13,764)Garrison Steel (Proprietary) Limited - (355,545) Discount Steel KZN (Proprietary) Limited - (989,568) Discount Steel Trading (Proprietary) Limited - (449,370) BSI Steel Zambia Limited 90,406 - BSI Steel Katanga SPRL 12,601 -
Dividends from/(to) related partiesDiscount Steel Africa (Proprietary) Limited 39,304,905 1,126,667Discount Steel Trading (Proprietary) Limited 23,482,332 - Discount Steel KZN (Proprietary) Limited 5,286,934 - Garrison Steel (Proprietary) Limited 23,303,199 - Shearcut Precision Steel (Proprietary) Limited 1,647,149 -
Compensation to directors and other key management
Details of compensation to directors and other key management is detailed in note 38.
38. Directors’ Emoluments
EXECUTIVE
2009 Basic remuneration
Performance
bonus
Retirement , medical and
other benefits
Total
R R R R
WL Battershill 1,417,573 4,158,512 239,527 5,815,612GDG Mackenzie 1,461,250 3,605,193 237,757 5,304,200JR Waller 1,073,624 2,475,397 175,228 3,724,249WR Teichmann 1,048,159 2,826,725 127,037 4,001,921C Parry 1,017,433 3,353,671 166,343 4,537,447
6,018,039 16,419,498 945,892 23,383,429
2008 Basic remuneration
Performance bonus
Retirement, medical and
other benefits
Total
R R R R
WL Battershill 1,078,352 3,044,284 191,363 4,313,999GDG Mackenzie 967,354 2,878,411 176,587 4,022,352JR Waller 723,542 1,721,432 263,120 2,708,094C Parry 335,766 651,610 99,150 1,086,526
3,105,014 8,295,737 730,220 12,130,971
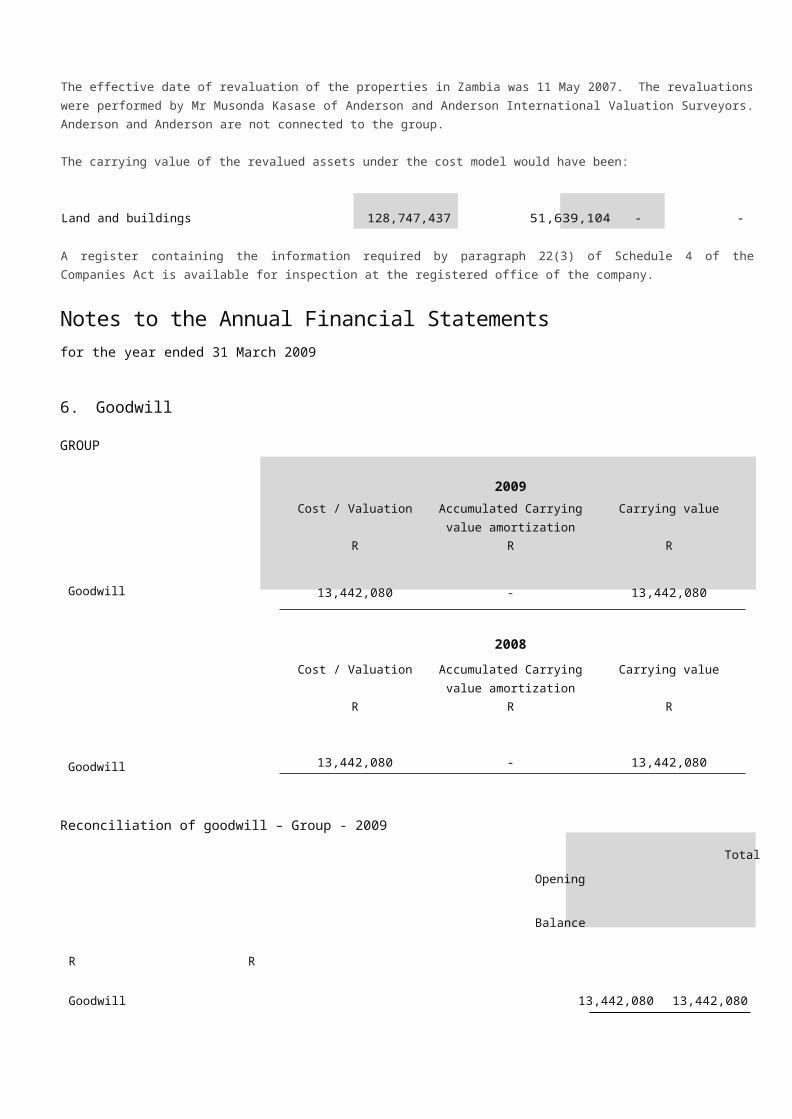
Notes to the Annual Financial Statementsfor the year ended 31 March 2009
38. Directors’ Emoluments (continued)
NON-EXECUTIVE
2009 Directors' fees Committee fees
Total
R R R
NG Payne 80,004 129,996 210,000EG Dube 13,334 6,666 20,000BM Khoza 66,670 33,330 100,000
160,008 169,992 330,000
2008 Directors' fees Committee Total
fees R R R
NG Payne 46,667 75,833 122,500EG Dube 46,667 23,333 70,000
93,334 99,166 192,500
39. Post balance sheet eventSteel prices have decreased by R500 and R1,000 per ton on 1 April 2009 and 1 May 2009 respectively and is to increase by R250 per ton effective 1 July 2009. The net realisable value of inventory at year end has been adjusted accordingly.
Business activities have been extended to Zimbabwe as from 1 May 2009 and the operation will constitute a subsidiary BSI Steel Africa Limited.
Land and buildings classified as held for sale at year end as per note 16 have been disposed of on 10 June 2009.
40. Earnings per shareGROUP
2009 2008 R R
Basic
Profit attributable to ordinary shareholders 100,311,697 99,367,479
Weighted average number of ordinary shares in issue 717,574,859 660,174,383
Basic and diluted earnings per share (cents) 13.98 15.05
Reconciliation of headline earningsHeadline earnings attributable to ordinary shareholders:
Profit attributable to equity holders of the group 100,311,697 99,367,479
Adjusted for:
- loss (profit) on disposal of property, plant and equipment 65,596 (1,306,787)- tax impact of the above adjustments (18,367) 365,900
Headline earnings attributable to ordinary shareholders 100,358,926 98,426,592

Notes to the Annual Financial Statementsfor the year ended 31 March 2009
40. Earnings per share (continued)
GROUP2009 2008 R R
Weighted number of shares717,574,859 660,174,383
Headline earnings per share (cents)13.99 14.91
Basic
Basic earnings per share are calculated by dividing the profit attributable to equity holders of the group by the weighted average
number of ordinary shares in issue during the year.
Headline
Headline earnings per share is calculated by excluding all the capital gains and losses from the profit attributable to ordinary
shareholders and dividing the resultant headline earnings by the weighted average number of ordinary shares in issue during the
year.
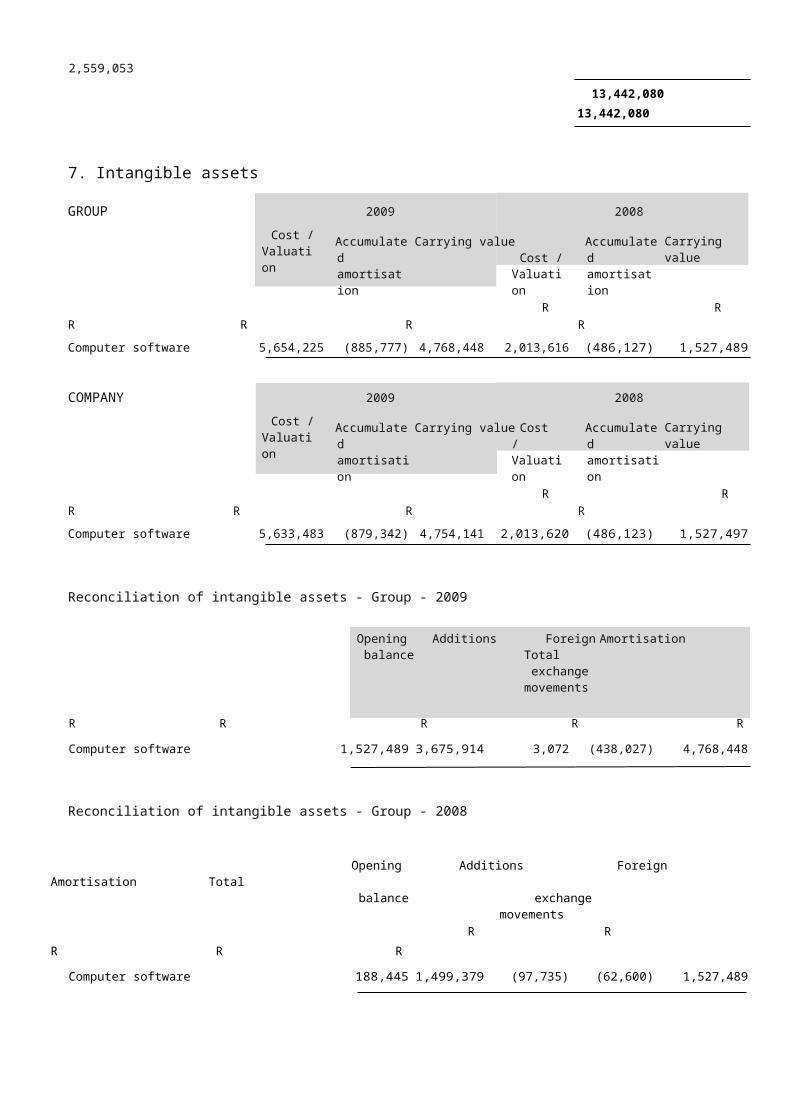
Other than directors’ holding disclosed in note 10 of the Directors’ Report, there are no holding of 5% or more.
Notice of Annual General Meeting
Shareholder Analysis
Register Date: 27 March 2009Issued Share Capital: 737,475,228 shares
SHAREHOLDER SPREAD No. of shareholders % No. of Shares %
1 - 1,000 shares 73 7.77 48,2
46 0.01
1,001 - 10,000 shares 463 49.26 2,430,6
28 0.33
10,001 - 100,000 shares 273 29.04 9,823,5
38 1.33
100,001 - 1,000,000 shares 89 9.47 30,721,37
4 4.17
1,000,001 shares and over 42 4.47 694,451,44
2 94.17 940 100 737,475,228 100
DISTRIBUTION OF SHAREHOLDERS No. of shareholders % No. of Shares %
Banks 2 0.21 202,7
69 0.03
Brokers 2 0.21 309,6
29 0.04
Close Corporations 19 2.02 326,4
30 0.04
Endowment Funds 5 0.53 164,205,83
8 22.27
Hedge Fund 1 0.11 3,378,5
05 0.46
Individuals 807 85.85 87,439,15
2 11.86
Insurance Companies 1 0.11 50,0
00 0.01
Investment Companies 2 0.21 139,1
88 0.02
Mutual Funds 6 0.64 41,325,46
2 5.60
Nominees and Trusts 56 5.96 345,988,28
4 46.92
Other Corporations 7 0.74 703,8
56 0.10
Pension Funds 3 0.32 70,0
00 0.01
Private Companies 25 2.66 75,215,88
3 10.20Public Companies 1 0.11 500,000 0.07Share Incentive Trust 3 0.32 17,620,232 2.39 940 100 737,475,228 100
PUBLIC / NON - PUBLIC SHAREHOLDERS No. of shareholdings % No. of Shares %Non - Public Shareholders 50 5.32 579,533,662 78.58Directors of the Company 8 0.85 524,147,234 71.07
Directors of Subsidiaries 3 0.32 13,784,90
3 1.87
Designated Adviser 4 0.43 2,720,0
00 0.37
Staff Holdings 35 3.72 38,881,52
5 5.
27 Public Shareholders 890 94.68 157,941,566 21.42 940 100 737,475,228 100
Beneficial shareholders holding of 5% or more
BSI Steel Limited: Shareholder Analysis Tables

BSI Steel Limited
(formerly BSI (SA) Limited)
(Incorporated in the Republic)
(Registration no 2001/023164/06)
JSE code: BSS ISIN: ZAE000125134
(“BSI” or “the Company”)
Notice is hereby given that the annual general meeting of members of BSI Steel Limited will be held at BSI Steel Limited Gauteng,
Erf 24, Farm Waterval, M61, Klipriver on Tuesday, 8 September 2009 at 4.00 pm to consider the business set out herein and if
deemed fit, to pass, with or without modification the ordinary and special resolutions set out below:
Ordinary Business:
Ordinary resolution no. 1: Consideration of Annual Financial Statements
To receive and adopt the annual financial statements for the company and the group for the year ended 31 March 2009, together
with the directors’ and auditors’ reports.
Ordinary resolution no. 2: Re-appointment of auditors
To re-appoint Deloitte and Touche as independent auditors of the company for the year ending 31 March 2010, such auditors
having been nominated by the company’s Audit Committee in terms of section 270(A)(i) of the Companies Act (act 61 of 1973), as
amended.
Ordinary resolution no. 3: Re-election of directors
In terms of article 117 of the company’s articles of association, the following directors retire by rotation at the annual general
meeting, but being eligible, offer themselves for re-election. Such re-elections are to be voted on individually unless a resolution is
agreed to by the meeting (without any vote against it) that a single resolution be used.
G D G MackenzieN G PayneC Parry
A brief CV of each director is available on pages 6 and 7 of this annual report.
Ordinary resolution no. 4: Directors’ remuneration
Resolved that the remuneration of the directors as set out on page 79 and 80 of this report be confirmed and approved.
Ordinary Resolution no 5: Approval of proposed directors’ remuneration
Resolved that the non-executive directors’ remuneration proposed for the year ending 31 March 2010 as set out below, be
approved.
Non-executive directors R 80 000 per annum
Audit Committee Chairman R 85 000 per annum
Risk Committee Chairman R 45 000 per annum
Audit Committee member R 40 000 per annum
Notice of Annual General Meeting (continue)
Ordinary Resolution no. 6: Unissued ordinary shares placed under the control of the directors

Resolved that the entire authorised but unissued ordinary share capital of the company, from time to time be placed under the control of the directors of the company, which directors are, subject to the Listings Requirements of the JSE Limited (“JSE”) and the provisions of sections 221 and 222 of the Companies Act (Act 61 of 1973), as amended (“the Act”), authorised to allot and issue any such shares at such time or times, to any such person or persons, company or companies and upon such terms and conditions as they may determine, such authority to remain in force until the next annual general meeting of the company, but at all times subject to sufficient unissued shares being available for issue and subject to the provisions of the Act.
Ordinary resolution no. 7: General authority to issue of shares for cash
Resolved that in terms of the Listing Requirements of the JSE Limited (“JSE”), the mandate given to the directors of the company in terms of a general authority to issue shares for cash, as and when suitable opportunities arise, be renewed subject to the following conditions:
1 The general authority be valid until the company’s next annual general meeting provided that it shall not extend beyond fifteen
months from the date of the passing of this ordinary resolution (whichever period is shorter).
2 The allotment and issue of the shares must be made to public shareholders as defined in the Listing Requirements of the JSE
and not to related parties.
3 The shares which are the subject of the issue for cash must be of a class already in issue, or where this is not the case, must
be limited to such shares or rights that are convertible into a class already in issue.
4 The number of shares issued for cash in aggregate in any one financial year shall not exceed 50% (fifty percent) of the
company’s issued ordinary share capital. The number of ordinary shares which may be issued shall be based on the number of
ordinary shares in issue at the date of such application less any ordinary shares issued during the current financial year,
provided that any ordinary shares to be issued pursuant to a rights issue (announced, irrevocable and fully underwritten) or
acquisition (concluded up to the date of application including announcement of the final terms) may be included as though they
were shares in issue at the date of application.
5 The maximum discount at which ordinary shares may be issued is 10% (ten percent) of the weighted average traded price of
those shares over the 30 business days prior to the date that the price of the issue is agreed between the company and the
party subscribing for the securities or any other price agreed to by the JSE.
6 After the company has issued shares for cash which represent, on a cumulative basis within a financial year, 5% (five percent)
or more of the number of shares in issue prior to that issue, the company shall publish an announcement containing full details
of the issue (including the number of shares issued, the average discount to the weighted average traded price of the shares
over the 30 business days prior to the date that the price of the issue is agreed in writing between the issuer and the party
subscribing for the shares and the effect of the issue on net asset value, net tangible asset value, earnings and headline
earnings per share), or any other announcements that may be required in such regard in terms of the Listing Requirements of
the JSE which may be applicable from time to time.
In terms of the Listing Requirements of the JSE, a 75% (seventy five percent) majority of the votes cast by shareholders present or represented by proxy at the general meeting, excluding the Designated Adviser and the controlling shareholders together with their associates, must be cast in favour of ordinary resolution number 7 for it to be approved.
Special BusinessSpecial resolution: General Authority to repurchase shares:Resolved in terms of section 85 of the Companies Act (Act 61 of 1973), as amended and the memorandum and articles of association of the company (or one of its wholly-owned subsidiaries) that the directors of the company be authorised, by way of a general authority, until this authority lapses at the next annual general meeting of the company provided that it shall not extend beyond fifteen months from the date of passing of this special resolution (whichever period is the shorter), to acquire the company’s own shares, upon such terms and conditions and in such amounts as the directors may from time to time decide, but subject to the Listings Requirements of the JSE Limited (“JSE”) subject to the following terms and conditions:
Notice of Annual General Meeting (continue)
1 any repurchase of securities must be effected through the order book operated by the JSE trading system and done without any
prior understanding or arrangement between the company and the counter party;
2 at any point in time, the company may only appoint one agent to effect any repurchases on its behalf;

3 the number of shares which may be repurchased pursuant to this authority in any financial year may not in the aggregate
exceed 20% (twenty percent) of the company’s issued share capital as at the date of passing of this special resolution or 10%
of the company’s issued share capital in the case of an acquisition of shares in the company by a subsidiary of the company;
4 repurchases of shares may not be made at a price greater than 10% (ten percent) above the weighted average of the market
value of the securities for the five business days immediately preceding the date on which the transaction was effected;
5 repurchases may not be undertaken by the company or any of its wholly owned subsidiaries during a prohibited period as
defined in the Listings Requirements of the JSE unless a repurchase programme is in place where the dates and quantities of
securities to be traded during the relevant period are fixed and full details of the programme have been disclosed in an
announcement over SENS prior to the commencement of the prohibited period;
6 repurchases may only take place if, after such repurchase, the shareholder spread of the company complies with the Listing
Requirements of the JSE;
7 after the company has acquired shares which constitute, on a cumulative basis, 3% (three percent) of the initial number of
shares in issue (at the time that authority from shareholders for the repurchase is granted) of the relevant class of securities and
for each 3% in aggregate of the initial number of that class acquired thereafter, the company shall publish an announcement
containing full details of such repurchase, and; 8 the company may not enter the market to proceed with the repurchase of its shares until the company’s Designated Adviser has
confirmed the adequacy of the company’s working capital for purposes of undertaking the repurchase of shares in writing to the
JSE.
The effect of the special resolution and the reason there for is to extend the general authority given to the directors of the company or any subsidiary of the company in terms of the Act and the JSE Listings Requirements for the acquisition by the company or its subsidiaries of the company’s securities which authority shall be used at the directors’ discretion during the course of the period authorised.
In accordance with the Listings Requirements of the JSE Limited, the directors record that:
The company is currently effecting a repurchase of its securities and the directors would utilise the renewed general authority to repurchase securities as and when suitable opportunities present themselves, which opportunities may require expeditious and immediate action.
The directors, after considering the effect of the maximum number of securities which may be repurchased pursuant to the general authority, are of the opinion that for a period of 12 months after the date of the notice of this annual general meeting:
- the company and the group will be able to pay their debts in the ordinary course of business;
- the consolidated assets of the company and of the group will be in excess of the liabilities of the company and the group;
the assets and liabilities being recognised and measured in accordance with the accounting policies used in the latest
audited group annual financial statements ;
- the share capital and reserves of the company and of the group are adequate for ordinary purposes; and
- the working capital of the company and the group will be adequate for ordinary business.
Disclosures required in terms of paragraph 11.26 of the JSE Listings Requirements:
The following additional information, some of which may appear elsewhere in this annual report is provided in terms of the JSE Listing Requirements for purposes of the special resolution:
Directors of the company – pages 6 and 7Major shareholders – page 82 Directors’ interest in the company’s shares – page 29 Company’s share capital – page 67
Notice of Annual General Meeting (continue)
Directors’ responsibility statement
The directors, whose names are given on page 6 and 7 of this annual report, collectively and individually accept full responsibility for the accuracy of the information pertaining to the above special resolution and certify that to the best of their knowledge and belief there are no facts that have been omitted which would make any statement false or misleading and that all reasonable enquiries to

ascertain such facts have been made and that the aforementioned special resolution contains all the information required by the JSE.
Material changeOther than the facts and developments reported on in this Annual Report, there have been no material changes in the financial or trading position of the company or its subsidiaries since the company’s financial year end and the signature date of this annual report.
Litigation statementOther than as disclosed or accounted for in this annual report, the directors are not aware of any, legal or arbitration proceedings, including any proceedings that are pending or threatened of which the company is aware which may have or have had in the recent past, being at least the previous 12 months from date of this annual report, a material effect on the financial position of the company and its subsidiaries.
Voting and Proxies A shareholder of the company entitled to attend, speak, and vote at the annual general meeting is entitled to appoint a proxy or proxies to attend, speak and on a poll vote in his stead. The proxy need not be a shareholder of the company. A form of proxy is attached for the convenience of any certificated shareholder and own name registered dematerialised shareholder who cannot attend the annual general meeting, but who wishes to be represented.
Additional forms of proxy may also be obtained on request from the company’s registered office. The completed forms of proxy must be deposited at, posted or faxed to the transfer secretaries at the address set out on the inside of the back cover, to be received by no later than 9:00 on Monday, 7 September 2009. Any member who completes and lodges a form of proxy will nevertheless be entitled to attend and vote in person at the annual general meeting should the member subsequently decide to do so.
On a show of hands, every shareholder of the company present in person or by proxy shall have 1 (one) vote only, irrespective of the number of shares he holds or represents, provided that a proxy shall, irrespective of the number of members he represents have only 1 (one) vote. On a poll, every shareholder of the company who is present in person or represented by proxy, shall have one vote for every share held in the company by such shareholder.
Shareholders who have dematerialised their ordinary shares through a CSDP or broker, other than own name registered dematerialised shareholders, and who wish to attend the annual general meeting must request their CSDP or broker to issue them with a Letter of Representation. Alternatively dematerialised shareholders other than own name registered dematerialised shareholders, who wish to be represented, must provide their CSDP or broker with their voting instructions in terms of the custody agreement between them and their CSDP or broker in the manner and by time-frame stipulated.
By order of the board
S J Hackett Company Secretary Pietermaritzburg 05 August 2009
Form of ProxyBSI Steel Limited(formerly BSI (SA) Limited)(Incorporated in the Republic)(Registration no 2001/023164/06)JSE code: BSS ISIN: ZAE000125134(“BSI” or “the Company”)
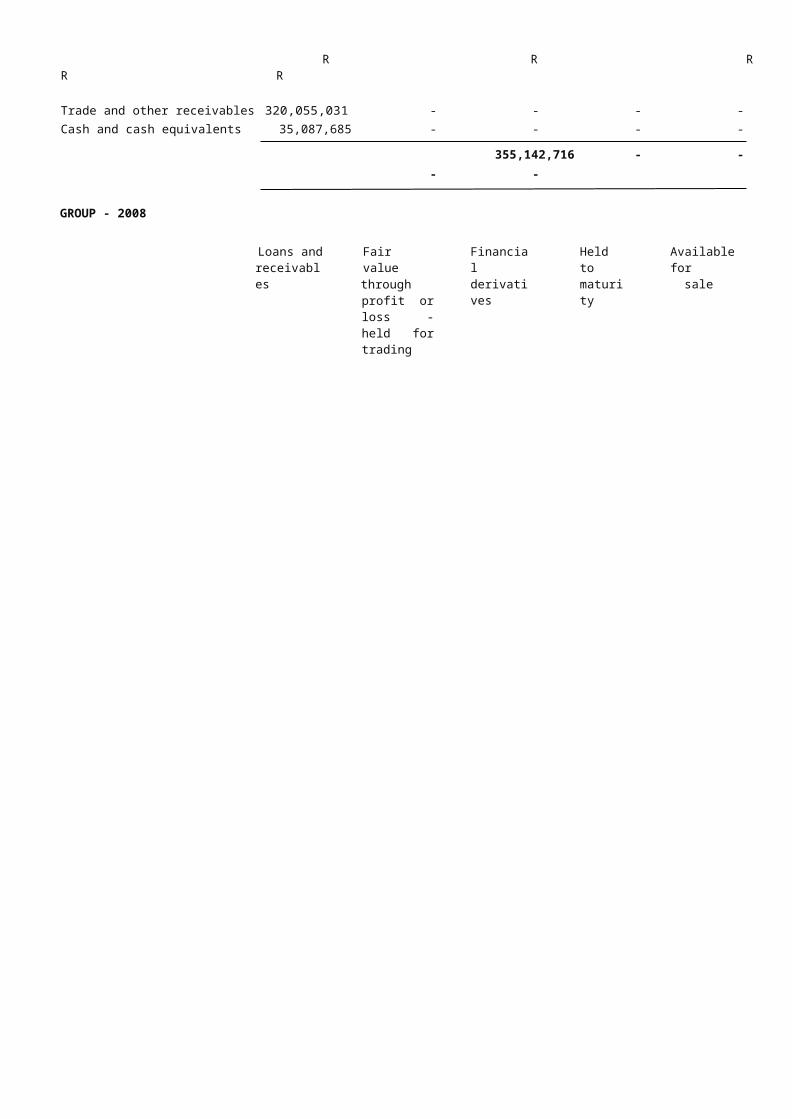
For use by the holders of the company’s certificated ordinary shares (“certificated shareholder”) and/or dematerialised ordinary shareholders whose shares are held through a CSDP or broker and who have selected own name registration (“own name dematerialised shareholders”) at the annual general meeting of the company to be held at BSI Steel Limited Gauteng, Erf 24, Farm Waterval, M61, Klipriver on Tuesday, 8 September 2009 at 4.00 pm and at any adjournment thereof.
Not for the use by holders of the company’s dematerialised ordinary shares who are not own name dematerialised shareholders. Such shareholders must contact their CSDP or broker timeously if they wish to attend and vote at the annual general meeting and request that they be issued with the necessary Letter of Representation to do so, or provide the CSDP or broker timeously with their voting instructions should they not wish to attend the annual general meeting in order for the CSDP or broker to vote thereat in accordance with their instructions.
I/We (Please print full names)
of (address)
being the holder(s) of ordinary shares in the company, hereby appoint or failing him / her or failing him / her
the chairperson of the annual general meeting, as my/our proxy to vote for me/us on my/our behalf at the annual general meeting which will be held for the purpose of considering and deemed fit, passing, with or without modification, the special and ordinary resolutions to be proposed thereat and at any adjournment thereof; and to vote for/and or against the special and ordinary resolution and/or abstain from voting in respect of the ordinary share register in my/our name/s, in accordance with the following instruction: (*Please indicate with an ”X” the appropriate space below how you wish your votes to be cast unless otherwise instructed my/our proxy may vote as he/she thinks fit).
In favour Against Abstain
ORDINARY BUSINESS1. To adopt the annual financial statements for the year
ended 31 March 20092. To re-appoint Deloitte and Touche as independent
auditors of the company3. (a) To re-elect Mr G D G Mackenzie as a director
(b) To re-elect Mr N G Payne as a director
(c) To re-elect Mr C Parry as a director
4. To approve remuneration paid to directors
5. To approve proposed directors’ remuneration
6. To place unissued shares under the control of the directors
7. General authority to issue shares for cash
SPECIAL BUSINESS8. Special resolution
General Authority to repurchase shares Signed this day of 2009
Signature
Assisted by (if applicable)
Please read the notes on the reverse.
Notes to form of proxy1 This form of proxy is to be completed only by those members who are:
a) holding shares in certificated form; or
b) recorded in the sub register in electronic form in their “own name”.
2 A shareholder may insert the name or names of two alternative proxies of his/her choice in the space provided, with or
without deleting “the chairman of the meeting”. The person whose name appears first on the form of proxy and who is present
at the annual general meeting will be entitled to act as proxy to the exclusion of those whose names follow. Any such proxy,
who need not be a shareholder of the company, is entitled to attend, speak and vote on behalf of the shareholder.

3 A proxy is entitled to one vote on a show of hands and, on a poll, one vote for each share held. A shareholder’s instructions to
the proxy must be indicated in the appropriate spaces.
4 If a shareholder does not indicate on this instrument that the proxy is to vote in favour of or against any resolution or to abstain
from voting or gives contradictory instructions, or should any further resolution/s or any amendment/s which may be properly put
before the annual general meeting be proposed, the proxy shall be entitled to vote as he thinks fit.
Forms of proxy must be lodged at, posted to or faxed to the transfer secretaries, Computershare Investor Services (Pty) Ltd,
Ground Floor, 70 Marshall Street, Johannesburg, 2001 (P O Box 61051, Marshalltown, 2107) to reach the company by no later
than 09.00 on Monday, 7 September 2009.
5 Documentary evidence establishing the authority of the person signing the proxy in a representative capacity must be attached
to this form of proxy unless previously recorded by the company’s transfer secretaries or waived by the chairperson of the
annual general meeting.
6 The completion and lodging of this form of proxy does not preclude the relevant shareholder from attending the annual general
meeting and speaking and voting in person to the exclusion of any proxy appointed in terms of this proxy form.
7 Any alteration or correction made to this form of proxy must be initialed by the signatory/ies.
8 The chairman of the meeting may accept or reject any form of proxy, which is completed and/or received other than in
accordance with these notes, provided that he shall not accept a proxy unless he is satisfied as to the manner in which a
member wishes to vote.
9 Shareholders who have dematerialised their shares must inform their Central Securities Depository Participant (“CSDP”) or
broker of their intention to attend the annual general meeting and request their CSDP or broker to issue them with the
necessary Letter of Representation to attend the annual general meeting or provide their CSDP or broker with their voting
instructions should they not wish to attend the annual general meeting in person but wish to be represented there at. This must
be done in terms of the agreement entered into between the members and their CSDP or broker.