bt group plc€¦ · customer management ... supplier rationalisation review value for money from...
TRANSCRIPT

BT Group plc Cost Transformation Teach-in
9 December 2014

© British Telecommunications plc
Agenda 15:30 Tony Chanmugam BT Group Finance Director
15:40 Shahzad Saleem Cost Transformation Managing Director
15:55 Case Study 1: Programme Compete Arthur Yu, Cost Transformation Director
Becky Warburton, Head of Cost Transformation
16:10 Case Study 2: Customer Management & Contact Centre Programme Andy Wells, Cost Transformation Director
Charlie Archer, Lead Consultant
16:25 Case Study 3: IT delivery model Rikkya Okker, Head of Cost Transformation
Tim Lancaster, Lead Consultant
16:40 Q&A
17:00 Drinks and nibbles
17:30 Close

Tony Chanmugam BT Group Finance Director

© British Telecommunications plc
Our purpose, goal, strategy and culture
Broaden and deepen our customer relationships
Fibre TV and content
Mobility and
future voice
UK business markets
Leading global
companies
Our strategy
A growing BT: to deliver sustainable profitable revenue growth
Invest for growth
Our goal
A healthy organisation
Deliver superior customer service
Transform our costs
Our purpose To use the power of communications to make a better world
Our culture
4

© British Telecommunications plc
Cost Transformation progress
1 opex is before specific items, depreciation & amortisation. Capex is before purchase of telecommunications licences. 2008/9 opex estimated for impact of historic Other Operating Income restatement
Capex Labour costs incl. contractors Consultancy Supplier renegotiation
Overhead Value Analysis Process re-engineering Right First Time BT-centric
Insourcing Output-based pricing Continuous Improvement
Quick wins Forensic Pan – BT
Still more than £1bn of gross
cost saving opportunities
5
5 year cost base1 reduction

© British Telecommunications plc
It’s needed to offset the headwinds in our business
6
Cost Transformation programmes
Natural attrition/retirement
Margin mix
Inflation
Improving revenue performance
Cost reduction Cost pressures

Shahzad Saleem Cost Transformation Managing Director

© British Telecommunications plc
8
Cost Transformation – team evolution
2005 BT Retail-centric cost transformation through forensic analysis by 10 internal consultants Initial phase: • Build the capability and the
toolsets • Overhead Value Analysis • Seven of original team
achieved BT senior positions including LoB chief finance officer, finance director, managing director & transformation director
2014 Pan-BT complete transformation system focused on cost and service improvement by 130 internal consultants Pan-BT top-down & bottom-up change: • Discovery and implementation of all E2E &
complex CT programmes • Continuous Improvement designed as the single
approach to bottom-up change in BT • Lean Six Sigma Academy • Capability assessment and development across
BT, leading to external certification designed to upskill all change people
• Sharing best practice with industry • 2-3 year assignments; projects ~3-6 months • Most successful team in BT at developing
leadership talent: • MBA • Six Sigma and Lean accreditation in-house • Behavioural Change
2011 Pan-BT in scope for proven cost transformation method by 30 internal consultants Pan-BT phase: • Launched E2E programmes • Activity in all LoBs of more
complex activities
2004 2006 2008 2010 2012 2014 2016

© British Telecommunications plc
Change hierarchy in BT
9
Cost Transformation team with involvement of the line
organisation
Line of Business transformation teams with involvement of the
line organisation
Line organisation supported by Continuous Improvement coaches
Teams at different levels of the organisation focus on change initiatives of
different scale and complexity
Multi-LoB end-to-end
transformation
Line of Business change initiatives
Operationally-led Continuous Improvement (CI)
Change initiatives driven at all levels of the organisation, depending on the
scale of change
Ownership Change initiatives
© British Telecommunications plc
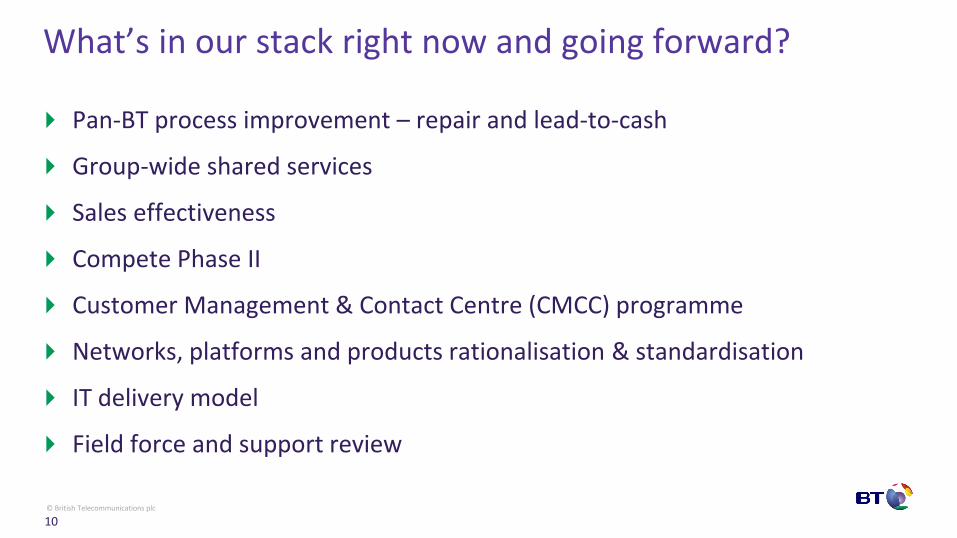
What’s in our stack right now and going forward?
Pan-BT process improvement – repair and lead-to-cash
Group-wide shared services
Sales effectiveness
Compete Phase II
Customer Management & Contact Centre (CMCC) programme
Networks, platforms and products rationalisation & standardisation
IT delivery model
Field force and support review
10

© British Telecommunications plc
Three case studies in cost transformation
11
Programme Compete Customer Management &
Contact Centre Programme IT delivery model
Arthur Yu
Cost Transformation Director
Becky Warburton
Head of Cost Transformation
Andy Wells
Cost Transformation Director
Charlie Archer
Lead Consultant
Rikkya Okker
Head of Cost Transformation
Tim Lancaster
Lead Consultant
Case Study 1 Case Study 2 Case Study 3

Programme Compete Arthur Yu
Becky Warburton

© British Telecommunications plc
Programme Objective:
Drive cost transformation outside UK by applying the tried-and-tested methods we've used elsewhere across the Group, focus on:
• Review regional operating model and size our operations based on financial returns and growth ambitions • Reduce cost of failure in our processes to improve operational efficiency and effectiveness • Optimise BT’s access and core network • Improve our third-party supplier value for money
Programme Compete – Transforming cost base outside UK
13
GS non-UK cost base = >£3.5bn (in 170 countries) (‘Compete’ reviews introduced in each country)
GS UK cost base = >£2.5bn (Various reviews on-going)

© British Telecommunications plc
Opportunities Description
Telco
Access & Voice Rationalise circuit inventory & cease unused circuits
Network transformation opportunities Migration & optimisation of network structure; satellite rationalisation
Revenue and Cost Assurance Reduce revenue leakage and stop unnecessary costs
Non-Telco
Supplier Rationalisation Review value for money from each supplier and consolidate tail vendors
Insourcing Identify third-party spend / services that can be insourced
Property & Facilities Management Property rationalisation, reduction in facilities management, energy cost review
Travel and Discretionary Spend Introduce standard global policy and tighten the control
TLR/TLC
Fair Reward Identify and reduce cases where remuneration is misaligned to performance / role complexity
Subcontractor resource review Minimise subcontracted services and insource where financially prudent
Shared Service Centre review Identify activities that could sit in a shared services environment in lower cost economies
Organisational structure reviews Right-size operations and optimise spans & layers to drive operational efficiency
Service Lines Review field services, network maintenance & other delivery costs
Our methodology – Forensic analysis with strong execution
14

© British Telecommunications plc
Problem Statement
• Our internal process failures sometimes lead to BT paying for third-party access circuits for longer than we need to
Example 1: Reduction in cease lead-times on leased lines
15
Results
• £21m of savings through reducing third-party access spend
• Improved customer service due to shorter customer cease lead-times and backlog reduction
Unnecessary cost due to mismatch between customer bill stop date and supplier cease date Validation Time
Income
90 day Customer Notice Period
Unnecessary costs
Cease Order Processing
90 day Supplier Notice Period
1
OLD process
1
Income
Validation Time Cease Order Processing
90 day Customer Notice Period
90 day Supplier Notice Period
NEW process
2
2 Pass the order to the cease factory to complete initial validation prior to issuing cease acceptance to the customer as this is when the “clock” begins for the 90 day Customer Notice Period
3 Customer and supplier notice periods align so there are no unrecovered cost days
Savings
3

© British Telecommunications plc
Problem Statement
• BT Global Services’ professional services people spend time on work that is not chargeable to the customer
• More people than necessary are doing back office roles which are non-chargeable
Results
• Chargeable time and gross margin by individual improved by 10% and 17% points respectively
• Non-chargeable headcount reduced by 62%
• Still further opportunities to go after in this space
Three key areas of focus Increase time spent on chargeable work
Improve gross margin per billable employee
Reduce number of employees on non-billable work
1
3
2
1
2
3
Example 2: Utilising professional services resources
16

© British Telecommunications plc
Problem Statement
• Complex organisational structure in Switzerland, Central and Eastern Europe leading to high cost and slow reaction to customer issues
Example 3: Rationalise operating model in Europe
17
Results
• £5m annualised TLC savings achieved to date
• Sales and customer service also improved because of quicker decision making and removing cost of failure
• We have proposed and are currently implementing similar consolidation in Asia and LatAm

© British Telecommunications plc
50%
21%
29%
Telco Non-Telco TLC/TLR
Financial outcomes
Benefits delivered so far = £180m
Identified opportunities to be delivered = c.£120m (c.£300m benefit in total once existing initiatives are fully implemented)
Further opportunities of c.£100m to be unlocked from Compete
Breakdown of benefits delivered to date from Compete (£180m)
Next steps
Strong execution to ensure successful completion
Driving further process standardisation across countries
Benchmarking and sharing best practice
A competitive cost base to support profitable growth outside of UK
Some best practice outside of the UK is applicable back in the UK, unlocking the next phase of savings
Achievement to date and next steps
18

CMCC Programme Andy Wells
Charlie Archer

© British Telecommunications plc
Customer Management & Contact Centre Programme BT’s Contact Centres
Major area of cost, >£1bn p.a.
Multiple programmes had been run around the same space; independent, LoB-focused... not strategic
Frequently a customer experience that does not meet expectations
Variable performance – no consistent efficiency or effectiveness across BT
20

© British Telecommunications plc
21
BT has Contact Centre operations in all LoBs… over 30k people including outsourced suppliers
Other CPs
End users
Openreach
TSO
Consumer Business GS Billing
Wholesale

© British Telecommunications plc
Our programme aims…
22
Customer
People
Sourcing & location
Structure & Organisation
Commercial

© British Telecommunications plc
Front-line efficiency & effectiveness – Focus areas
• Address the causes of avoidable contact and promote the use of self-serve channels where possible
Volume reduction
• Improve ‘one contact resolution’, reducing the number of transfers and repeat calls
Effectiveness
• Reduce the duration of each call / processing time without negatively impacting effectiveness and customer experience
Productivity
• Maximise available capacity by better managing the time when our people are taken away from their front-line activities
Utilisation
23

© British Telecommunications plc
Example 1: Transfers in Consumer
24
Problem Statement
• 19% of all calls in Consumer (75k calls per week) were transferred from one agent to another… each transfer increases the cost to serve and harms our customers’ experience
Results
We have identified enablers to cut transfers by more than half to 8%:
• rationalisation of teams (operating model review)
• IVR2 / call routing improvements
• multi-skilling and improved tools
• agent training and cultural change
1 ‘retention’ 2 Interactive Voice Response
1
© British Telecommunications plc
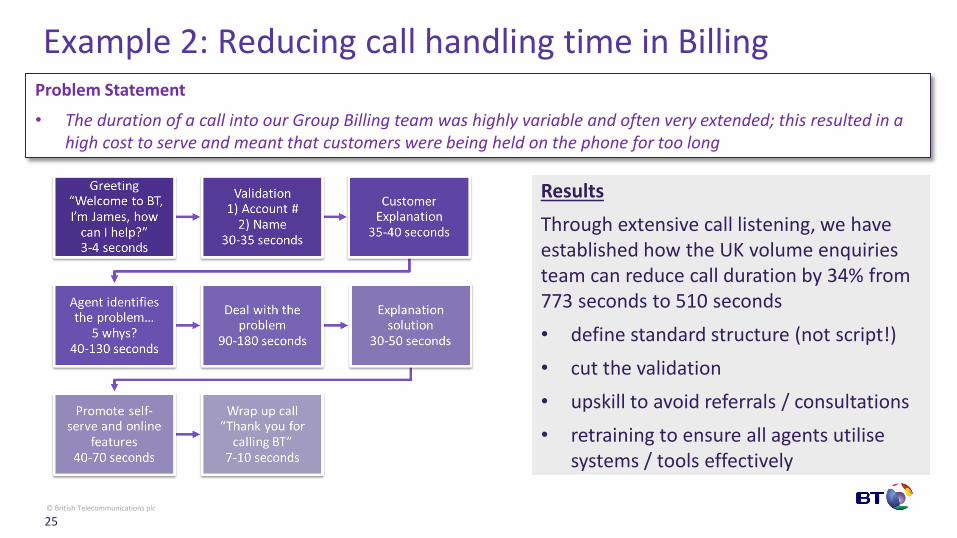
Example 2: Reducing call handling time in Billing
25
Problem Statement
• The duration of a call into our Group Billing team was highly variable and often very extended; this resulted in a high cost to serve and meant that customers were being held on the phone for too long
Results
Through extensive call listening, we have established how the UK volume enquiries team can reduce call duration by 34% from 773 seconds to 510 seconds
• define standard structure (not script!)
• cut the validation
• upskill to avoid referrals / consultations
• retraining to ensure all agents utilise systems / tools effectively

© British Telecommunications plc
Example 3: Pan-BT ‘shrinkage’ standards
26
Problem Statement
• Typically 30-40% of all paid hours are not available for productive ‘front-line’ work; there was significant variation across the Group and no standard against which teams could be measured
Benchmark: 29.5% shrinkage
Results
• We benchmarked all CMCC teams against standard ‘shrinkage’ categories and built a model describing the ideal amount of shrinkage – 29.5% for ‘Business As Usual’
• Mechanisms put in place to enable teams to get better visibility of shrinkage so that it can be better managed
• Model now adapted for non-CMCC teams
Paid hours
Leave (annual + other)
Sick (short + long-term)
Breaks
Training
Coaching + performance mgt
Internal meetings
Other
Available hours

© British Telecommunications plc
Other workstreams
27
Problem
Statement
Solution
Mgt and support
No standardisation; a wide range of management spans
No shared learning / best practice in support functions
Internal and external benchmarking to establish best in class
Forensic analysis to quantify and drive standardisation
Building Group-wide shared services
UK site strategy
Disparate workforce across many sites, ranging from large modern centres to smaller clusters in local exchanges
Optimise site size, bringing together teams to enable better management
Simplify estate and provide a better working environment
Right-shoring
No coordinated Group strategy
Variable quality and cost from suppliers
Establish Group-wide principles that govern the most appropriate location and sourcing model for all activities
Implementation plan in place and transition underway
Pay and grading
Pay and conditions not aligned to market rates
Market-aligned pay and conditions negotiated with the unions
All new joiners for CMCC activities brought in on the new contracts

© British Telecommunications plc
Conclusion
Our programme has started to transform the cost and quality of BT’s Contact Centres
Benefits generated from the programme will result in
– Significantly better customer service
• 250,000 more calls answered on-shore in Q1
• improvements in repeats and transfers in all Lines of Business
• enhanced self-serve capability
• more multi-skilled agents
– Large financial benefits (over £150m p.a. identified to date) … but there is a lot more to be done (similar opportunity again)
28
IT delivery model Rikkya Okker
Tim Lancaster

© British Telecommunications plc
IT delivery model – Strategic sourcing We forensically reviewed the cost of failure across the entire IT lifecycle (IT cost base >£0.5bn)
Design Development Test Requirement
definition Support
Process for delivering new internal IT systems
Quality issues
Churn of designers
Quality issues
Code quality
Wasted effort Rework Defects Incidents
Causes of cost of failure
Effects of cost of failure
30
Findings
• Issues in front-end of process cause cost of failure in back-end of process • Majority of cost sits in the back-end, >80% of cost incurred post design phase • We need to improve quality of early phases to reduce overall cost • We need to optimise the later phases for cost efficiency

© British Telecommunications plc
IT delivery model – Strategic sourcing We analysed cost of failure to determine which services are best done on-shore vs. off-shore, and in-house vs. out-source
Design Development Test Requirement
definition Support
31
Consolidated vendors, >£50M annualised savings
Insourced 850 roles across India & Malaysia 1:1.5 replacement ratio
Off-shore
Quality a high priority Development • Non business facing • Strategic • Complex
Insourced 850 roles across India & Malaysia 3:2 replacement ratio
Ou
tso
urc
ed
Optimise as-is Test & support • Non business facing • Legacy • Low complexity
Consolidated vendors, >£50M annualised savings
In-source all UK based work Only c.250
contractual roles still in the UK
On-shore
In-h
ou
se Quality a high priority
Requirements & design • Business facing • High complexity
No change in resourcing levels
© British Telecommunications plc
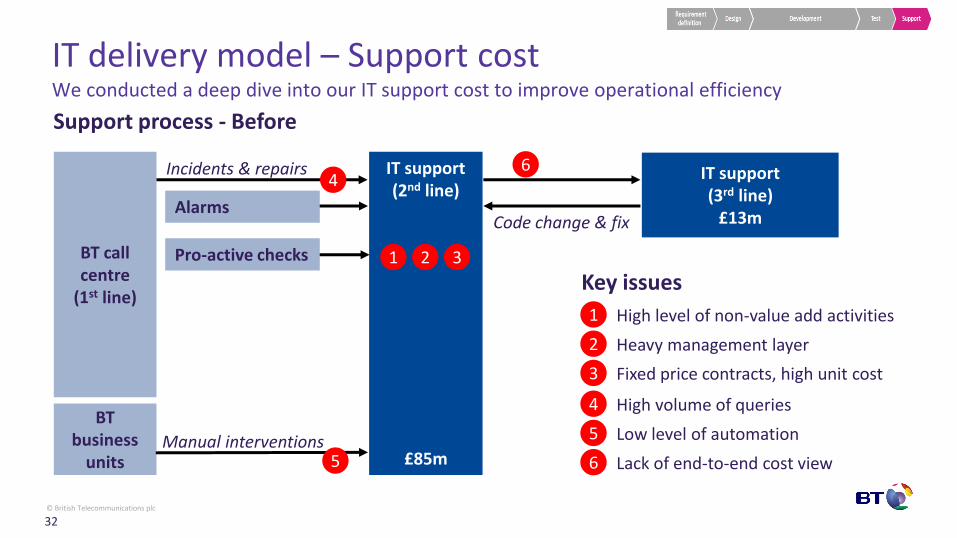
IT delivery model – Support cost We conducted a deep dive into our IT support cost to improve operational efficiency
Support process - Before
BT call centre
(1st line)
IT support (2nd line)
£85m
Alarms
BT business
units
Code change & fix
Incidents & repairs
Manual interventions
IT support (3rd line)
£13m
Pro-active checks
4 High volume of queries
5 Low level of automation
6 Lack of end-to-end cost view
Key issues
4
5
6
1 2 3
1 High level of non-value add activities
2 Heavy management layer
3 Fixed price contracts, high unit cost
32

© British Telecommunications plc
High level of non-value add activities
Incident fix
Code changes
Manualinterventions
Overhead &technical mgt
IT delivery model – Example 1: Reduce non-value add We used top-down techniques, but also rolled out Continuous Improvement to our vendors
1
Problem Statement
• >50% of effort in 2nd line IT support is overhead and technical management
33
Methodology
• Bottom-up (Continuous Improvement) tools combined with top-down tools
• Vendor contracts with agreements to share the cost savings above threshold
• Forensic process reviews and volume tracking
• Joint BT & vendor workshops to agree improvements

© British Telecommunications plc
High volume of queries
No Fault inc. HTB
Problem records
Reactive
Proactive
Queries (no actual fault)
IT delivery model – Example 2: Volume review We forensically combined various data sources to uncover root causes of high volumes
Problem Statement
• Nearly 20% of incoming incidents just a query, 10% have a known root cause in the code
34
4 Methodology
• Forensic review of multiple data sources
• Pan-BT engagement to address queries
• Detailed development review to fix root causes
© British Telecommunications plc
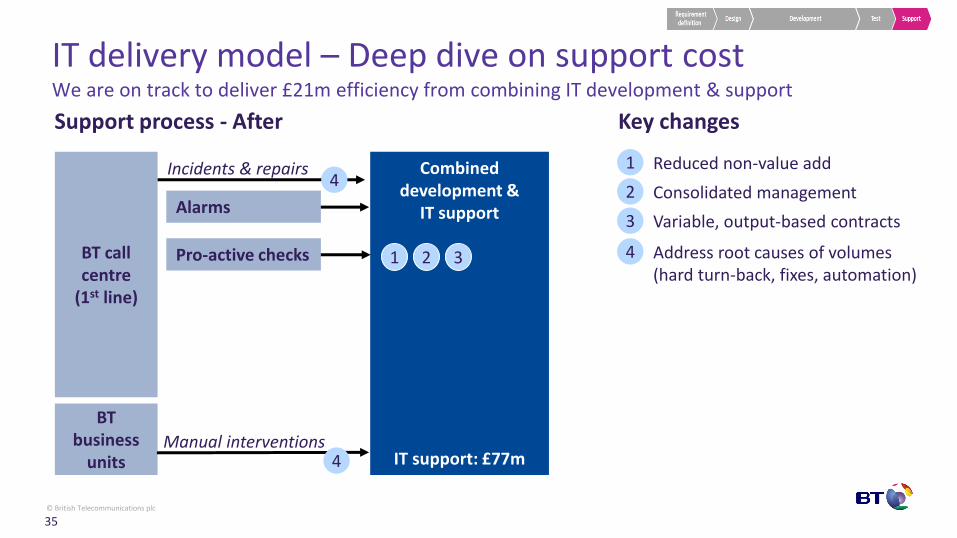
IT delivery model – Deep dive on support cost We are on track to deliver £21m efficiency from combining IT development & support
Support process - After
BT call centre
(1st line)
Combined development &
IT support
IT support: £77m
Alarms
BT business
units
Incidents & repairs
Manual interventions
Pro-active checks
4
4
1 2 3 4 Address root causes of volumes (hard turn-back, fixes, automation)
Key changes
1 Reduced non-value add
2 Consolidated management
3 Variable, output-based contracts
35
© British Telecommunications plc
Conclusion
We are optimising IT cost efficiency on an end-to-end basis
– we understand the cost drivers across the lifecycle
– forensic reviews, using cost transformation and Continuous Improvement
– delivered over £50m in benefits, while significantly reducing our incident and defect levels
We have more to go after
– expand our in-house IT capability in India and Malaysia
– contracts across development and support
– rationalise system estate
Potential to deliver a further 2x the benefits already delivered
36

© British Telecommunications plc
Summary
Cost transformation continues at pace
Plenty more opportunities identified
A key part of our strategy, supporting customer service and investing for growth
37

Questions please