budgeting in hotels: a contingency based study in northern
TRANSCRIPT
Budgeting in Hotels: A Contingency – Based Study in
Northern Cyprus
Dilem Ramadan
Submitted to the
Institute of Graduate Studies and Research
in partial fulfillment of the requirements for the Degree of
Master of Science
in
Tourism Management
Eastern Mediterranean University
August 2013
Gazimağusa, North Cyprus
Approval of the Institute of Graduate Studies and Research
Prof. Dr. Elvan Yılmaz
Director
I certify that this thesis satisfies the requirements as a thesis for the degree of Master of
Science in Tourism Management.
Prof. Dr. Mehmet Altınay
Dean, Faculty of Tourism
We certify that we have read this thesis and that in our opinion it is fully adequate in
scope and quality as a thesis for the degree of Master of Science in Tourism
Management.
Asst. Prof. Dr. Mine Haktanır
Supervisor
Examining Committee
1. Prof. Dr. Mehmet Altınay
2. Assoc. Prof. Dr. Hasan Kılıç
3. Asst. Prof. Dr. Mine Haktanır
iii
ABSTRACT
The aim of this study is to do an empirical research on budgeting in hotels regarding the
relationship between the contingent variables (structure, strategy, technology and
perceived environmental uncertainty) and budgeting practices and performance
measurement.
Management Control System is a valuable tool which is used by managers for decision
making. Budgets are seen as a management control system since they can provide a
basis for comparison between actual and budgeted results to rate their performance.
However, due to the fact that little has been investigated about budgeting in the service
industry, this paper aims to contribute to the existing literature by surveying the hotels in
Northern Cyprus through a contingency-based research.
In order to reach the aim of the study 124 self – administered (delivery and collection)
questionnaires were distributed to General Managers, Accounting/Finance Managers,
Human Resources Managers, Front Office Managers, F&B Managers, Housekeeping
Managers and Sales and Marketing Managers of 4- and 5 star hotels. Out of the 124
questionnaires 109 were received. The sample was selected by using the non-probability
judgmental sampling technique.
iv
This study has found that perceived environmental uncertainty, structure, strategy and
technology are all positively related with budgeting practices. However, budgeting
practices is negatively related with performance measurement. Moreover, the
implications, limitations and direction for future research are provided.
Keywords: Management Control Systems, Management Accounting, Budgeting,
Performance Measurement, North Cyprus

v
ÖZ
Bu araştırmanın amacı, deneysel bir araştırma uygulayarak otellerdeki koşullu
değişkenler (örgütsel yapı, strateji, teknoloji ve algılanan belirsizlik ortam) ile bütçeleme
uygulamaları ve performans ölçümü arasındaki ilişkiyi ölçmektir.
Yönetim bilişim sistemleri, müdürlerin karar verme sürecinde kullandığı çok etkili bir
araçtır. Bütçeler, performans ölçümü için fiili sonuçların ve bütçelenen sonuçların
karşılaştırılabilmesi için zemin oluşturduğundan dolayı bir yönetim bilişim sistem çeşidi
olarak görülmektedir. Ancak, hizmet sektöründeki bütçeleme ile ilgili çalışmalar az
olduğundan dolayı bu araştırma Kuzey Kıbrısdaki otelleri inceleyerek var olan literatüre
katkıda bulunmayı amaçlamaktadır.
Bu amaca ulaşılabilmesi için 4 ve 5 yıldızlı otellerin Genel Müdürlerine ve departman
müdürlerine toplam 124 adet anket dağıtılmıştır. Dağıtılan 124 anketten 109 anket geri
alınmıştır. Olasılıksız yargısal örnekleme tekniğini kullanarak örneklem seçilmiştir.
Araştırmanın sonucuna göre algılanan belirsizlik ortamı, örgütsel yapı, strateji ve
teknoloji ile bütçeleme uygulamaları arasında olumlu bir ilişkinin olduğu saptanmıştır.
Ancsk, bütçeleme uygulamaları ile performans ölçümü arasında olumsuz bir ilişki
gözlemlenmiştir. Buna ek olarak yöneticiler için öneriler yapılmış, tezin sınırlılıkları
açıklanmış ve gelecekteki araştırmalar için öneriler sunulmuştur.

vi
Anahtar Kelimeler: Yönetim Bilişim Sistemleri, Yönetim muhasebesi, Bütçeleme,
Performans Ölçümü, Kuzey Kıbrıs
vii
ACKNOWLEDGMENTS
First of all I would like to thank my supervisor Asst. Prof. Dr. Mine Haktanir for her
continuous support, motivation and patience especially through my nervous breakdowns.
She was always besides me not just as a supervisor but as a friend as well.
Secondly, besides my advisor I would like to give a special thanks to the Faculty of
Tourism for giving me the chance to do my masters degree and providing top quality
education that will lead me all the way through to the next level hassle – free.
In addition my sincere gratitude goes to Georgiana and Mona for their continuous help
throughout this period.
Finally I am expressing my endless gratefulness and never ending love to my mum who
was always there whenever I needed her support. Without her I wouldn’t have been
where I am now.
Thank you all for being there for me.....

viii
TABLE OF CONTENTS
ABSTRACT..................................................................................................................... iii
ÖZ.......................................................................................................................................v
ACKNOWLEDGEMENT...............................................................................................vii
LIST OF TABLES............................................................................................................xi
LIST OF FIGURES..........................................................................................................xii
1 INTRODUCTION.........................................................................................................13
1.1 Background of Turkish Republic of Northern Cyprus………………………..13
1.2 Rationale of the study………………………………...………….……….........17
1.3 Research Objectives………………………………..….……...….……............19
1.4 Thesis Outline………………………………………..….…..…………..…......20
2 LITERATURE REVIEW……………………………………..………….......….......21
2.1 Importance of Management Control System (MCS)…………..………....……21
2.2 Budgeting…………………………………………………………......…….....27
2.2.1 Importance of Budgeting………………………………………..…..........27
2.2.2 Description……………………………………………………….……….28
2.2.3 Types of Budgets……………………………………………….…….......29
2.2.4 Zero – Based Budgeting……………………………………….……….…31
2.3 Budgeting and Performance Measurement……………………….…………….31
2.3.1 Balanced – Scorecard (BSC)………………………………….……...…..33
2.3.2 Performance Pyramid……………………………………………….........35
2.3.3 Results and Determinants Model…………………….……...……...........35
ix
3 RESEARCH HYPOTHESES……………………………………………..…….…...39
3.1 Introduction………………………………………………………………….….39
3.2 Perceived Environmental Uncertainty (PEU)……………………….…….……41
3.3 Technology………………………………………………………………...…...43
3.4 Strategy……………………………………………………………………...….45
3.5 Structure…………………………………………………………………...……47
3.6 Budgeting Practices and Performance …………………………………….…...49
4 RESEARCH METHODOLOGY……………………………………………....……51
4.1 Deductive vs. Inductive Approach………………………………….…….….…51
4.2 Types of Data…………………………………………………………….…......53
4.2.1 Primary versus Secondary Data………………………………….…….…53
4.2.2 Qualitative versus Quantitative Data…………………………………..…54
4.3 Methods of Data Collection…………………………………………...…...…...54
4.3.1 Case Study…………………………………………………………….…..55
4.3.2 Grounded Theory……………………………………………………..…..55
4.3.3 Ethnography……………………………………………………...…..…...56
4.3.4 Phenomenology…………………………………………………...……....56
4.3.5 Narrative…………………………………………………………………..56
4.4 Quantitative Research Method………………………………………….………58
4.4.1 Experiments………………………………………………………........…58
4.4.2 Surveys/Questionnaires…………………………………………...….......59
4.4.3 Reliability in Quantitative Research……………………………………...60
4.4.4 Validity in Quantitative Research………………………………………...61
x
4.5 Qualitative Research Method……………………………………….…………..61
4.5.1 Individual Interviews……………………………………………………...62
4.5.2 Focus Groups………………………………………………...…………... 62
4.5.3 Observation………………………………………………………………..63
4.6 Sampling………………………………………………………....……………...63
4.7 Probability Sampling Techniques…………………………..……...…………....64
4.8 Non – Probability Sampling Techniques………………………..…...………….66
4.9 Rationale for using Deductive Approach………………………….....…………69
4.10 Rationale for using Quantitative Method……………………….........……….69
4.11 Measurement and Analysis………………………………………...…….…...72
5 FINDINGS…………………………………………………………………………...73
5.1 Introduction ………………..………………………..…..…………………..….73
5.2 Demographic Profile of the Sample………………………..…………………...73
5.3 Measurement Results…………………………………………..………...…......74
6 RESULTS AND CONCLUSIONS…………….………………………………........85
6.1 Overview of the Study……………………………………………..…………...85
6.2 Discussion..……………………………………………………………….….....86
6.3 Managerial Implications…………………………………………………..........88
6.4 Limitations and Directions for Future Research……………………..…………89
REFERENCES…………………………………………………………………….……91
APPENDIX……………………………………………………………………………110
Appendix A: Sample of Questionnaire………………………………………...….111
xi
LIST OF TABLES
Table 1. Tourism and the T.R.N.C Economy...................................................................14
Table 2. Number of People Accommodated....................................................................15
Table 3. Occupancy Rate..................................................................................................16
Table 4. Occupancy Rate According to the Regions in May 2013..................................16
Table 5. Occupancy Rate According to the Establishments With and Without
a Casino..............................................................................................................17
Table 6. Harness Employees’ Creativity With the Four Levers of Control.....................26
Table 7. Major Differences Between Deductive and Inductive Approaches...................53
Table 8. Key Areas of Phenomenology............................................................................57
Table 9. Table of Questions’ Content..............................................................................71
Table 10. Respondents’ Profile........................................................................................76
Table 11. The Frequencies and Descriptive Statistics of the Variables...........................78
Table 12. Exploratory Factor Analysis, Results and Coefficient Alpha..........................81
Table 13. Mean, Standard Deviations, Correlations of Study Variables.........................83
xii
LIST OF FIGURES
Figure 1. Levers of Control..............................................................................................25
Figure 2. Budget Preparation Process..............................................................................30
Figure 3. Balanced – Scorecard........................................................................................34
Figure 4. Lynch and Cross’s (1991) Performance Pyramid.............................................36
Figure 5. Results and Determinants Model......................................................................37
Figure 6. Contingent Control Variables...........................................................................40
Figure 7. The Process of Deduction................................................................................52
Figure 8. Types of Questionnaires...................................................................................60
Figure 9. Sampling Techniques........................................................................................67
Figure 10. Research Model..............................................................................................84
13
Chapter 1
INTRODUCTION
1.1 Background of Turkish Republic of Northern Cyprus
Cyprus is the third largest island in the Mediterranean and is located on the north of
Egypt, south of Turkey, east of Greece, west of Lebanon and Syria and northwest of
Israel. Greek and Turkish Cypriots lived together and shared the same culture however
due to tensions and disagreements in 1974, the island divided into two segments
representing two different nationalities; The Republic of Cyprus (Greek Cypriots) and
The Turkish Republic of Northern Cyprus (TRNC) (Turkish Cypriots). Since then,
attempting to reach a solution resulted in failure however; both communities maintain
open borders between the two segments with no restrictions regarding the movement of
the two nations. The result of the population census which took place in 2011 revealed
that the TRNC has a population of 294,906.
Cypriot culture is seen as one of the richest cultures due to the importance of family life,
cuisine, traditions, festivals and gatherings. Family life is very important in Northern
Cyprus where they spend most if not all their time with family gatherings, barbeques,
weddings and picnics. It has a rich cuisine which consists of many dishes that has been
influenced by many cultures due to its history. However, each dish has a particular taste
and type of cooking which actually represents the Cypriot culture.
14
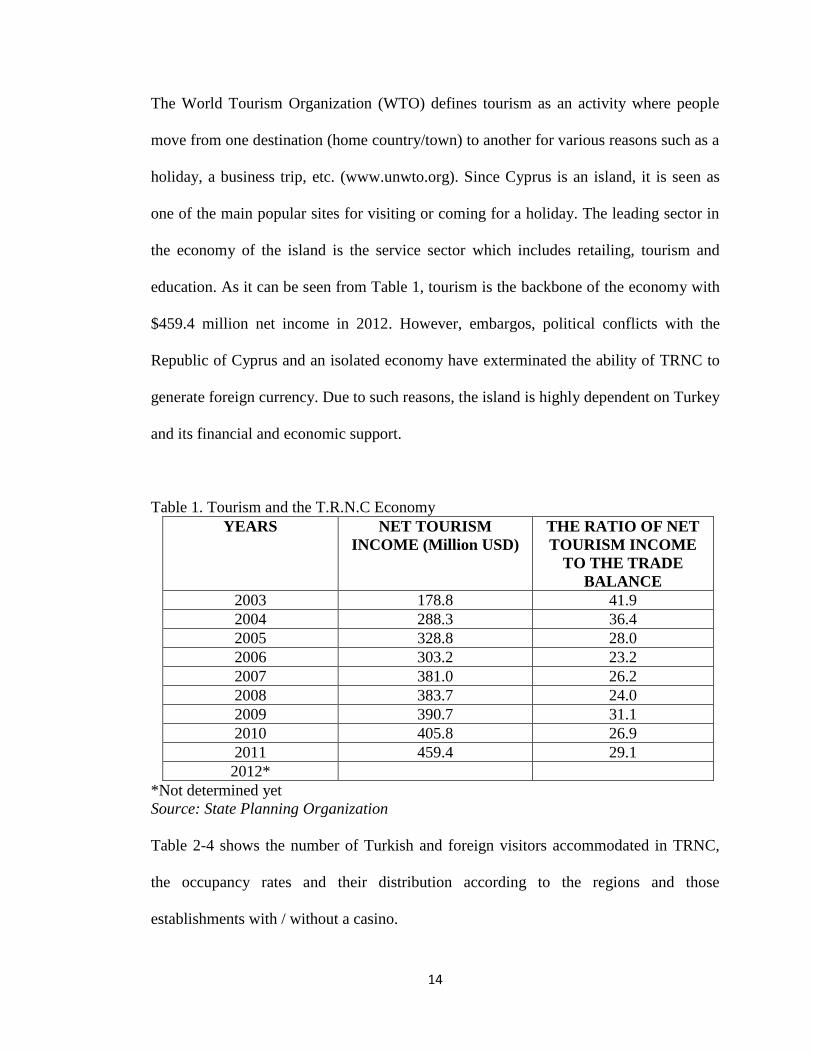
The World Tourism Organization (WTO) defines tourism as an activity where people
move from one destination (home country/town) to another for various reasons such as a
holiday, a business trip, etc. (www.unwto.org). Since Cyprus is an island, it is seen as
one of the main popular sites for visiting or coming for a holiday. The leading sector in
the economy of the island is the service sector which includes retailing, tourism and
education. As it can be seen from Table 1, tourism is the backbone of the economy with
$459.4 million net income in 2012. However, embargos, political conflicts with the
Republic of Cyprus and an isolated economy have exterminated the ability of TRNC to
generate foreign currency. Due to such reasons, the island is highly dependent on Turkey
and its financial and economic support.
Table 1. Tourism and the T.R.N.C Economy
YEARS NET TOURISM
INCOME (Million USD)
THE RATIO OF NET
TOURISM INCOME
TO THE TRADE
BALANCE
2003 178.8 41.9
2004 288.3 36.4
2005 328.8 28.0
2006 303.2 23.2
2007 381.0 26.2
2008 383.7 24.0
2009 390.7 31.1
2010 405.8 26.9
2011 459.4 29.1
2012*
*Not determined yet
Source: State Planning Organization
Table 2-4 shows the number of Turkish and foreign visitors accommodated in TRNC,
the occupancy rates and their distribution according to the regions and those
establishments with / without a casino.
15
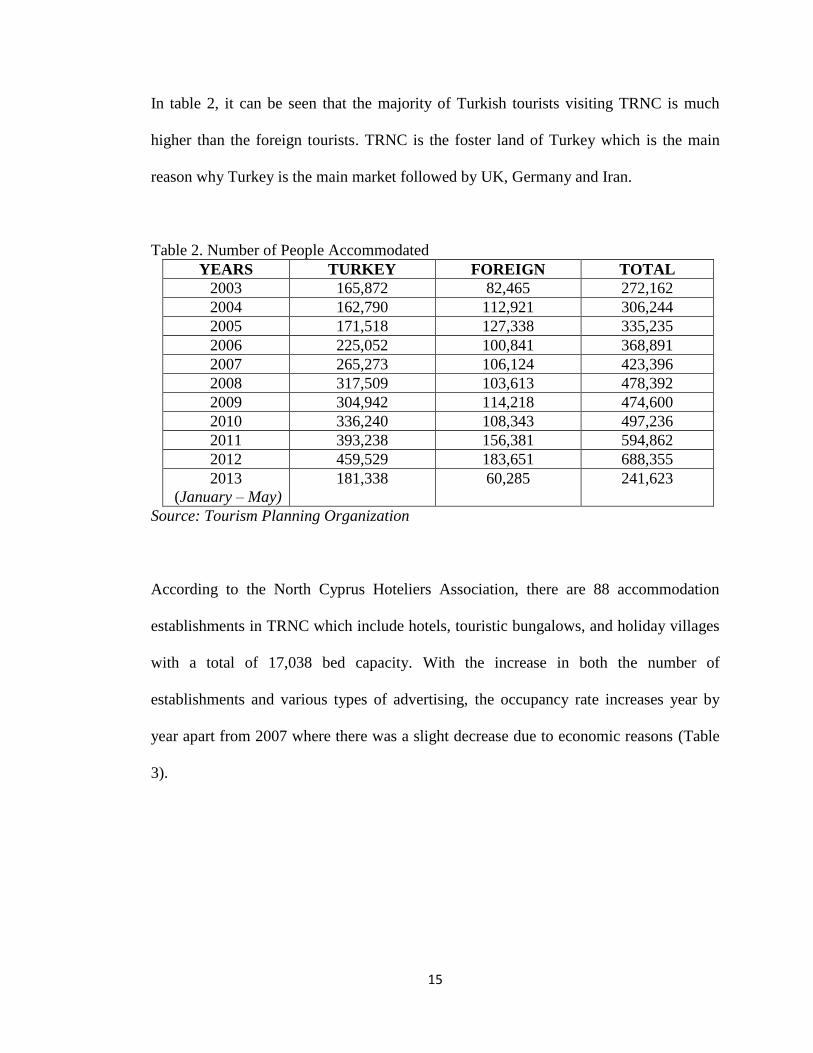
In table 2, it can be seen that the majority of Turkish tourists visiting TRNC is much
higher than the foreign tourists. TRNC is the foster land of Turkey which is the main
reason why Turkey is the main market followed by UK, Germany and Iran.
Table 2. Number of People Accommodated
YEARS TURKEY FOREIGN TOTAL
2003 165,872 82,465 272,162
2004 162,790 112,921 306,244
2005 171,518 127,338 335,235
2006 225,052 100,841 368,891
2007 265,273 106,124 423,396
2008 317,509 103,613 478,392
2009 304,942 114,218 474,600
2010 336,240 108,343 497,236
2011 393,238 156,381 594,862
2012 459,529 183,651 688,355
2013
(January – May)
181,338 60,285 241,623
Source: Tourism Planning Organization
According to the North Cyprus Hoteliers Association, there are 88 accommodation
establishments in TRNC which include hotels, touristic bungalows, and holiday villages
with a total of 17,038 bed capacity. With the increase in both the number of
establishments and various types of advertising, the occupancy rate increases year by
year apart from 2007 where there was a slight decrease due to economic reasons (Table
3).
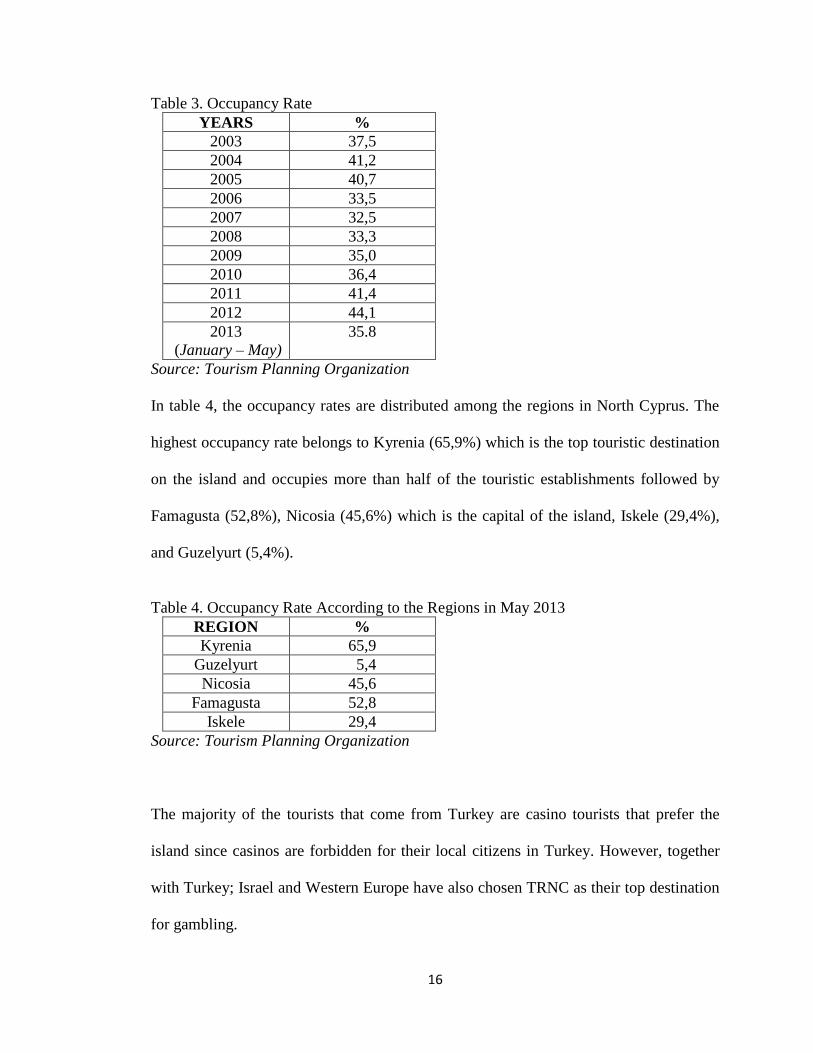
16
Table 3. Occupancy Rate
YEARS %
2003 37,5
2004 41,2
2005 40,7
2006 33,5
2007 32,5
2008 33,3
2009 35,0
2010 36,4
2011 41,4
2012 44,1
2013
(January – May)
35.8
Source: Tourism Planning Organization
In table 4, the occupancy rates are distributed among the regions in North Cyprus. The
highest occupancy rate belongs to Kyrenia (65,9%) which is the top touristic destination
on the island and occupies more than half of the touristic establishments followed by
Famagusta (52,8%), Nicosia (45,6%) which is the capital of the island, Iskele (29,4%),
and Guzelyurt (5,4%).
Table 4. Occupancy Rate According to the Regions in May 2013
REGION %
Kyrenia 65,9
Guzelyurt 5,4
Nicosia 45,6
Famagusta 52,8
Iskele 29,4
Source: Tourism Planning Organization
The majority of the tourists that come from Turkey are casino tourists that prefer the
island since casinos are forbidden for their local citizens in Turkey. However, together
with Turkey; Israel and Western Europe have also chosen TRNC as their top destination
for gambling.
17
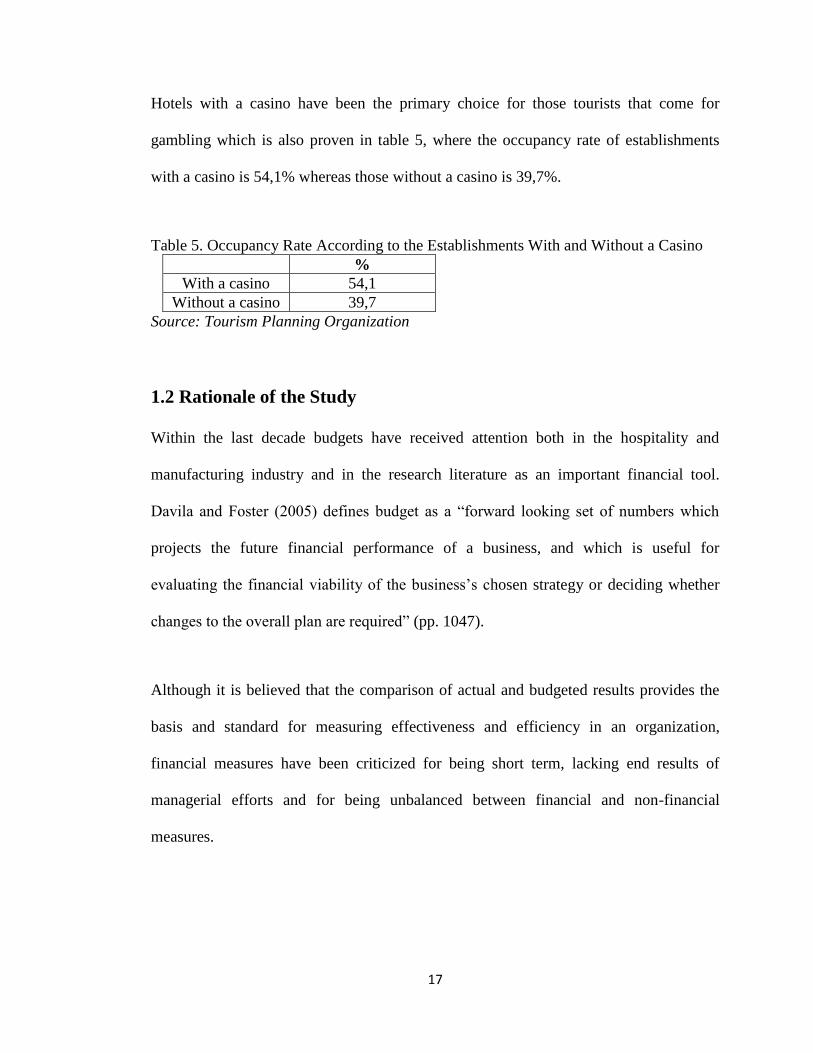
Hotels with a casino have been the primary choice for those tourists that come for
gambling which is also proven in table 5, where the occupancy rate of establishments
with a casino is 54,1% whereas those without a casino is 39,7%.
Table 5. Occupancy Rate According to the Establishments With and Without a Casino
%
With a casino 54,1
Without a casino 39,7
Source: Tourism Planning Organization
1.2 Rationale of the Study
Within the last decade budgets have received attention both in the hospitality and
manufacturing industry and in the research literature as an important financial tool.
Davila and Foster (2005) defines budget as a “forward looking set of numbers which
projects the future financial performance of a business, and which is useful for
evaluating the financial viability of the business’s chosen strategy or deciding whether
changes to the overall plan are required” (pp. 1047).
Although it is believed that the comparison of actual and budgeted results provides the
basis and standard for measuring effectiveness and efficiency in an organization,
financial measures have been criticized for being short term, lacking end results of
managerial efforts and for being unbalanced between financial and non-financial
measures.
18
As a result, new systems that place financial measures as one dimension of the decision-
making process and that incorporate financial measures with operational measures of
performance have emerged (Haktanir and Harris, 2005).
Over the years the competition in the hospitality industry has grown rapidly worldwide.
According to the statistics, international tourist arrivals grew by over 4% in 2011 to 980
million up from 939 million in 2010 (unwto.org). In the Turkish Republic of Northern
Cyprus (TRNC), the hospitality industry is the leading sector and is of great importance
to the economy in the island. However, many researchers pointed out that there is a lack
of research about budgeting especially in the hospitality industry.
Several studies were conducted in the manufacturing industry investigating the use and
implementation of budgeting. A survey done by Ahmad et al. (2003) in Malaysia proved
that the companies use budgets to a large extent, as part of their planning and control
mechanisms. Another survey done by Ghosh and Chan (1997) also indicated that the
budget usage in Singapore is 97% among the respondent companies. Similarly, some
studies have been conducted in the hospitality industry as well mainly focusing on the
hotels in the developed countries. Jones (1998, 2008a) conducted two surveys in the UK
in which budgets were viewed as the main performance indicators in the hospitality
industry. Another survey done by Pavlatos and Paggios (2009) analyzed the Greek
hotels and found that the majority used budgets for planning annual operations (98.8 per
cent), controlling cost (91,8 per cent), coordinating activities of the various parts of the
organization (80 per cent), and evaluating the performance of managers (64.7 per cent).
19
Therefore, due to the fact that little has been investigated about budgeting in the service
industry, this study aims to contribute to the existing literature by surveying the hotels in
Northern Cyprus through a contingency-based research.
The study will mainly focus on, the relationship between contextual factors identified
from contingency-based research, budgeting practices, and business performance within
the hospitality industry.
1.3 Research Objectives
In order to achieve the aim of the study for following research objectives were
undertaken;
The gap in the literature is identified
A review of the literature is carried out for budgeting practices and performance
measurement
The type of method for data collection is selected and the questionnaire is
prepared
The data is analyzed using SPSS 15.0 and the output of results are determined
Regarding the results found, implications for the sector and academicians is
provided
20
1.4 Thesis Outline
This thesis consists of six chapters. In Chapter 1, introduction, rationale of the study and
the research objectives were presented.
Chapter 2, presents the literature review about Management Control Systems (MCS),
Budgeting Practices (BP), and Performance Measurements (PM).
Chapter 3, consists of the research and model and hypothesis where each hypothesis is
explained and supported through previous studies findings.
Chapter 4, provides us with the methodology used in data collection for the study
followed by chapter 5 which consists of the findings of the study.
Lastly, Chapter 6 will present the discussion and conclusions of the study.
21
Chapter 2
LITERATURE REVIEW
2.1 Importance of Management Control System (MCS)
Management Control System (MCS) is an important tool to supply information to aid
managers’ decision making (Otley, 1999; Chenhall, 2003; Davila, 2005; Malmi and
Brown, 2008; Carenys, 2010). MCS has been defined as the entire method an
organization uses to make sure that the attitudes of the employees and their way of
thinking is in line with the companies aim (Malmi and Brown, 2008).
Management control is both old and new to management literature such that Anthony
(1965) saw it in between strategic planning and operational control. He stated that
strategic planning helps to measure and modify the organization according to the
changing environment by ensuring that the employees work towards achieving the long
term goals and objectives set by an organization as a whole whereas operational control
makes sure that the daily actions are in line with the goals and objectives set by the
organization and deals with short term events.
He saw management control as a course of action where it is ensured by the managers
that resources are consumed in an efficient and effective manner in order to achieve the
goals and aims of the company (Anthony, 1965).
22
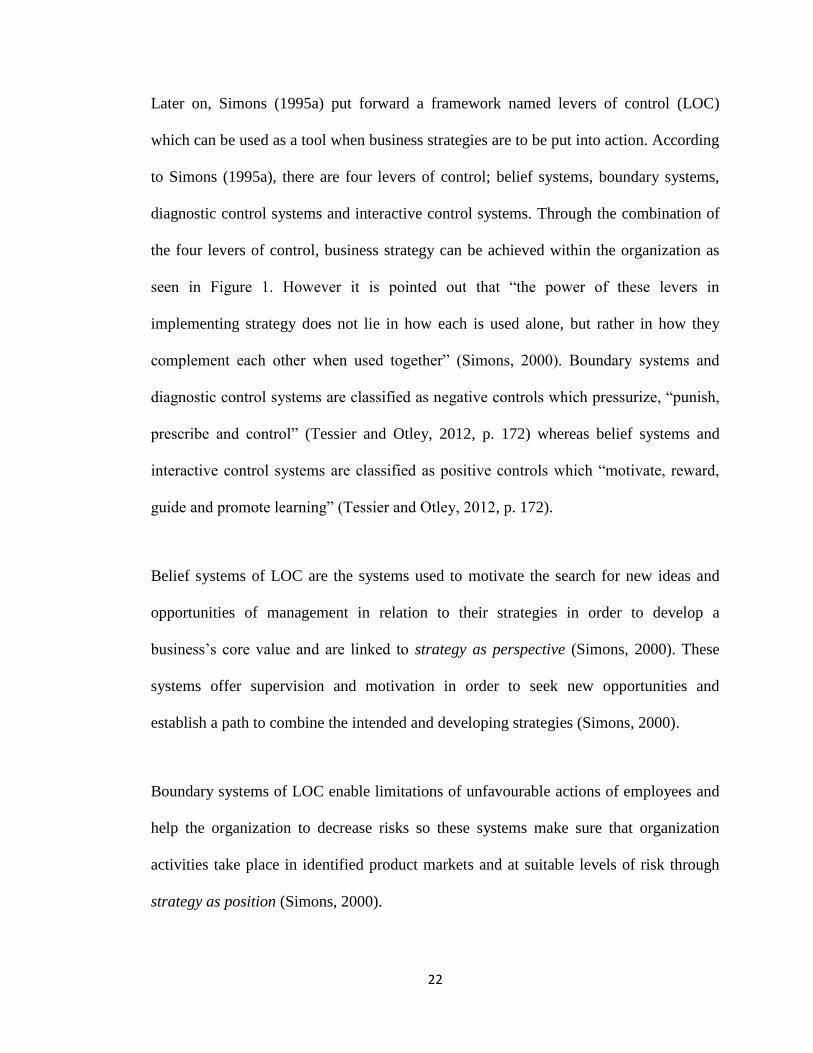
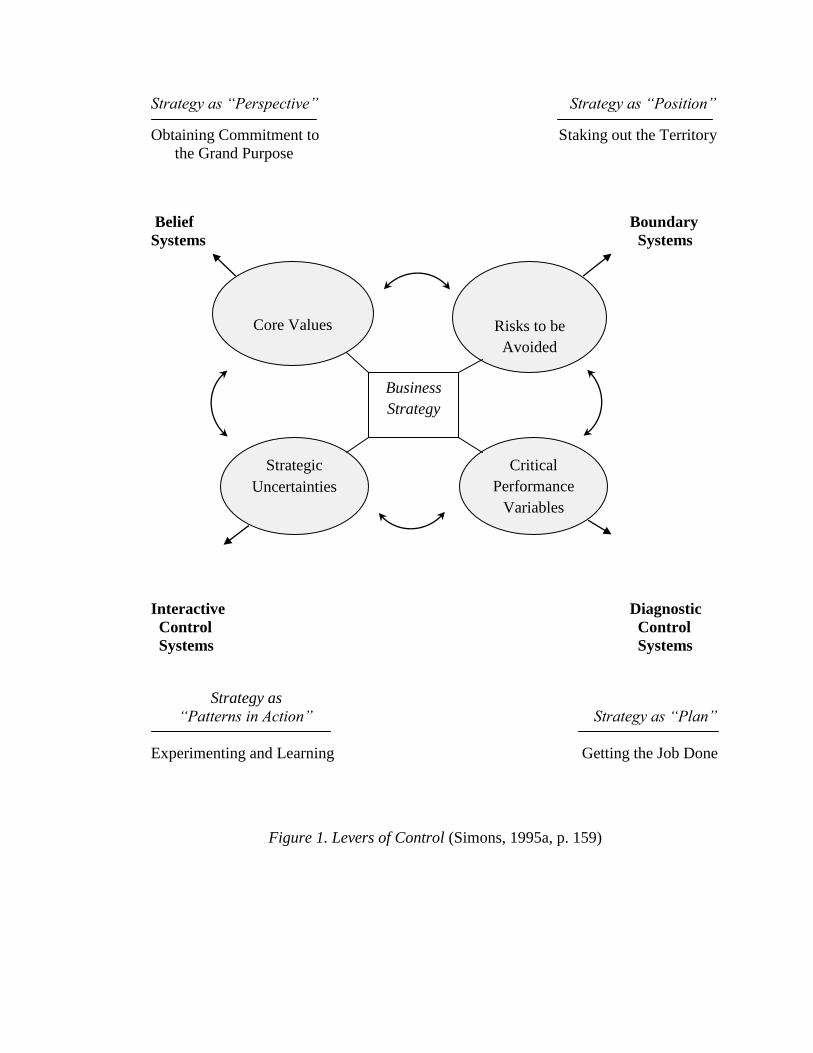
Later on, Simons (1995a) put forward a framework named levers of control (LOC)
which can be used as a tool when business strategies are to be put into action. According
to Simons (1995a), there are four levers of control; belief systems, boundary systems,
diagnostic control systems and interactive control systems. Through the combination of
the four levers of control, business strategy can be achieved within the organization as
seen in Figure 1. However it is pointed out that “the power of these levers in
implementing strategy does not lie in how each is used alone, but rather in how they
complement each other when used together” (Simons, 2000). Boundary systems and
diagnostic control systems are classified as negative controls which pressurize, “punish,
prescribe and control” (Tessier and Otley, 2012, p. 172) whereas belief systems and
interactive control systems are classified as positive controls which “motivate, reward,
guide and promote learning” (Tessier and Otley, 2012, p. 172).
Belief systems of LOC are the systems used to motivate the search for new ideas and
opportunities of management in relation to their strategies in order to develop a
business’s core value and are linked to strategy as perspective (Simons, 2000). These
systems offer supervision and motivation in order to seek new opportunities and
establish a path to combine the intended and developing strategies (Simons, 2000).
Boundary systems of LOC enable limitations of unfavourable actions of employees and
help the organization to decrease risks so these systems make sure that organization
activities take place in identified product markets and at suitable levels of risk through
strategy as position (Simons, 2000).
23
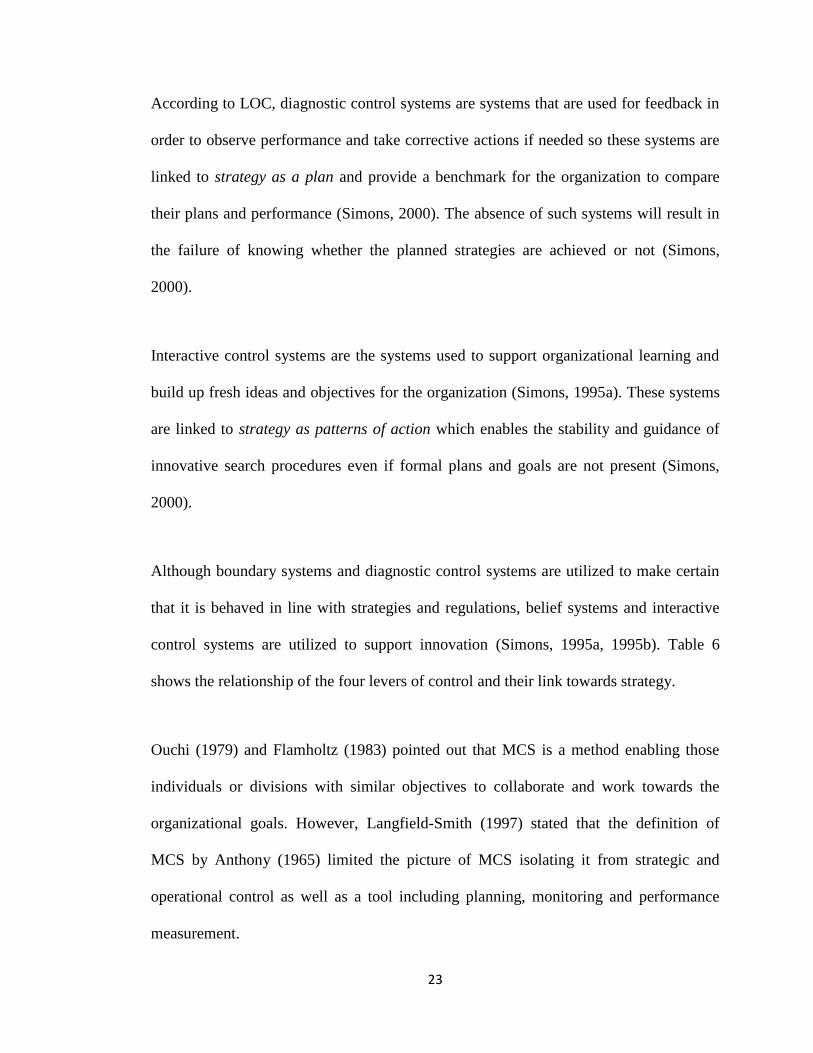
According to LOC, diagnostic control systems are systems that are used for feedback in
order to observe performance and take corrective actions if needed so these systems are
linked to strategy as a plan and provide a benchmark for the organization to compare
their plans and performance (Simons, 2000). The absence of such systems will result in
the failure of knowing whether the planned strategies are achieved or not (Simons,
2000).
Interactive control systems are the systems used to support organizational learning and
build up fresh ideas and objectives for the organization (Simons, 1995a). These systems
are linked to strategy as patterns of action which enables the stability and guidance of
innovative search procedures even if formal plans and goals are not present (Simons,
2000).
Although boundary systems and diagnostic control systems are utilized to make certain
that it is behaved in line with strategies and regulations, belief systems and interactive
control systems are utilized to support innovation (Simons, 1995a, 1995b). Table 6
shows the relationship of the four levers of control and their link towards strategy.
Ouchi (1979) and Flamholtz (1983) pointed out that MCS is a method enabling those
individuals or divisions with similar objectives to collaborate and work towards the
organizational goals. However, Langfield-Smith (1997) stated that the definition of
MCS by Anthony (1965) limited the picture of MCS isolating it from strategic and
operational control as well as a tool including planning, monitoring and performance
measurement.
24
Horngren (2004) affirmed that management accounting not only enables the
organization to make effective decisions but also allows the organization to concentrate
on how these management controls can be used for planning and control via
management accounting information.
Langfield-Smith (1997) indicated that the first study offering verification about MCS
and its relationship with competition was done by Khandwalla (1972). On the other
hand, the controls used by Khandwalla (1972) which include those such as inventory
control, costing (standard), budgeting (flexible) and Return on Investment (ROI) were
not considered to perform as a tool in organizations that focus on flexibility and
immediate response (Miles and Snow, 1978; Porter, 1980).
Despite all the debates in literature about MCS and its relationship with certain
variables, Horngren et al.,(2002) points out that the main purposes of MCS are;
To convey the goals and objectives of the organization in a visible way;
To confirm that both employees and managers know how to achieve the goals of
the organization and what is expected from them;
To convey the end results within the organization;
To confirm that managers are able to adjust to environmental changes.
25
Strategy as “Perspective” Strategy as “Position”
Obtaining Commitment to Staking out the Territory
the Grand Purpose
Belief Boundary
Systems Systems
Interactive Diagnostic
Control Control
Systems Systems
Strategy as
“Patterns in Action” Strategy as “Plan”
Experimenting and Learning Getting the Job Done
Figure 1. Levers of Control (Simons, 1995a, p. 159)
Strategic
Uncertainties
Core Values
Critical
Performance
Variables
Risks to be
Avoided
Business
Strategy
26
Table 6. Harness Employees’ Creativity with the Four Levers of Control
(Simons, 1995a, p.156)
Since the methods used in the past are not sufficient nowadays, managers must renew
their tools for management control as organizations develop and change (Horngren et
al., 2002). The later studies on control systems stated that they mainly concentrate on
information that includes financial and accounting data basically through budgets and
cost accounting (Carenys, 2010). The same study revealed that, the majority of control
systems, including budgets, management information systems and accounting and
financial systems compile information on specific aspects of the organization’s
performance to provide them to the organization members.
CONTROL
SYSTEM
PURPOSE
COMMUNICATES
CONTROL OF
STRATEGY AS
Belief Systems
Empower and
expand search
activity
Vision
Perspective
Boundary Systems
Provide limits of
freedom
Strategic domain
Competitive
position
Diagnostic Control
Systems
Coordinate and
monitor the
implementation
of intended
strategies
Plans and goals
Plan
Interactive Control
Systems
Stimulate and
guide emergent
strategies
Strategic uncertainties
Pattern of actions

27
According to contingency-based research, MCS is not a sole system that suits every
business (King et al., 2010; Malmi and Brown, 2008). It is believed that the fittingness
of a specific MCS depends on the characteristics of an organization such as its size,
structure, strategy, perceived environmental uncertainty, technology, and corporate
culture (King et al., 2010; Chenhall, 2003). A wide review of contingency research and
the variables are studied in the introduction section of chapter 3.
2.2 Budgeting
2.2.1 Importance of Budgeting
Budgets are regarded as one of the MCS since they can provide a benchmark to evaluate
performance and shape the actions and decisions of staff by translating an organization’s
objectives into strategies (King et al., 2010; Malmi and Brown 2008) and combine the
whole organizational activities into one logical abstract (Otley, 1999).
Within the last decade budgets have received attention both in the hospitality and
manufacturing industry and in the research literature as an important financial tool. King
et al., (2010) defines budget as figures that show the future and forecasts the financial
performance of a company showing whether the implemented strategy was the right
choice or whether changes are needed.

28
Although it is believed that the comparison of actual and budgeted results provides the
basis and standard for measuring effectiveness and efficiency in an organization,
financial measures have been criticized for being short term, lacking end results of
managerial efforts and for being unbalanced between financial and non-financial
measures (Brander Brown and Atkinson, 2001; Haktanir and Harris, 2005).
2.2.2. Description
Budgets are usually in the form of yearly short-term plans aiming to achieve the long-
term objectives (Adams, 1997). She pointed out that the purpose of budgets is to help
organizations to set future plans by determining the targets and objectives, to organize
and manage the activities within the departments, to pass on these objectives and plans
throughout the organization and to direct the performance of the organization. However
Jones (2006) has done a survey which compared the reasons for using budgets in three
sources; namely in the UK industry in 1997 and 2004 and in the textbooks.
In 1997, she found that budgets were firstly used to evaluate performance secondly to
aid control and thirdly to motivate managers. In 2004, the results had slightly changed
where budgets were firstly used to aid control secondly to evaluate performance and
thirdly to aid long-term planning. However, in the textbook analysis it was seen that
budgets were used firstly to aid both long-term and short-term planning, secondly to aid
control and thirdly to coordinate the operation.
29
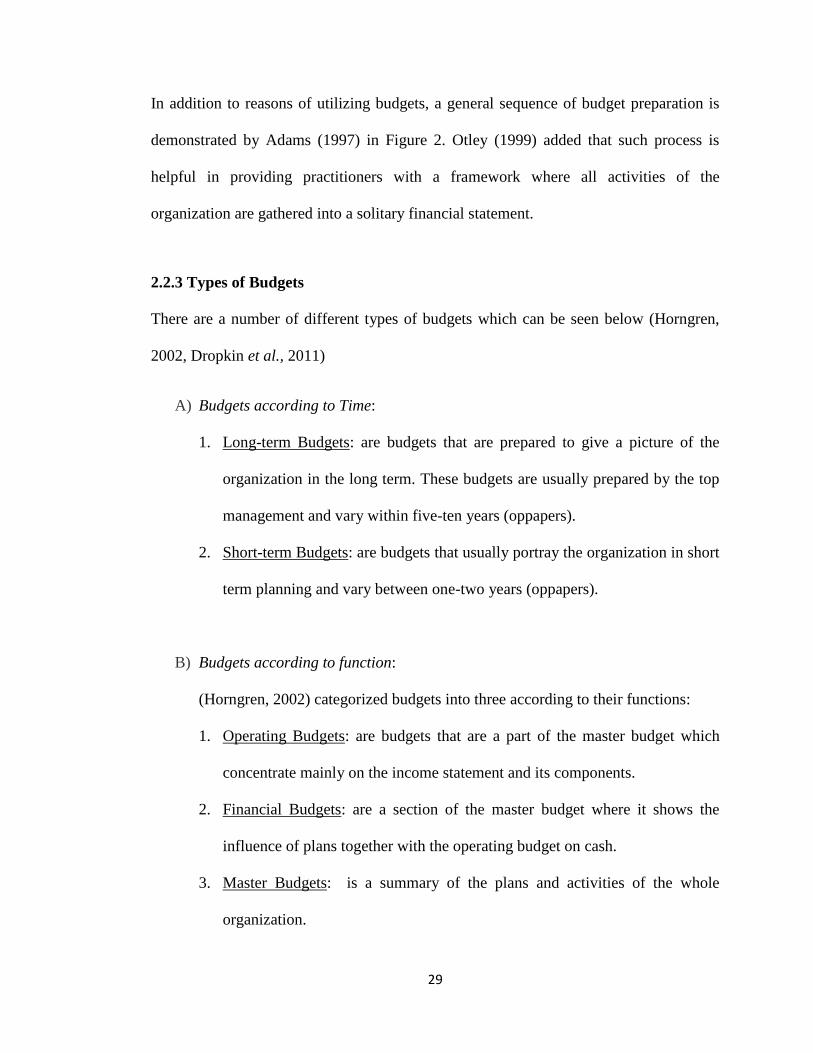
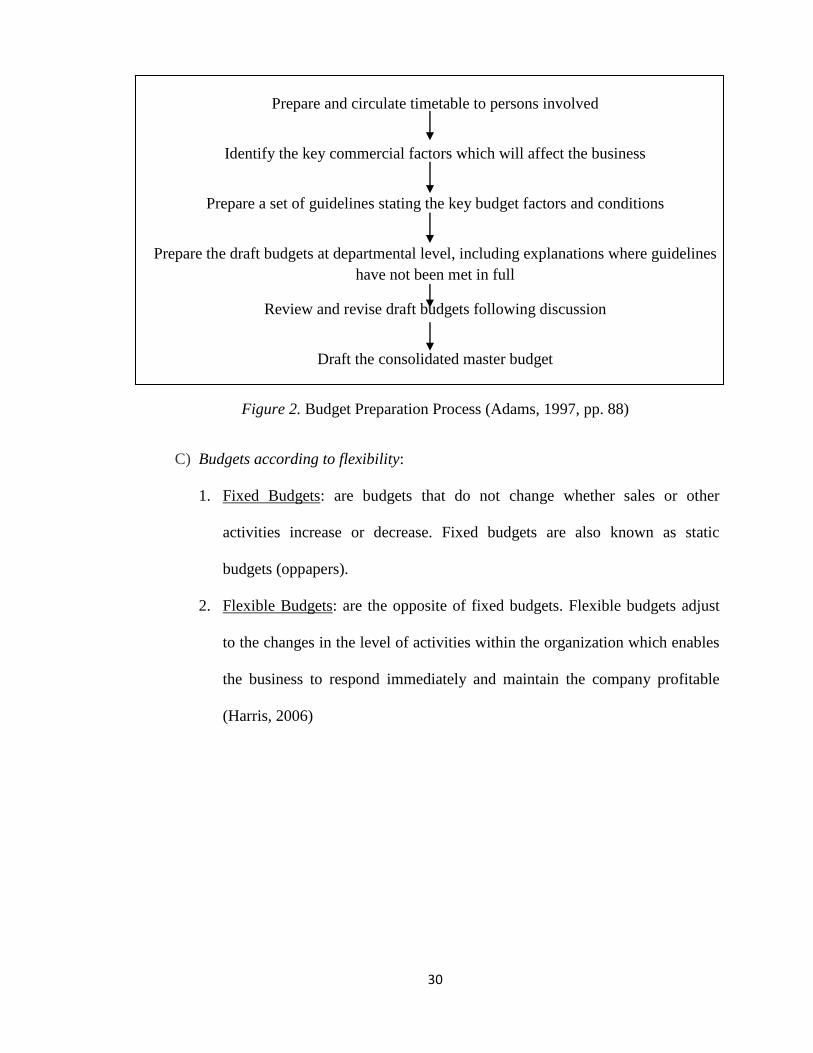
In addition to reasons of utilizing budgets, a general sequence of budget preparation is
demonstrated by Adams (1997) in Figure 2. Otley (1999) added that such process is
helpful in providing practitioners with a framework where all activities of the
organization are gathered into a solitary financial statement.
2.2.3 Types of Budgets
There are a number of different types of budgets which can be seen below (Horngren,
2002, Dropkin et al., 2011)
A) Budgets according to Time:
1. Long-term Budgets: are budgets that are prepared to give a picture of the
organization in the long term. These budgets are usually prepared by the top
management and vary within five-ten years (oppapers).
2. Short-term Budgets: are budgets that usually portray the organization in short
term planning and vary between one-two years (oppapers).
B) Budgets according to function:
(Horngren, 2002) categorized budgets into three according to their functions:
1. Operating Budgets: are budgets that are a part of the master budget which
concentrate mainly on the income statement and its components.
2. Financial Budgets: are a section of the master budget where it shows the
influence of plans together with the operating budget on cash.
3. Master Budgets: is a summary of the plans and activities of the whole
organization.
30
Prepare and circulate timetable to persons involved
Identify the key commercial factors which will affect the business
Prepare a set of guidelines stating the key budget factors and conditions
Prepare the draft budgets at departmental level, including explanations where guidelines
have not been met in full
Review and revise draft budgets following discussion
Draft the consolidated master budget
Figure 2. Budget Preparation Process (Adams, 1997, pp. 88)
C) Budgets according to flexibility:
1. Fixed Budgets: are budgets that do not change whether sales or other
activities increase or decrease. Fixed budgets are also known as static
budgets (oppapers).
2. Flexible Budgets: are the opposite of fixed budgets. Flexible budgets adjust
to the changes in the level of activities within the organization which enables
the business to respond immediately and maintain the company profitable
(Harris, 2006)
31
2.2.4 Zero-Based Budgeting
Zero-based budgeting (ZBB) is a type of budgeting system where budgets are re-
established each year without including previous year’s budget results (Linn, 2007;
Cottrell, 2012). Preparing such a budget allows the managers to see what is important
and what isn’t for each division to finance, since every division or unit within the
organization lists their activities according to their precedence (Linn, 2007). The
advantages of using ZBB is that it allocates the areas which should be financed in the
upcoming years by identifying unnecessary expenditures so that funds can be transferred
to those areas (Linn, 2007). Also due to the increase in global competition, it is believed
that to create the organization again through ZBB is considered a useful and insightful
attempt to adapt to the changing environment (Cottrell, 2012). However, ZBB is
considered to be time consuming since each item is required to be aligned which is why
most organizations don’t attempt to use this system nowadays (Linn, 2007).
2.3 Budgeting and Performance Measurement
One of the vital elements that are considered in decision-making is performance
measurement (Haktanir, 2006). Neely et al., (1995) defined performance measurement
as a procedure of measuring the actions that bring about performance. Another definition
was done by Philips (1999) where he defined performance as the success or results of a
unit. Furthermore, Kollberg et al., (2005) defined that performance measurement is a
procedure of the collection of processed measurable structures for the aim of enhancing
the performance of the organization through monitoring.
32
Haktanir (2006) stated that performance measures are commonly used for the
development of the plans through identification of those of poorly performance. Philips
(1999) pointed out that financial and non – financial measures were commonly used to
measure success. Emmanuel et al., (1990) put forward that financial measurements
which include profitability, ratios (earning per share, return on investment, and return on
shareholders’ funds) and accounting information provide a standard for comparison
which enables the company to compare its units with each other and evaluate their
performance.
DeFranco (2006) mentioned the importance of benchmarking is as follows;
Benchmarking is a beneficial process to any lodging operation. First, it measures
the operation’s performance and sets the bar or the standard. Then by making the
comparison, on an internal, competitive, or industry-wide basis, the lodging
operation will know where it is graded and what improvements are needed.
Then again, Haktanir (2006) indicated that even though the above mentioned measures
are of great importance, a combination of both financial and non-financial/operational
measures can provide a much better result of performance.
The study of Geller (1985) adopted in the US hotel industry presented the main
performance measures used which resulted in the majority being operational measures.
Another study alike that of Geller (1985) was adopted by Brander Brown et al., (1996)
in the UK hotel industry who found that companies take into consideration not just
financial measures but operational measures as well. A similar study was done by
Haktanir (2006) to find out the performance measures used in independent hotels in
33
North Cyprus. She found that the types of performance measurements depends on the
type of ownership and their involvement in the management of the operation together
with the sort of products or services offered by the organization.
Throughout literature, it is said that measures such as ratios, profitability, asset and
liability accounts and comparing actual and budgeted results are among the most
common measures used in performance measurement (Atkinson, 2006; Haktanir, 2006).
However, these measures have been censured for being short-term, lacking the provision
of past information relative to ongoing operations, reflecting results rather than
managerial efforts and for lacking the balance between the financial and operational
measures (Emmanuel et al., 1990; Lynch and Cross, 1995; Kaplan and Norton, 1992;
Kennerley and Neely, 2002; Davila and Foster, 2005; Haktanir, 2006; Atkinson; 2006).
Therefore, many frameworks have been developed in order to conquer such censures
such as the Balanced-Scorecard (BSC) by Kaplan and Norton (1992), the Performance
Pyramid by Lynch and Cross (1995), the Results and Determinants Model by Fitzgerald
et al., (1991) and the Performance Prism by Kennerley and Neely (2002). Kennerley and
Neely (2004) state that the main aim of such frameworks is to provide organizations
better measures to be able to measure their performance.
2.3.1 Balanced-Scorecard (BSC)
The balanced-scorecard has been seen as one of the most powerful frameworks for
performance measurement (Evans, 2004). Kaplan and Norton (1992) first introduced
this framework which consists of different perspectives in order to provide an in-depth
understanding of organizational performance.
34
Customer Perspective
To achieve our vision, how
should we appear to our
customers?
Learning and Growth Perspective
To achieve our vision, how will
we sustain our ability to change
and improve?
Financial Perspective
To succeed financially, how
should we appear to our
shareholders?
Internal Business Perspective
To satisfy our shareholders and
customers, what business
processes must we excel at?
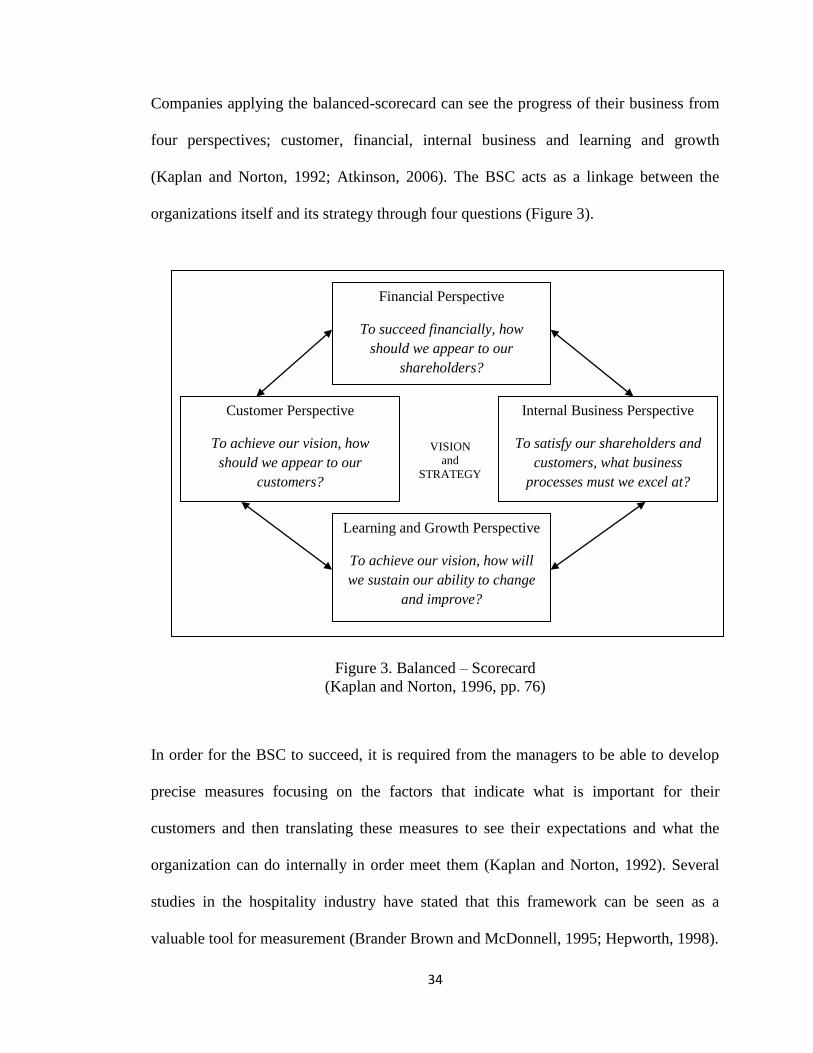
Companies applying the balanced-scorecard can see the progress of their business from
four perspectives; customer, financial, internal business and learning and growth
(Kaplan and Norton, 1992; Atkinson, 2006). The BSC acts as a linkage between the
organizations itself and its strategy through four questions (Figure 3).
Figure 3. Balanced – Scorecard
(Kaplan and Norton, 1996, pp. 76)
In order for the BSC to succeed, it is required from the managers to be able to develop
precise measures focusing on the factors that indicate what is important for their
customers and then translating these measures to see their expectations and what the
organization can do internally in order meet them (Kaplan and Norton, 1992). Several
studies in the hospitality industry have stated that this framework can be seen as a
valuable tool for measurement (Brander Brown and McDonnell, 1995; Hepworth, 1998).
VISION
and
STRATEGY
35
2.3.2 Performance Pyramid
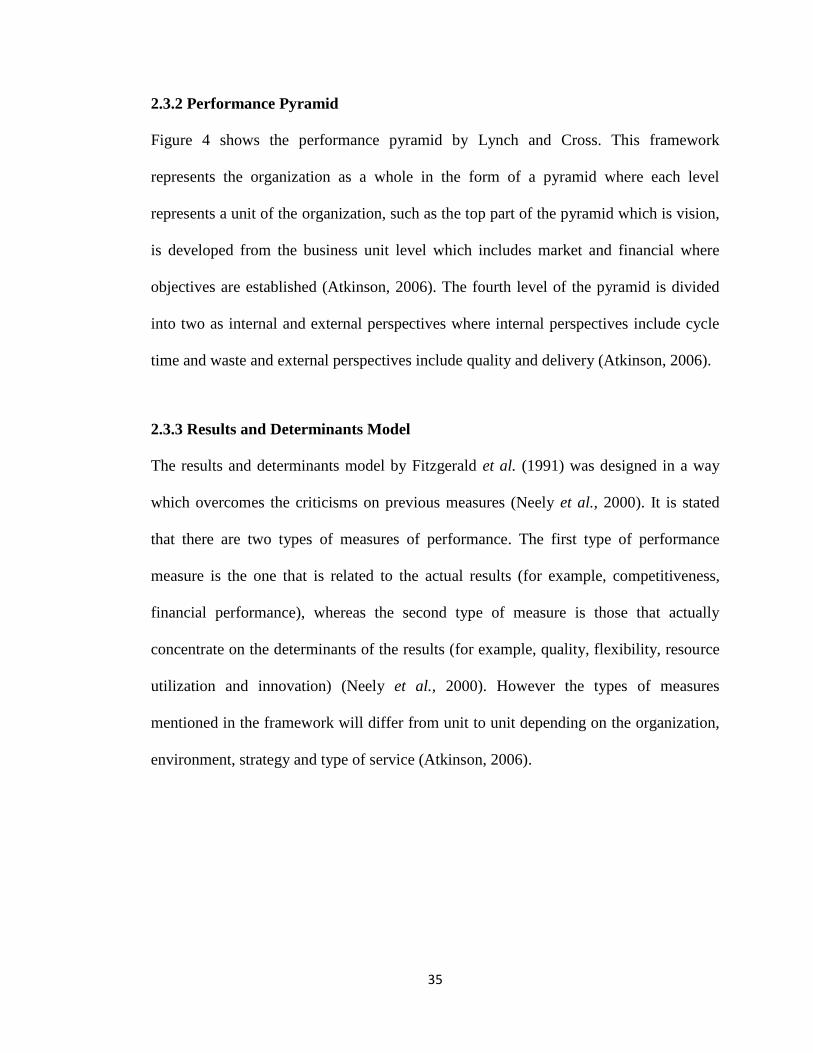
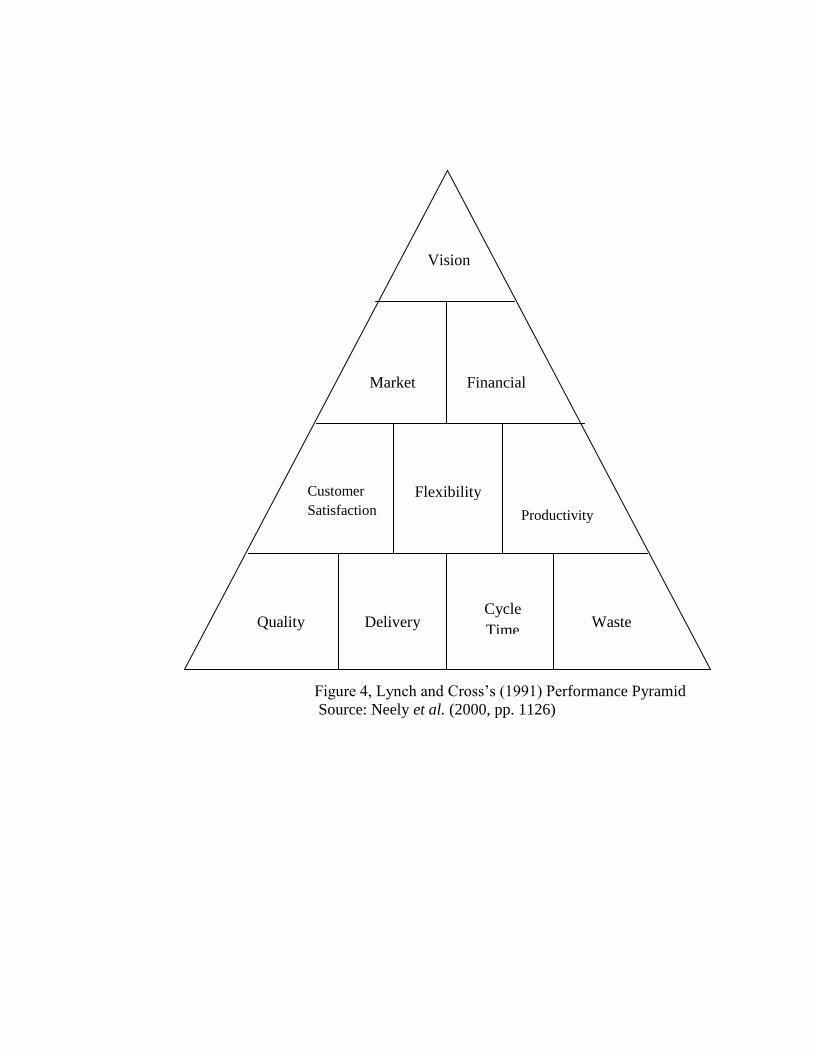
Figure 4 shows the performance pyramid by Lynch and Cross. This framework
represents the organization as a whole in the form of a pyramid where each level
represents a unit of the organization, such as the top part of the pyramid which is vision,
is developed from the business unit level which includes market and financial where
objectives are established (Atkinson, 2006). The fourth level of the pyramid is divided
into two as internal and external perspectives where internal perspectives include cycle
time and waste and external perspectives include quality and delivery (Atkinson, 2006).
2.3.3 Results and Determinants Model
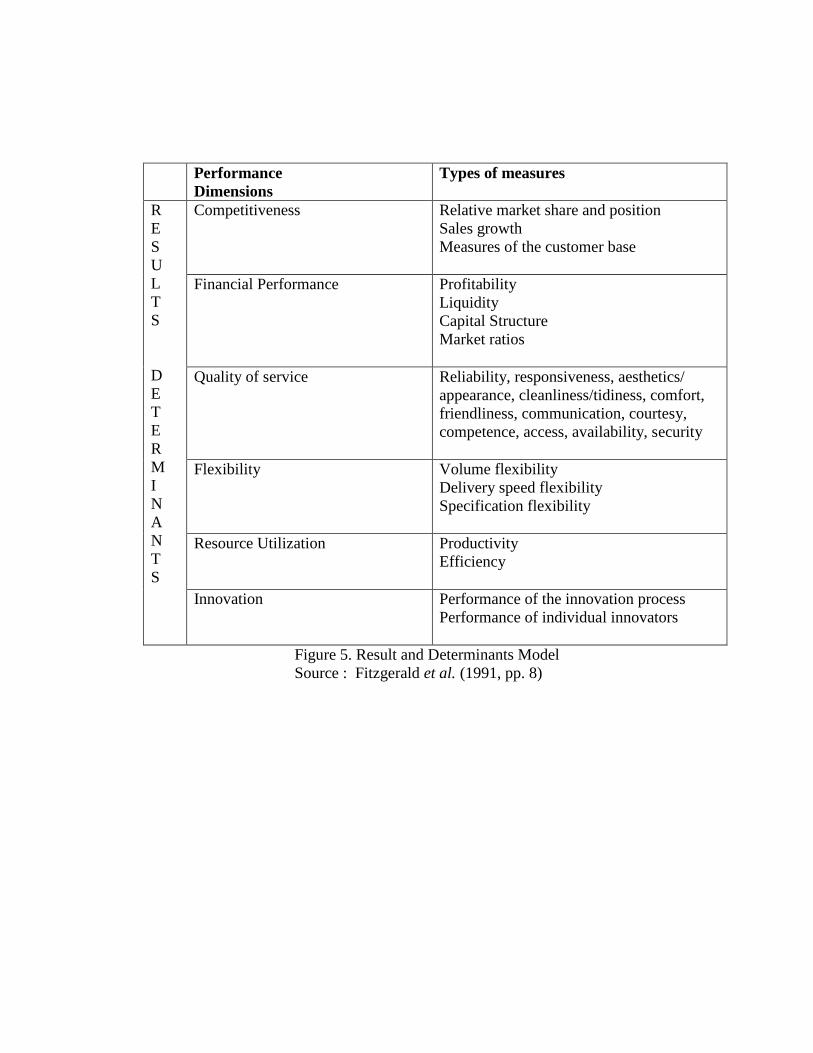
The results and determinants model by Fitzgerald et al. (1991) was designed in a way
which overcomes the criticisms on previous measures (Neely et al., 2000). It is stated
that there are two types of measures of performance. The first type of performance
measure is the one that is related to the actual results (for example, competitiveness,
financial performance), whereas the second type of measure is those that actually
concentrate on the determinants of the results (for example, quality, flexibility, resource
utilization and innovation) (Neely et al., 2000). However the types of measures
mentioned in the framework will differ from unit to unit depending on the organization,
environment, strategy and type of service (Atkinson, 2006).
36
Customer
Satisfaction
Figure 4, Lynch and Cross’s (1991) Performance Pyramid
Source: Neely et al. (2000, pp. 1126)
Quality Delivery Cycle
Time Waste
Flexibility
Productivity
Market Financial
Vision
26
Performance
Dimensions
Types of measures
R
E
S
U
L
T
S
D
E
T
E
R
M
I
N
A
N
T
S
Competitiveness Relative market share and position
Sales growth
Measures of the customer base
Financial Performance Profitability
Liquidity
Capital Structure
Market ratios
Quality of service Reliability, responsiveness, aesthetics/
appearance, cleanliness/tidiness, comfort,
friendliness, communication, courtesy,
competence, access, availability, security
Flexibility Volume flexibility
Delivery speed flexibility
Specification flexibility
Resource Utilization Productivity
Efficiency
Innovation Performance of the innovation process
Performance of individual innovators
Figure 5. Result and Determinants Model
Source : Fitzgerald et al. (1991, pp. 8)
38
After a broad review of the literature it can be said that the performance and success of
an organization highly depends on the type of MCS and performance measurement it
adopts. As it was mentioned in this chapter, according to the contingency theory there is
no single type of MCS that every organization can implement, however the critical point
in which the organizations have to consider is which type is suitable for his organization.
As I have defined before MCS is an effective tool that is used by managers to aid them
in decision making. Then again the suitable type depends on different situations and
different elements which were also given as a basis in the chapter. Therefore the
hypothesis carried out for this study and a detailed explanation of the contingent
variables are explained in the following chapter which is chapter 3.
39
Chapter 3
RESEARCH HYPOTHESES
3.1 Introduction
This chapter is about the contextual variables and their effect on budget use and business
performance, which is developed from a broad review of literature. According to
contingency theory, the structure and usage of control systems is dependent on the
background of the organization where these control systems manipulate (Fisher, 1998).
Accordingly, he states in his study that, the correlation of a control system and a
contextual variable can be theorized to intensify performance. In several studies it is
argued that organizational performance should be used as the dependent variable in
contingency research (Cadez and Guilding, 2008; Chenhall, 2003; Chenhall and
Langfield-Smith, 1998).
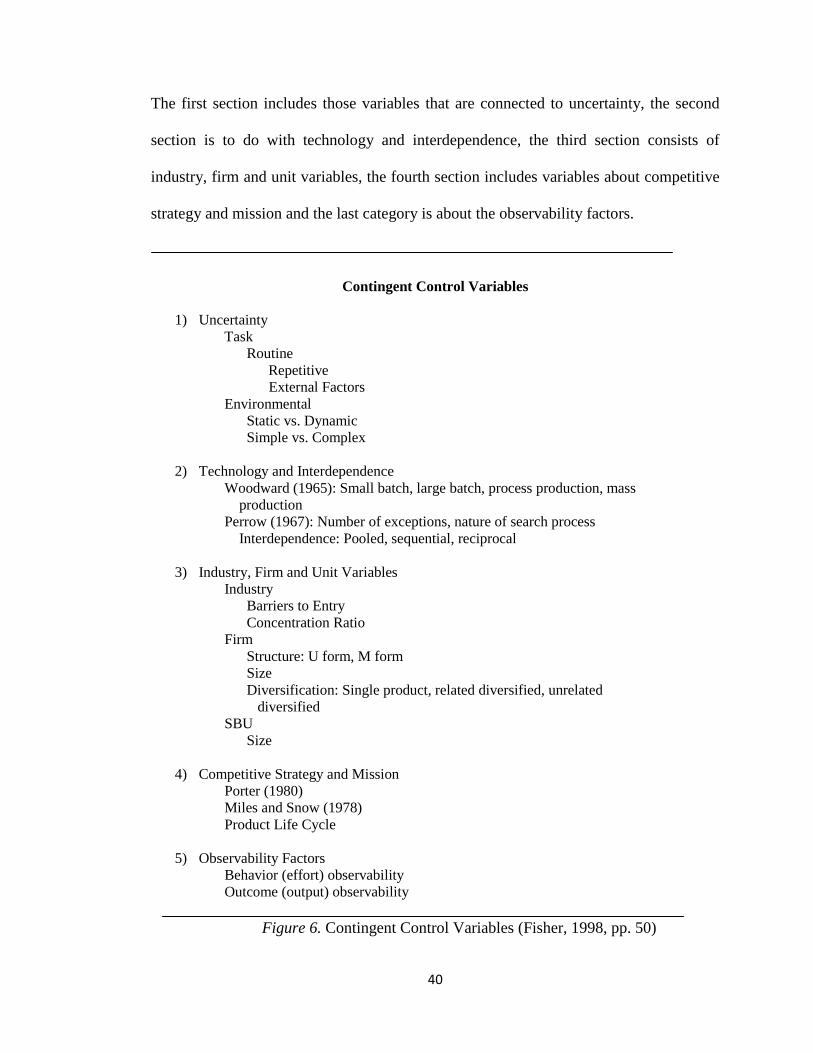
Fisher (1995) points out that evolving and testing an inclusive model that encompasses
several contingent factors and several components of accounting systems should be the
fundamental aim of contingent accounting research. Moreover, Fisher (1998) proposes
that a contingent variable is pertinent to the extent where companies that diverge on that
contingent variable also display differences in the way “control attributes” (pp.49) and
behaviors relate to performance. Figure 6 is taken from Fisher (1998) which shows the
well-known list of contingent variables used in previous studies.
40
The first section includes those variables that are connected to uncertainty, the second
section is to do with technology and interdependence, the third section consists of
industry, firm and unit variables, the fourth section includes variables about competitive
strategy and mission and the last category is about the observability factors.
Contingent Control Variables
1) Uncertainty
Task
Routine
Repetitive
External Factors
Environmental
Static vs. Dynamic
Simple vs. Complex
2) Technology and Interdependence
Woodward (1965): Small batch, large batch, process production, mass
production
Perrow (1967): Number of exceptions, nature of search process
Interdependence: Pooled, sequential, reciprocal
3) Industry, Firm and Unit Variables
Industry
Barriers to Entry
Concentration Ratio
Firm
Structure: U form, M form
Size
Diversification: Single product, related diversified, unrelated
diversified
SBU
Size
4) Competitive Strategy and Mission
Porter (1980)
Miles and Snow (1978)
Product Life Cycle
5) Observability Factors
Behavior (effort) observability
Outcome (output) observability
Figure 6. Contingent Control Variables (Fisher, 1998, pp. 50)

41
3.2 Perceived Environmental Uncertainty (PEU)
Managers in the hospitality industry confront a more unstable and complicated work
environment than those in the manufacturing industry due to the service industries
characteristics (Winata and Mia, 2005). Gordon and Narayanan (1984) interpreted from
several studies that decision maker’s initiate systems that help them manage with
uncertainty whenever it is perceived in the environment (Gordon and Milller, 1976;
Hayes, 1977; Ewusi – Mensah, 1981)
Chenhall (2003) defines PEU as the situation where environmental factors are seen as
uncertain by managers where uncertainty is differentiated from risk. He differentiates
these terms in the following way;
Risk is concerned with situations in which probabilities can be attached to
particular events occurring, whereas uncertainty defines situations in which
probabilities cannot be attached and even the elements of the environment may
not be predictable (pp. 137).
Another definition of PEU is from Sharma (2002) who states that PEU involves the
managers’ uncertainty of how the environmental factors will have an effect on or
influence their organization.
Ezzamel (1990) stated that the higher the environmental uncertainty the more the
involvement and interactions between managers and supervisors together with more
precedence on budgets especially for evaluation. Furthermore, Chapman (1998) put
forward that in terms of uncertainty, accounting can play as a planning tool only if there
is ongoing communication between departmental managers and accountants.
42
Throughout the literature different studies have taken different measures for PEU even
though they are examining the same environment (Gordon and Narayanan, 1984;
Chenhall and Morris, 1986; Tymond, Stout, and Shaw, 1998; Emmanuel et al., 1990;
Sharma, 2002; King et al., 2010). Gordon and Narayanan (1984) studied the link
between PEU and MCS using the measure uncertainty as the power of competition,
instability of environment and components of change.
Alternatively, Chenhall and Morris (1986) used uncertainty as a measure which took
into account the lack of information on the external environment, incapability to foresee
the probability of the environments effect on performance and whether the decision
taken was correct or not. However, Tymond, Stout, and Shaw (1998) provided a
recommendation that measures should include the perceptions of top management about
the external environment when examining uncertainty.
On the other hand, Emmanuel et al., (1990) pointed out that the features of the
environment which effect MCS are the extent of being predictable, the degree of the
competition within the market and the number of companies that deal with hostility to
some degree (for example, price, product, technological and distribution competition).
However, Sharma (2002) stated in her study that the most four common elements of
PEU are environmental turbulence, the ability to predict the future state of relevant
environmental factors, intensity of competition and environmental complexity.
43
Then again King et al., (2010) focused on two other elements of PEU; dynamism and
hostility. He stated that dynamism is “the dynamic nature of the environment” and
hostility is “the level of competition” (pp. 45). In his study of budgeting in healthcare
businesses, he found that there is an insignificant relationship between these two
elements of PEU and the extent of written budget use. Another study done by Bastian
and Muchlish (2012) in the manufacturing industry found that PEU has a positive
relationship between both organizational performance and strategy. Therefore, the
following hypothesis can be expressed as;
H1: PEU is related with budgeting practices.
3.3 Technology
Chenhall (2003) defines technology as the firm’s activities in how the tasks are
converted from inputs to outputs consisting of knowledge, hardware, data, people and
software. Winata and Mia (2005) argued in their study that the performance of managers
could be hastened by their involvement in budget planning and usage of information
technology.
After analyzing several studies, Winata and Mia (2005) stated the reason for such an
argument as computer systems maximize capacity and efficiency in both data handling
and channels of communication (Malone et al., 1987; Weill, 1992; Bryanjolfssan, 1993;
Johansen et al., 1995; Powel and Dent-Mitcallef, 1997).

44
Managers have the ability to evolve a network where they can access both internal and
external resources and fit out themselves with necessary information in order to set their
budgets correctly and accurately (Winata and Mia, 2005). In return, this will help
managers to contact with the environment, increase their performance and motivate
them in budget implementation. Kirk and Pine (1998 pp. 207) stated in their study that
there are four types of technology;
“Building Technology: The design and construction and maintenance of the
building to provide clients with the types of built environment”.
“Environmental Management Technology”: Controlling the demands for
resources within the internal environment.
“Food Production and Service Technology”: Supplying food and beverages to
customers through quality and cost control. This industry is also responsible in
providing healthy, safe and nutritious food in order to satisfy the needs of their
customers.
“Information Technology”: Using technology to communicate and process data
to increase the benefits offered to customers to the maximum level.
In addition to Kirk and Pine (1998) study, Tse (2003) and O’Conner and Murphy (2004)
stated another type of technology for the hospitality industry called disintermediation.
Disintermediation mainly focuses on the direct web bookings done by customers without
having to use travel agencies and how this affects the relationship between hotels and
travel agencies (O’Conner and Murphy, 2004).

45
O’Conner and Murphy (2004) state in their study that, the hospitality industry is
focusing more on the adoption of the web to sell its rooms directly to its customers.
Another study done by Garces et al., (2004) in the Aragonese hotel industry found that
they used the internet for advertising the services they offer and earn up to 5% of their
revenue through online sales. Alternatively, Buick (2003) done a similar study in
Scotland and found that small Scottish hotels use both the technology and the internet to
a high extent for marketing. Winata and Mia (2005) found in their study that managers’
performance in Australian hotels was significantly and positively associated with their
extent of IT use and budget participation.
Therefore, the following hypothesis can be expressed as;
H2: Technology is related with budgeting practices.
3.4 Strategy
It is foreseen by contingency theory that particular strategies are more appropriate for
particular types of MCS (Chenhall, 2003). Liao (2005) defines strategy as a combination
of promises and acts towards the development of core competencies and achievements
of obtaining a competitive advantage. Another definition is from Macintosh (1994) who
defines strategy as an aim that sets a plan intending to provide the required elements to
be able to compete in the marketplace and the type of structure that is needed for the
implementation of the plan.
As it can be seen from the definitions above, strategy is supposed to offer support both
internally and externally for the company to reach its organizational goals in harmony
(Herath, 2007).
46
Macintosh (1994) identified that the relationship between MCS and strategy is actually a
double way relationship where MCS has an impact on strategy but also is affected by
strategy.
There are many classifications of strategy throughout literature including defenders,
analyzers, prospectors and reactors (Miles and Snow, 1978), entrepreneurial,
conservative (Miller and Friesen, 1982), cost leadership and product differentiation
(Porter, 1980) and build, hold, harvest (Gupta and Govindarajan, 1984). Even though
there are many types of business strategies in the literature, this study is focusing on
Porter’s classification of strategies which are cost leadership and differentiation
strategies (Porter, 1980).
Chenhall and Morris (1995) stated that cost leadership strategies need budgets and
certain goals to ease the progress of cost control at the operational level. David (2011)
noted that there are two types of cost leadership strategies; low-cost strategy and best-
value strategy. He explains low-cost strategy as the selling of a product or service with
the lowest possible cost and best-value strategy as the selling of a product or service
with the best price-value in the sector. Firms that adopt either of these two strategies
must make sure that they attain their competitive advantage in a way that makes it
difficult for their rivals to copy (David, 2011).
47
To be able to manage cost leadership strategies effectively, companies must make
certain that the total costs of their company is lower than those of its rivals. On the other
hand, Simons, (1987) put forward that differentiation strategies are in need of a more
external and extensive MCS to be able to plan and gather the information needed of their
rivals. David (2011) stated that in order to apply the differentiation strategy you must
give something different compared to your competitors. Those who are successful in
applying this strategy will gain customer loyalty meaning that even if the company
increases its prices customers do not hesitate in buying the product or service (David,
2011). Chenhall (2003) proposed that cost leadership strategies are linked with the
customary and formal MCS that focus on cost control, operating goals, inflexible budget
controls and budgets. Therefore the following hypothesis can be expressed as;
H3: Strategy is related with budgeting practices.
3.5 Structure
Herath (2007) considered both structure and strategy as one component and stated that
structure depends on the strategic position of the company. She further explained that
strategy reveals the relationships and duties within the roles, and the authority delegated
for decision making ensuring a sole structure of an organization. Another definition is
from Chenhall (2003) who defines structure as the official requirements from the
employees in order to guarantee that the activities are accomplished in the organization.
Literature mainly focuses on the two components of structure; differentiation and
integration (Lawrence and Lorsch, 1967; Chenhall, 2003; King et al., 2010; Sharma,
2002).
48
Differentiation is referred to the extent in which managers are seen as “quasi-owners”
(King et al., 2010, pp. 44) gained through a decentralized authority whereas integration
refers to the extent in which managers behaviors are consistent with the organizations
goals (Chenhall, 2003). King et al., (2010) differentiates a decentralized structure from a
centralized structure in the following way. He states that in a centralized structured
business the decision making is only delegated to top level managers and owners only
whereas in a decentralized structured business decision making is delegated to the lower
level managers and the staff of the organization.
It is proven that more formal controls are seen in decentralized structured businesses
whereas centralized structured businesses call for less MCS since administrative controls
are at the minimum level and have a less difficult budget (Bruns and Waterhouse, 1975;
Merchant, 1981; King et al., 2010). Subramaniam et al (2002) states in their study that
managers could have authority in decision making for a variety of decisions such as
product development, hiring and pricing. He continues by explaining that the more a
company is decentralized the more the managers will be careful in decision making
which will result in an increase of both their responsibilities and their budget practices
since greater budget use will provide greater control of their targets and overall
performance. Therefore the following hypothesis can be expressed as;
H4: Structure is related with budgeting practices
49
3.6 Budgeting Practices and Performance
For the evaluation of the performance of managers, there has to be a yardstick in which
the measures of performance can be evaluated (Otley, 1978). There has been consistent
evidence about budgets being a tool used for evaluating overall performance of an
organization (Haktanir, 2006; Jones, 2008a) since it can shape the actions and decisions
of staff by translating an organization’s objectives into strategies (King et al., 2010;
Malmi and Brown, 2008) and combine the whole organizational activities into one
logical abstract (Otley, 1999) representing a criterion for both efficiency and
effectiveness (Otley, 1978).
Several studies state that budgeting is used for financial planning, allocation of resources
(financial) and to monitor the performance of the managers (Jones, 2008b; Oak and
Schmidgall, 2009). King et al., (2010) defines a budget as a “forward looking set of
numbers which projects the future financial performance of a business, and which is
useful for evaluating the financial viability of the business’s chosen strategy or deciding
whether changes to the overall plan are required” (pp. 41).
Several studies were conducted in the manufacturing industry investigating the use and
implementation of budgeting. A survey done by Ahmad et al. (2003) in Malaysia proved
that the companies use budgets to a large extent, as part of their planning and control
mechanisms. Another survey done by Ghosh and Chan (1997) also indicated that the
budget usage in Singapore is 97% among the respondent companies.
50
Similarly, some studies have been conducted in the hospitality industry as well mainly
focusing on the hotels in the developed countries. One of the first foremost studies
carried out in the hospitality industry was done by Kosturakis and Eyster (1979) taking
into account the food and service chains together with the hotel chains located in
America and their budgetary processes (Jones, 2006).
Afterwards this study was compared with those in Scandinavia by Schmidgall et.
al.,(1996). Jones (1998, 2008a) conducted two surveys in the UK in which budgets were
viewed as the main performance indicators in the hospitality industry. Yahya et al.,
(2008) found in their study that there is a significant positive relationship between
budgetary participation and performance.
Another survey done by Pavlatos and Paggios (2009) analyzed the Greek hotels and
found that the majority used budgets for planning annual operations (98.8 per cent),
controlling cost (91,8 per cent), coordinating activities of the various parts of the
organization (80 per cent), and evaluating the performance of managers (64.7 per cent).
Therefore the following hypotheses can be expressed as;
H5: Budgeting practices is related with performance measurement.
Up to now we have gone through the literature and the contingent variables for this
study. The following chapter will be explaining the methodologies in general and which
methodology is chosen for this study.
51
Chapter 4
RESEARCH METHODOLOGY
4.1 Deductive vs. Inductive Approach
When doing a research the first thing you must decide on is the type of approach you
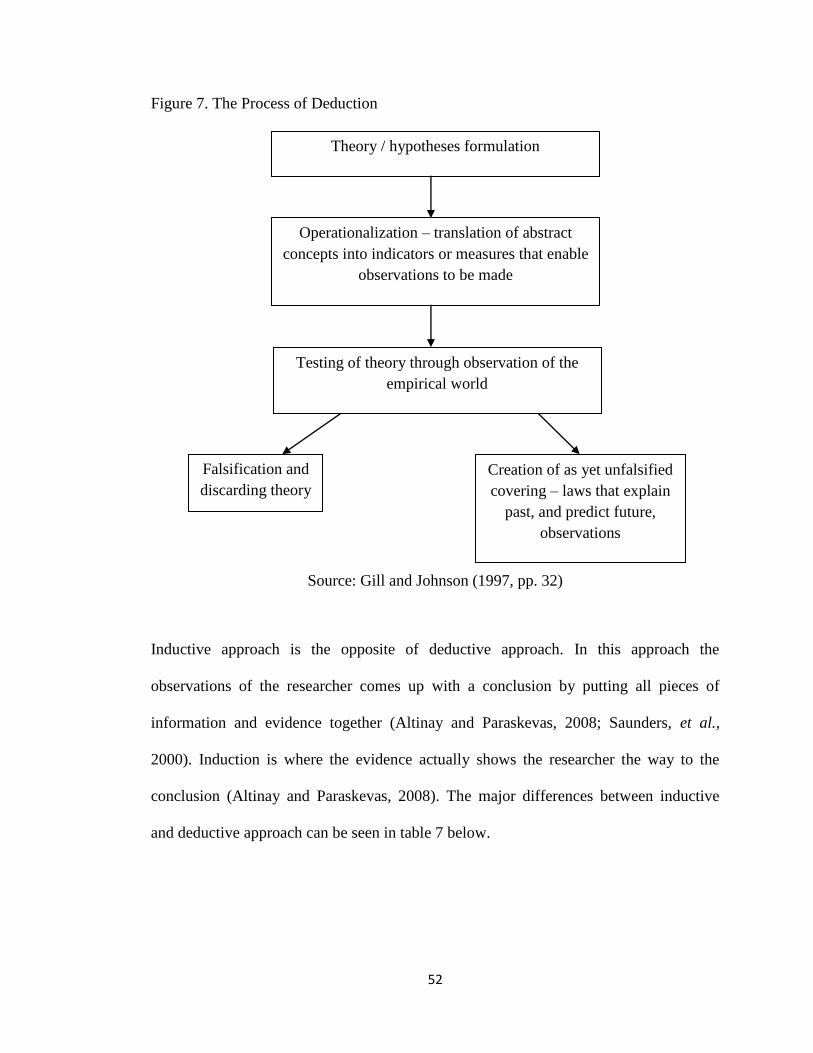
will be taking. That is either deductive or inductive. Lancaster (2005) describes
deductive approach as a type of research where hypotheses and theories are developed
and tested through observation. Gill and Johnson (1997) proposed the framework for the
deduction research process as shown in figure 7. The first step of the process is the
formulation of the theory/hypotheses. Here, the researcher can generate the
theory/hypotheses based on his/her previous experience on what s/he wants to prove or
generate the theory/hypotheses from a broad literature combining multiple studies
(Lancaster, 2005). Once the theories/hypotheses are formulated they have to be
operationalized which is the next step in the process. In this stage, the researcher must
make sure that the theories/hypotheses are measurable through empirical observation
(Lancaster, 2005). Burns (2000) indicates that a precise definition of what will be
measured and how it will be measured is a must in this stage to avoid confusion.
Afterwards, the researcher must identify which techniques and measures will be used for
the concepts that are operationalized which is the third stage of the deductive process
(Lancaster, 2005). Once this stage is completed, the researcher can then see if the
theory/hypotheses is falsified and to what degree and if it should be discarded.
52
Figure 7. The Process of Deduction
Source: Gill and Johnson (1997, pp. 32)
Inductive approach is the opposite of deductive approach. In this approach the
observations of the researcher comes up with a conclusion by putting all pieces of
information and evidence together (Altinay and Paraskevas, 2008; Saunders, et al.,
2000). Induction is where the evidence actually shows the researcher the way to the
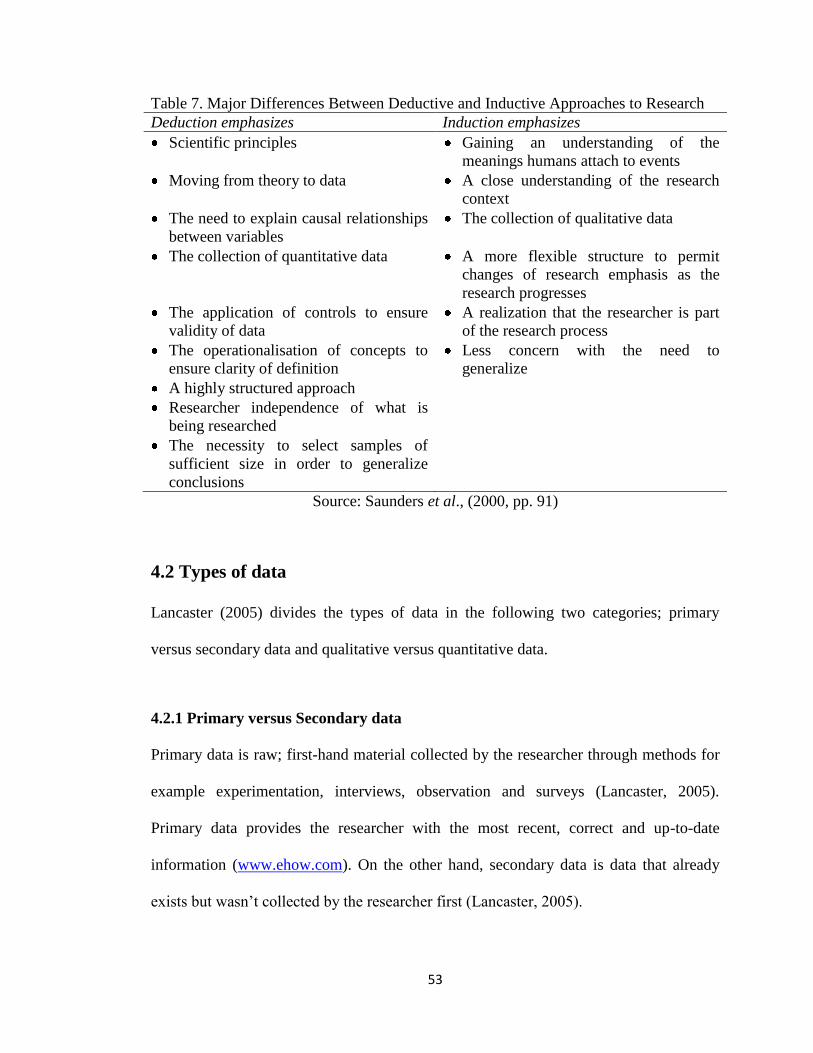
conclusion (Altinay and Paraskevas, 2008). The major differences between inductive
and deductive approach can be seen in table 7 below.
Theory / hypotheses formulation
Operationalization – translation of abstract
concepts into indicators or measures that enable
observations to be made
Testing of theory through observation of the
empirical world
Creation of as yet unfalsified
covering – laws that explain
past, and predict future,
observations
Falsification and
discarding theory
53
Table 7. Major Differences Between Deductive and Inductive Approaches to Research
Deduction emphasizes Induction emphasizes
Scientific principles Gaining an understanding of the
meanings humans attach to events
Moving from theory to data A close understanding of the research
context
The need to explain causal relationships
between variables
The collection of qualitative data
The collection of quantitative data A more flexible structure to permit
changes of research emphasis as the
research progresses
The application of controls to ensure
validity of data
A realization that the researcher is part
of the research process
The operationalisation of concepts to
ensure clarity of definition
Less concern with the need to
generalize
A highly structured approach
Researcher independence of what is
being researched
The necessity to select samples of
sufficient size in order to generalize
conclusions
Source: Saunders et al., (2000, pp. 91)
4.2 Types of data
Lancaster (2005) divides the types of data in the following two categories; primary
versus secondary data and qualitative versus quantitative data.
4.2.1 Primary versus Secondary data
Primary data is raw; first-hand material collected by the researcher through methods for
example experimentation, interviews, observation and surveys (Lancaster, 2005).
Primary data provides the researcher with the most recent, correct and up-to-date
information (www.ehow.com). On the other hand, secondary data is data that already
exists but wasn’t collected by the researcher first (Lancaster, 2005).
54
To be more precise, secondary data is actually primary data collected by another
individual or researcher (www.ehow.com). Secondary data includes both internal
sources such as internal organization data, company analyses, reports, databases and
external sources of data such as government surveys, published reports competitor
information and the internet (Lancaster, 2005)
4.2.2 Qualitative versus Quantitative data
Lancaster (2005) defines qualitative data as”data in the form of descriptive accounts of
observations or data which is classified by type” (pp. 66) and quantitative data as” data
which can be expressed numerically or classified by some numerical value” (pp.66).
Qualitative data can be obtained through individual interviews, focus groups,
observation, documentary analysis and data analysis (Robson, 2011; Petty et al., 2012).
Whereas quantitative data can be obtained through experiments, quasi – experiments,
surveys/questionnaires (Lancaster, 2005).
4.3 Methods of data collection
Robson (2011) defines methodology as “the theoretical, political and philosophical
backgrounds to social research and their implications for research practice and for the
use of particular research methods” (p. 528). Petty et al., (2012) states in her study that
the most commonly used five methodologies are case study, grounded theory,
ethnography, phenomenology and narrative.
55
4.3.1 Case Study
Case study methodology comes from evaluative research and human and social sciences
and intends to figure out the distinctiveness of a case (Creswell, 2007). Robson (2002)
identifies case study as an approach which contains an exploration of a specific event in
its own habitat via numerous sources of proof. In this type of methodology there is no
specific method of data analysis, one can choose from a range of methods for data
collection such as; interview, observation and document analysis (Petty et al., 2012).
When knowledge on hand is insufficient and lacking, this method allows you to find
new information about the subject or area (Otley and Berry, 1994).
4.3.2 Grounded Theory
The grounded theory is originated from sociology (Petty et al., 2012) and was stemmed
in the 1960s by Glaser and Strauss (Glaser and Strauss, 1967). This theory has two
approaches. The first is called the Glaserian grounded theory where the theory is
emerged from data whereas the second approach is vice versa where the concept is built
by researchers (Petty et al., 2012). The main objective of this method is that the
researcher enters the field with no acknowledged relationships and creates relationships
among the variables that are intended to be measured through raw data collected (Glaser
and Strauss, 1967). Interviews, observation and documentary data are the most
frequently used data collection methods in the grounded theory (Petty et al., 2012).
56
4.3.3 Ethnography
Ethnography originated in the early 20th
century from “cultural anthropology” (Petty et
al., 2012, pp. 379). Ethnography is a type of methodology where an understanding is
developed through a comprehensive observation which is usually taken place through
the participation of the researcher in the group over a period of time (Spradley, 1979;
Petty et al., 2012). The shared beliefs, language and behavior of certain cultural groups
are the main focus of this methodology (Petty et al., 2012). Ethnography is mainly used
among anthropologists and by those who carry out cultural studies (Altinay and
Paraskevas, 2008).
4.3.4 Phenomenology
Phenomenology is related with the methods used to research individuals and their
behavior (Gill and Johnson, 1997). This methodology mainly focuses on the individuals’
distinctive “lived experience” through the investigation of the definition of phenomenon
(Petty et al., 2012, pp. 2). The analysis of this methodology allows “the researcher to
uncover a description of the “essence” of the phenomenon; the universal meaning for
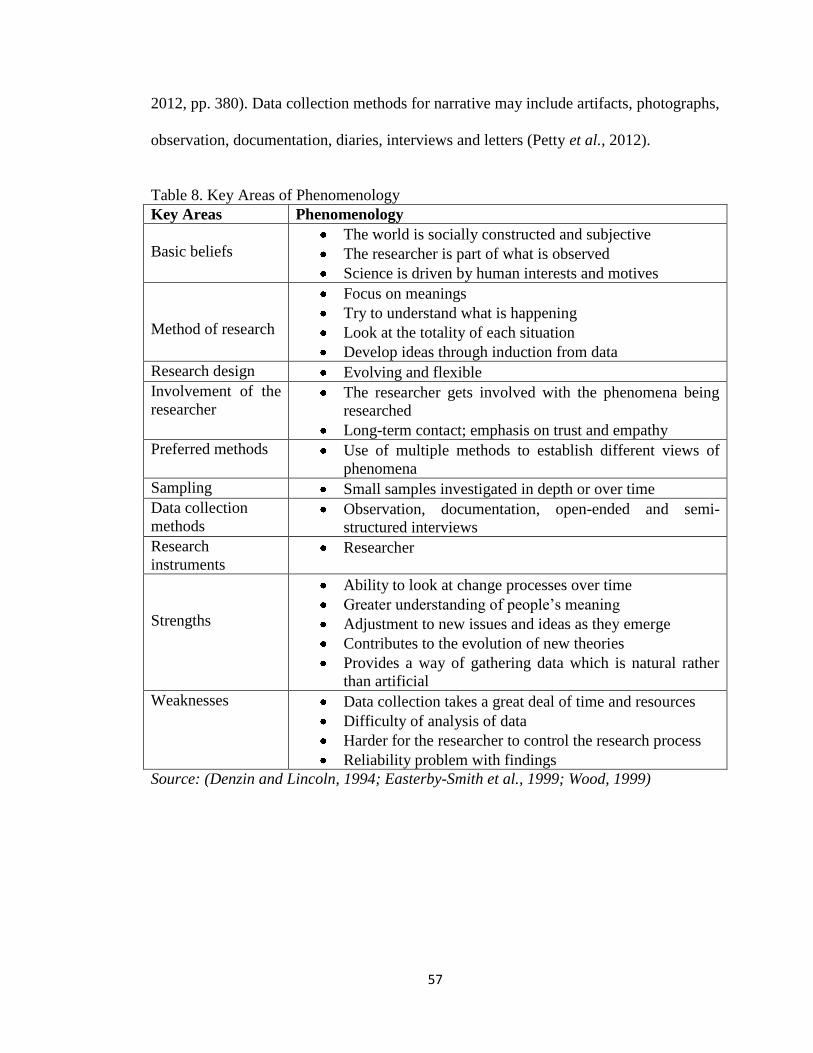
individuals” (Petty et al., 2012, pp. 379). The main key areas of this methodology are
outlined in table 8.
4.3.5 Narrative
Narrative is a type of methodology which is developed from humanities and social
sciences and can pursue both quantitative and qualitative methods (Elliott, 2005). This
methodology mainly concentrates on events and its stories and life experiences of
individuals (Creswell, 2007) either in a biographical way or “oral history” (Petty et al.,
57
2012, pp. 380). Data collection methods for narrative may include artifacts, photographs,
observation, documentation, diaries, interviews and letters (Petty et al., 2012).
Table 8. Key Areas of Phenomenology
Key Areas Phenomenology
Basic beliefs The world is socially constructed and subjective
The researcher is part of what is observed
Science is driven by human interests and motives
Method of research
Focus on meanings
Try to understand what is happening
Look at the totality of each situation
Develop ideas through induction from data
Research design Evolving and flexible
Involvement of the
researcher The researcher gets involved with the phenomena being
researched
Long-term contact; emphasis on trust and empathy
Preferred methods Use of multiple methods to establish different views of
phenomena
Sampling Small samples investigated in depth or over time
Data collection
methods Observation, documentation, open-ended and semi-
structured interviews
Research
instruments Researcher
Strengths
Ability to look at change processes over time
Greater understanding of people’s meaning
Adjustment to new issues and ideas as they emerge
Contributes to the evolution of new theories
Provides a way of gathering data which is natural rather
than artificial
Weaknesses Data collection takes a great deal of time and resources
Difficulty of analysis of data
Harder for the researcher to control the research process
Reliability problem with findings
Source: (Denzin and Lincoln, 1994; Easterby-Smith et al., 1999; Wood, 1999)
58
4.4 Quantitative Research Method
Quantitative research utilizes investigational methods and measures to analyze
hypothetical simplifications (Hoepfl, 1997), which also highlights the measurement and
analysis of contributory relationships among variables (Denzin and Lincoln, 1998;
Creswell, 2007; McMillan and Schumacher, 2006) enabling the researcher to publicize
herself with the question or theory to be studied, and possibly construct hypotheses for
testing (Golafshani, 2003) which then goes through statistical analysis (Malhotra, 2010).
The aim of this type of research is to decide on how a variable has an effect on another
variable by measuring the relationships between them through statistical methods for
instance correlation coefficients, frequencies and means (Altinay and Paraskevas, 2008).
4.4.1 Experiments
Saunders et al., (2000) describes experiments as a method of research that is used mostly
in psychology. They further explain that this method involves the following stages;
firstly the hypothesis is defined, secondly the sample of the population is selected,
thirdly the selected samples are allocated to different experiment situations, fourthly any
change on the variable(s) are introduced followed by the measurement of the variables
and lastly other variables are controlled. Furthermore, McQueen and Knussen (2002)
explained that the aim of this method is to demonstrate the cause and effect relationships
such as, learning and memory, child development and social behavior.
59
4.4.2 Surveys / questionnaires
Among researchers, questionnaires are seen as one of the most popular methods of data
collection (Altinay and Paraskevas, 2008). McQueen and Knussen (2002) explain that
the aim of this type of methodology is to generate primary descriptive data and can be
taken in the form of structured interviews or questionnaires. Moreover, Saunders et al.,
(2000) presents a table (figure 8) showing the types of questionnaires. He suggests that
the type of questionnaire used in a study differs according to how and with who you will
be doing the research. However Lancaster (2005) states that the researcher must consider
some aspects about the design and implementation of the questionnaire such as;
The range of questions that will be included
Types of questions (open/closed)
Content of the questions
Structure of the questions
Wording of the questions
Order of the questions
Furthermore, additionally to the aspects above, Saunders et al., (2000) states that even
though the format of the questionnaire is important, the sample population needs to be as
accurate as possible since there is a no second chance to recollect the data.
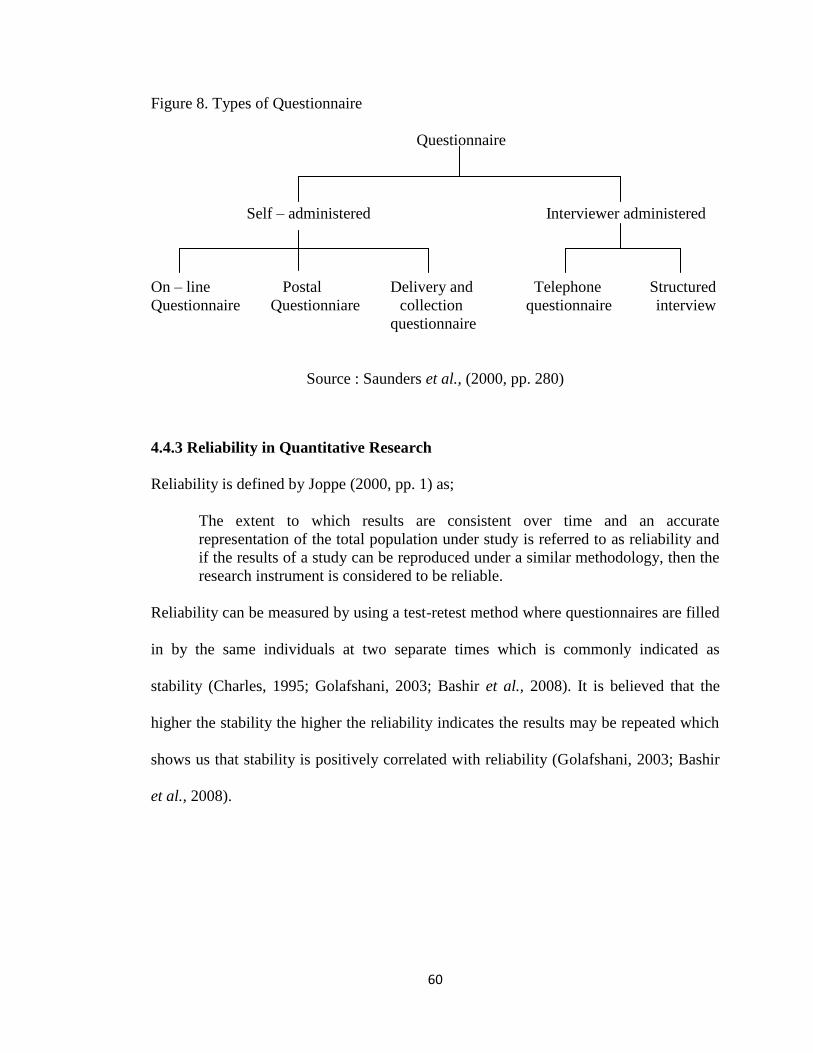
60
Figure 8. Types of Questionnaire
Questionnaire
Self – administered Interviewer administered
On – line Postal Delivery and Telephone Structured
Questionnaire Questionniare collection questionnaire interview
questionnaire
Source : Saunders et al., (2000, pp. 280)
4.4.3 Reliability in Quantitative Research
Reliability is defined by Joppe (2000, pp. 1) as;
The extent to which results are consistent over time and an accurate
representation of the total population under study is referred to as reliability and
if the results of a study can be reproduced under a similar methodology, then the
research instrument is considered to be reliable.
Reliability can be measured by using a test-retest method where questionnaires are filled
in by the same individuals at two separate times which is commonly indicated as
stability (Charles, 1995; Golafshani, 2003; Bashir et al., 2008). It is believed that the
higher the stability the higher the reliability indicates the results may be repeated which
shows us that stability is positively correlated with reliability (Golafshani, 2003; Bashir
et al., 2008).
61
4.4.4 Validity in Quantitative Research
Validity is defined by Joppe (2000, pp. 1) as;
Whether the research truly measures that which it was intended to measure or
how truthful the research results are. In other words, does the research instrument
allow you to hit “the bull’s eye” of your research object? Researchers generally
determine validity by asking a series of questions, and will often look for the
answers in the research of others.
The aim is to see if there is accurate measurement and whether the researcher is
measuring what s/he is aiming to measure (Golafshani, 2003).
4.5 Qualitative Research Method
Mack et al., (2005) defined qualitative research as “a type of scientific research” (pp. 1)
which is composed of an analysis that:
Tries to find answers for questions
Uses a series of procedures to answer the questions
Gathers proof
Discovers findings that have not been found before
Discovers findings that can be applied further than the limits of the research
Qualitative researchers look for clarification, knowledge, and extrapolation in contrast to
quantitative researchers who search for contributory relationships, forecast, and
generalize findings (Hoepfl, 1997; Golafshani, 2003). The most common used data
collection methods in qualitative research are individual interviews, focus groups, and
observation (Petty et al., 2012).
62
4.5.1 Individual Interviews
Qualitative research generally uses interviews for data collection. Individual interviews
comprise of “direct questioning” among the respondent and the interviewer
(McClelland, 1994, pp. 27). Robson (2011) classified interviews into 3 categories;
structured, semi-structured and unstructured. Petty et al., (2012) stated that structured
interviews are very alike to questionnaires and don’t go into much detail whereas semi-
structured interviews are the type of interviews where a few questions are determined
beforehand to get the conversation going during the interview. She also mentioned that
unstructured interviews are more in detail when compared structured and semi-
structured interviews since they cover an extensive area to survey. Petty et al., (2012)
also pointed out that the direction of the interview is dependent on the participant in
which the researcher follows.
4.5.2 Focus Groups
Mack et al., (2005) defined focus group as a method of qualitative data collection where
either one or multiple researchers meet with a number of participants in order to talk
about a specific topic for research. Petty et al., (2012) stated that focus groups can also
take place as unstructured, semi-structured or structured and have something/nothing in
common dependent on the research question. She also pointed out that focus groups are
helpful when multiple points of view about a specific topic are needed.

63
4.5.3 Observation
Observation provides detailed and specific information (Sackmann, 1991) which is
received from constantly contrasting comparing and questioning (Schein, 1992). By
using this method you gain the information needed by being present at the setting,
observing what they do and their relationships with each other (Altinay and Paraskevas,
2008; Lancaster, 2005). Observation can be used to examine politics and cultural groups
(Altinay and Paraskevas, 2008).
4.6 Sampling
Collecting data from the best representatives of the population is crucial when carrying
out a research or study. Altinay and Paraskevas (2008) define sampling as “the process
by which researchers select a representative subset or part of the total population…” (pp.
89) in order to come up with a result that considers and represents the whole population.
Sampling can be divided into two groups probability/representative sampling and non-
probability/judgmental sampling (Altinay and Paraskevas, 2008; Saunders et al., 2000;
McQueen and Knussen, 2002). The different types of sampling techniques for each
group are shown in figure 9. As it can be seen from the figure the sampling techniques
for probability sampling includes simple random, systematic, stratified random, cluster
and multi-stage and non-probability sampling includes quota, purposive, snowball, self-
selection and convenience. Altinay and Paraskevas (2008) define the above techniques
in the following way;
64
4.7 Probability sampling techniques
Simple random sampling: This technique emphasizes that each individual considered
in the population has an equal chance or probability of selection. For example, a
research is to be done in a hotel about customer satisfaction. The hotel provides you a
list of 800 customer contact details for your study and you decide to select 150 guests
randomly. You start from the list at any point you want and work your way through in a
specific pattern such as diagonally, horizontally, vertically, zig – zag or you can choose
numbers from every specific column or row until you reach a total of 150.
Systematic sampling: In this sampling technique, every nth
number of the population is
selected for the sample where n is calculated by dividing the total population by the
sample size required. For example, a researcher wants to do a study on the passengers
perception of the airline company and needs 25 percent of the population as his sample.
Assuming that there is 200 passengers on the flight, the researcher will have to take
every 8th
passenger (200/25=8) for the study.
Stratified random sampling: In this technique, the total population is divided into
segments or subsets according to specific characteristics such as, age gender, nationality,
etc. Afterwards the sample is selected from the subsets either by using simple random
sampling or systematic sampling. For example, a hotel wants to open a new restaurant
and needs feedback from its guests. The hotels guest profile consists of business
travelers, tour groups, leisure travelers and conference groups.
65
If the market mix is 30 percent business travelers, 40 percent tour groups, 20 percent
leisure travelers and 10 percent conference groups then a sample of thirty guests would
include 9 business travelers, 12 tour group guests, 6 leisure travelers and 3 conference
delegates.
Cluster sampling: In this technique, the population is divided into groups and a sample
of the groups is chosen randomly. Then a sample population is chosen out of the groups.
However, if the members of the whole group is studied this is called one-stage
clustering. On the other hand, if a sample is selected probabilistically from the chosen
groups then this is called two-stage clustering. For example, a study is carried out to
analyze the tourists spending patterns in a specific destination. You are taking into
account the hotels together with other touristic accommodations in the specific
destination. Then again, since this would be highly costly and take too much of your
time you decide to use one of the cluster approaches above. So, you start to analyze each
hotel and touristic accommodation that best suits your study. Then, you randomly
choose a fraction of these accommodations. Afterwards, you can either take in all the
tourists accommodating in the hotels chosen (one-stage) or you can randomly choose
some of the tourists from the selected hotels (two-stage).
Multi – stage sampling: This technique is defined by Saunders et al., (2000) as a
method used to conquer any problems when the case is about needing face-to-face
communication with a scattered population for a large geographical area.
66
Nonetheless, this method can also be used for disconnected groups together with those
that are not in the same geographical area. As it can be seen from figure 3, this technique
involves random sampling together with cluster sampling.
4.8 Non-probability sampling techniques
Quota sampling: This technique is used to make sure that there are equal participants
for each of the groupings done by stratified sampling. Firstly, by using the stratified
technique, the whole population is divided into subsets. Then by using judgmental
sampling, you choose the participants according to a specific share. For example, you
want to study the English people who have immigrated to Northern Cyprus about how
they find the standard of living in the island. Therefore you need to know how many
people have moved out here and in which area they live in. Let’s say that you need to
interview 100 English people and you know that 40% live in Kyrenia, 30% live in
Famagusta, 10% live in Nicosia, 10% live in Iskele and 10% live in Guzelyurt. As a
result, the number of interviewees is determined by the share of what each group has so
if you interview 40 English people from Kyrenia the quota will be full for this area and
you will be left with 4 other areas to fill in the quota.
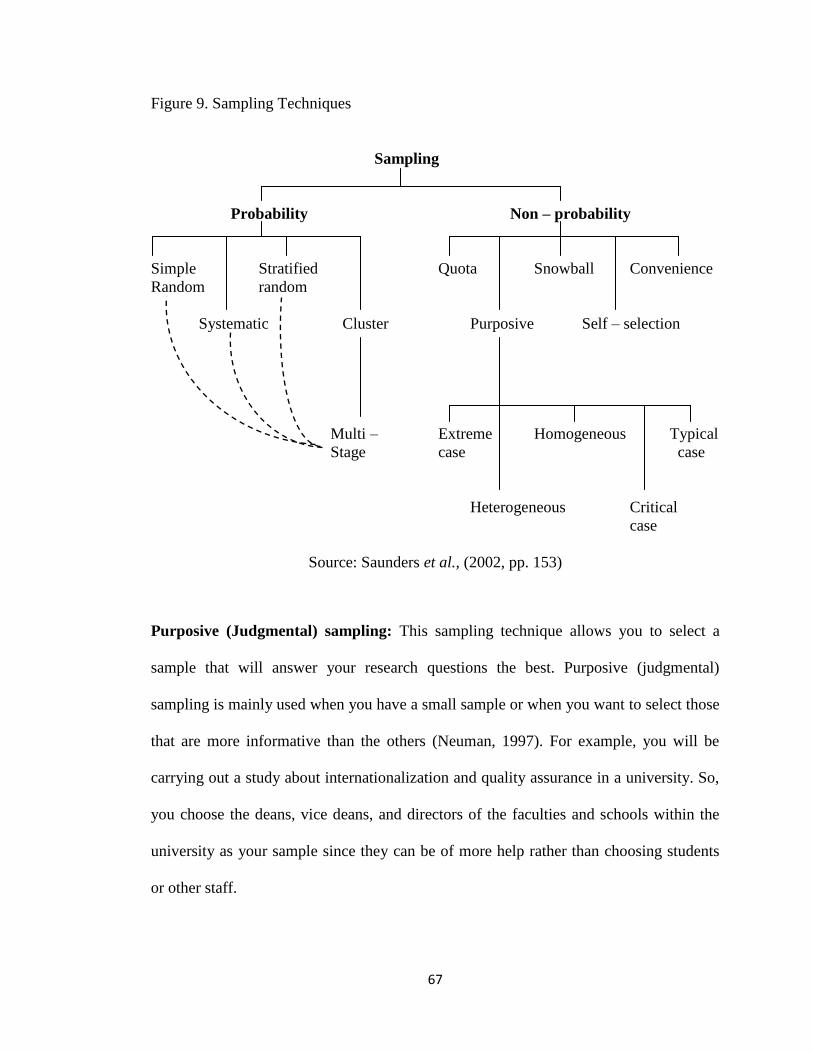
67
Figure 9. Sampling Techniques
Sampling
Probability Non – probability
Simple Stratified Quota Snowball Convenience
Random random
Systematic Cluster Purposive Self – selection
Multi – Extreme Homogeneous Typical
Stage case case
Heterogeneous Critical
case
Source: Saunders et al., (2002, pp. 153)
Purposive (Judgmental) sampling: This sampling technique allows you to select a
sample that will answer your research questions the best. Purposive (judgmental)
sampling is mainly used when you have a small sample or when you want to select those
that are more informative than the others (Neuman, 1997). For example, you will be
carrying out a study about internationalization and quality assurance in a university. So,
you choose the deans, vice deans, and directors of the faculties and schools within the
university as your sample since they can be of more help rather than choosing students
or other staff.
68
Snowball sampling: In this technique, nor the sample or the population has a definite
number beforehand until you finish collecting the data. In snowball sampling, you
mainly find your respondents from the recommendation or referral of a participant. For
example, you are doing a research about coastal zone management and you have many
research questions ready to be asked to the participants however you are guessing that
you have a large population in hand and you don’t know where to start. Therefore you
start with the minister of tourism. After the interview is finished you ask him who else
takes part in coastal zone management for you to interview and so on.
Self – selection sampling: This sampling technique is different from the other
techniques. In the other methods the researcher uses various ways of contacting or
finding participants however, in self – selection sampling the participants contact or find
you. You publish or advertise that you are doing such a study and those who are
interested fill in the questionnaire. For example, you are doing a study about e-
commerce in a specific country. You publish your study on several internet sites,
bulletin boards and social media sites and ask for those interested in your study to fill in
the survey until you have reached the wanted sample size.
Convenience sampling: In this technique, the sample is selected according to their
convenience and ease of access. For example, if you was to do a study on tourists’
perception about a destination you would go to touristic places (such as hotels,
museums, historical places, etc.) to find them to be able to conduct an interview.
Therefore, the sample that is chosen for this study is revealed by convenience instead of
being randomly chosen.
69
4.9 Rationale for using deductive approach
The aim of this study was to test the relationship among various contingent variables
with budgeting practices and performance measurement in hotels in Northern Cyprus.
After searching and analyzing the literature about similar studies done in different
countries, the hypotheses was developed and evaluated which is the procedure of the
deduction process.
4.10 Rationale for using quantitative method
When starting this study, the triangulation method (which is a mixture of both
quantitative and qualitative methods) was going to be implemented. However, due to the
opening of the high season in Northern Cyprus interviews with the participants would be
nearly impossible therefore self – administered (delivery and collection) questionnaires
were used.
As it was mentioned in this chapter, judgmental sampling is a non-probability sampling
technique where the sample is not randomly chosen but chosen according to the criteria
that will best answer the questions for the study. In this case, the sample for this study
consisted of General Managers and departmental managers so the sample size was
relatively small. However, since the subject was about budgeting practices in a hotel, the
most informative sample for this case was the manager instead of the employees because
it is known that General Managers and departmental managers attend budget meetings
and have a say in the decision making for various decisions which is why judgmental
sampling was used.

70
The aim of this study was to focus on the relationships between contingent variables and
budgeting practices and budgeting practices with performance measurement in hotels in
Northern Cyprus. The questionnaire was developed from a broad review and literature
and all items except for performance measurement were measured on 5 point likert
scales. The contingent variables used in the study was adapted from multiple studies
such as those from Gordon and Narayanan (1984), Fisher (1998), Sharma (2002),
Chenhall (2003), and King, et al., (2010).
The questionnaire was written in English and then translated to Turkish and again
translated back to English using back-to-back translation method. A pilot study was held
in one of the hotels for feedback and in case of any misunderstanding among the
questions. Positive feedback was received from the participants of the pilot study and the
questionnaires were distributed. The summary of the questions held in the questionnaire
can be seen from table 9.
This research considered 4 and 5 star hotels in Northern Cyprus as the population.
According to the list of hotels from the Ministry of Tourism and Planning there are 21
four and five star hotels in Northern Cyprus. All were included as the population apart
from two hotels who refused to fill the questionnaires.
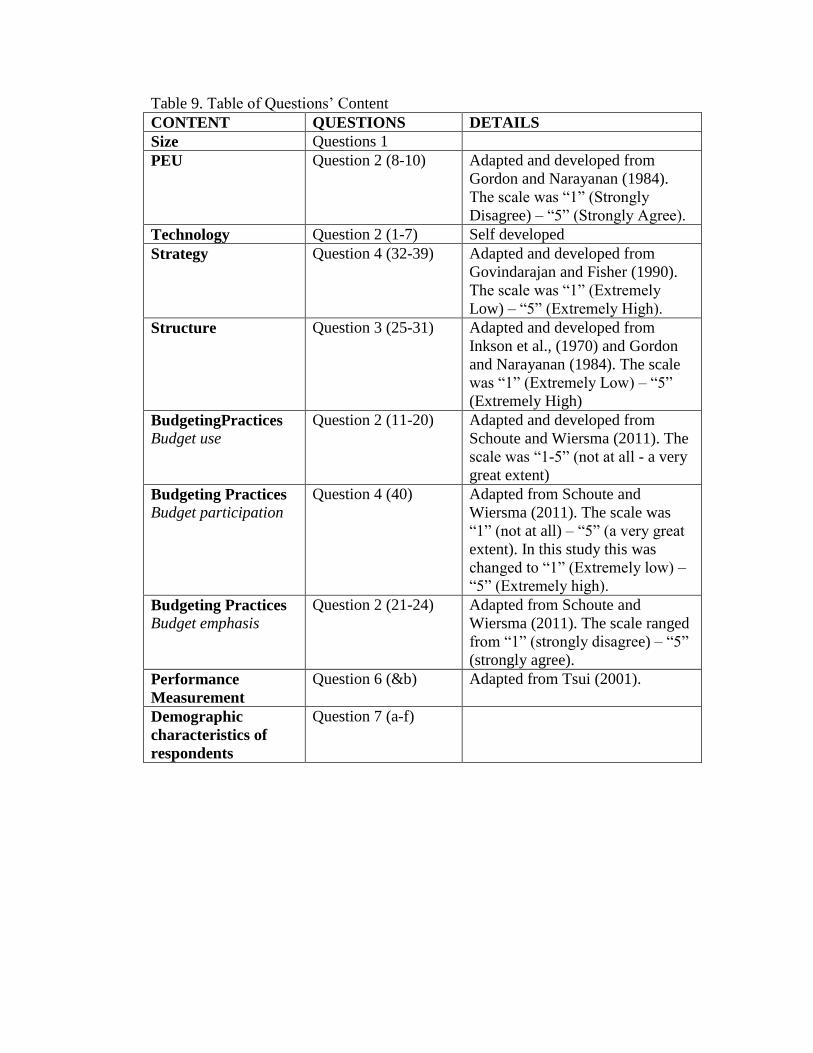
71
Table 9. Table of Questions’ Content
CONTENT QUESTIONS DETAILS
Size Questions 1
PEU Question 2 (8-10) Adapted and developed from
Gordon and Narayanan (1984).
The scale was “1” (Strongly
Disagree) – “5” (Strongly Agree).
Technology Question 2 (1-7) Self developed
Strategy Question 4 (32-39) Adapted and developed from
Govindarajan and Fisher (1990).
The scale was “1” (Extremely
Low) – “5” (Extremely High).
Structure Question 3 (25-31) Adapted and developed from
Inkson et al., (1970) and Gordon
and Narayanan (1984). The scale
was “1” (Extremely Low) – “5”
(Extremely High)
BudgetingPractices
Budget use
Question 2 (11-20) Adapted and developed from
Schoute and Wiersma (2011). The
scale was “1-5” (not at all - a very
great extent)
Budgeting Practices
Budget participation
Question 4 (40) Adapted from Schoute and
Wiersma (2011). The scale was
“1” (not at all) – “5” (a very great
extent). In this study this was
changed to “1” (Extremely low) –
“5” (Extremely high).
Budgeting Practices
Budget emphasis
Question 2 (21-24) Adapted from Schoute and
Wiersma (2011). The scale ranged
from “1” (strongly disagree) – “5”
(strongly agree).
Performance
Measurement
Question 6 (&b) Adapted from Tsui (2001).
Demographic
characteristics of
respondents
Question 7 (a-f)
72
General Managers, Accounting and Finance Managers, Food & Beverage Managers,
Housekeeping Managers, Front Office Managers, Sales & Marketing Managers, and
Human Resources Managers were considered as the sample which results in 7
questionnaires distributed per hotel. However, for 9 hotels one departmental manager
had the responsibility of two departments therefore 6 instead of 7 questionnaires were
distributed to those hotels. Also, one hotel just had one manager which was responsible
for all the departments so 1 instead of 7 questionnaires was given. In total 124
questionnaires were distributed and 109 questionnaires were received resulting in a
87.9% response rate.
4.11 Measurement and Analysis
Likert scales were used for the measurement of the majority of the variables of the study
which is seen as the most common type of scaling (Saunders et al., 2000). Apart from
performance measurement and demographic questions, 5-point likert scales were used
which were “1” (Strongly Disagree) – “5” (Strongly Agree), “1” (Extremely Low) – “5”
(Extremely High), “1” (not at all) - “5” (a very great extent). Two questions were used to
measure performance measurement where one question had a scale from 1-9 and the
other 1-10. On the other hand, a nominal scale (which is used to identify the
characteristics of individuals or objects) was used to measure the demographic questions
the respondents.
Once the questionnaires were collected, the data was entered and analyzed using SPSS
15.0 (Statistical Package for Social Sciences).
73
Chapter 5
FINDINGS
5.1 Introduction
This chapter presents the findings of the analysis which includes the demographic
profile of the sample, exploratory factor analysis and coefficient alphas of the variables
and the means, standard deviation and correlations of the study variables.
Cronbach’s alpha was used to measure the reliability of the variables. This measurement
has a range from 0 – 1.00 pointing out that those values closer to 1.00 has a higher
consistency. An alpha above 0.75 is generally accepted as high reliability, however those
values below the value indicates a low reliability. The relationship between the variables
was measured through Pearson Correlation Analysis together with the testing of the
hypothesis using a one-tailed test.
5.2 Demographic profile of the sample
The respondent’s demographic profile is shown in Table 10. As it can be seen from the
tables, the majority of the respondents are aged between 28-37 (40.4%) and 38-47
(40.4%). Out of the remaining 19.2%, 11.0% of the respondents are aged between 48-57,
5.5% are aged between 18-27 and 2.8% are aged 58 and above.
74
Sixty percent of the respondents are male, and the remaining 39.4% are female. Forty –
nine percent of the respondents have a University degree, 27.5% have a Vocational
school degree, 14.7% have a Secondary school degree and 8.3% have a Master/PhD
degree. The majority of the respondents are married (75.2%) while the remaining 24.8%
are single or divorced.
Forty – one percent have an organizational tenure of 1-5 years, 28.4% have tenure of 6-
10 years, 13.8% have tenure of 11-15 years, 11.0% have tenure of less than 1 year, 3.7%
have tenure of more than 20 years and the remaining 1.8% has tenure of 16-20 years.
Twenty – nine percent of the respondents were other which includes F&B managers and
Housekeeping managers, 16.5% were Accounting managers. 15.6% were Front Office
managers, 14.7% were Human Resources managers, 12.8% were General Managers and
11.0% were Sales and Marketing managers.
5.3 Measurement Results
Table 11 consists of the frequency and descriptive statistics of the study variables by
showing the number of respondents for each question and scale. This table is further
explained in the following chapter (Chapter 6). The results of the exploratory factor
analysis are shown in Table 12. The exploratory factor analysis used principal
component analysis with Varimax rotation to determine if variables embodied the
individual concepts. As the initial results showed cross loadings, 2 items were deleted
from STRUC, 3 items were deleted from STR, 4 items were deleted from TECH and 13
items were deleted from BP. Factor loadings range from .55 to .91.

75
Consequently, the remaining items loaded on their own factors. The coefficient alphas
for all variables were greater than the cut-off level .70, except PEU (α= 67) as shown in
Table 13. Therefore all variables reveal a high reliability with a minor exemption of
PEU.

77
Table 10. Respondents’ Profile (n= 109)
Frequency %
Age
18-27 6 5.5
28-37 44 40.4
38-47 44 40.4
48-57 12 11.0
58 and above 3 2.8
Total 109 100
Gender
Male 66 60.6
Female 43 39.4
Total 109 100
Education
Secondary school 16 14.7
Vocational school 30 27.5
University graduate 54 49.5
Master/PhD 9 8.3
Total 109 100
Marital status
Single or divorced 27 24.8
Married 82 75.2
Total 109 100
Organizational tenure
Less than 1year 12 11.0
1-5 years 45 41.3
6-10 years 31 28.4
11-15 years 15 13.8
16-20 years 2 1.8
More than 20 years 4 3.7
Total 109 100
Position
General Manager 14 12.8
HRM Manager 16 14.7
Accounting Manager 18 16.5
Front Office Manager 17 15.6
Sales and Marketing Manager 12 11.0
Other 32 29.4
Total 109 100
77
Table 13 presents the means, standard deviations and correlations of the study variables.
The correlation coefficients between STRUC, STR, PEU, TECH and BP are significant.
As it can be seen from the table PEU is related with BP (r=.261) therefore hypothesis 1
is supported. Hypothesis 2 is also supported since it can be seen that TECH is related
with BP (r=.222). The table also shows that STR is related with BP (r=.283) therefore as
a result hypothesis 3 is supported. Consequently, it can be said that hypothesis 4 is also
supported since it can be seen from the table that STRUC is related with BP (r=.363).
However the results also indicate that BP is negatively correlated with PM (r=.-164).
That is, hypothesis 5 is partially accepted since BP is related with PM but negatively.
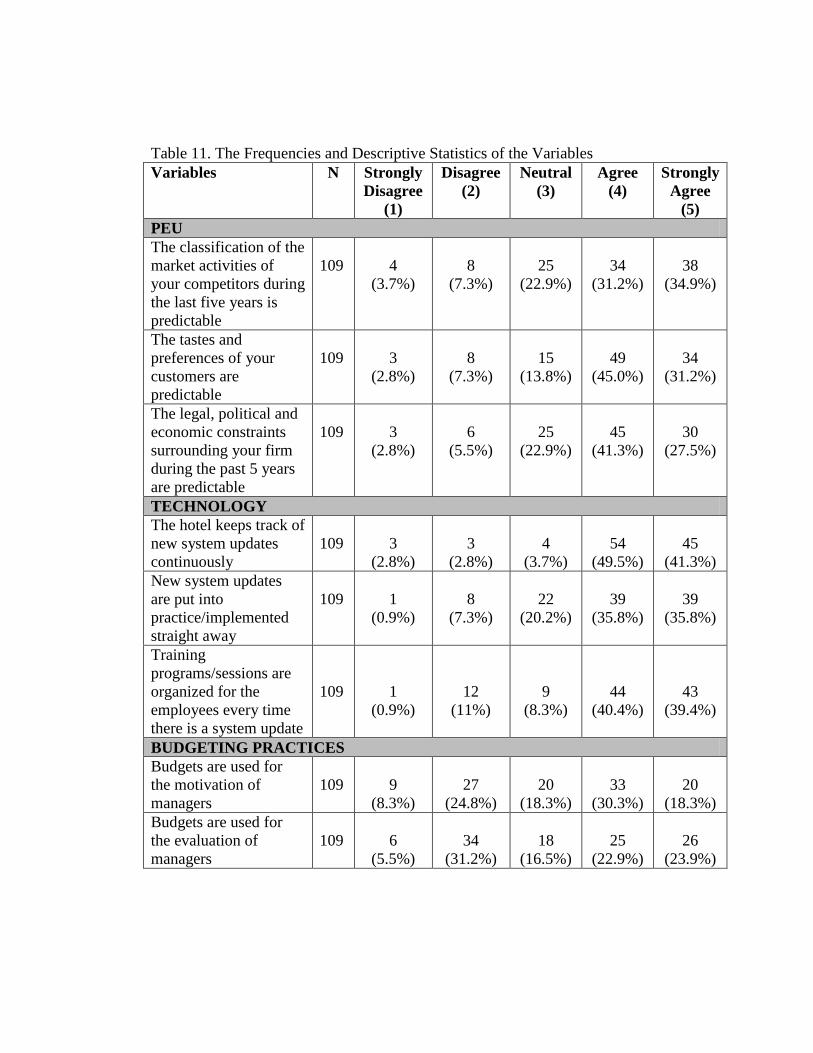
79
Table 11. The Frequencies and Descriptive Statistics of the Variables
Variables N Strongly
Disagree
(1)
Disagree
(2)
Neutral
(3)
Agree
(4)
Strongly
Agree
(5)
PEU
The classification of the
market activities of
your competitors during
the last five years is
predictable
109
4
(3.7%)
8
(7.3%)
25
(22.9%)
34
(31.2%)
38
(34.9%)
The tastes and
preferences of your
customers are
predictable
109
3
(2.8%)
8
(7.3%)
15
(13.8%)
49
(45.0%)
34
(31.2%)
The legal, political and
economic constraints
surrounding your firm
during the past 5 years
are predictable
109
3
(2.8%)
6
(5.5%)
25
(22.9%)
45
(41.3%)
30
(27.5%)
TECHNOLOGY
The hotel keeps track of
new system updates
continuously
109
3
(2.8%)
3
(2.8%)
4
(3.7%)
54
(49.5%)
45
(41.3%)
New system updates
are put into
practice/implemented
straight away
109
1
(0.9%)
8
(7.3%)
22
(20.2%)
39
(35.8%)
39
(35.8%)
Training
programs/sessions are
organized for the
employees every time
there is a system update
109
1
(0.9%)
12
(11%)
9
(8.3%)
44
(40.4%)
43
(39.4%)
BUDGETING PRACTICES
Budgets are used for
the motivation of
managers
109
9
(8.3%)
27
(24.8%)
20
(18.3%)
33
(30.3%)
20
(18.3%)
Budgets are used for
the evaluation of
managers
109
6
(5.5%)
34
(31.2%)
18
(16.5%)
25
(22.9%)
26
(23.9%)

80
Table 11. The Frequencies and Descriptive Statistics of the Variables (cont’d)
Variables N Extremely
Low
(1)
Low
(2)
I don’t
know
(3)
High
(4)
Extremely
High
(5)
STRUCTURE (To what extent has authority been delegated to the appropriate senior managers for
each of the following classes of decisions?)
Development of
new products or
services
109 2
(1.8%)
25
(22.9%)
11
(10.1%)
48
(44.0%)
23
(21.1%)
Selection of large
investments
109 11
(10.1%)
16
(14.7%)
18
(16.5%)
34
(31.2%)
30
(27.5%)
Budget allocations 109 9
(8.3%)
15
(13.8%)
17
(15.6%
38
(34.9%)
30
(27.5%)
Pricing decisions 109 7
(6.4%)
10
(9.2%)
5
(4.6%)
50
(45.9%)
37
(33.9%)
Training methods to
be used
109 3
(2.8%)
10
(9.2%)
10
(9.2%)
51
(46.8%)
35
(32.1%)
STRATEGY
Product quality
compared to your
competitors
109
0
4
(3.7%)
10
(9.2%)
47
(43.1%)
48
(44.0%)
Product/service
profitability
compared to your
competitors
109
1
(0.9%)
11
(10.1%)
16
(14.7%)
42
(38.5%)
39
(35.8%)
Brand image
compared to your
competitors
109 0 6
(5.5%)
9
(8.3%)
49
(45.0%)
45
(41.3%)
Product feature
compared to your
competitors
109
0
6
(5.5%)
9
(8.3%)
45
(41.3%)
49
(45.0%)
Return on
Investment
compared to your
competitors
109
2
(1.8%)
10
(9.2%)
10
(9.2%)
45
(41.3%)
42
(38.5%)

81
Table 11. The Frequencies and Descriptive Statistics of the Variables (cont’d)
Variables N Below
10%
(1)
11-
20%
(2)
21-
30%
(3)
31-
40%
(4)
41-
50%
(5)
51-
60%
(6)
61-
70%
(7)
71-
80%
(8)
81-
90%
(9)
Above
90%
(10)
PERFORMANCE MEASUREMENT
On average, the
growth of sales
revenue for the past 3
years is:
109
4
(3.7%)
34
(31.2%)
26
(23.9%)
19
(17.4%)
6
(5.5%)
1
(0.9%)
9
(8.3%)
5
(4.6%)
4
(3.7%)
1
(0.9%)
Below
5%
(1)
5-10%
(2)
11-
15%
(3)
16-
20%
(4)
25%
(5)
26-
30%
(6)
31-
35%
(7)
36-
40%
(8)
Above
45%
(9)
On average, the
growth of net profit
before taxes for the
past 3 years is:
109
15
(13.8%)
26
(23.9%)
32
(29.4%)
14
(12.8%)
4
(3.7%)
2
(1.8%)
6
(5.5%)
6
(5.5%)
4
(3.7%)
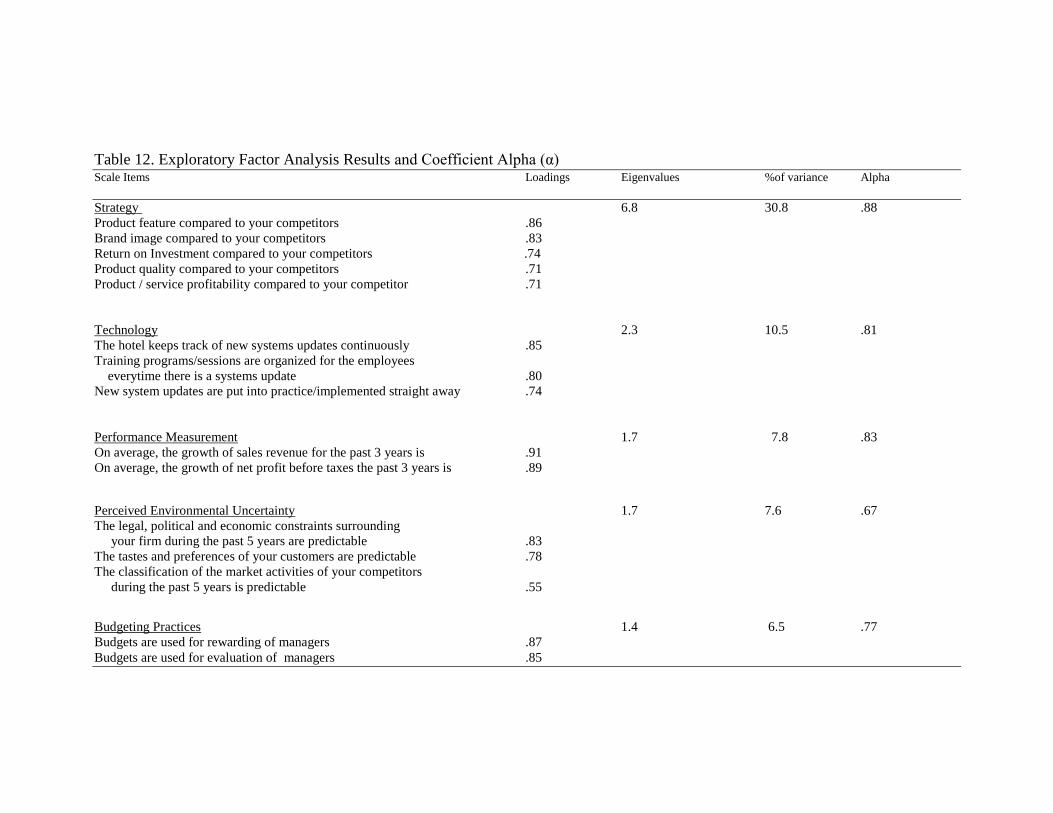
82
Table 12. Exploratory Factor Analysis Results and Coefficient Alpha (α) Scale Items Loadings Eigenvalues %of variance Alpha
Strategy 6.8 30.8 .88
Product feature compared to your competitors .86
Brand image compared to your competitors .83
Return on Investment compared to your competitors .74
Product quality compared to your competitors .71
Product / service profitability compared to your competitor .71
Technology 2.3 10.5 .81
The hotel keeps track of new systems updates continuously .85
Training programs/sessions are organized for the employees
everytime there is a systems update .80
New system updates are put into practice/implemented straight away .74
Performance Measurement 1.7 7.8 .83
On average, the growth of sales revenue for the past 3 years is .91
On average, the growth of net profit before taxes the past 3 years is .89
Perceived Environmental Uncertainty 1.7 7.6 .67
The legal, political and economic constraints surrounding
your firm during the past 5 years are predictable .83
The tastes and preferences of your customers are predictable .78
The classification of the market activities of your competitors
during the past 5 years is predictable .55
Budgeting Practices 1.4 6.5 .77
Budgets are used for rewarding of managers .87
Budgets are used for evaluation of managers .85
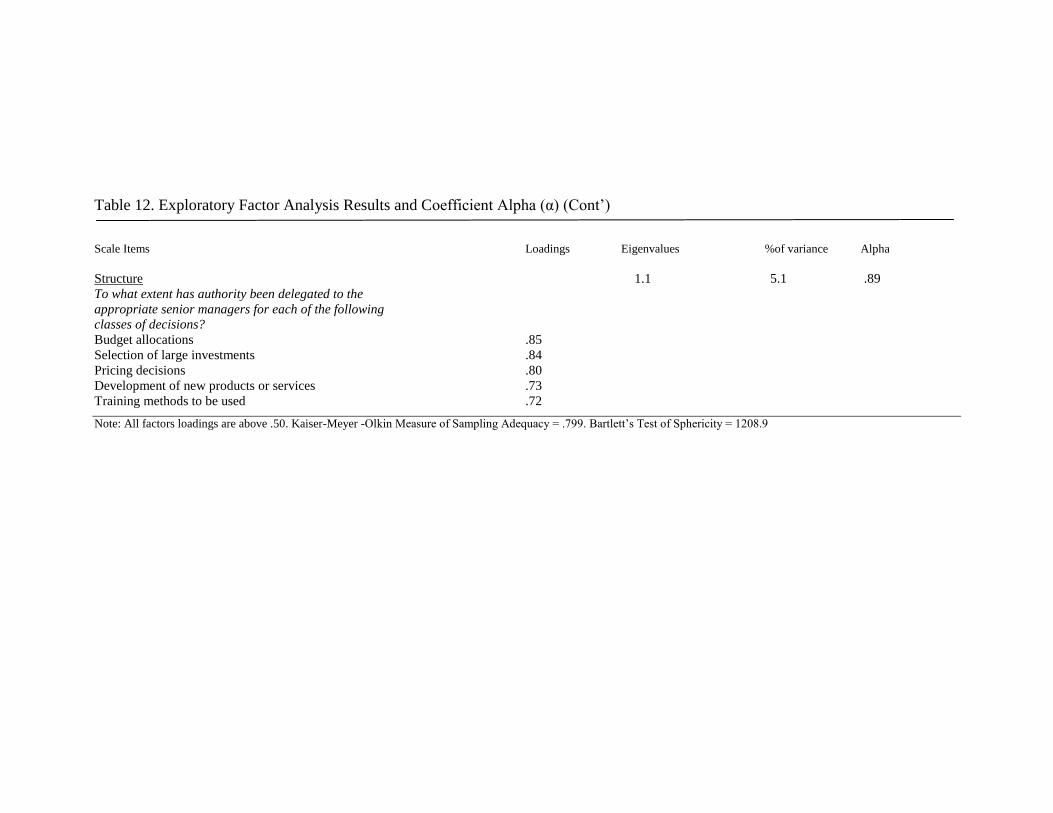
83
Table 12. Exploratory Factor Analysis Results and Coefficient Alpha (α) (Cont’)
Scale Items Loadings Eigenvalues %of variance Alpha
Structure 1.1 5.1 .89
To what extent has authority been delegated to the
appropriate senior managers for each of the following
classes of decisions?
Budget allocations .85
Selection of large investments .84
Pricing decisions .80
Development of new products or services .73
Training methods to be used .72
Note: All factors loadings are above .50. Kaiser-Meyer -Olkin Measure of Sampling Adequacy = .799. Bartlett’s Test of Sphericity = 1208.9
84
Table 13. Mean, Standard Deviations, Correlations of Study Variables
Variables Mean SD 1 2 3 4 5 6
1. Structure 3.71 .98 1.000
2. Strategy 4.16 .73 .477** 1.000
3. Perceived Environmental Uncertainty 3.89 .79 .336** .438** 1.000
4. Technology 4.09 .81 .383** .463** .288** 1.000
5. Budgeting Practices 3.15 1.21 .363* .283** .261** .222* 1000
6. Performance Measurement 3.61 1.99 -.220* -.096 -.051 -.091 -.164* 1000
Note: Composite scores for each construct were computed by averaging respective item scores. The scores for all constructs ranged from 1 to 5 except for performance
measurement which ranged from 1 to 9. All correlations are significant (p <0.01, p< 0.05)
**. Correlation is significant at the 0.01 level (1-tailed)
*. Correlation is significant at the 0.05 level (1-tailed)
85
Figure 10. Research Model
H5 (partially
supported)
H4 (+)
H3 (+)
H2 (+)
H1 (+)
Performance
Measurement
Budgeting
Practices
Structure
Technology
PEU
Strategy
85
Chapter 6
DISCUSSION AND CONCLUSION
6.1 Overview of the study
Contingency theory states that there is no single type of MCS that every organization
can implement, however the critical point in which the organizations have to consider is
which type is suitable for the company. Nevertheless, the structure and usage of control
systems are highly dependent on the background of the organization where the
manipulation of these controls systems take place (Fisher, 1998). There are many
contingent variables that can be considered in a study which can also be seen in Figure
6. Then again this study has taken on 4 of them.
The purpose of this study was to test the relationship between contingent variables,
budgeting practices and performance measurement. The main contingent variables used
in this study were strategy, structure, technology and perceived environmental
uncertainty. Non – probability judgemental sampling was used to collect the data from
the General Managers, Accounting and Finance Managers, Food & Beverage Managers,
Housekeeping Managers, Front Office Managers, Sales & Marketing Managers, and
Human Resources Managers. The processing of this data (109 questionnaires) was done
by using SPSS 15.0. This study had 5 hypotheses where 4 (H1, H2, H3, H4) of them
were supported and the remaining 1 (H5) was partially supported.

86
Consequently, this chapter presents the discussion of the findings in chapter 5, the
limitations of the study and the implications for both the sector and for further research.
6.2 Discussion
Throughout the study, 5 hypotheses was developed and tested where 4 of them were
accepted and remaining 1 was partially accepted. The first hypothesis (H1) which
proposed that “PEU is related with budgeting practices” was supported with a positive
relationship (r=.261).
These findings corroborate with those of Gordon and Narayanan (1984) and Muchlish
(2012) but refute the study of King et al., (2010) meaning that the more the external
environment is uncertain, the more the establishment will carry out budgeting practices
in order to be able to take precautions and protect themselves from risk. However this
study has also found that the hotels in Northern Cyprus seem to be able to predict the
market activities of its competitors better than being able to predict the tastes and
preferences of customers and the legal, political and economic constraints (Table 12).
The second hypothesis (H2) which proposed that “Technology is related with budgeting
practices” was also supported with a positive relationship (r=.222). These findings
corroborate with those of Winata and Mia (2005) meaning that ease of access to internal
and external resources, capacity maximization and efficient data handling enables the
organization to increase its budgeting practices.
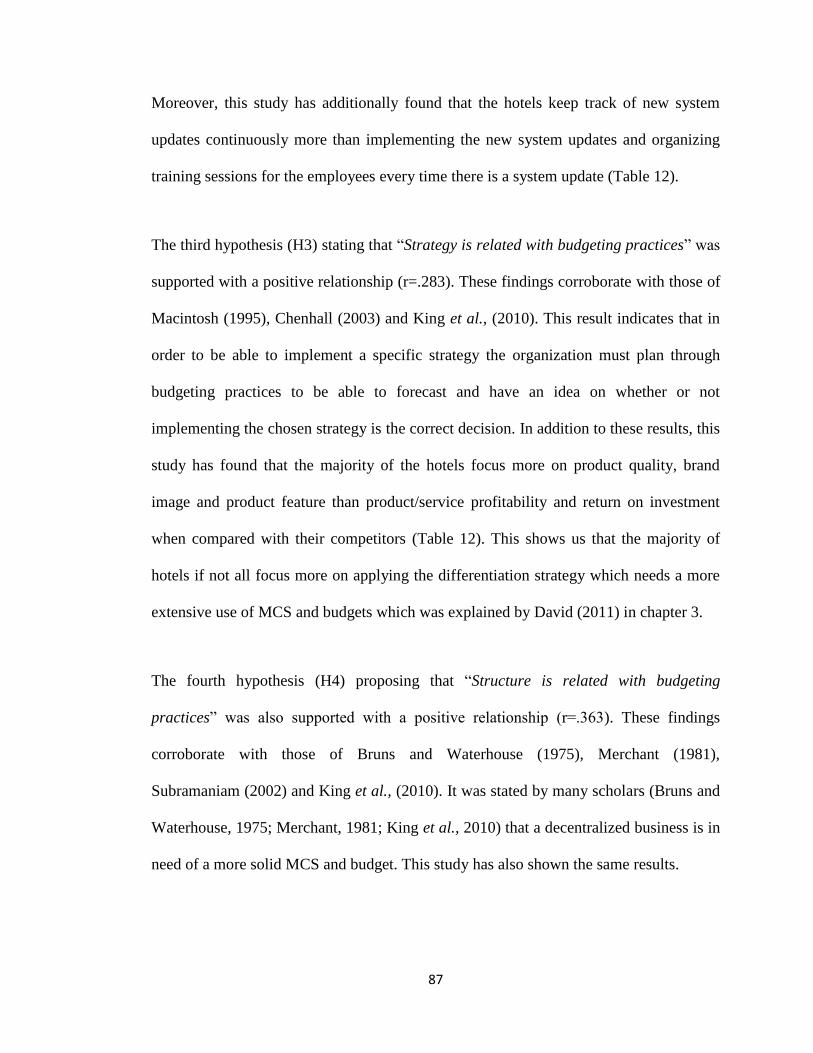
87
Moreover, this study has additionally found that the hotels keep track of new system
updates continuously more than implementing the new system updates and organizing
training sessions for the employees every time there is a system update (Table 12).
The third hypothesis (H3) stating that “Strategy is related with budgeting practices” was
supported with a positive relationship (r=.283). These findings corroborate with those of
Macintosh (1995), Chenhall (2003) and King et al., (2010). This result indicates that in
order to be able to implement a specific strategy the organization must plan through
budgeting practices to be able to forecast and have an idea on whether or not
implementing the chosen strategy is the correct decision. In addition to these results, this
study has found that the majority of the hotels focus more on product quality, brand
image and product feature than product/service profitability and return on investment
when compared with their competitors (Table 12). This shows us that the majority of
hotels if not all focus more on applying the differentiation strategy which needs a more
extensive use of MCS and budgets which was explained by David (2011) in chapter 3.
The fourth hypothesis (H4) proposing that “Structure is related with budgeting
practices” was also supported with a positive relationship (r=.363). These findings
corroborate with those of Bruns and Waterhouse (1975), Merchant (1981),
Subramaniam (2002) and King et al., (2010). It was stated by many scholars (Bruns and
Waterhouse, 1975; Merchant, 1981; King et al., 2010) that a decentralized business is in
need of a more solid MCS and budget. This study has also shown the same results.

88
However, this study has additionally found that the authority delegated to the
appropriate senior managers for the decision making of a group of decisions was very
high. These include decisions such as pricing decisions (highest authority), training
methods to be used, development of new products or services, budget allocations and
selection of large investments (Table 12). On the other hand, since the managers have
high authority in decision making this increases their responsibilities. As a result,
budgeting practices also increase with a more careful decision making process to control
the targets and aims of the organization which makes this study consistent with that of
Subramaniam (2002).
The fifth and last hypothesis (H5) which proposes that “Budgeting practices is related
with performance measurement” was partially accepted since BP was related with PM
however surprisingly negatively (r=.-164) which refutes the studies analyzed for this
research. However, regarding the purpose of budget use and the general performance of
the hotels, this study has found that the hotels in Northern Cyprus generally use budgets
for the motivation of managers more than for the evaluation of managers. It has also
been found that the majority of hotels have an 11 – 20% growth of sales revenue and 11
– 15% growth of net profit before taxes for the past 3 years.
6.3 Managerial Implications
Both the literature and the findings reveal the importance of the contingency variables
on budgeting practices and performance measurement which was the fundamental aim
of the research.
89
The findings of this study imply that the sample used may somehow lack knowledge
about budgeting and how to use a budget as a measurement of performance. Even
though the findings of a negative relationship between budgeting practices and
performance measurement was a disappointing factor, this may show us that MCS and
tools used for performance measurement may not have been included or fully covered in
tourism and hospitality programs. This factor could be the reason why the hotels in
Northern Cyprus face many problems when trying to increase their performance.
Therefore, it maybe suggested that the ministry of tourism, faculties and schools of
tourism and even the hoteliers association could arrange a program, course or seminar
on MCS and PM in order for the managers, employees and even students that want to be
in the sector to be aware of the importance of budgets and MCS when trying to measure
and increase performance.
6.4 Limitations and directions for future research
During the research of this study a number of limitations were identified. Firstly, this
study took into account 4 contingent variables; PEU, Technology, Structure and
Strategy. However, considering the relationships between the variables such as those in
Figure 6 (Chapter 3) and budgeting practices together with researching the relationships
between themselves would be beneficial.
Secondly, although the managers that were included in the study gave high rankings for
the variables, it is doubtful to what extent they are implemented. Therefore, not being
able to identify the extent of implementation maybe considered as a gap in the literature.

90
Thirdly, another limitation for the study occurred when gathering information for the
field work. One hotel refused to accept any questionnaires to be filled in by their
managerial team. In addition to this hotel, another hotels General Manager did not
accept the questionnaire to be filled once it was distributed.
Fourthly, the data was collected by distributing questionnaires therefore conducting
interviews or other types of data collection methods could have given richer and deeper
information about the variables considered in this study. Also having a limited time for
the data collection process was a limitation of this study.
Thus in future studies, examining the relationships of these variables between budgeting
practices and performance measurement using triangulation method for their data
collection and perhaps extending this process to a more longitudinal study would be a
significant contribution to the literature. Another direction could be that this study used
the contingency theory as its base therefore; trying to use other theories would also be a
contribution to the literature. In this way, we would gain more detailed and accurate
findings stating to what extent budgeting practices are done and whether or not they are
used as a tool for performance measurement.
91
REFERENCES
Adams, D. (1997), Management Accounting for the Hospitality Industry: A Strategic
Approach, Cassell
Ahmad, N.N.N., Suleiman, N., Alwi, N.M. (2003), Are budgets useful? A survey of
Malasyian Companies, Management Auditing Journal 18 (9), 717-724.
Altinay, L. and Paraskevas, A. (2008), Planning Research in Hospitality and Tourism,
Butterworth-Heinemann: Oxford.
Anthony, R.N. (1965), Planning and Control Systems: A framework for analysis,
Boston: Harvard Graduate School of Business.
Atkinson, H. (2006), Performance Measurement in International Hospitality Industry, in
Harris, P., and Mongiello, M., (2006), Accounting and Financial Management:
Developments in the International Hospitality Industry, Butterworth-
Heinemann, Oxford, pp. 46-70.
Bashir, M., Afzal, M.T., and Azeem, M. (2008), Reliability and Validity of Qualitative
and Operational Research Paradigm, Pakistan Journal of Statistics and
Operation Research, Vol. IV, No.1, pp. 35-45.
92
Bastian, E., and Muchlish, M. (2012), Perceived Environmen Uncertainty, Business
Strategy, Performance Measurement Systems and Organizational Performance,
Procedia – Social and Behavioral Sciences, 65, pp. 787 – 792.
Brander Brown, J. And McDonnell, B. (1995), The balanced scorecard: short term
guest or long term resident?, International Journal of Contemporary Hospitality
Management, Vol. 7, Nos, 2/3, pp. 7 – 11.
Brander Brown, J., McDonnell, B. and Lang, L. (1996), Performance measurement in
UK hotel organizations: towards a balanced scorecard?, Paper presented at the
council on Hotel, Restaurant and Institutional Education 50th
Annual
Conference, Washington, DC.
Brander Brown, J. and Atkinson, H. (2001), Budgeting in the Information Age,
International Journal of Contemporary Hospitality Management 13 (3), 136-
143.
Bruns, W., and Waterhouse, J. (1975), Budgetary control and organizational structure,
Journal of Accounting Research Autumn, 177 – 203.
Brynjolfsson, E. (1993), The productivity paradox of information technology,
Communication of the ACM, 36, pp. 67 – 77.
93
Buick, I. (2003), Information technology in small Scottish hotels: Is it working,
International Journal of Contemporary Hospitality Management, 15 (4), 243-
247.
Burns, R. B. (2000), Introduction to research methods, 4th
edn, London: Sage
Publications.
Cadez, S., Guilding, C. (2008), An exploratory investigation of an integrated
contingency model of strategic management accounting, Accounting,
Organization and Society, Vol. 33, No. 7/8, pp. 836 – 863.
Carenys, J. (2010), Management Control systems: A Historical Perspective,
International Bulletin of Business Administration, 7, pp. 37-54.
Chapman, P. M., Fairbrother, A., & Brown, D. (1998), A critical evaluation of safety
(uncertainty) factors for ecological risk assessment, Environmental Toxicology
and Chemistry, 17(1), pp. 99-108.
Charles, C. M. (1995), Introduction to educational research (2nd
ed.), San Diego,
Longman.
Chenhall, R. (2003), Management control systems design within its organizational
context: findings from contingency-based research and directions for the future,
Accounting, Organizations and Society 28, 127 - 168.
94
Chenhall, R . H., and Langfield-Smith, K. (1998), Factors influencing the role of
management accounting in the development of performance measures within
organizational change programs, Management Accounting Research, 9, 361 –
386.
Chenhall, R. H., & Morris, D. (1986), The impact of structure, environment, and
interdependence on the perceived usefulness of management accounting
systems, Accounting Review, pp. 16-35.
Chenhall, R., Morris, D. (1995), Organic decision and communication processes and
management accounting systems in entrepreneurial and conservative business
organizations, Omega, International Journal of Managements Science, 23 (5),
485 – 497.
Cottrell, T. (2012), Three phantom budget cuts and how to avoid them, The Bottom
Line: Managing Library Finances, Vol. 25, No. 1, pp. 16-20.
Creswell, J.W. (2007), Research Design: Qualitative, Quantitative and Mixed Methods
Approaches, (2nd Ed.), London, Sage Publications.
David, F. R. (2011), Strategic Management: Concepts and Cases, (13th Ed.), Pearson,
New – Jersey.
95
Davila, A., Foster, G. (2005), Management Accounting system adoption decisions:
evidence and performance implications from early-stage/startup companies.
The Accounting Review, 80 (4), 1039-1068.
Davila, T. (2005), An exploratory study on the emergence of management control
systems: formalizing human resources in small growing firms, Accounting,
Organizations and Society, 30, 223-248.
DeFranco, A. L. (2006), Benchmarking: measuring financial success in the hotel
industry, in Harris, P., and Mongiello, M., (2006), Accounting and Financial
Management: Developments in the International Hospitality Industry,
Butterworth-Heinemann, Oxford, pp. 87-104.
Denzin, N.K., and Lincoln, Y.S. (1994), Handbook of Qualitative Research, London:
Sage Publication.
Denzin, N.K., and Lincoln, Y.S. (1998) (Eds), Collecting and Interpreting Qualitative
Materials, Thousand Oaks, Sage Publication.
Dropkin, M., Halpin, J., & La Touche, B. (2011), The budget-building book for
nonprofits: A step-by-step guide for managers and boards, Vol. 5, Wiley. com.
Easterby-Smith, M., Thorpe, R., and Lowe, A. (1999), Management Research: An
Introduction, London: Sage Publications.
96
Elliott, J. (2005), Using Narrative in Social Research: Qualitative and Quantitative
Approaches, London: Sage.
Emmanuel, C., Otley, D., and Merchant, K. (1990), Accounting for management control,
Chapman and Hall, London.
Evans, J. R. (2004), An exploratory study of performance measurement systems and
relationships with performance results, Journal of Operations Management,
Vol. 22, pp. 219 – 232.
Ewusi – Mensah, K. (1981), The external organization environment and its impact on
management information systems, Accounting, Organizations and Society, pp.
301 – 316.
Ezzamel, M. (1990), The impact of environmental uncertainty, managerial autonomy
and size on budget characteristics, Management Accounting Research, 1(3), pp.
181-197.
Fisher, J. G. (1995), Contingency-based research on management control systems:
categorization by level of complexity, Journal of Accounting Literature, 14, 24 –
53.

97
Fisher, J. G. (1998), Contingency Theory, Management Control Systems and Firm
Outcomes: Past Results and Future Directions, Behavioural Research in
Accounting, Vol. 10, pp. 46 – 64.
Fitzgerald, L., Johnston, R., Brignall, S., Silvestro, R., and Voss, C. (1991),
Performance Measurement in Service Businesses, CIMA, London.
Flamholtz, E.G. (1983), Accounting, Budgeting and Control Systems in Their
Organizational Context: Theoretical and Empirical Perspectives, Accounting,
Organizations and Society, pp. 153-174.
Garces, S., Gorgemans, S., Sanchez, A.M., Perez, M.P. (2004), Implications of the
internet – an analysis of the Aragonese hospitality industry, Tourism
Management, 25, 603-613.
Geller, A.N. (1985), Tracing the critical success factors for hotel companies, The
Cornell HRA Quarterly, February, 76-81.
Ghosh, B.C., Chan, Y.K. (1997), Management Accounting in Singapore – well in place,
Management Auditing Journal 12 (1), 16-18.
Gill, J. And Johnson, P. (1997), Research Methods for Managers, (2nd ed.), London:
Paul Chapman Publishing.
98
Glaser, B., and Strauss, A. (1967), The Discovery of Grounded Theory, Chicago: Aldine
Golafshani, N. (2003), Understanding Reliability and Validity in Qualitative Research,
The Qualitative Report, Vol. 8, No. 2, pp. 597-607.
Gordon, L., and Miller, D. (1976), A contingency framework for the design of
accounting information systems, Accounting, Organizations and Society, pp. 59
– 69.
Gordon, L. A., and Narayanan, V. K. (1984), Management accounting systems,
perceived environmental uncertainty and organization structure: an empirical
investigation, Accounting, Organizations and Society, 1, pp. 33 – 47.
Gupta, A. K. And Govindarajan, V. (1984), Business unit strategy, managerial
characteristics, and business unit effectiveness at strategy implementation,
Academy of Management Journal, 25 – 41.
Haktanir, M., and Harris, P. (2005) Performance Measurement practice in an
independent hotel context: A case study approach, International Journal of
Contemporary Hospitality Management, Vol. 7, pp.347-67.
99
Haktanir, M. (2006), Performance Measurement in Independent Hotels, in Harris, P.,
and Mongiello, M., (2006), Accounting and Financial Management:
Developments in the International Hospitality Industry, Butterworth-
Heinemann, Oxford, pp. 3-21.
Harris, P. (2006), The profit planning framework: applying marginal accounting
techniques to hospitality services, in Harris, P., and Mongiello, M., (2006),
Accounting and Financial Management: Developments in the International
Hospitality Industry, Butterworth-Heinemann, Oxford, pp. 137-150.
Hayes, D. (1977), The contingency theory of managerial accounting, The Accounting
Review, pp. 22 – 39.
Hepworth, P. (1998), Weighing it up: a literature review for the balanced scorecard,
Journal of Management Development, Vol. 17, No. 8, pp. 559 – 563.
Herath, S. K. (2007), A framework for management control research, Journal of
Management Development, Vol. 26, No. 9, pp. 895 – 915.
Hoepfl, M.C. (1997), Choosing Qualitative Research: A Primer for Technology
Education Researchers, Journal of Technology Education, 9 (1), pp. 47-63.
Horngren, C.T., Sundem, G.L. and Stratton, W.O. (2002), Introduction to Management
Accounting, 12th edition, Prentice-Hall Int.
100
Horngren, C.T. (2004), Management Accounting: some comments, Journal of
Management Accounting Research, Vol. 19 No.3, pp.395-410.
Johansen, K., Karmarker, U., Seidmann, A. (1995), Business experience with computer
integrated manufacturing: empirical implications for industrial information
systems, Journal of Management, 12 (2), pp. 59 – 82.
Jones, T.A. (1998), UK hotel operators use of budgetary procedures, International
Journal of Contemporary Hospitality Management 10 (3), 96-100.
Jones, T.A. (2006), Budgetary practice within hospitality, in Harris, P., and Mongiello,
M., (2006), Accounting and Financial Management: Developments in the
International Hospitality Industry, Butterworth-Heinemann, Oxford, pp. 71-86.
Jones, T.A. (2008a), Changes in Hotel industry budgetary practice, International Journal
of Contemporary Hospitality Management 20 (4), 428-444.
Jones, T. A. (2008b), Improving hotel budgetary – A positive theory model, International
Journal of Hospitality Management, 27. pp. 529 – 540.
Joppe, M. (2000), The Research Process. Retrieved February 25, 1998, from
http://www.ryerson.ca/~mjoppe/rp.htm
101
Kaplan, R.S., and Norton, D.P. (1992), The balanced scorecard – Measures that drive
performance, Harvard Business Review (January - February), pp. 71-79.
Kennerley, M., and Neely, A. (2002), Performance measurement frameworks: a review,
in Neely, A. (ed.), Business Performance Measurement: Theory and Practice,
Cambridge University Press, Cambridge, pp. 145-155.
Kennerley, M., and Neely, A. (2004), Performance measurement frameworks: a review,
in Neely, A. (Ed), Business Performance Measurement: Theory and Practice,
Cambridge University Press, Cambridge.
Khandwalla, P.N. (1972), The Effect of Different Types of Competition on the Use of
Management Controls, Journal of Accounting Research, pp. 275-285.
King, R., Clarkson, P.M., and Wallace, S. (2010), Budgeting practices and performance
in small healthcare businesses, Management Accounting Research, 21, 40-55.
Kirk, D., and Pine, R. (1998), Research in hospitality systems and technology,
Hospitality Management, 17, 203 – 217.
Kollberg, B., Elg, M., and Lindmark, J. (2005), Design and Implementation of a
performance measurement system in swedish health care services: a multiple
case study of 6 development teams, Quality Management in Healthcare, 14 (2),
pp. 95 – 111.
102
Kosturakis, J. and Eyster, J. (1979), Operational budgeting in small hotel companies,
The Cornell Hotel and Restaurant Administration Quarterly, Vol. 19, No. 4, pp.
80 – 84.
Lancester, G. (2005), Research methods in management: a concise introduction to
research in management and business consultancy, Butterworth – Heinemann,
Oxford.
Langfield-Smith, K. (1997), Management control systems and strategy: a critical
review, Accounting Organizations and Society 22 (2), 207-232.
Lawrence, P. R. And Lorsch, J. W. (1967), Organization and Emvironment: Managing
Differentiation and Integration, Illinios, Irwin.
Liao, Y.S. (2005), Business Strategy and Performance: the role of human resources
management control”, Personnel Review, Vol. 34, Iss. 3, pp. 249-309.
Linn, M. (2007), Budget systems used in allocating resources to libraries, The bottom
Line: Managing Library Finances, Vol. 20, No. 1, pp. 20-29.
Lynch, R.L., and Cross, K.F. (1995), Measure Up! Yardsticks for continous
Improvement, Basil Blackwell, Oxford.
103
Macintosh, N. B. (1994), Management Accounting and Control Systems: An
organizational and Behavioral Approach, Wiley, Chichester.
Mack, N., Woodsong, C., MacQueen, K.M., Guest, G., Namey, E. (2005), Qualitative
Research Methods: A Data Collector’s Field Guide, Family Health
International, USA.
Malhotra, N.K. (2010), Marketing Research: An Applied Orientation, Pearson
Education, Inc., Prentice Hall.
Malmi, T., and Brown, D. (2008), Management control systems as a package –
opportunities, challenges and research directions, Management Accounting
Research, 19 (4), pp. 287 – 300.
Malone, T.W., Yates, J., Benjamin, R.I. (1987), Electronic markets and electronic
hierarchies, Communication of the ACM, 30, pp. 484 – 497.
McClelland, S.B. (1994), Training Needs Assessment Data-gathering Methods: Part 2 –
Individual Interviews, Journal of European Industrial Training, Vol. 18, Iss. 2,
pp. 27-31.
McQueen, R., and Knussen, C. (2002), Research Methods for Social Science: An
Introduction, Pearson Education Limited, London.
104
McMillan, J.H., and Schumacher, S. (2006), Research in Education: Evidence – Based
Inquiry, New York, Pearson Education, Inc.
Merchant, K.A. (1981), The design of the corporate budgeting system: influences on
managerial behaviour and performance, The Accounting Review, 813-829.
Miles, R. W., & Snow, C. C. (1978), Organizational Strategy, Structure, and Process,
New York: McGraw-Hill.
Miller, D., and Friesen, P. H. (1982), Innovation in conservative and entrepreneurial
firms: two models of strategic momentum, Strategic Management Journal, pp. 1
– 25.
Neely, A., Gregory, M. and Platts, K. (1995), Performance measurement system design:
a literature review and research agenda, International Journal of Operations and
Production Management, 15 (4), 80-116.
Neely, A., Mills, J., Platts, K., Richards, H., Gregory, M., Bourne, M., & Kennerley, M.
(2000), Performance measurement system design: developing and testing a
process-based approach, International Journal of Operations & Production
Management, 20(10), pp. 1119-1145.
Neuman, W. L. (1997), Social Research Methods, (2nd
edn), London, Allyn and Bacon.
105
Oak, S., and Schmidgall, R. S. (2009), Have budgetary controls in the US club industry
changed from the mid-1980s to the twenty-first century?, International Journal of
Contemporary Hospitality Management, Vol. 2, No. 4, pp. 411 – 421.
O’Connor, P., and Murphy, J. (2004), Reseach on information technology in the
hospitality industry, Hospitality Management, 23, pp. 473 – 484.
Otley, D. (1978), Budget Use and Managerial Performance, Journal of Accounting
Research, Vol. 18, No. 1 Spring, pp. 122 – 149.
Otley, D. T., and Berry, A. J. (1994), Case study research in management accounting
and control, Management Accounting Research, 5 (1), 45 – 65.
Otley, D. (1999), Performance management: a framework for management control
systems research, Management Accounting Research, 10, 363-382.
Ouchi, W.G. (1979), A Conceptual Framework for the Design of Organizational Control
Mechanisms, Management Science, pp. 833-849.
Pavlatos, O., Paggios, I. (2009), Management accounting practices in the Greek
hospitality industry, Managerial Auditing Journal 24 (1), 81-98.
106
Petty, N.J., Thomson, O. P., and Stew, G. (2012), Ready for a paradigm shift? Part 2:
Introducing qualitative research methodologies and methods, Manual Therapy,
Vol. 17, Iss. 5, pp. 378 – 384.
Philips, P. A. (1999), Performance measurement systems and hotels: a new conceptual
framewok, Hospitality Management, 18, pp. 171 – 182.
Porter, M. E. (1980), Competitive Strategy, New York: Free Press
Powel, T. C., and Dent-Mitcallef, A. (1997), Information technology as competitive
advantage: the role of human, business, and technology resources, Strategic
Management Journal, 18, pp. 375 – 406.
Robson, C. (2002), Real world research, 2nd
ed., Oxford: Blackwell.
Robson, C. (2011), Real world research, 3rd
ed., Chichester, Wiley.
Sackmann, A. S. (1991), Uncovering culture in organizations, Journal of applied
Behavioral Science, 27 (3), 295 – 317.
Saunders, M., Lewis, P., Thronhill, A. (2000), Research Methods for Business students,
2nd
edn, Pearson Education Limited, London.
107
Schein, E.H. (1992), Organizational Culture and Leadership, Jossey-Bass, San
Francisco.
Schmidgall, R., Borchgrevink, C. and Zahl-Begnum, O. (1996), Operations budgeting
practices of lodging firms in the United States and Scandinavia, International
Journey of Hospitality Management, Vol. 15 No. 2, pp. 189-203.
Sharma, D.S. (2002), The differential effect of environmental dimensionality, size, and
structure on budget system characteristics in hotels, Management Accounting
Research, 13, pp. 101-130.
Simons, R. (1987), Accounting control systems and business strategies: an empirical
analysis, Accounting Organizations and Society, 12 (4), 357 – 374.
Simons, R. (1995a), Control in an age of empowerment, Harvard Business Review, 67
(2), 80-88.
Simons, R. (1995b), Levers of control: How Managers Use Innovative Control Systems
to Drive Strategic Renewal, Harvard University Press, Boston, MA.
Simons, R. (2000), Performance Measurement & Control Systems for Implementing
Strategy, Prentice-Hall Inc.4, 205 – 228.
Spradley, J. (1979), The ethnographic intervie, New York: Holt, Rinehart and Winston
108
Subramaniam, N., McManus, L., and Mia, L. (2002), Enhancing hotel managers’
organizational commitment: an investigation of the impact of structure, need for
achievement and participative budgeting, Hospitality Management, 21, pp. 303 –
320.
Tessier, S., Otley, D. (2012), A conceptual development of Simons’ Levers of Control
framework, Management Accounting Research, Vol. 23, Iss. 3, pp. 171 – 185.
Tse, A. C. B. (2003), Disintermediation of travel agents in the hotel industry,
International Journal of Hospitality Management, 22, pp. 453 – 460.
Tymon, W. G., Stout, D. E., & Shaw, K. N. (1998), Critical analysis and
recommendations regarding the role of perceived environmental uncertainty in
behavioural accounting research, Behavioural Research in Accounting, 10, pp.
23-46.
Weill, P. (1992), The relationship between investment in information technology and
firms performance: a study of the valve manufacturing sector, Information
Systems Research, 3, pp. 307 – 333.
Winata, L., and Mia, L. (2005), Information technology and the performance effect of
managers’ participation in budgeting: evidence from the hotel industry,
Hospitality Management, 24, pp. 21 – 39.
109
Wood, R. (1999), Traditional and alternative research philosophies. In B. Brotherton
(ed.), The Handbook of Contemporary Hospitality Management Research, New
York, NY: John Wiley & Sons Ltd, pp. 3 – 18.
Yahya, M. N., Ahmad, N. N. N., and Fatima, A. H. (2008), Budgetary participation and
performance: some malaysian evidence, International Journal of Public Sector
Management, Vol. 21, Iss. 6, pp. 658 – 673.
www.oppapers.com
www.ehow.com

110
APPENDIX

111
Dear respondent,
This research is aimed to understand the effect of contextual variables in Management
Control Systems on budgeting practices and business performance within the four and
five star hotels in the TRNC. This study is aimed to benefit from the experiences and
ideas of the General Managers, Human Resource Managers, Accounting/Finance
Managers, Marketing Managers and Front Office Managers.
Each of the questions in the questionnaire is a judgement. Therefore there is no right or
wrong answer for these questions. All responses and response identities will be
confidential. The approximate response time for this questionnaire is 20 minutes. We
thank you for your participation in this study.
Research Team:
Asst. Prof. Dr. Mine HAKTANIR
Dilem Ramadan
Eastern Mediterranean University
Faculty of Tourism
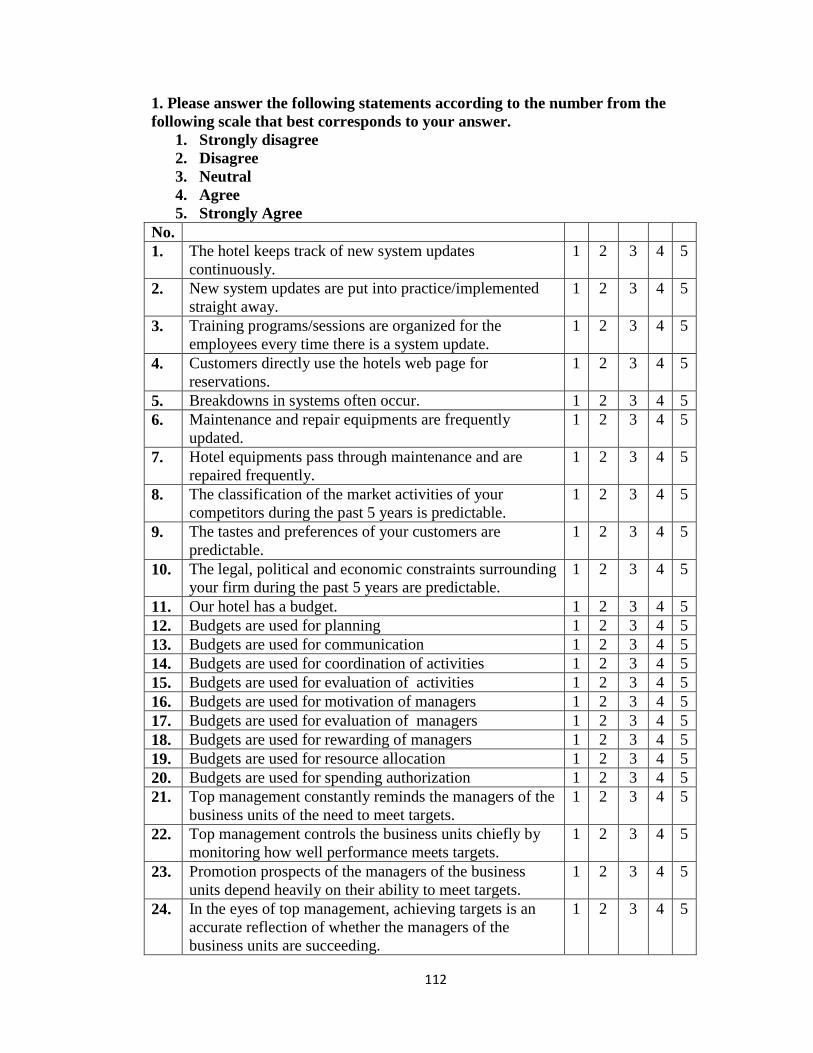
112
1. Please answer the following statements according to the number from the
following scale that best corresponds to your answer.
1. Strongly disagree
2. Disagree
3. Neutral
4. Agree
5. Strongly Agree
No.
1. The hotel keeps track of new system updates
continuously.
1 2 3 4 5
2. New system updates are put into practice/implemented
straight away.
1 2 3 4 5
3. Training programs/sessions are organized for the
employees every time there is a system update.
1 2 3 4 5
4. Customers directly use the hotels web page for
reservations.
1 2 3 4 5
5. Breakdowns in systems often occur. 1 2 3 4 5
6. Maintenance and repair equipments are frequently
updated.
1 2 3 4 5
7. Hotel equipments pass through maintenance and are
repaired frequently.
1 2 3 4 5
8. The classification of the market activities of your
competitors during the past 5 years is predictable.
1 2 3 4 5
9. The tastes and preferences of your customers are
predictable.
1 2 3 4 5
10. The legal, political and economic constraints surrounding
your firm during the past 5 years are predictable.
1 2 3 4 5
11. Our hotel has a budget. 1 2 3 4 5
12. Budgets are used for planning 1 2 3 4 5
13. Budgets are used for communication 1 2 3 4 5
14. Budgets are used for coordination of activities 1 2 3 4 5
15. Budgets are used for evaluation of activities 1 2 3 4 5
16. Budgets are used for motivation of managers 1 2 3 4 5
17. Budgets are used for evaluation of managers 1 2 3 4 5
18. Budgets are used for rewarding of managers 1 2 3 4 5
19. Budgets are used for resource allocation 1 2 3 4 5
20. Budgets are used for spending authorization 1 2 3 4 5
21. Top management constantly reminds the managers of the
business units of the need to meet targets.
1 2 3 4 5
22. Top management controls the business units chiefly by
monitoring how well performance meets targets.
1 2 3 4 5
23. Promotion prospects of the managers of the business
units depend heavily on their ability to meet targets.
1 2 3 4 5
24. In the eyes of top management, achieving targets is an
accurate reflection of whether the managers of the
business units are succeeding.
1 2 3 4 5
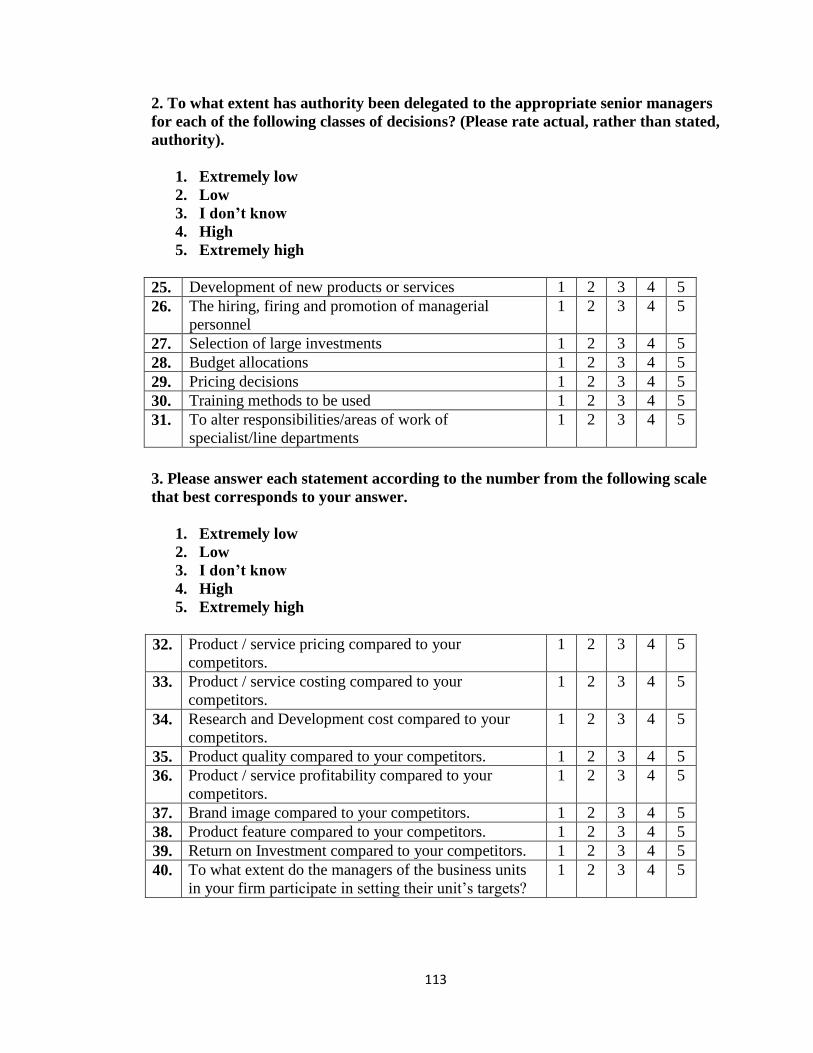
113
2. To what extent has authority been delegated to the appropriate senior managers
for each of the following classes of decisions? (Please rate actual, rather than stated,
authority).
1. Extremely low
2. Low
3. I don’t know
4. High
5. Extremely high
25. Development of new products or services 1 2 3 4 5
26. The hiring, firing and promotion of managerial
personnel
1 2 3 4 5
27. Selection of large investments 1 2 3 4 5
28. Budget allocations 1 2 3 4 5
29. Pricing decisions 1 2 3 4 5
30. Training methods to be used 1 2 3 4 5
31. To alter responsibilities/areas of work of
specialist/line departments
1 2 3 4 5
3. Please answer each statement according to the number from the following scale
that best corresponds to your answer.
1. Extremely low
2. Low
3. I don’t know
4. High
5. Extremely high
32. Product / service pricing compared to your
competitors.
1 2 3 4 5
33. Product / service costing compared to your
competitors.
1 2 3 4 5
34. Research and Development cost compared to your
competitors.
1 2 3 4 5
35. Product quality compared to your competitors. 1 2 3 4 5
36. Product / service profitability compared to your
competitors.
1 2 3 4 5
37. Brand image compared to your competitors. 1 2 3 4 5
38. Product feature compared to your competitors. 1 2 3 4 5
39. Return on Investment compared to your competitors. 1 2 3 4 5
40. To what extent do the managers of the business units
in your firm participate in setting their unit’s targets?
1 2 3 4 5
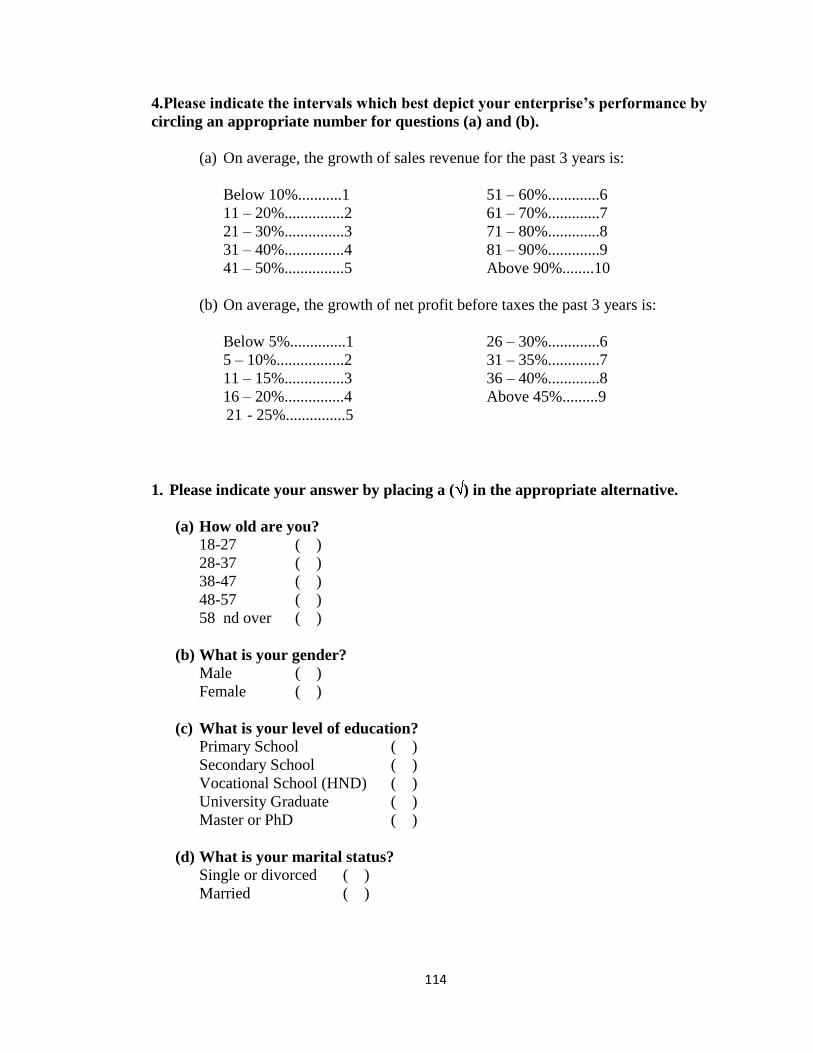
114
4.Please indicate the intervals which best depict your enterprise’s performance by
circling an appropriate number for questions (a) and (b).
(a) On average, the growth of sales revenue for the past 3 years is:
Below 10%...........1 51 – 60%.............6
11 – 20%...............2 61 – 70%.............7
21 – 30%...............3 71 – 80%.............8
31 – 40%...............4 81 – 90%.............9
41 – 50%...............5 Above 90%........10
(b) On average, the growth of net profit before taxes the past 3 years is:
Below 5%..............1 26 – 30%.............6
5 – 10%.................2 31 – 35%.............7
11 – 15%...............3 36 – 40%.............8
16 – 20%...............4 Above 45%.........9
21 - 25%...............5
1. Please indicate your answer by placing a ( ) in the appropriate alternative.
(a) How old are you?
18-27 ( )
28-37 ( )
38-47 ( )
48-57 ( )
58 nd over ( )
(b) What is your gender?
Male ( )
Female ( )
(c) What is your level of education?
Primary School ( )
Secondary School ( )
Vocational School (HND) ( )
University Graduate ( )
Master or PhD ( )
(d) What is your marital status?
Single or divorced ( )
Married ( )
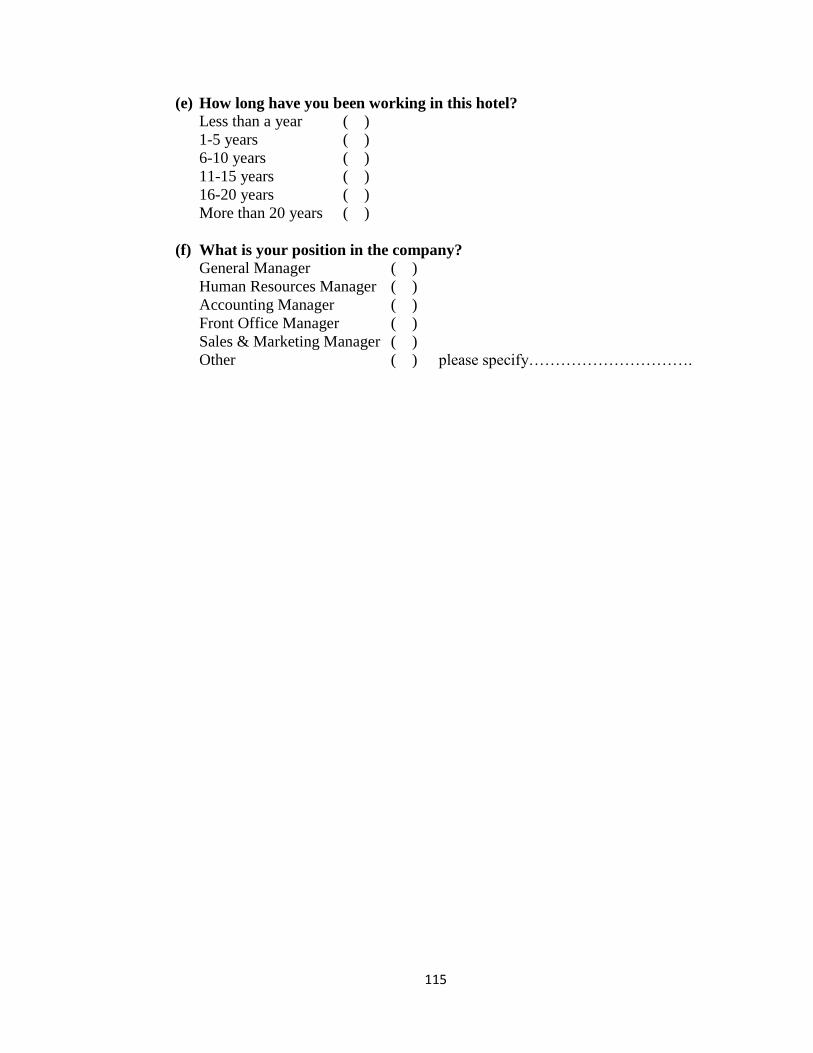
115
(e) How long have you been working in this hotel?
Less than a year ( )
1-5 years ( )
6-10 years ( )
11-15 years ( )
16-20 years ( )
More than 20 years ( )
(f) What is your position in the company?
General Manager ( )
Human Resources Manager ( )
Accounting Manager ( )
Front Office Manager ( )
Sales & Marketing Manager ( )
Other ( ) please specify………………………….
