building a green supply chain - dbguide.net · · 2008-10-27gillette samsung electronics sprint...
TRANSCRIPT
© 2008 IBM Corporation
No part of it may be circulated, quoted, or reproduced for distribution without prior written approval from IBM GBS
IBM Global Business Services
Building a Green Supply Chain
Frank KangIBM Global Supply Chain Innovation Center
October 10, 2008

IBM Global Business Services
1 © Copyright IBM Corporation 2008
Frank Kang, Global Supply Chain Innovation Center Leader
Associate Partner, IBM Global Business Services
Education:M.S., B.S., Cornell University, USA
Select Clients Served:MotorolaGilletteSamsung ElectronicsSprintAmwayCiscoWarner-Lambert
Specializations:Supply chain optimizationCustomer relationship managementStrategy consultingBusiness process redesignIT functional designOrganization change
Frank is an Associate Partner and leads IBM’s Global Supply Chain Innovation Center. He has more than 16 years experience in SCM and strategy consulting in the Electronics, Consumer Packaged Goods, Retail, Industrial Products, and Telecommunications Industries. Within SCM, he has extensive experience in supply chain strategy, supply and demand planning, new product development, vendor and channel partner management and IT strategy. Prior to IBM, Frank was employed by PwC Consulting and Booz, Allen & Hamilton.Some of his relevant projects include:
Project Leader for Operations Strategy – Global Consumer Electronics Client. Created and implemented global, cross-functional peformance metrics for a market leader in the electronics industry. The metrics spanned financial, customer satisfaction, internal productivity and business controls across the client, supply chain partners and final customers. This will result in the ultimate creation of a global performance metric scorecard to monitor and proactively address potential performance shortfalls.. Project Leader for Supply Chain Strategy – Global Consumer Electronics Client. For a Global 100 electronics manufacturer, developed the supply chain planning and execution strategy needed to improve poor customer on-time delivery performance. The scope included: 1) redesigning the forecasting and product planning processes 2) creating a new customer care vision and sales force automation tools 3) developing an e-business vision of an extended network of internal and external collaboration. The project resulted in a 35-45% customer order fulfillment lead time reduction and greater overall customer satisfactionProject Leader for Logistics Strategy – Global 500 Consumer Products Manufacturer. Reconfigured the global distribution network to increase customer service by over 20% while reducing inventory by 50%; the scope included determining facility locations, inventory consolidation opportunities, end-to-end product logistics at the SKU level, and deferred manufacturing and packaging optionsProject Leader for Inventory and Procurement Strategy – Global 500 Consumer Products Manufacturer. Developed and implemented forecasting, economic order quantity, and inventory disposal models to enable the client to reduce overall inventory by over 20% and operational expenses by over 25%; recommended vendor procurement strategies to increase corporate cashflow by consolidating the purchasing activities of all business groups and by realizing methods for restructuring vendor prices

IBM Global Business Services
2 © Copyright IBM Corporation 2008
Agenda
Case Studies2
IBM Carbon Point of View1
IBM Global Business Services
3 © Copyright IBM Corporation 2008
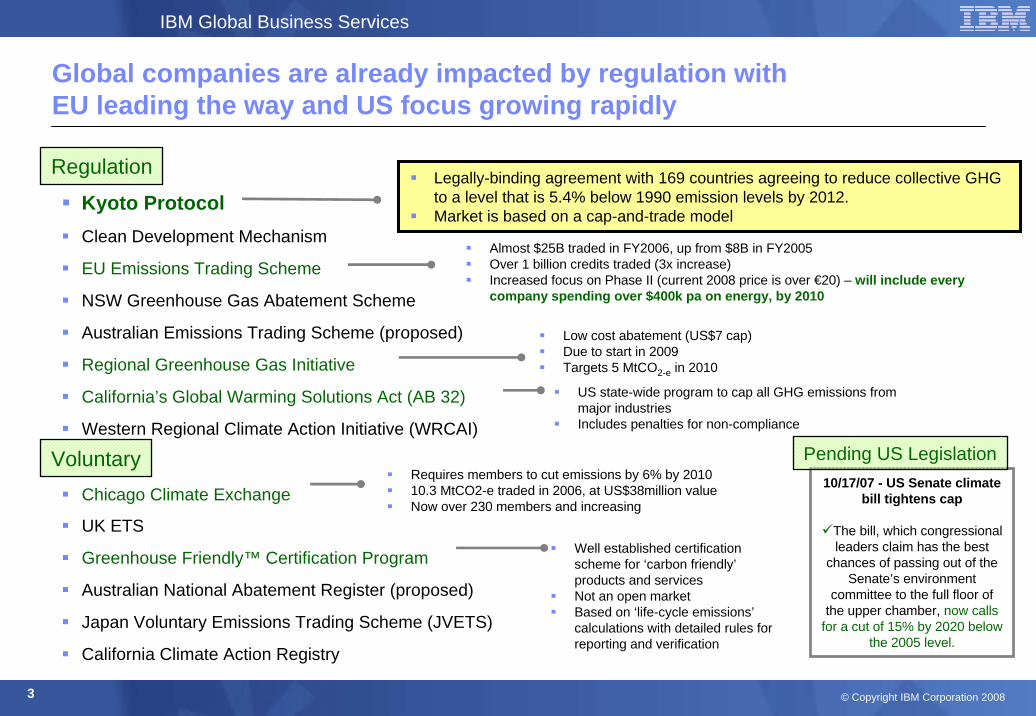
Global companies are already impacted by regulation with EU leading the way and US focus growing rapidly
Kyoto ProtocolClean Development Mechanism
EU Emissions Trading Scheme
NSW Greenhouse Gas Abatement Scheme
Australian Emissions Trading Scheme (proposed)
Regional Greenhouse Gas Initiative
California’s Global Warming Solutions Act (AB 32)
Western Regional Climate Action Initiative (WRCAI)
Chicago Climate Exchange
UK ETS
Greenhouse Friendly™ Certification Program
Australian National Abatement Register (proposed)
Japan Voluntary Emissions Trading Scheme (JVETS)
California Climate Action Registry
Legally-binding agreement with 169 countries agreeing to reduce collective GHG to a level that is 5.4% below 1990 emission levels by 2012. Market is based on a cap-and-trade model
Almost $25B traded in FY2006, up from $8B in FY2005Over 1 billion credits traded (3x increase)Increased focus on Phase II (current 2008 price is over €20) – will include every company spending over $400k pa on energy, by 2010
Low cost abatement (US$7 cap)Due to start in 2009Targets 5 MtCO2-e in 2010
Regulation
VoluntaryRequires members to cut emissions by 6% by 201010.3 MtCO2-e traded in 2006, at US$38million valueNow over 230 members and increasing
Well established certification scheme for ‘carbon friendly’products and servicesNot an open marketBased on ‘life-cycle emissions’calculations with detailed rules for reporting and verification
US state-wide program to cap all GHG emissions from major industries Includes penalties for non-compliance
10/17/07 - US Senate climate bill tightens cap
The bill, which congressional leaders claim has the best
chances of passing out of the Senate’s environment
committee to the full floor of the upper chamber, now calls
for a cut of 15% by 2020 below the 2005 level.
Pending US Legislation
IBM Global Business Services
4 © Copyright IBM Corporation 2008
“Our company is investing extensively in corporate social responsibility. We need to be a reference in this domain. As the leader of the luxury industry, we have to stay ahead.”Yves Carcelle, Chairman and CEO, Louis Vuitton
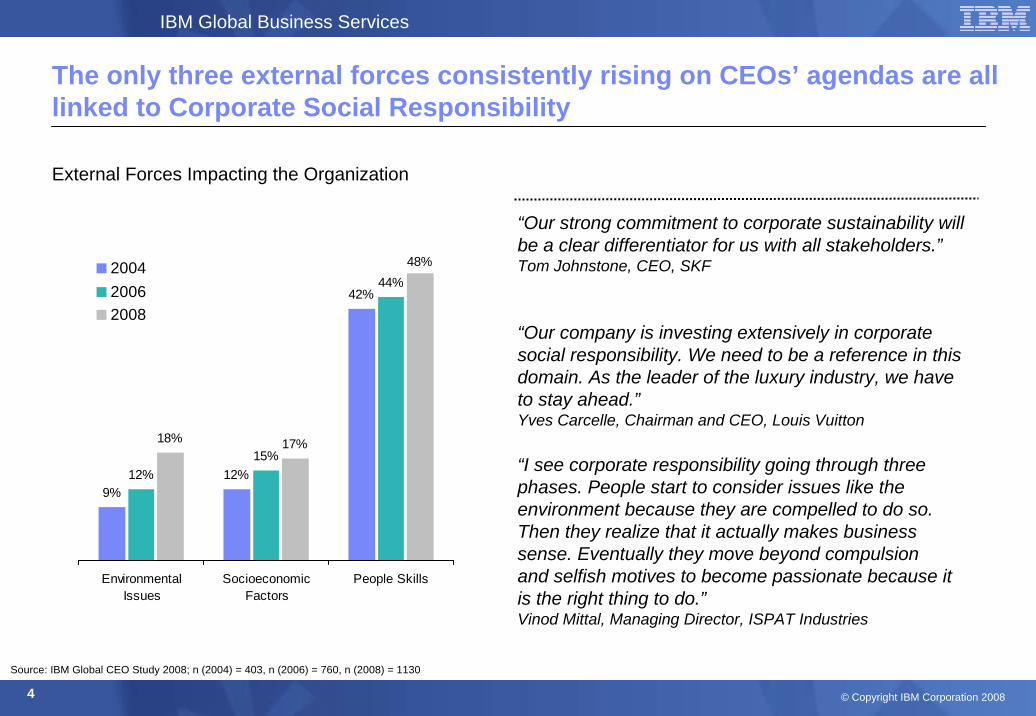
The only three external forces consistently rising on CEOs’ agendas are all linked to Corporate Social Responsibility
9%12%
42%
12%15%
44%
18% 17%
48%
EnvironmentalIssues
SocioeconomicFactors
People Skills
200420062008
Source: IBM Global CEO Study 2008; n (2004) = 403, n (2006) = 760, n (2008) = 1130
“Our strong commitment to corporate sustainability will be a clear differentiator for us with all stakeholders.”Tom Johnstone, CEO, SKF
“I see corporate responsibility going through three phases. People start to consider issues like the environment because they are compelled to do so. Then they realize that it actually makes business sense. Eventually they move beyond compulsionand selfish motives to become passionate because it is the right thing to do.”Vinod Mittal, Managing Director, ISPAT Industries
External Forces Impacting the Organization

IBM Global Business Services
5 © Copyright IBM Corporation 2008
8%11% 12%
2004 2006 2008
Americas
15%13%
21%
2004 2006 2008
EMEA
8%12%
21%
2004 2006 2008
Asia Pacific
9%
12%
18%
2004 2006 2008
CEO-focus on environmental issues has doubled globally with strong difference between Geos
Concern about Environmental Issues
Global“As the world becomes more "green", we can replace a plastic-based music distribution system with a waste-free music distribution system.”Chris Gorog, CEO, Napster
“We must double our investment in environmental areas.”CEO, Industrial Products Company, Sweden
“Environmental issues are driving entry into new market segments as avenues of growth.”President and CEO, Automotive Company, Australia
Source: IBM Global CEO Study 2008; n (2004) = 403, n (2006) = 760, n (2008) = 1130

IBM Global Business Services
6 © Copyright IBM Corporation 2008
Majority of CEOs see CSR as an opportunity, not a threat, and plan to significantly invest in CSR to integrate with society
Investment past 3years
Investment next 3years
Increasing customer expectations of corporate social responsibility
“The consumer’s concept of quality will no longer be measured by only the physical attributes of a product — it will extend to the process of how the product is made, including product safety, environmental compliance and social responsibility compliance.”Victor Fung, Chairman, Li & Fung
25 %INCREASE
10.7%13.4%
No impact 20%
Positive impact 69%
Negative impact 11%
Source: IBM Global CEO Study 2008, n = 609; * Total investments: all asset investments + all investments in R&D, marketing and sales

IBM Global Business Services
7 © Copyright IBM Corporation 2008
New products and services are top of mind for CSR-focused CEOs
Focus areas to benefit form increasing customer expectations of corporate social responsibility
New Products / ServicesEnvironmental Initiatives
New Operations
New Segments
New Channels
New Markets
New Business Relationships
Transparency
9%
8%
3%
3%
1%
1%
6%
9%Lower Focus*
Higher Focus*
Source: IBM Global CEO Study 2008, n = 180; * Difference between the response of CSR-focused CEOs and the entire sample

IBM Global Business Services
8 © Copyright IBM Corporation 2008
IBM’s “House of Carbon” approach facilitates a structured, comprehensive, and integrated model for carbon management
Strategy
People Information Products and Services
IT Property Supply Chain

IBM Global Business Services
9 © Copyright IBM Corporation 2008
• How can product design make better trade-offs between design requirements, including carbon footprint?
• What tools & practices should be employed by co’s wanting to establish leadership?
• What are the carbon impacts throughout the product’s lifecycle, and how can they be minimized upfront through smart design?
• How can the total network be optimized considering service, cost, “green”tradeoffs
• What CO2 impact is there from various inventory concepts & planning methodologies
• Are there opportunities to reduce cost and carbon emission at the same time?
• How can we best measure a supplier’s carbon impact (product, packaging, upstream logistics) and ultimately compliance with carbon reduction requirement?
• What sourcing strategies will result in a better trade-off of cost, service levels, carbon emission?
• How should we evaluate carbon offsets?
• What operations strategy (facility location, operating model) provides the best trade-off between cost, service, carbon?
• Is there a role for sustainable factory / facility mgmt?
• Can lean manufacturing and 6-sigma approaches be used to manage carbon?
• Is there a role for Manufacturing Execution Software in the mgmt of carbon?
• What distribution network strategy (facility locations, sizes, transport modes) provides the best tradeoff of cost, service and carbon?
• How can packaging be reduced and recycled?
• What is the impact of increased load consolidation, and is this practical?
• What role can alternative fuel or power sources play?
• How can field service operations reduce carbon footprint with better routing and parts inventory tracking?
• Is there a mechanism to drive continuous design improvement from service back to product design and engineering?
• Are all strategies being employed to reduce landfilled materials: reuse, refurbishing, recycling, secondary markets?
Flows: Product, Process, Information, Cash
SC Strategy Procurement LogisticsIntegrated Ops Integrated Ops
Plan Source Make DeliverDesign Service & End-of-Life
Asset Management
Finance
Sustainable facilities management: Green building & renewable energy; carbon footprint asset management; Asset utilization (Real-time data on energy usage; Carbon dashboard)
Paperwork Reduction; Environmental Cost Accounting; Environmental Tax Benefits Tracking
Suppliers & Manufacturers
Customers & Channels
PLM
Everywhere! Supply Chain activities create significant carbon emissions, making supply chain an important focus for clients seeking to reduce their
carbon footprint
Where is the Carbon in the Supply Chain?

IBM Global Business Services
10 © Copyright IBM Corporation 2008
Companies must balance carbon as a new trade-off in the supply chain to succeed in the 21st century
Typical supply chain optimization only considers the direct monetary costs
Different areas of supply chain present different options for becoming more sustainable and managing carbon more effectively
All areas of supply chain are interconnected and dependent on one-another- Local optimization efforts can adversely affect
other supply chain areas- Holistic approach is best for analyzing impact of
carbon
An optimized supply chain in the 21st century quantifies both the cost and the carbon impact of various supply chain policies.
Balancing Cost, Quality, Service and now…Carbon

IBM Global Business Services
11 © Copyright IBM Corporation 2008
Illustrative Trade-off Analysis: Quantifying the impact of shipment frequency on cost, inventory replenishment policy and “green”
Inventory
Inventory
Shipment
size
Inventory
Transportation
cost
Carbon in
transportation
Carbon in
warehousing
Vehiclesize
Inventory
Transportation cost
Carbon in
transportation
Carbon in
warehousing
Inventorycost
Inventorycost
Scenario 1LOW shipment frequency
Scenario 2HIGH shipment frequency
IBM Global Business Services
12 © Copyright IBM Corporation 2008
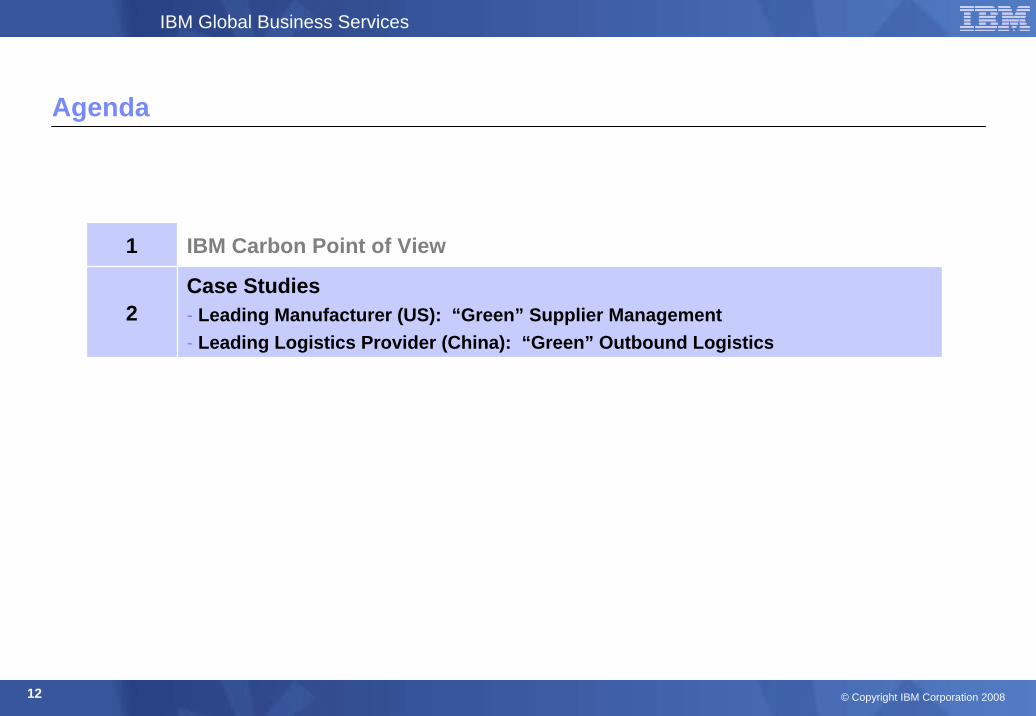
Agenda
Case Studies- Leading Manufacturer (US): “Green” Supplier Management- Leading Logistics Provider (China): “Green” Outbound Logistics
2
IBM Carbon Point of View1

IBM Global Business Services
13 © Copyright IBM Corporation 2008
Case Study
“Green” Supplier Management
IBM Global Business Services
14 © Copyright IBM Corporation 2008
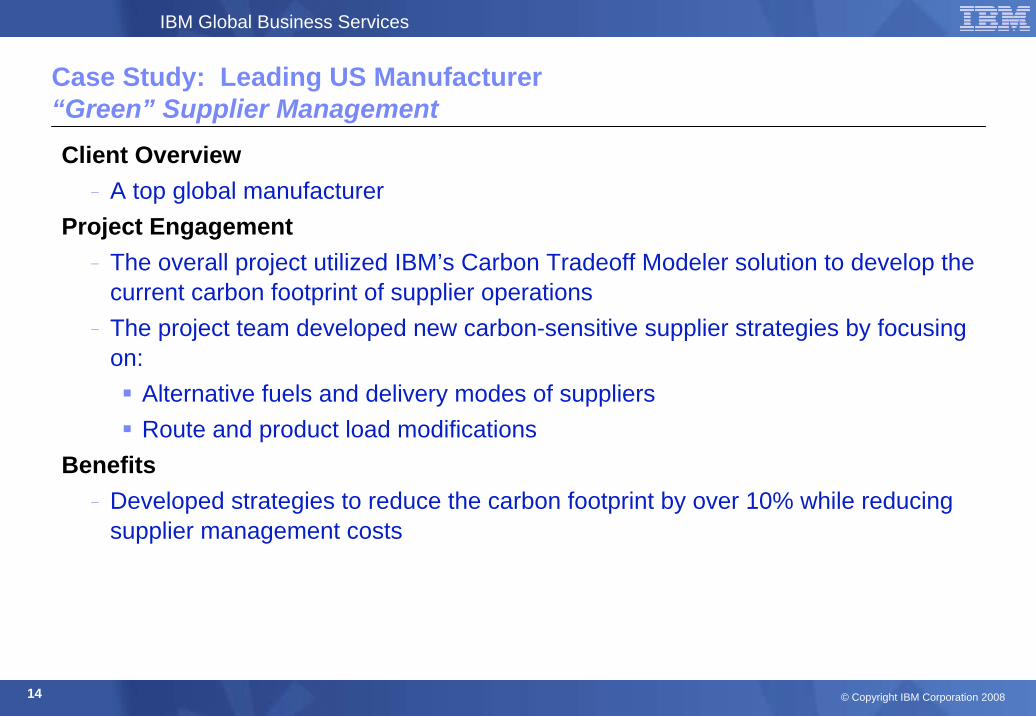
Client Overview- A top global manufacturer
Project Engagement- The overall project utilized IBM’s Carbon Tradeoff Modeler solution to develop the
current carbon footprint of supplier operations- The project team developed new carbon-sensitive supplier strategies by focusing
on:Alternative fuels and delivery modes of suppliers Route and product load modifications
Benefits- Developed strategies to reduce the carbon footprint by over 10% while reducing
supplier management costs
Case Study: Leading US Manufacturer“Green” Supplier Management

IBM Global Business Services
15 © Copyright IBM Corporation 2008
This setup will reduce carbon footprintThis setup will reduce transportation costThis setup will reduce miles traveled but increase average inventory
Combine 2 consecutive weekly shipments of item A1 from Supplier A in a bi-weekly shipment of the combined quantities
Preliminary AnalysisPreliminary AnalysisDescriptionDescription
ToTo--BeBeAsAs--IsIs
“Green” Supplier ManagementScenario Analysis # 1 – Same Supplier / Same Item (less miles)
Supplier A Supplier B
A1 A2 A3 B1 B2 B3
Maintown, USA
W/H Plant
Week 1200 Units
Week 2150 Units
Week 3300 Units
Week 4100 Units
Supplier A Supplier B
A2 A3 B1 B2 B3
Maintown, USA
W/H Plant
Week 1350 Units
Week 3400 Units
A1

IBM Global Business Services
16 © Copyright IBM Corporation 2008
This setup will reduce carbon footprintThis setup will reduce transportation costAverage inventory will increase if different shipments dates are combined
Consolidate partial shipments of various items from a particular supplier in a single shipment
Preliminary AnalysisPreliminary AnalysisDescriptionDescription
ToTo--BeBeAsAs--IsIs
“Green” Supplier ManagementScenario Analysis # 2 – Same Supplier / Many Items (less miles)
Supplier A Supplier B
A1 A2 A3 B1 B2 B3
Maintown, USA
W/H Plant
Supplier A Supplier B
A2 A3 B1 B2 B3
Maintown, USA
W/H Plant
A1
A3
A3A
1A
1
A2
A2
B 1B 1B 2
B 3
A3
A2
A1
B 1 B2B 3

IBM Global Business Services
17 © Copyright IBM Corporation 2008
This setup is likely to reduce total miles traveledThis setup will reduce carbon footprint and transportation costAverage inventory will increase if different shipments dates are combined
Consolidate shipments from various suppliers using a Milkrun approach (applied to logical supplier locations)
Preliminary AnalysisPreliminary AnalysisDescriptionDescription
ToTo--BeBeAsAs--IsIs
“Green” Supplier ManagementScenario Analysis # 3 – Many Suppliers / Many Items
Supplier A
Supplier D
Maintown, USA
W/H Plant
Supplier B
Supplier C
Supplier ESupplier A
Supplier D
Maintown, USA
W/H Plant
Supplier B
Supplier C
Supplier E

IBM Global Business Services
18 © Copyright IBM Corporation 2008
“Green” Supplier ManagementScenario Analysis Output
Identify top operational actions based on overall carbon reduction potential
Compare sourcing options by carbon, cost and business metrics
IBM Global Business Services
19 © Copyright IBM Corporation 2008
Case Study
“Green” Outbound Logistics
IBM Global Business Services
20 © Copyright IBM Corporation 2008
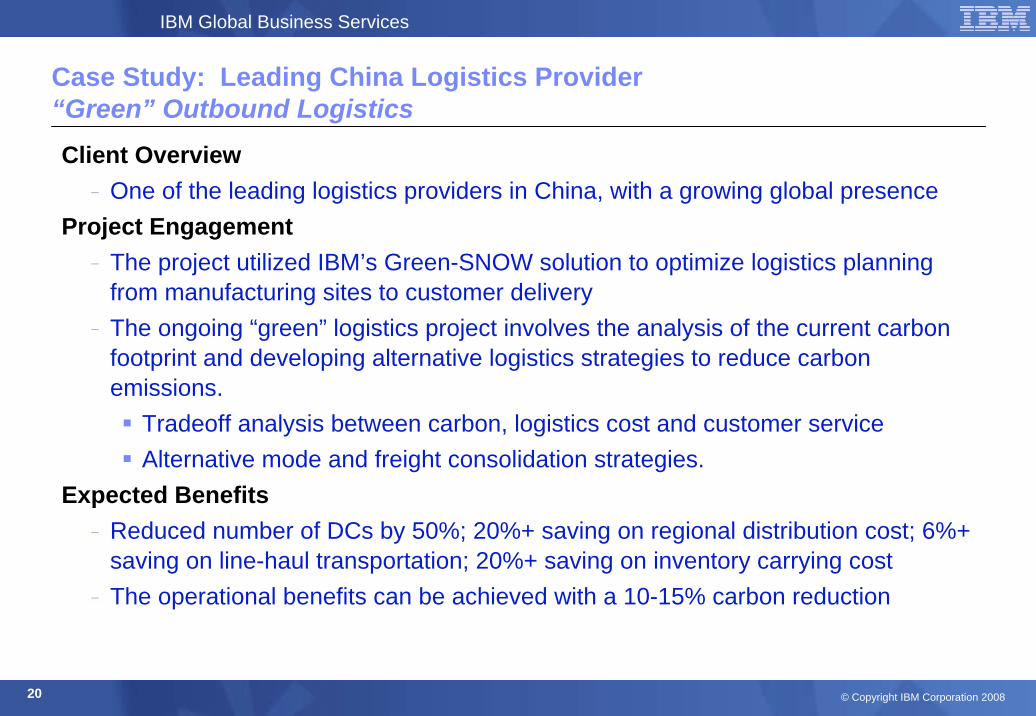
Client Overview- One of the leading logistics providers in China, with a growing global presence
Project Engagement- The project utilized IBM’s Green-SNOW solution to optimize logistics planning
from manufacturing sites to customer delivery- The ongoing “green” logistics project involves the analysis of the current carbon
footprint and developing alternative logistics strategies to reduce carbon emissions.
Tradeoff analysis between carbon, logistics cost and customer serviceAlternative mode and freight consolidation strategies.
Expected Benefits- Reduced number of DCs by 50%; 20%+ saving on regional distribution cost; 6%+
saving on line-haul transportation; 20%+ saving on inventory carrying cost- The operational benefits can be achieved with a 10-15% carbon reduction
Case Study: Leading China Logistics Provider“Green” Outbound Logistics

IBM Global Business Services
21 © Copyright IBM Corporation 2008
“Green” Outbound LogisticsBaseline Model: Customer Demand Distribution
IBM Global Business Services
22 © Copyright IBM Corporation 2008
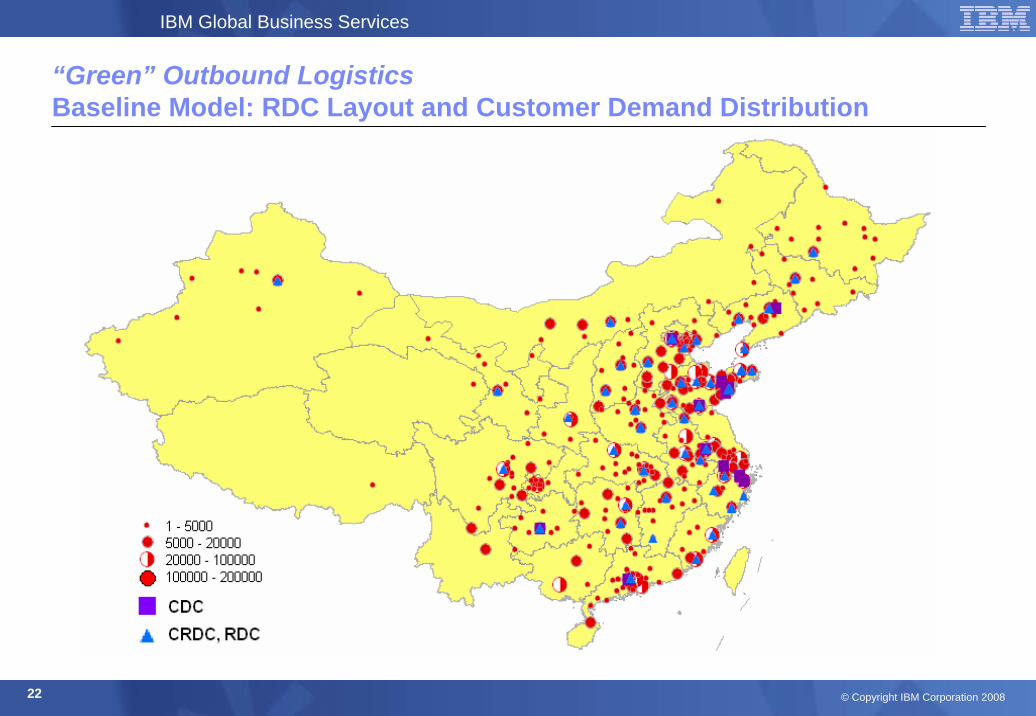
“Green” Outbound LogisticsBaseline Model: RDC Layout and Customer Demand Distribution

IBM Global Business Services
23 © Copyright IBM Corporation 2008
“Green” Outbound LogisticsBaseline Model: Multi-modes of Logistics Transportation
Line-Haul Transportation Direct Ship
Inter-Warehouse Transfer Secondary Distribution
IBM Global Business Services
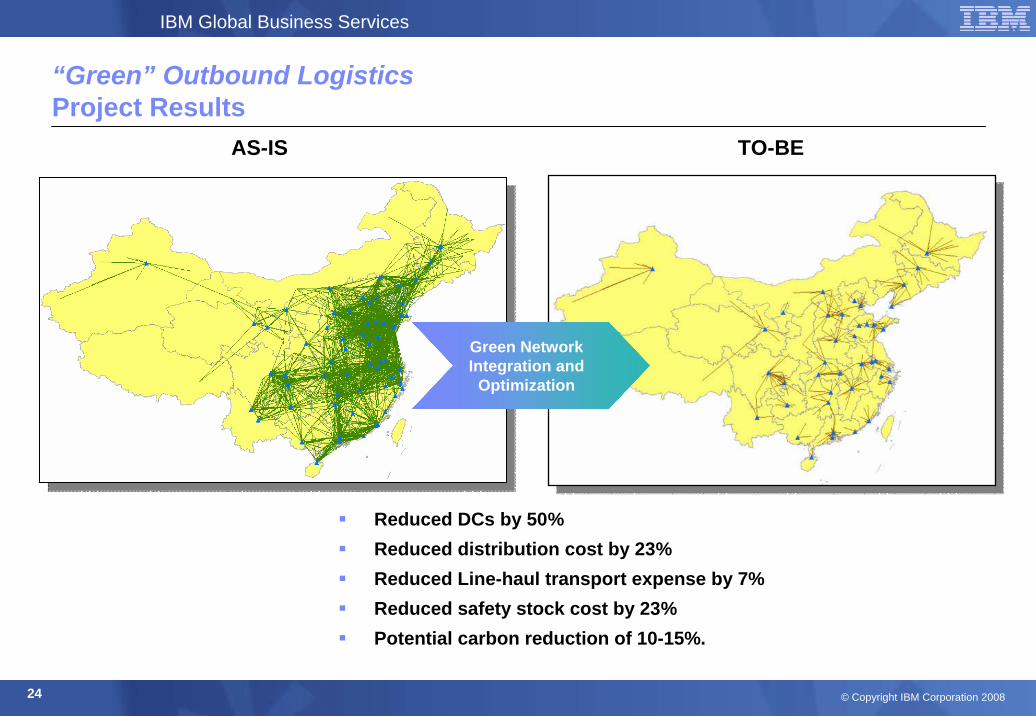
24 © Copyright IBM Corporation 2008
“Green” Outbound LogisticsProject Results
Green Network Integration and
Optimization
AS-IS
Reduced DCs by 50%Reduced distribution cost by 23% Reduced Line-haul transport expense by 7% Reduced safety stock cost by 23%Potential carbon reduction of 10-15%.
TO-BE