building a smarter campus - nmu.edu · focus discussion board of trustees meeting september 24, ......
TRANSCRIPT

Building a Smarter Campus Focus Discussion
Board of Trustees Meeting
September 24, 2010

Knowledge
Management
System
NMU Travel &
Expenses
K- 12 Enrollments?
NMU PeopleAdmin
NMU Performance
Evaluations
NMU Cbord
Housing
NMU Cbord Food
Service Suite
NMU Public Safety
Crimes Database?
NMU Student
Conduct?
NMU Parking
NMU Help Desk
NMU Course
Evaluation
NMU Network?
NMU Asset
Management
NMU Faculty LoadIPEDS
HEIDI
Dean Evans
(Conference & Catering)
NMU Golf Course
NMU Recreation
Memberships
NMU Bookstore
NMU Graduate Survey NMU Workforce
Development
NMU Continuing
Ed
NMU College for
Kids
NMU Academic
Feedback
NMU Energy
Management
NMU Health
Center?
Moody’s Ratios
NMU Event Tickets
NMU Financial Aid
NMU Ebill
NMU Telephone
Systems
Banner Student
Banner Finance
Banner
Advancement
NMU Student
Prospect System
NMU Utilities
NCAA
NMU Space
Utilization
Orientation
NMU Cbord Dining
System
Banner HR
NMU TMA
Workorders
NMU Superior
Edge
The University has many different sources of data

Who are the information providers?

Performance monitoring and
metrics
Custom reports to support planning and
analysis
Production reports to support daily operations
detailed data
4
Business IntelligenceTriangle
Summary and trend data

Dashboards compare one year to another
5

How do we turn data into information?
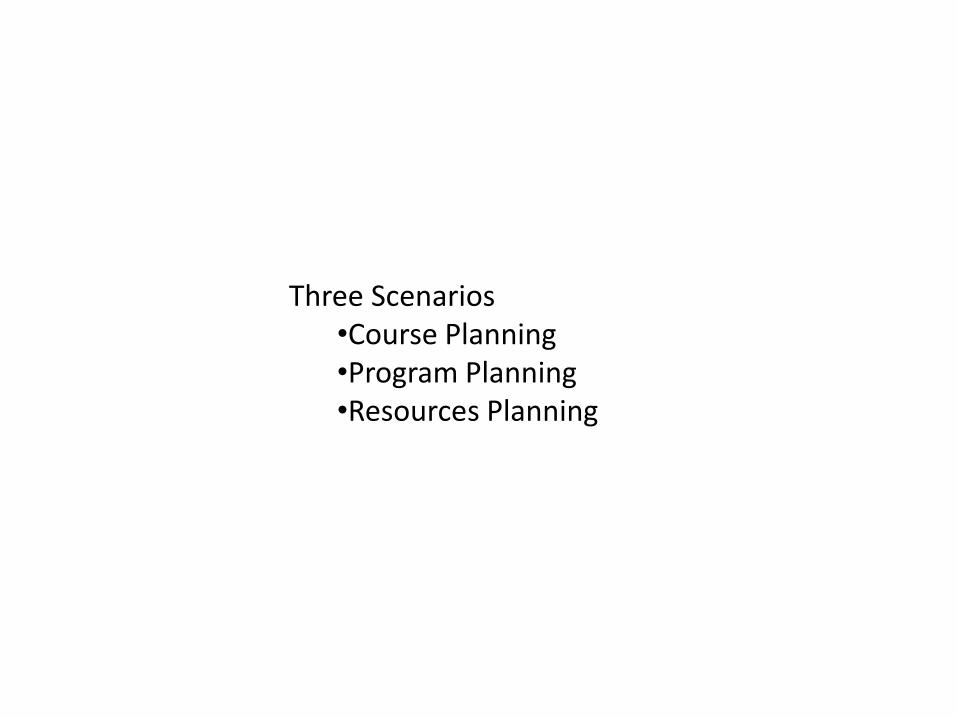
Three Scenarios•Course Planning•Program Planning•Resources Planning

Course Planning
Scenario:It’s June 2010, and we need to tune our class offerings to meet anticipated enrollment demand.

Graduation
Year
12th Grade
Enrollment
Projection
% Decrease
from Previous
Year
Cumulative %
Decrease
from 2009
2008 126,380
2009 126,352 0%
2010 126,012 0% 0%
2011 121,199 4% 4%
2012 117,502 3% 7%
2013 112,597 4% 11%
2014 109,218 3% 13%
2015 107,350 2% 15%
Course Planning

Who has been admitted to the COB in the last two weeks?

Course Planning
Enrollment 2004 2005 2006 2007 2008 2009 2010
ACT 201 46 44 39 36 35 33 33
ACT 230 172 181 190 164 141 118 160
ACT 240 106 123 100 112 109 103 104

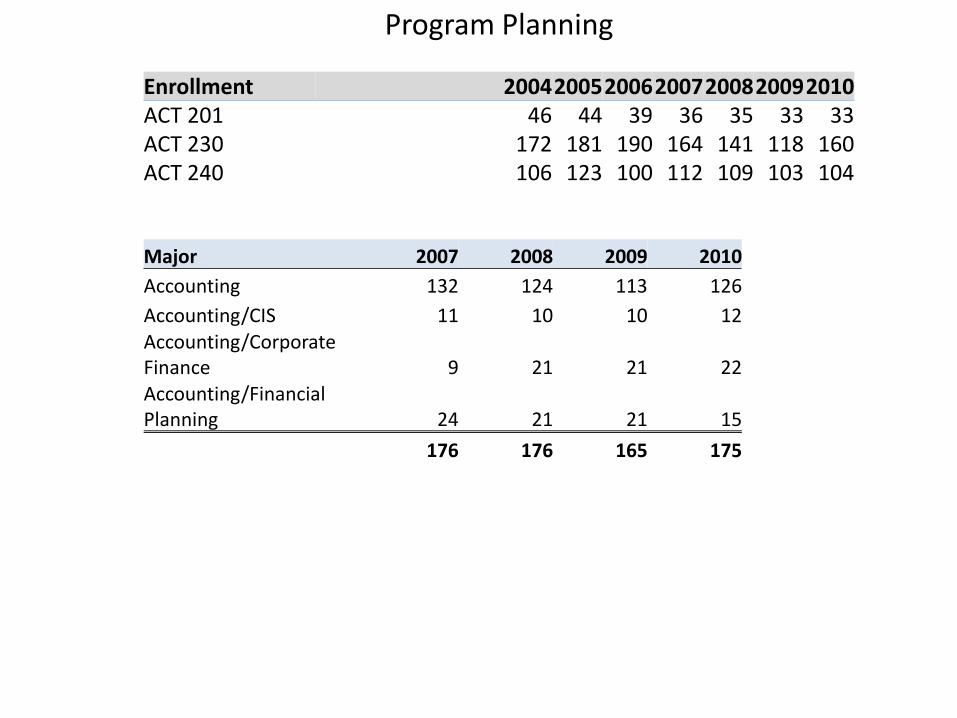
Program Planning
Scenario:It’s mid August, and departments are preparing their staffing requests. What do we use to guide decisions?

Program Planning
Enrollment 2004200520062007200820092010ACT 201 46 44 39 36 35 33 33ACT 230 172 181 190 164 141 118 160ACT 240 106 123 100 112 109 103 104
Program Planning
Enrollment 2004200520062007200820092010ACT 201 46 44 39 36 35 33 33ACT 230 172 181 190 164 141 118 160ACT 240 106 123 100 112 109 103 104
Major 2007 2008 2009 2010
Accounting 132 124 113 126
Accounting/CIS 11 10 10 12Accounting/Corporate Finance 9 21 21 22Accounting/Financial Planning 24 21 21 15
176 176 165 175

Major 2007 2008 2009 2010
Art and Design 567 613 653 711Art and Design/Secondary Ed 45 42 52 55
Art History 0 10 9 14
Crafts 1 3 2 1Graphic Communications 0 0 0 0
Industrial Media 12 18 8 2
Media Illustration 8 9 4 3
Pre-Architecture 20 14 13 11
653 709 741 797
Major 2007 2008 2009 2010
Family Nurse Practitioner 17 15
Nursing 561 579 544 593
Nursing Educator 5
561 579 566 608
Program Planning
All Majors 2007 2008 2009 2010
Grand Total 9,633 9,622 9,710 9,534

Resource Planning
Scenario:It’s today, and we need to make some decisions for the next few years:
•Facilities – Can the Art and Design facilities accommodate continued growth?•Facilities – What should a remodeled JXJ Building look like?•Reallocation – What are the financial implications of growing/curtailing an academic program?

Location
Classroom Hrs per
Wk Enroll
Art & Design Building 134 40.00 291
Art & Design Building 263 35.00 108
Art & Design Building 75 34.67 146
Art & Design Building 165 26.67 564
Resource Planning

Location Type Time Days
Hrs per
Wk Enroll
Art & Design Building 134 Lecture 08:00 am - 09:40 am MW 3.33 26
TR 3.33 27
10:00 am - 11:40 am TR 3.33 26
12:00 pm - 1:40 pm MW 6.67 28
TR 3.33 28
2:00 pm - 3:40 pm MW 3.33 27
TR 3.33 27
4:00 pm - 5:40 pm MW 3.33 24
TR 3.33 27
6:30 pm - 8:10 pm MW 3.33 26
TR 3.33 25
Art & Design Building 263 Seminar 2:00 pm - 4:30 pm MW 15.00 15
Studio 09:00 am - 11:30 am MW 5.00 22
TR 5.00 22
6:30 pm - 9:00 pm MW 5.00 24
TR 5.00 25
Art & Design Building 75 Seminar 09:00 am - 11:30 am MW 5.00 7
11:30 am - 1:55 pm TR 4.83 17
Studio 09:00 am - 11:25 am TR 4.83 25
12:00 pm - 2:30 pm MW 5.00 25
3:00 pm - 5:30 pm MW 5.00 24
4:00 pm - 6:30 pm TR 5.00 23
6:00 pm - 8:30 pm MW 5.00 25
Art & Design Building 165 Lecture 10:00 am - 11:40 am MW 3.33 78
TR 3.33 55
12:00 pm - 1:40 pm MW 3.33 92
TR 3.33 92
2:00 pm - 3:40 pm R 1.67 19
MW 3.33 23
4:00 pm - 5:40 pm R 1.67 57
MW 3.33 59
6:00 pm - 7:40 pm TR 3.33 89
Resource Planning

JXJ + Gries: Sections
Scheduled 2005 2006 2007 2008 2009 2010
English 119 120 112 125 127 134
Cisler College of Business 65 72 73 68 65 63
Psychology 35 36 36 38 36 33
History 23 25 22 23 21 21
Sociology 22 20 20 21 19 16
Economics 17 16 15 14 13 14
Biology 10 6 7 12 10 11
Political Science 23 19 20 15 11 10
Criminal Justice 20 13 16 14 15 10
Modern Languages and Lit 7 12 8 11 11 9
Geography 3 7 4 8 6 5
Nursing 3 6 4 4 5 5
Education 12 6 4 2 3 3
Social Work 9 9 5 3 1 3
Health/Phy Ed/Rec/Nutrition 1 1 1 3 2
Physics 2 2 2 2 1 2
Philosophy 10 10 9 8 8 2
Commun/Performance Studies 2 2 1 1
Native American Studies 1 4 2 1 2 1
Honors Program 1 2 2 3 4 1
Chemistry 2 4 3
Practical Nursing 1 1 1 1 1
Math and Computer Science 2 1 1 2 1
Grand Total 389 394 367 376 364 346
Resource Planning
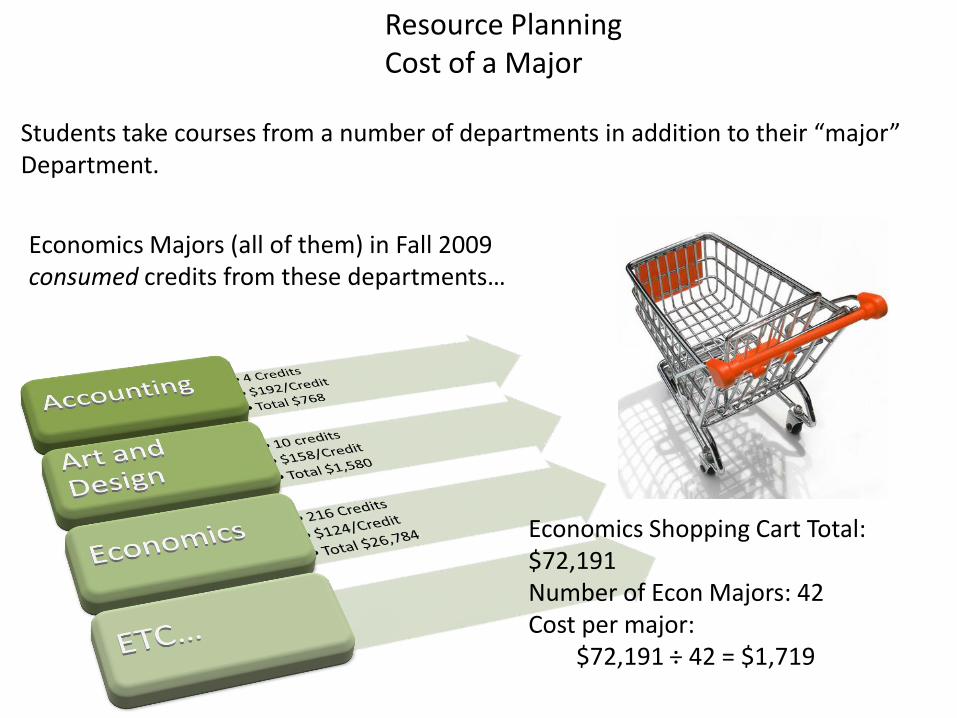
Students take courses from a number of departments in addition to their “major” Department.
Economics Majors (all of them) in Fall 2009 consumed credits from these departments…
Economics Shopping Cart Total: $72,191Number of Econ Majors: 42Cost per major:
$72,191 ÷ 42 = $1,719
Resource PlanningCost of a Major

Next Steps?