building climate-resilient food systems for pacific...
TRANSCRIPT

Building climate-resilient food systems for Pacific Islands

2
BUILDING CLIMATE-RESILIENT FOOD SYSTEMS FOR PACIFIC ISLANDS AuthorsJohann Bell and Mary Taylor
CitationThis publication should be cited as: Bell J and Taylor M. 2015. Building climate-resilient food systems for Pacific Islands. Penang, Malaysia: WorldFish. Program Report: 2015-15.BUILDING CLIMATE-RESILIENT FOOD SYSTEM
S FOR PACIFIC ISLANDS

3
CONTENTS CONTENTS
Executive summary 5
Introduction 6
Important features of the region 6
Food security challenges 8
Existing plans 8
Coping with climate change 9
Policy and adaptation landscape 10
The problem 10
Purpose of this report 11
Projected effects of climate change on food production 12
Agriculture 12
Projected effects on staple food crops 12
Projected effects on export commodities 13
Projected effects on high-value horticultural crops 16
Projected effects on livestock 17
Projected effects on pests and diseases 17
Forestry 18
Summary of changes to agricultural production 18
Fisheries and aquaculture 20
Projected changes to fish stocks 21
Projected changes to aquaculture production 23
Summary of changes to fisheries and aquaculture production 24
Implications for food security 26
Agriculture 26
Fisheries and aquaculture 26
Priority adaptations 30
Important questions 30
Win-win and lose-win adaptations for agriculture 33
Supporting policies for agriculture 34
Win-win and lose-win adaptations for fisheries and aquaculture 35
Adaptations to safeguard fish habitats 35
Adaptations to optimize catches of coastal demersal fish 37
Adaptations to fill the gap in fish needed for food security 37
Supporting policies for fisheries and aquaculture 39
Investments required to implement adaptations 41
Information gaps 45
Surface climate and the ocean 45

4
Agriculture 45
Tuna distribution and abundance 46
Coastal fish habitats and stocks 46
Pond aquaculture 46
Investments needed to fill gaps in information 47
Surface climate and the ocean 47
Agriculture 47
Fisheries and aquaculture 48
Crosscutting analysis 48
Potential partners 49
Recommendations 50
Specific recommendations 50
Notes 52
References 53
Appendices
Appendix 1. Projected changes to surface climate based on CMIP5 models from 60 the IPCC Fifth Assessment Report
Appendix 2. Information used to develop the end-to-end approach for determining 64 the effects of climate change on the production of fisheries and aquacultureCONTENTS

5
EXECUTIVE SUMMARY The 22 Pacific Island countries and territories face many challenges in building the three main pillars of food security: availability, access and appropriate use of nutritious food. These challenges arise because many Pacific Island countries and territories are undergoing rapid population growth and urbanization; communities cannot engage in broad-acre agriculture and livestock grazing due to shortages of arable land; opportunities to earn income are limited; and cheap, low-quality food imports are readily available due to burgeoning global trade. As a result, many Pacific Island countries and territories are now highly dependent on imported food, and the incidence of non-communicable diseases is among the highest in the world — 9 of the 10 countries with the highest rates of overweight and obesity and 7 of the 10 countries with the highest rates of diabetes are Pacific Island nations.
Pacific Island countries and their development partners are aware of the food security crisis and have launched plans and initiatives to combat the problems. These plans and initiatives include increasing appropriate local agricultural production, such as in agroforestry, promoting the health benefits of traditional diets, increasing access to the region’s rich tuna resources for local consumption, developing pond aquaculture, and conserving catchment vegetation to maintain soil quality and safeguard coastal fish habitats.
Pacific leaders also recognize that their islands are among the places most vulnerable to climate change on earth and have made repeated calls for assistance to adapt to global warming and ocean acidification. With support from development partners, high-level policies for adaptation to climate change and disaster risk management are in place, and a number of substantial projects are raising awareness of the implications of climate change among communities and assisting them to adapt. The problem is that communities still lack the practical and proven tools they will need to produce increased quantities of food in a changing climate. Recent, regional vulnerability assessments for agriculture, fisheries and aquaculture have identified the adaptations that promise to address the main drivers of food insecurity in the short term and climate change in the longer term. Even so, substantial gaps in knowledge need to be filled before these adaptations can be applied effectively.
Filling these gaps will allow Pacific Island governments to implement a food systems approach, creating options, for example, to reduce dependence on imported rice and wheat by increasing production of local staple crops resilient to climate change; to transfer some fish consumption from coastal fish to tuna; and to develop the freshwater aquaculture systems expected to be favored by warmer temperatures and higher rainfall. Revenue from tuna licenses, which provide a major portion of government revenue in atoll nations, also provides the opportunity to facilitate the importation of nutritious food to replace the energy-dense, nutrient-poor foods now pervading urban areas.
To harness the benefits of more resilient food systems, staged actions are needed to identify the research to be done at the national level, create effective research partnerships, mentor local scientists, overcome constraints to sharing knowledge and uptake of technology, provide farmers and fishers with ongoing climate services, and progressively implement the research activities needed to fill the gaps in information required for effective adaptation.
EXECUTIVE SUMMARY
6
Phot
o Cr
edit:
And
rew
McG
rego
r/SP
C
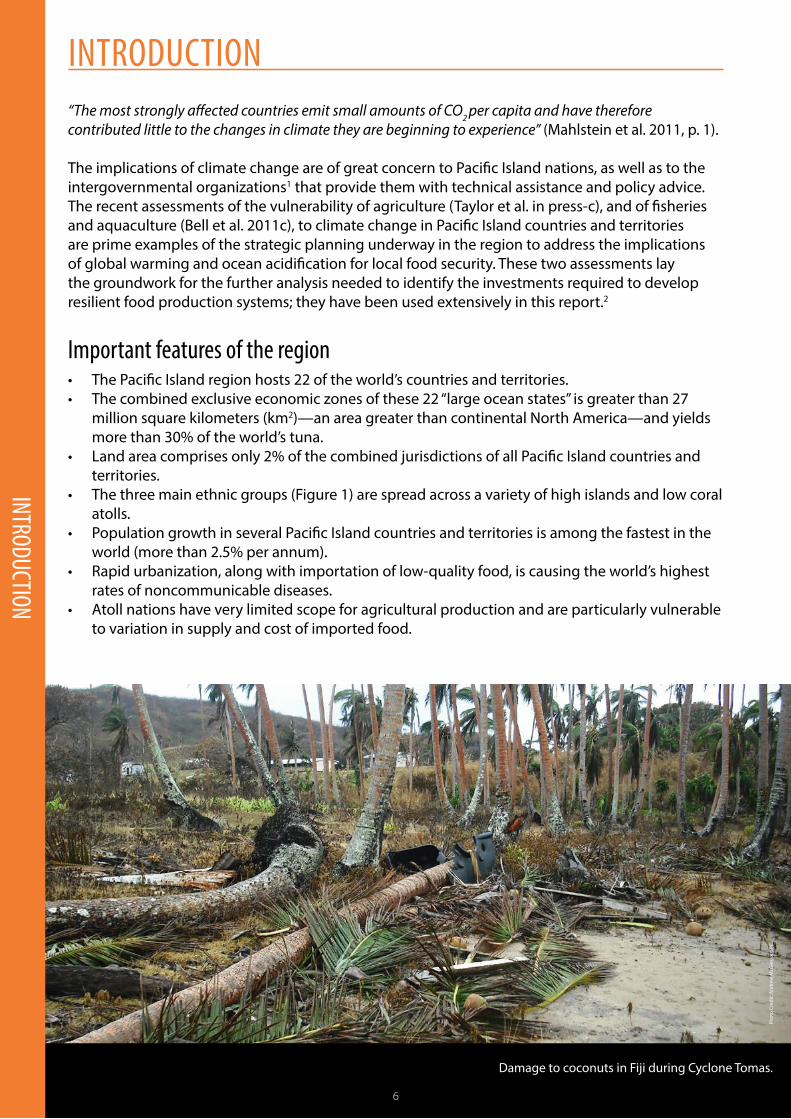
Damage to coconuts in Fiji during Cyclone Tomas.
6
INTRODUCTION
INTRODUCTION “The most strongly affected countries emit small amounts of CO2 per capita and have therefore contributed little to the changes in climate they are beginning to experience” (Mahlstein et al. 2011, p. 1).
The implications of climate change are of great concern to Pacific Island nations, as well as to the intergovernmental organizations1 that provide them with technical assistance and policy advice. The recent assessments of the vulnerability of agriculture (Taylor et al. in press-c), and of fisheries and aquaculture (Bell et al. 2011c), to climate change in Pacific Island countries and territories are prime examples of the strategic planning underway in the region to address the implications of global warming and ocean acidification for local food security. These two assessments lay the groundwork for the further analysis needed to identify the investments required to develop resilient food production systems; they have been used extensively in this report.2
Important features of the region• The Pacific Island region hosts 22 of the world’s countries and territories. • The combined exclusive economic zones of these 22 “large ocean states” is greater than 27
million square kilometers (km2)—an area greater than continental North America—and yields more than 30% of the world’s tuna.
• Land area comprises only 2% of the combined jurisdictions of all Pacific Island countries and territories.
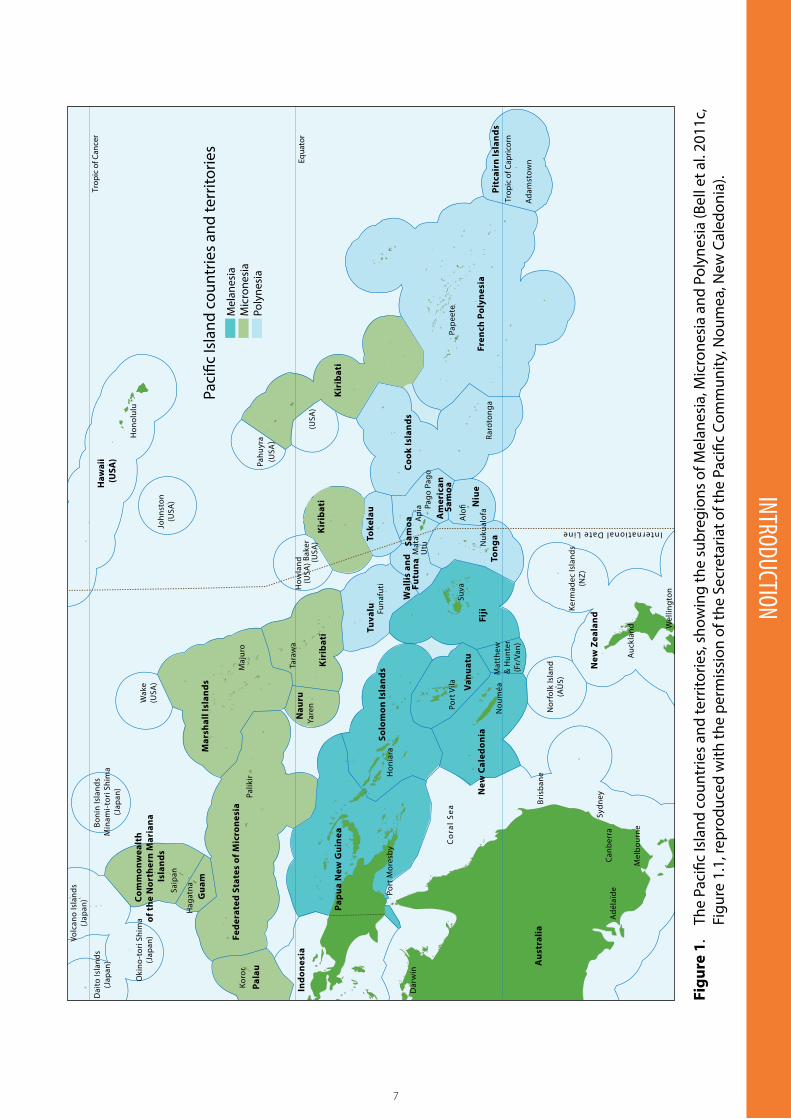
• The three main ethnic groups (Figure 1) are spread across a variety of high islands and low coral atolls.
• Population growth in several Pacific Island countries and territories is among the fastest in the world (more than 2.5% per annum).
• Rapid urbanization, along with importation of low-quality food, is causing the world’s highest rates of noncommunicable diseases.
• Atoll nations have very limited scope for agricultural production and are particularly vulnerable to variation in supply and cost of imported food.
7
INTRODUCTION
Figu
re 1
. Th
e Pa
cific
Isla
nd c
ount
ries
and
terr
itorie
s, sh
owin
g th
e su
breg
ions
of M
elan
esia
, Mic
rone
sia
and
Poly
nesi
a (B
ell e
t al.
2011
c,
Figu
re 1
.1, r
epro
duce
d w
ith th
e pe
rmis
sion
of t
he S
ecre
taria
t of t
he P
acifi
c Co
mm
unity
, Nou
mea
, New
Cal
edon
ia).
Mel
anes
iaM
icro
nesi
aPo
lyne
sia
International Date Line
New
Cal
edon
ia
Nou
méaV
anua
tu
Port
Vila
Solo
mon
Isla
nds
Hon
iara
Port
Mor
esby
Aus
tral
ia
Sydn
ey
Nor
folk
Isla
nd(A
US)
Auc
klan
d
New
Zea
land
Wel
lingt
on
Bris
bane
Canb
erra
Mel
bour
ne
Adé
laïd
e
Dar
win
Ind
ones
ia
Pala
u Ko
ror
Fed
erat
ed S
tate
s of
Mic
rone
sia
Palik
ir
Nau
ruYa
ren
Kir
ibat
i
Tara
wa
Tuva
lu Funa
futi
Fiji
Suva
Tong
aN
ukua
lofa
Wal
lis a
ndFu
tuna
Mat
aU
tu
Niu
e
Cook
Isla
nds
Raro
tong
a
Sam
oa Api
a
Am
eric
an
Sam
oa
Pago
Pag
o
Fren
ch P
olyn
esia
Pape
ete
Pitc
airn
Isla
nds
Ada
mst
own
Trop
ic o
f Cap
ricor
n
Kir
ibat
i
Kir
ibat
i
Toke
lau
Mar
shal
l Isl
and
s
Maj
uro
Com
mon
wea
lth
of t
he N
orth
ern
Mar
iana
Is
land
sSa
ipan
Hag
atna
Gua
m
Hon
olul
u
John
ston
(USA
)
Wak
e(U
SA)
Pahu
yra
(USA
)
(USA
)
How
land
(USA
)Bak
er(U
SA)
Boni
n Is
land
s M
inam
i-tor
i Shi
ma
(Jap
an)
Oki
no-t
ori S
him
a(J
apan
)
Equa
tor
Co
ral
Sea
Pap
ua N
ew G
uine
a
Dai
to Is
land
s(J
apan
)
Volc
ano
Isla
nds
(Jap
an)
Kerm
adec
Isla
nds
(NZ)
Mat
thew
&
Hun
ter
(Fr/
Van)
Haw
aii
(USA
)
Trop
ic o
f Can
cer

8
INTRODUCTION
Food security challengesThe demography of the 22 Pacific Island countries and territories poses two difficult and contrasting challenges for planning the food security of Pacific Island people.
• Increasing the food supply for growing rural populations. This need is illustrated by the rural communities of inland Papua New Guinea, where more than 40% of the region’s population lives. Populations are predicted to grow by more than 50% by 2035, and food production is largely limited to staple food crops such as sweet potato and banana.
This challenge also applies to the coastal areas of many Pacific Island countries and territories, where there is heavy reliance on fishing and root crops for food security. Fish consumption by Pacific coastal communities is typically two to four times the global average, and across the region 50%–90% of this fish is caught by subsistence fishing (Bell et al. 2009).
The heavy dependence on subsistence agriculture and fishing in rural areas stems from the limited opportunities to earn income due to the remote locations of many islands (Figure 1), the high ratio of coastline to land area, the scarcity of arable land due to the steep topography of many islands, and the fact that most of the remainder are coral atolls with poor, sandy soils. Even in countries such as Papua New Guinea, where mineral resources make significant contributions to gross domestic product, there are large disparities in the income earned by people in urban and mining enclaves compared with those in rural areas, where 94% of the resource-poor live (ADB 2012).
• Reversing public health problems associated with changes in the lifestyle and diet of the rapidly growing urban populations due to imports of energy-dense, nutritionally poor foods. These imports are replacing traditional foods due to lack of access to land for growing food by people migrating to towns, increases in disposable income of urban dwellers, and lack of awareness of the consequences of poor nutrition. The toll on Pacific Island urban populations has already been huge—9 of the 10 countries with the highest rates of overweight and obesity, and 7 of the 10 countries with the highest rates of diabetes, are Pacific Island nations.3
Existing plansFor the agriculture sector, strategic plans have been developed at regional and national levels to map out the actions needed to address these challenges. These plans are supported by the Land Resources Division of the Secretariat of the Pacific Community. The Heads of Agriculture and Forestry Services meet every two years to consider and discuss the programs being implemented and planned by the Land Resources Division. Major changes in policy and/or programming are endorsed by the Ministers of Agriculture and Forestry, but may require subsequent endorsement at the Pacific Island Forum Leaders meeting.
For the fisheries sector, practical plans have been proposed to meet the future need for fish for food by rural and urban communities across the region (Bell et al. 2009; Gillett and Cartwright 2010; Bell et al. 2015). These plans have been made easier by the strong collaborative arrangements between Pacific Island countries and territories for managing the region’s rich tuna resources through the Pacific Islands Forum Fisheries Agency, the Parties to the Nauru Agreement Office, and the Western and Central Pacific Fisheries Commission (WCPFC).
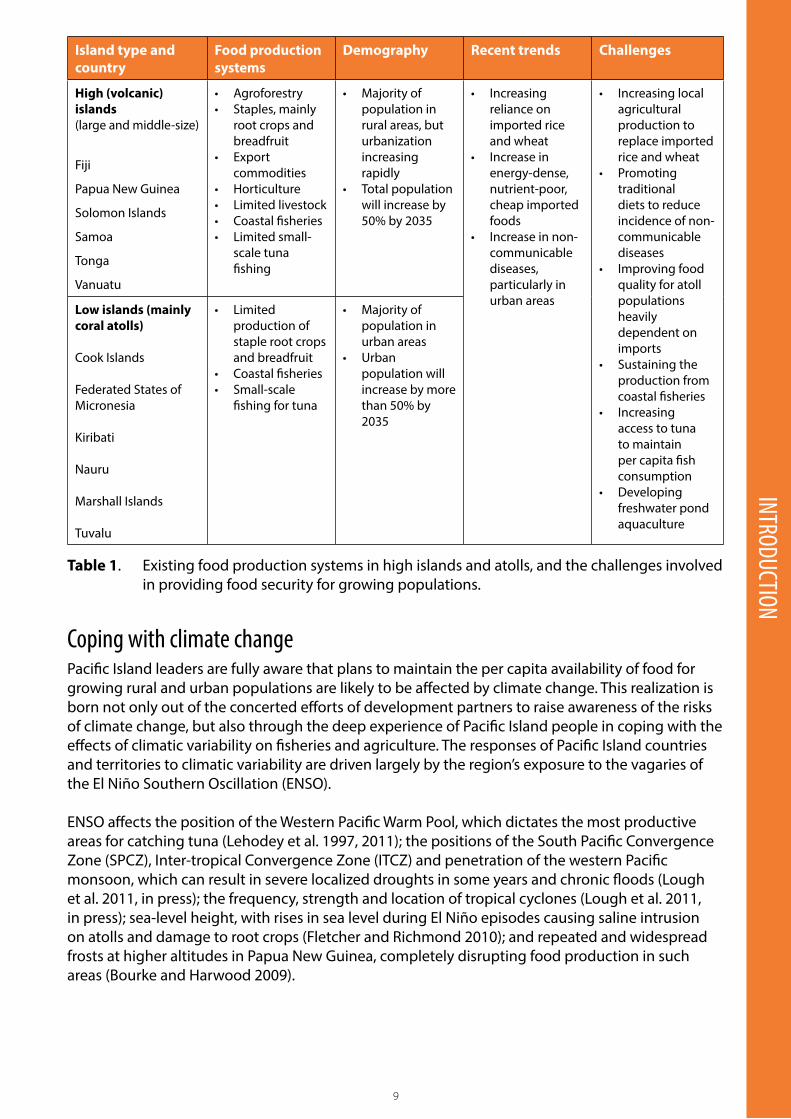
A brief summary of the challenges that the plans for the agriculture and fisheries sectors are designed to address is provided in Table 1.
9
Coping with climate changePacific Island leaders are fully aware that plans to maintain the per capita availability of food for growing rural and urban populations are likely to be affected by climate change. This realization is born not only out of the concerted efforts of development partners to raise awareness of the risks of climate change, but also through the deep experience of Pacific Island people in coping with the effects of climatic variability on fisheries and agriculture. The responses of Pacific Island countries and territories to climatic variability are driven largely by the region’s exposure to the vagaries of the El Niño Southern Oscillation (ENSO).
ENSO affects the position of the Western Pacific Warm Pool, which dictates the most productive areas for catching tuna (Lehodey et al. 1997, 2011); the positions of the South Pacific Convergence Zone (SPCZ), Inter-tropical Convergence Zone (ITCZ) and penetration of the western Pacific monsoon, which can result in severe localized droughts in some years and chronic floods (Lough et al. 2011, in press); the frequency, strength and location of tropical cyclones (Lough et al. 2011, in press); sea-level height, with rises in sea level during El Niño episodes causing saline intrusion on atolls and damage to root crops (Fletcher and Richmond 2010); and repeated and widespread frosts at higher altitudes in Papua New Guinea, completely disrupting food production in such areas (Bourke and Harwood 2009).
Table 1. Existing food production systems in high islands and atolls, and the challenges involved in providing food security for growing populations.
Island type and country
Food production systems
Demography Recent trends Challenges
High (volcanic) islands(large and middle-size)
Fiji
Papua New Guinea
Solomon Islands
Samoa
Tonga
Vanuatu
• Agroforestry• Staples, mainly
root crops and breadfruit
• Export commodities
• Horticulture• Limited livestock• Coastal fisheries• Limited small-
scale tuna fishing
• Majority of population in rural areas, but urbanization increasing rapidly
• Total population will increase by 50% by 2035
• Increasing reliance on imported rice and wheat
• Increase in energy-dense, nutrient-poor, cheap imported foods
• Increase in non-communicable diseases, particularly in urban areas
• Increasing local agricultural production to replace imported rice and wheat
• Promoting traditional diets to reduce incidence of non-communicable diseases
• Improving food quality for atoll populations heavily dependent on imports
• Sustaining the production from coastal fisheries
• Increasing access to tuna to maintain per capita fish consumption
• Developing freshwater pond aquaculture
Low islands (mainly coral atolls)
Cook Islands
Federated States of Micronesia
Kiribati
Nauru
Marshall Islands
Tuvalu
• Limited production of staple root crops and breadfruit
• Coastal fisheries• Small-scale
fishing for tuna
• Majority of population in urban areas
• Urban population will increase by more than 50% by 2035
INTRODUCTION
10
INTRODUCTION
Despite the demonstrated ability of Pacific Island people to cope with climatic variability, there is widespread realization that the region will need assistance to adapt to the more extreme climatic change expected to occur as greenhouse gas emissions continue to increase. In particular, the region needs assistance to• ensure that the plans in place to maintain and expand local agriculture and fisheries production
are “climate proof”; • reduce dependence on imported foods (e.g. rice and wheat) that are vulnerable to the effects
of climate change in other parts of the world; • capitalize on opportunities for increases in local food production created by climate change.
Policy and adaptation landscapeA range of top-down and bottom-up processes have set the stage for including agriculture and fisheries in national and regional policies on climate change and developing and implementing adaptations to improve food security in the face of global warming and ocean acidification. High-level strategic frameworks that pave the way for supporting adaptation targeting Pacific Island countries and territories include the Pacific Island Framework for Adaptation to Climate Change (2006–2015) and the more recent Strategy for Climate and Disaster-Resilient Development in the Pacific. In addition, the United Nations Framework Convention on Climate Change has assisted the least developed countries in the region to develop National Adaptation Plans of Action, and more recently Joint National Action Plans for Climate Change and Disaster Risk Management.
At the community level, several major projects have been launched with the assistance of international development agencies and nongovernmental organizations (NGOs)4 to help Pacific Island people adapt to climate change. These projects have raised awareness of the likely effects of climate change on future food supply and have predisposed communities to adapt.
The problemAlthough communities are predisposed to adapt, they still lack the full range of practical and proven tools for implementing the sectoral plans to produce increased quantities of food, and to do this successfully under a changing climate. The vulnerability assessments for agriculture (Taylor et al. in press-c) and fisheries and aquaculture (Bell et al. 2011c) have identified several adaptations that promise to address drivers of food insecurity in the short term, such as population growth and urbanization, and climate change in the longer term; however, substantial gaps in knowledge need to be filled for many of these adaptations before they can be applied effectively.
Therefore, an overarching challenge facing the region is to do the research required to make these promising adaptations fully effective so that they can be transferred to communities with confidence—that is, to produce practical tools for future climates.
The problems to be overcome in developing and promoting these tools for the region include the following:
• lack of effective processes for prioritizing research at national and regional levels;• limited capacity to design, implement, monitor and evaluate relevant research;• poor documentation skills and limited sharing of research data and results;• constraints to knowledge sharing through extension services and farmer networks; • limited understanding of the factors influencing uptake of technology.
11
Phot
o Cr
edit:
Joha
nn B
ell/W
orld
Fish
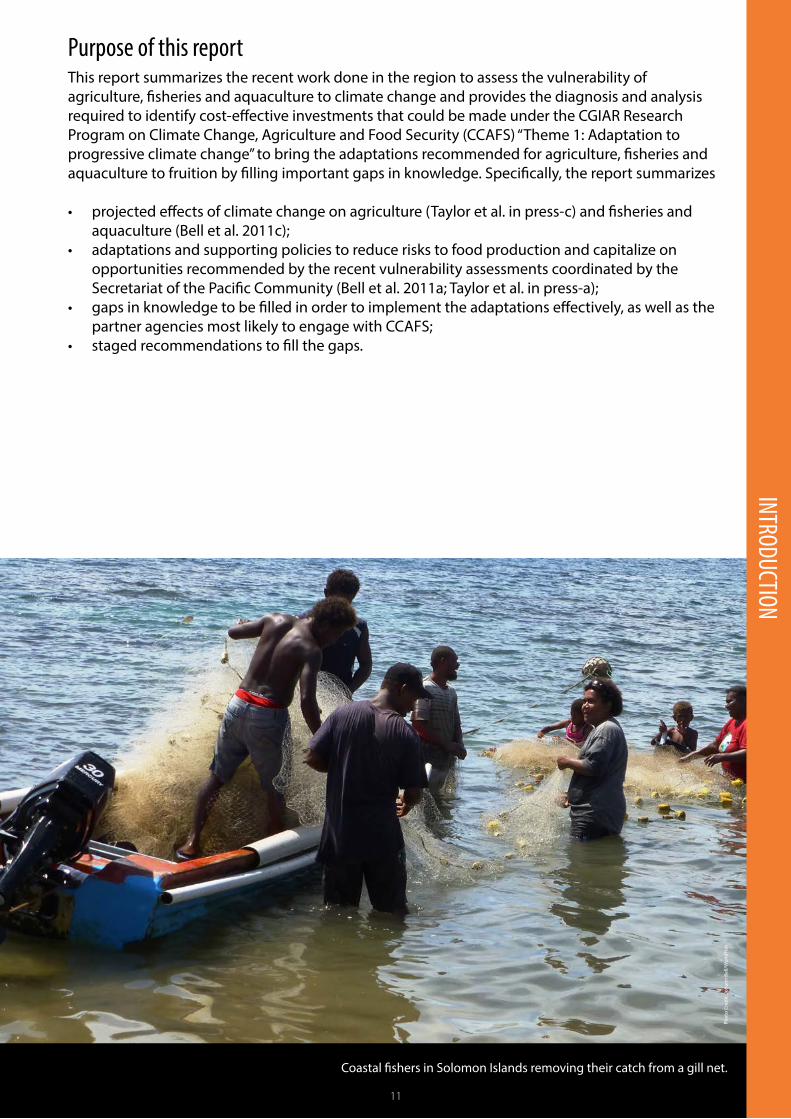
Coastal fishers in Solomon Islands removing their catch from a gill net.
11
Purpose of this report This report summarizes the recent work done in the region to assess the vulnerability of agriculture, fisheries and aquaculture to climate change and provides the diagnosis and analysis required to identify cost-effective investments that could be made under the CGIAR Research Program on Climate Change, Agriculture and Food Security (CCAFS) “Theme 1: Adaptation to progressive climate change” to bring the adaptations recommended for agriculture, fisheries and aquaculture to fruition by filling important gaps in knowledge. Specifically, the report summarizes
• projected effects of climate change on agriculture (Taylor et al. in press-c) and fisheries and aquaculture (Bell et al. 2011c);
• adaptations and supporting policies to reduce risks to food production and capitalize on opportunities recommended by the recent vulnerability assessments coordinated by the Secretariat of the Pacific Community (Bell et al. 2011a; Taylor et al. in press-a);
• gaps in knowledge to be filled in order to implement the adaptations effectively, as well as the partner agencies most likely to engage with CCAFS;
• staged recommendations to fill the gaps.
INTRODUCTION

12
PROJECTED EFFECTS OF CLIMATE CHANGE ON FOOD PRODUCTION
PROJECTED EFFECTS OF CLIMATE CHANGE ON FOOD PRODUCTION
AgricultureThis analysis is based on a recent in-depth assessment of the vulnerability of agriculture (and forestry) in Pacific Island countries and territories to climate change (Taylor et al. in press-c). The assessment used projected changes to the surface climate derived from the World Climate Research Programme’s Coupled Model Intercomparison Project Phase 5 (CMIP5) models (Appendix 1) to estimate the direct and indirect effects of alterations to air temperature and rainfall on various subsectors of agriculture: staple food crops, export commodities, high-value horticulture crops and livestock. Although effects on forestry are not the focus of this report, livelihoods derived from forestry help provide food security for rural households, and so a brief description of the projected effects of climate change on forestry has also been included.
Projected effects on staple food crops Staple food crops in the Pacific include sweet potato (Ipomoea batatas), banana (Musa species), cassava (Manihot esculenta), taro (Colocasia esculenta), cocoyam (Xanthosoma sagittifolium), swamp taro (Cyrtosperma merkusii), giant taro (Alocasia macrorrhiza) and yams (Dioscorea spp.). Rice (almost entirely imported), wheat flour (entirely imported), coconuts (Cocos nucifera) and breadfruit (Artocarpus altilis) are also important food staples. Abelmoschus manihot (aibika, bele, island cabbage, slippery cabbage) is also considered a staple because of its widespread use in Melanesia and its nutritional value.
For most staple food crops, increases in extreme weather events are likely to have greater impacts than changes in mean temperature in the short to medium term (2030–2050). The increased probability of extreme rainfall (both frequency and intensity) will test the skills of farmers in those countries where rainfall is already high, especially for crops sensitive to waterlogging, such as sweet potato (Bourke et al. 2006). Similarly, domesticated yam is highly susceptible to increased rainfall variability and extreme rainfall events (Lebot 2009). High temperature events could also affect tuberization in sweet potato and yam.
The climate change response of pests and diseases that affect staple crops is far less certain, with the exception of taro leaf blight, where an increase in minimum temperatures and increased humidity provide conditions conducive to the spread of the disease (Trujillo 1965; Putter 1976). High wind speeds from more intense tropical cyclones will also create problems for many crops.
Despite these threats, the overall impact of climate change on Pacific staple food crop production is expected to be generally low over the next few decades and far less than the impact of global warming on supply of imported grain crops from other regions (McGregor et al. in press-b). There is even some evidence that elevated levels of carbon dioxide (CO2) may have yield benefits for cassava, taro and possibly other aroids (Miglietta et al. 1998; Rosenthal et al. 2012; Taylor et al. in press-b). Beyond 2050, the negative effects of climate change are expected to become much more pronounced, especially if global emissions continue to track the high-emission scenarios (Representative Concentration Pathway [RCP] 6.0 and RCP8.5; Appendix 1). Negative impacts on production have been assessed as very high for rice; high for taro, swamp taro and domesticated yams; and moderate to high for sweet potato. By contrast, the impact on cassava, aibika (bele) and banana has been assessed as low to moderate, and low impact is predicted for cocoyam, giant taro, wild yams and breadfruit (McGregor et al. in press-b). Sea-level rise is not expected to be a major issue for agricultural production in the region, except for the atoll nations and the atoll islands of the larger Melanesian countries, where the major effects are likely to occur beyond 2050, especially with high emissions (RCP6.0 and 8.5). In the short to medium term, storm surges and king tides pose problems for these countries. Increased salinization from these events could result in an accelerating decline in swamp taro production by 2035, with production potentially disappearing entirely by 2050 (McGregor et al. in press-b).

13
PROJECTED EFFECTS OF CLIMATE CHANGE ON FOOD PRODUCTIONProjected effects on export commodities The projected impacts of climate change on the Pacific’s major agricultural export cash crops (coconut, coffee, cocoa, palm oil and sugar) show considerable variation (McGregor et al. in press-a). Coffee (Coffea arabica) is the commodity predicted to be the most susceptible to global warming, with yields expected to fall significantly by 2050 in current production areas, mainly due to increased temperature effects (Figure 2), especially in the uplands of Papua New Guinea (Davis et al. 2012; McGregor et al. in press-a). Coffee is a major export commodity for Papua New Guinea (Figure 3), and coffee growing employs a large number of people. Therefore, declines in coffee production are likely to have significant adverse implications for livelihoods.
Most cash crops are vulnerable to extreme weather events, which account for many of the losses in production in the region. The
projected increase in the frequency and intensity of extreme weather events poses the greatest risk to production of export commodities over the next few decades. High wind speeds are a significant threat to senile (more than 60-year-old) coconut palms, which make up a major proportion of many existing plantings. Sugar is very vulnerable to flooding (Figure 4); therefore, extreme rainfall events are also likely to result in higher potential crop losses for sugar. Some export commodities may benefit from climate change. For example, increases in average temperatures are likely to favor cocoa production in some countries, such as Vanuatu. Palm oil production is unlikely to suffer from climate change in the areas where these palms are grown (McGregor et al. in press-a).
Figure 2. The bio-climate envelope for Arabica coffee (Fermont 2012).
Marginal conditions
Optimum conditions
Ann
ual r
ainf
all (
mm
)
500
1000
2000
1500
2500
3000
Temperature (˚C)
10 20 3015 25 35

14
PROJECTED EFFECTS OF CLIMATE CHANGE ON FOOD PRODUCTION
Beyond 2050, the potential adverse impacts of global warming on export commodities are likely to become more pronounced. Most of the current coffee production areas of Papua New Guinea will become unsuitable, making coffee highly vulnerable to climate change. The overall production impact assessment for coconuts is low to moderate but is dependent to some extent on the successful implementation of strategies to replace senile palms with new coconut plantings. The greatest threat to sugar will continue to be from extreme events, such as floods, with a projected moderate negative impact on production. Cocoa production in Papua New Guinea and Solomon Islands is also expected to be adversely impacted. Little is
Figure 3. Export values (in PGK) of cash crops in Papua New Guinea (Bourke and Harwood 2009).
known about how climate change will impact cocoa pests and diseases, although black pod disease could increase in severity (Bourke 2013).
There could be some positive economic benefits for oil palm cultivation due to its relatively high resilience to increased temperatures and rainfall and the likelihood of increased oil prices over the medium term (palm oil prices are strongly correlated to crude oil prices [Figure 5]). The high returns from oil palm plantations are creating interest in planting the crop in Vanuatu and Fiji; however, the high vulnerability of oil palm to tropical cyclones is likely to rule this out (McGregor et al. in press-a).
0
100,000
200,000
300,000
400,000
500,000
Valu
e (K
'000
)
Year 2004
20011998
19951992
19891986
19831980
19741971
19681965
19621959
19561953
19501947
Coffee
Palm oil
Cocoa
Copra oil
Copra
Tea
Rubber

15
PROJECTED EFFECTS OF CLIMATE CHANGE ON FOOD PRODUCTION
Figure 4. Proportion of total estimated losses of USD 24 million to the sugar cane industry in Fiji in 2009 incurred by different parts of the industry (Lal et al. 2009).
Growers’ farm and off-farm costs
Cane access road costs
Millers’ costs
Other infrastructure costs
56%31%
10%3%
Total economic losses to the sugar cane industry in 2009: USD 24 million
Figure 5. World palm oil and crude oil prices: 1997–2013 (Public Ledger June 2012).
Crude oil Brent crude futures (USD/t)
Palm oil Malaysian olein (refined, bleached, deodorized) free on board (FOB) Malaysia (USD/t)
2500
2000
1500
1000
500
0
1/06
/199
7
1/04
/199
8
1/02
/199
9
1/12
/199
9
1/10
/200
0
1/08
/200
1
1/06
/200
2
1/04
/200
3
1/02
/200
4
1/12
/200
4
1/10
/200
5
1/08
/200
6
1/06
/200
7
1/04
/200
8
1/02
/200
9
1/12
/200
9
1/10
/201
0
1/08
/201
1
1/06
/201
2
1/04
/201
3

16
PROJECTED EFFECTS OF CLIMATE CHANGE ON FOOD PRODUCTION
Projected effects on high-value horticultural cropsHigh-value horticultural crops include papaya, mango, citrus, pineapple, watermelon, tomato, vanilla, ginger, kava and betel nut. As with the other crop categories, extreme weather events are the greatest threat to these products in the short to medium term. Of the fruit crops, papaya and mango are considered to be the most vulnerable (i.e. low to moderate impact up to 2050), with fungal diseases being a particular threat for papaya. Fruit set in mango will be adversely affected by increased variability in rainfall and extreme rainfall events (Rajan 2012). The impact on citrus and pineapple is likely to be insignificant to low, though some pests and diseases may become more problematic for citrus (Table 2). Higher rainfall is likely to have a negative impact on both tomato and watermelon production, and extreme heat (depending on the timing) can significantly affect tomato production and yield (Deuter et al. 2012). For the spices, vanilla and ginger, the projected impact is also neutral to low, with the possibility that changed rainfall patterns
could increase ginger production. Similarly for betel nut and kava, the short-to-medium-term impact of climate change on production is expected to be minimal except with more intensive cyclones which are likely to have significant impact, particularly for plantings not in agroforestry food gardens (Stice and McGregor in press). Beyond 2050, the impacts are less certain, but the increased intensity of extreme weather events is expected to pose the greatest challenge. High wind speeds could potentially be a significant threat to mango and papaya production, more intense rainfall could lead to waterlogging, and flooding is likely to affect most crops. Both papaya and tomato are at greatest risk, but production of watermelon and pineapple are also likely to be affected. On the other hand, an increase in temperature could enable citrus cultivation at higher altitudes in Papua New Guinea. For citrus and betel nut, the production and economic impact assessment is low, and for vanilla, ginger and kava, it is low to moderate (Stice and McGregor in press).
Table 2. Means of spread and optimum climatic conditions for the infection of common citrus foliar diseases.
Disease Means of spread Optimum temperature for spread (ºC)
Optimum wetting period
Greasy spot Wind 24–27 Several nightsPost bloom fruit drop Water splash 25–28 10–12 hoursMelanose Water splash 25–29 10–12 hoursCitrus scab Water splash 21–29 5–6 hoursCitrus canker Wind–blown rain 25–28 4–6 hoursBlack spot Wind 21–32 1–2 daysAlternaria brown spot Wind 21–27 12–14 hours
Source: Timmer 1999, p. 107
17
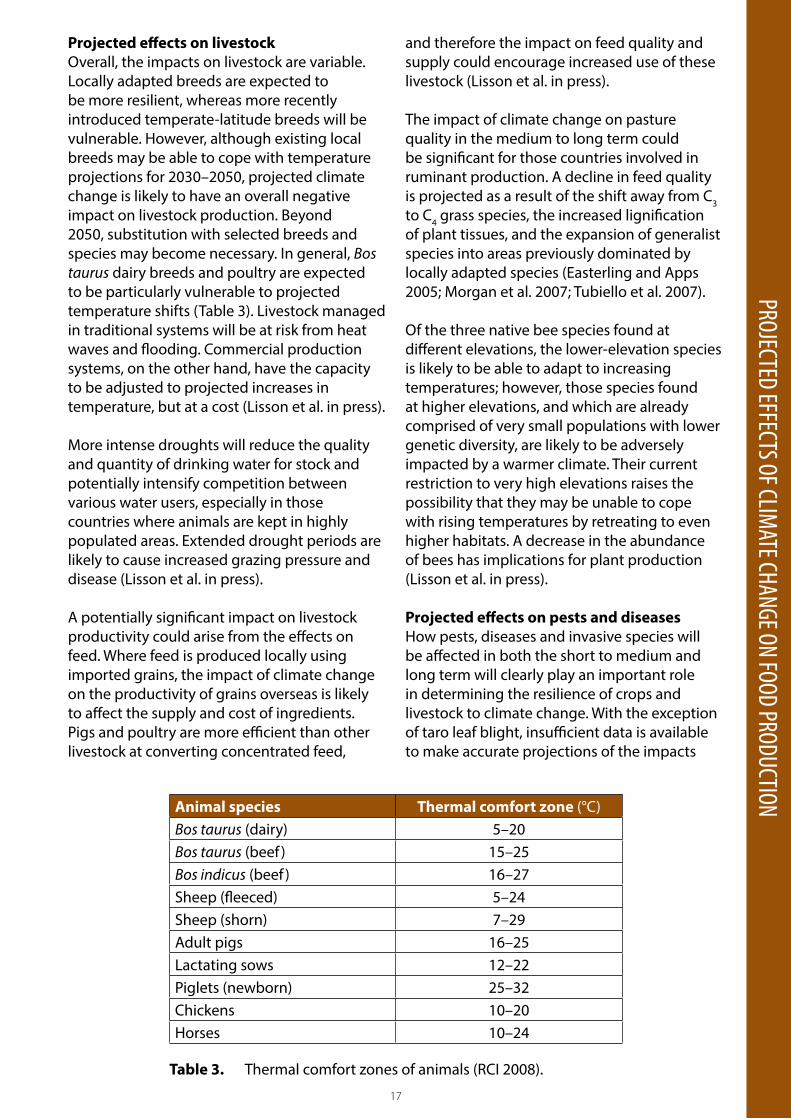
Projected effects on livestockOverall, the impacts on livestock are variable. Locally adapted breeds are expected to be more resilient, whereas more recently introduced temperate-latitude breeds will be vulnerable. However, although existing local breeds may be able to cope with temperature projections for 2030–2050, projected climate change is likely to have an overall negative impact on livestock production. Beyond 2050, substitution with selected breeds and species may become necessary. In general, Bos taurus dairy breeds and poultry are expected to be particularly vulnerable to projected temperature shifts (Table 3). Livestock managed in traditional systems will be at risk from heat waves and flooding. Commercial production systems, on the other hand, have the capacity to be adjusted to projected increases in temperature, but at a cost (Lisson et al. in press).
More intense droughts will reduce the quality and quantity of drinking water for stock and potentially intensify competition between various water users, especially in those countries where animals are kept in highly populated areas. Extended drought periods are likely to cause increased grazing pressure and disease (Lisson et al. in press).
A potentially significant impact on livestock productivity could arise from the effects on feed. Where feed is produced locally using imported grains, the impact of climate change on the productivity of grains overseas is likely to affect the supply and cost of ingredients. Pigs and poultry are more efficient than other livestock at converting concentrated feed,
and therefore the impact on feed quality and supply could encourage increased use of these livestock (Lisson et al. in press).
The impact of climate change on pasture quality in the medium to long term could be significant for those countries involved in ruminant production. A decline in feed quality is projected as a result of the shift away from C3 to C4 grass species, the increased lignification of plant tissues, and the expansion of generalist species into areas previously dominated by locally adapted species (Easterling and Apps 2005; Morgan et al. 2007; Tubiello et al. 2007).
Of the three native bee species found at different elevations, the lower-elevation species is likely to be able to adapt to increasing temperatures; however, those species found at higher elevations, and which are already comprised of very small populations with lower genetic diversity, are likely to be adversely impacted by a warmer climate. Their current restriction to very high elevations raises the possibility that they may be unable to cope with rising temperatures by retreating to even higher habitats. A decrease in the abundance of bees has implications for plant production (Lisson et al. in press).
Projected effects on pests and diseasesHow pests, diseases and invasive species will be affected in both the short to medium and long term will clearly play an important role in determining the resilience of crops and livestock to climate change. With the exception of taro leaf blight, insufficient data is available to make accurate projections of the impacts
Animal species Thermal comfort zone (°C)Bos taurus (dairy) 5–20Bos taurus (beef ) 15–25Bos indicus (beef ) 16–27Sheep (fleeced) 5–24Sheep (shorn) 7–29Adult pigs 16–25Lactating sows 12–22Piglets (newborn) 25–32Chickens 10–20Horses 10–24
Table 3. Thermal comfort zones of animals (RCI 2008).
PROJECTED EFFECTS OF CLIMATE CHANGE ON FOOD PRODUCTION

18
PROJECTED EFFECTS OF CLIMATE CHANGE ON FOOD PRODUCTION
of climate change on known pests, diseases and invasive species. Greater research effort is required in this area. Many crop pest and disease problems are linked to intensification of land use and declining soil fertility (Taylor et al. in press-b).
Changes in the geographical extent, population, life cycle and transmission characteristics of livestock pests and diseases are expected. For example, larger populations of pathogens may arise with higher temperatures and humidity, especially for those pathogens that spend some of their life cycle outside the animal host. Alternatively, the populations of some pathogens may decrease due to sensitivity to higher temperatures (Lisson et al. in press).
ForestryOverall, the major commercially planted forests, including most timber plantations, are not expected to be particularly vulnerable to climate change until later this century. The intertidal and atoll forests are considered to be the most vulnerable, especially to tropical cyclones and associated storm surges. Cyclones already cause significant damage to trees outside forests, and to forests themselves, and this is very likely to remain a significant problem in the future. Following such events, effective management is needed to prevent incursion of exotic invasive weeds. Flooding, waterlogging and landslides caused by extreme rainfall events are also likely to result in increased damage to trees. More intense El Niño events, coupled with higher temperatures, could increase the risk of severe droughts and wildfires for some countries, which could have a significant impact on forest biodiversity—for example, for the endemic conifers in New Caledonia. Conversely, the projected higher rainfall and decrease in droughts in countries near the equator, such as Kiribati and Nauru, will be generally beneficial to tree survival and growth. Any adverse impacts of higher temperatures and extreme heat events on tree growth will likely be at least partly counterbalanced by increases in CO2 levels, especially for the drier forest types.
Planted monoculture forests are more at risk from climate change. Pinus caribaea in Fiji is vulnerable to tropical cyclones, fire and
landslides. Swietenia macrophylla in Fiji is also vulnerable to tropical cyclones, and would become more vulnerable if Hypsipyla shoot borer reaches Fiji and causes a multistemmed habit.
Summary of changes to agricultural productionThe effects of climate change on agricultural production are expected to be mixed, and are difficult to estimate over the longer term (beyond 2050) due to uncertainty associated with future emission scenarios and the interplay of local market forces and variation in the supply of imported staples. The limited data available for many of the Pacific food crops further complicates efforts to assess climate change impacts.
Some Pacific agricultural industries are expected to continue to grow in the future despite the adverse impacts of climate change, albeit at a slower rate due to global warming. Fiji’s horticultural exports are likely to be in this category. Other industries that are already in decline, such as Fiji’s sugar industry, are now expected to decline more rapidly due to climate change. For those species expected to be favored by climate change, or where any projected negative impacts of global warming are expected to be low, off-setting price impacts could improve revenues for farmers. Breadfruit could fit into this category if availability of imported grains is reduced due to climate change. Provided sufficient attention is given to more sustainable farming practices, the impact of climate change on Pacific staple food crops, such as breadfruit, cassava and banana, can be minimized.
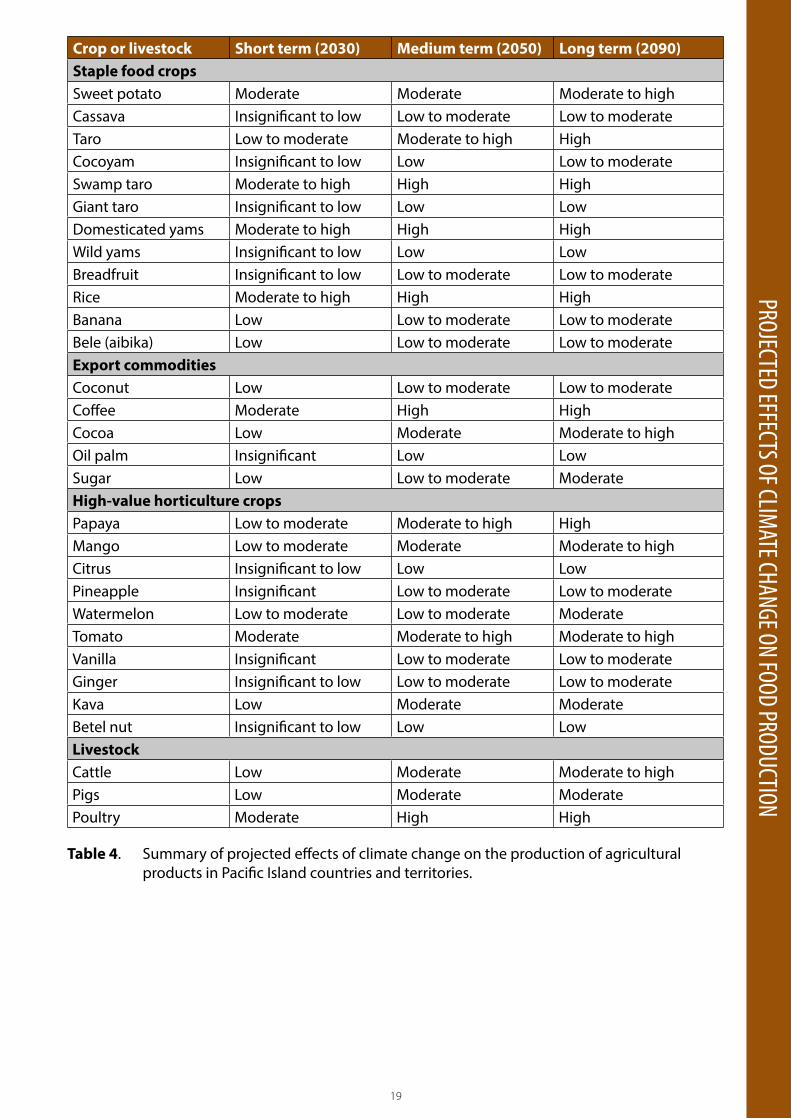
The projected negative and positive impacts of climate change on production of staple food crops, export commodities, high-value horticultural crops and livestock in the tropical Pacific are summarized in Table 4. Note that the projected effects are likely to vary both within countries and between countries. For example, cocoa production could improve in some parts of the region due to increasing temperatures, provided higher risk of diseases due to increasing rainfall can be contained.
19
Crop or livestock Short term (2030) Medium term (2050) Long term (2090)Staple food cropsSweet potato Moderate Moderate Moderate to highCassava Insignificant to low Low to moderate Low to moderateTaro Low to moderate Moderate to high HighCocoyam Insignificant to low Low Low to moderateSwamp taro Moderate to high High HighGiant taro Insignificant to low Low LowDomesticated yams Moderate to high High HighWild yams Insignificant to low Low Low Breadfruit Insignificant to low Low to moderate Low to moderateRice Moderate to high High HighBanana Low Low to moderate Low to moderateBele (aibika) Low Low to moderate Low to moderateExport commoditiesCoconut Low Low to moderate Low to moderateCoffee Moderate High HighCocoa Low Moderate Moderate to highOil palm Insignificant Low LowSugar Low Low to moderate Moderate High-value horticulture cropsPapaya Low to moderate Moderate to high HighMango Low to moderate Moderate Moderate to highCitrus Insignificant to low Low Low Pineapple Insignificant Low to moderate Low to moderateWatermelon Low to moderate Low to moderate ModerateTomato Moderate Moderate to high Moderate to highVanilla Insignificant Low to moderate Low to moderateGinger Insignificant to low Low to moderate Low to moderateKava Low Moderate ModerateBetel nut Insignificant to low Low LowLivestockCattle Low Moderate Moderate to highPigs Low Moderate ModeratePoultry Moderate High High
PROJECTED EFFECTS OF CLIMATE CHANGE ON FOOD PRODUCTION
Table 4. Summary of projected effects of climate change on the production of agricultural products in Pacific Island countries and territories.

20
PROJECTED EFFECTS OF CLIMATE CHANGE ON FOOD PRODUCTION
Fisheries and aquacultureThe assessment of the vulnerability to climate change of fisheries and aquaculture in the region used in this report was based on an end-to-end “climate-to-fish-to-fisheries” approach
(Figure 6). This approach was endorsed by the Food and Agriculture Organization of the United Nations (FAO), International Council for the Exploration of the Sea (ICES) and North Pacific Marine Science Organization (PICES) international symposium on “Climate Change Effects on Fish and Fisheries: Forecasting Impacts, Assessing Ecosystem Responses, and Evaluating Management Strategies”’ held in Sendai, Japan, in 2010 (Murawaski 2011). The
Figure 6. Summary of the end-to-end approach used to assess the vulnerability of tropical Pacific fisheries and aquaculture to climate change (Bell et al. 2013).
approach cascades changes to the tropical Pacific Ocean and surface climate, projected to occur under the Intergovernmental Panel on Climate Change (IPCC) Special Report on Emissions Scenarios (SRES) A2 emissions scenario by global climate models (Appendix 2), along direct and indirect pathways (Figure 7) to identify (i) which of the region’s diverse fisheries and aquaculture resources and activities are expected to increase or decline by 2035, 2050 and 2100 as greenhouse gas emissions increase; (ii) implications for food security and livelihoods; and (iii) priority adaptations and policies needed to minimize the threats and take advantage of opportunities to increase food production.
Oceanic conditions
Ecosystems supporting fish
Fish stocks and aquaculture
Economic and social implications
Adaptations and policies needed to maintain productivity
Atmospheric conditions
21
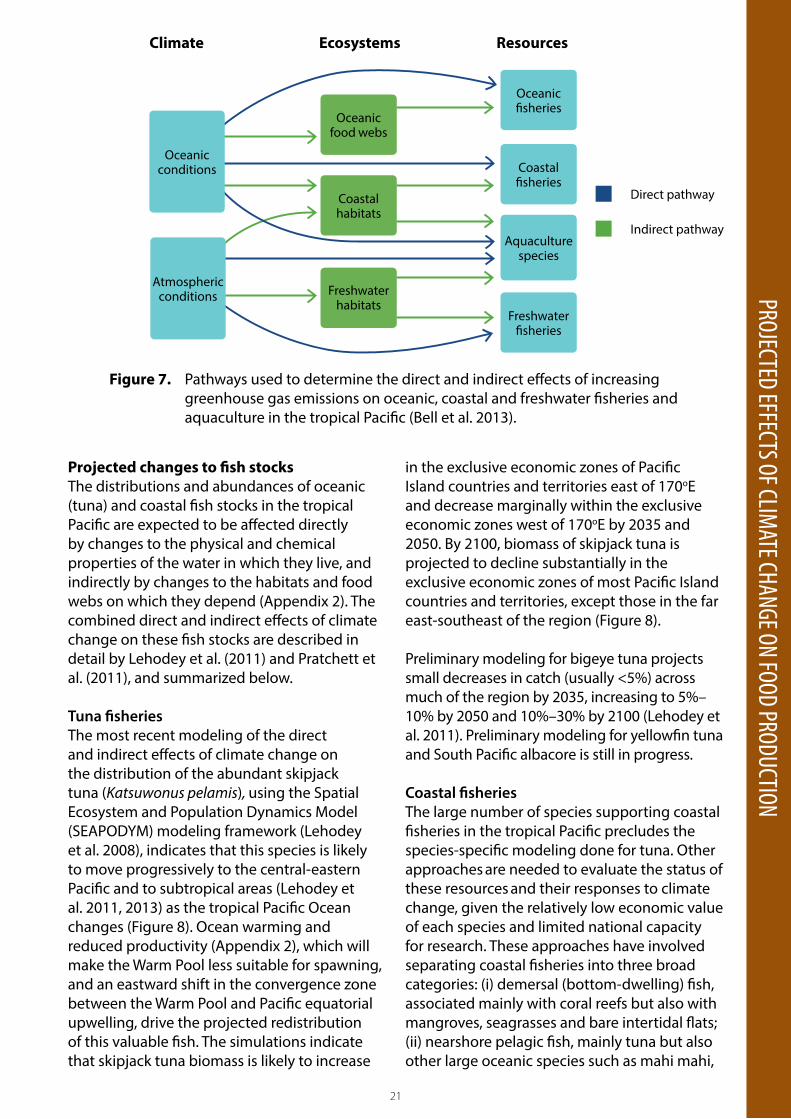
Projected changes to fish stocksThe distributions and abundances of oceanic (tuna) and coastal fish stocks in the tropical Pacific are expected to be affected directly by changes to the physical and chemical properties of the water in which they live, and indirectly by changes to the habitats and food webs on which they depend (Appendix 2). The combined direct and indirect effects of climate change on these fish stocks are described in detail by Lehodey et al. (2011) and Pratchett et al. (2011), and summarized below.
Tuna fisheriesThe most recent modeling of the direct and indirect effects of climate change on the distribution of the abundant skipjack tuna (Katsuwonus pelamis), using the Spatial Ecosystem and Population Dynamics Model (SEAPODYM) modeling framework (Lehodey et al. 2008), indicates that this species is likely to move progressively to the central-eastern Pacific and to subtropical areas (Lehodey et al. 2011, 2013) as the tropical Pacific Ocean changes (Figure 8). Ocean warming and reduced productivity (Appendix 2), which will make the Warm Pool less suitable for spawning, and an eastward shift in the convergence zone between the Warm Pool and Pacific equatorial upwelling, drive the projected redistribution of this valuable fish. The simulations indicate that skipjack tuna biomass is likely to increase
Figure 7. Pathways used to determine the direct and indirect effects of increasing greenhouse gas emissions on oceanic, coastal and freshwater fisheries and aquaculture in the tropical Pacific (Bell et al. 2013).
in the exclusive economic zones of Pacific Island countries and territories east of 170oE and decrease marginally within the exclusive economic zones west of 170oE by 2035 and 2050. By 2100, biomass of skipjack tuna is projected to decline substantially in the exclusive economic zones of most Pacific Island countries and territories, except those in the far east-southeast of the region (Figure 8).
Preliminary modeling for bigeye tuna projects small decreases in catch (usually <5%) across much of the region by 2035, increasing to 5%–10% by 2050 and 10%–30% by 2100 (Lehodey et al. 2011). Preliminary modeling for yellowfin tuna and South Pacific albacore is still in progress.
Coastal fisheriesThe large number of species supporting coastal fisheries in the tropical Pacific precludes the species-specific modeling done for tuna. Other approaches are needed to evaluate the status of these resources and their responses to climate change, given the relatively low economic value of each species and limited national capacity for research. These approaches have involved separating coastal fisheries into three broad categories: (i) demersal (bottom-dwelling) fish, associated mainly with coral reefs but also with mangroves, seagrasses and bare intertidal flats; (ii) nearshore pelagic fish, mainly tuna but also other large oceanic species such as mahi mahi,
PROJECTED EFFECTS OF CLIMATE CHANGE ON FOOD PRODUCTIONClimate Ecosystems Resources
Oceanic food webs
Oceanic fisheries
Coastal fisheries
Aquaculture species
Freshwater fisheries
Coastal habitats
Freshwater habitats
Oceanic conditions
Atmosphericconditions
Direct pathway
Indirect pathway

22
PROJECTED EFFECTS OF CLIMATE CHANGE ON FOOD PRODUCTION
rainbow runner, wahoo and marlin; and (iii) subtidal and intertidal invertebrates (Pratchett et al. 2011).
The dominant demersal fish component of coastal fisheries associated with coral reefs can be separated into specialist coral-feeding fish and coral residents, reef-associated species, and generalist species (Pratchett et al. 2011). The specialist fish species that depend directly
on live coral for food and shelter are likely to experience greater impacts than generalist species, which can switch to using alternative resources. Overall, however, significant changes in species composition of demersal fish associated with coral are expected. The projected decreases for these three types of fish have been integrated by Pratchett et al. (2011) to provide estimates of decreases in demersal fish production (Table 5).
140oE
20oS
0o
20oN
40oN
20oS
0o
20oN
40oN
20oS
0o
20oN
40oN
20oS
0o
20oN
40oN
0 0.05 0.1 0.15 0.2
180o
140oE 140o W 100o W180o
140oE 140o W 100o W180o
140oE 140o W 100o W180o
140o W 100o W
-1% +9%
+1% +12%
-17% +8%
Longitude
Longitude
Longitude
Longitude
Latit
ude
Latit
ude
Latit
ude
Latit
ude
2035
2050
2100
Metric tons per km2
2005
2035
2050
2100
Biom
ass
chan
ge (%
)
Pala
u
FSM
PNG
Solo
mon
Is.
Mar
shal
l Is.
Nau
ru
Tuva
lu
Toke
lau
Kirib
ati
Cook
Is.
Fren
ch
Poly
nesi
a
15
10
5
0
-5
-10
-15
40
20
0
-20
-40
15
10
5
0
-5
-10
-15
a b
c
Aver
age
catc
h (m
etric
tons
x10
00)
Biom
ass
chan
ge (%
)Bi
omas
s ch
ange
(%)
300
250
200
150
100
50
0
Pala
u
FSM
PNG
Solo
mon
Is.
M
arsh
all I
s.
N
auru
T
uval
u
T
okel
au
Kirib
ati
Cook
Is.
Fren
ch P
olyn
esia
1.2 0.7 1.24.5
Country/Territory
Figure 8. Projected distributions of skipjack tuna biomass across the tropical Pacific Ocean under the IPCC SRES A2 emissions scenario: (a) simulations for 2005, 2035, 2050 and 2100 derived from the SEAPODYM model, including projected average percentage changes for the boxed areas east and west of 170oE; (b) recent average annual catches of skipjack tuna (2000–2010) from exclusive economic zones of selected Pacific Island countries and territories; (c) estimated changes in biomass relative to virgin stock levels (dark blue), and incorporating fishing effort 1.5 times greater than the average for 1990–1999 (light blue), for 2035, 2050 and 2100 (Bell et al. 2013).
23
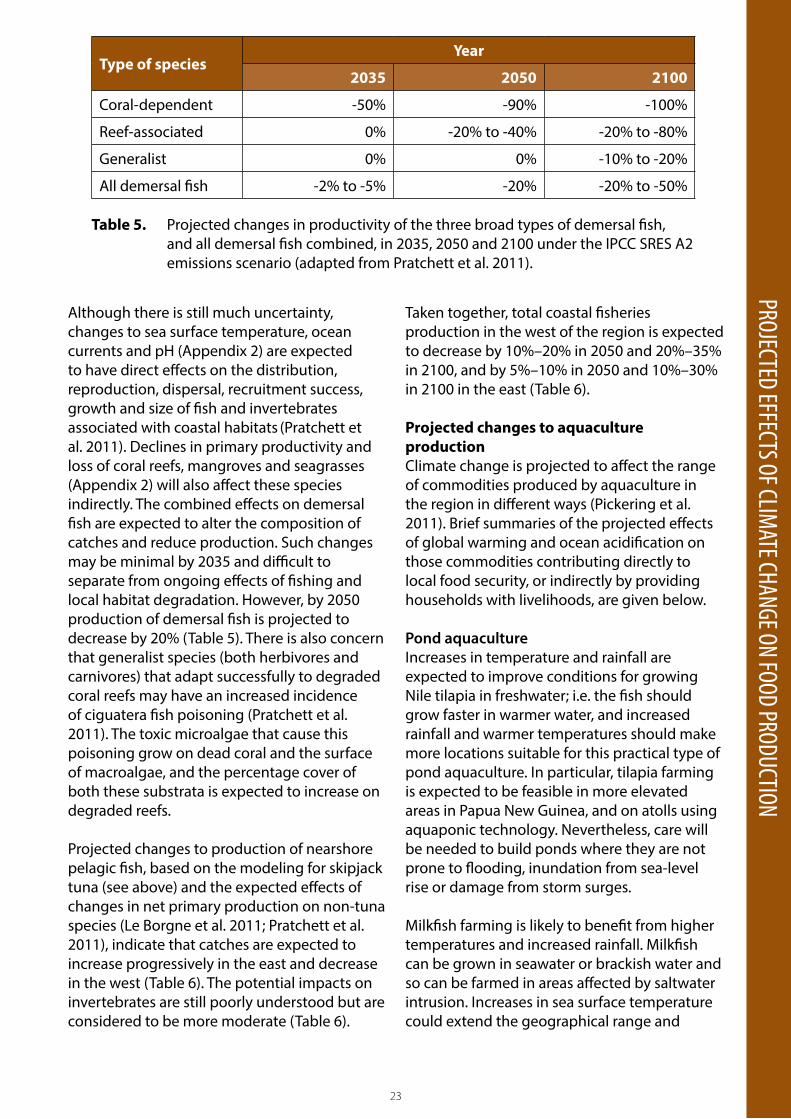
Although there is still much uncertainty, changes to sea surface temperature, ocean currents and pH (Appendix 2) are expected to have direct effects on the distribution, reproduction, dispersal, recruitment success, growth and size of fish and invertebrates associated with coastal habitats (Pratchett et al. 2011). Declines in primary productivity and loss of coral reefs, mangroves and seagrasses (Appendix 2) will also affect these species indirectly. The combined effects on demersal fish are expected to alter the composition of catches and reduce production. Such changes may be minimal by 2035 and difficult to separate from ongoing effects of fishing and local habitat degradation. However, by 2050 production of demersal fish is projected to decrease by 20% (Table 5). There is also concern that generalist species (both herbivores and carnivores) that adapt successfully to degraded coral reefs may have an increased incidence of ciguatera fish poisoning (Pratchett et al. 2011). The toxic microalgae that cause this poisoning grow on dead coral and the surface of macroalgae, and the percentage cover of both these substrata is expected to increase on degraded reefs.
Projected changes to production of nearshore pelagic fish, based on the modeling for skipjack tuna (see above) and the expected effects of changes in net primary production on non-tuna species (Le Borgne et al. 2011; Pratchett et al. 2011), indicate that catches are expected to increase progressively in the east and decrease in the west (Table 6). The potential impacts on invertebrates are still poorly understood but are considered to be more moderate (Table 6).
Type of speciesYear
2035 2050 2100
Coral-dependent -50% -90% -100%
Reef-associated 0% -20% to -40% -20% to -80%
Generalist 0% 0% -10% to -20%
All demersal fish -2% to -5% -20% -20% to -50%
Table 5. Projected changes in productivity of the three broad types of demersal fish, and all demersal fish combined, in 2035, 2050 and 2100 under the IPCC SRES A2 emissions scenario (adapted from Pratchett et al. 2011).
PROJECTED EFFECTS OF CLIMATE CHANGE ON FOOD PRODUCTION
Taken together, total coastal fisheries production in the west of the region is expected to decrease by 10%–20% in 2050 and 20%–35% in 2100, and by 5%–10% in 2050 and 10%–30% in 2100 in the east (Table 6).
Projected changes to aquaculture productionClimate change is projected to affect the range of commodities produced by aquaculture in the region in different ways (Pickering et al. 2011). Brief summaries of the projected effects of global warming and ocean acidification on those commodities contributing directly to local food security, or indirectly by providing households with livelihoods, are given below.
Pond aquacultureIncreases in temperature and rainfall are expected to improve conditions for growing Nile tilapia in freshwater; i.e. the fish should grow faster in warmer water, and increased rainfall and warmer temperatures should make more locations suitable for this practical type of pond aquaculture. In particular, tilapia farming is expected to be feasible in more elevated areas in Papua New Guinea, and on atolls using aquaponic technology. Nevertheless, care will be needed to build ponds where they are not prone to flooding, inundation from sea-level rise or damage from storm surges.
Milkfish farming is likely to benefit from higher temperatures and increased rainfall. Milkfish can be grown in seawater or brackish water and so can be farmed in areas affected by saltwater intrusion. Increases in sea surface temperature could extend the geographical range and

24
PROJECTED EFFECTS OF CLIMATE CHANGE ON FOOD PRODUCTION
season for capturing wild juveniles, although ocean acidification and changes in coastal habitats may have negative effects on the supply of wild-caught fry. If larger-scale farming operations prove to be viable in the region and climate change increases variation in the supply of wild fry, such enterprises could adapt by producing juveniles in hatcheries.
Seaweed The seaweed (Kappaphycus alvarezii) produced in Fiji, Kiribati, Papua New Guinea and Solomon Islands is sensitive to increased sea surface temperature and reduced salinity, which stress the plants and retard growth, resulting in crop losses due to increased incidence of outbreaks of epiphytic filamentous algae and tissue necrosis. Lower salinities caused by increased rainfall are likely to reduce the number of sites where seaweed can be grown. More intense cyclones would increase the risk of damage to the equipment used to grow seaweed in Fiji, but not in Kiribati, Papua New Guinea or Solomon Islands, which are not in the cyclone belt.
Marine ornamentals Conditions for producing the main village-based marine ornamental products—corals and giant clams—are likely to deteriorate due to more frequent bleaching caused by higher sea surface temperature, changes in salinity and turbidity caused by higher rainfall, and reduced aragonite saturation levels from ocean acidification. In some locations, sea-level rise could reduce these potential impacts by improving water exchange.
Summary of changes to fisheries and aquaculture productionThe effects of changes to the atmosphere and ocean on fish habitats and fish stocks underpinning fisheries and aquaculture across the region are expected to result in winners and losers—tuna are expected to be more abundant in the east, and freshwater aquaculture is likely to be more productive. Conversely, coral reef fisheries could decrease by 20% by 2050, and coastal aquaculture is expected to be less efficient (Figure 9).
Year Demersal fish
Nearshore pelagic fish Shallow subtidal and
intertidal invertebrates
Total coastal fisheries***
West* East** West* East**
2035 -2% to -5% 0% +15% to +20% 0% Negligible Negligible
2050 -20% -10% +20% -5% -10% to -20% -5% to -10%
2100 -20% to -50% -15% to -20% +10% -10% -20% to -35% -10% to -30%
* 15°N–20°S and 130°E and 170°E; ** 15°N–15°S and 170°E and 150°W; *** assumes that the proportions of coastal fisheries categories remain constant.
Table 6. Projected changes in production of the three categories of coastal fisheries, and total coastal fisheries production, in 2035, 2050 and 2100 under the IPCC SRES A2 emissions scenario. Note that availability of nearshore pelagic fish is expected to increase in the eastern part of the region (adapted from Pratchett et al. 2011).

25
Phot
o Cr
edit:
Que
ntin
Han
ich/
Uni
vers
ity o
f Wol
long
ong
Abatao fishers.
25
Figure 9. Projected directions of changes in the availability of fish for food security and to support livelihoods from the main fisheries and aquaculture resources in Pacific Island countries and territories. Projections are for the IPCC SRES A2 emissions scenario in 2035, 2050 and 2100, summarized as estimated increases (winners) or decreases (losers) in broad percentage categories. Oceanic (tuna) fisheries are separated into those east and west of 170oE. Projections for pond and coastal aquaculture are not relative to present-day production (which has potential for increase) and indicate estimated changes in production efficiency (Bell et al. 2013).
Tuna fisheries Coral reef fisheries
Freshwater fisheries
AquacultureWest East Ponds Coastal
2035
2050
2100
Percentage increase
<5 <55–10 10–2010–20 >30
Percentage decrease PROJECTED EFFECTS OF CLIMATE CHANGE ON FOOD PRODUCTION

26
IMPLICATIONS FOR FOOD SECURITY
IMPLICATIONS FOR FOOD SECURITY
AgricultureThe implications of climate change for agricultural production in the Pacific Islands are likely to entail a complex interplay between the unfavorable and favorable effects on the performance of the plants and animals involved, as well as the broad range of other factors affecting production, such as geographic location, resource endowment, farming practices, the degree of dependence on agriculture and for livelihoods, and the social and financial capital of countries and communities (Taylor et al. in press-c).
But the interactions of climate change with the physical, social and financial attributes of Pacific Island countries and territories are not the only factors affecting the sector; noncommunicable diseases, population growth and urbanization are all significant—and more immediate—challenges to the contributions of agriculture to food security and livelihoods. Indeed, the effects of population growth on the food supply over the next two decades are expected to be just as consequential as the eventual impacts of longer-term climate change (Lobell and Tebaldi 2014).
The heavy reliance of Pacific Island countries and territories on imported staples must also be recognized. The risks posed to global rice and wheat production by climate change (Porter et al. 2014), linked with increasing demand for these basic foods by the expanding world population, is likely to lead to less secure and more costly supplies of imported staples in the region. The resilience of Pacific staple food crops to the effects of global warming compared to staples grown in other regions provides opportunities to soften the potential effects of climate change on food security and livelihoods in Pacific Island countries and territories. Variability in the supply of rice and wheat could also create a favorable trend in the relative prices of domestic versus imported foods, thereby providing incentives to develop local agriculture.
Despite this seemingly favorable position, climate-related risks to food production
and livelihoods need to be acknowledged and minimized over the coming decades by developing strategies to maximize the resilience of staple food crops and enhance their productivity and their attractiveness to the consumer (SPC 2011; Taylor et al. in press-a).
Governments, development agencies, communities and farmers will need to work together to develop alternative livelihoods where it is recognized that production of a particular commodity is threatened, such as coffee in Papua New Guinea. Similarly, where the projected impact of climate change is deemed to be favorable, such as for banana cultivation at higher altitudes in Papua New Guinea and cocoa production in Fiji, stakeholders will need to ensure they can take advantage of such opportunities. Measures need to be taken to minimize the physical and socioeconomic constraints faced by farmers to improve food systems and make livelihoods less vulnerable (Taylor et al. in press-a); for example, coconut production needs to be revitalized by replacing senile coconut palms with new trees (McGregor et al. in press-a).
Fisheries and aquacultureThe implications of the projected changes in quality and area of fish habitats, status of fish stocks, and aquaculture production for the food security of Pacific Island people have to be assessed in the face of the other drivers of change affecting the sector (Hall 2011). In the context of Pacific Island countries and territories, the overriding driver affecting future access to fish is population growth. Rapid population growth not only progressively reduces the availability of finite fish supplies per capita; it can also undermine fish supply through the degradation of habitats that attends expansion of urban areas and rural communities (Sale et al. 2014).
The looming shortfalls in the fish required for good nutrition of rapidly growing rural communities and urban centers, as well as the implications for food security and public health given the high dependence on fish for animal protein and importance of subsistence fishing
27
in rural areas, have been well documented (SPC 2008; Bell et al. 2009, 2011d, 2015). Although shortfalls will not occur in all Pacific Island countries and territories, the implications for several countries (e.g. Kiribati, Papua New Guinea, Solomon Islands and Vanuatu) are serious. These implications call for rapid and effective action in three areas.
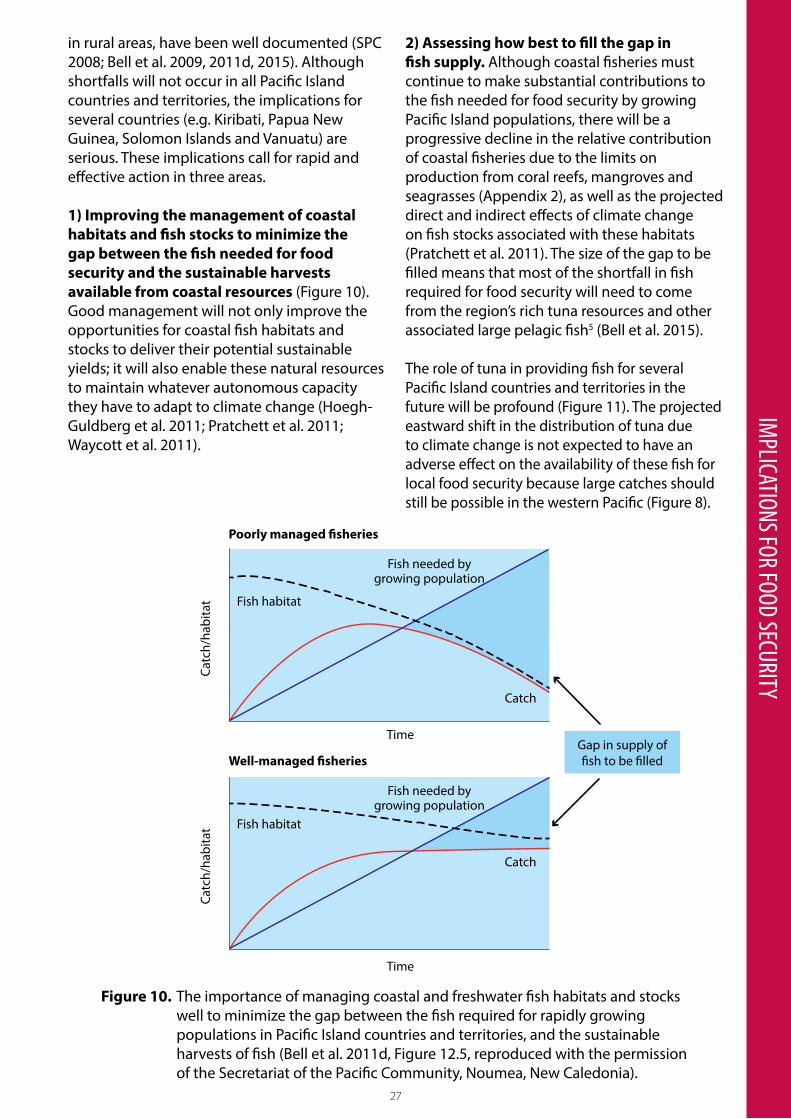
1) Improving the management of coastal habitats and fish stocks to minimize the gap between the fish needed for food security and the sustainable harvests available from coastal resources (Figure 10). Good management will not only improve the opportunities for coastal fish habitats and stocks to deliver their potential sustainable yields; it will also enable these natural resources to maintain whatever autonomous capacity they have to adapt to climate change (Hoegh-Guldberg et al. 2011; Pratchett et al. 2011; Waycott et al. 2011).
IMPLICATIONS FOR FOOD SECURITY
Figure 10. The importance of managing coastal and freshwater fish habitats and stocks well to minimize the gap between the fish required for rapidly growing populations in Pacific Island countries and territories, and the sustainable harvests of fish (Bell et al. 2011d, Figure 12.5, reproduced with the permission of the Secretariat of the Pacific Community, Noumea, New Caledonia).
2) Assessing how best to fill the gap in fish supply. Although coastal fisheries must continue to make substantial contributions to the fish needed for food security by growing Pacific Island populations, there will be a progressive decline in the relative contribution of coastal fisheries due to the limits on production from coral reefs, mangroves and seagrasses (Appendix 2), as well as the projected direct and indirect effects of climate change on fish stocks associated with these habitats (Pratchett et al. 2011). The size of the gap to be filled means that most of the shortfall in fish required for food security will need to come from the region’s rich tuna resources and other associated large pelagic fish5 (Bell et al. 2015).
The role of tuna in providing fish for several Pacific Island countries and territories in the future will be profound (Figure 11). The projected eastward shift in the distribution of tuna due to climate change is not expected to have an adverse effect on the availability of these fish for local food security because large catches should still be possible in the western Pacific (Figure 8).
Gap in supply of fish to be filled
Catc
h/ha
bita
t Fish habitat
Fish habitat
Fish needed by growing population
Fish needed by growing population
Catch
Catch
Time
Time
Catc
h/ha
bita
t
Poorly managed fisheries
Well-managed fisheries

28
IMPLICATIONS FOR FOOD SECURITY
The quantities of tuna required for future food security in Papua New Guinea and Solomon Islands dwarf the amounts needed by other Pacific Island countries and territories (Figure 11). An important implication for Papua New Guinea and Solomon Islands, however, is that an increasing proportion of average tuna catches from their exclusive economic zones and archipelagic waters will be required for local food security over time. These proportions have been estimated to reach 11% for Papua New Guinea and 6% for Solomon Islands, respectively, in 2035 (Bell et al. 2015).
Where access to tuna is difficult or variable due to the effects of climatic variability (ENSO) on the distribution of tuna (Lehodey et al. 1997, 2011), pond aquaculture of Nile tilapia and milkfish has potential to make locally important contributions to fish supply in rural settings through household and small enterprises, and in urban areas through larger-scale businesses in peri-urban areas (Pickering et al. 2011).
3) Promoting the vehicles needed to deliver the fish required. Allocating more of the average national tuna catch to local food security and developing pond aquaculture is one thing; providing access to this fish for rural and urban communities at affordable prices and in environmentally and socially responsible ways is another.
Launching the actions needed to address the implications outlined above should not be deferred—they are urgent national priorities. At least seven Pacific Island countries and territories will face shortfalls in the fish needed for food security in both rural and urban areas by 2020, and another seven Pacific Island countries and territories are expected to have problems delivering fish from remote coral reefs to urban centers (Table 7).
Figure 11. Percentage contributions of various fisheries and aquaculture resources required to supply selected Pacific Island countries and territories with the fish recommended for good nutrition. Contributions of resources needed to supply 35 kilograms (kg) of fish per person per year in 2035, 2050 and 2100 have been adjusted for the effects of climate change on coastal fisheries (Pratchett et al. 2011). Estimates of the fish required in Papua New Guinea are based on national consumption of 13 kg per person per year to reflect difficulties in distributing fish to inland areas. Percentages do not always sum to 100 due to rounding (Bell et al. 2013).
Fish needed (metric tons x 1000)
Papua New Guinea Solomon Islands
2010 (87,785 t)
2010 (87,785 t)
2050 (172,524 t)
2100 (274,625 t)
0 50
65
40
29
16
11
13 44
55
6897
2015
100 150 200 250 300
2010 (19,236 t)
2035 (33,947 t)
2050 (41,345 t)
2100 (68,910 t)
0
78
64
46
24
27
43
11 61
10 20 30 40 50 60 70Fish needed (metric tons x 1000)
Vanuatu Samoa2010 (8,813 t)
2035 (14,000 t)
2050 (16,905 t)
2100 (24,325 t)
0
37
23
17
11 10 78
6 77
74
62
5 10 15 20 25
2010 (6409 t)
2035 (7070 t)
2050 (7341 t)
2100 (8405 t)
0
80 20
70 27
356
45
59
43 11
2 4 6 8 10
Fish needed (metric tons x 1000) Fish needed (metric tons x 1000)
% Coastal fisheries % Freshwater fisheries % Aquaculture % Tuna fisheries

29
Pacific Island country or territory
Coastal fish production(metric tons/year)a
2020
Fish needed for food(metric tons)b
Surplus (+) or deficit (-)(metric tons)c
Countries and territories with a fish deficit
Papua New Guinead 81,260 117,000 -18,200
Solomon Islandse 27,610g 25,400 +2,210
Samoaf 14,000 15,600 -1,600
Kiribatif 12,960 10,900 +2,060
Vanuatue 3,730 10,800 -7,070
American Samoaf 1,100 2,100 -1,000
Commonwealth of the Northern Mariana Islandse
750 2,100 -1,350
Guame 710 6,900 -6,190
Nauruf 130 700 -570
Countries and territories with difficulty distributing fish to urban centers
Fijie 77,000 31,100 +45,900
Federated States of Micronesiaf
45,220 7,600 +37,620
French Polynesiaf 45,380 18,800 +26,580
Tongae 17,430 3,600 +13,830
Tuvaluf 9,530 1,300 +8,230
Wallis and Futunaf 2,800 900 +1,900
Niuef 170 100 +70
Table 7. Quantities of fish needed for food in 2020 and 2035, and surpluses (+) or deficits (-) in coastal fish supply, relative to the recommended or traditional levels of fish consumption for two groups of Pacific Island countries and territories (adapted from Bell et al. 2015).
a Based on median estimates of sustainable fish harvests of 3 metric tons per km2 of coral reef (Andréfouët et al. 2006; Newton et al. 2007) and other sources of information (Bell et al. 2015).
b Based on population projections by the Secretariat of the Pacific Community’s Statistics for Development Division.
c Calculations for 2035 include a 2%–5% reduction in the production of coastal fisheries due to the effects of climate change (Pratchett et al. 2011).
d Fish needed for food based on providing 35 kg per person to people living within 5
kilometers (km) of the coast and 28 kg per person for people living in coastal urban areas; with population estimates provided by the Statistics for Development Division, Secretariat of the Pacific Community.
e Fish needed for food based on recommended fish consumption of 35 kg per person per year.
f Fish needed for food based on recent traditional levels of fish consumption for rural and/or urban populations, which are greater than 35 kg per person per year (Bell et al. 2009; Gillett 2009).
g Includes 2000 metric tons of freshwater fish.
IMPLICATIONS FOR FOOD SECURITY

30
PRIORITY ADAPTATIONS
PRIORITY ADAPTATIONS
Important questionsSeveral questions need to be addressed when selecting adaptations to address the implications of drivers such as rapid population growth and climate change for the food security of Pacific Island countries and territories. These questions, and the reasons why they are appropriate in the context of climate change and food security in the Pacific Island region, are outlined below.
Has an integrated, no-regrets approach been used?Because other important drivers like population growth and urbanization are likely to affect per capita access to food production from agriculture, fisheries and aquaculture before the projected effects of climate change become strongly limiting, a framework is needed for planned adaptations that addresses the other drivers in the near term and climate change in the longer term (Grafton 2010; Bell et al. 2011a). The best investments will be those that deliver short-term and long-term benefits—what could be called “win-win” adaptations (Figure 12). Adapting to climate change will also involve “lose-win” adaptations—where economic and social costs exceed the benefits in the near term, but where investments position communities to receive net benefits in the
longer term under a changing climate. “Win-lose” investments represent maladaptation to climate change and should be avoided, except where human survival may otherwise be compromised.
Do the adaptations support sound land management?Traditional food production in the Pacific is based on agroforestry. The most common form is shifting cultivation, or slash-and-burn rain-fed gardens, associated with arboriculture of local fruit and nut species. In a given area, farmers will cultivate land for about three years before abandoning it for a much longer period. A range of crops are cultivated in agroforestry—all crops of good nutritional value and with little dependence on external inputs or extension services. These multicrop garden systems, which are protected by trees within the garden and often by forest (primary or secondary), reduce the risk to crops from natural disasters. These systems are adjusted for resource endowments, the seasons and occasional natural disasters. Families often have several, albeit relatively small, traditional food gardens that use the best locations for particular crops, maintain the use of land, and—importantly—reduce the risk of all crops being lost at one time (McGregor et al. in press-b).
Figure 12. Decision framework for identifying adaptations to address climate change and other drivers (adapted from Grafton 2010 and Bell et al. 2011a).
Climate change
Oth
er d
river
s
Long-term loss
Nea
r-te
am g
ain
Nea
r-te
am lo
ss
Long-term gain
Lose-win
Win-lose Win-win
Lose-lose

31
PRIORITY ADAPTATIONSIn recent years, many food production systems in the Pacific have become unsustainable. Drivers such as increasing population pressure and urban migration have forced farmers to abandon traditional practices. At the same time, economic incentives have encouraged them to adopt new ones without understanding all the implications. Reduced fallow periods or repeated cropping of high-value crops on the same land, often without rotations or sufficient replenishment of soil nutrients, have resulted in falling yields and increasing pest and disease problems. Excessive clearing of vegetation promotes soil erosion and runoff into the sea, damaging coral reefs and other coastal fish habitats (Appendix 2). Crops grown close to rivers are subject to flooding or prolonged periods of waterlogging. Paying attention to soil fertility, crop diversity, livestock waste management, etc., must be combined with an ecosystem-based approach (whole of island, ridge to reef ), which will help to bring about the necessary changes in land use and support sound land management (Markham 2013). Acknowledging the importance of soil health and fertility, diversity, and climate-resilient agroforestry systems has to be the overriding adaptation response in agriculture to climate change.
Do the adaptations dovetail with best practices for management of coastal fisheries?It is widely recognized that the coastal fisheries of Pacific Island countries and territories cannot be managed in the same way as the region’s rich tuna resources. The coastal fisheries are based on hundreds of species of fish and invertebrates, very few of which yield sufficient economic and social benefits in their own right to justify the type of stock assessments made for tuna (Bell et al. 2011a). Another major difference is that coastal fisheries stocks are usually restricted to national waters and may form self-replenishing populations on relatively small spatial scales. The threats to sustainable production are therefore usually local. Confronting habitat degradation caused by agriculture, forestry and mining activities in catchments, and overfishing due to population growth and other economic and social drivers (Allison et al. 2011; Hall 2011; Gillett and Cartwright 2010; Kronen et al. 2010), present the two greatest challenges.
Strengthening the long tradition of community-based management in Pacific Island countries and territories and incorporating an ecosystem-based approach (Heenan et al. 2013, 2015; FAO 2003; Preston 2009) is broadly seen as offering the best hope of securing coastal fisheries resources for the future (Gillett and Cartwright 2010; SPC 2010; Govan et al. 2008). In much of Melanesia, community-based approaches to fisheries management are also favored by long-standing customary marine tenure (Aswani 2005; Cinner 2005; Ruddle et al. 1992), which helps to ensure that benefits accrue directly to communities.
Although many Pacific Island countries and territories may aspire to produce more fish from their coastal waters to feed growing populations, management that aims to avoid further depletion of overfished stocks is likely to be more appropriate in the short term than management aimed at maximizing sustainable production. Using primary fisheries management6 to limit catches in order to avoid irreversible damage to stocks in the face of uncertainty (Cochrane et al. 2011), as well as investing in the social capital and management institutions needed for communities and governments to manage coastal fisheries (Pomeroy and Andrew 2011), are high priorities. Unfortunately, the projected increases in degradation of coral reefs due to global warming and ocean acidification are expected to increase uncertainty, demanding an even more precautionary approach (Hobday et al. 2011) and reducing responsible yields from coastal fisheries even further (Figure 13).
Have both autonomous and planned adaptations been considered?Two broad categories of adaptations are needed to maintain the strong contributions of fisheries and aquaculture to regional food security. First, the potential for autonomous7 adaptation to climate change by the habitats and stocks that underpin fisheries production should be maximized by reducing other stresses on these natural resources. Second, planned8 adaptations are needed to improve the quantities of food harvested from fisheries, aquaculture and agriculture in ways that reduce the threats of climate change and capitalize on the opportunities (Figure 14).

32
PRIORITY ADAPTATIONS
Figure 13. General relationship between potential benefits from coastal fisheries (green line), and uncertainty in information for management (blue line), as functions of management costs, for primary, secondary and tertiary fisheries management. The reduction in benefits under primary fisheries management as a result of the increased uncertainty caused by climate change (CC) is indicated by the orange shading (adapted from Bell et al. 2011a; Cochrane et al. 2011).
Figure 14. Relationships between the objective for providing food security for Pacific Island countries and territories (orange), the fisheries resources on which this benefit is based (green), the actions and institutional outputs needed to deliver these benefits (blue), and the components of the system where autonomous adaptation could help limit the potential impact of climate change and where planned adaptation should reduce the threats of climate change and capitalize on opportunities to maintain or enhance food security (Bell et al. 2011a, Figure 13.3, reproduced with the permission of the Secretariat of the Pacific Community, Noumea, New Caledonia).
Habitats
Stocks
Assessments
Food security
Monitoring
Livelihoods
Planned adaptation
Autonomous adaptation
Allocations
VehiclesManagement
Policies
Economic development and govenment revenue
Secondary
Cost
TertiaryPrimary
Low Medium High
Unc
erta
inty
Bene
fits
CC
33
Do the proposed adaptations respect human rights?Identification of win-win and lose-win adaptations should not be based simply on the availability of technology and projected future responses of the resources underpinning fisheries, aquaculture and agriculture. Potential social barriers to the uptake of appropriate technology, such as cultural norms and gender issues, may limit broad-based community participation. The probability of removing these barriers in order to provide communities with a wider range of strategies to adapt to climate change must be assessed when evaluating the likely success of proposed adaptations.
Adaptations must also be designed and delivered in a way that is acceptable to those whom they are intended to benefit. This important prerequisite is expected to be relatively easy to achieve in many cases, because the traditional ways that Pacific Island people use to respond to and cope with extreme events such as cyclones and droughts are likely to predispose them to embracing and implementing new adaptations. However, improvements can be made to traditional ways of responding to extreme events, particularly by (i) increasing the equal participation of women and men in all aspects of planning and applying adaptations, and (ii) ensuring that the people likely to be affected are involved in negotiations to select and implement adaptations.
Do the adaptations address both climate change and disaster risk management?Disaster risk management and climate change adaptation both attempt to address underlying causes of vulnerability and risks to sustainable national development caused by geophysical or climate-related hazards, whether they be slow or sudden-onset in nature. Combining disaster risk management and climate change adaptation is particularly pertinent in the Pacific, where there is a large overlap between the most common natural disasters and the impacts of climate change (i.e. cyclones and floods). Accordingly, the majority of Pacific Island countries and territories have joint strategic national action plans for disaster risk management and climate change adaptation. There is also a regional Strategy for Disaster and Climate Resilient Development in the Pacific. Thus, planned adaptations should also cover
the full range of natural disasters caused by climatic variability and climate change.
Win-win and lose-win adaptations for agricultureIn the study led by the Secretariat of the Pacific Community and reported by Taylor et al. (in press-c), a number of broad adaptation options have been identified that if effectively applied could serve to maintain the important role of agriculture for food security in the region. These priority win-win and lose-win adaptations, which cover the various subsectors previously discussed (staple food crops, export commodities, high-value horticulture crops and livestock), are summarized below.
Adaptation A1: Improve soils (win-win).Improve soil health management through use of cover crops, legumes, composting and agroforestry systems. Curb land clearing and encourage sustainable levels of land-use intensification to prevent land degradation and loss of soil fertility, improve productivity, and build resilience to climate change.
Adaptation A2: Enhance pest, disease and weed controls (win-win).Enhance quarantine capabilities, sentinel monitoring programs, and commitment to identification and management of pests, weeds and disease threats to counteract those pathogens and pests likely to be favored by climate change. The recent development of plant health clinics and the release of an app for Pacific Pests and Pathogens9 illustrate the approaches that can be applied.
Adaptation A3: Improve water use efficiency (lose-win).Introduce cost-effective technologies and management practices to reduce pressure on water resources, including appropriate application of fertilizer and pesticides, as well as careful management of agricultural wastes, to reduce pollutant loads to aquifers, rivers and coastal habitats. Water conservation approaches such as eco-sanitation can also have direct benefits to agriculture, as demonstrated by the use of composting toilets in atoll environments, which saves precious drinking water while also providing a valuable source of organic material for community gardens.
PRIORITY ADAPTATIONS
34
PRIORITY ADAPTATIONS
Adaptation A4: Integrate traditional and modern farming practices (lose-win).Promote traditional farming systems that match the carrying capacity of the land to improve long-term productivity and resilience. Avoid reduced fallow periods or repeated cropping of high-value crops on the same land, especially without rotations or sufficient replenishment of soil nutrients. Such methods have resulted in a number of significant challenges in industries such as ginger and taro exports from Fiji.
Adaptation A5: Improve processing and storage of staples (win-win).Improve processing and storage of staples to offset production losses due to climate change. Explore export opportunities through exploiting the chemotype10 potential of root crops and breadfruit.
Adaptation A6: Protect ecosystem assets (win-win).Protect and replant littoral forest to help build resilience of coastal agroforestry farming systems and maintain coastal forest integrity.
Adaptation A7: Maintain and enhance crop diversity (win-win).Improve assessment of crop, tree and livestock diversity in the region; strengthen mechanisms for access to diversity from outside the region; and enhance national germplasm and planting material conservation and distribution networks. More extensive multilocational evaluation of diversity combined with simulation modeling will help ensure that appropriate provision of planting material is achieved. Identify barriers to adoption of new varieties, as well as champions at the national and local level, to support wider uptake of new varieties.
Adaptation A8: Improve crops, trees and livestock (win-win).Develop crops, trees and livestock that are more tolerant of climatic and environmental extremes and, where possible, use centralized and decentralized breeding programs to address known pest and disease risks. Crop breeding initiatives aimed at increased processing efficiency should focus on ease of harvest of the underground organs (short neck for cassava, compact tubers for yams) and on dry matter content, which is highly correlated with starch content.
Adaptation A9: Increase use of protected cultivation and nursery systems (lose-win).Use polythene-and-netting tunnels to protect horticultural crops from extreme heat and extend off-season planting of vegetables. Combine protected cultivation with irrigation pumps and drip irrigation to enable production to be moved away from riverbanks that are vulnerable to flooding.
Supporting policies for agricultureThe policies required to implement the adaptations that seek to maintain the contributions of agriculture to food security are outlined below and summarized in Table 8.
Policy A1: Support initiatives that integrate traditional and modern farming practices, such as breadfruit orchards, and which demonstrate climate-smart practices, including enhancing soil health, managing pests and diseases, and improving water storage and harvesting.
Policy A2: Promote the benefits of agroforestry, including consideration of an incentive system for rewarding farmers for the ecosystem services they provide to society.
Policy A3: Support enhancement of soil productivity, including methods that help farmers make their own assessment of constraints and options for improving soil productivity within their particular farming situation, and that encourage farmer experimentation.
Policy A4: Promote sustainable production and consumption of local foods, especially staple food crops, through building awareness and capacity at all levels to understand the threats from climate change posed to imported grain-based food and ensuring that information regarding climate resilience and nutritional benefits of traditional food crops is disseminated across sectors and to rural communities.
Policy A5: Strengthen national and community efforts in processing staple food crops through support for research, increased access to technical support and information, and availability of finance for initial investment costs.

35
Policy A6: Promote the use of ecosystem-based approaches to ensure a greater understanding of the importance of good management of ecosystem processes at the farmer and community levels.
Policy A7: Provide subsidies and incentives for crop and livestock substitution and/or expensive inputs or modifications that will improve climate resilience of food production systems.
Policy A8: Recognize the importance of crop, tree and livestock diversity for strengthening food production systems, and establish and strengthen mechanisms, such as ratification of the International Treaty on Plant Genetic Resources for Food and Agriculture, so that agricultural diversity can be exchanged and shared nationally, regionally and internationally. Support such initiatives by establishing efficient and effective processes for addressing biosecurity concerns.
Policy A9: Support better utilization of the region’s crop and livestock diversity, not only through facilitating diversity exchange (Policy A8), but also through supporting national (where appropriate) and regional crop and livestock improvement and breeding programs.
Policy A10: Improve access to water through investments in storage facilities, eco-sanitation and community-managed irrigation systems that would help to overcome short- or long-term periods of drought.
Win-win and lose-win adaptations for fisheries and aquacultureThe priority win-win and lose-win adaptations for maintaining the important role of fish for food security in the region have been described by Bell et al. (2011a). These adaptations center on safeguarding fish habitats, optimizing catches of coastal demersal and freshwater fish, and filling the gap in fish needed for food security. Several of these interventions are not new—they have already been proposed as part of effective coastal zone management and ecosystem-based fisheries management, as well as to address the effects of population growth on the availability of fish for food security (Bell et al. 2011a and references therein). The most effective way to implement many of these adaptations is through community-based management frameworks, which integrate customary marine tenure and other social capital, local governance, traditional knowledge, self-interest, and self-enforcement capacity.
Adaptations to safeguard fish habitatsAdaptation F1: Manage and restore vegetation in catchments (win-win).Sustaining coastal fish production begins with maintaining catchment vegetation. Good vegetation cover reduces the movement of sediments and nutrients into river networks after heavy rainfall, thereby greatly diminishing the potential impacts on coastal fish habitats. Poor vegetation cover results in accelerated runoff
Adaptation Type Supporting policy*
A1 Improve soils W-W A1, A2, A3
A2 Enhance pest, disease and weed controls W-W A1, A2
A3 Improve water use efficiency L-W A1, A10
A4 Integrate farming practices L-W A1, A4
A5 Improve processing and storage of staples W-W A4, A5
A6 Protect ecosystem assets W-W A2, A3, A6
A7 Maintain and enhance crop diversity W-W A1, A2, A8, A9
A8 Improve crops, trees and livestock W-W A8, A9
A9 Increase use of protected cultivation and nursery systems L-W A7
*Refers to supporting policy number on pages 34–35; W = win; L = lose
Table 8. Relationships between adaptations and supporting policies to maintain the contributions of agriculture to food security for Pacific Island countries and territories.
PRIORITY ADAPTATIONS

36
PRIORITY ADAPTATIONS
and erosion, which directly damage coral reef, mangrove and seagrass habitats and make corals less resilient to bleaching (Hoegh-Guldberg et al. 2011; Waycott et al. 2011; Figure 15). The main interventions needed to ensure that adequate levels of vegetation are maintained in catchments are summarized below.
• Promote the importance of catchment management for fisheries at national planning meetings, and obtain commitments from the agriculture, forestry
Figure 15. Differences in the quality of fish habitats under the influence of well-managed and poorly managed catchments (Bell et al. 2011a, Figure 13.4, reproduced with the permission of the Secretariat of the Pacific Community, Noumea, New Caledonia).
and mining sectors to implement best practices to conserve vegetation and replant trees, minimize soil exposure and loss during construction of infrastructure, and prevent pollutants from entering watercourses.
• Raise awareness of the downstream effects of poorly designed agriculture and forestry operations; facilitate broad-based participation in the diversification of agroforestry.
Well-managed catchment Poorly managed catchment
Land useHabitats Processes
Burial of habitat
Vegetated catchment
Unvegetated catchment
Agriculture
Mining
Logging
Mangrove
Bare sand
Seagrass
Coral reef
Freshwater input
Sediment and nutrient input
Sediment and nutrient transfer
Scouring of streambank
Sediment deposition
Nutrient uptake
37
Adaptation F2: Foster the care of coastal fish habitats (win-win).In addition to the vital importance of minimizing sediment and nutrient inputs to the coastal zone from runoff, several measures are needed to improve the resilience of coastal fisheries to climate change. These measures are listed below.
• Control pollution and manage waste from urban areas. These are responsible interventions at any time, but require even greater attention in the future because the projected changes to coastal waters may reduce their capacity to attenuate waste.
• Eliminate activities that damage the three-dimensional structure of coral reefs (Hoegh-Guldberg et al. 2011; Pratchett et al. 2011). Such activities include destructive fishing methods, extraction of coral for building materials, and poorly designed coastal infrastructure and tourist activities and facilities.
• Prohibit activities that reduce mangroves, such as removing trees, and that damage the structural complexity of seagrasses, such as dredging or fishing with trawl nets (Waycott et al. 2011).
• Strengthen awareness of communities about the dependence of fish and invertebrates on coastal habitats; and liaise with communities to maintain connectivity among coral reefs, mangroves, seagrasses and intertidal flats to conserve the habitat mosaic needed for successful recruitment of juvenile fish and invertebrates (Waycott et al. 2011).
• Enlist the assistance of NGOs, coral reef task forces,11 and programs such as Seagrass Watch12 to help communities protect fish habitats while using these habitats to meet their needs in ways that combine traditional approaches and government regulations for sustainable use of resources.
Adaptation F3: Provide for landward migration of coastal fish habitats (lose-win).Avoid building infrastructure on low-lying land adjacent to mangroves, which will eventually have to be protected from sea-level rise by
erecting barriers to inundation. Instead, such low-lying areas should remain undeveloped to provide opportunities for mangroves to migrate landward (Waycott et al. 2011) and help mitigate CO2 emissions. Where existing road infrastructure blocks the inundation of low-lying land suitable for the colonization of mangroves, channels and bridges should be constructed to allow inundation to occur. Communities should also be encouraged and trained to plant mangroves in such places to fast-track the establishment of the trees (Waycott et al. 2011).
Adaptations to optimize catches of coastal demersal fishAdaptation F4: Sustain production of coastal fish and invertebrates (lose-win).Precautionary measures based on primary fisheries management intended to keep production of demersal coastal fish and invertebrates within sustainable bounds are needed. Such measures will reduce catches in the short term but should help narrow the gap between coastal fisheries production and the fish needed by rapidly growing populations in the longer term by safeguarding the potential for stocks to be replenished.
Adaptation F5: Diversify catches of coastal fish and invertebrates (lose-win).Raising awareness of the alterations in relative abundance of demersal coastal fish and invertebrate species, driven by changes in distribution (Cheung et al. 2010) and an increase in herbivorous species (Pratchett et al. 2008, 2011) due to climate change, will assist communities to optimize catches. However, harvesting of herbivorous fish needs to be restrained to ensure they are plentiful enough to remove the algae that inhibit survival and growth of coral (Bellwood et al. 2004; Hughes et al. 2007).
Adaptations to fill the gap in fish needed for food securityAdaptation F6: Increase local access to tuna for food (win-win).The rich tuna resources of the region provide Pacific Island countries and territories with the opportunity to fill the gap between the fish needed for good nutrition in the future and the fish expected to be available from coastal demersal fisheries (Bell et al. 2011d, 2015).
PRIORITY ADAPTATIONS

38
PRIORITY ADAPTATIONS
The key adaptation for increasing the access of coastal communities to tuna involves transferring coastal fishing effort from coral reef fish to oceanic fisheries resources. This can be done most effectively by installing networks of low-cost fish aggregating devices (Figure 16) anchored close enough to the coast (usually within 1 km from the shore at depths of 300–1000 meters [m]) to provide better access to tuna for subsistence and small-scale commercial fishers. Even in Papua New Guinea and Solomon Islands, where tuna catches are eventually expected to diminish, tuna should still be plentiful enough to make fish aggregating devices an efficient adaptation response to increasing human populations and declining demersal fisheries.
The key adaptation for urban communities is to facilitate the distribution of small tuna and bycatch available from industrial fishing fleets transshipping their catch in regional ports to urban and peri-urban areas (Bell et al. 2015).
Adaptation F7: Expand pond aquaculture (win-win).The success of farming Nile tilapia in Asia (ADB 2005; De Silva and Davey 2009) is a strong indicator that pond aquaculture has much potential to help provide more fish for inland communities in Papua New Guinea (Smith
Figure 16. A key adaptation for coastal fisheries: equip and train small-scale fishers to transfer some of their effort from coral reef fisheries to oceanic fisheries resources by using nearshore fish aggregating devices (SPC 2014).
2007), for coastal communities with limited access to reef fish or lack of suitable locations for deploying fish aggregating devices, and for urban populations (Pickering et al. 2011). Nile tilapia are easy to culture and usually reach harvest size within 4–6 months in the tropics (Nandlal and Foscarini 1990; Nandlal and Pickering 2004). As a result of past investments by WorldFish, genetically improved farmed tilapia (GIFT) varieties are available (Gupta and Acosta 2004), which now grow twice as fast as wild strains.
The simple, proven technology for farming species like tilapia and milkfish is expected to help meet the growing demand for fish in some locations in the short term, and is likely to be favored by the projected increases in rainfall and temperatures in the future (Section 2.1). Availability of suitable feeds at reasonable cost is likely to be one of the major limiting factors. Specific adaptations to secure adequate supplies of fishmeal include rationalizing allocation of fishmeal from tuna processing plants in the region for aquaculture and agriculture, using undesirable introduced and invasive freshwater fish species in Papua New Guinea to produce fish feeds at the village level, and replacing fishmeal with suitable local alternative sources of protein.
Coral reef fisheries resources Oceanic fisheries resources
Fishing effort
39
Adaptation F8: Develop fisheries for small pelagic fish (win-win).Diversify coastal fisheries to catch small pelagic species. The generally sustainable (though variable) nature of small pelagic fish harvests should provide access to more fish in the near term. The outlook for the long term is uncertain—projected decreases in primary productivity due to increased stratification associated with higher sea surface temperature (Appendix 2) may cause the abundance of small pelagic fish to decline in some places, whereas projected increases of nutrients in coastal waters due to greater runoff, as well as changes in the locations of cold eddies (Appendix 2), may increase production in some locations in the long term.
Adaptation F9: Improve postharvest methods (win-win).Extend the shelf life of fish caught in coastal areas by training communities, particularly women, in appropriate ways to improve traditional methods for smoke curing, salting and drying fish. Improved postharvest methods could also enable households to store fish for times when conditions are not suitable for harvesting and create opportunities to trade products with inland communities without access to fish.
Supporting policies for fisheries and aquacultureThe policies required to implement the adaptations that seek to maintain the contributions of fisheries and aquaculture to food security are outlined below and summarized in Table 9.
Policy F1: Strengthen governance for sustainable use and protection of coastal fish habitats.
Policy F2: Promote ecosystem-based management measures for agriculture, forestry and mining to prevent damage to freshwater and coastal fish habitats through soil loss, transport of sediments and nutrients to watercourses and coasts, and pollution.
Policy F3: Protect source and resilient coral reefs that are expected to supply recruits to
downstream reefs to help them recover after coral bleaching or damage by cyclones.
Policy F4: Minimize barriers to migration of mangroves during development of strategies to assist other sectors to respond to climate change.
Policy F5: Promote mangrove replanting programs in suitable areas to meet the twin objectives of enhancing habitat for coastal fisheries and capturing carbon.
Policy F6: Apply primary fisheries management to coastal fish stocks to maintain their potential for replenishment.
Policy F7: Restrict export of demersal coastal fish to ensure that these resources are available for national food security where necessary. (This policy does not apply to deepwater snapper.)
Policy F8: Allocate tuna from average catches within the exclusive economic zone for food security, so that communities have greater access to these fisheries resources.
Policy F9: Include the tuna catch needed for local consumption in national and regional tuna management plans, including the general tuna management framework of the WCPFC.
Policy F10: Encourage coastal fishing communities to transfer fishing effort from coral reef fisheries to oceanic fisheries resources to supply more tuna for local consumption.
Policy F11: Include nearshore fish aggregating devices as part of the national infrastructure for food security, and make provision to quickly replace fish aggregating devices lost through wear and tear.
Policy F12: Provide incentives for the private sector to purchase, store, process and distribute lower-value tuna and bycatch landed by industrial fleets in major ports to increase access to fish in urban areas, and ensure that enterprises comply with the Right to Food standards contained in the International Covenant on Economic, Social and Cultural Rights, and Humanitarian Law.
PRIORITY ADAPTATIONS

40
Policy F13: Dedicate a proportion of the revenue from fishing licenses to improve management of all fisheries and aquaculture, as well as access to fish for rural and urban populations—for example, by upgrading transport links to inland communities in Papua New Guinea to enable better access to locally canned tuna and smoked and dried fish.
Policy F14: Provide incentives for the private sector to invest in pond aquaculture, and support effective systems for distributing high-quality fry to smallholders in rural areas.
Policy F15: Reconcile the use of introduced fish species for pond aquaculture with the potential effects on freshwater biodiversity by zoning pond aquaculture. Until the recommended research is completed, the introduction of Nile tilapia should be limited to (i) Pacific Island countries and territories where coastal fisheries resources and local access to tuna are insufficient to meet the present and future recommended level of fish consumption for good nutrition; and (ii) catchments where Mozambique tilapia already occurs.
Policy F16: Strengthen national capacity and collaboration between national agencies to manage environmental issues related to aquaculture development, such as application of environmental impact assessment procedures that consider present and future risks associated with aquaculture proposals.
Policy 17: Provide training and technical support for coastal fishing communities to catch small pelagic fish, and for inland and coastal communities to improve postharvest methods to extend the shelf life of catches.
Policy F18: Revise primary school curricula to teach children about fish and food security, focusing on the importance of fish for their health, the basic management actions needed to maintain fish habitats and fish stocks, and the options for increasing future supplies of fish.
Adaptation Type Supporting policy*
F1 Manage and restore vegetation in catchments W-W F1, F2, F18
F2 Foster the care of coastal fish habitats W-W F1–F3, F18
F3 Provide for landward migration of coastal fish habitats L-W F4, F5, F18
F4 Sustain production of coastal fish and invertebrates L-W F6, F7, F13, F18
F5 Diversify catches of coastal fish and invertebrates L-W F6, F13, F18
F6 Increase local access to tuna for food W-W F8–F13, F18
F7 Expand pond aquaculture W-W F13–F16, F18
F8 Develop fisheries for small pelagic fish W-W? F13, F17, F18
F9 Improve postharvest methods W-W F17, F18
*Refers to supporting policy number on pages 39–40; W = win; L = lose
Table 9. Relationships between adaptations and supporting policies to maintain the contributions of fish to food security for Pacific Island countries and territories (Bell et al. 2011a).
PRIORITY ADAPTATIONS

41
INVESTMENTS REQUIRED TO IM
PLEMENT ADAPTATIONS
INVESTMENTS REQUIRED TO IMPLEMENT ADAPTATIONS
The investments required to implement the recommended adaptations that seek to reduce the threats posed by climate change to food security and to capitalize on the opportunities are described here.
Investments that apply to both the agriculture and the fisheries and aquaculture sectors (e.g. microcredit schemes) are listed below, followed by the investments specific to each of the sectors. Prospective partners for implementing adaptations for agriculture and for fisheries and aquaculture, supported by these investments, are listed in Tables 10 and 11, respectively.
Investments applicable to both sectors include the following:
• integrated land use planning to reverse habitat degradation by stabilizing soils and preventing high sediment loads from entering streams and reaching the coast, including revegetation of areas in catchments most likely to intercept sediment and establishing well-vegetated riparian (stream-side) buffer zones;
• frameworks and mechanisms to integrate cross-sectoral governance within joint national plans for climate change adaptation and disaster risk management to safeguard productive agricultural land and freshwater and coastal fish habitats;
• microcredit schemes to enable farmers and coastal communities to operate small businesses applying the adaptations described below;
• training and capacity building for farmers and coastal communities, including participatory research and exchanges with external institutions, to diversify food production systems in ways that build resilience to climate change;
• forums to encourage participation by all genders in the planning, design and implementation of adaptations to climate change;
• educational materials to assist communities to understand the contributions of fisheries, aquaculture and agriculture to food security and livelihoods; the fundamentals of climate change and projected effects on food production; and key adaptations, including the need to manage catchments;
• interactive and educational computer games for children to promote learning (by having fun) about vulnerability of fisheries, aquaculture and agriculture to climate change; help them understand the consequences of adapting or not adapting; and introduce them to other disaster risk management choices and outcomes.
Investments specific to agriculture include the following:
• climate-proofing food production systems through uptake of technical innovation, such as protected cultivation;
• distribution networks for high-quality, climate-resilient planting material;
• improving understanding of the factors that influence adaptive capacity;
• improved extension services, involving farmer organizations and the use of mobile technology;
• systems for prioritization, coordination, monitoring and evaluation or review of research to support adaptation, and dissemination of results, including strengthened mechanisms to improve coordination of donor assistance at the national level to avoid duplication of work and improve targeting of applied research;
• integrated land use planning to ensure processes are in place to protect vulnerable habitats and reverse land degradation;
• incentives for the private sector to engage in processing and storage of staple food crops;

42
INVESTMENTS REQUIRED TO IM
PLEMENT ADAPTATIONS
• training in applying and monitoring soil fertility improvement adaptations for extension services and farmers;
• support for the private sector to develop compost production technology;
• strengthened biosecurity services and adoption of a diverse range of approaches for monitoring and prevention of pests and diseases, including plant health clinics and mobile technology;
• support for the integration of modern and traditional farming practices through provision of change incentives and appropriate technical support;
• cross-sectoral support for processed staple food crop products to encourage wider use;
• baseline assessment of national crop and livestock diversity and relevance of different conservation and monitoring systems;
• training in crop, tree and livestock selection and breeding.
Investments specific to fisheries and aquaculture include the following:
• monitoring the responses of fish habitats and fish stocks to climate change to guide adaptations, such as switching to new target species as relative abundance of fish species changes;
• establishing nearshore fish aggregating devices as part of the national infrastructure for food security, which will involve maintaining stockpiles of equipment at national fisheries agencies to replace fish aggregating devices as required;
• practical business models and incentives for the private sector to engage in storage, processing and distribution of low-cost tuna and bycatch landed at major ports, to provide increased access to fish for rapidly growing urban populations;
• assessment of the feasibility and practicality of using a portion of license fees from distant water fishing nations to offset the cost of locally canned tuna for inland populations in Papua New Guinea;
• identifying prime locations for peri-urban and rural pond aquaculture based on information on rainfall and temperature from downscaled global climate models, and other demographic and natural resources layers available for geographic information systems (GIS);
• distribution networks to deliver high-quality juvenile tilapia to smallholders for grow-out in rural areas;
• scaling up aquaponics for Nile tilapia and vegetable production in urban centers of atoll nations;
• establishment of sampling programs for senior high school science classes to assess spatial and temporal (multiyear) variation in abundance of postlarval milkfish for farming.

43
Table 10. Recommended adaptations to climate change for agriculture in Pacific Island countries and territories, together with suggested investments and agencies already involved.
No. Adaptation Investment needed Agency or partner*
AgricultureA1 Improve soils Training in applying and monitoring soil fertility improvement
adaptations for extension services and farmers; support for private sector to develop compost production technology
ACIAR, SPC, GIZ, USP, USAID
A2 Enhance pest, disease and weed controls
Improved extension services, involving farmer organizations and the use of mobile technology; strengthened biosecurity services and adoption of a diverse range of approaches for monitoring of pests, diseases and weeds
ACIAR, SPC, CTA, FAO, NZAID, DFAT
A3 Improve water use efficiency
Assessment of existing technologies and water use monitoring approaches
SPC, USP
A4 Integrate farming practices
Provision of change incentives and appropriate technical support to facilitate integration of different farming practices
ACIAR, SPC, GIZ, USAID
A5 Improve processing and storage of staples
Incentives for the private sector to engage in processing and storage of staple food crops; cross-sectoral support of processed staple food crop products to encourage wider use
USAID
A6 Protect ecosystem assets
Integrated land use planning to ensure processes are in place to protect vulnerable habitats and reverse land degradation
SPC, GIZ, USAID, USP, UNDP
A7 Maintain and enhance crop diversity
Conservation, propagation and distribution systems for high-quality, climate-resilient and improved planting material; baseline assessment of national crop and livestock diversity and relevance of different conservation and monitoring systems
SPC, ACIAR, NARI, VARTC, GIZ, KGA
A8 Improve crops, trees and livestock
Training in crop, tree and livestock selection and improvement; analysis to determine best approach to achieve breeding aims (external, centralized, decentralized)
SPC, ACIAR, USP, VARTC, DFAT
A9 Increase use of protected cultivation
Climate-proofing food production systems through promoting uptake of technical innovation, such as protected cultivation
ACIAR, SPC
Note:ACIAR = Australian Centre for International Agricultural ResearchCTA = Technical Centre for Agricultural and Rural Cooperation DFAT = Department of Foreign Affairs and Trade (Australia)FAO = Food and Agriculture Organization of the United NationsGIZ = Deutsche Gesellschaft für Internationale ZusammenarbeitKGA = Kastom Gaden AssociationNARI = National Agricultural Research Institute (Papua New Guinea)NZAID = New Zealand Aid ProgrammeSPC = Secretariat of the Pacific CommunityUNDP = United Nations Development ProgrammeUSAID = United States Agency for International DevelopmentUSP = University of the South Pacific VARTC = Vanuatu Agricultural Research and Technical Centre*Does not imply that this is a complete list of all agencies involved
INVESTMENTS REQUIRED TO IM
PLEMENT ADAPTATIONS

44
No. Adaptation Investment needed Agency or partner*
Fisheries and aquacultureF1 Manage and
restore vegetation in catchments
Integrated land use planning to stabilize soils and prevent sedimentation; revegetation of catchments
GIZ
F2 Foster the care of coastal fish habitats
Cross-sectoral governance within national development plans to protect coral reefs, mangroves and seagrasses, and safeguard these habitats during the adaptation of other sectors to climate change to avoid maladaptation
F3 Provide for landward migration of coastal fish habitats
Mapping to plan and modify infrastructure needed to allow mangroves to migrate landward as sea level rises
SPC
F4 Sustain production of coastal fish and invertebrates
Implementing community-based fisheries management, incorporating primary fisheries management and ecosystem-based approaches
WorldFish, SPC, LMMA
F5 Diversify catches of coastal fish and invertebrates
Monitoring changes in relative abundance of species; training in new fishing methods
SPC
F6 Increase access to tuna
Programs to establish nearshore fish aggregating devices as part of the national infrastructure for food security (see gaps in knowledge)
SPC, WorldFish
Practical business models and incentives for the private sector to engage in storage, processing and distribution of low-cost tuna and bycatch landed at major ports
SPC, FFA, UNIDO
Microcredit schemes and training programs to enable coastal communities to launch small-scale commercial fisheries around fish aggregating devices and establish small businesses distributing tuna and bycatch from transshipping operations
UNIDO, FFA, SPC
Assess practicality of using a portion of license fees from distant water fishing nations to offset the cost of locally canned tuna for inland populations in Papua New Guinea
UNIDO, FFA, SPC
F7 Expand pond aquaculture
Analysis to identify the prime locations for peri-urban and rural pond aquaculture based on information on rainfall and temperature from downscaled global climate models, and other demographic and natural resources layers available for GIS
SPC
Hatcheries and distribution networks to deliver high-quality tilapia for grow-out in rural areas
SPC, WorldFish
Microcredit schemes and training programs to enable smallholders to develop pond aquaculture
F8 Develop fisheries for small pelagic fish
Training programs and microcredit schemes to develop small-scale fisheries
SPC
F9 Improve postharvest methods
Training programs and microcredit schemes
Note:FFA = Pacific Islands Forum Fisheries AgencyGIZ = Deutsche Gesellschaft für Internationale ZusammenarbeitLMMA = Locally Managed Marine Area NetworkSPC = Secretariat of the Pacific CommunityUNIDO = United Nations Industrial Development Organization
Table 11. Recommended adaptations to climate change for fisheries and aquaculture in Pacific Island countries and territories, together with suggested investments and agencies already involved.
INVESTMENTS REQUIRED TO IM
PLEMENT ADAPTATIONS
45
INFORMATION GAPS
Improved modeling and monitoring of ocean variables are also required. In particular, nutrients, oxygen and pH need to be measured regularly over a much more representative area of the tropical Pacific Ocean to parameterize and validate models simulating the responses of the ocean to different emissions scenarios.
AgricultureInformation needed to fill gaps in understanding related to agriculture includes the following:• improved understanding of the physiological
responses and thresholds (including salt tolerance) of crops, agroforestry trees and livestock to expected climate change (including elevated CO2 concentrations), as well as the interactions of pests, weeds and disease with these changes;
• improved understanding of the impact of climate change on pests and diseases—in particular, those currently considered a significant threat;
• knowledge of optimum combinations of species, arrangements and spacing for agroforestry and intercropping systems to strengthen resilience to climate change;
• knowledge of best practices for improving soil fertility and health, and improved understanding of the impact of climate change on soil biodiversity;
• improved understanding of the effectiveness of agricultural diversity for strengthening climate resilience and the indicators that can be used to determine optimum levels of diversity for resilience;
• better understanding of the impact of technologies, such as the use of protected cultivation and irrigation systems, in strengthening climate resilience in high-value horticulture systems;
• knowledge of best practices for processing staple food crops at the local and national levels so that healthy food can be provided in a user-friendly form, including better understanding of varieties suited for processing.
Although the adaptations and supporting policies to maintain the important contributions of agriculture, fisheries and aquaculture to food security as the climate changes discussed above are based on the best information available, much uncertainty still surrounds them. This uncertainty is due to (i) the coarse grid sizes of global climate models and their inherent biases; (ii) the range of emission scenarios; (iii) limited knowledge of the physiological responses (thresholds) of crops, agroforestry trees, livestock, pests, diseases and weeds, as well as responses of fisheries and aquaculture production systems to climate change; and (iv) the way in which the people of the Pacific are likely to accept and implement the recommended adaptations. The information needed to fill these gaps is summarized below.
Surface climate and the oceanMore long-term, high-quality data on surface weather is needed over a wider area of the region to distinguish anthropogenic effects on surface climate from natural variability, link local climate to larger-scale climate observations, and validate and select the best-performing climate models for each region.
To improve the next generation of global climate models, significant inherent biases in the models need to be addressed. These major biases include (i) the overly zonal orientation of the SPCZ, which limits confidence in projections of the rainfall and wind fields of the central-southern Pacific; and (ii) the fact that the warming associated with ENSO events is generally situated too far to the west and often occurs too frequently. A better understanding of the physical mechanisms driving these characteristics is needed to improve the parameterization of coupled atmosphere-ocean models.
Appropriate dynamical and statistical downscaling approaches are also needed to provide robust projections of changes to surface climate and the ocean at scales meaningful to management in Pacific Island countries and territories.
INFORMATION GAPS

46
Tuna distribution and abundanceGiven the vital role that tuna will need to play in local food security in the future, greater certainty is needed in projected changes to the distribution and abundance of tuna. At present, a single modeling platform—SEAPODYM—is used for tropical Pacific tuna. This model treats tuna populations as a continuous tracer or “dye” that spreads through the ocean subject to currents and ocean mixing but with characteristics that mimic the behavior of tuna populations by using preferential diffusion towards regions of high food or away from regions with unsuitable temperature or oxygen levels.
Although several sources of information are needed to improve SEAPODYM (Bell et al. 2011a, 2015), important gains are also expected to come from diversifying the modeling approaches used for tuna so that projections can be made using multimodel means, in much the same way that the projections for surface climate and the ocean are now made.
Coastal fish habitats and stocksThe full range of information needed to reduce uncertainty about the extent to which climate change is likely to widen the gap between the fish required for food (driven by population growth) and sustainable coastal fisheries production includes reducing uncertainty about several ecological processes (Bell et al. 2011a, 2013) and is therefore probably beyond the scope of CCAFS.
The information gaps related to coastal fisheries likely to be of most relevance center on the following:
• understanding all the key factors involved in harnessing the full potential of nearshore fish aggregating devices for increasing access to tuna and other large pelagic fish;
• monitoring catches of demersal coastal fish to track the size of the supply gap to be filled.
Pond aquacultureIn addition to any modifications needed to adapt the well-established methods for farming Nile tilapia and milkfish for the region (Pickering et al. 2011), the information required to assist Pacific Island countries and territories to evaluate whether pond aquaculture is likely to be enhanced by climate change and identify any possible disadvantages of pond aquaculture is outlined below:
• areas most likely to be suitable for pond aquaculture in the future based on downscaling global climate models to the level of river catchments;
• potential impacts of Nile tilapia introduced for pond aquaculture on freshwater biodiversity;
• likelihood that warmer and wetter conditions may increase the risks posed to pond aquaculture by disease (Pickering et al. 2011);
• potential for freshwater aquaculture ponds to increase habitat for malaria mosquitoes.
INFORMATION GAPS

47
INVESTMENTS NEEDED TO FILL GAPS IN INFORMATION
and tropical cyclones. These downscaled models are needed to provide a better understanding of the likely changes to the surface area and structure of the two large equatorial ocean provinces (Warm Pool and Pacific Equatorial Divergence) that are of great significance to the distribution and abundance of tuna.
Agriculture• regional and local models for implications of
climate change on production of crops and livestock (to remove reliance on models and research from other regions);
• communicating seasonal climate outlooks so that farmers can make more informed decisions about crop types, scale of production, planting times and other farm management decisions better suited to the projected climate conditions;
• generation and documentation of better agricultural data for merging with meteorological data to allow for more targeted advice for farmers;
• more extensive valuation of crop and livestock diversity to better determine extent of climate resilience within Pacific gene pools;
• research including field trials to assess the climate resilience benefits of agroforestry, the effectiveness of production systems for minimizing water-logging impacts, best practices for improving and maintaining soil health and resilience, and protected cropping, etc.;
• case studies of benefits and cost effectiveness of adopting technology to improve climate resilience.
INVESTMENTS NEEDED TO FILL GAPS IN INFORMATION
The investments needed to improve understanding of the vulnerability of agriculture, fisheries and aquaculture to climate change and progressively increase the effectiveness of the recommended adaptations are described in the following subsections.
Surface climate and the ocean• building the capacity of Pacific Island
countries and territories to forecast the weather and make short-term seasonal climate predictions, particularly for tropical cyclones and ENSO events, and to operate appropriate warning systems for severe weather events;
• assisting Pacific Island countries and territories to reverse the increase in recent decades in the number of missed observations and inactive reporting stations, largely due to national meteorology system budget constraints and increasing costs of instrumentation;
• high-quality surface weather observations, to assist Pacific Island countries and territories to detect the nature and significance of changing climates, link relevant island-scale weather patterns to larger-scale climate observations, and relate changes in rainfall to variations in local river flows and groundwater regimes;
• sustaining and enhancing uptake throughout Pacific Island countries and territories of country-specific seasonal climate outlooks, as knowing that an upcoming season is likely to be wetter or drier than usual, or that there is an increased risk of tropical cyclone activity, can allow preparatory planning assisted by the variety of information now available through various web portals;
• developing higher-resolution physical global climate models that address existing biases in the position of the SPCZ and the spatial and temporal structure of ENSO and that are capable of projecting changes to the frequency and intensity of ENSO events

48
Fisheries and aquaculture• development of an individual-based
modeling framework for tuna to complement SEAPODYM and reduce uncertainty, enabling a multimodel approach. An individual-based model offers the following advantages over SEAPODYM: ability to compare movement of individuals projected by the model to tagging data; backtracking of individual movements, allowing tuna and tuna-forage distributions to be simulated backwards in time to identify potential source regions; simpler validation of projected tuna behavior against observations; and application at small spatial scales (e.g. around islands) when combined with high-resolution ocean models;
• modification of the available satellite products to provide the finer-scale measurements (< 1 km grid size) needed to manage bleaching events on individual coral reefs and integrate data on light intensity, pH and turbidity with sea surface temperature;
• mapping of mangroves to help quantify the contribution of these habitats to coastal fisheries production and mitigation of CO2; to raise awareness among coastal planners of their importance; to identify where mangroves can migrate landward and the modifications to infrastructure needed to allow these habitats to do so as sea level rises; and to provide a baseline for monitoring changes in the area, density and species composition of mangroves;
• long-term monitoring programs to (i) inform Pacific Island countries and territories about changes in coastal fish habitats and stocks of demersal fish (including market sampling); (ii) determine the variation in habitats and stocks due to climate change, as opposed to other drivers; and (iii) assess whether the effects of climate change are occurring as projected;
• investigations to harness the full benefits of fish aggregating devices, including
- bathymetry for selecting suitable sites for installing fish aggregating devices;
- any impediments likely to prevent coastal communities from making the best use of fish aggregating devices, and how best to remove such blockages;
- effects of industrial fleets operating close to fishing exclusion zones on the catch of tuna by small-scale fishers around fish aggregating devices;
- scope for nearshore fish aggregating devices to add value to coral reef management initiatives;
- variation in abundance of small pelagic fish species, catch rates near fish aggregating devices, and possible effects of higher levels of nutrients from the projected increases in runoff around high islands on the productivity of these fish.
• impact risk assessments for the introduction or further translocation of Nile tilapia for pond aquaculture to provide decision-makers with science-based advice about any possible effects on freshwater biodiversity (ensuring that any such potential effects are not confounded with habitat degradation, and are relative to any existing impacts on biodiversity that can be attributed unequivocally to Mozambique tilapia);
• development of methods to manage malaria risk associated with fish ponds.
Crosscutting analysisAn integrated analysis of the vulnerability of coastal communities to food insecurity is required to raise awareness of the range of food production systems at their disposal and to prioritize the production of food from agriculture, fisheries and aquaculture. This analysis would integrate village population size; the area available for growing various types of root crops, fruit and vegetables (access to fresh water, soil type, topography, rainfall); area of coral reef available per capita; the distance to the nearest area suitable for deploying fish aggregating devices; the suitable local conditions for pond aquaculture; distance to the nearest market; and availability of social and physical capital needed to produce food and earn income.
INVESTMENTS NEEDED TO FILL GAPS IN INFORMATION

49
POTENTIAL PARTNERS
A range of institutions are well placed to help make the investments needed to fill these gaps in knowledge and to form partnerships with CCAFS. These partners are listed in Table 12.
POTENTIAL PARTNERS
Table 12. Investments needed to fill gaps in information required to implement the recommended adaptations to climate change for agriculture, aquaculture and fisheries in Pacific Island countries and territories effectively, together with potential partners for CCAFS.
Investment needed Potential partner
Surface climate and the ocean
Building capacity of Pacific Island countries and territories to make short-term seasonal climate predictions and operate warning systems
NIWA, BOM
Reversing increase in number of missed observations and inactive reporting stations BOM
High-quality surface weather observations to detect changing climates; linking island-scale weather to larger-scale climate observations and rainfall to river flows
NIWA, BOM
Enhanced country-specific seasonal climate outlooks such as Pacific Island Climate Update, Climate and Oceans Support Program, ENSO Update
NIWA (www.niwa.co.nz/climate/icu), BOM (http://www.bom.gov.au/cosppac/comp/), NOAA (www.prh.noaa.gov/peac)
Higher-resolution physical global climate models that address existing biases in SPCZ and ENSO and that are capable of projecting ENSO events and tropical cyclones
NIWA, BOM, CSIRO, NOAA
Agriculture
Regional and local models for implications of climate change on production of crops and livestock
CSIRO, SPC, USP
Communicating seasonal climate outlooks to farmers for decision-making NIWA, SPC, SPREP
Generation and documentation of better agricultural data to merge with meteorological data to allow for more targeted advice for farmers
SPC, FAO
More extensive valuation of crop diversity to better determine extent of climate resilience
SPC, FAO
Climate resilience benefits of agroforestry, effectiveness of production systems for minimizing water-logging impacts, best practices for improving and maintaining soil health and resilience
SPC, USP, FAO
Case studies of benefits and cost effectiveness of adopting agricultural technology to improve climate resilience
SPC
Fisheries and aquaculture
Individual-based modeling framework for tuna SPC, UNSW, CSIRO
Satellite products to provide the finer-scale measurements needed to manage coral bleaching events
NOAA
Mapping of mangroves to plan for landward migration SPC
Long-term monitoring programs to identify changes in coastal fish habitats and stocks SPC
Effects of climate change on incidence and virulence of ciguatera fish poisoning SPC, CSIRO, UTS
Harnessing the full benefits of inshore fish aggregating devices, particularly effective engagement of communities
SPC, Global Tuna Initiative, LMMA
Impact risk assessments for the introduction or further translocation of Nile tilapia for pond aquaculture
SPC, UQ
Methods to manage malaria risk associated with fish ponds SPC, USP
Crosscutting
Prospects for integrating methods for producing food from fisheries, aquaculture and agriculture to reduce the vulnerability of coastal communities to food insecurity
SPC, USP
Note:BOM = Bureau of Meteorology (Australia)CSIRO = Commonwealth Scientific and Industrial Research OrganisationFAO = Food and Agriculture Organization of the United NationsLMMA = Locally Managed Marine Area NetworkNIWA = National Institute of Water and Atmospheric Research (New Zealand)NOAA = National Oceanic and Atmospheric Administration (United States)SPC = Secretariat of the Pacific CommunitySPREP = Secretariat of the Pacific Regional Environment ProgrammeUNSW = University of New South WalesUQ = University of QueenslandUSP = University of the South Pacific UTS = University of Technology (Sydney)

50
RECOMM
ENDATIONS
RECOMMENDATIONS
all government revenue through fishing license fees;
• projected increases in abundance of tuna in the exclusive economic zones of most atoll nations by 2035 due to climate change, and continued large catches of tuna in the western Pacific even though tuna are expected to move progressively eastward (Figure 8);
• more favorable conditions for freshwater pond aquaculture across the region due to projected increases in temperature and rainfall.
Specific recommendations• Produce national assessments of the
vulnerability of agriculture in Pacific Island countries and territories to climate change to complement those done for fisheries and aquaculture (Bell et al. 2011b), and identify
- implications for food security and livelihoods, as a result of projected changes in production, population and urbanization;
- priority adaptations for agriculture in each Pacific Island country and territory to minimize the threats posed by climate change, and to maximize opportunities.
• Identify the research to be done at the national level for each country to implement the priority adaptations based on integrating
- projected needs for food by rural and urban populations;
- natural and human capital attributes of the country for producing agricultural and fisheries products;
- existing production methods and capacity, including traditional knowledge;
- projected effects of climate change on national food systems;
A series of staged investments is recommended for CCAFS in the Pacific Islands region to pave the way for gaps in knowledge to be filled. The context for these recommendations is given in Table 1 and is framed by the following considerations:
• good potential for agriculture on the high islands of Melanesia and the middle-sized countries of Polynesia, but very limited scope for agriculture on the land-poor microstates, such as Nauru, and the atolls with limited land area and high pH sandy soil;
• rapid rates of population growth and urbanization in many Pacific Island countries and territories;
• increasing use of energy-dense, nutrient-poor imports to feed urban populations, significantly contributing to the world’s highest incidence of obesity and diabetes;
• high dependency on imported rice and wheat-based food products mainly by urban but also rural populations in most Pacific Island countries and territories, increasing the vulnerability of Pacific Island people to food insecurity due to the projected negative effects of climate change on global production of rice and wheat, which will affect stability and cost of supply;
• relative resilience of Pacific staple food crops, such as breadfruit and cassava, as well as traditional production systems, to climate change;
• high dependence on fish for animal protein, given the limited scope for animal husbandry in most Pacific Island countries and territories;
• projected decreases in coastal fisheries production due to the degradation of coral reefs caused by global warming and ocean acidification;
• the rich tuna resources of the region, which currently supply more than 30% of the world’s tuna and provide six Pacific Island countries and territories with 10%–60% of
51
- relevant previous agricultural research that can be used to help improve resilience of national food systems in the face of climate change;
- gaps in knowledge to be filled to deliver practical tools necessary for implementing adaptations, and for supplying food for growing populations as the climate changes.
• Identify the best agricultural and fisheries actors or bodies and the best approaches for implementing the research required to meet each nation’s needs, as well as the needs of neighboring countries with insufficient capacity for research.
• Strengthen research on food systems for the region by
- creating effective partnerships between national research and extension agencies, farmers’ networks, NGOs, and advanced scientific institutions to improve national capacity (or provide complementary capacity) to design, implement, monitor and evaluate relevant research (including internships, attachments, visiting scientists and scholarships);
- mentoring national staff (research and extension) and farmers, in collaboration with the Secretariat of the Pacific Community’s Land Resources Division and other relevant agencies, such as the University of the South Pacific, to document results of field trials and share research data and results with counterparts in neighboring countries;
- overcoming constraints to sharing knowledge with farmers and fishing communities in other countries and regions through strengthening more innovative knowledge sharing approaches such as farmer-to-farmer exchanges;
- improving the understanding of the factors influencing uptake of technology;
RECOMM
ENDATIONS - providing farmers and fishers with
climate services (e.g. short-term and medium-term forecasts relevant to the main agriculture and fisheries production systems) to guide their investments and activities, in collaboration with the New Zealand National Institute of Water and Atmospheric Research (NIWA), the Australian Bureau of Meteorology (BOM), the Commonwealth Scientific and Industrial Research Organisation (CSIRO), and the United States National Oceanic and Atmospheric Administration (NOAA).
• Progressively implement the research activities needed to fill gaps in information in collaboration with appropriate partners.
• Liaise with the Pacific Programme for Climate Resilience (PPCR), supported by the World Bank and Asian Development Bank, to discuss opportunities to expand the technical expert group advising PPCR to include experts on research design and data analysis.
52
NOTES
NOTES
1 Pacific Islands Forum Secretariat (www.forumsec.org); Secretariat of the Pacific Community (www.spc.int); Pacific Islands Forum Fisheries Agency (www.ffa.int); Secretariat of the Pacific Regional Environmental Programme (www.sprep.org).
2 This report also draws on the joint FAO and Secretariat of the Pacific Community regional workshop on “Priority adaptations to climate change for Pacific fisheries and aquaculture: Reducing risks and capitalising on opportunities” (Johnson et al. 2013); the recent regional overview of climate change in the Pacific (BOM and CSIRO 2011); and Chapter 30 of the Fifth Assessment Report of the Intergovernmental Panel on Climate Change (Hoegh-Guldberg et al. 2014).
3 http://www.spc.int/nmdi/MdiSummary2.aspx?minorGroup=25
4 Examples of recent and ongoing adaption projects in the region include the International Climate Change Adaptation Initiative (supported by AusAID), Coping with Climate Change in the Pacific Island Region (GIZ), Global Climate Change Alliance (European Union), Pacific Programme for Climate Resilience (World Bank, Asian Development Bank), Pacific Adaptation to Climate Change (Global Environment Facility) and an adaptation project funded by USAID.
5 Also includes the bycatch from industrial tuna fisheries.
6 Primary fisheries management recognizes the need to use simple harvest controls, such as size limits, closed seasons and areas, gear restrictions, and protection of spawning aggregations.
7 An adaptation that does not constitute a conscious response to climatic stimuli but is triggered by ecological changes in natural systems.
8 An adaptation that is the result of a deliberate policy decision, based on an awareness that conditions have changed or are about to change and that action is required to return to, maintain or achieve a desired state.
9 https://itunes.apple.com/au/app/pacific-pests-and-pathogens/id903244644?mt=8
10 Plants of the same species with genetically defined phytochemical characteristics such as organic acids, flavonols, flavanols, anthocyanins and carotenes.
11 For example, the Coral Triangle Initiative (www.cti-secretariat.net/about-cti/plan-of-actions).
12 www.seagrasswatch.org/about.html
13 Changes with respect to 1986–2005 base period.

53
REFERENCESREFERENCES
[ADB] Asian Development Bank. 2005. An Evaluation of Small-Scale Freshwater Rural Aquaculture Development for Poverty Reduction. Manila: Asian Development Bank.
[ADB] Asian Development Bank. 2012. The State of Pacific Towns and Cities: Urbanization in ADB’s Pacific Developing Member Countries. Pacific Studies Series. Manila: Asian Development Bank.
Allison EH, Béné C and Andrew NL. 2011. Poverty reduction as a means to enhance resilience in small-scale fisheries. In Pomeroy R and Andrew NL, eds. Managing Small Scale Fisheries: Frameworks and Approaches for the Developing World. London: Centre for Agricultural Bioscience International. 206–38.
Andréfouët S, Muller-Karger FE, Robinson JA, Kranenburg CJ, Torres-Pulliza D, Spraggins SA and Murch B. 2006. Global assessment of modern coral reef extent and diversity for regional science and management applications: A view from space. In Suzuki Y, Nakamori T, Hidaka M, Kayanne H, Casareto BE, Nadaoka K, Yamano H, Tsuchiya M and Yamazato K, eds. 10th International Coral Reef Symposium. Okinawa: Japanese Coral Reef Society.
Aswani S. 2005. Customary sea tenure in Oceania as a case of rights-based fishery management: Does it work? Reviews in Fish Biology and Fisheries 15:285−307.
Bell JD, Allain V, Allison EH, Andréfouët S, Andrew NL, Batty MJ, Blanc M, Dambacher JM, Hampton J, Hanich Q et al. 2015. Diversifying the use of tuna to improve food security and public health in Pacific Island countries and territories. Marine Policy 51:584–91.
Bell JD, Andrew NL, Batty MJ, Chapman LB, Dambacher JM, Dawson B, Ganachaud AS, Gehrke PC, Hampton J, Hobday AJ et al. 2011a. Adapting tropical Pacific fisheries and aquaculture to climate change: Management measures, policies and investments. In Bell JD, Johnson JE and Hobday AJ, eds. Vulnerability of Tropical Pacific Fisheries and Aquaculture to Climate Change. Noumea: Secretariat of the Pacific Community. 803–74.
Bell JD, Ganachaud A, Gehrke PC, Griffiths SP, Hobday AJ, Hoegh-Guldberg O, Johnson JE, Le Borgne R, Lehodey P, Lough JM et al. 2013. Mixed responses of tropical Pacific fisheries and aquaculture to climate change. Nature Climate Change 3:591–99.
Bell JD, Johnson JE, Ganachaud AS, Gehrke PC, Hobday AJ, Hoegh-Guldberg O, Le Borgne R, Lehodey P, Lough JM, Pickering T et al. 2011b. Vulnerability of Tropical Pacific Fisheries and Aquaculture to Climate Change: Summary for Pacific Island Countries and Territories. Noumea, New Caledonia: Secretariat of the Pacific Community. Retrieved from http://www.spc.int/climate-change/fisheries/assessment/e-book-summary/
Bell JD, Johnson JE and Hobday AJ, eds. 2011c. Vulnerability of Tropical Pacific Fisheries and Aquaculture to Climate Change. Noumea, New Caledonia: Secretariat of the Pacific Community.
Bell JD, Kronen M, Vunisea A, Nash WJ, Keeble G, Demmke A, Pontifex S and Andréfouët S. 2009. Planning the use of fish for food security in the Pacific. Marine Policy 33:64–76.
Bell JD, Reid C, Batty MJ, Allison EH, Lehodey P, Rodwell L, Pickering TD, Gillett R, Johnson JE, Hobday A and Demmke A. 2011d. Implications of climate change for contributions by fisheries and aquaculture to Pacific Island countries and communities. In Bell JD, Johnson JE and Hobday AJ, eds. Vulnerability of Tropical Pacific Fisheries and Aquaculture to Climate Change. Noumea: Secretariat of the Pacific Community. 733–801.

54
REFERENCES
Bellwood DR, Hughes TP, Folke C and Nyström M. 2004. Confronting the coral reef crisis. Nature 429:827–33.
Biasutti M. 2013. Future rise in rainfall inequality. Nature Geoscience 6. doi:10.1038/ngeo1814
[BOM and CSIRO] Australian Bureau of Meteorology and Commonwealth Scientific and Industrial Research Organisation. 2011. Climate Change in the Pacific: Scientific Assessment and New Research. Volume 1: Regional Overview.
Bourke RM. 2013. Implications of climate change for food security in Papua New Guinea. Report prepared for the Australian Department of Climate Change and Energy Efficiency, Canberra.
Bourke RM and Harwood T, eds. 2009. Food and Agriculture in Papua New Guinea. Canberra: ANU E Press, The Australian National University.
Bourke RM, McGregor A, Allen M, Evans BR, Mullen BF, Pollard AA, Wairiu A and Zotalis S. 2006. Solomon Islands Smallholder Agriculture Study. Canberra: Australian Agency for International Development (AusAID).
Cheung WWL, Lam VWY, Sarmiento JL, Kearney K, Watson R, Zeller D and Pauly D. 2010. Large-scale redistribution of maximum fisheries catch potential in the global ocean under climate change. Global Change Biology 16:24–35.
Christensen JH, Krishna Kumar K, Aldrain E, An S-I, Cavalcanti IFA, de Castro M, Dong W, Goswami P, Hall A, Kanyanga JK et al. 2013. Climate phenomena and their relevance for future regional climate change. In Stocker TF, Qin D, Plattner G-K, Tignor M, Allen SK, Boschung J, Nauels A, Xia Y, Bex V and Midgley PM, eds. Climate Change 2013: The Physical Science Basis. Contribution of Working Group I to the Fifth Assessment Report of the Intergovernmental Panel on Climate Change. Cambridge and New York: Cambridge University Press. 1217–308.
Cinner JE. 2005. Socioeconomic factors influencing customary marine tenure in the Indo-Pacific. Ecology and Society 10:1−14.
Cochrane KL, Andrew NL and Parma AM. 2011. Primary fisheries management: A minimum requirement for provision of sustainable human benefits in small-scale fisheries. Fish and Fisheries 12:275–88.
Davis AP, Gole TW, Baena S and Moat J. 2012. The impact of climate change on indigenous Arabica coffee (Coffea arabica): Predicting future trends and identifying priorities. PLoS ONE 7(11):e47981. doi:10.1371/journal.pone.0047981
De Silva SS and Davey FB. 2009. Success Stories in Asian Aquaculture. London: Springer.
Deuter P, White N and Putland D. 2012. Critical temperature thresholds case study: Tomato. Agriscience Queensland. Retrieved from http://www.managingclimate.gov.au/wp-content/uploads/2012/04/Critical-temperature-thresholds_Tomato_V2.pdf
Easterling W and Apps M. 2005. Assessing the consequences of climate change for food and forest resources: A view from the IPCC. Climatic Change 70:165–89.
[FAO] Food and Agriculture Organization of the United Nations. 2003. Fisheries management. 2. The ecosystem approach to fisheries. FAO Technical Guidelines for Responsible Fisheries 4(2).
Fermont A. 2012. Insight Special: Coffee and Climate Change – A Perspective from East Africa. Coffee Division of ED&F Man, Coffee Business Services and Academy, A Volcave Initiative.

55
Fletcher CH and Richmond BM. 2010. Climate change in the Federated States of Micronesia: Food and water security, climate risk management and adaptive strategies. Report of Findings. Center for Island Climate Adaptation and Policy, Sea Grant College Program. Honolulu: University of Hawai’i.
Ganachaud AS, Sen Gupta A, Orr JC, Wijffels SE, Ridgway KR, Hemer MA, Maes C, Steinberg CR, Tribollet AD, Qiu B and Kruger JC. 2011. Observed and expected change to the tropical Pacific Ocean. In Bell JD, Johnson JE and Hobday AJ, eds. Vulnerability of Tropical Pacific Fisheries and Aquaculture to Climate Change. Noumea: Secretariat of the Pacific Community. 101–87.
Gillet R. 2009. Fisheries in the Economies of Pacific Island Countries and Territories. Pacific Studies Series. Manila: Asian Development Bank.
Gillett R and Cartwright I. 2010. The Future of Pacific Island Fisheries. Noumea: Secretariat of the Pacific Community.
Govan H, Aalbersberg W, Tawake A and Parks J. 2008. Locally-managed Marine Areas: A Guide for Practitioners. The Locally-Managed Marine Area Network. Retrieved from www.lmmanetwork.org/Site_Documents/Grouped/LMMAGuide.pdf
Grafton RQ. 2010. Adaptation to climate change in marine capture fisheries. Mar. Pol. 34:606–15.
Guilyardi E, Bellenger H, Collins M, Ferrett S, Cai W and Wittenberg A. 2012. A first look at ENSO in CMIP5. CLIVAR Exchanges 17:29–32.
Gupta MV and Acosta BO. 2004. The impact of genetically improved farmed Nile tilapia in Asia. Aquaculture Economics and Management 4:107–24.
Hall SJ. 2011. Climate change and other external drivers in small-scale fisheries: Practical steps for responding. In Pomeroy R and Andrew NL, eds. Managing Small-Scale Fisheries: Frameworks and Approaches for the Developing World. London: Centre for Agricultural Bioscience International. 132–59.
Heenan A, Pomeroy R, Bell J, Munday PL, Cheung W, Logan C, Brainard R, Amri AY, Aliño P, Armada N et al. 2015. A climate-informed, ecosystem approach to fisheries management. Marine Policy 57: 182–192.
Heenan A, Pomeroy R, Brainard R, Amri A, Alino P, Armada N, Bell J, Cheung W, David L, Guieb R et al. 2013. Incorporating climate change and ocean acidification into an ecosystem approach to fisheries management (EAFM) plan. Publication. Honolulu: The USAID Coral Triangle Support Partnership.
Hobday AJ, Smith ADM, Stobutzki I, Bulman C, Daley R, Dambacher JM, Deng RA, Dowdney J, Fuller M, Furlani D et al. 2011. Ecological risk assessment for the effects of fishing. Fisheries Research 108:372–84.
Hoegh-Guldberg O, Andréfouët S, Fabricius KE, Diaz-Pulido G, Lough JM, Marshall PA and Pratchett MS. 2011. Vulnerability of coral reefs in the tropical pacific to climate change. In Bell JD, Johnson JE and Hobday AJ, eds. Vulnerability of Tropical Pacific Fisheries and Aquaculture to Climate Change. Noumea: Secretariat of the Pacific Community. 251–96.
Hoegh-Guldberg O, Cai R, Poloczanska ES, Brewer PG, Sundby S, Hilmi K, Fabry VJ and Jung S. 2014. The ocean. In Barros VR, Field CB, Dokken DJ, Mastrandrea MD, Mach KJ, Bilir TE, Chatterjee M, Ebi KL, Estrada YO, Genova RC, Girma B, Kissel ES, Levy AN, MacCracken S, Mastrandrea PR and
REFERENCES

56
REFERENCES
Hoegh-Guldberg O, Mumby PJ, Hooten AJ, Steneck RS, Greenfield P, Gomez E, Harvell CD, Sale PF, Edwards AJ, Caldeira K et al. 2007. Coral reefs under rapid climate change and ocean acidification. Science 3181737–42.
White LL, eds. Climate Change 2014: Impacts, Adaptation, and Vulnerability. Part B: Regional Aspects. Contribution of Working Group II to the Fifth Assessment Report of the Intergovernmental Panel on Climate Change. Cambridge and New York: Cambridge University Press. 1655–731.
Hughes TP, Rodrigues MJ, Bellwood DR, Ceccarelli D, Hoegh-Guldberg O, McCook L, Moltschaniwskyj N, Pratchett MS, Steneck RS and Willis B. 2007. Phase shifts, herbivory and the resilience of coral reefs to climate change. Current Biology 17:360–65.
Johnson J, Bell J and De Young C, eds. 2013. Priority Adaptations to Climate Change for Pacific Fisheries and Aquaculture: Reducing Risks and Capitalizing on Opportunities. FAO Fisheries and Aquaculture Proceedings No. 28.
Kronen M, Vunisea A, Magron F and McArdle B. 2010. Socio-economic drivers and indicators for artisanal coastal fisheries in Pacific island countries and territories and their use for fisheries management strategies. Marine Policy 34:1135–43.
Lal PN, Rita R and Khatri N. 2009. Economic Costs of the 2009 Floods in the Fiji Sugar Belt and Policy Implications. Gland, Switzerland: IUCN.
Le Borgne R, Allain V, Griffiths SP, Matear RJ, McKinnon AD, Richardson AJ and Young JW. 2011. Vulnerability of open ocean food webs in the tropical Pacific to climate change. In Bell JD, Johnson JE and Hobday AJ, eds. Vulnerability of Tropical Pacific Fisheries and Aquaculture to Climate Change. Noumea: Secretariat of the Pacific Community. 189–249.
Lebot V. 2009. Tropical Root and Tuber Crops: Cassava, Sweet Potato, Yams and Aroids. Crop Production and Science in Horticulture Series No. 17. Wallingford, UK: CAB International.
Lehodey P, Bertignac M, Hampton J, Lewis A and Picaut J. 1997. El Niño-Southern Oscillation and tuna in the western Pacific. Nature 389:715–18.
Lehodey P, Hampton J, Brill RW, Nicol S, Senina I, Calmettes B, Pörtner HO, Bopp L, Ilyina T, Bell JD and Sibert J. 2011. Vulnerability of oceanic fisheries in the tropical Pacific to climate change. In Bell JD, Johnson JE and Hobday AJ, eds. Vulnerability of Tropical Pacific Fisheries and Aquaculture to Climate Change. Noumea: Secretariat of the Pacific Community. 433–92.
Lehodey P, Senina I, Calmettes B, Hampton J and Nicol S. 2013. Modelling the impact of climate change on Pacific skipjack tuna population and fisheries. Climatic Change. doi:10.1007/s10584-012-0595-1
Lehodey P, Senina I and Murtugudde R. 2008. A spatial ecosystem and population dynamics model (SEAPODYM) – modelling of tuna and tuna-like populations. Prog. Oceanogr. 78:304–18.
Lisson S, Manueli P, Nonga N, Cokanasiga K and Taylor M. In press. Vulnerability of livestock to climate change. In Taylor M, McGregor A and Dawson B, eds. Vulnerability of Pacific Agriculture and Forestry to Climate Change. Noumea: Secretariat of the Pacific Community.
Lobell DB and Tebaldi C. 2014. Getting caught with our plants down: The risks of a global crop yield slowdown from climate trends in the next two decades. Environ. Res. Lett. 9:7. doi:10.1088/1748-9326/9/7/074003

57
Longhurst AR. 2006. Ecological Geography of the Sea. New York: Academic Press.
Lough J, Gupta AS, Power SB, Grose MR and McGree S. In press. Observed and projected changes in surface climate of tropical Pacific Islands. In Taylor M, McGregor A and Dawson B, eds. Vulnerability of Pacific Agriculture and Forestry to Climate Change. Noumea: Secretariat of the Pacific Community.
Lough JM, Meehl GA and Salinger MJ. 2011. Observed and projected changes in surface climate of the tropical Pacific. In Bell JD, Johnson JE and Hobday AJ, eds. Vulnerability of Tropical Pacific Fisheries and Aquaculture to Climate Change. Noumea: Secretariat of the Pacific Community. 49–99.
Mahlstein I, Knutti R, Solomon S and Portmann RW. 2011. Early onset of significant local warming in low latitude countries. Environ. Res. Lett. 6. doi:10.1088/1748-9326/6/3/034009
Markham R. 2013. The paradox of horticulture in the Pacific Islands. Chronica Horticulturae 53(3):14–20.
McGregor A, Bourke RM, Lebot V and Taylor M. In press-a. Vulnerability of export commodities to climate change. In Taylor M, McGregor A and Dawson B, eds. Vulnerability of Pacific Agriculture and Forestry to Climate Change. Noumea: Secretariat of the Pacific Community.
McGregor A, Taylor M, Bourke RM and Lebot V. In press-b. Vulnerability of staple food crops to climate change. In Taylor M, McGregor A and Dawson B, eds. Vulnerability of Pacific Agriculture and Forestry to Climate Change. Noumea: Secretariat of the Pacific Community.
Miglietta F, Magliulo V, Bindi M, Cerio L, Vaccari FP, Loduca V and Peressoti A. 1998. Free air CO2 enrichment of potato (Solanum tuberosum L.): Development, growth and yield. Global Change Biology 4:163–72.
Morgan JA, Milchunas DG, LeCain DR, West M and Mosier AR. 2007. Carbon dioxide enrichment alters plant community structure and accelerates shrub growth in the short grass steppe. Proceedings of the National Academy of Sciences 104:14724–29.
Murawski SA. 2011. Summing up Sendai: Progress integrating climate change science and fisheries. ICES J. Mar. Sci. 68:1368–72.
Nandlal S and Foscarini R. 1990. Introduction of Tilapia Species and Constraints to Tilapia Farming in Fiji. Rome: Food and Agriculture Organization of the United Nations. Retrieved from www.fao.org/docrep/field/003/ac295e/ac295e00.htm
Nandlal S and Pickering TD. 2004. Tilapia Fish Farming in Pacific Island Countries Volume 2: Tilapia Grow-out in Ponds. Noumea: Secretariat of the Pacific Community.
Newton K, Cote IM, Pilling GM, Jennings S and Dulvy NK. 2007. Current and future sustainability of island coral reef fisheries. Current Biology 17: 655–58.
Pickering TD, Ponia B, Hair CA, Southgate PC, Poloczanska ES, Della Patrona L, Teitelbaum A, Mohan CV, Phillips MJ, Bell JD and De Silva S. 2011. Vulnerability of aquaculture in the tropical Pacific to climate change. In Bell JD, Johnson JE and Hobday AJ, eds. Vulnerability of Tropical Pacific Fisheries and Aquaculture to Climate Change. Noumea: Secretariat of the Pacific Community. 647–731.
Pomeroy R and Andrew NL. 2011. Managing Small Scale Fisheries: Frameworks and Approaches for the Developing World. London: Centre for Agricultural Bioscience International.
REFERENCES

58
REFERENCES
Porter JR, Xie L, Challinor AJ, Cochrane K, Howden SM, Iqbal MM, Lobell DB and Travasso MI. 2014. Food security and food production systems. In Field CB, Barros VR, Dokken DJ, Mach KJ, Mastrandrea MD, Bilir TE, Chatterjee M, Ebi KL, Estrada YO, Genova RC, Girma B, Kissel ES, Levy AN, MacCracken S, Mastrandrea PR and White LL, eds. Climate Change 2014: Impacts, Adaptation, and Vulnerability. Part A: Global and Sectoral Aspects. Contribution of Working Group II to the Fifth Assessment Report of the Intergovernmental Panel on Climate Change. Cambridge and New York: Cambridge University Press. 485–533.
Power S, Delage F, Chung C, Kociuba G and Keay K. 2013. Robust twenty-first-century projections of El Niño and related precipitation variability. Nature. doi:10.1038/nature12580
Pratchett MS, Munday MS, Wilson SK, Graham NAJ, Cinner JE, Bellwood DR, Jones GP, Polunin NVC and McClanahan TR. 2008. Effects of climate-induced coral bleaching on coral-reef fishes: Ecological and economic consequences. Oceanography and Marine Biology: An Annual Review 46:251–96.
Pratchett MS, Munday PL, Graham NAJ, Kronen M, Pinca S, Friedman K, Brewer TD, Bell JD, Wilson SK, Cinner JE et al. 2011. Vulnerability of coastal fisheries in the tropical Pacific to climate change. In Bell JD, Johnson JE and Hobday AJ, eds. Vulnerability of Tropical Pacific Fisheries and Aquaculture to Climate Change. Noumea: Secretariat of the Pacific Community. 493–576.
Preston G. 2009. The Ecosystem Approach to Coastal Fisheries and Aquaculture in Pacific Island Countries and Territories. Part 1: A Review of the Current Status; Part 2: Principles and Approaches for Strategic Implementation. Noumea: Secretariat of the Pacific Community.
Putter CAJ. 1976. The phenology and epidemiology of Phytophthora colocasiae Racib. on taro in East New Britain Province, Papua New Guinea. [Masters thesis] Department of Biology, University of Papua New Guinea, Papua New Guinea.
Rajan S. 2012. Phenological responses to temperature and rainfall: A case study of mango. In Sthapit BR, Ramanatha Rao V and Sthapit SR, eds. Tropical Fruit Tree Species and Climate Change. New Delhi: Bioversity International.
[RCI] Ruth Consolidated Industries. 2008. Worksheet on heat stress in livestock and poultry. Retrieved from http://www.heatstress.info/heatstressinfo/Zonesofcomfort
Rosenthal DM, Slattery RA, Miller RE, Grennan AK, Cavagnaro TR, Fauquet CM, Gleadow RM and Ort DR. 2012. Cassava about-FACE: Greater than expected yield stimulation of cassava (Manihot esculenta) by future CO2 levels. Global Change Biology 18:2661–75.
Ruddle K, Hviding E and Johannes RE. 1992. Marine resource management in the context of customary tenure. Marine Resource Economics 7:249–73.
Sale PF, Agardy T, Ainsworth CH, Feist BE, Bell JD, Christie P, Hoegh-Guldberg O, Mumby PJ, Feary DA, Saunders MI et al. 2014. Transforming management of tropical coastal seas to cope with challenges of the 21st century. Marine Pollution Bulletin 85:8–23.
Smith PT. 2007. Aquaculture in Papua New Guinea: Status of Freshwater Fish Farming. ACIAR Monograph 125. Canberra: Australian Centre for International Agricultural Research.
[SPC] Secretariat of the Pacific Community. 2008. Fish and food security. Policy Brief 1/2008. Noumea: Secretariat of the Pacific Community.
59
[SPC] Secretariat of the Pacific Community. 2010. A Community-based Ecosystem Approach to Fisheries Management: Guidelines for Pacific Island Countries. Noumea: Secretariat of the Pacific Community, Brisbane: The Nature Conservancy, Rome: Food and Agriculture Organization of the United Nations. [SPC] Secretariat of the Pacific Community. 2011. Food Security in the Pacific and East Timor and Its Vulnerability to Climate Change. Noumea: Secretariat of the Pacific Community.
[SPC] Secretariat of the Pacific Community. 2014. Pacific Island fisheries and climate change. Policy Brief 24/2014. Noumea: Secretariat of the Pacific Community.
Stice K and McGregor A. In press. Vulnerability of high-value horticultural crops to climate change. In Taylor M, McGregor A and Dawson B, eds. Vulnerability of Pacific Agriculture and Forestry to Climate Change. Noumea: Secretariat of the Pacific Community.
Taylor M, Crimp S, Dawson B and McGregor A. In press-a. Adapting Pacific agriculture and forestry to climate change: Management measures and investments. In Taylor M, McGregor A and Dawson B, eds. Vulnerability of Pacific Agriculture and Forestry to Climate Change. Noumea: Secretariat of the Pacific Community.
Taylor M, Lal P, Atumurirava F, Sukal A, Solifa D, Nonga N, Groom S and Starz C. In press-b. Agriculture and climate change: An overview. In Taylor M, McGregor A and Dawson B, eds. Vulnerability of Pacific Agriculture and Forestry to Climate Change. Noumea: Secretariat of the Pacific Community.
Taylor M, McGregor A and Dawson B, eds. In press-c. Vulnerability of Pacific Agriculture and Forestry to Climate Change. Noumea: Secretariat of the Pacific Community.
Timmer LW. 1999. Diseases of fruit and foliage. In Timmer LW and Duncan Larry W, eds. Citrus Health Management. Plant Health Management Series. St. Paul, MN: APS Press. 107–15.
Trujillo EE. 1965. Effects of humidity and temperature on zoosporangia production and germination of Phytophthora colocasiae. Phytopathology 55(2):126.
Tubiello FN, Amthor JS, Boote KJ, Donatelli M, Easterling W, Fischer G, Gifford RM, Howden M, Reilly J and Rosenzweig C. 2007. Crop response to elevated CO2 and world food supply: A comment on ‘‘Food for Thought ...” by Long et al., Science 312:1918–21, 2006. European Journal of Agronomy 26:215–23.
Vecchi GA and Wittenberg AT. 2010. El Niño and our future climate: Where do we stand? Wiley Interdisciplinary Reviews: Climate Change 1:260–70.
Waycott M, McKenzie LJ, Mellors JE, Ellison JC, Sheaves MT, Collier C, Schwarz A-M, Webb A, Johnson JE and Payri CE. 2011. Vulnerability of mangroves, seagrasses and intertidal flats in the tropical Pacific to climate change. In Bell JD, Johnson JE and Hobday AJ, eds. Vulnerability of Tropical Pacific Fisheries and Aquaculture to Climate Change. Noumea: Secretariat of the Pacific Community. 297–368.
Wetzel FT, Beissmann H, Penn DJ and Jetz W. 2013. Vulnerability of terrestrial island vertebrates to projected sea-level rise. Global Change Biology. doi:10.1111/gcb.12185
REFERENCES

60
APPENDIX 1
APPENDIX 1. PROJECTED CHANGES TO SURFACE CLIMATE BASED ON CMIP5 MODELS FROM THE IPCC FIFTH ASSESSMENT REPORT The projected changes to surface climate used to assess the vulnerability to climate change of agriculture in Pacific Island countries and territories were based on the greenhouse gas emission scenarios known as Representative Concentration Pathways (RCPs) used in the IPCC Fifth Assessment Report (AR5) and an ensemble of 26 CMIP5 global climate models (Lough et al. in press). The projections for air temperature, rainfall and other features of surface climate based on AR5 and CMIP5 models (Table 13) do not differ substantially from the projections based on IPCC Fourth Assessment Report (AR4) scenarios and World Climate Research Programme Coupled Model Intercomparison Project Phase 3 (CMIP3) models (Appendix 2), largely because both sets of models operate at fairly coarse resolutions due to limits on computing power.
Climate variable RCP Observed 2030 2050 2090Air temperature RCP2.6 Significant warming
0.18oC/decade, 1961–2011
0.75oC 0.75oC 0.75oCRCP4.5 0.75oC 1.0oC 1.5oCRCP6.0 0.75oC 1.0oC 2.2oCRCP8.5 0.75oC 1.5oC 3.0oC
Air temperature extremes
Fourfold increase in frequency of warm days and nights and decrease in cool days and nights, 1951–2011
Becoming more frequent and intense through 21st century and higher emissions scenarios
1 in 20 year extreme daily temperature will be 2–4oC warmer than present extremes (RCP8.5)
Rainfall RCP2.6 No significant change—still dominated by natural variability
Becoming wetter across much of region, especially near-equatorial Kiribati and Nauru, with magnitude of change increasing through 21st century and higher emissions scenarios; drier French Polynesia and Pitcairn Islands
RCP4.5RCP6.0RCP8.5
Rainfall extremes
No significant change—still dominated by natural variability
Becoming more frequent and intense through 21st century and higher emissions scenarios
1 in 20 year extreme daily rainfall will occur every 7–10 years (RCP2.6) and every 4–6 years (RCP8.5)
Tropical cyclones No significant change
Similar number or fewer tropical cyclones but those that occur more intense
ENSO events No significant change but central Pacific ENSOs more frequent than eastern Pacific ENSOs
Continued source of interannual variability; associated rainfall extremes intensify and extreme El Niños (e.g. 1982–1983, 1997–1998) double in frequency during 21st century
Table 13. Summary of observed changes in the climate of Pacific Island countries and territories, and changes projected to occur by 2030, 2050 and 2090 under emissions scenarios based on RCPs. Projected changes are relative to the 1986–2005 base period (with central values for temperature and sea-level projections).

61
All Pacific Island countries and territories are very likely to warm in all seasons by up to 1.0oC by 2030,13 regardless of the RCP emissions scenario followed (Wetzel et al. 2013; Lough et al. in press). By 2050, the extent of warming across the Pacific could be up to 2.0oC and possibly reach 4.0oC by 2090. Climate projections start to diverge, according to emissions scenario, around 2030. Therefore, inferences about potential impacts to agriculture and forestry beyond this time are limited in confidence and strongly dependent on the global mitigation strategy put in place to reduce emissions (Lough et al. in press).
Some model projections also suggest that the wet season will become wetter and the dry season drier (Biasutti 2013). Future rainfall projections indicate an increase in average annual rainfall over large parts of the equatorial Pacific in a warmer climate (Figure 17), though the confidence in these projected changes is substantially less than for projected temperature changes (Lough et al. in press).
During November–April, relatively large percentage increases in rainfall are projected along the equator, in the northeast near the Marshall Islands and in the middle of the SPCZ, with decreases at the northeastern edge of the SPCZ near the Cook Islands. During May–October, relatively large percentage increases in rainfall are projected along the equator and the northwest around Palau and the Federated States of Micronesia, with small changes in the multimodel mean south of the equator (Figure 17; Lough et al. in press).
A warmer climate is expected to bring a greater incidence of daily extremes of high temperatures and rainfall amounts. The current 1-in-20 year extreme daily rainfall event is projected to occur once every 7 to 10 years by 2030, and once every 4 to 6 years by 2090. However, there is some variation across the region with a range of results around this model mean value (Lough et al. in press).
Although climate models do not yet provide consistent projections of the future of ENSO events (Vecchi and Wittenberg 2010; Guilyardi et al. 2012), the CMIP5 models indicate that these events are very likely to continue as the major source of interannual Pacific climate variability (Christensen et al. 2013). A systematic change in the frequency, intensity or pattern of El Niño and La Niña events would have important impacts on average rainfall, rainfall variability, wet and dry extremes, tropical cyclones, and sea levels (Table 14). Future El Niño and La Niña events will tend to be warmer than in the past, and rainfall variability associated with ENSO events is likely to become amplified. This means that areas that are typically wetter (drier) during an ENSO event will become even wetter (drier) for an ENSO of equivalent magnitude in the future (Christensen et al. 2013; Power et al. 2013). There is, however, low confidence as to how Pacific decadal climate variability may change in the future (Christensen et al. 2013).
APPENDIX 1

62
APPENDIX 1
Figure 17. Percentage change in average November–April (left) and May–October (right) rainfall between 1986–2005 and 2080–2099 for (a) RCP8.5; (b) RCP4.5; and (c) observed 1986–2005 average rainfall. Black crosses = 67% of models agree on a change >5%; black circles = 80% of models agree on a change >5%; no stippling = no model agreement (of 67% of models) on change (BOM and CSIRO 2011).
November–April rainfall change Model mean RCP8.5, 1986–2005 to 2080–2099
May–October rainfall change Model mean RCP8.5, 1986–2005 to 2080–2099
30oS
30oN120oN 180oN
0o
30oS
30oN120oN 180oN
0o
November–April rainfall change Model mean RCP4.5, 1986–2005 to 2080–2099
May–October rainfall change Model mean RCP4.5, 1986–2005 to 2080–2099
-100 -80 -40 -10 5 20 60 100-60 -20 -5 10 40 80 120 140
30oS
30oN120oN 180oN
0o
30oS
30oN120oN 180oN
0o
a
b.
GPCP rainfall November–April 1986–2005 GPCP rainfall May–October 1986–2005
140 2 4 6 8 10 12
30 30
-30110 110150 150130 130170 170200 200120 120160 160190 190140 140180 180210 210220 220
-30
-10 -10
10 10
-20 -20
0 0
20 20
c.

63
Table 14. Summary of impacts of El Niño and La Niña on rainfall, sea level and tropical cyclone risk. Rainfall is for November–April in Southern Hemisphere countries and May–October for Northern Hemisphere countries. indicates locations that can experience large opposite swings in sea level at the start of an El Niño event due to the passage of Rossby waves; ** indicates locations that may potentially show significant time lags in the sea-level response to ENSO events; ‡ indicates northeast-facing coastlines only (rainfall data from Global Precipitation Climatology Project (GPCP), //precip.gsfc.nasa.gov/).
Country Region El Niño Extreme El Niño La NiñaAmerican Samoa
sea level**Dry
sea level** sea level**
Cook Islands North Wet Very wet Very dry
South tropical cyclone risk
Very dry
Federated States of Micronesia West Wet sea level
Dry sea level sea level
East Wetsea level
Wet sea level
Dry sea level
Fiji Dry Very dry sea level**
Wet sea level**
French Polynesia Wet DryGuam Wet
sea levelDry
sea level sea level
Kiribati Gilbert Islands Very wet sea level*
Dry sea level*
Very dry
Line Islands Wet sea level
Very wet sea level
Very dry sea level
Marshall Islands North Wet sea level
Wet sea level
Dry sea level
South Wet sea level
Wet sea level sea level
Nauru Very wet sea level
Dry sea level
Very dry
New Caledonia Dry Dry Wet
Niue Dry tropical cyclone risk
Very dry sea level**
Wet sea level**
Commonwealth of the Northern Mariana Islands
sea level sea level sea level
Palau sea level
Very dry sea level
Wet sea level
Papua New Guinea sea level‡
Dry sea level‡ sea level‡
Pitcairn Islands Dry
Samoa sea level** tropical cyclone risk
Very dry sea level** sea level**
Solomon Islands Dry sea level
Dry sea level
Wet sea level
Tokelau Wet Very wet sea level**
Very dry sea level**
Tonga Dry tropical cyclone risk
Very dry Very wet
Tuvalu Wet sea level
Wet sea level
Dry sea level
Vanuatu Dry Dry Very wet
Wallis and Futuna sea level**
Dry sea level sea level**
Notes:November to April rainfall for all stations except those in the Northern Hemisphere (Federated States of Micronesia, Marshall Islands, Palau and Guam), which are based on May to October rainfall.El Niño years since 1979: 1986, 1987, 1991, 1994, 2002, 2004, 2006 and 2009.Extreme El Niño years since 1979: 1982–1983 and 1997–1998.La Niña years since 1979: 1988, 1998, 1999, 2007, 2010 and 2011.Dry or Wet: greater than ± 0.5 standard deviations of mean seasonal rainfall.Very dry or Very wet: greater than ± 2 standard deviations of mean seasonal.
APPENDIX 1

64
APPENDIX 2
APPENDIX 2. INFORMATION USED TO DEVELOP THE END-TO-END APPROACH FOR DETERMINING THE EFFECTS OF CLIMATE CHANGE ON THE PRODUCTION OF FISHERIES AND AQUACULTURE Projected changes to surface climate Modeling based on an ensemble of CMIP3 global climate models and greenhouse gas emissions scenarios used for the IPCC AR4 (BOM and CSIRO 2011; Lough et al. 2011) indicates that surface temperatures in the tropical Pacific are expected to continue their observed warming trend. By 2035, air temperatures are likely to be 0.5–1.0°C higher than the 1980–1999 average. By 2050, the increase is expected to be 1.0–1.5°C, and 2.5–3.0°C by 2100.
There is more uncertainty among climate models about how rainfall patterns will change across the region (Table 15). Nevertheless, the CMIP3 models project that rainfall will increase in the SPCZ and ITCZ near the equator and decrease in the subtropics. Warming oceans are expected to intensify the hydrological cycle, which is likely to lead to more extreme rainfall events and—given warmer air temperatures—more intense droughts. Overall, rainfall in the tropics could increase by 5%–20% by 2035 and 10%–20% by 2050 (Figure 18).
It is still uncertain how the frequency and/or intensity of ENSO events may change in a warming world. Nevertheless, they are expected to continue to be a major source of interannual climate variability in the tropical Pacific (BOM and CSIRO 2011; Lough et al. 2011).
The CMIP3 models also indicate that there may be fewer tropical cyclones in the region in the future, but those that do occur are likely to be more intense. The location of tropical cyclone activity is not projected to change significantly—cyclones are expected to be more frequent and more common between 140°E and 170°E (but extending to 150°W) during La Niña events and less frequent and located mainly between 150°E and 170°W (but extending to 130°W) during El Niño episodes (BOM and CSIRO 2011; Lough et al. 2011).
Projected changes to physical and chemical features of the tropical Pacific OceanThe projected changes to the main features of the tropical Pacific Ocean, based on multimodel mean projections from CMIP3 models, are described in detail by Ganachaud et al. (2011) and summarized in Table 15.
Large-scale currents and eddies The major currents in the tropical Pacific Ocean (Figure 19) are expected to change due to global warming, particularly near the equator. The flow of the South Equatorial Current (SEC) near the equator is projected to decrease progressively in strength, declining by 20%–40% by 2100, with corresponding reductions in SEC transport (volume of water dispersed). The South Equatorial Counter Current (SECC) is also projected to decrease by up to ~40% by 2100. The Equatorial Undercurrent (EUC) is expected to progressively increase in strength and transport by up to 10% by 2100, reducing the depth of the SEC. Eddy activity can be expected to increase or decrease in association with projected changes in current strength (Ganachaud et al. 2011).

65
APPENDIX 2Feature Unit 1980–2000 2035 2050 2100
Air temperature, regional average
°C 25.7 26.4–26.6(+0.8oC)
26.8–27.0(+1.3oC)
28.3–28.6(+2.8oC)
Rainfall Western equatorial 7°S–7°N, 130°E–180°
millimeters (mm)/day
6.3 6.5–6.8(+5.3%)
6.7–7.0(+8.3%)
7.1–7.7(+16.2%)
Eastern equatorial7°S–7°N, 180°–130°W
mm/day 2.7 2.7–3.0(+7.6%)
2.9–3.2(+14.3%)
3.2–3.8(+33.3%)
Northern tropical7°N–25°N, 130°E–130°W
mm/day 4.8 4.8–5.0(+1.9%)
4.9–5.0(+2.9%)
5.0–5.2(+5.9%)
Southeast tropical7°S–25°S, 205°E–130°W
mm/day 4.8 4.7–5.0(+0.3%)
4.7–5.0(-0.1%)
4.4–5.0(-2.5%)
Southwest tropical7°S–25°S, 130°E–205°E
mm/day 5.3 5.4–5.4(+2%)
5.4–5.5(+2.5%)
5.4–5.7(+5.1%)
Westward windstress 2oS–2oN, 130°E–230°W
x 10-2 N/m2 3.6 3.4–3.5(-4%)
3.3–3.5(-5%)
3.1–3.5(-7%)
Water temperature*Sea surface temperature, basin average
°C 27.4 28.2–28.3(+0.8oC)
28.5–28.7(+1.2oC)
29.8–30.1(+2.5oC)
Maximum Warm Pool sea surface temperature, warmest 10% region
°C 29.4 30.1–30.3(+0.8oC)
30.5–30.7(+1.2oC)
31.8–32.2(+2.6oC)
Area enclosed by 29°C isotherm
106 km2 9 22–24(+150%)
29–33(+240%)
53–57(+500%)
Ocean currentsWestward equatorial SEC speed, upper 50 m, 160°E–130°W, 2oS–2oN
centimeters per second (cm/s)
28 26–28(-1.5 cm/s)
n/a 18–23(-7.7 cm/s)
Eastward SECC speed, upper 50 m, 170°E–175°E
cm/s 14 14–16(+1 cm/s)
n/a 9–13(-4 cm/s)
Sea-level riseBased on global climate models**1
cm n/a 6–17(+11 cm)
9–25(+17 cm)
20–58 (+39 cm)
Based on semi-empirical model***2
cm n/a 20–30(+25 cm)
32–48(+40 cm)
80–126(+102 cm)
Ocean acidification pH Aragonite saturation3
8.083.9
7.983.2–3.6(-0.5)
n/a2.8–3.2(-0.9)
7.812.3–2.7(-1.4)
* Sea surface temperature metrics are corrected for bias (i.e. 1980–2000 provides the observed value, based on the HadISST dataset); ** projections derived from IPCC AR4, including scaled-up ice sheet discharge; *** projections from a semi-empirical model; 1 = 5%–95% range; 2 = range is one standard deviation; 3 = range is two standard deviations; SEC = South Equatorial Current; SECC = South Equatorial Counter Current; n/a = data not available or not applicable.
Table 15. Key features of surface climate and the ocean in the tropical Pacific for the period 1980–2000, together with projected ranges for these variables in 2035 (2025–2045), 2050 (2040–2060) and 2100 (2080–2100) for the IPCC SRES A2 emissions scenario; range represents 90% confidence interval about the multimodel mean change. Also shown in brackets is the absolute mean percentage change, relative to 1980–2000 (adapted from Bell et al. 2013).

66
APPENDIX 2
140 °E 160 °E 180 ° 160 °W 140 °W
20 °N
10 °N
0 °
10 °S
20 °S
−8
−6
−4
−2
0
2
4
6
8Change in rainfall (%
/decade)
Longitude
Latit
ude
+
--
-
-
+
+
Intertropical convergence zone
Southeast trade winds
Equatorial trade winds
Northeast trade winds
South Paci�c convergence zone
Figure 18. Projected changes to rainfall and trade winds for the western and central tropical Pacific under the IPCC SRES A2 emissions scenario between 1980–2000 and 2080–2100. The locations of the two convergence zones are shown as solid lines; + and - indicate increases and decreases in wind speeds (Bell et al. 2013).
Figure 19. Projected trends in sea surface temperature (SST) and major surface (black) and subsurface (dashed) currents between 1980–2000 and 2080–2100. Values for currents are volume transport ranges (90% confidence interval for multimodel means; Bell et al. 2013).
0.16 0.18 0.20 0.22 0.24 0.26 0.28 0.30 0.32Change in SST (°C/decade)
Subtropical gyre
Subtropical gyre
North equatorial counter current
New Guinea coastal undercurrent
South equatorial counter current
South equatorial current-40% to -20%
+3% to +10%
-2% to +25%
0% to +27% -37% to +1%
140 °E 160 °E 180 ° 160 °W 140 °W
Longitude
20 °N
10 °N
0 °
10 °S
20 °S
Latit
ude
South equatorial current
Equatorial undercurrent
North equatorial current

67
Ocean temperature and salinityOcean temperature is projected to continue rising substantially, with higher warming rates near the surface, especially in the first 100 m. Sea surface temperature is expected to increase 0.7°C by 2035, 1.4°C by 2050 and 2.5°C by 2100. The salinity of the tropical western Pacific Ocean is projected to decrease due to the intensified hydrological cycle (Lough et al. 2011). The salinity front and the 29°C isotherm associated with the Warm Pool are expected to move further east at the equator.
Nutrient supplyThe food webs that support oceanic and coastal fisheries in the tropical Pacific depend on nutrients being delivered to surface waters. In many parts of the ocean, the stratification of the water column largely blocks the transfer of nutrients to the photic zone because the thermocline (the region of the water column where water temperature and salinity gradients change rapidly) is a barrier to the vertical movement of water (Figure 20a).
Typically, the waters below the thermocline are rich in nutrients (from the mineralization of
dead organisms), whereas the waters above are poor in nutrients (because nutrients are used for primary production). The barrier created by the thermocline is penetrated where upwelling occurs. In such places, primary production is high. However, some (cold) eddies have a similar effect because they bring the thermocline, as well as the nutrient-rich waters below the barrier, closer to the surface and into the photic zone (Figure 20b).
Increases in sea surface temperature due to global warming are projected to increase the stratification of the water column and strengthen the barrier to the transfer of nutrients created by the thermocline. In the Warm Pool, projected increases in rainfall (Appendix 1) will reduce salinity and increase stratification further (Ganachaud et al. 2011). Preliminary modeling of the effects of global warming on nutrient availability indicates that decreases in net primary productivity are expected to occur in all ecological provinces except in the Pacific Equatorial Divergence (Figure 21), where upwelling is expected to remain strong enough to continue to deliver nutrients to surface waters (Le Borgne et al. 2011).
Figure 20. (a) Key features of the surface layer of the ocean that determine primary production; the thermocline is a barrier to mixing and transfer of nutrients from cold, deep water to the surface mixed layer (Le Borgne et al. 2011, Figure 4.2); (b) features of cold eddies (rotating clockwise in the Southern Hemisphere), which bring the thermocline closer to the surface (Ganachaud et al. 2011, Figure 3.11, reproduced with the permission of the Secretariat of the Pacific Community, Noumea, New Caledonia).
APPENDIX 2
Clockwise cyclonea) b)
Photic zonePhotic zone
Mixed layer
Cold layerThermocline
ThermoclineBarrier to exchange
Aphotic zone
Aphotic zone
0.1% surface light
Cold eddy
Nutrients
Westernpropagation
New nutrients(large/small pool)
Bacteria andzooplankton
Warm/cold eddy Sunlight
Eddy propagation
Nutrientremineralisation Mixing
Upwelling
Atmosphericnutrient inputs
Thermocline displacement
Diffusion(small/large barrier)
Phytoplankton
Nutrients
Enhanced production
Regenerated nutrients(large/small pool)
Light attenuation Grazing
Nutrient uptake
Light
Light
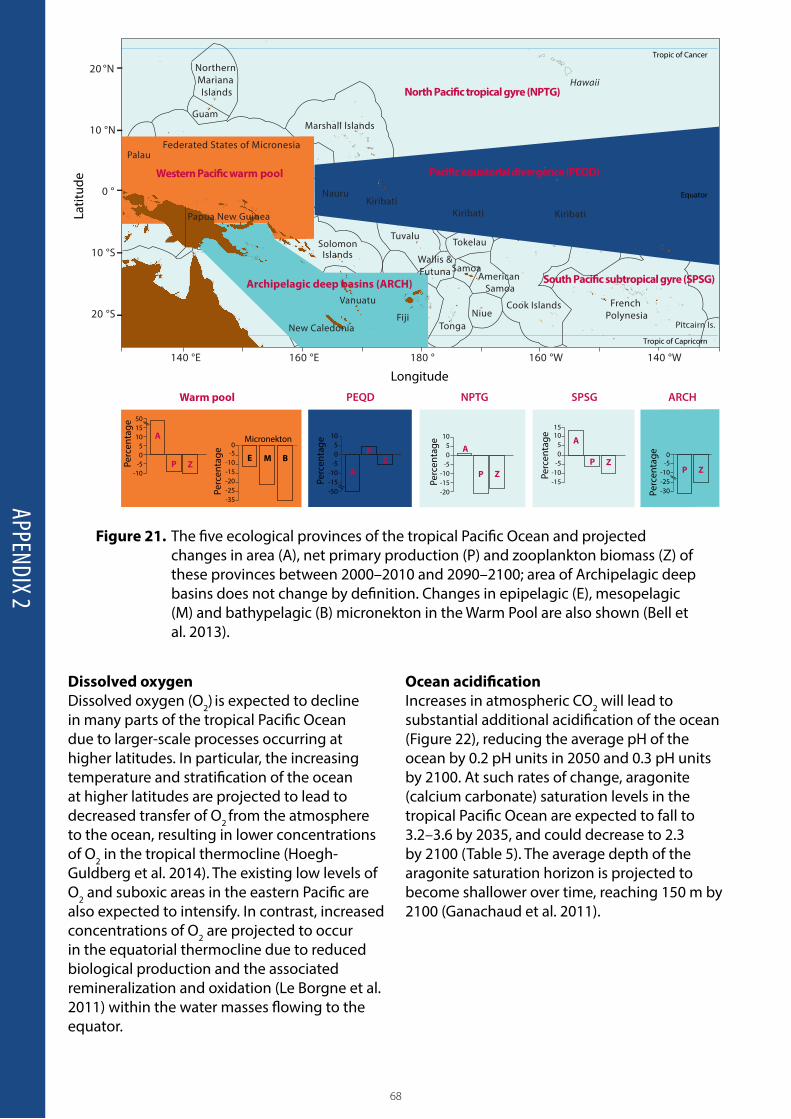
68
APPENDIX 2
Dissolved oxygen Dissolved oxygen (O2) is expected to decline in many parts of the tropical Pacific Ocean due to larger-scale processes occurring at higher latitudes. In particular, the increasing temperature and stratification of the ocean at higher latitudes are projected to lead to decreased transfer of O2 from the atmosphere to the ocean, resulting in lower concentrations of O2 in the tropical thermocline (Hoegh-Guldberg et al. 2014). The existing low levels of O2 and suboxic areas in the eastern Pacific are also expected to intensify. In contrast, increased concentrations of O2 are projected to occur in the equatorial thermocline due to reduced biological production and the associated remineralization and oxidation (Le Borgne et al. 2011) within the water masses flowing to the equator.
140 °E 160 °E 180 ° 160 °W 140 °W
20 °N
10 °N
0 °
10 °S
20 °S
Wallis &Futuna
Northern Mariana Islands
Pitcairn Is.
French Polynesia
Federated States of Micronesia
Western Paci�c warm pool
Archipelagic deep basins (ARCH)
North Paci�c tropical gyre (NPTG)
Paci�c equatorial divergence (PEQD)
South Paci�c subtropical gyre (SPSG)
Longitude
Latit
ude
1510
50
-5-10-15
A
P Z
Perc
enta
ge
0-5
-10-25-30
P Z
Perc
enta
ge
0-5
-10-15-20-25-35
E M
Perc
enta
ge B
Micronekton 1050
-5-10-15-20
A
P Z
Perc
enta
ge10
50
-5-10-15-50
A
PZ
Perc
enta
ge
501510
50
-5-10
A
ZPPerc
enta
ge
Warm pool
Tropic of Capricorn
Tropic of Cancer
Equator
Figure 21. The five ecological provinces of the tropical Pacific Ocean and projected changes in area (A), net primary production (P) and zooplankton biomass (Z) of these provinces between 2000–2010 and 2090–2100; area of Archipelagic deep basins does not change by definition. Changes in epipelagic (E), mesopelagic (M) and bathypelagic (B) micronekton in the Warm Pool are also shown (Bell et al. 2013).
Ocean acidificationIncreases in atmospheric CO2 will lead to substantial additional acidification of the ocean (Figure 22), reducing the average pH of the ocean by 0.2 pH units in 2050 and 0.3 pH units by 2100. At such rates of change, aragonite (calcium carbonate) saturation levels in the tropical Pacific Ocean are expected to fall to 3.2–3.6 by 2035, and could decrease to 2.3 by 2100 (Table 5). The average depth of the aragonite saturation horizon is projected to become shallower over time, reaching 150 m by 2100 (Ganachaud et al. 2011).

69
APPENDIX 2
Sea level Earlier projections from the IPCC Fourth Assessment Report that sea level will rise by ~50 cm under the A2 emissions scenario by 2100 are now considered to be conservative because they do not include the effects of increased flow from the melting of land ice. Other projections based on historical reconstructions for global sea-level rise, which include the effects of ice melt and thermal expansion, indicate that sea-level rise could be 25 cm by 2035 and ~100 cm by 2100 (Table 15). (See BOM and CSIRO 2011 and Lough et al. in press for additional projections of sea level.)
Projected changes to fish habitatsOpen ocean ecosystemsThe tropical Pacific Ocean is not a uniform habitat. Rather, the region is divided into five ecological provinces (Longhurst 2006). These provinces are known as the Pacific Equatorial Divergence (PEQD), Western Pacific Warm Pool (Warm Pool), North Pacific Tropical Gyre (NPTG), South Pacific Subtropical Gyre (SPSG) and Archipelagic Deep Basins (ARCH). (See Figure 21).
The borders of these provinces are generally defined by the convergence zones of the major surface currents described by Ganachaud et al. (2011), and each province has a specific wind regime and vertical hydrological structure (Le
Figure 22. The effect of increased atmospheric carbon dioxide on carbonate ions (CO3 2-) in seawater, which causes ocean acidification and reduces the availability of calcium carbonate for marine life (Ganachaud et al. 2011, Box 3.3, reproduced with the permission of the Secretariat of the Pacific Community, Noumea, New Caledonia).
Borgne et al. 2011). In addition, the locations of PEQD and the Warm Pool change from year to year, depending on prevailing ENSO conditions. Consequently, any analysis of the effects of climate change on open ocean ecosystems has to be done in the context of the five ecological provinces.
Modeling based on linking a global climate model with a biogeochemical model indicates that the projected changes to the climate of the tropical Pacific are expected to alter (i) the surface areas of provinces, except ARCH, which is fixed by definition; and (ii) the net primary production and zooplankton production within each province (Figure 21; Le Borgne et al. 2011). In particular, the area of PEQD is expected to be reduced by 50% by 2100, the area of the Warm Pool is projected to increase correspondingly, and SPSG and NPTG are expected to expand towards the poles and to the west.
The organisms that comprise the food webs for tuna and other large pelagic fish are projected to respond differently to the projected changes in sea surface temperature, nutrient supply, oxygen levels and ocean acidification in each province. For example, the decreases in nutrient supply in SPSG and NPTG are likely to reduce the average size of phytoplankton, resulting in less efficient food webs. In comparison, the food web in the PEQD is not expected to be sensitive
High productivity/shell formation
CO2
CO2 + H2O => HCO3- + H+
=> Ca2+ + CO32-
H+ CO32- => HCO3
-
CaCO3
High CaCO3dissolution Aragonite saturation horizon
Marine Life

70
APPENDIX 2
to decreases in nutrients because upwelling will continue, and because the supply of iron is the main factor limiting primary production there (Le Borgne et al. 2011).
Coastal fish habitatsCoral reefsCoral reefs are expected to be degraded badly by the projected increases in sea surface temperature and by ocean acidification. The relationship between corals and their symbiotic dinoflagellate algae breaks down under extended periods of thermal stress. The impact of this stress—coral bleaching—is correlated with periods when sea surface temperature exceeds the summer maxima by 1–2°C for 3–4 weeks or more (Hoegh-Guldberg et al. 2011). Varying thermal sensitivity among corals is expected to lead to progressive loss of heat-tolerant species. The projected decreases in pH and aragonite saturation levels (Table 15) pose severe threats to corals because their ability to build hard skeletons from carbonate ions is expected to fail when atmospheric concentrations of CO2 exceed 450 parts per million. The outcome of more frequent bleaching and reduced calcification will be more fragile and degraded reefs.
Two other aspects of climate change are expected to exacerbate these problems: (i) cyclones of greater intensity (Category 4 or 5) will cause more severe damage to reefs in subtropical areas; and (ii) greater sediment and nutrient loads from heavier rainfall will impede photosynthesis by symbiotic dinoflagellates and create more favorable conditions for the epiphytic algae that compete with corals. Negative impacts on coral recruitment and growth can be expected due to heavy runoff. In addition, changes in ocean currents, upwelling and nutrient supply are also expected to affect replenishment and growth of corals.
Although good local management of catchments can reduce the negative effects of sediments and nutrient loads from runoff, progressive declines in live coral cover and increases in macroalgae are expected to occur for the remainder of the century (Hoegh-Guldberg et al. 2007, 2011). (See Figure 23.)
MangrovesThe projected rise in sea level makes mangroves highly vulnerable because more frequent
inundation by seawater affects growth and permanent inundation kills the trees (Waycott et al. 2011). Mangroves can adapt to sea-level rise by migrating landward, but this depends on local topography and hydrology, sediment composition, competition with other plant species in landward areas, and the rate of sea-level rise. There is concern that the capacity of mangroves to migrate landward may not be able to keep pace with the projected accelerated rate of sea-level rise. In many places, steep terrain and existing infrastructure (e.g. roads) will prevent migration. Any increase in cyclone intensity will have severe consequences for mangroves because cyclones damage foliage, desiccate plant tissues, and increase evaporation rates and salinity stress. More powerful wave surges during cyclones also erode sediments on the seaward edge of mangroves and reduce the stability of plants.
Two aspects of climate change should improve conditions for mangroves—heavier rainfall and higher CO2 concentrations. Mangroves grow better where increased rainfall lowers salinities and delivers more nutrients, and respiration and productivity are likely to improve as atmospheric concentrations of CO2 increase. On balance, however, the integration of all the projected effects is likely to result in significant reductions in mangrove habitat (Figure 23).
Seagrasses The potential impacts of increased sea surface temperature on intertidal and subtidal seagrasses include changes in species composition, relative abundance and distribution, as well as acute “burn off” during short-term temperature spikes (Waycott et al. 2011). Turbidity associated with increased rainfall is expected to cause decreases in photosynthesis, limiting the growth rate and the depth at which seagrasses can grow.The effects of reduced light on seagrass growth due to more turbid coastal waters are likely to be compounded by sea-level rise. Seagrasses growing along the deeper margins of meadows are already at the limit of their light tolerance and are unlikely to be able to adapt to further light reductions. However, in some intertidal and shallow subtidal areas, seagrasses are expected to adapt to rising sea levels by growing landward, provided the newly inundated sediments are suitable.
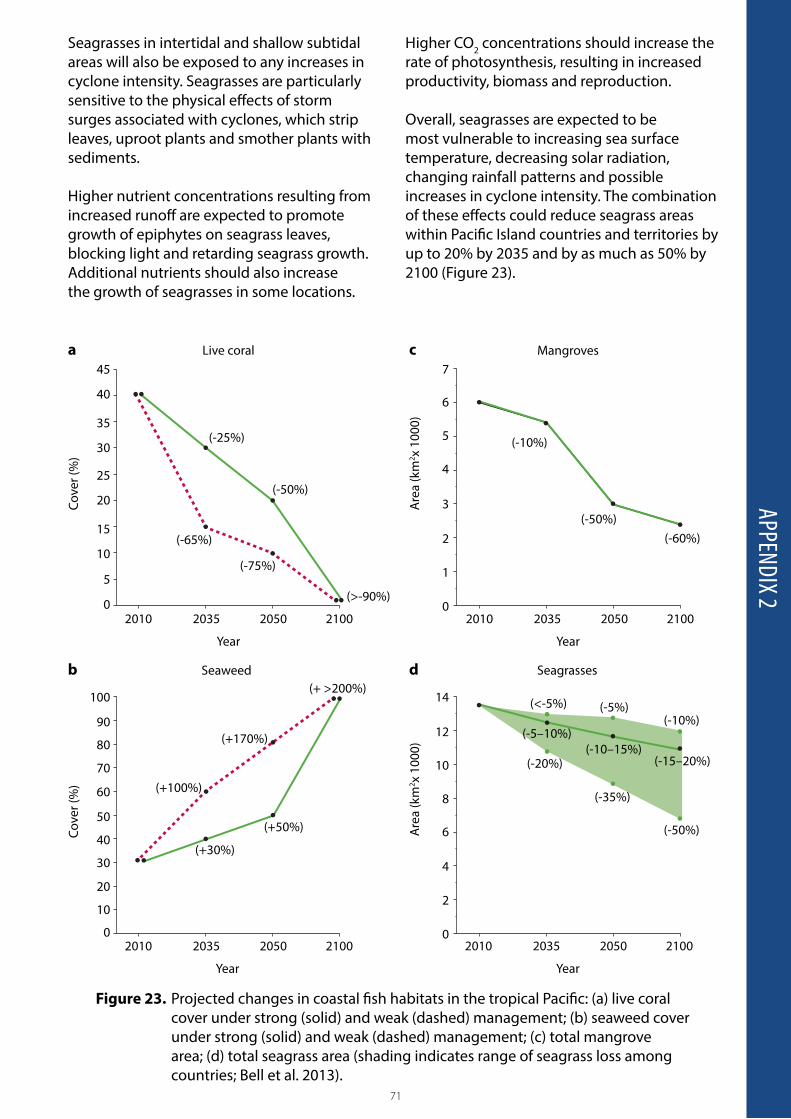
71
Seagrasses in intertidal and shallow subtidal areas will also be exposed to any increases in cyclone intensity. Seagrasses are particularly sensitive to the physical effects of storm surges associated with cyclones, which strip leaves, uproot plants and smother plants with sediments.
Higher nutrient concentrations resulting from increased runoff are expected to promote growth of epiphytes on seagrass leaves, blocking light and retarding seagrass growth. Additional nutrients should also increase the growth of seagrasses in some locations.
Higher CO2 concentrations should increase the rate of photosynthesis, resulting in increased productivity, biomass and reproduction.
Overall, seagrasses are expected to be most vulnerable to increasing sea surface temperature, decreasing solar radiation, changing rainfall patterns and possible increases in cyclone intensity. The combination of these effects could reduce seagrass areas within Pacific Island countries and territories by up to 20% by 2035 and by as much as 50% by 2100 (Figure 23).
Figure 23. Projected changes in coastal fish habitats in the tropical Pacific: (a) live coral cover under strong (solid) and weak (dashed) management; (b) seaweed cover under strong (solid) and weak (dashed) management; (c) total mangrove area; (d) total seagrass area (shading indicates range of seagrass loss among countries; Bell et al. 2013).
45
25
35
15
40
20
30
10
5
0
(-25%)
(-50%)
(-65%)
2010 20502035 2100
(-75%)
(>-90%)
Live coral
Year
Cove
r (%
)
a
100
60
80
40
90
50
70
30
20
10
0
(+ >200%)
(+170%)
(+100%)
(+30%)
(+50%)
2010 20502035 2100
Seaweed
Year
Cove
r (%
)
b
5
7
3
4
6
2
1
0
(-10%)
(-50%)(-60%)
2010 20502035 2100
Mangroves
Year
Are
a (k
m2 x
1000
)
c
10
14
6
8
12
4
2
0
(-10–15%)(-5–10%)
(-15–20%)
(-50%)
(-35%)
(-20%)
(<-5%) (-5%)(-10%)
2010 20502035 2100
Seagrasses
Year
Are
a (k
m2 x
1000
)
d
APPENDIX 2

This publication should be cited as: Bell J and Taylor M. 2015. Building climate-resilient food systems for Pacific Islands. Penang, Malaysia: WorldFish. Program Report: 2015-15.
© 2015. WorldFish. All rights reserved. This publication may be reproduced without the permission of, but with acknowledgment to, WorldFish.
Paper made fromrecycled material
100% RECYCLED
Contact Details:WorldFish, PO Box 500 GPO,10670 Penang, MALAYSIAwww.worldfishcenter.org
Photo credit: Front cover, Neil Andrew/WorldFishPhoto credit: Back cover, Vincent Lebot/CAB International