building energy; identifying opportunities and …jkr.gov.my [email protected]...
TRANSCRIPT

NATIONAL W ORKSHOP,
BUILDING SECTOR ENERGY EFFICIENCY2 5 t h F e b r u a r y 2 0 1 6 , P u l l m a n B a n g s a r , K u a l a L u m p u r
I r L o o i H i p P e u
B . E n g ( H o n s ) , P. E n g ( P r a c t i c e C e r t ) , J u r u t e r a G a s , F. I E M
I m m e d i a t e P a s t P r e s i d e n t M G B C ,
C o m p o n e n t 5 M a n a g e r , B S E E P
Building Energy; Identifying opportunities and technologies

T h e B u i l d i n g S e c t o r c o n s u m e s 1 5 % o f t o t a l
e n e r g y ( n a t i o n a l e n e r g y b a l a n c e ) a n d 5 5 % i n
t h e e l e c t r i c i t y s e c t o r . A s b u i l d i n g e n e r g y
( e l e c t r i c i t y ) c o m e s u n d e r i n c r e a s i n g s c r u t i n y
2 Synopsis
Building Energy; Identifying opportunities and
technologies
© I r H . P . L o o i ( h i p p e u l o o i @ g m a i l . c o m ) 2 5 F e b 2 0 1 6
f r o m p r a c t i c a l f i n a n c i a l a n d r e g u l a t o r y c o n s i d e r a t i o n s , t h e
n e e d f o r E . E . i n t h e b u i l d i n g s e c t o r w i l l b e c o v e r e d i n t h i s
p a p e r w i t h t h e f o l l o w i n g t o p i c a l d i s c u s s i o n s :
1. BSEEP Component 5 – Demonstrating E.E. in buildings
2. Identifying Building Energy; E.E. Benchmarks and Performance Indicators
3. Identifying Technologies; Fitting technologies to NEEDS

BUILDING SECTOR ENERGY EFFICIENCY PROJECT
Component 5 – Demonst ra t ion Pro jec ts
© I r H . P . L o o i ( h i p p e u l o o i @ g m a i l . c o m ) 2 5 F e b 2 0 1 6
BUILDING SECTOR ENERGY EFFICIENCY PROJECT
C a w a n g a n A l a m S e k i t a r D a n T e n a g aI b u P e j a b a t J K R M a l a y s i aT i n g k a t 2 3 , M e n a r a P J D , N o 5 0 , J a l a n T u n R a z a k , 5 0 4 0 0 K U A L A L U M P U R T e l : ( 6 0 3 ) 4 0 4 1 1 9 2 | F a x : ( 6 0 3 ) 4 0 4 1 1 9 8 8 W e b : w w w . j k r . g o v . m y / b s e e p /
4 About BSEEP

5 About BSEEP
BUILDING SECTOR ENERGY EFFICIENCY PROJECT
Government & Private Sectors
Implementing Agency
Implementing Partner
Financer
© I r H . P . L o o i ( h i p p e u l o o i @ g m a i l . c o m ) 2 5 F e b 2 0 1 6

6 About BSEEP
BUILDING SECTOR ENERGY EFFICIENCY PROJECT
© I r H . P . L o o i ( h i p p e u l o o i @ g m a i l . c o m ) 2 5 F e b 2 0 1 6
Global Environmental Facility Internationalcooperation to address global environmentalissues. Funded by donors and financiers. Serves asthe financial frame work for the United NationsFramework on Climate Change (UNFCC)
United Nations Development Programme is theUnited Nations global development network.UNDP focuses on 3 main areas; (1) Sustainabledevelopment, (2) Democratic governance andpeacebuilding, and (3) Climate and disasterresilience.
Public Works Department, Ministry of Works, Malaysia

7 About BSEEP
© I r H . P . L o o i ( h i p p e u l o o i @ g m a i l . c o m ) 2 5 F e b 2 0 1 6

8 About BSEEP – 5 Components
© I r H . P . L o o i ( h i p p e u l o o i @ g m a i l . c o m ) 2 5 F e b 2 0 1 6
• Clear and effective system of monitoring and improving the energy performance of the building sector
1. Institutional CapacityDevelopment
• Implementation of, and compliance to, favorable policies that encourage the application of EE technologies in the country’s buildings sector
2. Policy Development &Regulatory Framework
• Availability of financial and institutional support for initiatives on EE building technology applications
3. E.E. Financing CapacityImprovements
•Enhanced awareness of the government, publicand the buildings sector on EE building technologyapplications
4. Information and AwarenessEnhancement
•Improved confidence in the feasibility,performance, energy, environmental and economicbenefits of EE building technology applicationsleading to the replication of the EE technologyapplication demonstration
5. E.E. Demonstration Projects

9 About Component 5 – BSEEP
© I r H . P . L o o i ( h i p p e u l o o i @ g m a i l . c o m ) 2 5 F e b 2 0 1 6
BUILDING SECTOR ENERGY
EFFICIENCY PROJECT
C o m p o n e n t 5 – D e m o n s t r a t i o n P r o j e c t s
hippeulooi@gmail .com
Ir. Looi Hip Peu - C5 Manager
B.Eng (Hons), P.Eng, Jurutera Gas, F.IEM
Immediate Past President,
Malaysia Green Building Confederation

10 About Component 5 – BSEEP
© I r H . P . L o o i ( h i p p e u l o o i @ g m a i l . c o m ) 2 5 F e b 2 0 1 6
•Improved confidence in the feasibility,performance, energy, environmental andeconomic benefits of EE buildingtechnology applications leading to thereplication of the EE technologyapplication demonstration
5. E.E. Demonstration Projects
Improved confidence in the
feasibility, performance, energy,
environmental and economic benefits of
EE building technology applications
leading to the replication of the EE technology
application demonstration

11 About Component 5 – BSEEP
© I r H . P . L o o i ( h i p p e u l o o i @ g m a i l . c o m ) 2 5 F e b 2 0 1 6
As BSEEP is a fully funded (GEF-UNDP) programme, NO COSTWILL BE CHARGED TO ELIGIBLEprojects.
However BSEEP will be keen toearn Environmental Profit.
Participating project owners mustbe willing to share data withBSEEP.

12 BSEEP C5 Activities
© I r H . P . L o o i ( h i p p e u l o o i @ g m a i l . c o m ) 2 5 F e b 2 0 1 6
(1) Pro Active Intervention
(a) Building Simulation
(b) Energy Audit
(2) Active Intervention
(a) Grant for E.E. Technology for retrofit or new projects
(b) On Line Monitoring for Building Energy
1. Project which promote and showcase successful application
of EE technologies and practices (exclude the broader
agenda of ‘green’).
2. Building Sector Only (exclude industry sector).
3. Building retrofit (i.e. existing) OR new construction are eligible
4. Project in the public or private sector are eligible
5. All Activities are fully funded by BSEEP
New Project
Existing Building

© I r H . P . L o o i ( h i p p e u l o o i @ g m a i l . c o m ) 2 5 F e b 2 0 1 6
13 BSEEP C5 Grants
BSEEP provides grants for approved projects underComponent 5 Only building sector Demonstrate clear E.E. Objectives An achievable target of RM grant per tCO2 abatement Existing building retrofit and new buildings eligible Grants provided are subject to conditions:
E.E. measures where grant is provided MUST becompleted.Grants are NOT FULL funding but may be partialfunding.Grants are generally for technical assistance ONLYPartial funding of capital cost MAY be possible (subjectto approval.

14 BSEEP C5 – Identifying Technologies
© I r H . P . L o o i ( h i p p e u l o o i @ g m a i l . c o m ) 2 5 F e b 2 0 1 6
Technologies General Application
1 ACMV – Chiller Replacement Generally large chillers
2 ACMV – air cond retrofit/replacement Eg small central chiller, VRV systems,
3 ACMV – System retrofit Air side retrofit, water side retrofit, VSD drive, Energy management
4 ACMV – Passive design, low thermal wall
5 ACMV – Passive design, glazing
6 ACMV – Total building envelope studies Shading device, tinting of glazing
7 ACMV – Enthalpy wheels, heat recovery
8 ACMV – heat recovery from reject system for hot water
9 Solar thermal – hot water Generally only hotels and hospitals
10 Solar air conditioning (Adsorption Chiller) Currently capex is still to high.
11 Lamp replacement/ low energy lamps
12 Energy management system
13

15 BSEEP C5 – Identifying Technologies
© I r H . P . L o o i ( h i p p e u l o o i @ g m a i l . c o m ) 2 5 F e b 2 0 1 6
Data; Preliminary ONLY pending detail analysis at end of C5 programme

16
© I r H . P . L o o i ( h i p p e u l o o i @ g m a i l . c o m ) 2 5 F e b 2 0 1 6
Email: C5 Manager [email protected]
Provide some basic details:
1. Type of project (new or retrofit, building
type, GFA, location, owner etc)
2. Energy audit done
3. What kind of assistance preferred?
BSEEP C5 – End

© I r H . P . L o o i ( h i p p e u l o o i @ g m a i l . c o m ) 2 5 F e b 2 0 1 6

18
© I r H . P . L o o i ( h i p p e u l o o i @ g m a i l . c o m ) 2 5 F e b 2 0 1 6
Components of Building Energy
U n d e r s t a n d i n g B u i l d i n g C o m p o n e n t s a n d B u i l d i n g E n e r g y
B e n c h m a r k s a r e i m p o r t a n t a s a f i r s t s t e p i n i d e n t i f y i n g E . E .
t e c h n o l o g i e s a n d m e a s u r e s .
W h a t a r e t h e t y p i c a l c o m p o n e n t s o f B u i l d i n g E n e r g y a n d w h a t
a r e t h e i n d i c e s u s e d t o b e n c h m a r k E . E . p e r f o r m a n c e ?
G e n e r a l l y t w o M A J O R s u b s e c t o r c a n b e i d e n t i f i e d . B o t h s u b
s e c t o r s a r e d i f f e r e n t i n t e r m s o f e n e r g y u s e p r o f i l e ,
b e n c h m a r k i n g m e t h o d o l o g i e s a n d t h e r e f o r e t h e t e c h n o l o g i e s
t o b e a p p l i e d . T h i s s u b m o d u l e h a s t h e f o l l o w i n g t o p i c s :
1. Introduction; difference between Residential and Non Residential Sector
2. The Residential Sector
4. The Non – Residential Sector
19
© I r H . P . L o o i ( h i p p e u l o o i @ g m a i l . c o m ) 2 5 F e b 2 0 1 6
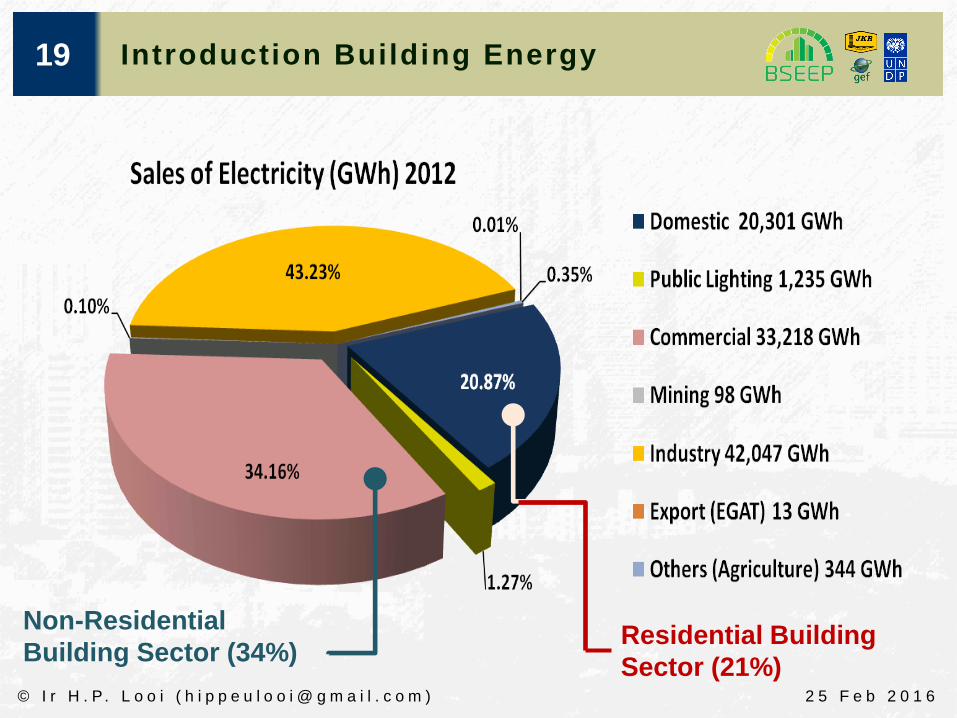
Introduction Building Energy
Non-Residential
Building Sector (34%)Residential Building
Sector (21%)

20
© I r H . P . L o o i ( h i p p e u l o o i @ g m a i l . c o m ) 2 5 F e b 2 0 1 6
Introduction Building Energy
Typical Office
Typical Middle Class
Household
Energy Use for the Residential
& Non Residential Sectors are
substantially DIFFERENT in
terms of use profile and
technologies.

21
© I r H . P . L o o i ( h i p p e u l o o i @ g m a i l . c o m ) 2 5 F e b 2 0 1 6
Introduction Building Energy
The Industrial sector consumes 45% of total energy
nationally. Note; MToe = Millions, Tonnes Oil Equivalent

22
© I r H . P . L o o i ( h i p p e u l o o i @ g m a i l . c o m ) 2 5 F e b 2 0 1 6
The Residential Building Sector
Landed properties constitute a major
proportion of housing types (more than
77%) with high-rise apartments and flats
constituting only 16% of housing stock

23
© I r H . P . L o o i ( h i p p e u l o o i @ g m a i l . c o m ) 2 5 F e b 2 0 1 6
The Residential Sector

24
© I r H . P . L o o i ( h i p p e u l o o i @ g m a i l . c o m ) 2 5 F e b 2 0 1 6
The Residential Sector

25
© I r H . P . L o o i ( h i p p e u l o o i @ g m a i l . c o m ) 2 5 F e b 2 0 1 6
The Residential Sector

26
© I r H . P . L o o i ( h i p p e u l o o i @ g m a i l . c o m ) 2 5 F e b 2 0 1 6
The Residential Sector

27
© I r H . P . L o o i ( h i p p e u l o o i @ g m a i l . c o m ) 2 5 F e b 2 0 1 6
The Residential Sector

28
© I r H . P . L o o i ( h i p p e u l o o i @ g m a i l . c o m ) 2 5 F e b 2 0 1 6
The Residential Sector
Case Study (Middle Class Malaysian Family)

29
© I r H . P . L o o i ( h i p p e u l o o i @ g m a i l . c o m ) 2 5 F e b 2 0 1 6
The Residential Sector
For Residential Buildings NO BEI benchmarks, BUT building
energy performance based on OTTV as practiced by GBI:
Levels GBI RNC Version 3 OTTV landed
GBI RNC Version 3 OTTV High rise
1 50W/m² 50W/m²
2 46W/m² 46W/m²
3 44W/m² 42W/m²
4 42W/m² 38W/m²
5 40W/m² 34W/m²
6 38W/m² 30W/m²

30
© I r H . P . L o o i ( h i p p e u l o o i @ g m a i l . c o m ) 2 5 F e b 2 0 1 6
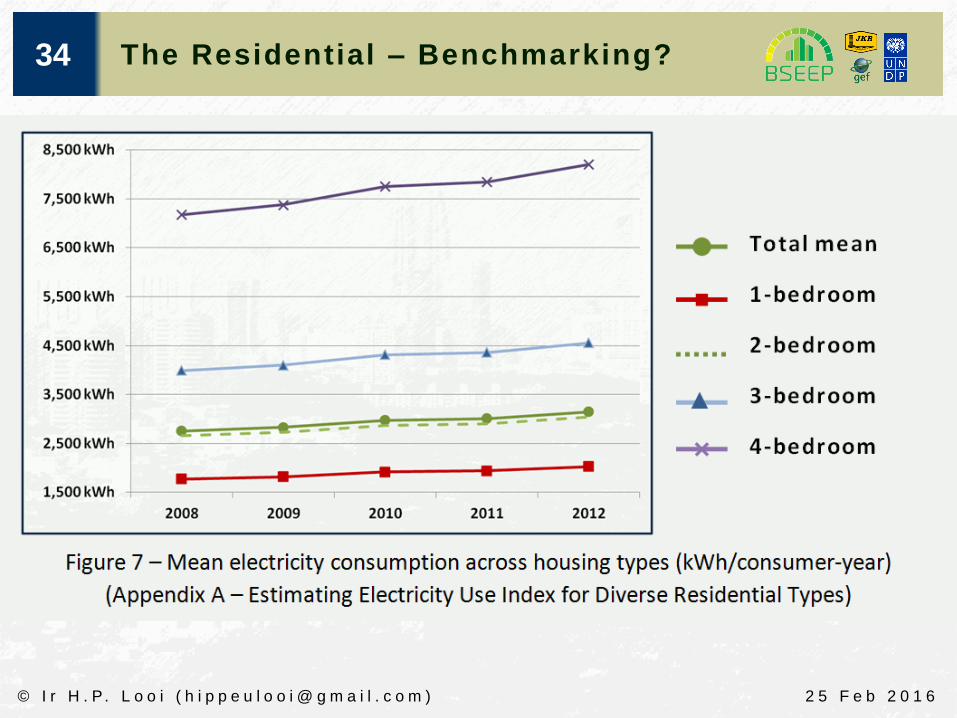
The Residential – Benchmarking?
Energy Use for the Domestic Sector
Arithmetic mean of electricity use based on sum total of all domestic consumers inMalaysia (kWh per domestic consumer per year).

31
© I r H . P . L o o i ( h i p p e u l o o i @ g m a i l . c o m ) 2 5 F e b 2 0 1 6
The Residential – Benchmarking?
Energy Use for the Domestic Sector
Singapore Data
Average Monthly Sales in kWh 2009 2010 2011
Overall 481 489 470
HDB Public Housing 375 382 369
1-Room / 2-Room 149 154 153
3-Room 278 284 277
4-Room 387 394 380
5-Room and Executive 473 482 465
Private Housing 821 824 784
Private Apartments and Condo 678 679 644
Landed Properties 1203 1229 1190

32
© I r H . P . L o o i ( h i p p e u l o o i @ g m a i l . c o m ) 2 5 F e b 2 0 1 6
The Residential – Benchmarking?

33
© I r H . P . L o o i ( h i p p e u l o o i @ g m a i l . c o m ) 2 5 F e b 2 0 1 6
The Residential – Benchmarking?
34
© I r H . P . L o o i ( h i p p e u l o o i @ g m a i l . c o m ) 2 5 F e b 2 0 1 6
The Residential – Benchmarking?

35
© I r H . P . L o o i ( h i p p e u l o o i @ g m a i l . c o m ) 2 5 F e b 2 0 1 6
TNB – Online Monitoring

36
© I r H . P . L o o i ( h i p p e u l o o i @ g m a i l . c o m ) 2 5 F e b 2 0 1 6
The Residential Sector Case
Case Study to find out how
much building envelope
contribute to Residential
Energy

37
© I r H . P . L o o i ( h i p p e u l o o i @ g m a i l . c o m ) 2 5 F e b 2 0 1 6
The Residential Sector
Simulation of
Cooling Energy
due to insulation
and AAC bricks.
Single StoreyCorner Lot Intermediate Lot Double Storey
Corner Lot Intermediate Lot

38
© I r H . P . L o o i ( h i p p e u l o o i @ g m a i l . c o m ) 2 5 F e b 2 0 1 6
The Residential Sector
Single StoreyCorner Lot Intermediate Lot
Double StoreyCorner Lot Intermediate Lot
39
© I r H . P . L o o i ( h i p p e u l o o i @ g m a i l . c o m ) 2 5 F e b 2 0 1 6
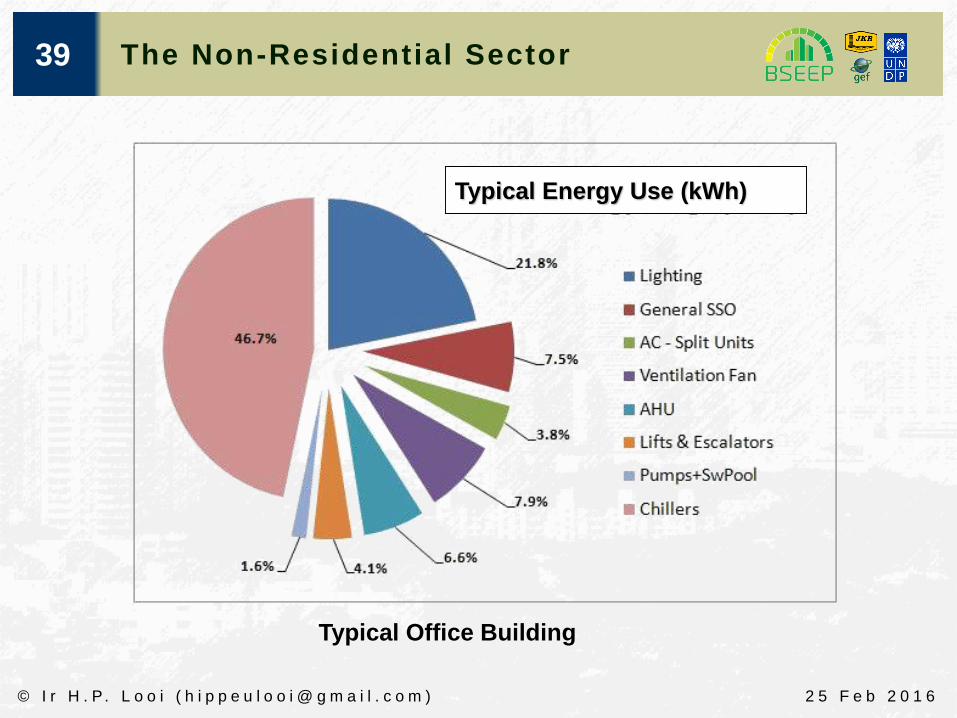
The Non-Residential Sector
Typical Energy Use (kWh)
Typical Office Building

40
© I r H . P . L o o i ( h i p p e u l o o i @ g m a i l . c o m ) 2 5 F e b 2 0 1 6
The Non-Residential Sector
In Commercial buildings, we can conclude that building
energy comprise the following:
It is possible to design a building which lessen energy use
of those components listed above. These building
components can be said to be “intrinsic” to the building
OR part of the building ‘character’.
1. Air conditioning = 45% - 60%
2. Lighting = 15% - 25%
3. Utilities = 10% - 30%
4. General power outlets = 10% - 30%
These are dependent
on building design.
This do not depend on
building design.

41
© I r H . P . L o o i ( h i p p e u l o o i @ g m a i l . c o m ) 2 5 F e b 2 0 1 6
Commercial Building Standards

42
© I r H . P . L o o i ( h i p p e u l o o i @ g m a i l . c o m ) 2 5 F e b 2 0 1 6
The Non-Residential - Standards
Benchmarking buildings is illustrated in this diagram.
1. The NFPA 101 (NFPA = National Fire Protection Association, USA) is a technical
standard for designing codes for “Life Safety” which relates to fire safety. Insurance
company refers to this code for setting of premiums.
2. The UBBL (Uniform Building By Law) is a building design code which is mandatory
in Malaysia. It prescribed life safety which includes structure, fire safety, ventilation
and lighting.
3. The MS1515 (Malaysian Standards) and ASHRAE90.2 (American Society of
Heating, Refrigeration and Airconditioning Engineers) are two technical standards
for energy efficient buildings.
4. NABERS (National Australian Built Environment Rating System) rate building for
environmental sustainability and developed and supported by the Australian
government.
5. ASHRAE 189 is a technical standards for high performance buildings which include
multi-criteria for environmental benchmarks.

43
© I r H . P . L o o i ( h i p p e u l o o i @ g m a i l . c o m ) 2 5 F e b 2 0 1 6
The Non-Residential Sector

44
© I r H . P . L o o i ( h i p p e u l o o i @ g m a i l . c o m ) 2 5 F e b 2 0 1 6
Commercial Sector Energy Benchmark
90 – 140kWh/m²
> 200kWh/m²
160 –200kWh/m²
< 100kWh/m²
140 – 200kWh/m²
Office Building

45
© I r H . P . L o o i ( h i p p e u l o o i @ g m a i l . c o m ) 2 5 F e b 2 0 1 6
Commercial Sector Energy Benchmark
Office Building
Study by Dr Lee (NUS); most building average 220 – 300kWh/m² (2003)
In 2009 GreenMark became mandatory. BEI for GreenMark certified would be at least
150kWh/m²

46
© I r H . P . L o o i ( h i p p e u l o o i @ g m a i l . c o m ) 2 5 F e b 2 0 1 6
Commercial Sector Energy Benchmark
For Commercial Buildings the following benchmarks by GBI &
JKR-BSEEP:
Leve
ls Office BEI per year
Hotel / Resort, BEI
per year
Retail Malls BEI/
year
Health care BEI/year
Industrial Building BEI/year
Data Centre (PUE)
1 150kWh/m² 200kWh/m² 240kWh/m² 200kWh/m² 180kWh/m² 1.9
2 140kWh/m² 190kWh/m² 225kWh/m² 190kWh/m² 150kWh/m² 1.8
3 130kWh/m² 175kWh/m² 210kWh/m² 175kWh/m² 140kWh/m² 1.7
4 120kWh/m² 160kWh/m² 195kWh/m² 160kWh/m² 130kWh/m² 1.6
5 110kWh/m² 150kWh/m² 180kWh/m² 150kWh/m² 120kWh/m² 1.5
6 100kWh/m² 135kWh/m² 160kWh/m² 135kWh/m² 110kWh/m² 1.4
7 90kWh/m² 120kWh/m² 145kWh/m² 120kWh/m² 100kWh/m² 1.3
8 - - - - 90kWh/m²
Low Energy Building (LEO) is any building performance, level 6
and below!

47
© I r H . P . L o o i ( h i p p e u l o o i @ g m a i l . c o m ) 2 5 F e b 2 0 1 6
The Non-Residential Sector
Case Study: Find the component of
building energy attributed to building
envelope.
Model Case

48 The Non-Residential Sector
Building thermal envelope contributes up to 15% of
building cooling energy which make up about 50% of
total building energy.

© I r H . P . L o o i ( h i p p e u l o o i @ g m a i l . c o m ) 2 5 F e b 2 0 1 6

50
© I r H . P . L o o i ( h i p p e u l o o i @ g m a i l . c o m ) 2 5 F e b 2 0 1 6
E.E. Technologies Synopsis
E . E . m e a s u r e s f o r t h e b u i l d i n g s e c t o r c a n b e u n d e r s t o o d b y
t h e t e c h n o l o g i e s a n d m e t h o d w h i c h c a n b e d e p l o y e d . T h e K e y
t o e f f e c t i v e E . E . m e a s u r e i s t o m a t c h a p p r o p r i a t e t e c h n o l o g y
t o c o n d i t i o n s a n d f i n a n c i a l c o n s i d e r a t i o n s ( R o I ) .
I d e n t i f y i n g E . E . Te c h n o l o g i e s f o r t h e b u i l d i n g s e c t o r i s
p r e s e n t e d w i t h t h e f o l l o w i n g t o p i c a l d i s c u s s i o n s :
1. Understanding Concepts
4. Active Design; Air Conditioning
2. Design Approach to Building E.E. – Passive and Active Design
3. Passive Design; Building Envelope

51
© I r H . P . L o o i ( h i p p e u l o o i @ g m a i l . c o m ) 2 5 F e b 2 0 1 6
Concept – Understanding Site Source
“Secondary energy is energy embodied in commodities that
comes from human induced energy transformation”
“Primary energy is energy embodied in sources which
involve human induced extraction or capture, that may
include separation from contiguous material, cleaning or
grading, to make the energy available for trade, use or
transformation”

52
© I r H . P . L o o i ( h i p p e u l o o i @ g m a i l . c o m ) 2 5 F e b 2 0 1 6
UNDP Definition – Primary/Secondary
53
© I r H . P . L o o i ( h i p p e u l o o i @ g m a i l . c o m ) 2 5 F e b 2 0 1 6
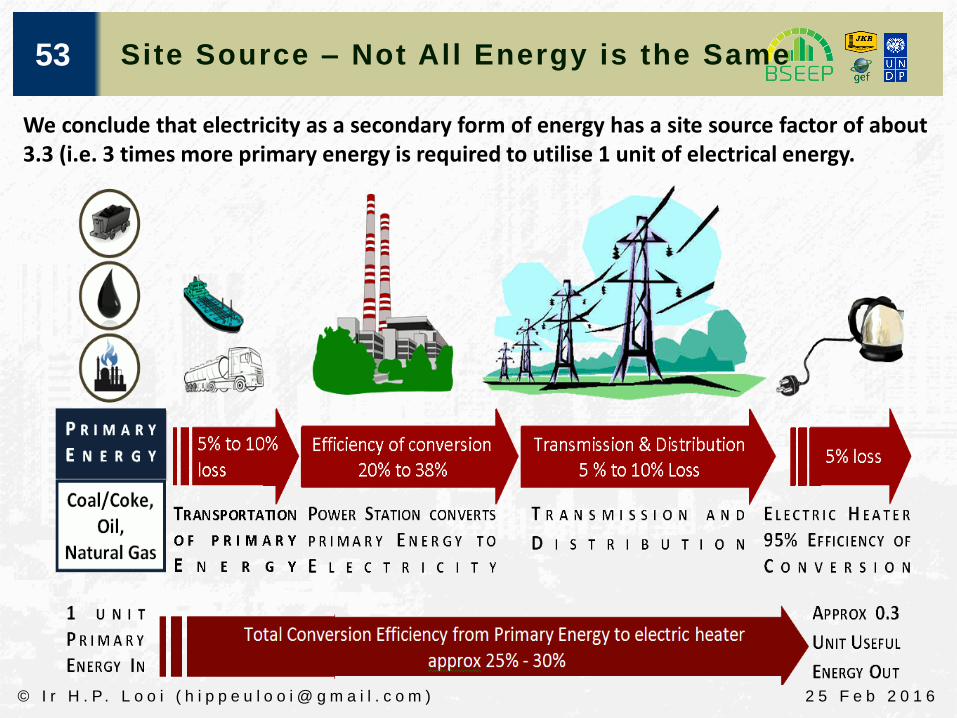
Site Source – Not All Energy is the Same
We conclude that electricity as a secondary form of energy has a site source factor of about3.3 (i.e. 3 times more primary energy is required to utilise 1 unit of electrical energy.

54 Site Source – Not All Energy is the Same
We can conclude that, the use of primary energy at final consumer-end is more
efficient than the use of secondary-electrical energy. In this example, a clear
advantage of at least 2 times higher efficiency using gas-ring as compared to an
electric water heater. It should be noted that a ‘closed-type’ gas-heater has efficiency
as high as 90%. In such case, the site-source efficiency of enclosed-type gas heater
will be at least 3 times that of electric heater.

55 Site Source – Not All Energy is the Same

56
© I r H . P . L o o i ( h i p p e u l o o i @ g m a i l . c o m ) 2 5 F e b 2 0 1 6
Space Cooling – District Cooling
Conventional space cooling every building
within a district has its own space cooling
plant. The CoP of each individual plant ranges
from CoP 2 to 6 (smaller plants have lower
CoP). Additionally individual plant may not
be able to deal with part loads inherent in
the operation of each building. This will
further degrade the apparent CoP of
individual plants. The aggregated CoP of a
district may be estimated at say 4.0.
I unit primary energy provides approx. 1.2 units cooling energy

57
© I r H . P . L o o i ( h i p p e u l o o i @ g m a i l . c o m ) 2 5 F e b 2 0 1 6
Space Cooling – District Cooling
I unit primary energy provides approx. 3.2 units cooling energy
District Cooling Plant with Natural Gas as Primary Energy Source

58
© I r H . P . L o o i ( h i p p e u l o o i @ g m a i l . c o m ) 2 5 F e b 2 0 1 6
Space Cooling – District Cooling
I unit primary energy provides approx. 2.8 units cooling energy
DC Plant with
Electricity
Generation and
Gas Engines

59
© I r H . P . L o o i ( h i p p e u l o o i @ g m a i l . c o m ) 2 5 F e b 2 0 1 6
Space Cooling – District Cooling
Energy balance of gas
engine (typical), with 100%
energy input

60
© I r H . P . L o o i ( h i p p e u l o o i @ g m a i l . c o m ) 2 5 F e b 2 0 1 6
Energy Convertors / Pumps
Energy
Conversion
DeviceEnergy
Input
Useful
Energy
Output
Energy convertors converts energy from one form to another form. The input formmay be either primary or secondary energy source e.g. coal, natural gas, petroleum,electricity etc.; while the useful energy output include (examples) kinetic, shaft ormechanical energy, thermal (heat or cold) energy, or secondary energy such aselectricity.
Concomitant to the energy convertor is the efficiency of conversion defined as:
Efficiency of Conversion; Ƞ =𝑼𝒔𝒆𝒇𝒖𝒍 𝑬𝒏𝒆𝒓𝒈𝒚 𝑶𝒖𝒑𝒖𝒕
𝑬𝒏𝒆𝒓𝒈𝒚 𝑰𝒏𝒑𝒖𝒕
Ƞ is less than 100% or 1 and the differences can be attributed to losses such as friction,inefficiencies in fuel conversion, exhaust gas, system cooling etc.

61
© I r H . P . L o o i ( h i p p e u l o o i @ g m a i l . c o m ) 2 5 F e b 2 0 1 6
Energy Convertors – Common Eff.

62
© I r H . P . L o o i ( h i p p e u l o o i @ g m a i l . c o m ) 2 5 F e b 2 0 1 6
Energy Plants
System Range CHPElectricalefficiency
TypicalOverallEfficiency
Power-to-Heat Ratio
Advantages Disadvantages
Steam turbine
0.4-300 MWe
10-45% < 80% 0.15-0.75 Fuel flexibility Moderate electrical efficiency
Gas turbine 0.5-300 MWe
25-40% < 65-90% 0.45-0.75 Low investment cost
Low part load electrical efficiency
Combined cycle
10-300 Mwe
35-50% 75-90% 0.75-1.7 High electrical efficiency
Not economic for small scale
Internal Combustion Engine
1kWe-15 Mwe
25-45% 65-85% 0.5-1.8 High overall efficiency
Low temperature heat supply
Steam engine
20kWe-2 Mwe
5-25% 70-80% 0.1-0.45 Good partial load performance
Low electrical efficiency
Micro turbine
25-200 kWe
25-30% 50-80% 0.55-0.75 Low maintenance costs, Low noise
Not fully mature technology

63
© I r H . P . L o o i ( h i p p e u l o o i @ g m a i l . c o m ) 2 5 F e b 2 0 1 6
Energy Convertors / Pumps
Thermal pumps move thermal energy from one source to another location. A
good illustration is the Peltier heat pump. In the reverse ‘Seeback effect’, a
voltage difference will cause a cold and hot difference at both junctions. This
effectively “pumps” heat from one end to the other. In contrast an electric
heater is an energy convertor. More conventional heat pumps are chillers in
space cooling.
In the case of thermal pumps, efficiency is defined by the Coefficient of
Performance (CoP).
(𝑪𝒐𝑷) =𝑻𝒉𝒆𝒓𝒎𝒂𝒍 𝑬𝒏𝒆𝒓𝒈𝒚 𝑫𝒆𝒍𝒊𝒗𝒆𝒓𝒆𝒅
𝑬𝒏𝒆𝒓𝒈𝒚 𝑰𝒏𝒑𝒖𝒕CoP may be more than 1 and represent the thermal energy (heat or cold)
which can be pumped with the input of 1 unit of energy.
Thermal PumpThermal
Energy
Source
Thermal
Energy
DeliveredEnergy Input

64
© I r H . P . L o o i ( h i p p e u l o o i @ g m a i l . c o m ) 2 5 F e b 2 0 1 6
Concept – Pump & Convertor ?
PUMP COMPARED TO ENERGY CONVERTORS
Kinetic Energy
Convertor e.g. motor
Water at lower level
Water
Prime Driver
1 unit of energy input
Amount of water being pumped through
Pumps does not ‘create’ or
convert Energy. It merely move
‘fluid’ from 1

65
© I r H . P . L o o i ( h i p p e u l o o i @ g m a i l . c o m ) 2 5 F e b 2 0 1 6
Concept – Pump & Convertor ?
Kinetic Energy
Convertor e.g.
motor
Heat OR Cold Rotary Chiller
Heat Or Cold
Prime Driver
1 unit of energy input
3 to 6 units of thermal energy transferred
CoP = 6 means 1
unit of energy input pumps 6 units of thermal energy
HEAT PUMP – CONVENTIONAL COMPRESSION/EXPANSION

66
© I r H . P . L o o i ( h i p p e u l o o i @ g m a i l . c o m ) 2 5 F e b 2 0 1 6
Concept – Pump & Convertor ?
ADSORPTION/ ABSORBTION CHILLERS
Heat
Cold Ab. Chillers “Cold”
Prime Driver
1 unit of energy input
1 unit of prime energy input
can transfer less than 0.5 to
3 units of thermal energy.
CoP = 6 means 1
unit of energy input pumps 6 units of thermal energy
67
© I r H . P . L o o i ( h i p p e u l o o i @ g m a i l . c o m ) 2 5 F e b 2 0 1 6
Absorption Chiller
CoP >> 1 to 3

68
© I r H . P . L o o i ( h i p p e u l o o i @ g m a i l . c o m ) 2 5 F e b 2 0 1 6
Adsorption Chiller
CoP >> 0.5 to 1.2

69
© I r H . P . L o o i ( h i p p e u l o o i @ g m a i l . c o m ) 2 5 F e b 2 0 1 6
MS 1525 – Min CoP of Unitary Air Cond

70
© I r H . P . L o o i ( h i p p e u l o o i @ g m a i l . c o m ) 2 5 F e b 2 0 1 6
MS 1525 – Min CoP of Unitary Air Cond

71
© I r H . P . L o o i ( h i p p e u l o o i @ g m a i l . c o m ) 2 5 F e b 2 0 1 6
Chiller Technology – Magnetic Bearings

72
© I r H . P . L o o i ( h i p p e u l o o i @ g m a i l . c o m ) 2 5 F e b 2 0 1 6
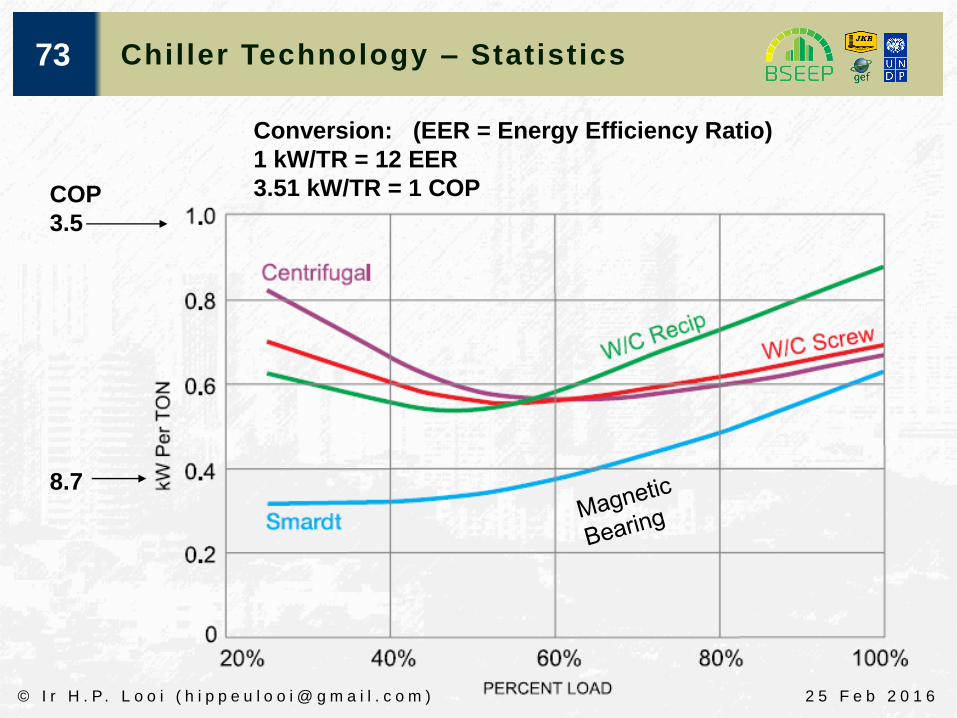
Chiller Technology – Statistics
73
© I r H . P . L o o i ( h i p p e u l o o i @ g m a i l . c o m ) 2 5 F e b 2 0 1 6
Chiller Technology – Statistics
Conversion: (EER = Energy Efficiency Ratio)
1 kW/TR = 12 EER
3.51 kW/TR = 1 COPCOP
3.5
8.7

74
© I r H . P . L o o i ( h i p p e u l o o i @ g m a i l . c o m ) 2 5 F e b 2 0 1 6
Design Concepts
Passive design are features which
are intrinsic (or part of ) the building
form which contributes to good
environmental qualities such as
providing shelter or insulation
against the hot tropical sun or its
layout is such that it ensures quality
environment for occupant.
Active design features are M&E
systems which actively ‘intervene’
to ensure good or adequate
environmental qualities in a
building. Active measures include
lifts, air conditioning, mechanical
ventilation , artificial lighting etc.

75
© I r H . P . L o o i ( h i p p e u l o o i @ g m a i l . c o m ) 2 5 F e b 2 0 1 6
Design Concepts; Passive Design
Up to 50% of electrical energy is used for Cooling. Cooling energy is verymuch a component of Building Form. The following approaches to designingfor thermal comfort are adopted / available:
Building Thermal Envelope (OTTV & RTTV).
Calculating Cooling Load for Residential Space
Passive Design for Thermal Comfort (Cool House)
Thermal Mass
Natural Ventilations

76
© I r H . P . L o o i ( h i p p e u l o o i @ g m a i l . c o m ) 2 5 F e b 2 0 1 6
Chiller Technology – Statistics
Design Approach Issues Addressed Technical Standards
Building Thermal
Envelope (OTTV and
RTTV)
(i) Reducing cooling load for
‘active’ air cond. (static load)
(1)ASHRAE fundamentals, chapter 17 and 18.
(2)MS1525
(ii)Thermal comfort (1)ASHRAE 55;
(2)ISO 7730
Cooling Load
Calculation
(i) Cooling load for ‘active’ air
conditioning units (static and
dynamic load)
(1)ASHRAE fundamentals, chapter 17 and 18
(2)MS1525
(3)ISO 13786
Building Thermal
Mass
(i) Reducing cooling load for
‘active’ air conditioning
(dynamic cooling load).
(1)ASHRAE fundamentals, chapter 17 and 18
(2)MS1525
(3)ISO 13786
(ii)Thermal comfort (1)ASHRAE 55;
(2)ISO 7730
Natural Ventilation (i) ‘Natural’ thermal comfort (1)ASHRAE 55;
(2)ISO 7730
(3)UBBL by-law 39 and 40
Day Lighting (i) Day lighting (1)MS 1525
(2)UBBL by-law 39
Table 8 – Summary of Passive Design and Technical Standards for Residential Buildings

77
© I r H . P . L o o i ( h i p p e u l o o i @ g m a i l . c o m ) 2 5 F e b 2 0 1 6
Building Envelope
OTTV= 𝟏 −𝑾𝑾𝑹 𝒙𝑼𝑾𝒙𝑻𝑫𝒆𝒒 +𝑾𝑾𝑹𝒙𝑼𝒇𝒙𝜟𝑻 +𝑾𝑾𝑹𝒙𝑺𝑪𝒙𝑺𝑭

78
© I r H . P . L o o i ( h i p p e u l o o i @ g m a i l . c o m ) 2 5 F e b 2 0 1 6
Building Envelope
Heat Conduction Through Walls;
15 α (1-WWR)Uw
Heat Conduction Through Windows
6(WWR)Uf
Solar Heat Gain Through Windows;194xOFxWWRxSC
OTTVi = 15 α(1-WWR)Uw + 6(WWR)Uf + 194xOFxWWRxSC
α = Solar Absorptivity (Colour of Wall)WWR=Window to Wall RatioUw = Heat transmission value of wall W/m² oKUf = Heat transmission value of glazing W/m² oKOF = Correction factor for solar orientationSC = Solar Coefficient for glazing.

79
© I r H . P . L o o i ( h i p p e u l o o i @ g m a i l . c o m ) 2 5 F e b 2 0 1 6
Building Envelope
Building Thermal Envelope (OTTV)
Roof Thermal Envelope (RTTV)
OTTV and RTTV provide an index of TOTAL external energy infiltration into internal
building space via the building envelope.

80
© I r H . P . L o o i ( h i p p e u l o o i @ g m a i l . c o m ) 2 5 F e b 2 0 1 6
Building Envelope
Heat Conduction
Through Walls;15 α (1-WWR)Uw
Heat Conduction Through Wall
Colour of Wall Alpha Value
Black Paint 0.90 – 0.99
White Paint 0.15 – 0.30
Aluminium Oxide Paint 0.09
Red Roof TIles 0.4 – 0.8
Wall Construction Typical U values
Cement Sand Bricks > 3.0 W/m² oK
115 clay bricks with 15mm plaster both sides
> 2.6-2.8 W/m² oK
100 Aerated Lightweight bricks < 1.00 W/m² oK

81
© I r H . P . L o o i ( h i p p e u l o o i @ g m a i l . c o m ) 2 5 F e b 2 0 1 6
Building Envelope
Heat Conduction
Through Walls;15 α (1-WWR)Uw
200mm Brick Wall

82
© I r H . P . L o o i ( h i p p e u l o o i @ g m a i l . c o m ) 2 5 F e b 2 0 1 6
Building Envelope
Heat Conduction
Through Walls;15 α (1-WWR)Uw
150mm Brick Wall

83
© I r H . P . L o o i ( h i p p e u l o o i @ g m a i l . c o m ) 2 5 F e b 2 0 1 6
Building Envelope
Heat Conduction
Through Windows
6(WWR)Uf
Glazing Type Typical U values Indicative Cost RM / ft²
Single Glazed 5.7 W/m² oK 4.5 – 5.5
Single Glazed Low-e 4.2 W/m² oK 11 – 12
Double Glazed 2.6-2.9 W/m² oK 15 – 20
Double Glazed Low-e 1.2 30 - 45

84
© I r H . P . L o o i ( h i p p e u l o o i @ g m a i l . c o m ) 2 5 F e b 2 0 1 6
Building Envelope
WHAT IS THE HEAT GAIN THROUGH THE BUILDING FABRIC,
CAPITAL COST IMPACT AND IMPACT ON BUILDING ENERGY ?

85
© I r H . P . L o o i ( h i p p e u l o o i @ g m a i l . c o m ) 2 5 F e b 2 0 1 6
Building Envelope
0 W
1,000 W
2,000 W
3,000 W
4,000 W
5,000 W
6,000 W
7,000 W
Walls Glazing Roof
Insulation inRoof Ceiling
© BSEEP October 2015
0 W
1,000 W
2,000 W
3,000 W
4,000 W
5,000 W
6,000 W
7,000 W
Walls Glazing Roof
Insulation inRoof Ceil ing
© BSEEP October 2015
Single Storey TerraceCorner Intermediate
Double Storey TerraceCorner Intermediate

© I r H . P . L o o i ( h i p p e u l o o i @ g m a i l . c o m ) 2 5 F e b 2 0 1 6
Preliminary
AssessmentWalk Through
SurveyEnergy Audit
(Grade 3)
Appoint
Contractor
Investment
Grade Audit

© I r H . P . L o o i ( h i p p e u l o o i @ g m a i l . c o m ) 2 5 F e b 2 0 1 6
87 Approach to Energy Planning

© I r H . P . L o o i ( h i p p e u l o o i @ g m a i l . c o m ) 2 5 F e b 2 0 1 6
88 Approach to Energy Planning

© I r H . P . L o o i ( h i p p e u l o o i @ g m a i l . c o m ) 2 5 F e b 2 0 1 6
89 Approach to Energy Planning

© I r H . P . L o o i ( h i p p e u l o o i @ g m a i l . c o m ) 2 5 F e b 2 0 1 6
90 Approach to Energy Planning
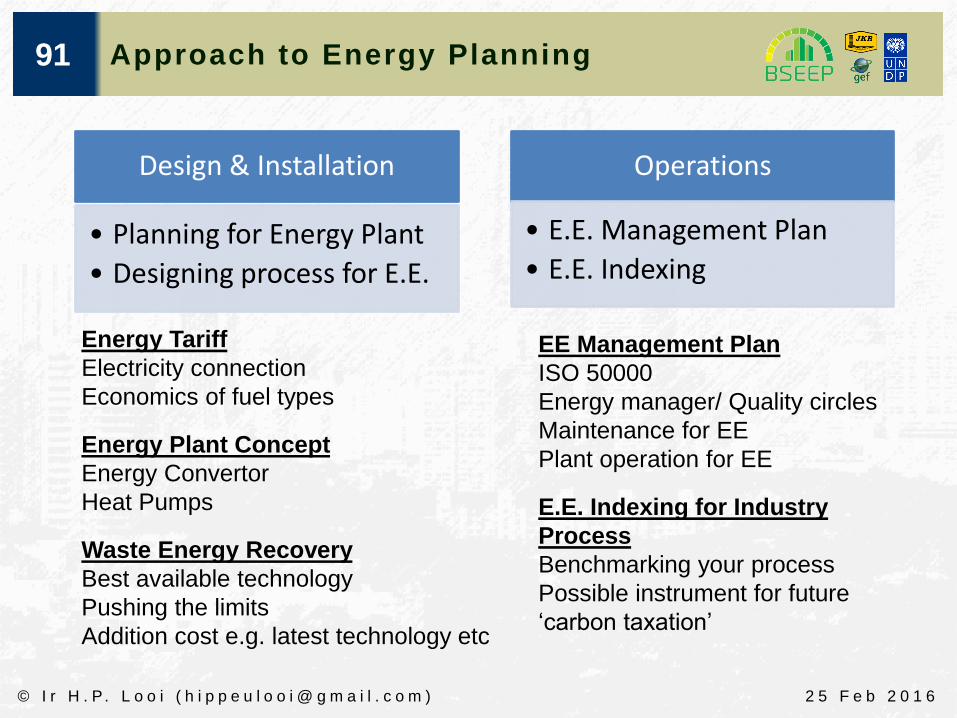
91
© I r H . P . L o o i ( h i p p e u l o o i @ g m a i l . c o m ) 2 5 F e b 2 0 1 6
Approach to Energy Planning
Design & Installation
• Planning for Energy Plant
• Designing process for E.E.
Operations
• E.E. Management Plan
• E.E. Indexing
Energy Tariff
Electricity connection
Economics of fuel types
Energy Plant Concept
Energy Convertor
Heat Pumps
Waste Energy Recovery
Best available technology
Pushing the limits
Addition cost e.g. latest technology etc
EE Management Plan
ISO 50000
Energy manager/ Quality circles
Maintenance for EE
Plant operation for EE
E.E. Indexing for Industry
Process
Benchmarking your process
Possible instrument for future
‘carbon taxation’

92
© I r H . P . L o o i ( h i p p e u l o o i @ g m a i l . c o m ) 2 5 F e b 2 0 1 6
Approach to Energy Planning
Non Renewable
• Natural Gas
• LPG
• Medium Oil
• Bunker Oil
Renewable
• Biomass
• Biogas
• Waste
• Solar
Electricity
• Capacity
• Profile
Thermal
• Capacity
• Profile (heat/cold)
Identify Primary Fuel Source Identify Energy Needs
Energy Convertor
Engine-Alternator
Boilers
Turbine-alternator
Heat Pumps
Conventional electric chillers
Adsorption Chillers
Absorption Chillers
Waste Energy Recovery
Waste Biomass – boilers/furnace
Heat Exchanger
Plant Process
Thermal – hot/cold needs
Electricity needs

93
© I r H . P . L o o i ( h i p p e u l o o i @ g m a i l . c o m ) 2 5 F e b 2 0 1 6
Approach to Energy Planning
Energy tariff (principally electricity) is the first step in planning for the main
energy plant. An assessment of prime energy source for each type of plant is
required to confirm the concept for energy plant to be adopted.
1. Electrical Substations
2. District Cooling Plants
3. Co-Generation Plant
ENERGY TARIFF

94
© I r H . P . L o o i ( h i p p e u l o o i @ g m a i l . c o m ) 2 5 F e b 2 0 1 6
Example Audit Result

95
© I r H . P . L o o i ( h i p p e u l o o i @ g m a i l . c o m ) 2 5 F e b 2 0 1 6
Daily Load Profile Example

96
© I r H . P . L o o i ( h i p p e u l o o i @ g m a i l . c o m ) 2 5 F e b 2 0 1 6
Daily Load Profile Example

97
© I r H . P . L o o i ( h i p p e u l o o i @ g m a i l . c o m ) 2 5 F e b 2 0 1 6
Approach to Energy Planning
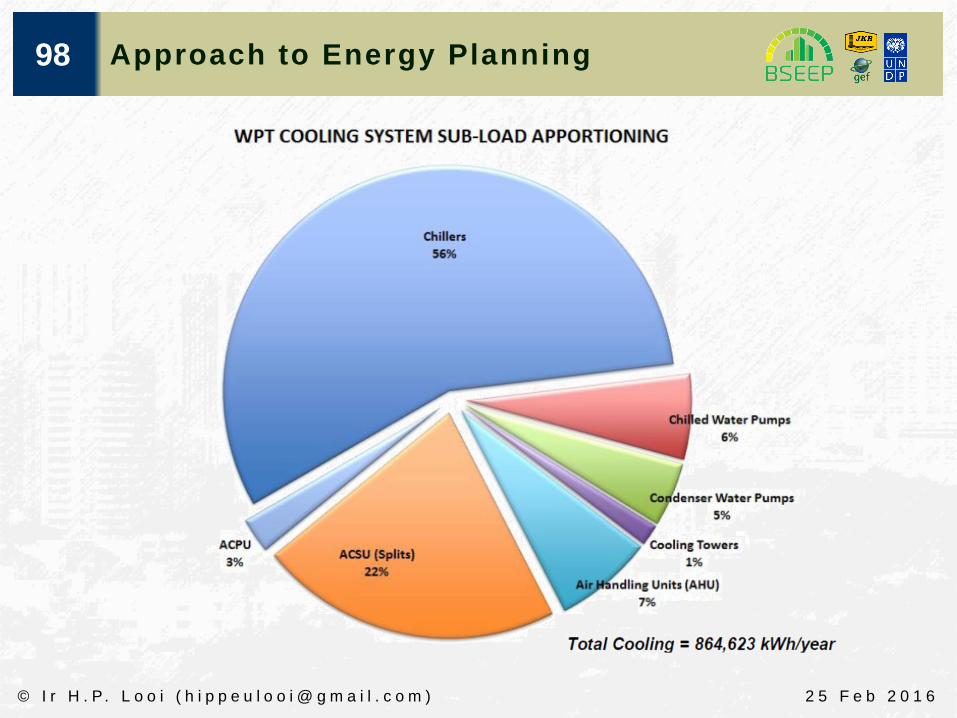
98
© I r H . P . L o o i ( h i p p e u l o o i @ g m a i l . c o m ) 2 5 F e b 2 0 1 6
Approach to Energy Planning

99
© I r H . P . L o o i ( h i p p e u l o o i @ g m a i l . c o m ) 2 5 F e b 2 0 1 6
Simple Rule of Thumb Estimate
Simple rule of thumb estimate make use of expert knowledge.
1. It should ONLY be done by an expert (with the knowledge)
2. Due to experience, rule of thumb figures are useful to make quick
estimate
3. Quick estimate may be a starting point to decide whether to proceed
with more substantial measure e.g. walk through audit OR grade 3
audit
(a) Start by collecting electricity bill.
(b) Find out GFA of building.
(c) Translate to kW/m² - A quick idea can be form regarding the GAP
which EE measure can done.
(d) Have an idea of kWh benchmark.
(e) Rule of thumb : Air Cond takes up 50% and Lighting 20% - 25%
(f) Air Cond Chiller CoP can be inferred (roughly). Chiller takes up 50%
of energy
(g) Have some idea of rule of thumb cost e.g. RM2K/Tr for chiller etc.

100
© I r H . P . L o o i ( h i p p e u l o o i @ g m a i l . c o m ) 2 5 F e b 2 0 1 6
Example 1
Replace the existing air cooled chilled water system to a centralized central chilled
water system.
Baseline cost = RM 1,417,500; Upgrade cost = RM 2,205,000.00
Incremental cost = RM 787,500,.00
For abatement of 1,000,000kWh/year or 741,000kg CO2/year.
Capex incremental achievement @ 1.27kWh/year OR 0.94kgCO2/year

101
© I r H . P . L o o i ( h i p p e u l o o i @ g m a i l . c o m ) 2 5 F e b 2 0 1 6
Example 2
OPTIMAL REPLACEMENT OF AC UNIT
An existing commercial tower located in the heart of KL.
Air-conditioning accounts for 65% of total energy use (the norm should be 50% or
less – this means this is a very inefficient building energy wise).
The building has 90 units of 10HP air cooled packaged air cond units (ACPU).
Study finds an OVERPRIVION of capacity.
Solution replace ALL 90 units of 10HP ACPU with 90 units of 7.5HP compressors
Investment cost = RM 540,000,.00
For abatement of 330,000kWh/year or 244,000kg CO2/year.
Capex incremental achievement @ 0.61 kWh/year OR 0.45 kgCO2/year

102
© I r H . P . L o o i ( h i p p e u l o o i @ g m a i l . c o m ) 2 5 F e b 2 0 1 6
Example 3 – Shop Lot Office
Replace (about) 12 split units with multi-split Variable Refrigeration Volume (VRV) system – decrease in kWh by 40%.

103
© I r H . P . L o o i ( h i p p e u l o o i @ g m a i l . c o m ) 2 5 F e b 2 0 1 6
Preliminary Results BSEEP