building lasting impact
TRANSCRIPT

Annual Report 2017
Building lasting impact
World Vision Australia ABN 28 004 778 081 1 Vision Drive Burwood East Victoria 3151
Incorporation and charitable statusPublic company limited by guarantee under the Corporations Act from 19 June 1960. Members are our current directors.
Registered charity with the Australian Charities and Not-for-Profits Commission from 3 December 2012.
Tax concessions and fundraisingPublic Benevolent Institution (PBI) and endorsed by the Australian Taxation Office as:• a Deductible Gift Recipient (DGR); and• an income tax exempt charity (holding tax concessions and
exemptions relating to income, goods and services, and fringe benefits taxes).
Operates an Overseas Aid Fund and a Necessitous Persons Fund, endorsed as DGRs.
Fundraises throughout Australia and registered under fundraising legislation as required:NSW Registration no. 13579 QLD Registration no. CH0675SA Licence no. CCP2438 TAS Registration no. 1 VIC Registration no. 10214.15 WA Licence no. CC18076
AccreditationsFully accredited by the Australian Government through its Department of Foreign Affairs and Trade. The accreditation process provides the Australian Government and the Australian public with confidence that they are funding a professional, well-managed, community-based organisation capable of delivering good development outcomes.
Member of the Australian Council for International Development (ACFID) and adherent to the ACFID Code of Conduct. The code defines minimum standards of governance, management and accountability for non-government organisations. It aims to improve international development outcomes and increase stakeholder trust by enhancing transparency and accountability of signatory organisations.
Feedback and complaintsFeedback on this report and on our operations and conduct more generally can be sent to [email protected] or in writing to:
Supporter Services 1 Vision Drive Burwood East Vic 3151
We will acknowledge feedback and give a response.
Complaints relating to a breach of the ACFID Code of Conduct can be made to the ACFID Code of Conduct Committee.
About this Annual ReportThis Annual Report covers our activities and performance for the period 1 October 2016 to 30 September 2017 − our financial year.
It is one of the ways we seek to satisfy our accountability obligations to all our stakeholders, including our partners and supporters. We believe accountability is crucial for our sustainability and therefore our ability to fulfil our mission. By holding ourselves accountable, we demonstrate that we are worthy of the trust our stakeholders place in us.
We have prepared this Annual Report to respond to specific legal requirements and the ACFID Code of Conduct. We encourage you to read this Annual Report together with the most recent Accountability Report of the World Vision International Partnership. This addresses the mechanisms and processes that the Partnership − of which we are a part − has in place to assure quality improvement and ensure integrity. It also addresses the challenges the Partnership faces as a whole.
This report covers activities we (World Vision Australia) have undertaken or supported. Where we have undertaken or supported an activity with other World Vision offices we describe them as “World Vision” activities.
World Vision Australia 02
Annual Report 2017 Building lasting impact
Click to read more when you see this icon.
Contents
Vision 04
Our Chair and CEO 05
Our organisation, values and mission 06
Strategy 07
Strategy House 08
How we performed to our strategy in 2017 09
Collaboration 010
Working and funding through the World Vision International Partnership 011
Our evaluation approach 012
Our global footprint 013
Impact 014
Health 015
Water 015
Livelihoods 015
Emergencies 016
Child protection 016
Education 016
Leadership 017
Our Board 018
Governance and management 019
Corporate governance 020
Risk management 021
Our people 022
Environmental management 023
Progress 024
Financial position and performance 025
Our revenue in FY17 026
Disbursements – How funds were used in FY17 027
Summarised financial report 031
Independent Auditor’s report 032
Income Statement 035
Statement of Financial Position 036
Statement of Changes in Equity 037
World Vision Australia 03
Annual Report 2017 Contents

Vision
It inspires everything we do. Our vision for life in all its fullness. For children like 17-month-old Beauty in Zambia. And for every child, everywhere we work.

In my first year as CEO, I’ve seen firsthand – in visits to the Kimberley, Sri Lanka, Kenya and Myanmar – the hope our work brings. In Uganda, I’ve watched with pride as staff, often living in tents, away from their families, bring life-saving relief for South Sudanese women and children fleeing violence.
We are making real progress, bringing hope around the globe. World Vision reaches a new person with clean water every 10 seconds. World Vision Australia is working hard to maximise our impact, reducing administration costs while growing our grants and philanthropy channels so over 80 percent of your funds go to the field. Over the past four years we’ve reached 100.5 million children with life-saving health, education and protection measures.
Technology is transforming our industry in exciting ways, bringing supporters closer than ever to our work. We’re implementing virtual reality, Facebook Live broadcasts from some of the world’s most fragile contexts, and a new tap and donate tool.
It’s been a delight to lead World Vision Australia. We’ve recruited talent in marketing, technology, communications, supporter experience and private funding. Staff engagement has lifted from 61 percent to 69 percent.
We continue to benefit from the strong public voice of Tim Costello, now Chief Advocate. This year we advocated for refugees displaced by the Myanmar-Bangladesh crisis and the millions in need in East Africa. We brought attention to the UNHCR report that revealed Australia slipped to 59th place in our refugee intake worldwide. And we launched the global campaign “It takes a world to end violence against children”.
It’s been an amazing year. We could not have achieved all this and more without our supporters. You are the fuel for our mission and we’re so excited that you’re committed to being change makers with us. From my heart, I thank you.
Our Chair and CEO
George SavvidesChair
Claire RogersChief Executive Officer
This is my final message as Board Chair and I leave with a tremendous sense of confidence and optimism for World Vision Australia. After serving on the Board between 1997 and 2010, I returned as Board Chair in 2012. Since then, I’ve seen World Vision’s leaders adapting to the changing challenges of our humanitarian work.
Grant income has grown, with more funds from institutions, corporates and philanthropists than ever before. Meeting their expectations has required us to adjust how we operate, as well as overlay grant programs onto existing field work.
We’ve seen an increase in humanitarian emergencies. Meeting the needs of displaced persons is a vast, ongoing challenge. Increasing fragility requires different funding and operating models to address complex situations as they evolve.
Child sponsorship remains core to who we are. We launched our new Community Sponsorship product this year, providing supporters with the opportunity to engage with entire communities and not just individual children.
I’d like to thank all my colleagues on our Board for their passionate commitment. I’m delighted fellow Board member Shannon Adams will succeed me as Chair in February. I’d like to thank Colin Carter, Rob Goudswaard and Jude Barraclough, who retired this year, for their wisdom and experience. We welcome Jon Seeley and Gordon Allison.
As Chair, I want to acknowledge Tim Costello’s profound contribution as CEO over 13 years. I also wish to congratulate our new CEO, Claire Rogers, on completing a most successful first year. Among many achievements, she has led the team to attain an excellent financial and operational scorecard against the goals set by the Board. Finally, I would like to thank our supporters for their continued commitment to delivering our vision: life in all its fullness for every child.
World Vision Australia 05
Annual Report 2017 Vision / Our Chair and CEO

We are committed to the poor
We value people
We are stewards
We are partners
We are responsive
We are Christian
Engaging Australia
We seek to inform Australians about the causes of poverty and
challenge them to be involved in its alleviation, including making financial
and non-financial contributions to our work. We also strive to
demonstrate God’s love in action for the world’s most vulnerable and
encourage people to respond.
Community development
We work within communities and across geographical areas to help
individuals and groups improve the wellbeing of children and overcome poverty. We do this through long-
term projects aimed at empowering communities to sustainably manage
their own development.
Tackling injustice through policy change and advocacy
We engage governments, institutions, donors, communities and the public
to address the underlying issues that perpetuate poverty. We aim to
empower communities to speak up for their rights and influence change, both
locally and globally.
Humanitarian and emergency relief
We have staff and supplies for food, clean water, shelter and Child Friendly Spaces positioned around the globe to respond to immediate needs. We
also work with communities to recover from disasters and reduce the impacts of future events through planning and
capacity building.
Our core values
Our vision
Our core values emphasise our commitment to
Jesus Christ and the poor.
We try to honour and reflect them
consistently through our attitudes,
decisions, actions and relationships.
Our vision for every child, life in all its
fullness;
Our prayer for every heart, the will to make
it so.
Our organisation, values and mission
World Vision Australia is an organisation incorporated in Australia. We are one of many World Vision offices, which, through a Covenant of Partnership, together form the World Vision International Partnership, which collectively operates in more than 90 countries. In this sense, we are a “twin citizen”, operating in Australia but also with international obligations. As a whole, the Partnership is one of the world’s largest non-governmental humanitarian and development agencies. All offices in the Partnership are signatories to the Covenant of Partnership.
As a Christian organisation, our mission is to attract and engage supporters to eliminate poverty and its causes among the children and communities we serve around the world.
Our Christian faith is the foundation for all we do and we strive to follow the teachings of Jesus Christ. We are committed to the poor because we are Christian. We seek to express our Christian beliefs in an inclusive and non-judgemental manner and we are committed to working with people of all cultures, faiths and genders to achieve transformation.
06
Annual Report 2017
World Vision Australia
Vision / Our organisation, values and mission

Strategy
Clear direction helps us navigate change and work towards lasting impact. Riding four kilometres to school, these children in Cambodia are on the way to achieving their goals.
World Vision Australia 08
Annual Report 2017 Strategy / Strategy House
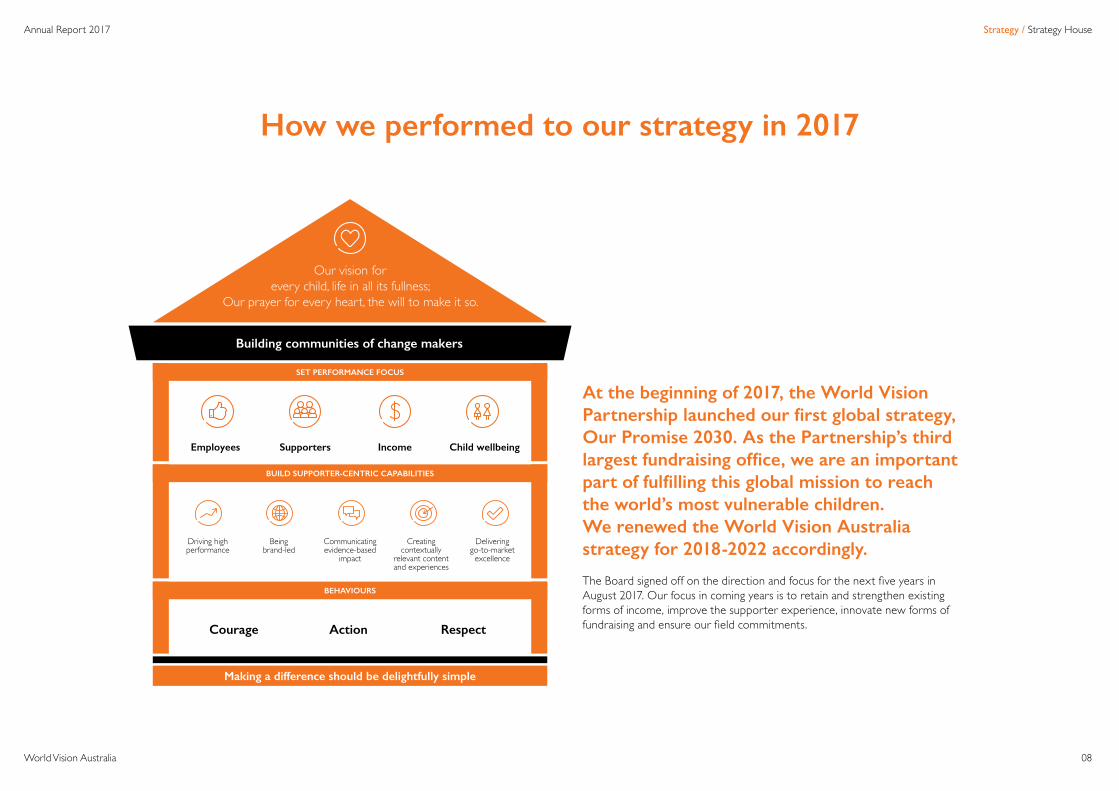
How we performed to our strategy in 2017
At the beginning of 2017, the World Vision Partnership launched our first global strategy, Our Promise 2030. As the Partnership’s third largest fundraising office, we are an important part of fulfilling this global mission to reach the world’s most vulnerable children. We renewed the World Vision Australia strategy for 2018-2022 accordingly.
The Board signed off on the direction and focus for the next five years in August 2017. Our focus in coming years is to retain and strengthen existing forms of income, improve the supporter experience, innovate new forms of fundraising and ensure our field commitments.
BUILD SUPPORTER-CENTRIC CAPABILITIES
BEHAVIOURS
SET PERFORMANCE FOCUS
Building communities of change makers
Our vision for every child, life in all its fullness;
Our prayer for every heart, the will to make it so.
Driving high performance
Courage Action Respect
Employees IncomeSupporters
Creating contextually
relevant content and experiences
Being brand-led
Delivering go-to-market excellence
Communicating evidence-based
impact
Child wellbeing
Making a difference should be delightfully simple

Children’s wellbeing We are contributing to the wellbeing of more children than ever before. In our 2016 report, we estimated that we contributed to the wellbeing of approximately 76.7 million children around the world. Our most recent information shows we have contributed to the wellbeing of an estimated 100.5 million children through our programming and advocacy work.
We had another strong year working with the World Food Programme. This year we reached $108.1 million in support, combined cash and non-cash. Through the partnership we distributed food aid in some of the most fragile countries – Afghanistan, Burundi, Central African Republic, Democratic Republic of Congo, Iraq, Jordan, Kenya, Lebanon, Malawi, Myanmar, Somalia, South Sudan, Sudan, Timor-Leste, Uganda and Zimbabwe.
In addition to our work with the World Food Programme, our humanitarian support reached over 404,000 people who fled Mosul, Iraq, during the unrest facing the city. Our Syria refugee crisis response continued. We also worked with DFAT to distribute aid to East Africa and respond to the hunger crisis in South Sudan, Ethiopia, Kenya, Somalia and Uganda. In 2017, 2.7 million children and their families benefited from this aid. Support included providing for food, water and sanitation needs and establishing Child Friendly Spaces for children who have been displaced because of conflict.
Our supporters In 2017, we’ve focused on gaining a deeper understanding of our supporters, creating better opportunities to partner to deliver sustainable change.
We gathered deeper insights into how our supporters want to interact with us and made improvements through all our mass supporter touch points, including digital, call centre and face to face. For instance, we offer supporters etax statements. Our focus on making a difference in the lives of the most vulnerable children has also created opportunities and choice for supporters. We have created a new transition experience for child sponsors when our work in a community ends and we relocate to areas where needs are greatest. We will roll this out to all relevant supporters in FY18.
Digital content and technology continues to be a central pillar in our ability to create experiences, from enabling understanding of our work in the field to facilitating new and different means of supporting us in the future (such as social impact partnerships and investment opportunities). For example, our social enterprise Little Things Coffee sells ethically sourced and certified coffee from both a cafe and online store, with all profits supporting our work in community development and emergency relief.
The role of Chief Advocate was created at the end of 2016. Tim Costello continues to share and promote our work, helping supporters to see the work we do and the impact we can make together.
Generating income for the field While we have grown income to over $404 million, we have seen significant change in our income mix. Child sponsorship declined from $174 million to $154 million between 2016 and 2017, offset by an increase of eight percent from other sources including pledges, emergency relief appeals and cash donations. Our non-cash income declined from over $120 million in 2016 to over $98 million in 2017, an 18 percent decrease. This was a result of our strategic decision to no longer distribute pharmaceutical goods and focus instead on sourcing donated goods and assets that align more closely with our existing programming.
In 2017 we secured over $92.6 million in cash grants, continuing the upward trend from $86.3 million in 2016 and demonstrating improvement in our technical competence. This increase is part of a combined annual growth rate of over 10 percent since 2014. It represents the strong relationships we have with the Australian Government and other donors, including the Food and Agriculture Organization of the United Nations (FAO) and EuropeAid, and the trust they place in us.
With a cost-to-income ratio of 17.6 percent in 2017, we committed over $335 million to our field programs. This represents a moderate decrease of seven percent since 2016, mainly due to reduced income in sources for some programming formats. See pages 26-30 for more information about our income and on how we used funds in 2017.
World Vision Australia 09
Annual Report 2017 Strategy / Strategic performance
How we performed to our strategy in 2017

Working together fuels our success. Alongside the Australian Government, we’re partnering with flood-prone communities in Solomon Islands to help them prepare for disasters.
Collaboration

World Vision National Offices in overseas countries
World Vision Partnership Treasury Office
World Vision
Australia
Our projects in Australia(Funds direct from
World Vision Australia)
Our projects in overseas countries
World Vision Australia 011
Annual Report 2017 Collaboration / Financial accountability
Working and funding through the World Vision International Partnership
Our place in the PartnershipWe implement our overseas aid, development and advocacy projects through the World Vision International Partnership. Our Partnership is dedicated to working with children, families and communities to overcome poverty and injustice, with offices operating in nearly 100 countries.
Within our Partnership, we are known as a “Support Office” because our principal function is to support the National Offices in countries where World Vision runs projects.
Typically, we receive a proposal from a National Office to support a project or Area Program (AP). APs, funded through child sponsorship, take place in defined geographical areas focused on the most vulnerable and consist of projects that address specific challenges facing children in their communities. You can read all about the sectoral focus of our work in our FY15 and FY16 Annual Reports.
We approve projects through a structured committee process. This is informed by global Partnership strategy and includes criteria such as strategic fit, relevance of the proposed response, organisational capacity and donor requirements.
Our project designs reflect a community-led approach, ensuring ownership and sustainable outcomes long after the project closes. National Offices deliver projects with our support and that of the global Partnership – sometimes together with other global and local aid organisations. Our partnerships always focus on achieving the greatest impact and improving child wellbeing.
At different points in a project’s lifecycle, monitoring and evaluation takes place at a community, National Office and World Vision Australia level. This enables us to efficiently demonstrate impact and assure supporters of quality.
For our projects in Australia, we work directly with communities to implement activities. In this context, our role and function is similar to that of a National Office in our Partnership.
How funds raised in Australia reach communities we serve The World Vision Australia Treasury and Investment Policy governs the objectives, responsibilities, processes and permitted activities of our investment function. The policy sets out how we will invest assets in accordance with World Vision ethos and core values, considering fiduciary requirements, applicable laws and liquidity requirements.
We place funds raised for all our projects in term deposits with minimum A+ rated banks in Australia. At all times an amount equivalent to at least eight weeks’ operating expenditure is retained as a working capital reserve.
Funding for our projects overseas is susceptible to the fluctuation of foreign exchange rates. As such, we have currency forward contracts in place to minimise our exposure. We transfer our funds to the World Vision Partnership Treasury Office, which then provides these funds to field projects based on approved plans.

All World Vision projects and programs funded by World Vision Australia undergo regular monitoring and evaluation to measure progress and results. We use a range of indicators, including a globally standardised set of child wellbeing indicators, indicators relevant to the design of the intervention and indicators required by donors of grant-funded projects. Our evaluations provide important insights that help us further improve programming and report on progress to our supporters.
In 2017, our evidence and learning team focused on strengthening our understanding of the impact of our priority program models. They paid special attention to the aspects identified as needing higher quality evidence of results.
We used the results from an evidence gap analysis completed in 2016 to identify our evaluation priorities for core program models: Farmer Managed Natural Regeneration (FMNR), Business Facilitation and Local Value Chain Development (LVCD). Some examples of main findings from these studies are as follows.
Across all three projects there have been positive gains, but there is still work to be done.
Economic Development and Value Chain Project in Muyinga Province, BurundiThis project aimed to reduce chronic malnutrition and improve household income in one of the world’s least developed countries.
• Approximately 81 percent of high-iron bean producers reported a steady increase in income.
• Household asset index scores increased by 21 percent among project participants compared to eight percent among comparison households.
• Access to financial services increased for project households by 63 percent, with project households now having 56 percent more access to savings and loans than comparison households.
• Male-headed households and female-headed households benefited equally.
• Chronic malnutrition, stunting and underweight prevalence among children under five reduced in treatment areas by three, six and 27 percent respectively, while the prevalence of all three increased in the control area by 21, five and one percent respectively. This indicated that the project in part mitigated the impact of the food security crisis occurring at that time in Burundi, better enabling families to feed their children.
• Parents were more likely to implement improved nutrition practices, such as feeding children vegetables from kitchen gardens and including iron-rich foods.
East Africa FMNR (Kenya, Rwanda, Uganda and Tanzania)FMNR can contribute significantly to restoring degraded landscapes, enabling people to access firewood and other forest products (such as timber, honey and fruits) and increase their income sources. For example, in Kotido, Uganda:
• Eighty-two percent of households participated in the project to increase tree cover and improve natural resource use.
• Eighty-eight percent of all households reported an increase in tree cover in their community.
• Ninety-six percent of respondents reported that they valued trees more after participating in the project. Shade and fruit were the most important benefits.
• Project households derived income from a greater variety of forest materials such as honey, fruit and medicinal products, almost doubling their income.
• The benefits extended to women, with project participants reporting increased involvement in farmer groups (53 percent), new skills
• development (44 percent) and increased income (39 percent) for women.
Enhancing Women’s Civil and Political Empowerment in Herat, AfghanistanWe worked with community groups to empower women by enhancing their political and civil roles in society.
• Support for violence against women decreased among men and women by 21 and 14 percent respectively, moving from moderate support of violence against women to moderate opposition.
• The number of men reporting that their wife made household spending decisions increased by 24 percent.
• The likelihood of women being involved in community development decisions increased by 38 percent.
• Both men and women equally and strongly support women’s participation in the labour market.
• Women’s individual responsibility for domestic labour decreased by 15 percent and joint responsibility for domestic labour increased by 20 percent.
• Faith leaders were initially supportive of women’s rights, and this increased by a further nine percent.
World Vision Australia 012
Annual Report 2017 Collaboration / Our evaluation approach
Our evaluation approach
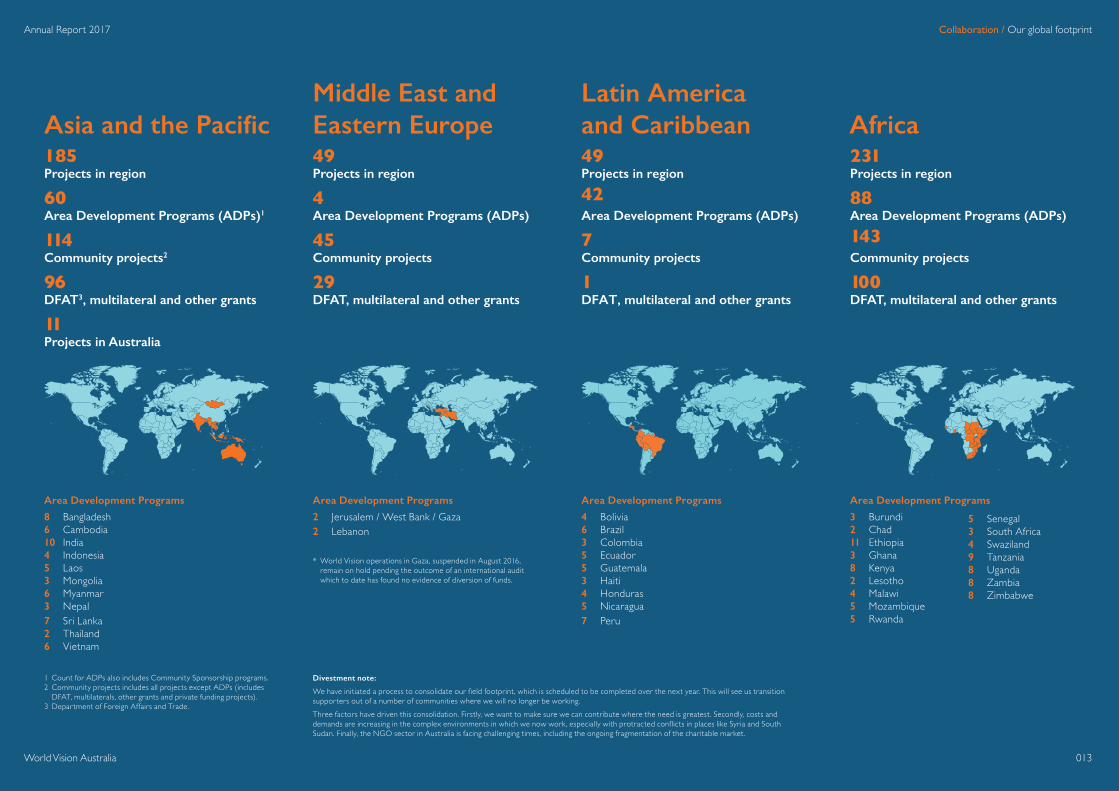
185 Projects in region
60 Area Development Programs (ADPs)1
114 Community projects2
96 DFAT3, multilateral and other grants
11 Projects in Australia
49 Projects in region
4 Area Development Programs (ADPs)
45 Community projects
29 DFAT, multilateral and other grants
Middle East and Eastern Europe
Latin America and Caribbean AfricaAsia and the Pacific49 Projects in region
42 Area Development Programs (ADPs)
7 Community projects
1 DFAT, multilateral and other grants
231 Projects in region
88 Area Development Programs (ADPs)
143 Community projects
100 DFAT, multilateral and other grants
Area Development Programs
8 Bangladesh6 Cambodia10 India4 Indonesia5 Laos3 Mongolia6 Myanmar3 Nepal7 Sri Lanka2 Thailand6 Vietnam
Area Development Programs
2 Jerusalem / West Bank / Gaza2 Lebanon
* World Vision operations in Gaza, suspended in August 2016, remain on hold pending the outcome of an international audit which to date has found no evidence of diversion of funds.
Area Development Programs
4 Bolivia6 Brazil3 Colombia5 Ecuador5 Guatemala3 Haiti4 Honduras5 Nicaragua7 Peru
Area Development Programs
3 Burundi2 Chad11 Ethiopia 3 Ghana8 Kenya2 Lesotho4 Malawi5 Mozambique5 Rwanda
5 Senegal 3 South Africa4 Swaziland9 Tanzania8 Uganda8 Zambia8 Zimbabwe
1 Count for ADPs also includes Community Sponsorship programs.2 Community projects includes all projects except ADPs (includes
DFAT, multilaterals, other grants and private funding projects).3 Department of Foreign Affairs and Trade.
Divestment note:
We have initiated a process to consolidate our field footprint, which is scheduled to be completed over the next year. This will see us transition supporters out of a number of communities where we will no longer be working. Three factors have driven this consolidation. Firstly, we want to make sure we can contribute where the need is greatest. Secondly, costs and demands are increasing in the complex environments in which we now work, especially with protracted conflicts in places like Syria and South Sudan. Finally, the NGO sector in Australia is facing challenging times, including the ongoing fragmentation of the charitable market.
World Vision Australia 013
Annual Report 2017 Collaboration / Our global footprint

Impact
Every day, we’re moving forward. Changing what needs to change. In Makira, Solomon Islands, we’re supporting faith and community leaders to tackle gender-based violence.
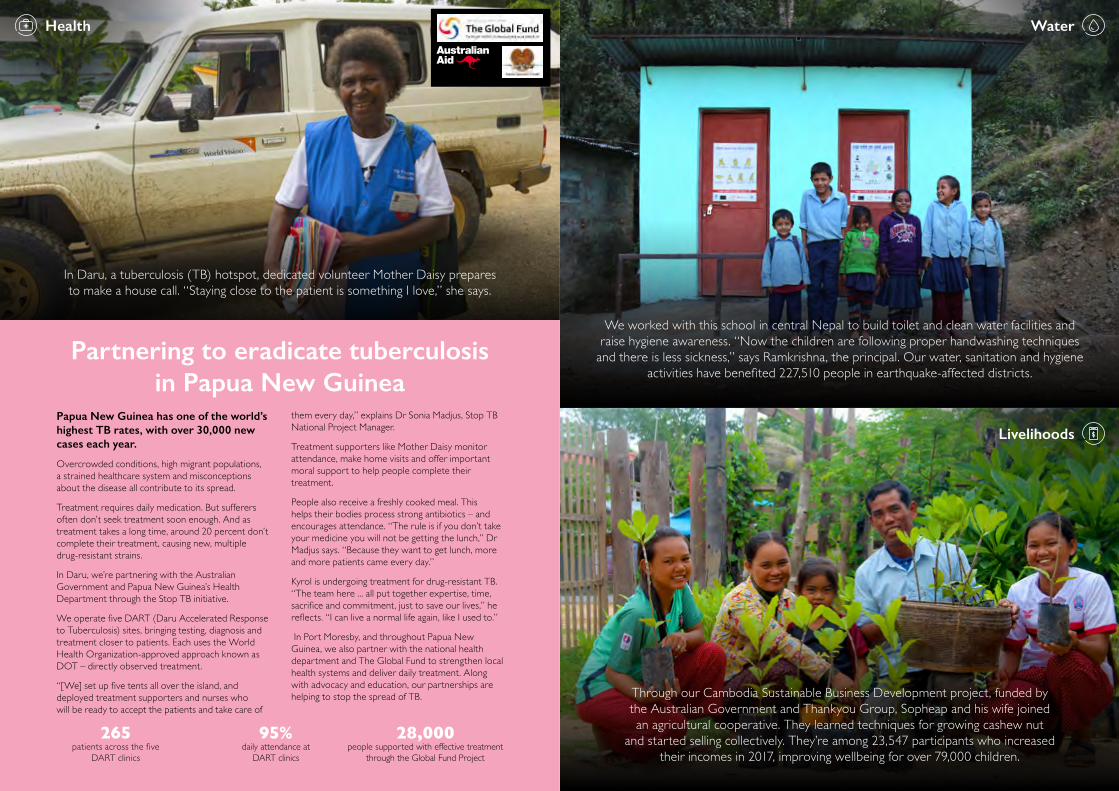
In Daru, a tuberculosis (TB) hotspot, dedicated volunteer Mother Daisy prepares to make a house call. “Staying close to the patient is something I love,” she says.
Papua New Guinea has one of the world’s highest TB rates, with over 30,000 new cases each year.
Overcrowded conditions, high migrant populations, a strained healthcare system and misconceptions about the disease all contribute to its spread.
Treatment requires daily medication. But sufferers often don’t seek treatment soon enough. And as treatment takes a long time, around 20 percent don’t complete their treatment, causing new, multiple drug-resistant strains.
In Daru, we’re partnering with the Australian Government and Papua New Guinea’s Health Department through the Stop TB initiative.
We operate five DART (Daru Accelerated Response to Tuberculosis) sites, bringing testing, diagnosis and treatment closer to patients. Each uses the World Health Organization-approved approach known as DOT – directly observed treatment.
“[We] set up five tents all over the island, and deployed treatment supporters and nurses who will be ready to accept the patients and take care of
them every day,” explains Dr Sonia Madjus, Stop TB National Project Manager.
Treatment supporters like Mother Daisy monitor attendance, make home visits and offer important moral support to help people complete their treatment.
People also receive a freshly cooked meal. This helps their bodies process strong antibiotics – and encourages attendance. “The rule is if you don’t take your medicine you will not be getting the lunch,” Dr Madjus says. “Because they want to get lunch, more and more patients came every day.”
Kyrol is undergoing treatment for drug-resistant TB. “The team here ... all put together expertise, time, sacrifice and commitment, just to save our lives,” he reflects. “I can live a normal life again, like I used to.”
In Port Moresby, and throughout Papua New Guinea, we also partner with the national health department and The Global Fund to strengthen local health systems and deliver daily treatment. Along with advocacy and education, our partnerships are helping to stop the spread of TB.
Partnering to eradicate tuberculosis in Papua New Guinea
95% daily attendance at
DART clinics
265 patients across the five
DART clinics
28,000 people supported with effective treatment
through the Global Fund Project
We worked with this school in central Nepal to build toilet and clean water facilities and raise hygiene awareness. “Now the children are following proper handwashing techniques
and there is less sickness,” says Ramkrishna, the principal. Our water, sanitation and hygiene activities have benefited 227,510 people in earthquake-affected districts.
Through our Cambodia Sustainable Business Development project, funded by the Australian Government and Thankyou Group, Sopheap and his wife joined an agricultural cooperative. They learned techniques for growing cashew nut
and started selling collectively. They’re among 23,547 participants who increased their incomes in 2017, improving wellbeing for over 79,000 children.
Health Water
Livelihoods

Emergencies Child protection
Education
More than six million people have been displaced in South Sudan, Somalia, Kenya and Ethiopia due to drought, conflict and political instability. Through a World
Vision savings group, Joyce started a small business to get back on her feet.
767,000 refugees in Uganda have received
food or cash assistance
$9,389 saved by groups at Imvepi between June and August
3.5 million people reached since January through our
East Africa Hunger Crisis response
Every day, Joyce serves steaming cups of tea and hearty meals in one of Uganda’s newest towns: Imvepi refugee settlement.
Her customers include aid workers, refugees wanting a break from cooking, and young people stopping to chat.
Established in early 2017, Imvepi now hosts over 100,000 people. They’re among one million refugees – mostly women and children – who’ve escaped conflict and hunger in South Sudan.
A 23-year-old mother of three, Joyce fled after her husband was killed.
World Vision has established 60 savings groups at Imvepi, involving 1,800 refugees and host community members. Providing benefits for both refugees and the host community helps them co-exist peacefully.
We provide start-up kits including savings boxes, record books, pens and calculators. We also provide training in financial literacy, saving and business management.
“I had been operating a small restaurant in South Sudan so I managed to escape with my cooking pans and a few other items,” Joyce says. “All I needed was some capital to buy food ...”
After two months of saving US$0.71 a week alongside her group’s 30 members, Joyce qualified for a US$18 loan.
“I was able to buy ... cooking oil, salt, ingredients, and a few plastic plates ...,” she says. “I got some free tarpaulins, bought a few wooden poles and put up a small structure to act as the eating place for my customers.”
Most days Joyce makes US$4. After just two weeks, she repaid her loan. Now she’s planning to take out another to expand the business.
Savings groups are just part of our response in Uganda. We’re also helping to register arrivals, provide meals, distribute relief items and support unaccompanied and at-risk children. We’re working to help families like Joyce’s achieve long-term recovery and self-reliance.
Business is booming in Imvepi refugee settlement
At Zelican camp, outside Mosul, Iraq, a World Vision Child Friendly Space provides much-needed relief from the chaos. Children enjoy games, football, drama and
drawing under the gentle guidance of trained child protection specialists.
In Western Australia’s Pilbara region, project facilitator Elyssa works with a child at the colourful Parnngurr playgroup. We’re partnering with remote communities throughout the country to improve early learning
opportunities and help Indigenous children prepare for “big school”.
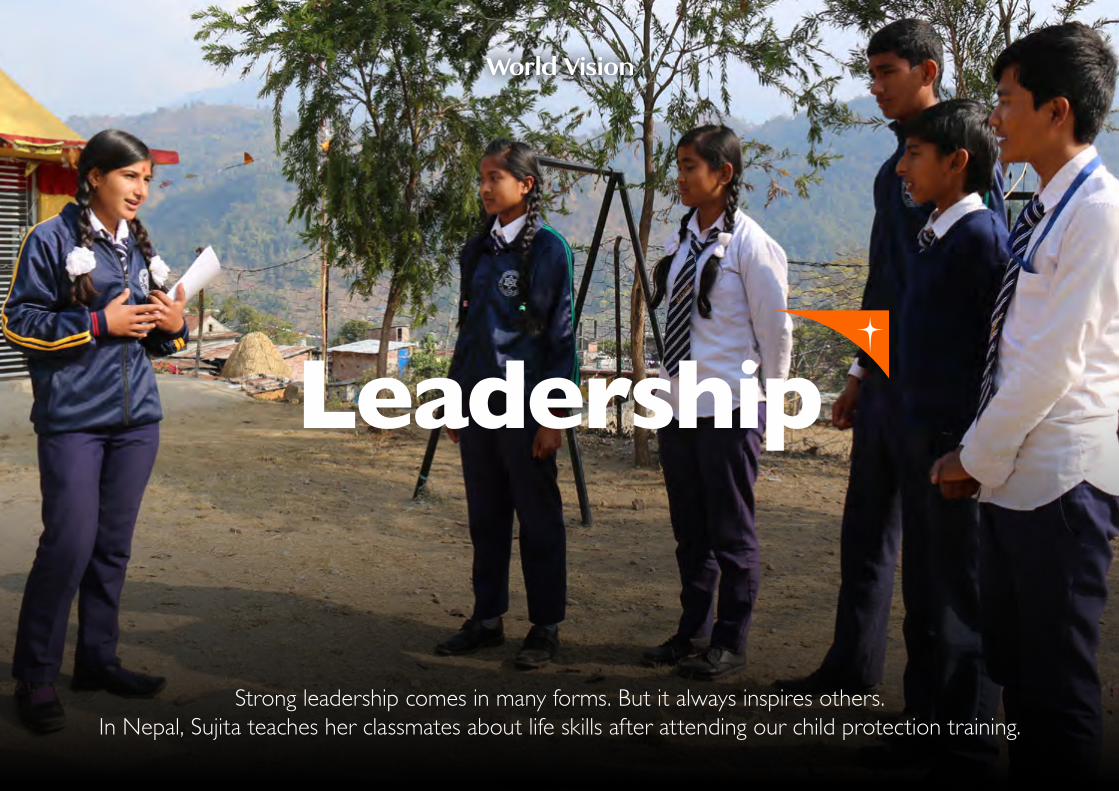
Leadership
Strong leadership comes in many forms. But it always inspires others. In Nepal, Sujita teaches her classmates about life skills after attending our child protection training.

George Savvides Chair
Former CEO of Medibank Private LtdChair of the Board, Macquarie University Hospital BoardChair of the Board, Kings Group Ltd; Board member, Ryman Healthcare Ltd NZX; Deputy Chair of the Board, Special Broadcasting Service Corporation
Tim McCormack Chair – People, Culture and Nominations Committee
Professor of Law, Melbourne Law School, University of MelbourneAdjunct Professor, Faculty of Law, University of Tasmania
Claire RogersChief Executive Officer /Board Member
Former Head of ANZ Australia’s Digital BankingBoard member of Australian Council for International Development (ACFID)
Donna Shepherd Member – People, Culture and Nominations Committee
Chair of the Board, Creating Communities Australia Pty LtdChair, Board of World Vision International
Gordon AllisonChair – Audit and Risk Committee
Executive Manager, Office of the Chief Operating Officer, National Australia Bank
Fiona Pearse Member – Audit and Risk Committee
Experienced financial and commercial executive and non-executive director
Darryl GardinerMember – Audit and Risk Committee
Board member of World Vision New ZealandAnglican priest, youth and community worker, speaker and trainer in New Zealand and internationally
Jon SeeleyMember – Audit and Risk Committee
Group Managing Director, Seeley International Pty Ltd
Bessie VanerisPartnership Director*
Chief People Officer, World Vision International* Primary purpose is to ensure
good communication and alignment between us and the World Vision International Partnership.
Shannon Adams Deputy Chair Member – Audit and Risk Committee
Partner, Piper Alderman, LawyersBoard member, World Vision International
Wendy Simpson Member – People, Culture and Nominations Committee
Chairman of Wengeo Pty LtdFounding Chair of Springboard Enterprises Australia Limited
Our Board
Retiring directors during 2017 were Judy Barraclough, Rob Goudswaard, John Harrower, Louise Bauer, Colin Carter and Bonnie Wurzbacher.
World Vision Australia 018
Annual Report 2017 Leadership / Our Board

Governance and management
Our Board and committeesOur Board comprises 11 highly qualified individuals who each bring unique expertise and experience relevant to their governance role.
Throughout 2017, George Savvides served as our Board Chair.
More detailed profiles can be found here
In 2017, the following committees supported our Board:
• The Audit and Risk Committee, which assists in monitoring and ensuring the integrity of our financial reporting and compliance with legal and regulatory requirements, internal standards (including the code of conduct), policies and expectations of key stakeholders. This committee also assists with monitoring and ensuring the effectiveness of our internal control and risk management framework and of the internal and external audit functions. This committee met six times in 2017. Gordon Allison is Chair of this committee.
• The People, Culture and Nominations Committee, which assists our Board to effectively discharge its responsibilities for monitoring human resources and corporate culture, appointment of our senior leaders and evaluation of our CEO. This committee also assists with respect to Board composition, skills and procedures to maintain a process of continuous improvement. This committee met five times in 2017. Tim McCormack is Chair of this committee.
Ross PiperChief, Field Impact
Nathan CallaghanChief, People and Culture
Teresa SpertiChief Marketing Officer
Janine KewmingChief, Private Funding
Simon KilnerChief Information Officer
Rebecca Glover Chief Financial Officer
Claire Rogers Chief Executive Officer
Natalie HannemannChief of Supporter
Experience
Pam RebeccaChief of Digital and Retail
Jill Roche Chief of Corporate Affairs
Tim Costello Chief Advocate
Leadership team
World Vision Australia 019
Annual Report 2017 Leadership / Governance and management

We are committed to the accountability and transparency that is provided through our corporate governance framework. Our aim is to create long-term, sustainable value for our supporters and other stakeholders, especially those who we serve.
Our Board recognises its role in overseeing the determination and implementation of policies and processes that reflect good corporate governance and understands that these must, like our core values (see page 6), inform and guide the attitudes, decisions and actions that make up the fabric of our life and work. We also recognise that this is another area in which we must continuously make improvements by considering, reviewing, testing and changing processes.
Our corporate governance environment is one in which the law, industry codes, the expectations of our stakeholders (supporters and those we serve) and World Vision Partnership requirements interplay.
Law and industry codesWe are regulated in the main by the Australian Charities and Not for Profits Commission as a registered charity under the Australian Charities and Not for Profits Commission Act 2012 (ACNC Act). We are registered as a public corporation limited by guarantee under the Corporations Act 2001, which means that the Corporations Act applies but in a manner modified by the ACNC Act. We also hold tax exemptions and concessions and are therefore also subject to the Income Tax Assessment Act 1997.
As a signatory to the ACFID Code of Conduct we are also subject to the code’s governance principles and requirements. The code defines minimum standards of governance, management and accountability for non-government organisations. It aims to improve international development outcomes and increase stakeholder trust by enhancing the transparency and accountability of signatory organisations.
We have voluntarily adopted the Australian Institute of Company Directors’ “Good Governance Principles and Guidance for Not for Profit Organisations” (AICD NFP Principles) and the Australian Securities Exchange’s Corporate Governance Principles and Recommendations (ASX Principles). We apply these insofar as it is sensible and realistic to do so even though we are not a listed entity. This means taking into account our position as a large not-for-profit organisation and with due regard to the scope of our operations and level of donor and public interest. The AICD NFP Principles and the ASX Principles are not incompatible and both apply to us, but the AICD NFP Principles − being focused on not-for-profit organisations − take precedence.
World Vision PartnershipAs a member of the World Vision International Partnership, we are also subject to Partnership policies, insofar as they are appropriate under Australian laws. In relation to corporate governance specifically, the Partnership’s corporate governance guidelines apply. These guidelines are, by their nature, specific to entities within the Partnership, including ourselves.
Read our full Corporate Governance Statement. The statement addresses in detail how we respond to the requirements and principles under relevant laws, industry codes and our own policies as they relate to corporate governance.
Law: ACNC Act and Corporations Act, Income Tax Assessment Act
Expectations of stakeholders
World Vision Partnership
requirements
Industry codes: ACFID
Code, AICD NFP Principles, ASX
Principles
World Vision Australia 020
Annual Report 2017 Leadership / Corporate governance
Corporate governance

Internal audit We implement an internal audit function that acts as an independent, objective assurance and consulting activity designed to add value and improve our operations. It helps us accomplish our objectives by bringing a systematic, disciplined approach to evaluate and improve the effectiveness of risk management, control and governance processes.
It does this by providing independent, objective assurance to the Board that the components of internal control are operating effectively and as they are intended. It aims to assist the CEO and Executive Team in effectively discharging their responsibilities to the Board in these areas of risk management and internal control, while also supporting improvements in overall business process.
In accordance with professional standards and good corporate governance principles, this internal audit function is, and will be perceived to be, independent of World Vision Australia activities, processes and staff that it reviews. This ensures objectivity in performing duties and reporting results. The function reports into the Chair of the Audit and Risk Committee and then administratively through the Chief Financial Officer.
We have engaged EY (formerly Ernst & Young) as our outsourced internal auditors.
Risk managementWe require all areas of our business to identify key risks and to analyse, evaluate and treat those risks in a proactive manner. To ensure a consistent and structured approach, we manage risk systematically in line with our risk management policy and in response to changes in our internal and external environment. We have designed this approach to bring about cultural and behavioural improvements in the understanding of our risk management.
The risk framework we deploy for these purposes is in line with World Vision International’s risk management framework. This is important as we must also consider project and program portfolio risks associated with the projects implemented by the National Offices in countries where we conduct development activities.
The strategic intent of the framework is to ensure that we manage the risks of the organisation in a proactive manner, which embraces the identification, treatment, management, reporting and review of risks. We recognise that risks are inherent
in all operations. The intent of our risk management approach, therefore, is to provide guidance on the management of risks – not just in a reactive way, but also in a positive way, where risks can be taken when duly considered and approved by those with delegated authority. This approach is intended to result in improved decision making and also considers upside risk (ie, the uncertainty of potential gain, not just potential loss).
Our risk management framework comprises the following structural elements:• The Australian Standard ISO
31000:2009 Risk Management – Principles and Guidelines
• World Vision Partnership Enterprise Risk Policy and Framework
• Three lines of defence model for corporate governance – business operations, risk/legal and audit
By structuring the framework around standard processes and proven tools, we can gain confidence that our risk and assurance processes reflect best practice now and into the future.
The main structural elements of the risk management frameworkWe aim to integrate risk management into our overall management system. We will continually assess, and adapt if necessary, existing risk management policies and practices across World Vision Australia for adequacy and effectiveness against the following attributes.
1. Continuous improvement of risk management effectiveness.
2. Single-point accountability for risks.3. Risk-based decision making.4. Continual communication with internal
and external stakeholders.5. Full integration in the governance
structure, essential for the achievement of organisational objectives.
Leadership / Risk management
Risk management
World Vision Australia 021
Annual Report 2017

World Vision Australia 022
Annual Report 2017
Building a culture of high performanceOur employees have experienced great change over the last year. The implementation of the new leadership team has strengthened our commitment to staff and provided the framework for a strong, professional and high performing culture.
The culture program we shaped in FY17 is the platform for all staff to commit, engage, develop and grow the business, to achieve the highest possible change for children and their communities. Working to a common purpose of being a community of change makers offers staff opportunities to apply their skill and experience; building a resilient, empowered and motivated workforce.
Employee engagementWe connected our engagement survey, regular pulse checks and one-to-one performance and development reviews to proactively build employee and manager relationships. Our workforce has grown in expertise and diversity, offering new scope and opportunity to identify and nurture talent and offer employees short-term and secondment placements within the organisation.
Our culture program encouraged idea generation and dialogue from staff to improve business process, productivity and transparency. This has resulted in our highest rates of employee engagement in four years, as well as a strong perception that we are making the changes necessary for further growth. Utilising Yammer, our internal social networking service, staff shared ideas for making processes delightfully simple and for building employee trust and motivation.
We thank our employees and volunteers for their diligence and stewardship and will continue to provide opportunities to further their experience within the organisation.
Our people
Leadership / Our people
11 440 365 75 19% N/A
13 524 440 84 18.70% N/A
12 652 543 109 15.90% N/A
6 164 9
5 201 66
Male
Female
Boa
rd
mem
bers
Tota
l em
ploy
ees
Full-
tim
e em
ploy
ees
Part
-tim
e em
ploy
ees
Staf
f tu
rnov
er
Hou
rs
volu
ntee
red
By department
“Staff engagement has lifted from 61 percent to 69 percent.”
– Claire Rogers, CEO
2017
2016
2015
2017
Finance and Corporate Services 44
Private Funding 42
Technology 33
Corporate Affairs 26
People and Culture 25
Strategy and Innovation 7
Chief Executive Office 2
Supporter Experience 6
Field Impact 104
Retail and Digital 92
Marketing 59

We are committed to improving our environmental performance and reducing our contribution to climate change and environmental degradation.
Since 2008, we have considered the extent of our carbon footprint by measuring a selection of key activities and consumption items that have the most significant environmental impact. These include electricity, air travel (fuel only), paper, car fleet and gas.
We have set a target of zero emissions by 2017 for these key indicators. We have committed to reducing emissions and purchasing carbon offsets where we cannot sufficiently reduce emissions to meet the nil target.
We continue to integrate our carbon reduction strategy with our core development programs. We have a reforestation project and an energy-efficient stoves project in Africa. Both of these incorporate carbon emission reductions that form the basis of certifiable emission reduction units under the Clean Development Mechanism of the Kyoto Protocol. The projects are also improving rural livelihoods, increasing resilience to climate change and restoring degraded lands. This year, we were again able to purchase carbon emission offsets from our reforestation project in Soddo, Ethiopia. More information about this project can be found here.
Results from our carbon footprint reduction initiativePricewaterhouseCoopers has independently reviewed the data in the table below. The independent review statement is available on our website.
The table shows the number of tonnes of CO2-e emitted under each key activity during the 2017 financial year compared with the previous year. During the year, total emissions before offsets decreased by 349 tonnes CO2-e as a result of reductions in headcount and rent and occupancy expenditure. We reduced our car fleet, resulting in reduced petrol expenditure. Paper consumption decreased due to a shift towards digital marketing.
Environmental management
Notes1. Australian National Greenhouse Accounts factors changed during the year and we have used the
conversion factors published in 2017 for this report. We have not recalculated FY16 results.2. The Environment Protection Agency (Victoria) and Department for Environment, Food and Rural Affairs
(UK) factors for each particular cabin class changed during FY17. We used these factors in this report and have not recalculated FY16 results. Air travel emissions calculations exclude airfares purchased and reimbursed for non-World Vision Australia staff where they have been readily identified.
3. We have purchased Voluntary Emissions Reductions (VERs) from the Forest Finance Group, an accredited independent trader of carbon offsets generated from World Vision projects. We purchased these VERs at market rate to offset 2,828 tonnes CO2-e. The Gold Standard Foundation has certified the VERs.
Leadership / Environmental management
FY17 FY16
Key activities measured Tonnes CO2-e
Electricity1 1,777 1,935
Air travel (fuel only)2 598 710
Paper 184 246
Car fleet 60 90
Gas 209 196
Total emissions before offsets 2,828 3,177
Gold Standard offsets purchased from World Vision programs3
(2,828) (2,513)
Total emissions after offsets - 664
Target - 664
World Vision Australia 023
Annual Report 2017

Progress
Our partners and supporters rely on us to manage resources wisely. So that more children like Amisha and Nitesh get the opportunities they deserve.

Financial position and performance
Snapshot This table is a snapshot of our income and disbursements over FY17 compared to the previous two years. You can find more detail in the extracts from our audited Annual Financial Statements for the year ended 30 September 2017 on pages 31-37.
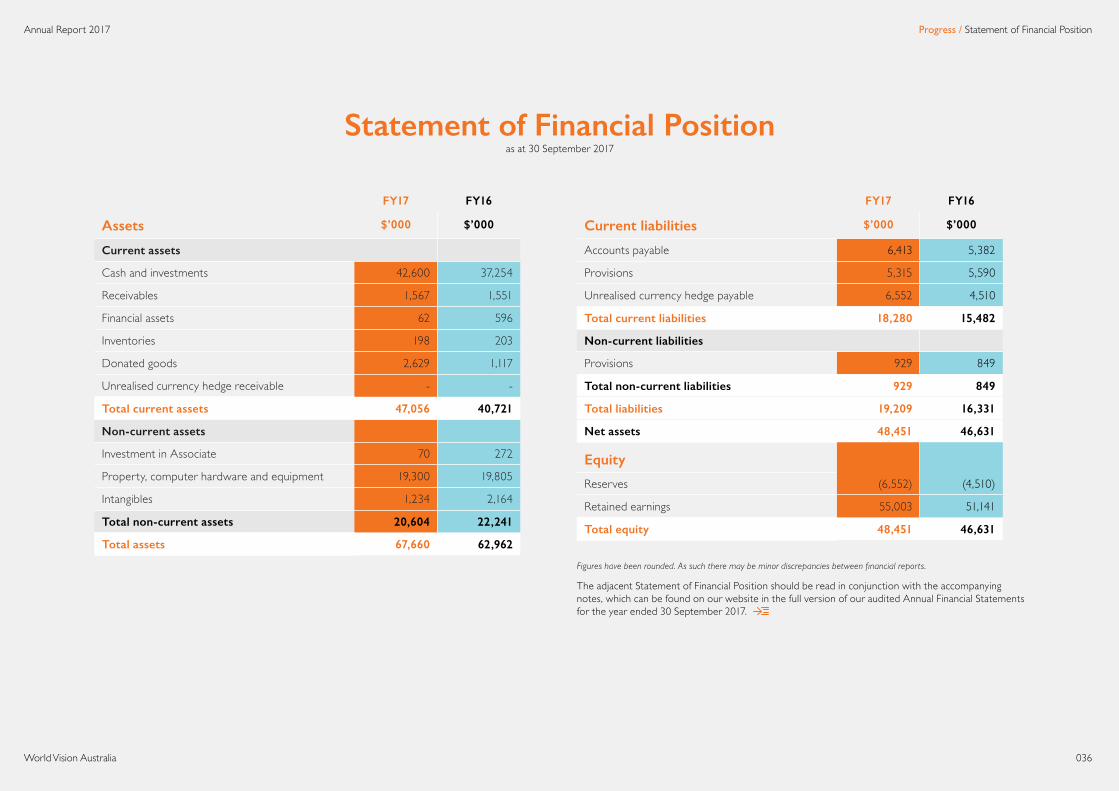
These extracts are set out in the manner required under the ACFID Code of Conduct, to which we are a signatory. Additionally, we are registered with the Australian Charities and Not-for-Profits Commission (ACNC) as a “large charity”. We will be disclosing our financial performance in the 2017 Annual Information Statement, which we will lodge with the ACNC and which will be available via the ACNC’s Charity Register.
Income FY17$m
FY16$m
FY15$m
Child sponsorship 151.6 172.3 183.2Grants – DFAT 47.5 38.5 44.5Appeals, donations and gifts 37.1 39.4 54.2Overseas grants 43.5 47.3 38.4Other revenue 25.7 16.9 14.9Cash income 305.4 314.4 335.2
Non-monetary donations and gifts 98.7 120.7 89.2Total income 404.1 435.1 424.4
DisbursementsFundraising 41.4 40.7 60.4Administration and accountability 25.4 39.0 31.2Overheads 66.8 79.6 91.6
International programs:Funds to international programs 224.4 212.6 251.5Program support costs 4.9 5.7 7.7
Domestic projects 4.4 5.3 4.8Community education 2.3 1.6 0.8Program disbursements – cash 236 225.2 264.9
Non-monetary items to international programs 97.2 125.0 86.6Program disbursements 333.2 350.2 351.5
Total disbursements 400.0 429.8 443.1
Excess/(shortfall) of revenue over expenditure 4.1 5.3 (18.7)Share of loss of associate 0.2 - -Surplus/(deficit) 3.9 5.3 (18.7)
Figures have been rounded. As such there may be minor discrepancies between financial reports.
World Vision Australia 025
Annual Report 2017 Progress / Financial position and performance
$200
m
$175
m
$25m
$50m
$125
m
$150
m
$75m
$100
m
Non-monetary revenue
Other revenue
Appeals, donations and gifts
Australian Government (DFAT)
Overseas grants
Child sponsorship
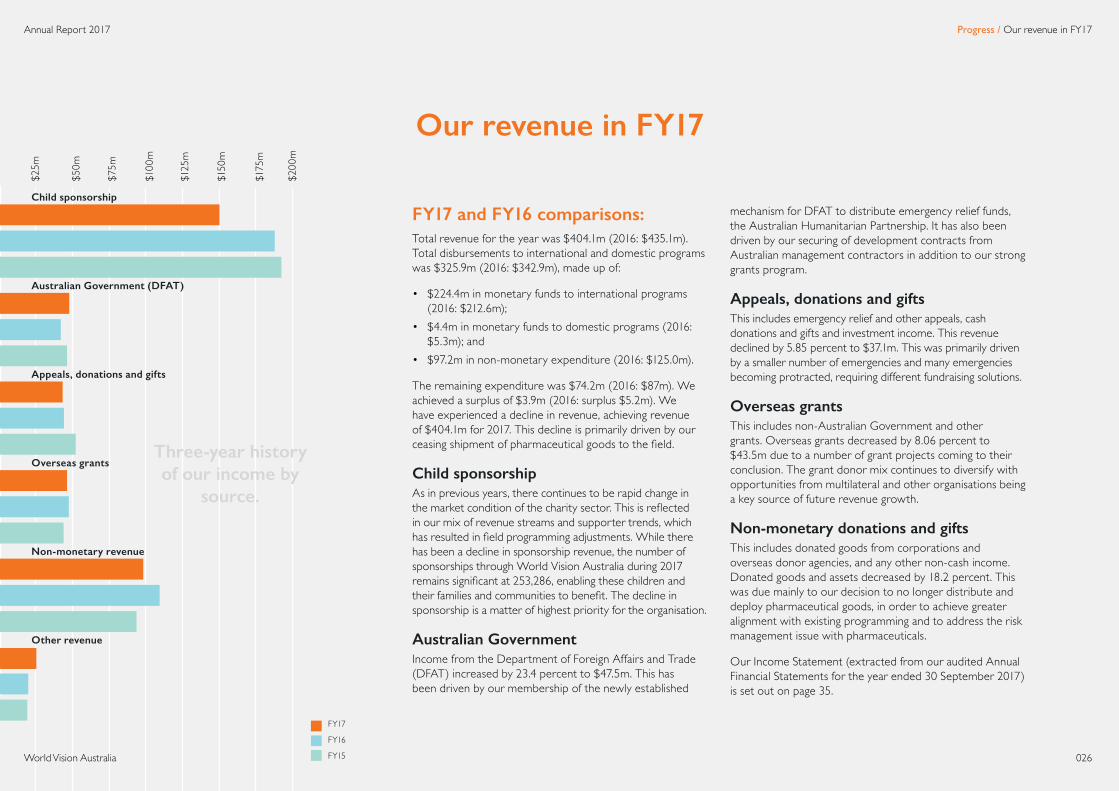
Our revenue in FY17
FY17 and FY16 comparisons:Total revenue for the year was $404.1m (2016: $435.1m). Total disbursements to international and domestic programs was $325.9m (2016: $342.9m), made up of:
• $224.4m in monetary funds to international programs (2016: $212.6m);
• $4.4m in monetary funds to domestic programs (2016: $5.3m); and
• $97.2m in non-monetary expenditure (2016: $125.0m).
The remaining expenditure was $74.2m (2016: $87m). We achieved a surplus of $3.9m (2016: surplus $5.2m). We have experienced a decline in revenue, achieving revenue of $404.1m for 2017. This decline is primarily driven by our ceasing shipment of pharmaceutical goods to the field.
Child sponsorshipAs in previous years, there continues to be rapid change in the market condition of the charity sector. This is reflected in our mix of revenue streams and supporter trends, which has resulted in field programming adjustments. While there has been a decline in sponsorship revenue, the number of sponsorships through World Vision Australia during 2017 remains significant at 253,286, enabling these children and their families and communities to benefit. The decline in sponsorship is a matter of highest priority for the organisation.
Australian GovernmentIncome from the Department of Foreign Affairs and Trade (DFAT) increased by 23.4 percent to $47.5m. This has been driven by our membership of the newly established
mechanism for DFAT to distribute emergency relief funds, the Australian Humanitarian Partnership. It has also been driven by our securing of development contracts from Australian management contractors in addition to our strong grants program.
Appeals, donations and giftsThis includes emergency relief and other appeals, cash donations and gifts and investment income. This revenue declined by 5.85 percent to $37.1m. This was primarily driven by a smaller number of emergencies and many emergencies becoming protracted, requiring different fundraising solutions.
Overseas grantsThis includes non-Australian Government and other grants. Overseas grants decreased by 8.06 percent to $43.5m due to a number of grant projects coming to their conclusion. The grant donor mix continues to diversify with opportunities from multilateral and other organisations being a key source of future revenue growth.
Non-monetary donations and giftsThis includes donated goods from corporations and overseas donor agencies, and any other non-cash income. Donated goods and assets decreased by 18.2 percent. This was due mainly to our decision to no longer distribute and deploy pharmaceutical goods, in order to achieve greater alignment with existing programming and to address the risk management issue with pharmaceuticals.
Our Income Statement (extracted from our audited Annual Financial Statements for the year ended 30 September 2017) is set out on page 35.
FY17
FY16
FY15
Three-year history of our income by
source.
World Vision Australia 026
Annual Report 2017 Progress / Our revenue in FY17

w
Administration$25.4m, 6.3%
Community education$2.3m, 0.6%
Program support costs$4.9m, 1.2%
Funds to international programs
$321.6m, 80.4%
Fundraising$41.4m, 10.3%
Disbursements – How funds were used in FY17
FY17
FY16
FY15
$41.4 $25.4 $321.6 $4.4 $2.3 $4.9 $400
$40.7 $39.0 $337.5 $5.3 $1.6 $5.7 $429.8
$60.4 $31.2 $338.2 $4.8 $0.8 $7.7 $443.1
Fund
rais
ing
Tota
l $m
Acc
ount
abili
ty
and
adm
inis
trat
ion*
Fund
s to
in
tern
atio
nal p
rogr
ams*
Dom
esti
c pr
ogra
ms
Com
mun
ity
educ
atio
n
Prog
ram
su
ppor
t co
sts
Domestic programs $4.4m, 1.1%
World Vision Australia 027
Annual Report 2017 Progress / Disbursements

$200
m
$175
m
$25m
$50m
$125
m
$150
m
$75m
$100
m
Global operations and other
Latin America
Asia and Pacific
Africa
Middle East, Eastern Europe and Central Asia
FY17
FY16
FY15
FY17 and FY16 comparisons:FundraisingThis includes our marketing and supporter facing costs. Fundraising costs increased by 0.9 percent, from 9.4 percent of revenue to 10.3 percent, reflecting greater focus on fundraising opportunities to offset challenging market conditions.
Accountability and administrationThis includes the costs of information technology, finance and accounting, human resources and legal and risk management functions, as well as our CEO and management teams (see page 19 for more information). Accountability and administration costs decreased by 34.8 percent compared to 2016. Streamlining of operations in 2016 resulted in higher redundancy and impairment costs, which are not included to the same extent in 2017 and are the primary drivers of the reduction.
Domestic programsThis includes our disbursements for work in Australia on Indigenous development programs. Funds to domestic programs decreased by 17.4 percent to $4.4m, as we specifically focused on domestic programs through which we can have maximum impact.
Community educationThis includes the costs associated with public awareness campaigns in Australia and advocacy activities seeking to bring about change in government and institutional policies.
Program support costsThis includes costs associated with quality advisors and sector specialists. We engage them to assist with the design, monitoring and evaluation of the programs we support, to ensure maximum impact.
Funds to international programsThis includes all cash, food (including World Food Programme contracts) and goods designated for our international programs. It also includes funds transferred to our global centre operating costs and Partnership’s Treasury Office. These are funds that are designated for field programs and have not yet been committed to a specific project, but will be in future years. The provision of resources to the field declined by 4.9 percent relative to the prior year, mainly because we no longer distribute and deploy pharmaceutical goods. This overall decrease is net of a 5.5 percent increase to $111.8m in funds sent to international programs.
You can find out more about how funds reach communities on page 11.
Cash, food and goods by region
in FY17
World Vision Australia 028
Annual Report 2017 Progress / Disbursements

Disbursements by regionsThe graph to the left shows disbursements of cash, food and goods by region in FY17 compared with the previous two years.
Information on the amounts disbursed to countries within each of the regions can be found at note five from page 32 of our audited Annual Financial Statements for the year ended 30 September 2017, available on our website.
The decline in the Africa region in the current financial year is primarily driven by the reduction in pharmaceutical gifts-in-kind in 2017.
We have also included in the chart disbursements towards “Global operations and other”. These disbursements are for global management and expertise of the World Vision International Partnership. They are also for the Partnership’s international advocacy activities on issues such as ending violence against children, child rights, sustainable development goals, peacebuilding and fragile and conflict-affected contexts.
As explained on page 11, our programs are implemented via a network of National Offices under the oversight of the Partnership, which coordinates activities such as the transfer of funds and strategic operations. Technical experts, strategists and global leaders in the Partnership
provide global strategy and specialty expertise. Utilising this expertise and experience enables us to improve our efficiency and maximise economies of scale.
Excess of expenditure over revenue: Overall, total revenue for FY17 was $404.1m (FY16: $435.1m). Total cash funds to international and domestic programs was $228.8m (FY16: $217.9m) and other expenditure was $171.4m (FY16: $211.9m), resulting in a surplus of $3.9m (FY16: surplus of $5.2m).
Disbursements by region in FY17
Asia Pacific$69.2m, 23.0%
Latin America$15.1m, 5.0%
Middle East/EE$73.5m, 24.5%
Africa$115.1m, 38.3%
Global operations and other$27.6m, 9.2%
World Vision Australia 029
Annual Report 2017 Progress / Disbursements

Ensuring our ability to meet our field program financial commitmentsAs part of the Partnership’s global planning process, we make funding commitments to relief and development programs (international or domestic) based on income forecasts approximately three to six months before the start of the next financial year.
Our Field Allocations Committee considers and approves all funds proposed for allocation. The committee comprises key employees with responsibility and delegated authority from our Board for overseeing the use of funds in all our programs. We base funding decisions on criteria such as strategic fit, organisational capacity and donor requirements.
This process helps to provide the requisite level of certainty around funding streams for local World Vision offices implementing our programs. This enables them to plan appropriately and allocate resources.
All overseas projects we support are funded in US dollars. World Vision International enters into foreign exchange purchase contracts on behalf of and following instructions from us, to hedge against currency exchange risks.
We are committed to ensuring that funds donated to us are used for the purposes for which they were raised. The only exception to this occurs when circumstances beyond our control prevent us from utilising funds in the manner promised. Such circumstances may include instances where:
• geopolitical issues prevent the use of funds;• staff security is jeopardised so that we
are forced to withdraw from the project area;
• the relevant community has asked us to leave; or
• we lose confidence that our field partner has capacity to implement projects and account for funds.
When we are unable to use funds donated to us for the purposes for which they were raised, we allocate the funds to areas of similar need. We inform our donors of this in general communications about each appeal. Where specific communication is required, the method of communicating depends on the number of donors affected.
We are committed to accountable and transparent financial management and follow strict procedures to ensure funds are used as intended, including annual internal and external audits. In addition to our internal audit process, our accounts are audited by Grant Thornton Audit Pty Ltd. We lodge our audited Annual Financial Statements with ACNC and ACFID and make them available on our website.
Our staff visit our projects periodically and perform quality monitoring in the areas of sustainability, impact, development approach and financial risk monitoring. Regular operational audits ensure that our overseas and local partners adhere to agreed project management standards.
World Vision Australia 030
Annual Report 2017 Progress / Disbursements

Summarised financial report
Extracts from our audited Annual Financial StatementsSet out on the following pages are the following extracted from our Annual Financial Statements for the year ended 30 September 2017:
Declaration by Directors Page 31
Independent Auditor’s Report Page 32
Income Statement Page 35
Statement of Financial Position Page 36
Statement of Changes in Equity Page 37
All amounts are presented in Australian dollars. You can find a full version of our audited Annual Financial Statements for the year ended 30 September 2017 on our website. We will also lodge this with ACNC and ACFID.
Declaration by DirectorsIn accordance with a resolution of the Board of Directors of World Vision Australia, the Directors declare that in their opinion:
(a) There are reasonable grounds to believe that the Company will be able to pay its debts as and when they fall due.
(b) The financial statements and notes set out on pages 12 to 51 have been prepared in accordance with Subdivision 60-C of the Australian Charities and Not-for-profits Commission Act 2012, including:(i) giving a true and fair view of the Company’s financial position as at 30 September
2017 and of its performance for the year ended on that date; and(ii) complying with Australian Accounting Standards (including the Australian
Accounting Interpretations) and the Australian Charities and Not-for-profits Commission Regulation 2013.
(c) The financial statements and associated records of the Company have been properly kept during the year end 30 September 2017 in accordance with the provisions of the NSW Charitable Fundraising Act 1991, the regulations under this Act and the conditions attached to organisation’s authority. The internal controls exercised by the Company are appropriate and effective in accounting for all income received and applied by the Company from any of its fundraising appeals.
Chair Director
Melbourne, November 2017
World Vision Australia 031
Annual Report 2017 Progress / Summarised financial report

Independent Auditor’s report
To the Members of World Vision Australia
Auditor’s opinionWe have audited the accompanying financial report of World Vision Australia (the “Company”). The report comprises the statement of financial position as at 30 September 2017; the statement of comprehensive income, statement of changes in equity and statement of cash flows for the year then ended; and notes to the financial statements, including a summary of significant accounting policies and the Directors’ declaration.
In our opinion, the financial report of World Vision Australia has been prepared in accordance with Division 60 of the Australian Charities and Not-for-profits Commission Act 2012, including:
a giving a true and fair view of the Company’s financial position as at 30 September 2017 and of its financial performance for the year then ended; and
b complying with Australian Accounting Standards and Division 60 of the Australian Charities and Not-for-profits Commission Regulation 2013.
Basis for auditor’s opinionWe conducted our audit in accordance with Australian Auditing Standards. Our responsibilities under those standards are further described in the Auditor’s responsibilities for the audit of the financial report section of our report.
We believe that the audit evidence we have obtained is sufficient and appropriate to provide a basis for our audit opinion.
Responsibilities of the Directors for the financial reportThe Directors of the Company are responsible for the preparation and fair presentation of the financial report in accordance with Australian Accounting Standards and the ACNC Act. They are also responsible for such internal control as the Directors determine is necessary to enable preparation of the financial report that is free from material misstatement, whether due to fraud or error.
In preparing the financial report, the Directors are responsible for assessing the Company’s ability to continue as a going concern. They must disclose, as applicable, matters related to going concern and using the going concern basis of accounting. This applies unless the Directors either intend to liquidate the Company or to cease operations, or have no realistic alternative but to do so.
Those charged with governance are responsible for overseeing the Company’s financial reporting process.
World Vision Australia 032
Annual Report 2017 Progress / Independent Auditor’s report

Auditor’s responsibilities for the audit of the financial reportOur objectives are to obtain reasonable assurance about whether the financial report as a whole is free from material misstatement, whether due to fraud or error, and to issue an auditor’s report that includes our opinion.
Reasonable assurance is a high level of assurance, but is not a guarantee that an audit conducted in accordance with the Australian Auditing Standards will always detect a material misstatement when it exists. Misstatements can arise from fraud or error and are considered material if, individually or in the aggregate, they could reasonably be expected to influence the economic decisions of users taken on the basis of this financial report.
As part of an audit in accordance with the Australian Auditing Standards, we exercise professional judgement and maintain professional scepticism throughout the audit. We also:
• Identify and assess the risks of material misstatement of the financial report, whether due to fraud or error; design and perform audit procedures responsive to those risks; and obtain audit evidence that is sufficient and appropriate to provide a basis for our opinion. The risk of not detecting a material misstatement resulting from fraud is higher than for one resulting from error, as fraud may involve collusion, forgery, intentional omissions, misrepresentations, or the override of internal control.
• Obtain an understanding of internal control relevant to the audit in order to design audit procedures that are appropriate in the circumstances, but not for the purpose of expressing an opinion on the effectiveness of the Company’s internal control.
• Evaluate the appropriateness of accounting policies used and the reasonableness of accounting estimates and related disclosures made by the Directors.
• Conclude on the appropriateness of the Directors’ use of the going concern basis of accounting and, based on the audit evidence obtained, whether a material uncertainty exists related to events or conditions that may cast significant doubt on the Company’s ability to continue as a going concern. If we conclude that a material uncertainty exists, we are required to draw attention in our auditor’s report to the related disclosures in the financial report or, if such disclosures are inadequate, to modify our opinion. Our conclusions are based on the audit evidence obtained up to the date of our audit report. However, future events or conditions may cause the Company to cease to continue as a going concern.
• Evaluate the overall presentation, structure and content of the financial report, including the disclosures, and whether the financial report represents the underlying transactions and events in a manner that achieves fair presentation.
We communicate with those charged with governance regarding – among other matters – the planned scope and timing of the audit and significant audit findings, including any significant deficiencies in internal control that we identify during our audit.
World Vision Australia 033
Annual Report 2017 Progress / Independent Auditor’s report

Report on the requirements of the NSW Charitable Fundraising Act 1991 and the NSW Charitable Fundraising Regulations 2015 and the requirements of the WA Charitable Collections Act (1946) and the WA Charitable Collections Regulations (1947)We have audited the financial report as required by Section 24(2) of the NSW Charitable Fundraising Act 1991 and the WA Charitable Collections Act (1946). Our procedures included obtaining an understanding of the internal control structure for fundraising appeal activities and examination, on a test basis, of evidence supporting compliance with the accounting and associated record keeping requirements for fundraising appeal activities pursuant to the NSW Charitable Fundraising Act 1991, the NSW Charitable Fundraising Regulations 2008, the WA Charitable Collections Act (1946) and the WA Charitable Collections Regulations (1947).
Because of the inherent limitations of any assurance engagement, it is possible that fraud, error or noncompliance may occur and not be detected. An audit is not designed to detect all instances of non-compliance with the requirements described in the above-mentioned acts and regulations. This is because an audit is not performed continuously throughout the period and the audit procedures performed in respect of compliance with these requirements are undertaken on a test basis. The audit opinion expressed in this report has been formed on the above basis.
Auditor’s opinionIn our opinion:
a) The financial report of World Vision Australia has been properly drawn up and associated records have been properly kept during the financial year ended 30 September 2017, in all material respects, in accordance with:i. sections 20(1), 22(1-2), 24(1-3) of the NSW Charitable Fundraising Act 1991; ii. sections 10(6) and 11 of the NSW Charitable Fundraising Regulations 2015;iii. the WA Charitable Collections Act (1946); and iv. the WA Charitable Collections Regulations (1947).
b) The money received as a result of fundraising appeals conducted by the Company during the financial year ended 30 September 2017 has been properly accounted for and applied, in all material respects, in accordance with the above mentioned acts and regulations.
l, Eric Passaris, am currently a member of Chartered Accountants Australia and New Zealand and my membership number is 78720.
Grant Thornton Audit Pty Ltd was the audit firm appointed to undertake the audit of World Vision Australia for the year ended 30 September 2017. I was responsible for the execution of the audit and delivery of our firm’s audit report.
Grant Thornton Audit Pty Ltd Chartered Accountants
E W Passaris Partner – Audit & Assurance
Melbourne, 24 November 2017
World Vision Australia 034
Annual Report 2017 Progress / Independent Auditor’s report
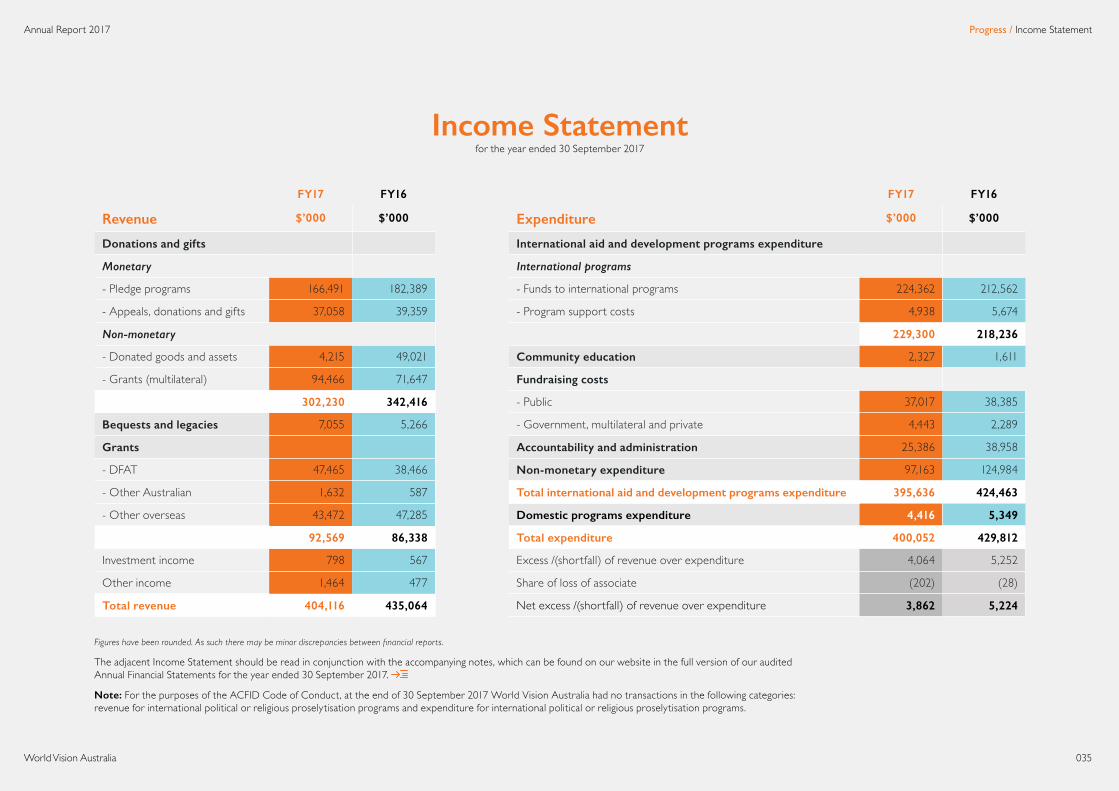
Income Statement for the year ended 30 September 2017
FY17 FY16
Revenue $’000 $’000
Donations and gifts
Monetary
- Pledge programs 166,491 182,389
- Appeals, donations and gifts 37,058 39,359
Non-monetary
- Donated goods and assets 4,215 49,021
- Grants (multilateral) 94,466 71,647
302,230 342,416
Bequests and legacies 7,055 5,266
Grants
- DFAT 47,465 38,466
- Other Australian 1,632 587
- Other overseas 43,472 47,285
92,569 86,338
Investment income 798 567
Other income 1,464 477
Total revenue 404,116 435,064
FY17 FY16
Expenditure $’000 $’000
International aid and development programs expenditure
International programs
- Funds to international programs 224,362 212,562
- Program support costs 4,938 5,674
229,300 218,236
Community education 2,327 1,611
Fundraising costs
- Public 37,017 38,385
- Government, multilateral and private 4,443 2,289
Accountability and administration 25,386 38,958
Non-monetary expenditure 97,163 124,984
Total international aid and development programs expenditure 395,636 424,463
Domestic programs expenditure 4,416 5,349
Total expenditure 400,052 429,812
Excess /(shortfall) of revenue over expenditure 4,064 5,252
Share of loss of associate (202) (28)
Net excess /(shortfall) of revenue over expenditure 3,862 5,224
Figures have been rounded. As such there may be minor discrepancies between financial reports.
The adjacent Income Statement should be read in conjunction with the accompanying notes, which can be found on our website in the full version of our audited Annual Financial Statements for the year ended 30 September 2017.
Note: For the purposes of the ACFID Code of Conduct, at the end of 30 September 2017 World Vision Australia had no transactions in the following categories: revenue for international political or religious proselytisation programs and expenditure for international political or religious proselytisation programs.
World Vision Australia 035
Annual Report 2017 Progress / Income Statement
Statement of Financial Position as at 30 September 2017
FY17 FY16
Assets $’000 $’000
Current assets
Cash and investments 42,600 37,254
Receivables 1,567 1,551
Financial assets 62 596
Inventories 198 203
Donated goods 2,629 1,117
Unrealised currency hedge receivable - -
Total current assets 47,056 40,721
Non-current assets
Investment in Associate 70 272
Property, computer hardware and equipment 19,300 19,805
Intangibles 1,234 2,164
Total non-current assets 20,604 22,241
Total assets 67,660 62,962
FY17 FY16
Current liabilities $’000 $’000
Accounts payable 6,413 5,382
Provisions 5,315 5,590
Unrealised currency hedge payable 6,552 4,510
Total current liabilities 18,280 15,482
Non-current liabilities
Provisions 929 849
Total non-current liabilities 929 849
Total liabilities 19,209 16,331
Net assets 48,451 46,631
Equity
Reserves (6,552) (4,510)
Retained earnings 55,003 51,141
Total equity 48,451 46,631
Figures have been rounded. As such there may be minor discrepancies between financial reports.
The adjacent Statement of Financial Position should be read in conjunction with the accompanying notes, which can be found on our website in the full version of our audited Annual Financial Statements for the year ended 30 September 2017.
World Vision Australia 036
Annual Report 2017 Progress / Statement of Financial Position
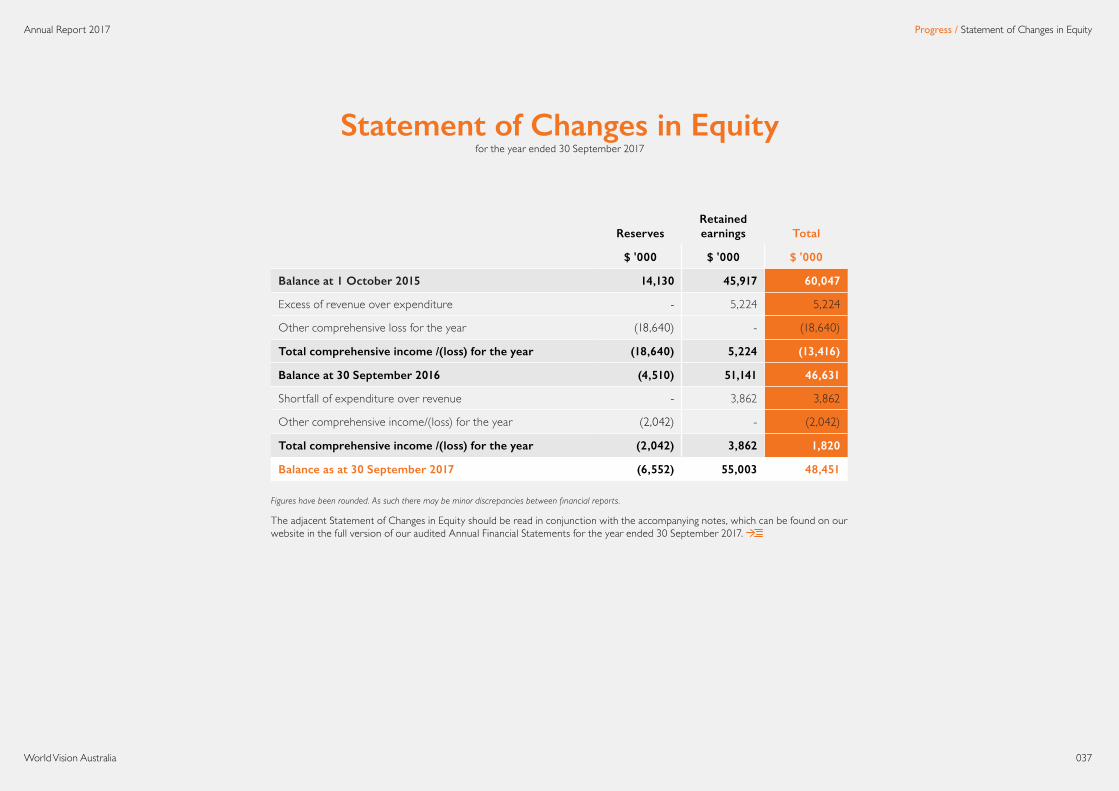
Statement of Changes in Equity for the year ended 30 September 2017
ReservesRetained earnings Total
$ '000 $ '000 $ '000
Balance at 1 October 2015 14,130 45,917 60,047
Excess of revenue over expenditure - 5,224 5,224
Other comprehensive loss for the year (18,640) - (18,640)
Total comprehensive income /(loss) for the year (18,640) 5,224 (13,416)
Balance at 30 September 2016 (4,510) 51,141 46,631
Shortfall of expenditure over revenue - 3,862 3,862
Other comprehensive income/(loss) for the year (2,042) - (2,042)
Total comprehensive income /(loss) for the year (2,042) 3,862 1,820
Balance as at 30 September 2017 (6,552) 55,003 48,451
Figures have been rounded. As such there may be minor discrepancies between financial reports.
The adjacent Statement of Changes in Equity should be read in conjunction with the accompanying notes, which can be found on our website in the full version of our audited Annual Financial Statements for the year ended 30 September 2017.
World Vision Australia 037
Annual Report 2017 Progress / Statement of Changes in Equity
The Campaign for Australian Aid is a joint initiative of the Make Poverty History and Micah Challenge coalitions, for all Australians who believe we can and should do more as a nation to end extreme poverty around the world.
National Office
1 Vision Drive Burwood East VIC 3151 Telephone: (03) 9287 2233 Fax: (03) 9287 2427 Email: [email protected] worldvision.com.au
New South Wales Office
Level 3, 134 William Street Potts Point NSW 2011 Telephone: (02) 9806 6300
Canberra Office
WOTSO WorkSpace Ground Floor 490 Northbourne Avenue Dickson ACT 2602 Telephone: (02) 6102 5502