building partnership with mexico - wilson center partnership with mexico e. anthony wayne career...
TRANSCRIPT

Building Partnership with Mexico
E. Anthony Wayne
Career Ambassador (ret.)
Public Policy Fellow, Wilson Center
@EAnthonyWayne
FAR MD&DC, 02/18

Building a Partnership with Mexico
• U.S.-Mexico ties touch more U.S. lives daily than any other country
via trade, border connections, tourism, and family ties. The same is
true for Mexico.
• An estimated 35 million U.S. citizens are of Mexican heritage.
• Share a 1990-mile border (3,201 km) & adjoining environment.
• In recent years, government-to-government collaboration has been
unprecedented.
Managing a Massive
Relationship

Currency in USD. Source: BEA 2016-2017
US-Mexico Trade
2017 Trade in goods and
services:
US trades over 1 million
per minute with Mexico.
611
Billion
$271 Billion
$340 Billion
US-Mexico Trade
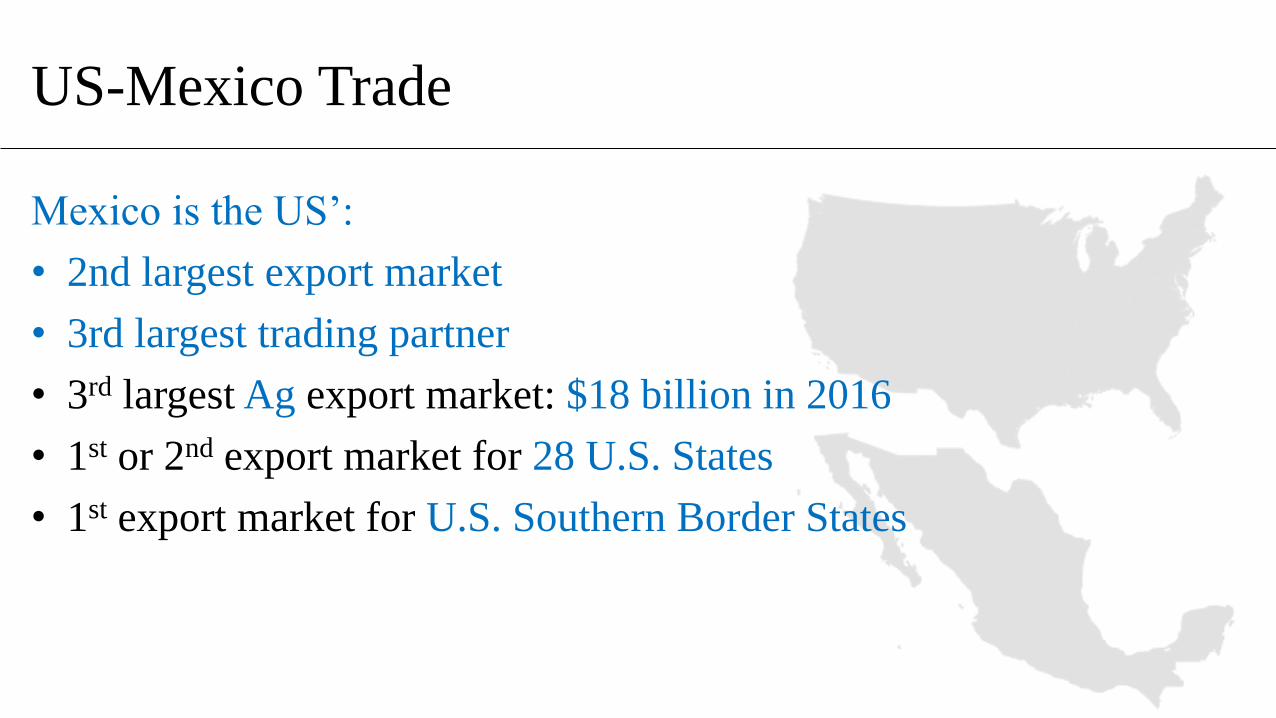
Mexico is the US’:
• 2nd largest export market
• 3rd largest trading partner
• 3rd largest Ag export market: $18 billion in 2016
• 1st or 2nd export market for 28 U.S. States
• 1st export market for U.S. Southern Border States

Source: Bureau of transportation statistics, 2016
Each day there are over
1 million border crossings
US-Mexico Border Crossings
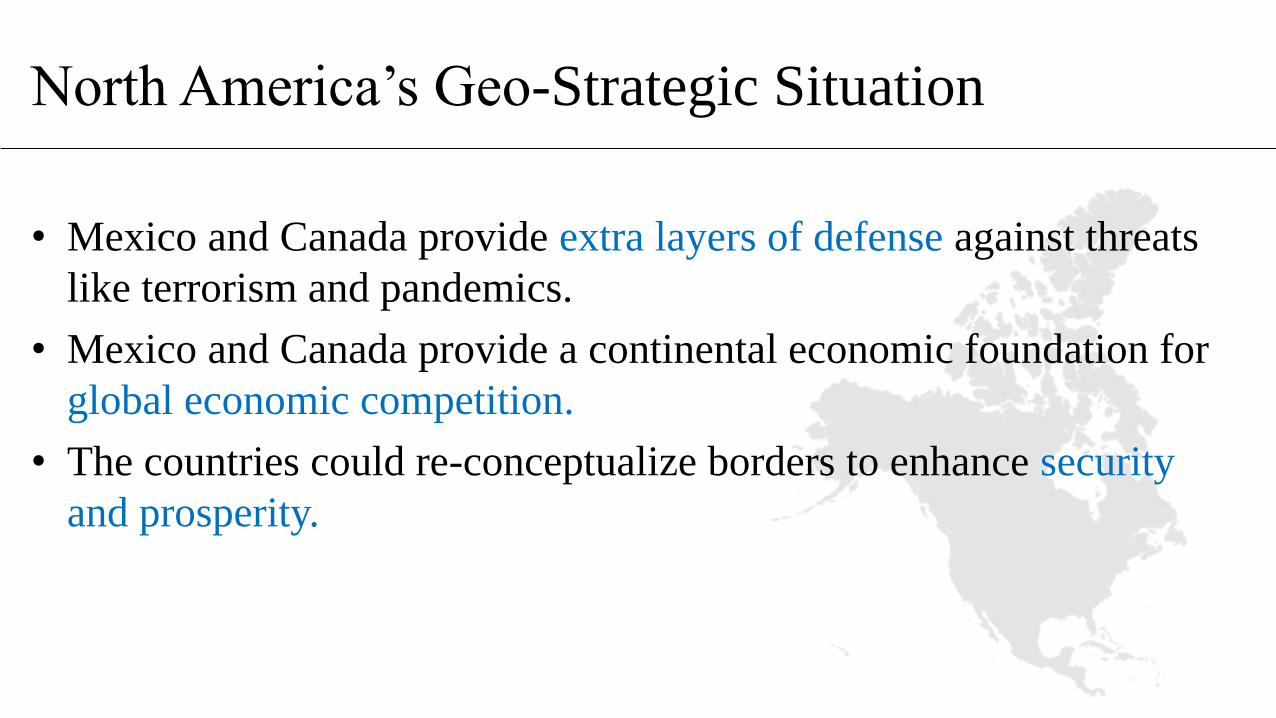
North America’s Geo-Strategic Situation
• Mexico and Canada provide extra layers of defense against threats
like terrorism and pandemics.
• Mexico and Canada provide a continental economic foundation for
global economic competition.
• The countries could re-conceptualize borders to enhance security
and prosperity.

North American
Cooperation
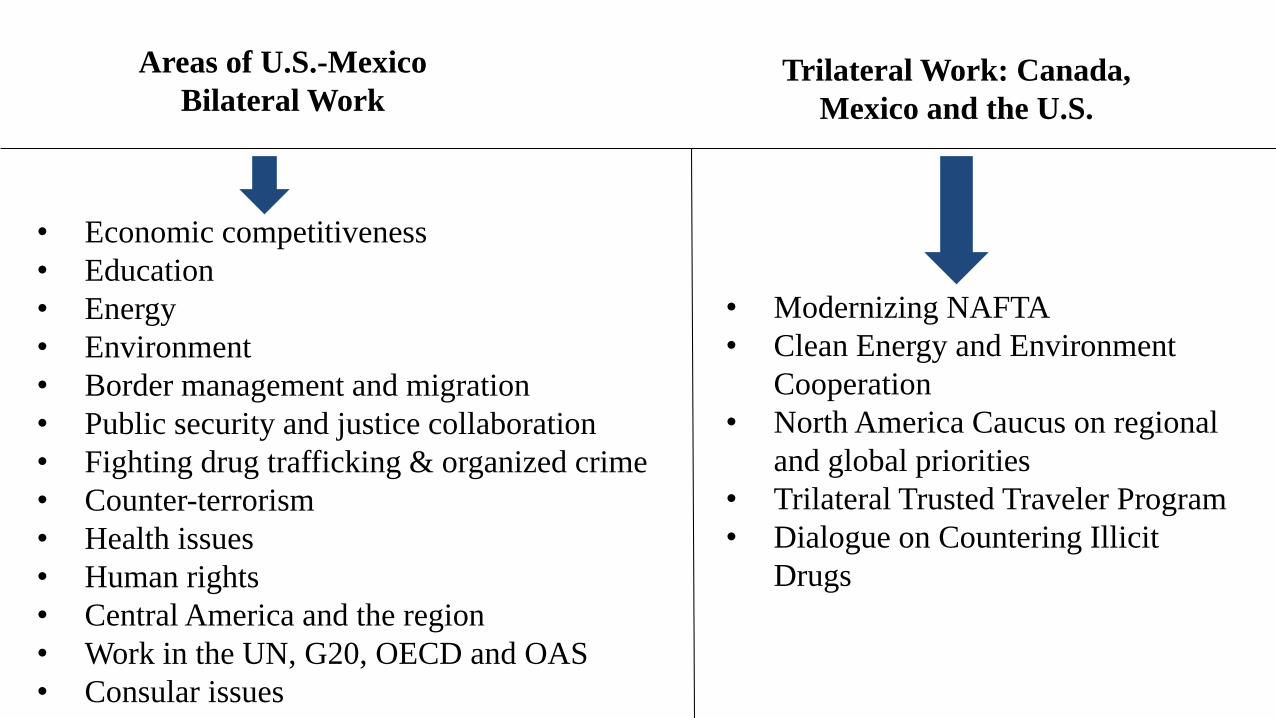
• Economic competitiveness
• Education
• Energy
• Environment
• Border management and migration
• Public security and justice collaboration
• Fighting drug trafficking & organized crime
• Counter-terrorism
• Health issues
• Human rights
• Central America and the region
• Work in the UN, G20, OECD and OAS
• Consular issues
Areas of U.S.-Mexico
Bilateral WorkTrilateral Work: Canada,
Mexico and the U.S.
• Modernizing NAFTA
• Clean Energy and Environment
Cooperation
• North America Caucus on regional
and global priorities
• Trilateral Trusted Traveler Program
• Dialogue on Countering Illicit
Drugs

Building stronger Mexican law
enforcement institutions and
bilateral cooperation
Cross-border criminal networks
U.S. drug demand and organized
crime violence in MexicoIllegal immigration
Potential Terrorism
Corruption
Reducing poverty in
Mexico
Negative public perceptions
Serious Challenges to Address
Modernizing NAFTA
Regional politics and demographics
Economic Security

$0
$200
$400
$600
$800
$1,000
$1,200
$1,400Mexico-Canada Trade U.S.-Canada Trade U.S.-Mexico Trade
4 times larger since 1993
North American Trade in Goods and Services
Source: Secretaria de Economia, 2016; BEA, 2016; Census Bureau, 2016.

North American Trade
• Canada, Mexico and the US trade $1.24 trillion a year, or
• $3.3 billion a day, reflecting major shared production networks.
• More than US trade with all the European Union and 1.9 times
more than with China.
• 14 million US jobs are supported by trade with both neighbors.
Source: Secretaria de Economia, 2016; BEA, 2016; Census Bureau, 2016.
0.0
100,000.0
200,000.0
300,000.0
400,000.0
500,000.0
600,000.0
700,000.0
1994
1995
1996
1997
1998
1999
2000
2001
2002
2003
2004
2005
2006
2007
2008
2009
2010
2011
2012
2013
2014
2015
2016
Total goods
Total services
35% Since 2010
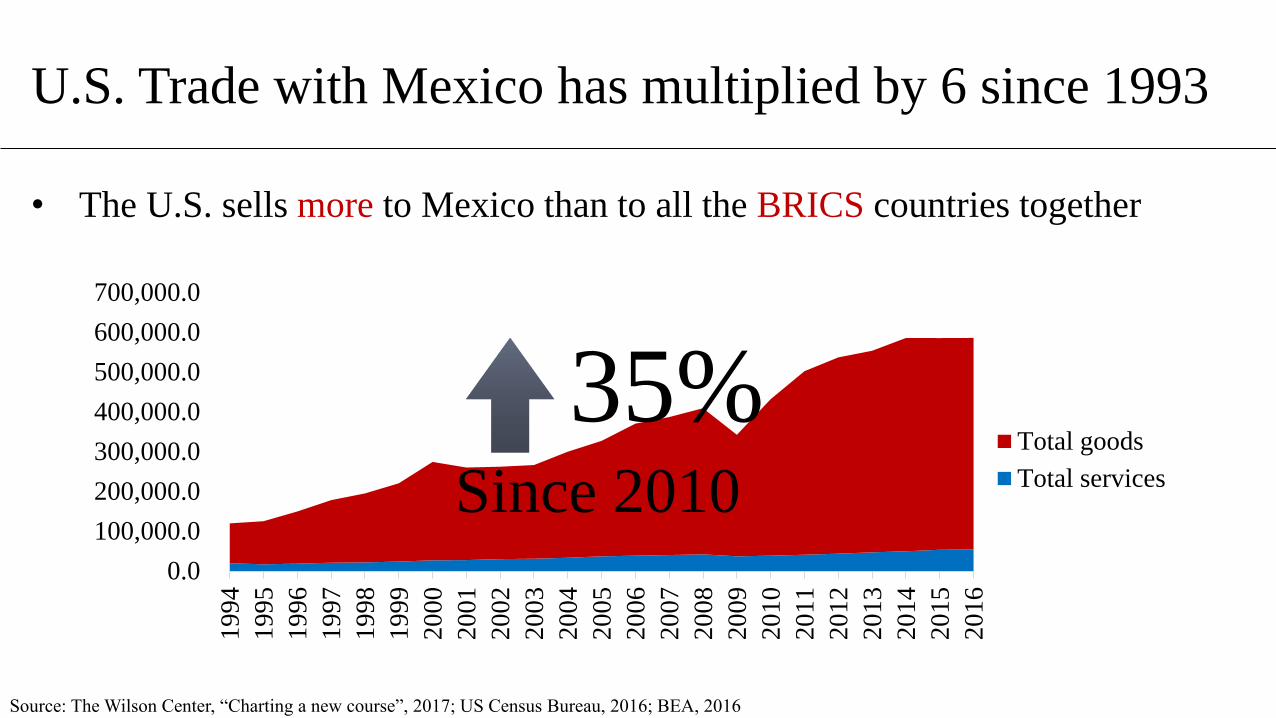
• The U.S. sells more to Mexico than to all the BRICS countries together
Source: The Wilson Center, “Charting a new course”, 2017; US Census Bureau, 2016; BEA, 2016
U.S. Trade with Mexico has multiplied by 6 since 1993

Rank Order: Top US States’ Trade with Mexico 2015
StateVolume $USD
(Billions)State
Volume $USD
(Billions)
Texas 174 Indiana 9.3
California 71.6 Florida 8.6
Michigan 61 Pennsylvania 7.7
Illinois 21.2North
Carolina7.6
Arizona 15.7 Kentucky 7.4
Ohio 14.5 New Jersey 7.3
Tennessee 11.7 Louisiana 6.8
Georgia 9.9 New York 6.4
Source: Secretaria de Economia, 2016

Source: BEA, 2017
U.S. Trade Deficit with
Mexico dropped
2.7%as a portion of Total
U.S.-Mexico Trade
between 2010-2016
US Trade in Goods - Deficit
Mexico,
8.9% Canada,
2.1%
European
Union,
19.0%
Japan,
8.6%
China,
47.1%
Others,
11.2%
40%
25%
8%
5% 4% 3% 2% 2% 2% 1%
0%
5%
10%
15%
20%
25%
30%
35%
40%
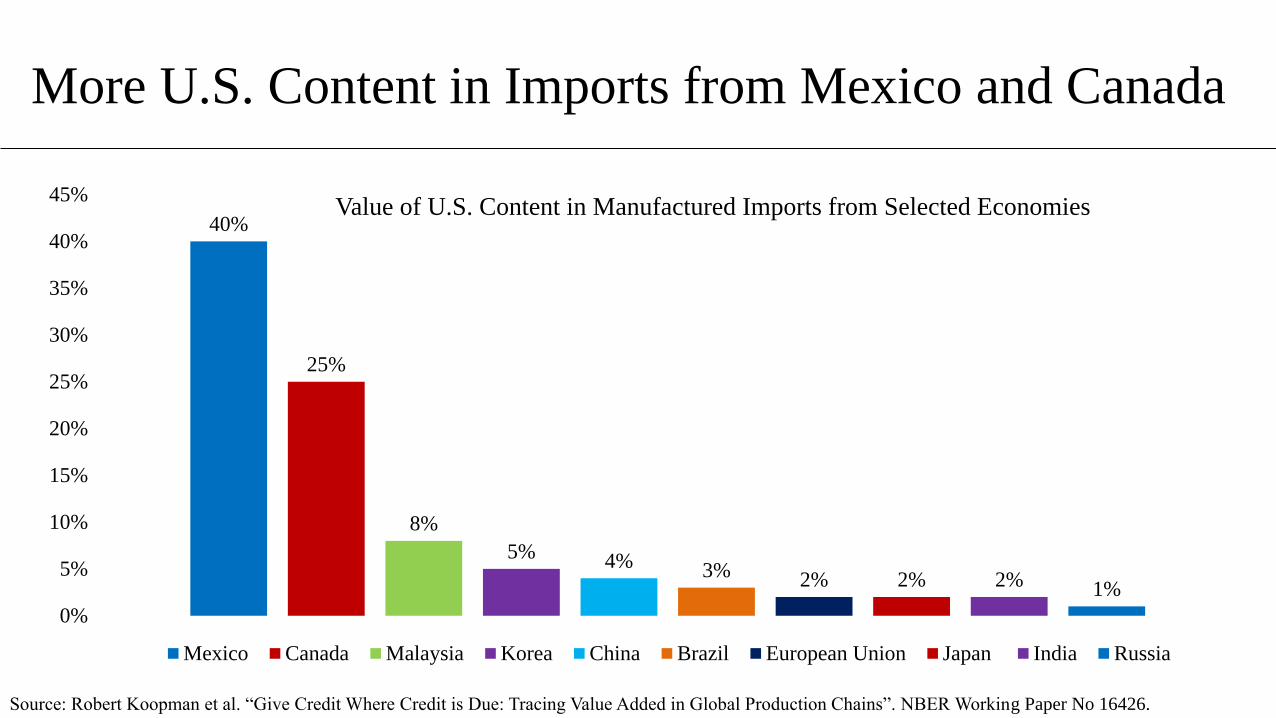
45%Value of U.S. Content in Manufactured Imports from Selected Economies
Mexico Canada Malaysia Korea China Brazil European Union Japan India Russia
Source: Robert Koopman et al. “Give Credit Where Credit is Due: Tracing Value Added in Global Production Chains”. NBER Working Paper No 16426.
More U.S. Content in Imports from Mexico and Canada
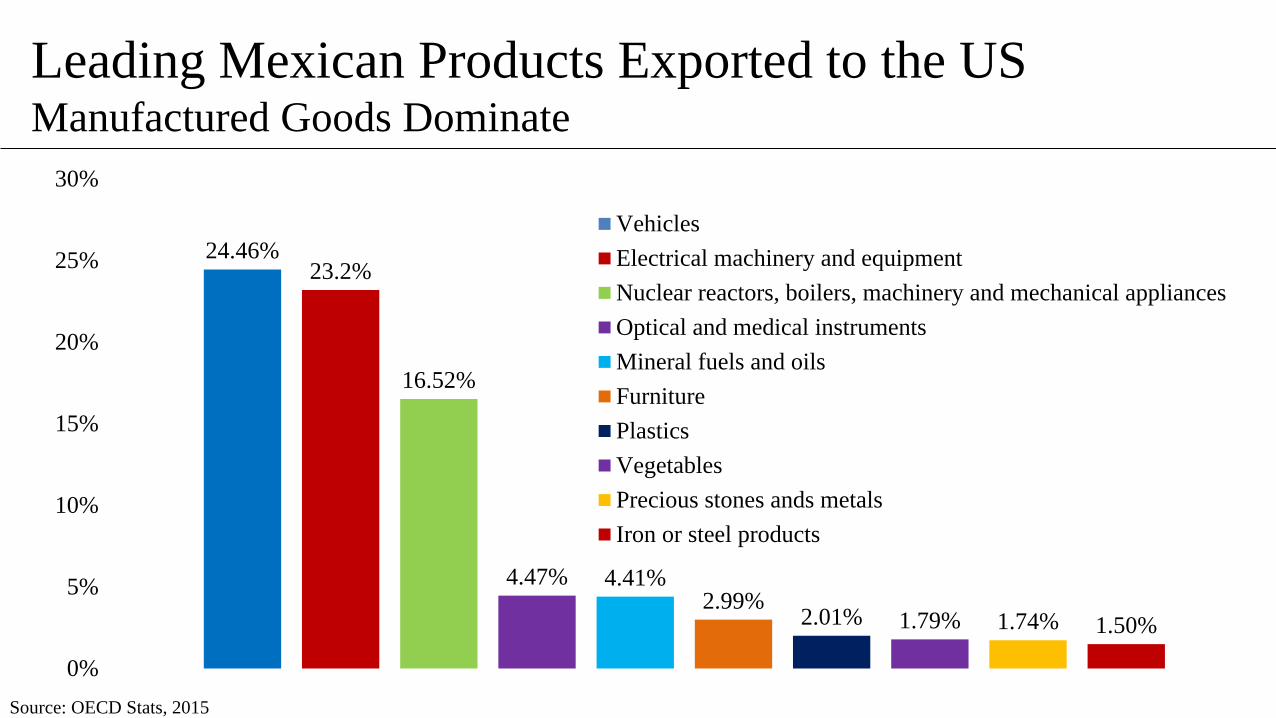
Source: OECD Stats, 2015
24.46%23.2%
16.52%
4.47% 4.41%2.99%
2.01% 1.79% 1.74% 1.50%
0%
5%
10%
15%
20%
25%
30%
Vehicles
Electrical machinery and equipment
Nuclear reactors, boilers, machinery and mechanical appliances
Optical and medical instruments
Mineral fuels and oils
Furniture
Plastics
Vegetables
Precious stones ands metals
Iron or steel products
Leading Mexican Products Exported to the US Manufactured Goods Dominate

Leading U.S. Products
Exported to Mexico
Machinery
Electrical machinery
Vehicles
Mineral fuels
Plastics
$0 $10 $20 $30 $40 $50Billions
Source: Office of the U.S. Trade Representatives , 2016
Corn
Soybeans
Dairy products
Pork & pork products
Beef & beef products
$0 $1 $1 $2 $2 $3Billions
Leading U.S. Agricultural
Products Exported to Mexico

Competition from China2.4 million
New Technology4.7 million
Source: Autor et. Al, 2016; Hicks and Devaraj, 2015
Where have the manufacturing jobs gone?

U.S. Manufacturing Employment and Output

Source: The Wilson Center, 2016; Clinton Administration Statement on the NAFTA, 1993.
Some 5 million US
jobs depend on trade
and investment ties
with Mexico,
compared to an
estimated 700,000
jobs in 1993.
Mexico trade supports some 5 million jobs

U.S.-Mexico and North American Investment
In 2015, Canada’s and
Mexico’s FDI in the US
reached $285 billion
The US had $445 billion
FDI in Canada and
Mexico.
Source: US BEA, data last published on July 25, 2016.

Source: Wilson Center, 2016.
U.S. Jobs Created by Mexican Investment
• Mexican investment supports 123,000 US jobs.
Reforms and Partnership

Mexico’s Major Reforms
• Education
• Telecommunications
• Energy
• Judicial and Law
Enforcement
More partnership with
the U.S.

Energy and the
Environment
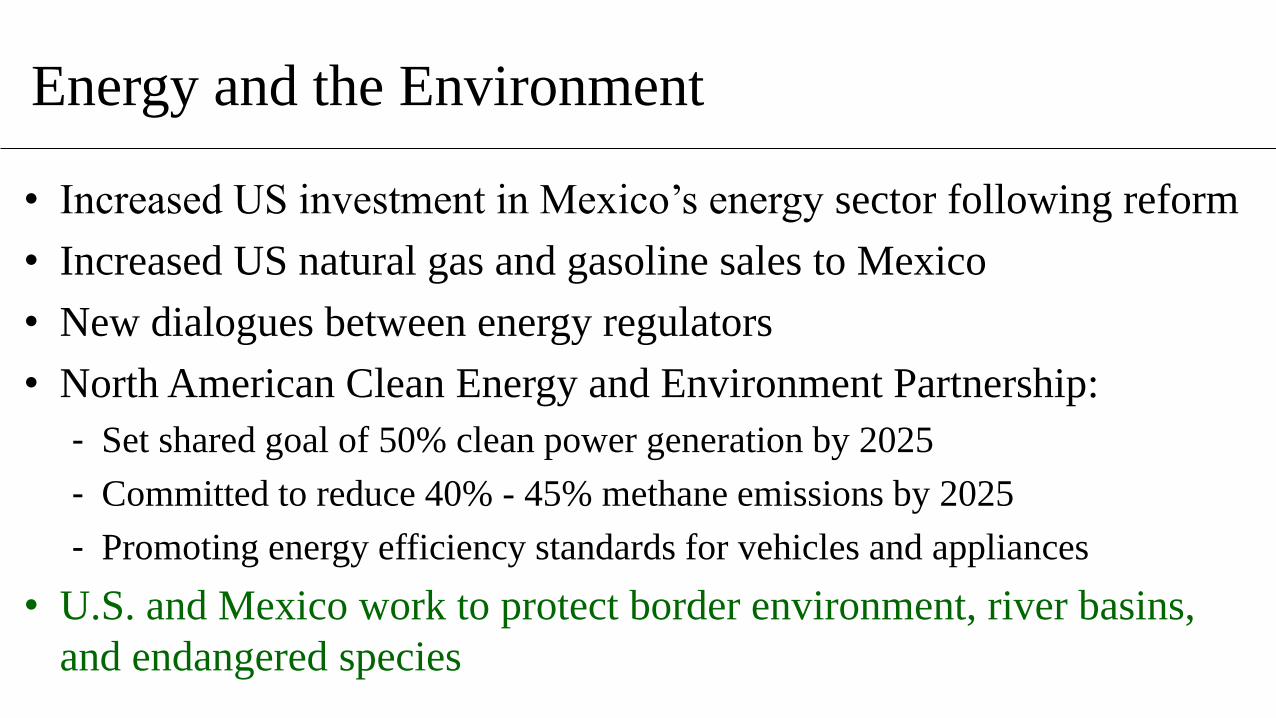
Energy and the Environment
• Increased US investment in Mexico’s energy sector following reform
• Increased US natural gas and gasoline sales to Mexico
• New dialogues between energy regulators
• North American Clean Energy and Environment Partnership:
- Set shared goal of 50% clean power generation by 2025
- Committed to reduce 40% - 45% methane emissions by 2025
- Promoting energy efficiency standards for vehicles and appliances
• U.S. and Mexico work to protect border environment, river basins,
and endangered species

U.S. Energy Trade Surplus with Mexico
8.67
20.25
0
5
10
15
20
25
30
35
40
45
501992
1993
1994
1995
1996
1997
1998
1999
2000
2001
2002
2003
2004
2005
2006
2007
2008
2009
2010
2011
2012
2013
2014
2015
2016
Bil
lion U
SD
Imports Exports
Note: Calculations include crude oil, gasoline and petroleum products
Source: US Census Bureau, 2016
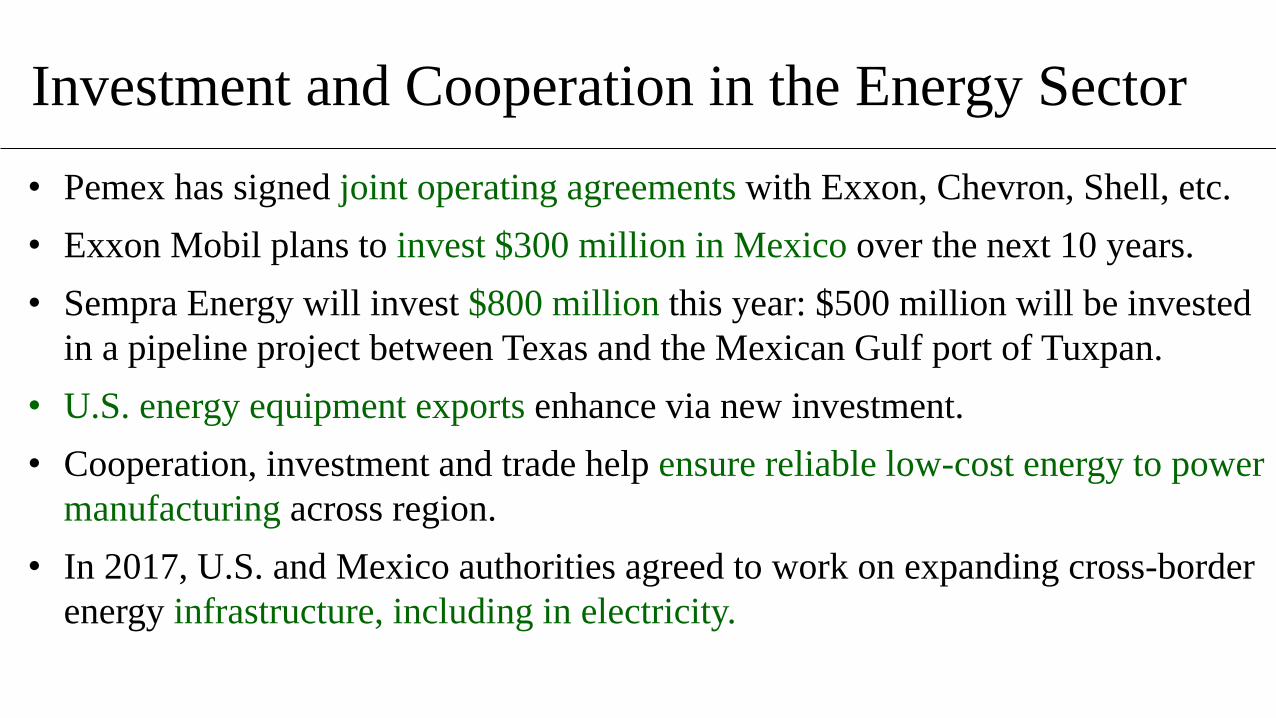
• Pemex has signed joint operating agreements with Exxon, Chevron, Shell, etc.
• Exxon Mobil plans to invest $300 million in Mexico over the next 10 years.
• Sempra Energy will invest $800 million this year: $500 million will be invested
in a pipeline project between Texas and the Mexican Gulf port of Tuxpan.
• U.S. energy equipment exports enhance via new investment.
• Cooperation, investment and trade help ensure reliable low-cost energy to power
manufacturing across region.
• In 2017, U.S. and Mexico authorities agreed to work on expanding cross-border
energy infrastructure, including in electricity.
Investment and Cooperation in the Energy Sector

Border Management Licit
and Illicit Flows
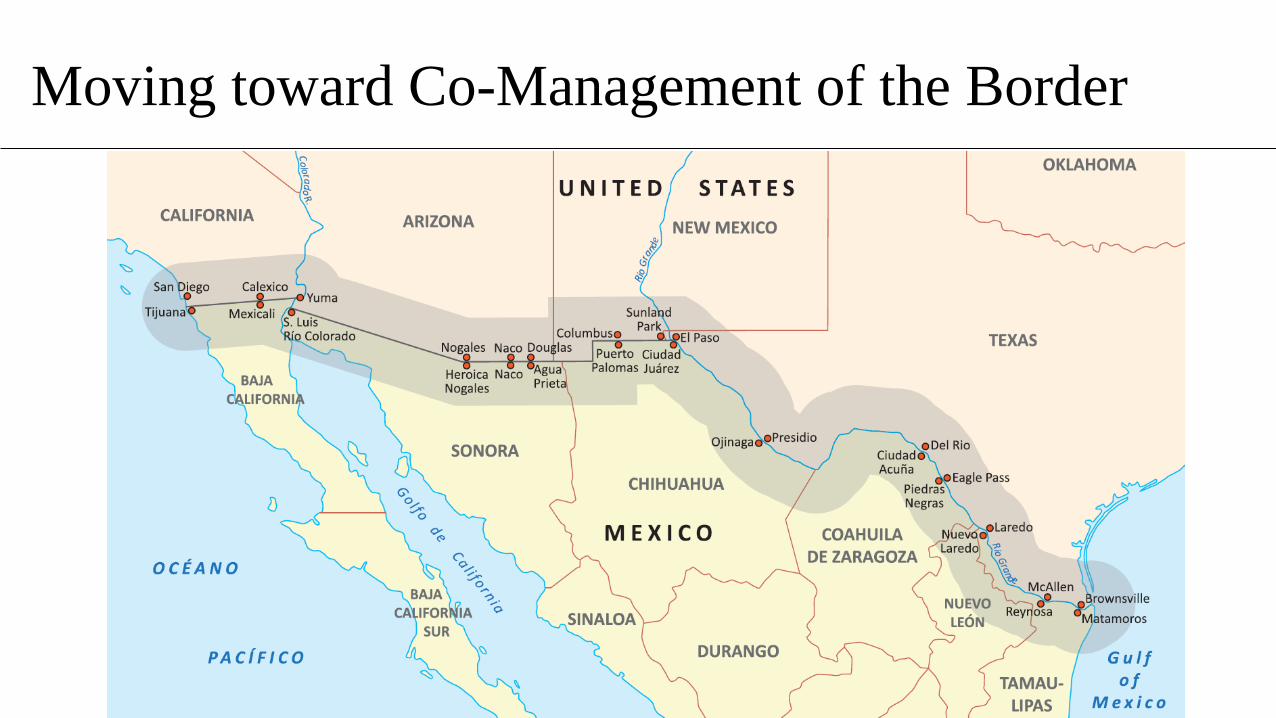
Moving toward Co-Management of the Border

Moving from blame to “shared responsibilities”
• Making the border more open to legitimate travel and commerce.
• Working to align customs regulatory frameworks; increase joint use
of customs facilities on the border.
• New mechanisms to communicate, coordinate and more effectively
counter illicit trade and travel: drugs, guns, money and people.
• Steps to increase security and reduce cross-border violence.
• New programs to share information on potential border crossers,
including via shared border radio-frequency identification system.
• Working to create a Trilateral Trusted Traveler Program.
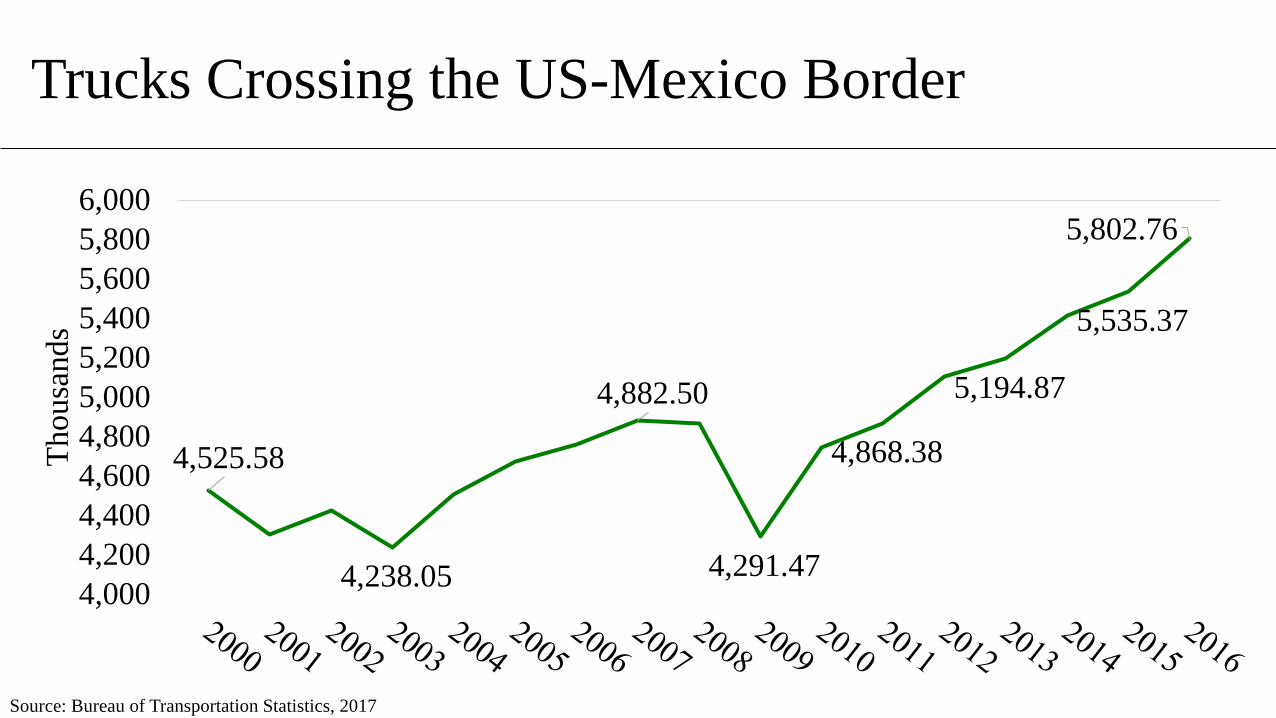
Trucks Crossing the US-Mexico Border
4,525.58
4,238.05
4,882.50
4,291.47
4,868.38
5,194.87
5,535.37
5,802.76
4,000
4,200
4,400
4,600
4,800
5,000
5,200
5,400
5,600
5,800
6,000
Thousa
nd
s
Source: Bureau of Transportation Statistics, 2017

62 35
% WHO OPPOSE/FAVOR BUILDING A WALL
ALONG ENTIRE BORDER WITH MEXICO
Oppose Favor
Source: Pew Research Center Poll, 2017
Border Poll 2017: Border wall to secure border

Source: Ipsos Poll, 2018
Americans’ Views toward Immigration Policy
Total Democrat Republican Independent
Support building a wall along the
US-Mex border38% 18% 68% 32%
Agree that building a wall along the
US-Mex border wastes taxpayer
money
60% 81% 35% 57%
Agree that building a wall along the
US-Mex border is necessary for
national security
35% 20% 61% 29%

Border: Migrant Flows
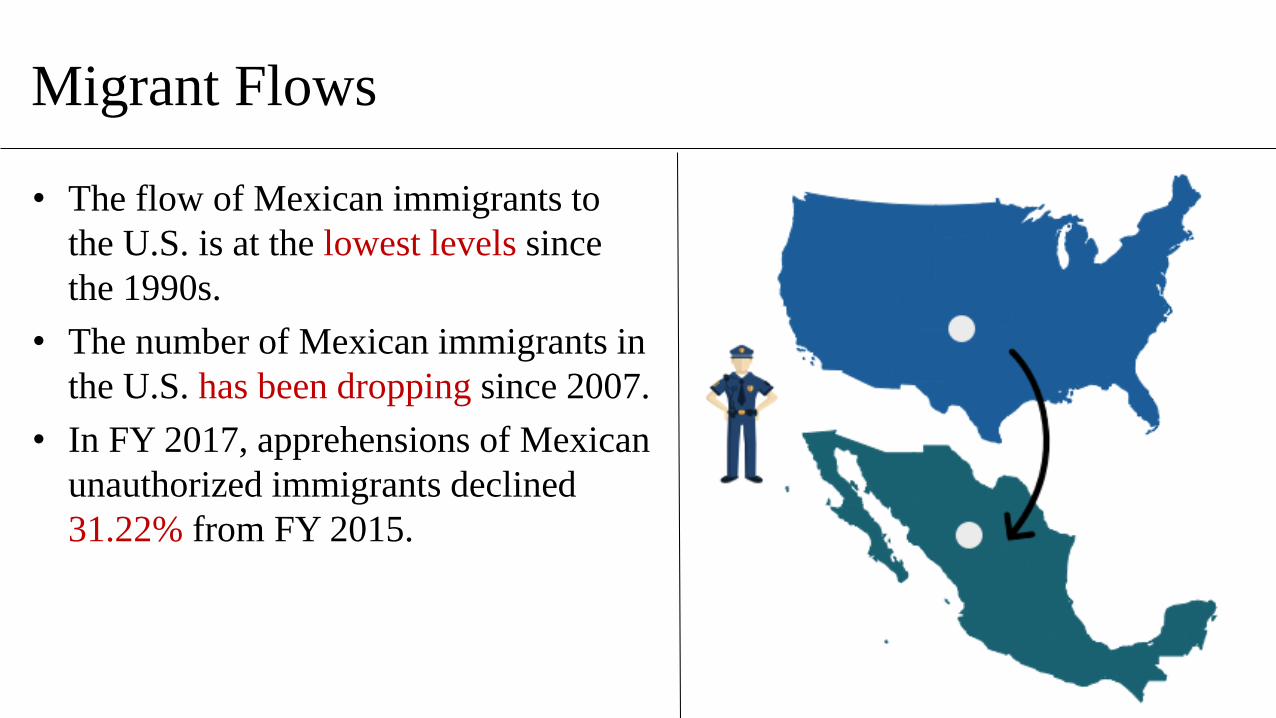
Migrant Flows
• The flow of Mexican immigrants to
the U.S. is at the lowest levels since
the 1990s.
• The number of Mexican immigrants in
the U.S. has been dropping since 2007.
• In FY 2017, apprehensions of Mexican
unauthorized immigrants declined
31.22% from FY 2015.

Source: PEW Research Center, 2016
2
2.9
4.5
6.96.4
5.6
5.6
1.5
2.8
4.1
5.35
5.4
5.7
0
1
2
3
4
5
6
7
8
1990 1995 2000 2007 2009 2015 2016
Mexican Other
Number of Unauthorized Immigrants in the U.S.

670
1,390
1,000
2,940
1,370
870
0
500
1000
1500
2000
2500
3000
95 to '00 05 to '10 09 to '14U.S. to Mexico Mexico to the U.S.
Source: Pew Research, 2017
Net Migration from Mexico
• In 2016, there were 1.3 million less unauthorized Mexican immigrants in
the US than in 2007

Recent Apprehensions

33,723
43,249
31,584
11,125
18,187
22,537
0
5,000
10,000
15,000
20,000
25,000
30,000
35,000
40,000
45,000
50,000
Source: U.S. Border Patrol Monthly Apprehensions (FY 2000 - FY 2017)
USBP Southwest Border Total Apprehensions

Source: Unidad de Politica Migratoria, 2017; CBP Border Security Report FY 2017
*Deportations by Mexico from December 2016 through November 2017
2017 US-Mexico Migrant Apprehensions
Deportations by Mexico
from El Salvador, Guatemala
and Honduras 80,457
Apprehensions by the U.S.
along the Southwest border
from El Salvador, Guatemala
and Honduras 162,891

Helping Northern Triangle

June 15
2017
The United States and Mexico enhanced cooperation on Central America in
response to the 2014 surge of child and family migrants. This includes work at
Mexico’s southern border against smuggling of people and drugs.
In June 2017, the US and Mexico hosted a Conference on Prosperity and Security in
Central America in Miami. Commitments included:• U.S. FY 2018 budget request for $460 million to address economic, security, and
governance challenges in the Northern Triangle (NT).
• NT support for a migration observatory to study and share information on regional
migration flows.
• Agreement to improved information sharing, cooperation and U.S. assistance to
combat transnational criminal organizations.
• $53 million from Mexico for three NT infrastructure projects.
Addressing Central American Migration
Importance of Bilateral
Cooperation Against
Crime

US-Mexico Law Enforcement/Security Cooperation
Mérida Initiative Programs &
Agency-to-Agency Cooperation
Defense Dialogues & Cooperation
Security Coordination Group

1. Disrupting the operational capacity
of organized crime.
2. Institutionalizing reforms to sustain
the rule of law and respect for
human rights in Mexico.
3. Creating a “21st Century Border”.
4. Building strong and resilient
communities.
$2.6 billion appropriated by
the US since 2008.
$1.6 billion already spent on
training and equipment via
over 100 programs to
bolster Mexican capacity.
Mexico has spent over
10 times more.
US-Mexico Mérida Initiative: Evolving
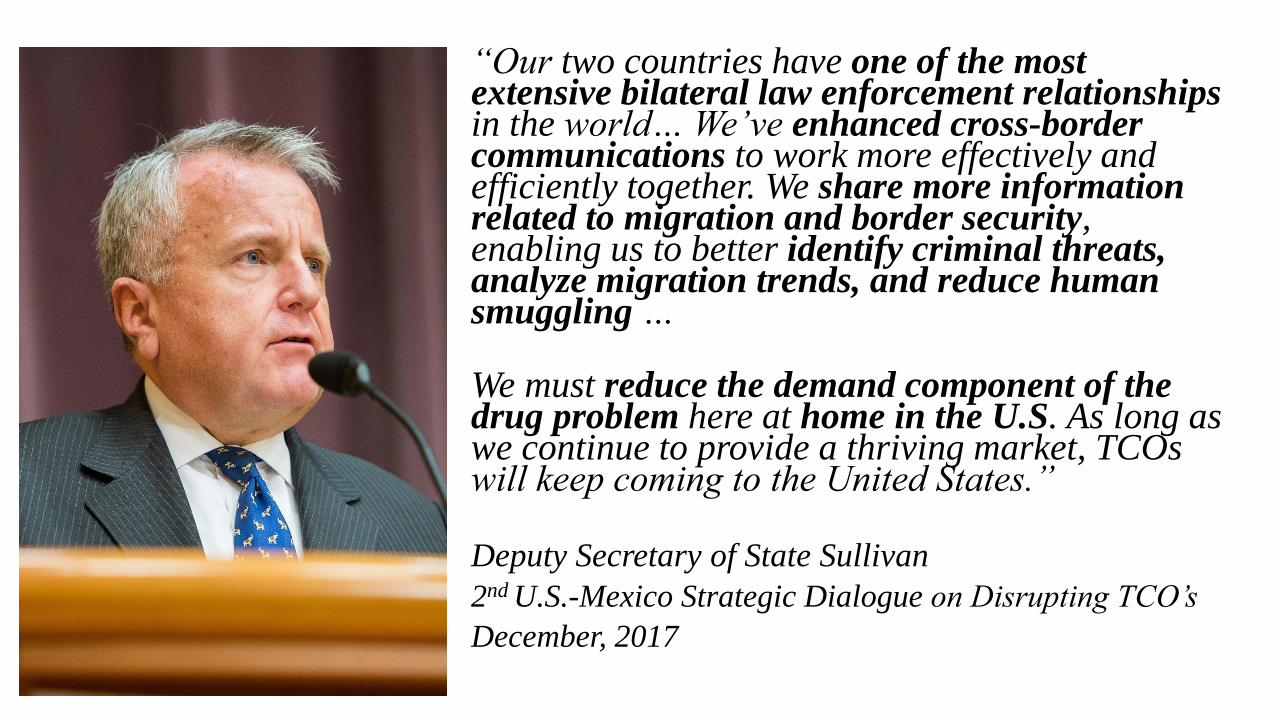
“Our two countries have one of the most extensive bilateral law enforcement relationships in the world… We’ve enhanced cross-border communications to work more effectively and efficiently together. We share more information related to migration and border security, enabling us to better identify criminal threats, analyze migration trends, and reduce human smuggling …
We must reduce the demand component of the drug problem here at home in the U.S. As long as we continue to provide a thriving market, TCOs will keep coming to the United States.”
Deputy Secretary of State Sullivan
2nd U.S.-Mexico Strategic Dialogue on Disrupting TCO’s
December, 2017

“We had a working session to comprehensively deal with the entire business model of TCOs, from supply and production out in the fields to the financial and distribution retail networks in the United States. Only by attacking this chain at every point along the way will we be successful …
In the end, the idea is to trust each other in order to deal with a common problem.”
Secretary of Foreign Affairs Videgaray2nd U.S.-Mexico Strategic Dialogue on Disrupting TCO’s
December, 2017

"Secretary Chong and I will sign a memorandum of cooperation to fully implement the Criminal History Information Sharing Program. Through this program, our U.S. Immigration and Customs Enforcement will be able to provide Mexico with the U.S. criminal history of repatriated Mexicans.
By sharing information and resources and increasing detection and the interdiction of illegal goods, we are combatting the TCOs that threaten the security of all of our communities.
Secretary of Homeland Security Nielsen2nd U.S.-Mexico Strategic Dialogue on Disrupting TCO’s
December, 2017

Opioids Change the Game
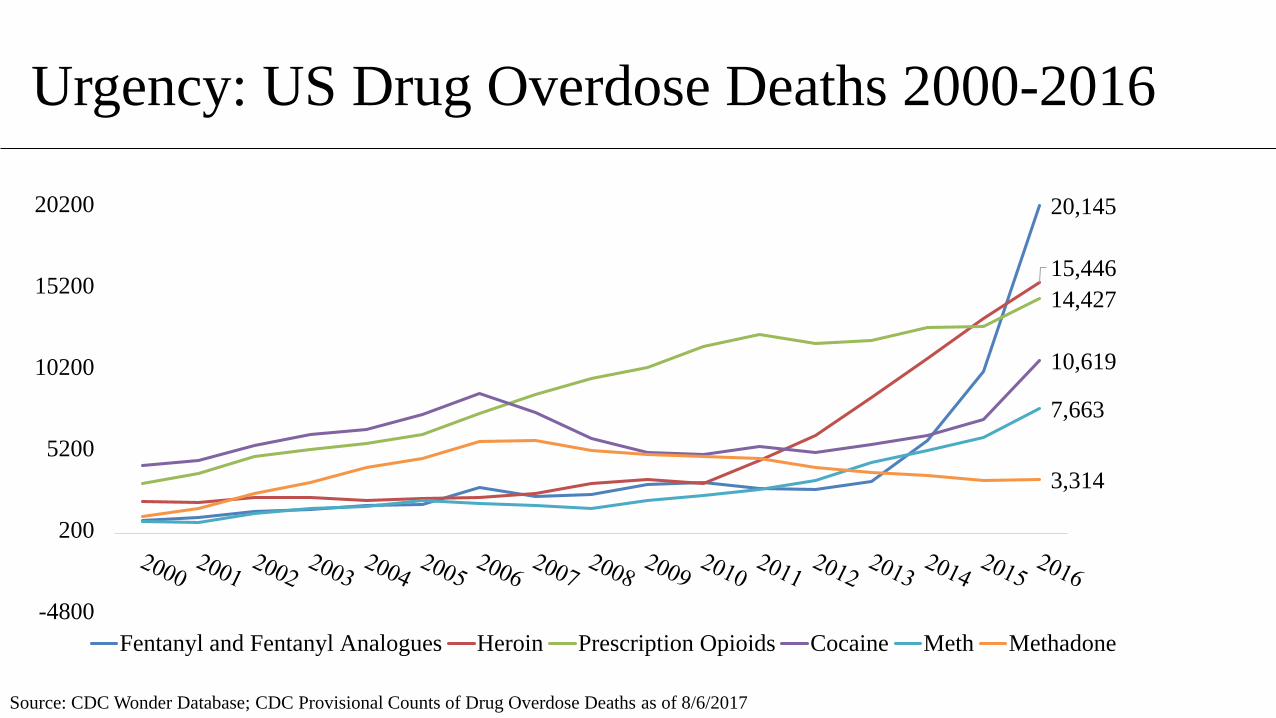
Urgency: US Drug Overdose Deaths 2000-2016
20,145
15,446
14,427
10,619
7,663
3,314
-4800
200
5200
10200
15200
20200
Fentanyl and Fentanyl Analogues Heroin Prescription Opioids Cocaine Meth Methadone
Source: CDC Wonder Database; CDC Provisional Counts of Drug Overdose Deaths as of 8/6/2017

Sources: The Globalist, The White House, CDC.
U.S. Opioid Crisis
• Opium derivatives use: over 5% of the U.S. population in 2013.
• Since 1999, overdose deaths involving opioids has quadrupled.
• Opium and heroin production in Mexico has grown substantially, as
has transshipment of illicit opioids, e.g., Fentanyl, from China.
• In 2016, the U.S. and Mexico launched a working group on drugs
and dismantling criminal networks.
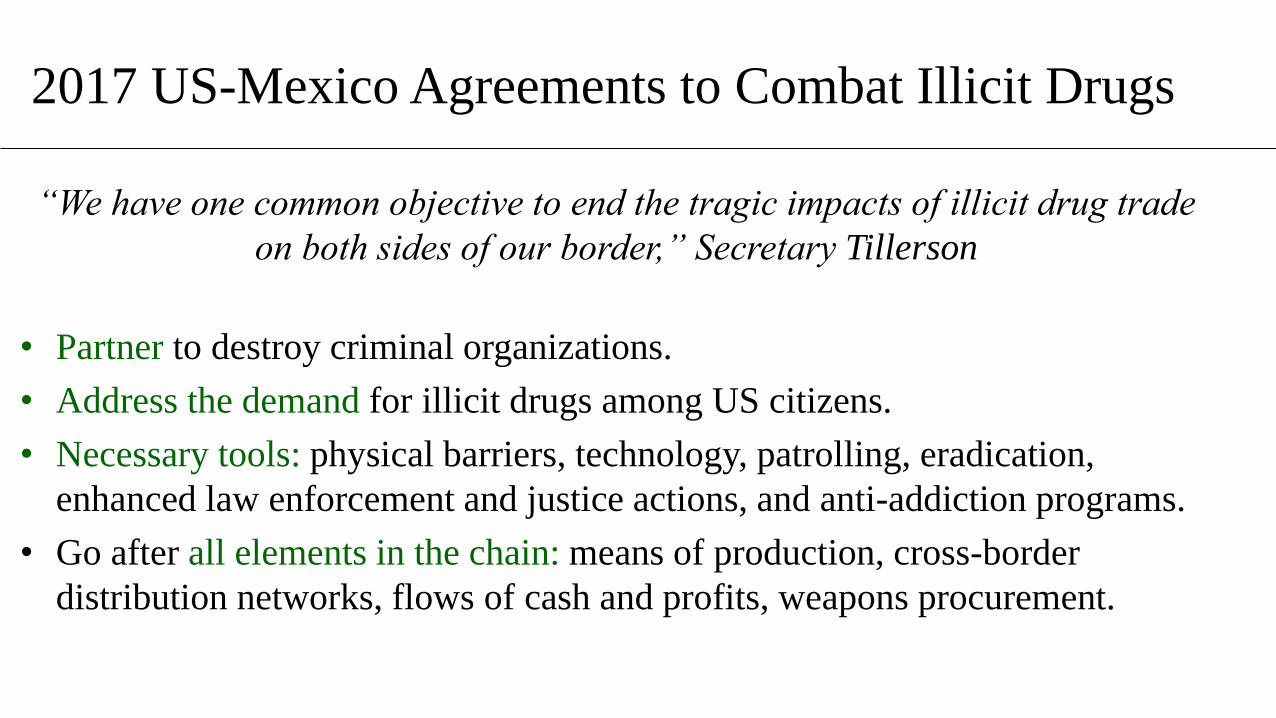
“We have one common objective to end the tragic impacts of illicit drug trade
on both sides of our border,” Secretary Tillerson
• Partner to destroy criminal organizations.
• Address the demand for illicit drugs among US citizens.
• Necessary tools: physical barriers, technology, patrolling, eradication,
enhanced law enforcement and justice actions, and anti-addiction programs.
• Go after all elements in the chain: means of production, cross-border
distribution networks, flows of cash and profits, weapons procurement.
2017 US-Mexico Agreements to Combat Illicit Drugs
Violence up in Mexico:
Mexican Strategy and Tactics?
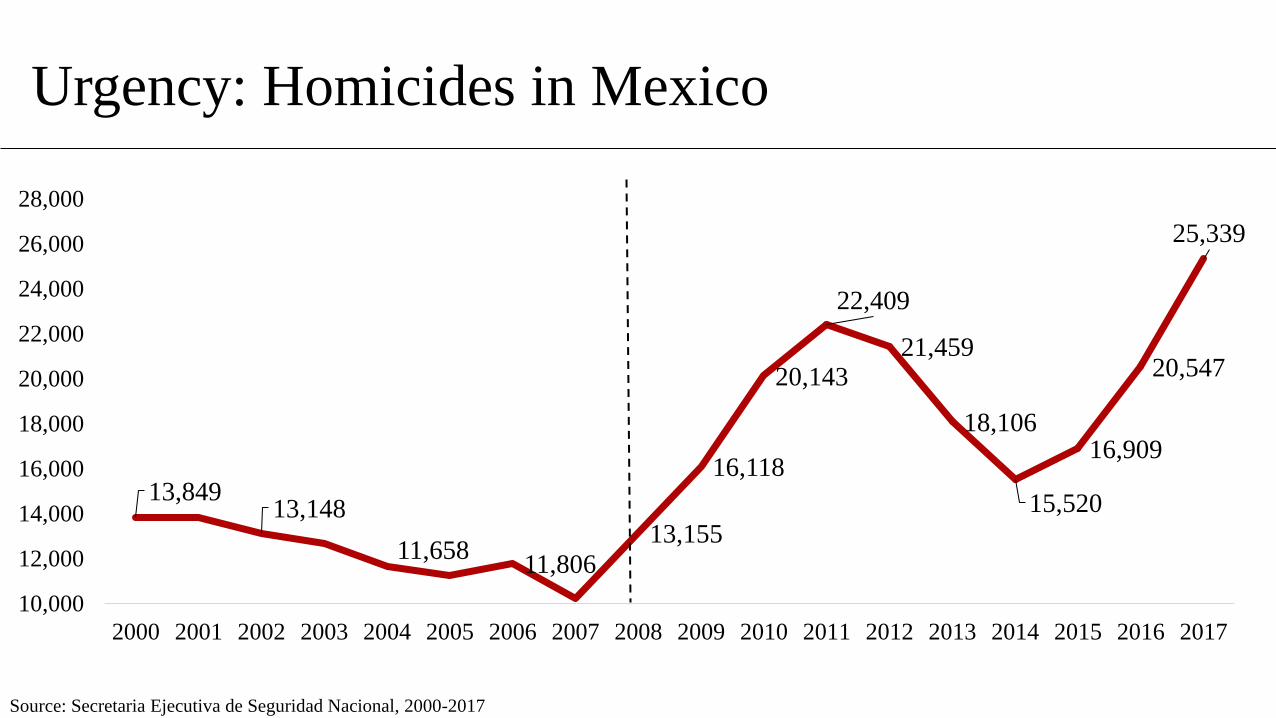
Urgency: Homicides in Mexico
13,84913,148
11,65811,806
13,155
16,118
20,143
22,409
21,459
18,106
15,520
16,909
20,547
25,339
10,000
12,000
14,000
16,000
18,000
20,000
22,000
24,000
26,000
28,000
2000 2001 2002 2003 2004 2005 2006 2007 2008 2009 2010 2011 2012 2013 2014 2015 2016 2017
Source: Secretaria Ejecutiva de Seguridad Nacional, 2000-2017

Urgency: Homicides in Mexico
1400
1600
1800
2000
2200
2400
260025, 339 killings in 2017;
surpassing 2011 (22, 855) as most
violent year since 1997.
October was most violent month
since 1997.
Law enforcement overwhelmed;
cartels fighting; types of crime
expanded; more states affected.
Est. crime cost up to 17.6% GDP.
U.S. travel warning for vacation
spots.
Source: Secretaria Ejecutiva de Seguridad Nacional, 2017; Reuters, 2017; El Pais, 2017.

Perceptions of Bilateral
Relations and NAFTA

Americans’ and Mexicans’ Perceptions of each other
(per cent favorable)
66
3028
33
38
43
48
53
58
63
68
2011 2012 2013 2014 2015 2017
Americans' views of Mexico Mexicans' views of the US
Source: Gallup, 2017; Pew Research Center, 2017.
• In 2017 polling, 66% of Americans had positive views of Mexico; while only
30% of Mexicans had positive views of the US.

US Opinion: Is NAFTA Good for the US Economy?
53
34
71
50
30
35
40
45
50
55
60
65
70
75
2008 2013 2017
%
Overall Republican Democrat Independent
Source: The Chicago Council on Global Affairs
NAFTA Negotiations
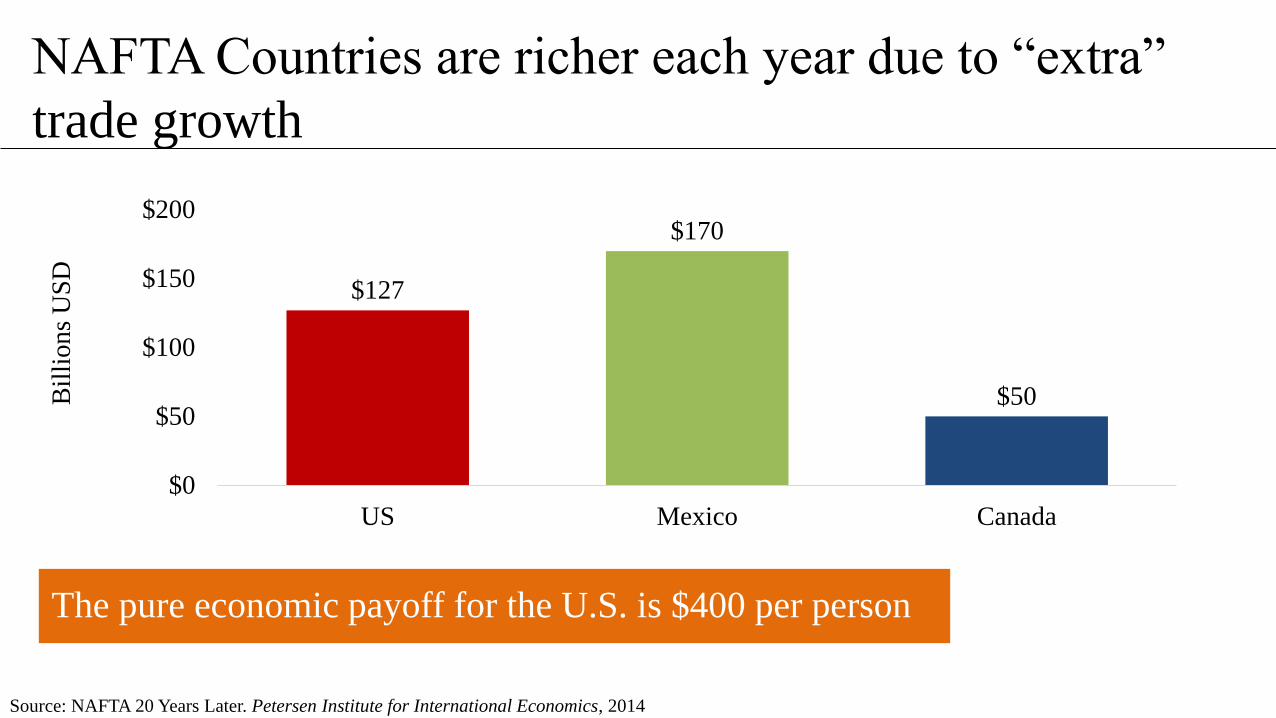
NAFTA Countries are richer each year due to “extra”
trade growth
$127
$170
$50
$0
$50
$100
$150
$200
US Mexico Canada
Bil
lion
s U
SD
Source: NAFTA 20 Years Later. Petersen Institute for International Economics, 2014
The pure economic payoff for the U.S. is $400 per person


NAFTA Modernization Controversial Issues
Controversial topics include:
• Focus on reducing US trade deficit
• Eliminate or weaken dispute settlement provisions in Chapter 19 to preserve United States freedom to enforce rigorously its trade laws
• Eliminate or weaken the Investor-to-State Dispute Settlement (ISDS) mechanism
• Proposals to strengthen rules of
origin and incentives to ensure
greater US sourcing of products
• Five year sunset clause for treaty
• Preserve preferential purchasing
programs such as “Buy America”
and cap Mexican and Canadian
participation
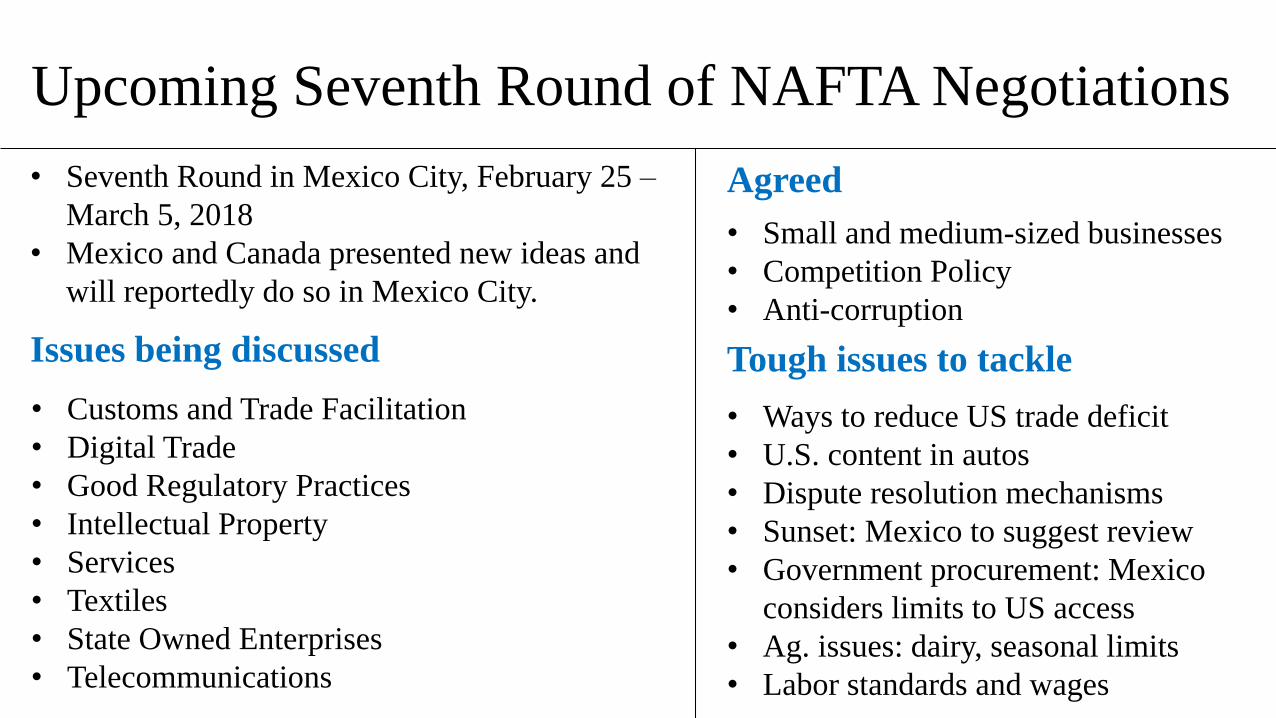
Upcoming Seventh Round of NAFTA Negotiations
Issues being discussed
• Customs and Trade Facilitation
• Digital Trade
• Good Regulatory Practices
• Intellectual Property
• Services
• Textiles
• State Owned Enterprises
• Telecommunications
Tough issues to tackle
• Ways to reduce US trade deficit
• U.S. content in autos
• Dispute resolution mechanisms
• Sunset: Mexico to suggest review
• Government procurement: Mexico
considers limits to US access
• Ag. issues: dairy, seasonal limits
• Labor standards and wages
• Seventh Round in Mexico City, February 25 –
March 5, 2018
• Mexico and Canada presented new ideas and
will reportedly do so in Mexico City.
Agreed
• Small and medium-sized businesses
• Competition Policy
• Anti-corruption

Debate over Rules of Origin
“Based on Trade in Value Added data recently released by the OECD, … between 1995 and 2011, U.S. content of manufactured goods imported from Canada dropped significantly, … for Mexico fell even more.”
“If we don’t fix the rules of origin, negotiations on the rest of the agreement will fail to meaningfully shift the trade imbalance. Our nation’s ballooning trade deficit has gutted American manufacturing, killed jobs and sapped our wealth.”
Secretary of Commerce Ross
September, 2017

Arguments on the Other Side of Rules of Origin
1. An October 2017 study finds that U.S. value added in Mexican exports is higher
than figures Secretary Ross used: 38% U.S. value added for autos and 27% U.S.
value added for Mexican manufacturing exports to the U.S.
2. North America’s decline of value-added in total trade results from China’s
increasing sales to all three markets, with the U.S. having the most Chinese content
in manufactured goods.
3. Yet, U.S. employment in the auto and auto parts sector grew 41% from 2009-2016.
4. Joint production makes the North American auto industry more competitive.
(Germany and Japan do this too.)
5. Canada’s and Mexico’s exports to the U.S. incorporate more U.S. value added than
any other countries in the world! 50% of NAFTA trade is intermediate goods.
6. Boston Consulting Group: changing auto rules of origin could cost 24,000 jobs.
Source: Alonso de Gortari, 2017; Luis de la Calle, 2017; Brookings Metropolitan Policy program, 2016; MEMA/BCG, 2017.
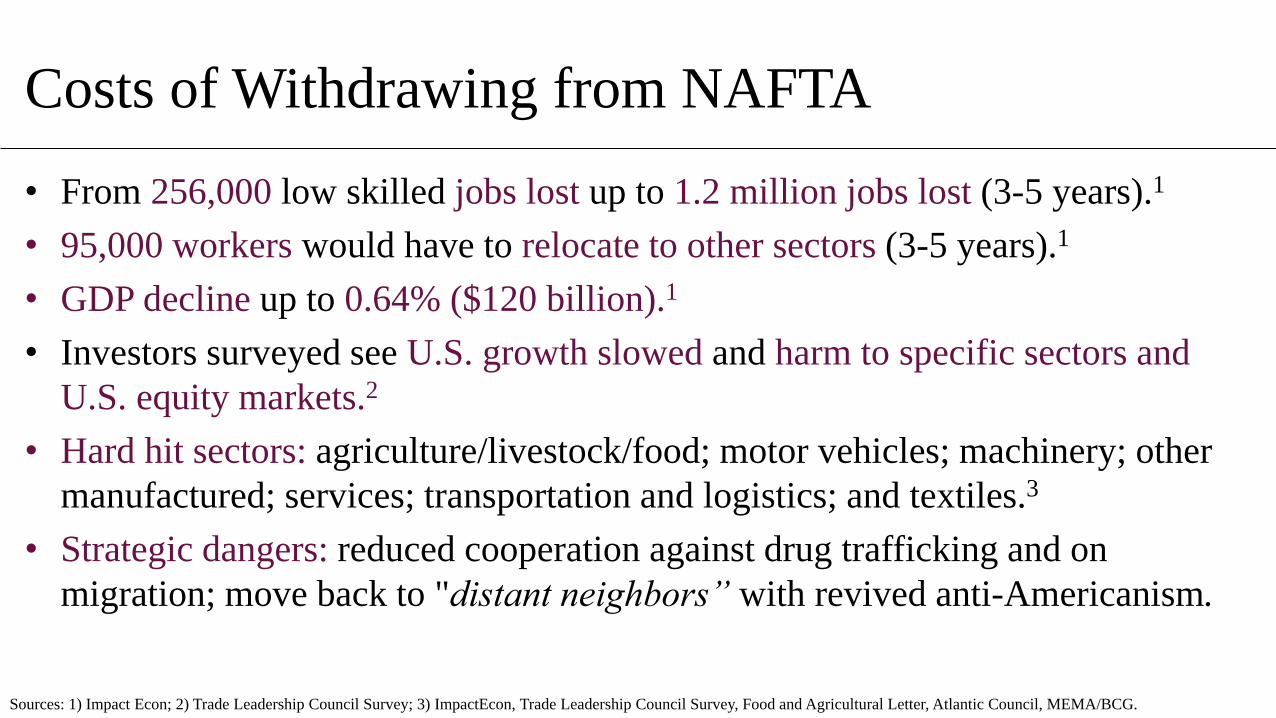
Costs of Withdrawing from NAFTA
• From 256,000 low skilled jobs lost up to 1.2 million jobs lost (3-5 years).1
• 95,000 workers would have to relocate to other sectors (3-5 years).1
• GDP decline up to 0.64% ($120 billion).1
• Investors surveyed see U.S. growth slowed and harm to specific sectors and
U.S. equity markets.2
• Hard hit sectors: agriculture/livestock/food; motor vehicles; machinery; other
manufactured; services; transportation and logistics; and textiles.3
• Strategic dangers: reduced cooperation against drug trafficking and on
migration; move back to "distant neighbors” with revived anti-Americanism.
Sources: 1) Impact Econ; 2) Trade Leadership Council Survey; 3) ImpactEcon, Trade Leadership Council Survey, Food and Agricultural Letter, Atlantic Council, MEMA/BCG.

Mexico’s 2018 Presidential
Election

President Peña Nieto Approval Rating
Source: Consulta Mitofsky, 2017
52 53 57 5650 51 50 51
57 57 57 61 65 61 62 65 6977 76 73 71
35 35 38 4149 48 49 47
41 40 39 36 33 33 32 2924
17 19 22 26
0102030405060708090
Dissapproval Approval

Mexico’s 2018 Elections
• Sunday July 1, 2018
• Almost 88 million will vote for 2,787 local positions and 629 federal level posts in 30 of the 32 states.
- President (6 year term; no reelection).
- 128 Senators (96 chosen by Majority vote & 32 by Proportional Representation for a 6 year term with possible reelection).
- 500 Federal Deputies (300 by Majority vote & 200 chosen under Proportional Representation for a 3 year term with possible reelection).
- 9 Governors (Chiapas, Guanajuato, Jalisco, Morelos, Puebla, Tabasco, Veracruz, Yucatan and the Mayor of Mexico City for 6 year terms with no reelection).
- 982 Local Deputies in 27 State Congresses (3 year term with reelection).
- 1,612 mayors in 25 states (3 year terms with reelection).
Source: The Wilson Center’s Elections Blog, 2017
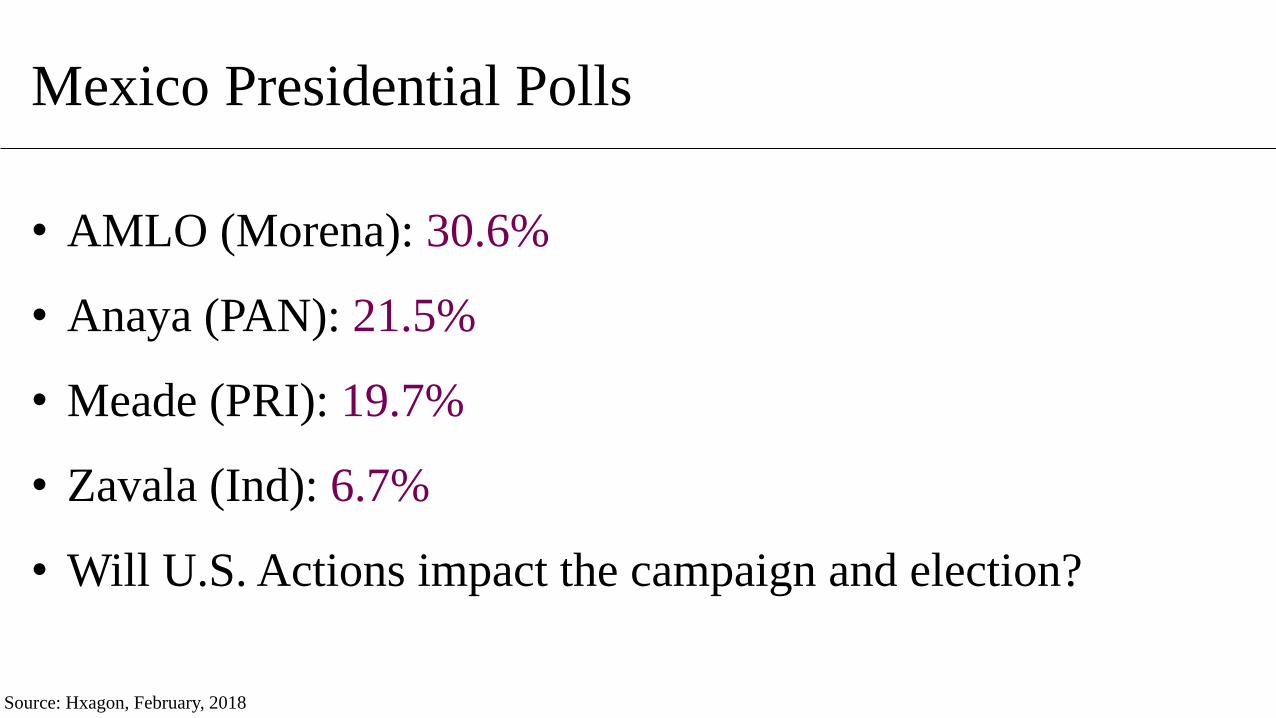
Mexico Presidential Polls
Source: Hxagon, February, 2018
• AMLO (Morena): 30.6%
• Anaya (PAN): 21.5%
• Meade (PRI): 19.7%
• Zavala (Ind): 6.7%
• Will U.S. Actions impact the campaign and election?

Issues that the Mexican Population Care About
Violence and Security
Corruption
UnemploymentPoverty
Economic Crisis
Low Wages
Partnership
with Mexico?

U.S.-Mexico: Tasks Ahead to Build Partnership
Trade: • Successfully complete NAFTA modernization negotiations.
Bilateral Security Cooperation:• Better manage migration and travel issues; intercept terrorists.
• Better fight organized crime, attacking production, distribution, logistics, finance networks, arms smuggling, and addiction/demand.
• Continue to support Central America; partner with others.
• Deepen military-to-military cooperation and partnership.
Improve Competitiveness:• Enhance technology, information sharing and processes to improve security and
facilitation of legitimate trade and travel.
• Invest in programs, including education, to further develop the complimentary nature of the two economies, create jobs and improve global competitiveness.

Building Partnership with Mexico
E. Anthony Wayne
Career Ambassador (ret.)
Public Policy Fellow at the Wilson
Center
@EAnthonyWayne
FAR MD&DC, 02/18