bunge - introduction to ag freight iaom – manila 2012 – andrew
TRANSCRIPT

Bunge - Introduction to Ag Freight
IAOM – Manila 2012 – Andrew Benjamin
Introduction to Ocean Freight
Bunge Propaganda
Demand
Supply (Oversupply)
Calculating Freight / Modes of “Chartering”
Outlook / Risks
2 Bunge Port Facilities

Bunge Ocean Freight Product Line
Headquarter for Bunge Global Freight is Geneva
We also have freight offices in Singapore, Shanghai, Miami and Sao Paolo
FPL manages ALL Dry Ocean Freight flows for the Bunge Group
Bunge has also an active Vegetable Oil and Container Freight presence
Bunge ships about 35 Million Tonnes per annum grains and oilseeds
Bunge ships about 2.5 Million Tonnes per annum of vegetable Oils
Bunge ships about 40,000 TEU Containers per annum
In addition to our own traded cargoes, we transport another 30 Million tonnes per annum of 3rd party cargoes
(Mainly Coal, Iron Ore and fertilizers)
Headcount of 59 persons today (of which 42 in Gva)
On any given day we are operating a fleet in excess of 170 vessels (10 Capes, 90 Panamaxes, 70 Handies)

Bunge presence in Dry Bulk Freight Market
Singapore
7 People
Shanghai
2 Research
Geneva 42 people
Chartering, Risk Mgmt, Research
Operation, Finance & Legal
Miami
3 People
Brazil
5 People
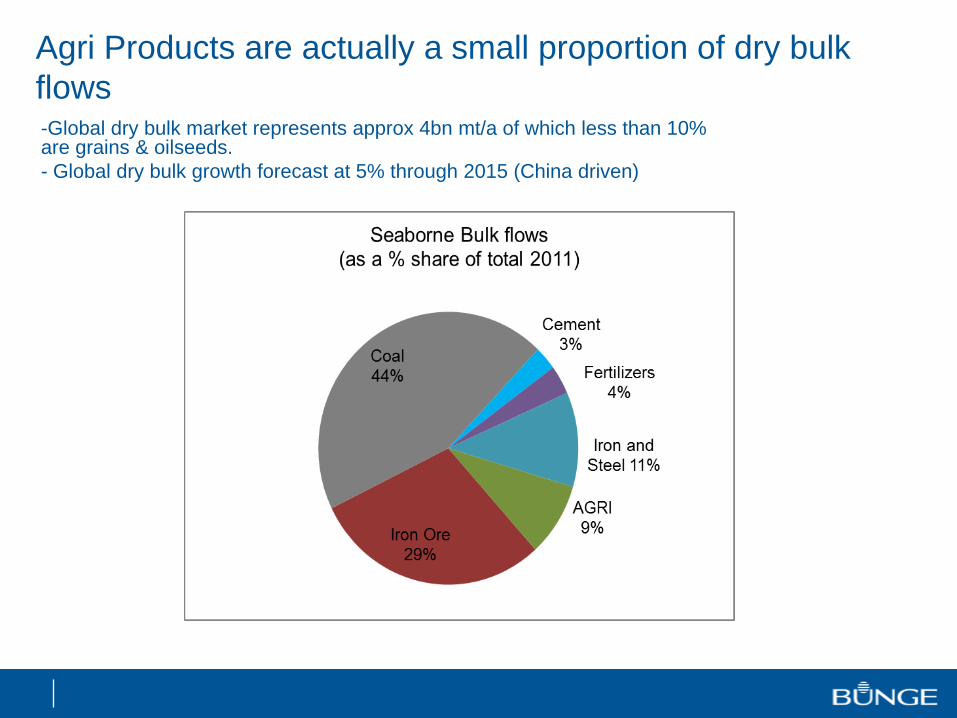
Agri Products are actually a small proportion of dry bulk
flows-Global dry bulk market represents approx 4bn mt/a of which less than 10% are grains & oilseeds.
- Global dry bulk growth forecast at 5% through 2015 (China driven)

Major Dry Bulk Flows
6
Black = Coal
Orange = Iron Ore
Green = Grain
Atlantic
Pacific
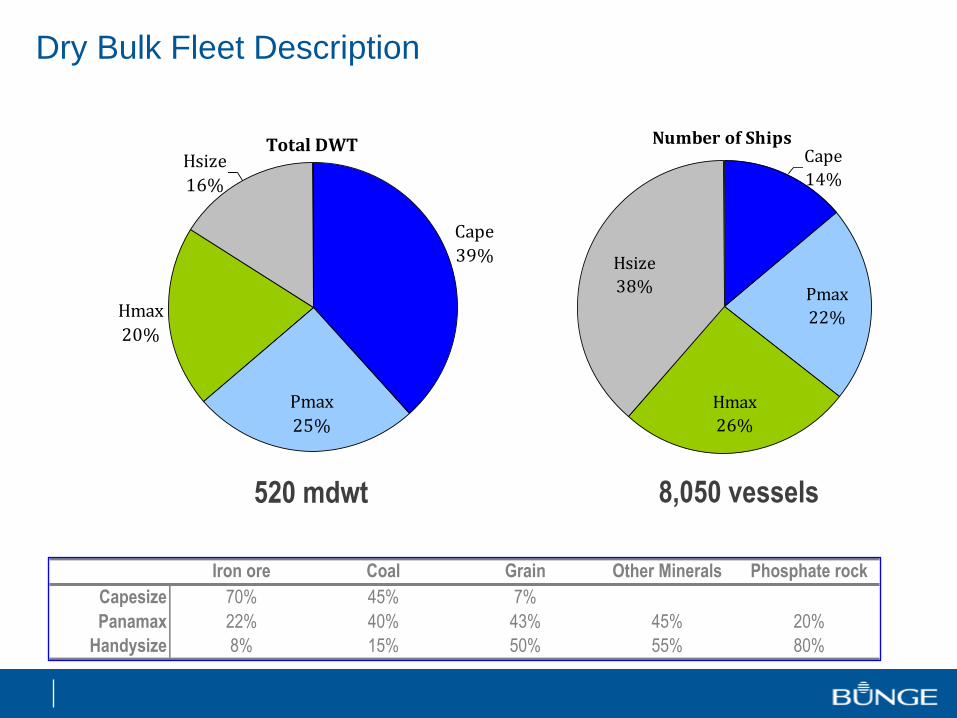
Dry Bulk Fleet Description
Total DWT
Cape
39%
Hmax
20%
Hsize
16%
Pmax
25%
Number of Ships
Hsize
38% Pmax
22%
Hmax
26%
Cape
14%
Iron ore Coal Grain Other Minerals Phosphate rock
Capesize 70% 45% 7%
Panamax 22% 40% 43% 45% 20%
Handysize 8% 15% 50% 55% 80%
520 mdwt 8,050 vessels

Fleet Development (Too many new ships!)
Dry Bulk Freight markets face real pressure due to tonnage over-supply –how did we become so desperate to buy ships ??
0
50000
100000
150000
200000
250000
31/01
/06
30/04
/06
31/07
/06
31/10
/06
31/01
/07
30/04
/07
31/07
/07
31/10
/07
31/01
/08
30/04
/08
31/07
/08
31/10
/08
31/01
/09
30/04
/09
31/07
/09
31/10
/09
31/01
/10
30/04
/10
31/07
/10
31/10
/10
31/01
/11
30/04
/11
31/07
/11
31/10
/11
Cape
pmx

The global fleet make up is shifting to bigger ship sizes
Fleet age profile: Increasingly modern & larger fleet
Handysize sector getting older (scrapping??)
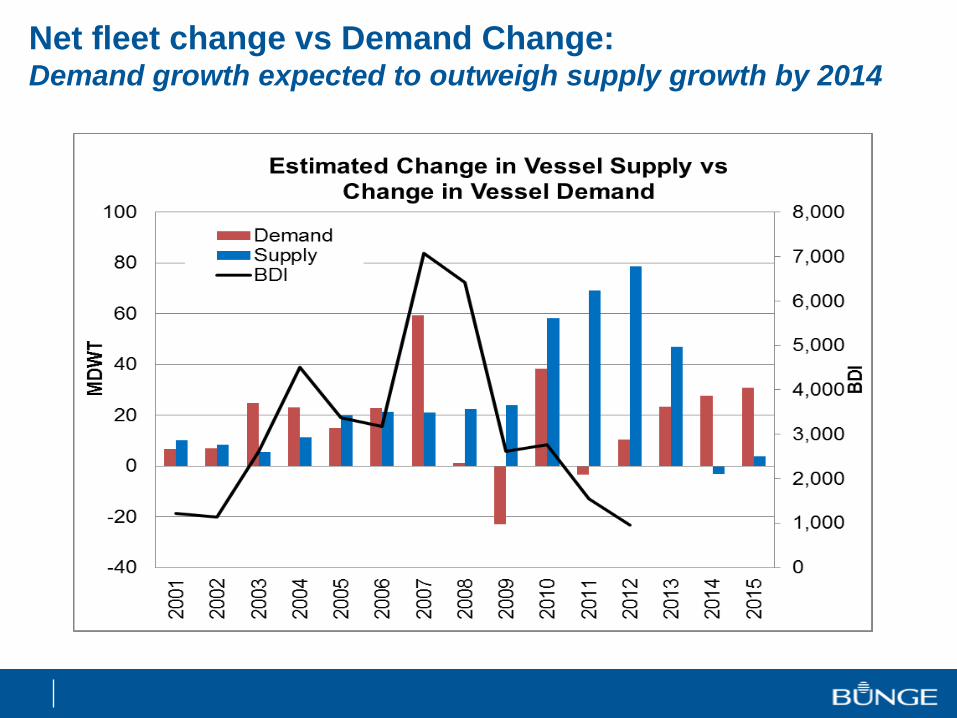
Net fleet change vs Demand Change: Demand growth expected to outweigh supply growth by 2014

Sectoral ship sizes are increasing.
Upstream and downstream port development will follow
Handy (Dwt 20k -> 45k)
Limited Newbuilding program coupled with an already ageing fleet
Supramax :
52k Dwt 58k Dwt 62k Dwt 68k Dwt
Panamax :
68k Dwt 74k Dwt 82k Dwt 90-95k Dwt (Post Pnmx)
Capes :
149k Dwt 161k Dwt 172k Dwt 177-182k Dwt
220k Dwt 400k Dwt (Vale Max)
DWT (DEADWEIGHT) (mts) : Combined weight of cargo, water, bunkers and constant-weights that can be safely
carried by the vessel.

Calculating Freight ($pmt)
Total Voy. Costs / Cargo Quantity = Freight Rate
Total Voyage Costs;
Voy Duration x Daily Hire Rate (Time Charter Rate)
Port and Canal Transit Costs (CRD circa US$250k for 55kmts Wheat)
Cost of Bunkers (Fuel) in mts/day consumed (S’pore currently $680pmt IFO)
Insurance (Gulf of Aden Transit, etc..)
Misc costs (cargo separation, hold cleaning, etc..)
Cargo Quantity;
Type of Cargo, it’s stowage factor (sf)
Cubic Capacity of Vsl
Load and Disport and Canal Transit Draft Restrictions

How are freight rates determined
Voyage Duration is typically inclusive of ;
- Pre ballast to Loadport
- Days at Load and disport
- Laden passage to discharge port
- All calculated in number of days x Time Charter Rate & Daily Fuel
Cost» Fuel : 30mts IFO x $680pmt = $20,500/Day (65% of daily cost)
» Time Pacific Rounds (35% of daily cost)
» Handies : $7k/day
» Supramax : $6k/day
» Pnmx : $4k
Load/Discharge rates
• With time charter levels so low, there is minimal discounts afforded to charterers for
increased discharge rates

Type of shipping contracts
Voyage Charter
Contract between shipowner & charterer for transport of specified amount of commodity from specified loading port(s) to specified discharging port(s) on single vsl/trip.
Shipowner responsible for all the costs
Charterers pays and agreed $/ton rate and settles dem/des with owners.
Time Charter
Charterer hires vessel for specified period of time & assumes commercial control of vessel and pays the owners a $/day rate.
Shipowner responsible for operation and capital costs (maintenance, crew, insurance and finance)
Charterer responsible for all voyage costs. (Fuel, Port Costs, etc)
Contract of Affreightment, CoA
Contract between shipowner & charterer for transport of a specified amount of commodity from a specified loading port(s) to specified discharging port(s) for 2 or more cargoes.
Shipowner responsible for all costs
Charterer pays an agreed $/ton rate and settles dem/des with owners.
One charter party covers numerous cargo shipments
Bareboat charter
Charterer hires the vessel for a very long time, normally the whole economic life of the vessel.
Shipowner responsible for capital costs only
Charterer responsible for all other costs, including ship management (crewing, maintenance, etc…)
Rates are on a $/day basis

SummaryDemand
• Global drybulk trade about 4mmt / year, up by more than 50% over last 10 yrs.
• Bunge moves 60 mln tons of freight per year ~ 1.6% of global flows.
• Coal and iron ore the two most shipped dry bulk commodities.
• Steel industry & power production integral to dry bulk market.
• Grains and oilseeds relatively small volume but important swing factor in market & for sub-Cape sizes.
• Moderate growth principally driven by Asia (and China in particular).
• Global dry bulk demand expected to grow by about 5% per year through 2015.
Supply
• Over 650mdwt of carrying capacity by end-2012, more than 9,000 ships in total
• Fleet growth expected to slow as yards move to higher margin biz and robust scrapping programs in low rate market.
• Age profile of the fleet increasingly modern across the larger sizes.
• Dry bulk fleet to grow >10% in 2012 & average of 4% over the next 5 years.

COUNTER PARTY RISK !!!
Thank You
17 Bunge Port Facilities