burberry group plc - burberry corporate website · burberry group plc reports interim results for...
TRANSCRIPT
Burberry Group plc
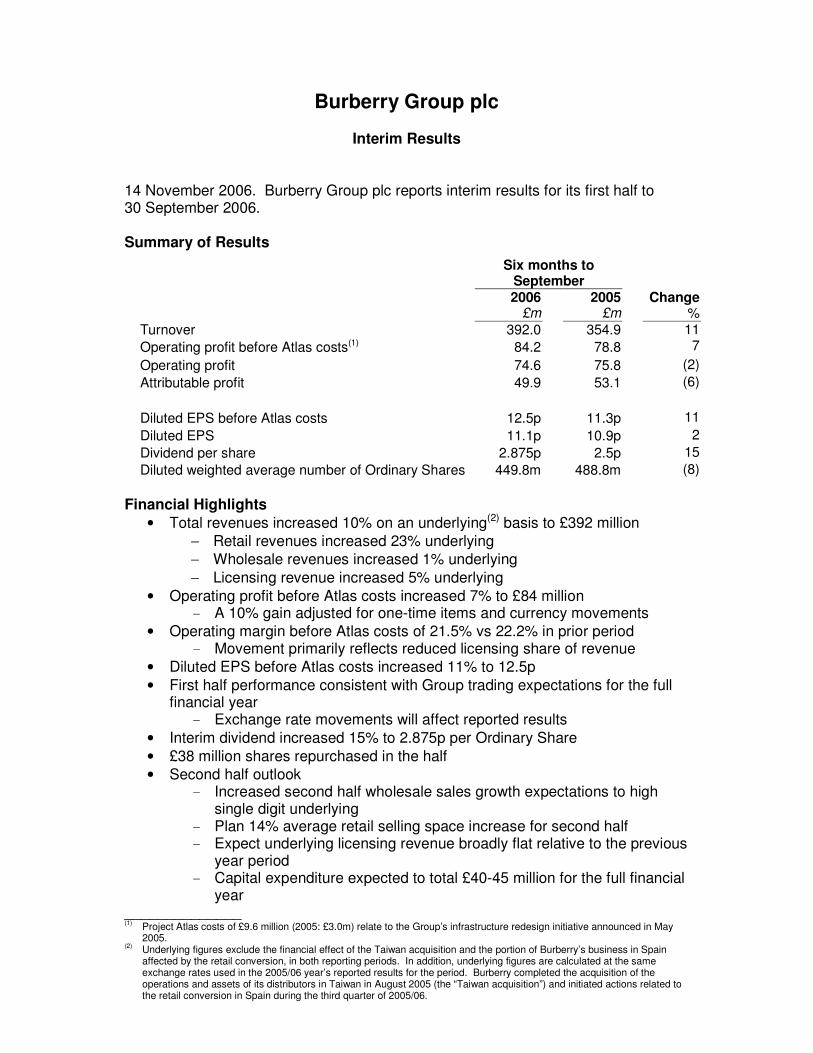
Interim Results 14 November 2006. Burberry Group plc reports interim results for its first half to 30 September 2006. Summary of Results
Six months to September
2006 £m
2005 £m
Change %
Turnover 392.0 354.9 11
Operating profit before Atlas costs(1) 84.2 78.8 7
Operating profit 74.6 75.8 (2)
Attributable profit 49.9 53.1 (6)
Diluted EPS before Atlas costs 12.5p 11.3p 11
Diluted EPS 11.1p 10.9p 2
Dividend per share 2.875p 2.5p 15
Diluted weighted average number of Ordinary Shares 449.8m 488.8m (8)
Financial Highlights
• Total revenues increased 10% on an underlying(2) basis to £392 million
− Retail revenues increased 23% underlying
− Wholesale revenues increased 1% underlying
− Licensing revenue increased 5% underlying
• Operating profit before Atlas costs increased 7% to £84 million - A 10% gain adjusted for one-time items and currency movements
• Operating margin before Atlas costs of 21.5% vs 22.2% in prior period - Movement primarily reflects reduced licensing share of revenue
• Diluted EPS before Atlas costs increased 11% to 12.5p
• First half performance consistent with Group trading expectations for the full financial year
- Exchange rate movements will affect reported results
• Interim dividend increased 15% to 2.875p per Ordinary Share
• £38 million shares repurchased in the half
• Second half outlook - Increased second half wholesale sales growth expectations to high
single digit underlying - Plan 14% average retail selling space increase for second half - Expect underlying licensing revenue broadly flat relative to the previous
year period - Capital expenditure expected to total £40-45 million for the full financial
year ______________ (1)
Project Atlas costs of £9.6 million (2005: £3.0m) relate to the Group’s infrastructure redesign initiative announced in May 2005.
(2) Underlying figures exclude the financial effect of the Taiwan acquisition and the portion of Burberry’s business in Spain
affected by the retail conversion, in both reporting periods. In addition, underlying figures are calculated at the same exchange rates used in the 2005/06 year’s reported results for the period. Burberry completed the acquisition of the operations and assets of its distributors in Taiwan in August 2005 (the “Taiwan acquisition”) and initiated actions related to the retail conversion in Spain during the third quarter of 2005/06.
2
Strategic and Operating Highlights
• Excellent retail progress - Opened six new stores, a replacement store, five concessions and two
outlets - Retail share of revenue increased to 43% from 35% in previous period - Accelerated pace of retail expansion to produce expected 13%
increase in average selling space for the financial year
• Advanced key accessory strategies - Autumn 2006 luxury handbag styles achieving excellent results at retail - Added senior supply chain, design and development talent
• Launched major new men’s fragrance, Burberry London, in August 2006
• Important operational achievements - Project Atlas successfully completed first major SAP implementations
on schedule - Implemented new market calendar - Initiated basic inventory replenishment programme
Angela Ahrendts, Chief Executive Officer, stated, “Led by excellent retail performance, strong outerwear sales and enthusiastic demand for new accessories collections, Burberry delivered a 10% gain in adjusted operating income in the first half. The management team moves confidently into the second half as we continue to execute our strategies, capitalising on front-end strengths, while improving upon back-end challenges, looking to extend this momentum to the full financial year.” Management will discuss these results during a presentation to analysts and institutions at 1:00pm today at Merrill Lynch Financial Centre, The Auditorium, 100 Newgate Street, London EC1A 1HQ (telephone +44 (0) 20 7968 0577). The presentation will also be broadcast live on the Internet at www.burberryplc.com and can be accessed by telephone at +44 (0) 20 7081 7194 (UK and international) and +1 866 432 7186 (US). Replay: +44 (0) 20 8196 1998 and +1 866 583 1035 (US), account number 299766.
3
Enquiries: Burberry 020 7968 0577 Stacey Cartwright CFO Matt McEvoy Strategy and IR John Scaramuzza Strategy and IR Brunswick 020 7404 5959 Susan Gilchrist Laura Cummings Robert Gardener The financial information contained in this announcement has not been audited. Certain statements made in this announcement are forward looking statements. Such statements are based on current expectations and are subject to a number of risks and uncertainties that could cause actual results to differ materially from any expected future results in forward looking statements. This announcement does not constitute an invitation to underwrite, subscribe for or otherwise acquire or dispose of any Burberry Group plc shares. Past performance is not a guide to future performance and persons needing advice should consult an independent financial adviser.

4
Business and Financial Review Business Review Burberry achieved a strong start to its 150th year. First half revenue increased 10% on an underlying basis and diluted EPS before costs associated with Project Atlas increased 11%. Equally important, Burberry advanced several strategic priorities, including brand leveraging, retail expansion, accessory development and operational improvement. Strategic, operating and financial highlights are outlined in the review of Burberry’s 2006/07 first half set out below. Regions. First half activity varied by region.
First Half Retail and Wholesale Revenue by Geographical Market (Destination)
Reported % change Revenue Mix %
(£ million) 2006/07 2005/06 Reported Underlying(2)
2006/07 2005/06
Europe (excluding Spain) 109.9 93.5 18 18 28 26
Spain 74.8 74.5 0 (3) 19 21
North America 81.8 76.0 8 10 21 21
Asia Pacific 75.8 64.9 17 10 19 18
Rest of World 8.9 6.4 39 39 2 2
Total 351.2 315.3 11 10 90 89
Licensing 40.8 39.6 3 5 10 11
Total 392.0 354.9 11 10 100 100
• Europe (excluding Spain). Overall performance across Europe (excluding Spain) was strong in the period. Wholesale demand combined with excellent retail trading to produce an 18% underlying (18% reported) revenue gain. In wholesale, the Italian and German markets demonstrated particular strength relative to the previous year. Retail sales were generally strong throughout the region, boosted by strength at existing locations, with the UK market achieving a double digit gain. Burberry opened one concession and one outlet store in the region during the period
• Spain. Sales in Spain experienced a 3% underlying (0% reported) decline primarily driven by reduced wholesale orders in the specialty store channel. This decline was partially offset by retail gains largely associated with additional selling space. During the half, Burberry continued to refine the operation of its womenswear department store concessions. Also, as part of the objective to enhance Burberry’s brand position in Spain, the Group opened a flagship store in Madrid in August and three accessory concessions during the half.
• North America. The North American market achieved a 10% underlying increase (8% reported). While the Group continues to position the wholesale business for future growth in this market, revenues experienced a moderate decrease in the period primarily due to shipping delays. In retail, new space combined with strong performance at existing stores to produce excellent revenue growth in the period. Burberry opened stores in Atlantic City (New Jersey), Kansas City (Missouri), Northbrook (Illinois) and Hackensack (New
5
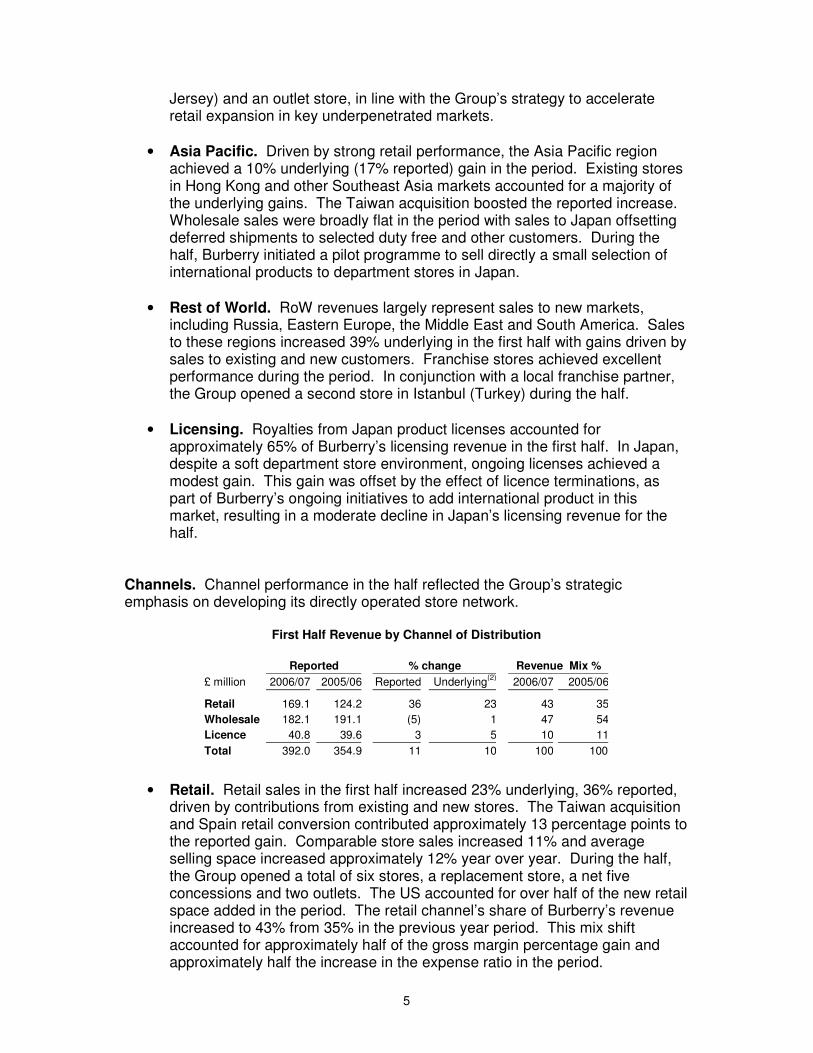
Jersey) and an outlet store, in line with the Group’s strategy to accelerate retail expansion in key underpenetrated markets.
• Asia Pacific. Driven by strong retail performance, the Asia Pacific region achieved a 10% underlying (17% reported) gain in the period. Existing stores in Hong Kong and other Southeast Asia markets accounted for a majority of the underlying gains. The Taiwan acquisition boosted the reported increase. Wholesale sales were broadly flat in the period with sales to Japan offsetting deferred shipments to selected duty free and other customers. During the half, Burberry initiated a pilot programme to sell directly a small selection of international products to department stores in Japan.
• Rest of World. RoW revenues largely represent sales to new markets, including Russia, Eastern Europe, the Middle East and South America. Sales to these regions increased 39% underlying in the first half with gains driven by sales to existing and new customers. Franchise stores achieved excellent performance during the period. In conjunction with a local franchise partner, the Group opened a second store in Istanbul (Turkey) during the half.
• Licensing. Royalties from Japan product licenses accounted for approximately 65% of Burberry’s licensing revenue in the first half. In Japan, despite a soft department store environment, ongoing licenses achieved a modest gain. This gain was offset by the effect of licence terminations, as part of Burberry’s ongoing initiatives to add international product in this market, resulting in a moderate decline in Japan’s licensing revenue for the half.
Channels. Channel performance in the half reflected the Group’s strategic emphasis on developing its directly operated store network.
First Half Revenue by Channel of Distribution
• Retail. Retail sales in the first half increased 23% underlying, 36% reported, driven by contributions from existing and new stores. The Taiwan acquisition and Spain retail conversion contributed approximately 13 percentage points to the reported gain. Comparable store sales increased 11% and average selling space increased approximately 12% year over year. During the half, the Group opened a total of six stores, a replacement store, a net five concessions and two outlets. The US accounted for over half of the new retail space added in the period. The retail channel’s share of Burberry’s revenue increased to 43% from 35% in the previous year period. This mix shift accounted for approximately half of the gross margin percentage gain and approximately half the increase in the expense ratio in the period.
Reported % change Revenue Mix %
£ million 2006/07 2005/06 Reported Underlying(2)
2006/07 2005/06
Retail 169.1 124.2 36 23 43 35
Wholesale 182.1 191.1 (5) 1 47 54
Licence 40.8 39.6 3 5 10 11
Total 392.0 354.9 11 10 100 100
6
• Wholesale. Underlying wholesale sales increased 1%, declining 5% on a reported basis. Production delays in key outerwear styles and a core handbag group coupled with limited ability to respond to reorders constrained growth in the half. Reported wholesale sales were also affected by the Taiwan acquisition and Spain retail conversion.
• Licensing. Total licensing revenue in the first half increased 5% on an underlying basis, 3% reported. Good growth in product licence revenue (approximately 35% of total licensing revenue in the period) was led by fragrances, which benefited from the successful launch of Burberry London for women in spring 2006 and the men’s fragrance in autumn 2006. Watches also continued to demonstrate good momentum in the period. As discussed above, licensing revenue from Japan experienced a moderate underlying decline in the period.
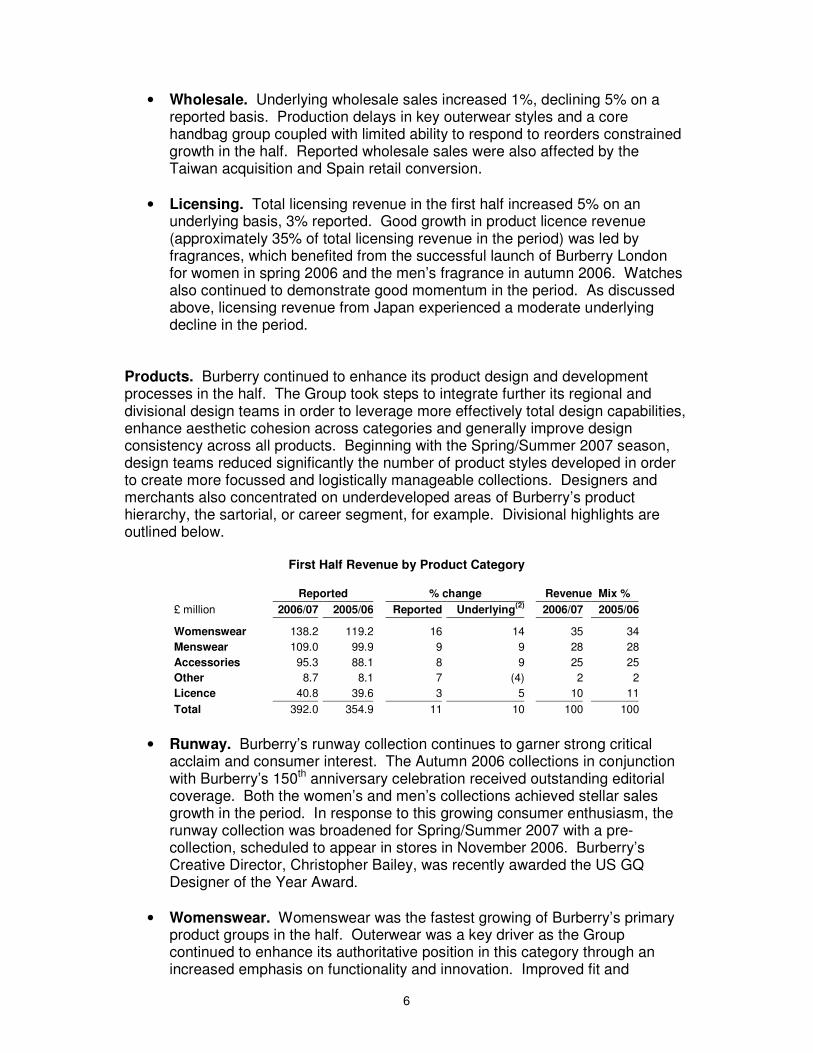
Products. Burberry continued to enhance its product design and development processes in the half. The Group took steps to integrate further its regional and divisional design teams in order to leverage more effectively total design capabilities, enhance aesthetic cohesion across categories and generally improve design consistency across all products. Beginning with the Spring/Summer 2007 season, design teams reduced significantly the number of product styles developed in order to create more focussed and logistically manageable collections. Designers and merchants also concentrated on underdeveloped areas of Burberry’s product hierarchy, the sartorial, or career segment, for example. Divisional highlights are outlined below.
First Half Revenue by Product Category
• Runway. Burberry’s runway collection continues to garner strong critical acclaim and consumer interest. The Autumn 2006 collections in conjunction with Burberry’s 150th anniversary celebration received outstanding editorial coverage. Both the women’s and men’s collections achieved stellar sales growth in the period. In response to this growing consumer enthusiasm, the runway collection was broadened for Spring/Summer 2007 with a pre-collection, scheduled to appear in stores in November 2006. Burberry’s Creative Director, Christopher Bailey, was recently awarded the US GQ Designer of the Year Award.
• Womenswear. Womenswear was the fastest growing of Burberry’s primary product groups in the half. Outerwear was a key driver as the Group continued to enhance its authoritative position in this category through an increased emphasis on functionality and innovation. Improved fit and
Reported % change Revenue Mix %
£ million 2006/07 2005/06 Reported Underlying(2)
2006/07 2005/06
Womenswear 138.2 119.2 16 14 35 34
Menswear 109.0 99.9 9 9 28 28
Accessories 95.3 88.1 8 9 25 25
Other 8.7 8.1 7 (4) 2 2
Licence 40.8 39.6 3 5 10 11
Total 392.0 354.9 11 10 100 100
7
continued attention to transitional product also contributed to the strong performance of the womenswear collection.
• Menswear. Menswear performed well in the half. The continued emphasis on outerwear development led to strong gains in the category. In July, Burberry appointed a new head of menswear with extensive product development and merchandising experience. In operations, the Group took steps to improve the efficiency of product development by integrating efforts across design centres in core product categories.
• Accessories. Performance of Burberry’s new luxury handbags is the accessories highlight of the half. In creating the line for the Autumn/Winter 2006 season, the design and merchandising teams intensified efforts on the top end of the handbag product range, broadening the selection and increasing emphasis on innovation, adding authentic details and modern shapes. An exclusive range of handbags was also designed in celebration of Burberry’s 150th anniversary – the Burberry Icons Collection. As the selling season approached, the Group also enhanced its marketing efforts in support of the collection. Burberry’s stores have experienced outstanding demand for these styles.
Operations. The Group achieved several milestones in its ongoing efforts to enhance operating efficiency and infrastructure.
• Project Atlas. Project Atlas is the cornerstone of Burberry’s efforts to enhance operational effectiveness. During the half, the project tracked to plan and budget. The first major SAP deployments, for UK-based financial and non-stock procurement systems, were successfully accomplished. The next major deployments, which deliver new processes and systems for production planning, manufacturing and procurement, are in process and scheduled for completion in early 2007. Progress continued with respect to the later phases of the programme as well. During the next six to twelve months, Atlas enters its most intensive phase with important SAP deployments in the Group’s core product development operations and key geographical regions. At the same time, implementation of a tactical initiative (prior to full SAP deployment) to allow integrated global visibility of retail sales and inventory information also commenced in the half. With respect to the project’s financial implications for the 2006/07 year, Burberry continues to expect to realise benefits of approximately £6 million and incur expenses of £19 million.
• Specific initiatives. The Group undertook several discrete initiatives during the half to enhance its operational performance. In advance of full Atlas implementation, Burberry initiated a simple basic inventory replenishment programme for the Autumn 2006 season involving a small selection of key styles. The Group also took initial steps to rationalise its supply chain by consolidating sourcing of selected key products. In order to improve the frequency of new product flow to stores and wholesale customers, Burberry formally adjusted its product development calendar to increase the number of collections annually. This resulted in incremental expense in the half with corresponding benefits expected in the second half.
8
Financial summary Turnover increased 10% on an underlying basis (11% reported) to £392 million.
• Gross margin improved from 57.8% to 61.6% primarily as a result of the increase in the retail channel’s share of revenue and reduced markdowns. These gains were partially offset by the licensing channel’s reduced share of revenue.
• This channel shift to retail was also a key driver of the increase in the expense ratio from 35.6% to 40.2% (before Atlas costs). Investments in human and operating infrastructure, management transition and increased marketing in connection with Burberry’s 150th anniversary also contributed to the expense ratio rise. The increase was further amplified by a £1.5 million one-time property related gain, which offset expenses, in the previous period.
• The Group achieved a 21.5% operating margin before Atlas costs in the half relative to 22.2% in the previous period. The majority of this decrease was driven by licensing’s reduced share of revenue. The retail/wholesale operating margin was 14.0% in the 2006/07 first half relative to 14.3% in 2005/06 period. Adjusted for the one-time gain, the 2005/06 retail/wholesale operating margin was 13.8% relative to 14.0% this half.
• Operating profit before Atlas costs increased to £84.2 million, a 7% gain. Adjusted for the one-time gain and the effect of currency movements (approximately £0.9 million), operating profit before Atlas costs increased 10%.
• Diluted EPS before Atlas costs increased 11% to 12.5p.
• First half performance was consistent with Group trading expectations for the full financial year.
- Exchange rate movements will affect reported results
• After Atlas costs, operating profit was £74.6 million with diluted EPS of 11.1p.
• The directors have declared a 15% increase in the interim dividend to 2.875p.
• In the half, the Group repurchased £38 million of its shares. Second half outlook
• Retail. Burberry has accelerated its retail expansion programme for the year. For the second half, average retail selling space is planned to increase approximately 14% through the addition of five stores and five concessions. For the full financial year, the Group plans to open nine Burberry stores, a net nine concessions and four outlets resulting in an expected 13% increase in average retail selling space (excluding the effects of the Taiwan acquisition and Spain retail conversion).
9
• Wholesale. As a result of early indications from replenishment and new calendar initiatives, the Group has increased its second half wholesale growth expectation to high single digit underlying.
• Licensing. The Group continues to expect licensing revenue broadly flat underlying in the second half relative to the previous year period. In Japan, Burberry will continue its activities to reinforce brand positioning, which constrain volume growth. In product licenses, Burberry looks forward to the launch of its new eyewear collection.
• Capital expenditure. Capital expenditure is expected to total £40-45 million for the full financial year.
Burberry will release a third quarter trading statement on 16 January 2007.

10
Financial Review Group results
Six months to
30 September 2006
Six months to
30 September 2005
£m
Percentage of turnover
£m Percentage of turnover
Turnover
Retail 169.1 43.1% 124.2 35.0%
Wholesale 182.1 46.5% 191.1 53.8%
Licence 40.8 10.4% 39.6 11.2%
Total turnover 392.0 100.0% 354.9 100.0%
Cost of sales (150.4) (38.4%) (149.7) (42.2%)
Gross profit 241.6 61.6% 205.2 57.8% Net operating expenses before Atlas costs (157.4) (40.2%) (126.4) (35.6%)
Operating profit before Atlas costs 84.2 21.5% 78.8 22.2%
Atlas costs (9.6) (2.4%) (3.0) (0.8%)
Operating profit 74.6 19.0% 75.8 21.4%
Net finance (expense)/income (1.2) (0.3%) 2.3 0.6%
Profit before taxation 73.4 18.7% 78.1 22.0%
Taxation (23.5) 6.0% (25.0) (7.0%)
Attributable profit 49.9 12.7% 53.1 15.0%
Diluted EPS before Atlas costs 12.5p - 11.3p -
Diluted EPS 11.1p - 10.9p -
Diluted weighted average number of Ordinary Shares (millions) 449.8 - 488.8 -
Burberry Group turnover is composed of revenue from three channels of distribution: retail, wholesale and licensing operations. Retail revenue is generated from the sale of women’s and men’s apparel and accessories through the Group’s directly operated store network. Wholesale revenue arises from the sale of these products to wholesale customers worldwide, principally leading and prestige department stores and speciality retailers. Licence revenue consists of royalties receivable from Japanese and product licensing partners. At 30 September 2006, the Group operated 277 retail locations (2005: 177) consisting of 73 Burberry stores (2005: 62), 172 concessions (2005: 90) and 32 outlet stores (2005: 25). Turnover Total turnover in the first half advanced to £392.0 million from £354.9 million in the prior period, representing an increase of 11%, or 10% on an underlying basis. In determining “underlying” performance, financial results are adjusted to exclude the financial effects of the Taiwan acquisition, the portion of Burberry’s business in Spain affected by the retail conversion and the impact of foreign currency exchange rate differences between periods. The Taiwan acquisition and Spain retail conversion shift sales from Burberry’s wholesale channel to its retail channel. In determining underlying performance, the financial effect of the relevant businesses are excluded from both reporting periods.
11
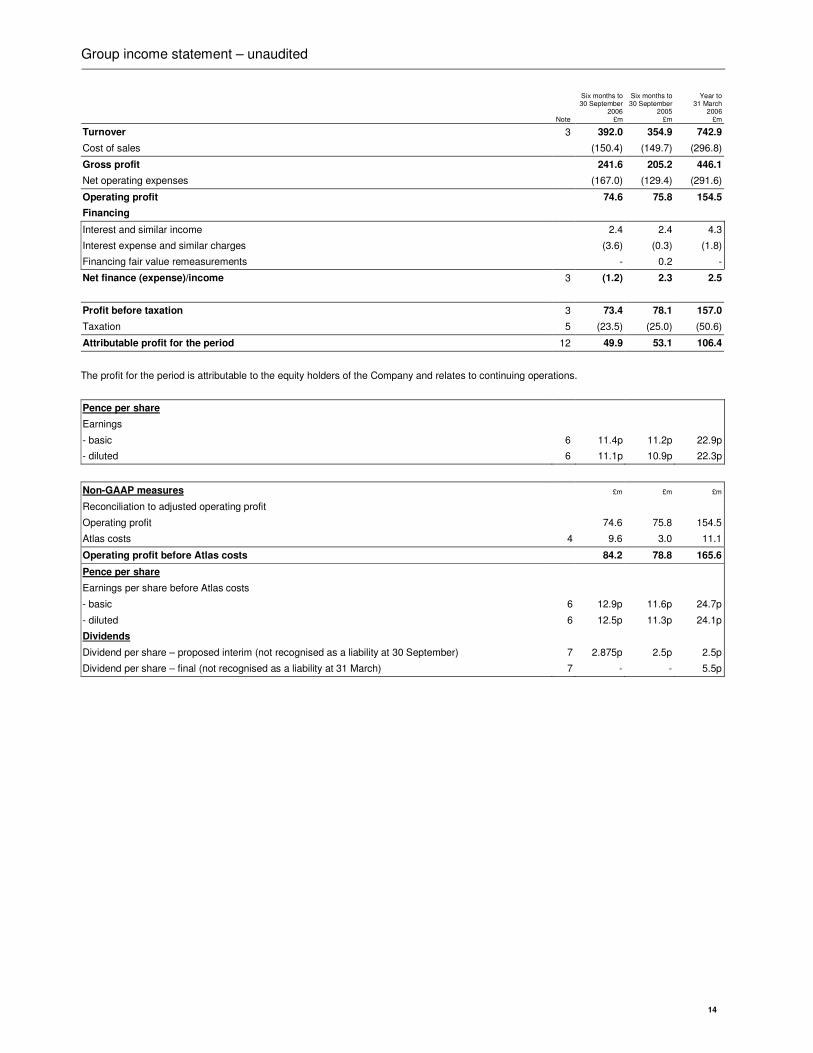
Operating profit Gross profit as a percentage of turnover was 61.6% in the first half of 2006/07 relative to 57.8% in the prior year period. The increase was driven by the increase in the retail channel’s share of the revenue mix and reduced markdowns, partially offset by the licensing channel’s reduced share of revenue. Net operating expenses before Atlas costs as a percentage of turnover increased to 40.2% from 35.6% in the previous period. The increase in the expense ratio largely reflected the change in composition of Burberry’s cost structure with the retail channel shift, investments in human and operating infrastructure, management transition costs and incremental marketing investment. As a result of these factors, operating profit before Atlas costs increased 7% to £84.2 million, or 21.5% of turnover relative to 22.2% in the previous period. Exchange rate differences relative to the previous period reduced reported operating profit by £0.9 million. Net expenses associated with Project Atlas totalled £9.6 million (2005: £3.0 million). Reported operating profit was £74.6 million for the half. Net finance income Net interest expense was £1.2 million in the six months to September 2006, compared to net interest income of £2.3 million in the prior period, reflecting borrowings associated with the Group’s share repurchase programme. In the prior year period, the Group maintained a cash balance in advance of completing in March 2006 its £250 million share repurchase plan. Burberry continued to repurchase shares in the first half. Profit before taxation As a result of the above factors, Burberry reported profit before taxation and Atlas costs of £83.0 million in the six months to 30 September 2006 compared to £81.1 million in the prior period. Including Atlas costs, profit before taxation was £73.4 million in the current period. Attributable profit Burberry recorded a 32.0% effective tax rate (2005: 32.0%) on profit, resulting in a £23.5 million tax charge, and reported attributable profit of £49.9 million for the six months to 30 September 2006 compared to £53.1 million reported in the prior period. The effective tax rate for the period is in line with the expected rate for the full financial year. Diluted earnings per share before Atlas costs increased 11.0% to 12.5p in the half compared to 11.3p in the prior period. Including Atlas costs, the Group reported diluted earnings per share of 11.1p. In the six months to September 2006, the diluted weighted average number of ordinary shares in issue was 449.8 million (2005: 488.8 million).
12
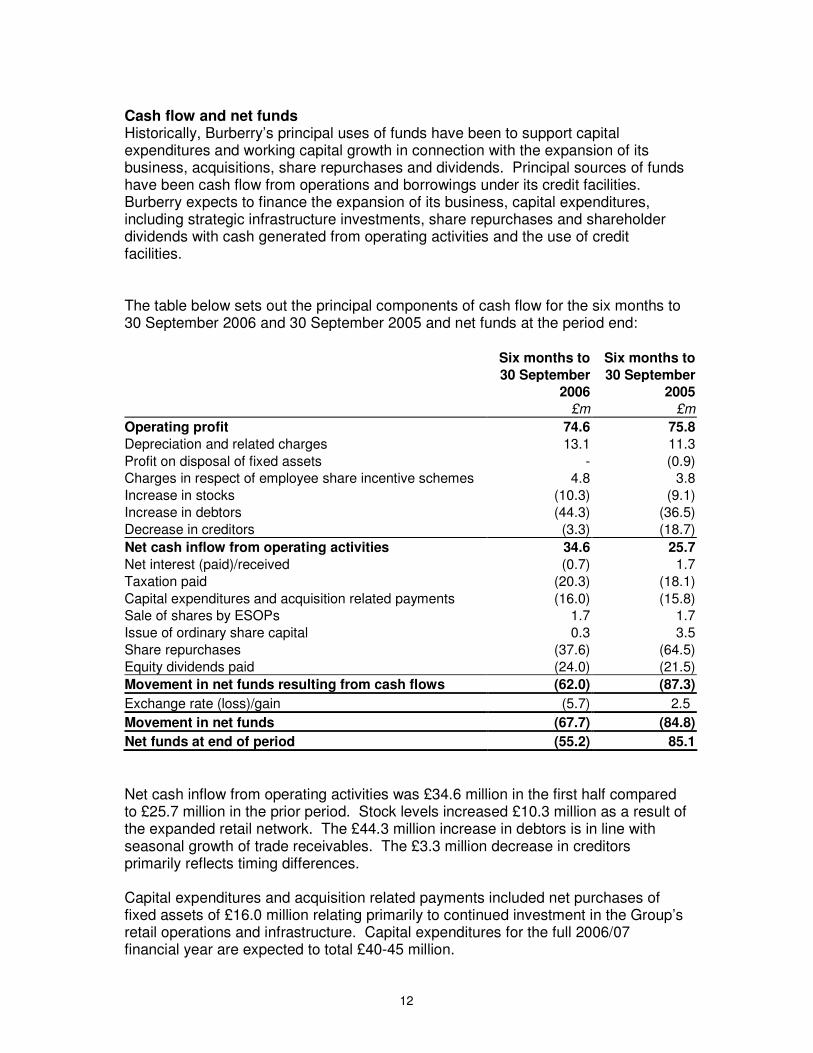
Cash flow and net funds Historically, Burberry’s principal uses of funds have been to support capital expenditures and working capital growth in connection with the expansion of its business, acquisitions, share repurchases and dividends. Principal sources of funds have been cash flow from operations and borrowings under its credit facilities. Burberry expects to finance the expansion of its business, capital expenditures, including strategic infrastructure investments, share repurchases and shareholder dividends with cash generated from operating activities and the use of credit facilities. The table below sets out the principal components of cash flow for the six months to 30 September 2006 and 30 September 2005 and net funds at the period end:
Six months to
30 September
2006
£m
Six months to
30 September
2005
£m
Operating profit 74.6 75.8
Depreciation and related charges 13.1 11.3
Profit on disposal of fixed assets - (0.9)
Charges in respect of employee share incentive schemes 4.8 3.8
Increase in stocks (10.3) (9.1)
Increase in debtors (44.3) (36.5)
Decrease in creditors (3.3) (18.7)
Net cash inflow from operating activities 34.6 25.7
Net interest (paid)/received (0.7) 1.7
Taxation paid (20.3) (18.1)
Capital expenditures and acquisition related payments (16.0) (15.8)
Sale of shares by ESOPs 1.7 1.7
Issue of ordinary share capital 0.3 3.5
Share repurchases (37.6) (64.5)
Equity dividends paid (24.0) (21.5)
Movement in net funds resulting from cash flows (62.0) (87.3)
Exchange rate (loss)/gain (5.7) 2.5
Movement in net funds (67.7) (84.8)
Net funds at end of period (55.2) 85.1
Net cash inflow from operating activities was £34.6 million in the first half compared to £25.7 million in the prior period. Stock levels increased £10.3 million as a result of the expanded retail network. The £44.3 million increase in debtors is in line with seasonal growth of trade receivables. The £3.3 million decrease in creditors primarily reflects timing differences. Capital expenditures and acquisition related payments included net purchases of fixed assets of £16.0 million relating primarily to continued investment in the Group’s retail operations and infrastructure. Capital expenditures for the full 2006/07 financial year are expected to total £40-45 million.
13
In line with its risk management policy, Burberry has continued to hedge its principal foreign currency transaction exposures arising in respect of Yen denominated royalty income and Euro denominated product purchases and sales. In connection with share option awards, the Group sold £1.7 million of equity from its Employee Share Ownership Trusts and received £0.3 million (2005: £3.5 million) from the issue of new shares following the exercise of share-based options. In the six months to 30 September 2006 the Group repurchased 8.4 million shares at a total cost of £38 million. An interim dividend of 2.875p per share (2005: 2.5p) has been declared, payable on 1 February 2007.
14
Group income statement – unaudited
Note
Six months to 30 September
2006
£m
Six months to 30 September
2005 £m
Year to 31 March
2006 £m
Turnover 3 392.0 354.9 742.9
Cost of sales (150.4) (149.7) (296.8)
Gross profit 241.6 205.2 446.1
Net operating expenses (167.0) (129.4) (291.6)
Operating profit 74.6 75.8 154.5
Financing
Interest and similar income 2.4 2.4 4.3
Interest expense and similar charges (3.6) (0.3) (1.8)
Financing fair value remeasurements - 0.2 -
Net finance (expense)/income 3 (1.2) 2.3 2.5
Profit before taxation 3 73.4 78.1 157.0
Taxation 5 (23.5) (25.0) (50.6)
Attributable profit for the period 12 49.9 53.1 106.4
The profit for the period is attributable to the equity holders of the Company and relates to continuing operations.
Pence per share
Earnings
- basic 6 11.4p 11.2p 22.9p
- diluted 6 11.1p 10.9p 22.3p
Non-GAAP measures £m £m £m
Reconciliation to adjusted operating profit
Operating profit 74.6 75.8 154.5
Atlas costs 4 9.6 3.0 11.1
Operating profit before Atlas costs 84.2 78.8 165.6
Pence per share
Earnings per share before Atlas costs
- basic 6 12.9p 11.6p 24.7p
- diluted 6 12.5p 11.3p 24.1p
Dividends
Dividend per share – proposed interim (not recognised as a liability at 30 September) 7 2.875p 2.5p 2.5p
Dividend per share – final (not recognised as a liability at 31 March) 7 - - 5.5p
15
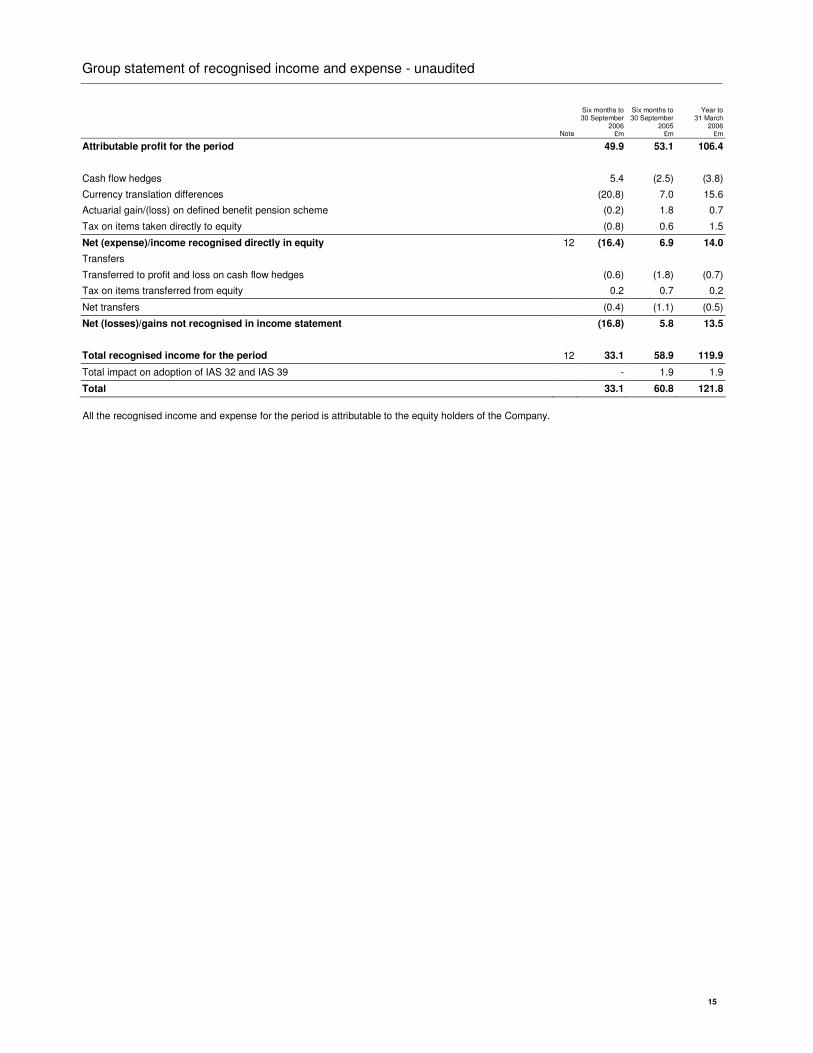
Group statement of recognised income and expense - unaudited
Note
Six months to 30 September
2006 £m
Six months to 30 September
2005 £m
Year to 31 March
2006 £m
Attributable profit for the period 49.9 53.1 106.4
Cash flow hedges 5.4 (2.5) (3.8)
Currency translation differences (20.8) 7.0 15.6
Actuarial gain/(loss) on defined benefit pension scheme (0.2) 1.8 0.7
Tax on items taken directly to equity (0.8) 0.6 1.5
Net (expense)/income recognised directly in equity 12 (16.4) 6.9 14.0
Transfers
Transferred to profit and loss on cash flow hedges (0.6) (1.8) (0.7)
Tax on items transferred from equity 0.2 0.7 0.2
Net transfers (0.4) (1.1) (0.5)
Net (losses)/gains not recognised in income statement (16.8) 5.8 13.5
Total recognised income for the period 12 33.1 58.9 119.9
Total impact on adoption of IAS 32 and IAS 39 - 1.9 1.9
Total 33.1 60.8 121.8
All the recognised income and expense for the period is attributable to the equity holders of the Company.
16
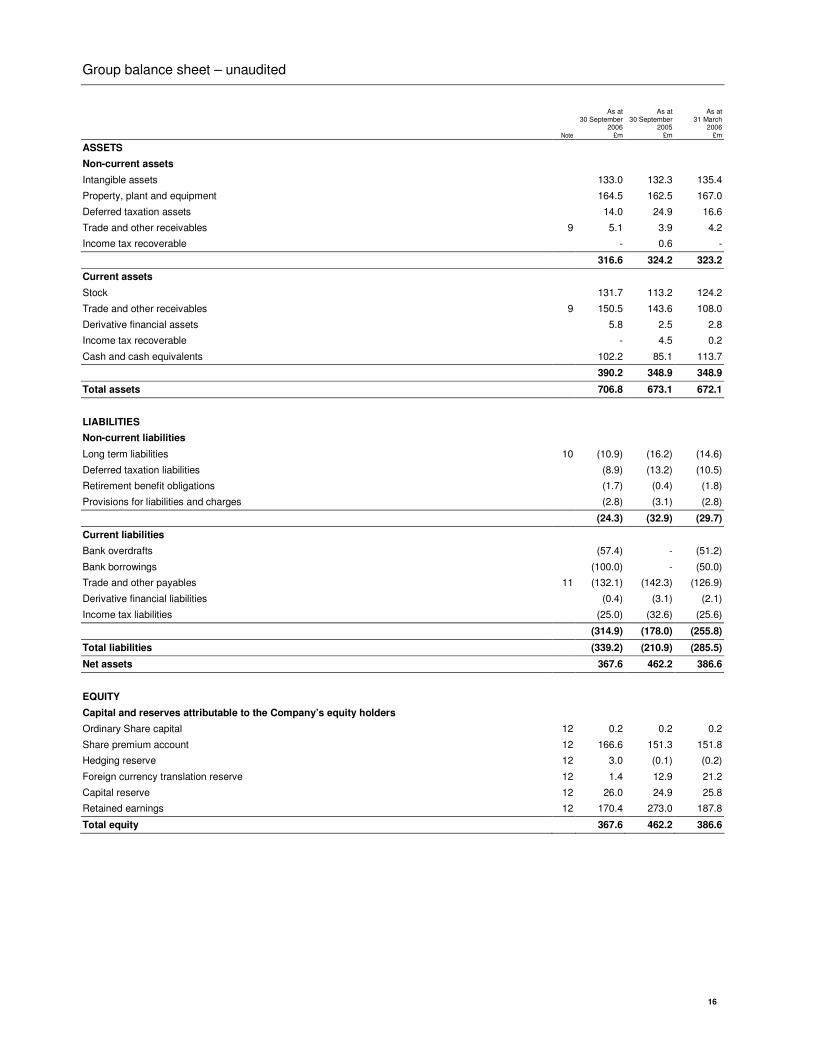
Group balance sheet – unaudited
Note
As at 30 September
2006 £m
As at 30 September
2005 £m
As at 31 March
2006 £m
ASSETS
Non-current assets
Intangible assets 133.0 132.3 135.4
Property, plant and equipment 164.5 162.5 167.0
Deferred taxation assets 14.0 24.9 16.6
Trade and other receivables 9 5.1 3.9 4.2
Income tax recoverable - 0.6 -
316.6 324.2 323.2
Current assets
Stock 131.7 113.2 124.2
Trade and other receivables 9 150.5 143.6 108.0
Derivative financial assets 5.8 2.5 2.8
Income tax recoverable - 4.5 0.2
Cash and cash equivalents 102.2 85.1 113.7
390.2 348.9 348.9
Total assets 706.8 673.1 672.1
LIABILITIES
Non-current liabilities
Long term liabilities 10 (10.9) (16.2) (14.6)
Deferred taxation liabilities (8.9) (13.2) (10.5)
Retirement benefit obligations (1.7) (0.4) (1.8)
Provisions for liabilities and charges (2.8) (3.1) (2.8)
(24.3) (32.9) (29.7)
Current liabilities
Bank overdrafts (57.4) - (51.2)
Bank borrowings (100.0) - (50.0)
Trade and other payables 11 (132.1) (142.3) (126.9)
Derivative financial liabilities (0.4) (3.1) (2.1)
Income tax liabilities (25.0) (32.6) (25.6)
(314.9) (178.0) (255.8)
Total liabilities (339.2) (210.9) (285.5)
Net assets 367.6 462.2 386.6
EQUITY
Capital and reserves attributable to the Company’s equity holders
Ordinary Share capital 12 0.2 0.2 0.2
Share premium account 12 166.6 151.3 151.8
Hedging reserve 12 3.0 (0.1) (0.2)
Foreign currency translation reserve 12 1.4 12.9 21.2
Capital reserve 12 26.0 24.9 25.8
Retained earnings 12 170.4 273.0 187.8
Total equity 367.6 462.2 386.6
17
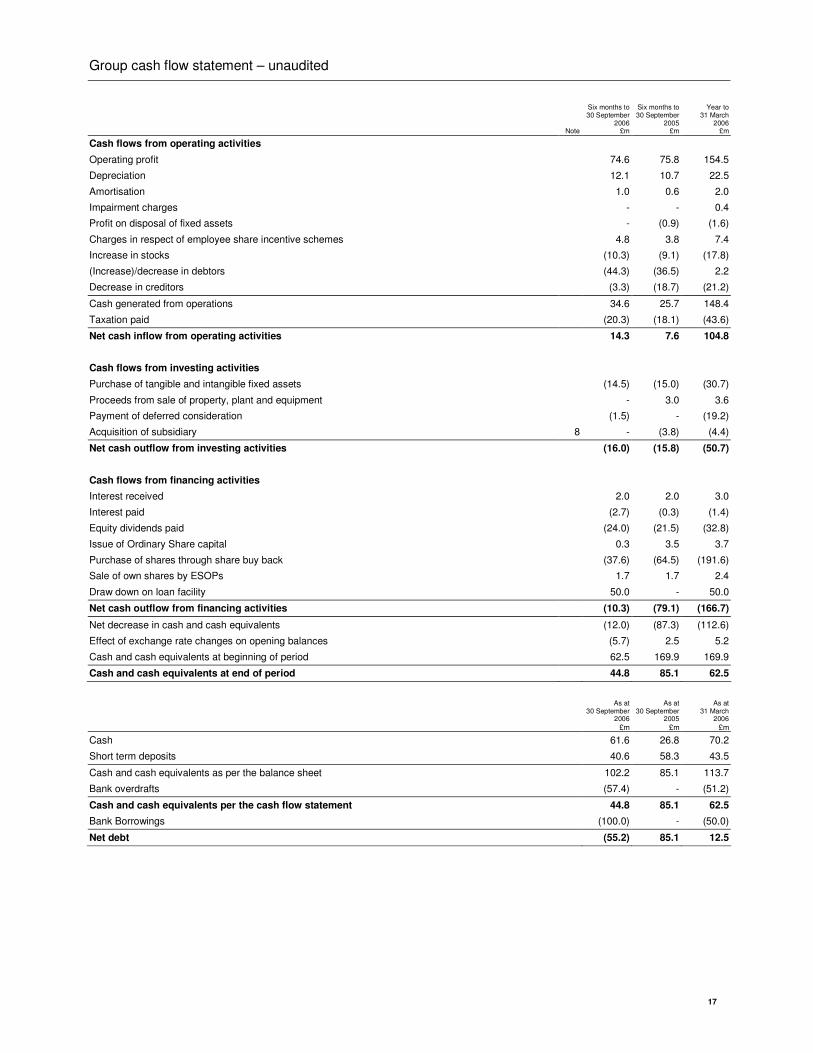
Group cash flow statement – unaudited
Note
Six months to 30 September
2006 £m
Six months to 30 September
2005 £m
Year to 31 March
2006 £m
Cash flows from operating activities
Operating profit 74.6 75.8 154.5
Depreciation 12.1 10.7 22.5
Amortisation 1.0 0.6 2.0
Impairment charges - - 0.4
Profit on disposal of fixed assets - (0.9) (1.6)
Charges in respect of employee share incentive schemes 4.8 3.8 7.4
Increase in stocks (10.3) (9.1) (17.8)
(Increase)/decrease in debtors (44.3) (36.5) 2.2
Decrease in creditors (3.3) (18.7) (21.2)
Cash generated from operations 34.6 25.7 148.4
Taxation paid (20.3) (18.1) (43.6)
Net cash inflow from operating activities 14.3 7.6 104.8
Cash flows from investing activities
Purchase of tangible and intangible fixed assets (14.5) (15.0) (30.7)
Proceeds from sale of property, plant and equipment - 3.0 3.6
Payment of deferred consideration (1.5) - (19.2)
Acquisition of subsidiary 8 - (3.8) (4.4)
Net cash outflow from investing activities (16.0) (15.8) (50.7)
Cash flows from financing activities
Interest received 2.0 2.0 3.0
Interest paid (2.7) (0.3) (1.4)
Equity dividends paid (24.0) (21.5) (32.8)
Issue of Ordinary Share capital 0.3 3.5 3.7
Purchase of shares through share buy back (37.6) (64.5) (191.6)
Sale of own shares by ESOPs 1.7 1.7 2.4
Draw down on loan facility 50.0 - 50.0
Net cash outflow from financing activities (10.3) (79.1) (166.7)
Net decrease in cash and cash equivalents (12.0) (87.3) (112.6)
Effect of exchange rate changes on opening balances (5.7) 2.5 5.2
Cash and cash equivalents at beginning of period 62.5 169.9 169.9
Cash and cash equivalents at end of period 44.8 85.1 62.5
As at
30 September 2006
£m
As at 30 September
2005
£m
As at 31 March
2006
£m
Cash 61.6 26.8 70.2
Short term deposits 40.6 58.3 43.5
Cash and cash equivalents as per the balance sheet 102.2 85.1 113.7
Bank overdrafts (57.4) - (51.2)
Cash and cash equivalents per the cash flow statement 44.8 85.1 62.5
Bank Borrowings (100.0) - (50.0)
Net debt (55.2) 85.1 12.5
18
Notes to the interim financial statements
1. Corporate information Burberry Group is a luxury goods manufacturer, wholesaler and retailer in Europe, North America and Asia Pacific; licensing activity is also carried out, principally in Japan. All of the companies which comprise Burberry Group are owned by Burberry Group plc (“the Company”) directly or indirectly. 2. Accounting policies and basis of preparation The financial information contained in this report is unaudited. The Income Statement, Statement of Recognised Income and Expense and Cash Flow Statement for the interim period to 30 September 2006, and the Balance Sheet as at 30 September 2006 and related notes have been reviewed by the auditors and their report to the Company is set out on page 24. The information shown for the year ended 31 March 2006 does not constitute statutory accounts within the meaning of Section 240 of the Companies Act 1985 and has been extracted from the statutory accounts for the year ended on that date, which have been filed with the Registrar of Companies. The report of the auditors on the statutory accounts for the year ended 31 March 2006 was unqualified and did not contain a statement under Section 237 of the Companies Act 1985. These unaudited consolidated financial statements for the six months ended 30 September 2006 have been prepared in accordance with the listing rules of the Financial Services Authority. Accounting policies have been consistently applied in the interim financial report on the basis set out in the Group's financial statements for the year ended 31 March 2006 on pages 52 to 57. Non-GAAP measures
Non-GAAP measures are presented in order to provide a clear and consistent presentation of the underlying performance of the Group’s ongoing business. Such presentation will be prepared on a consistent basis in the future.
19
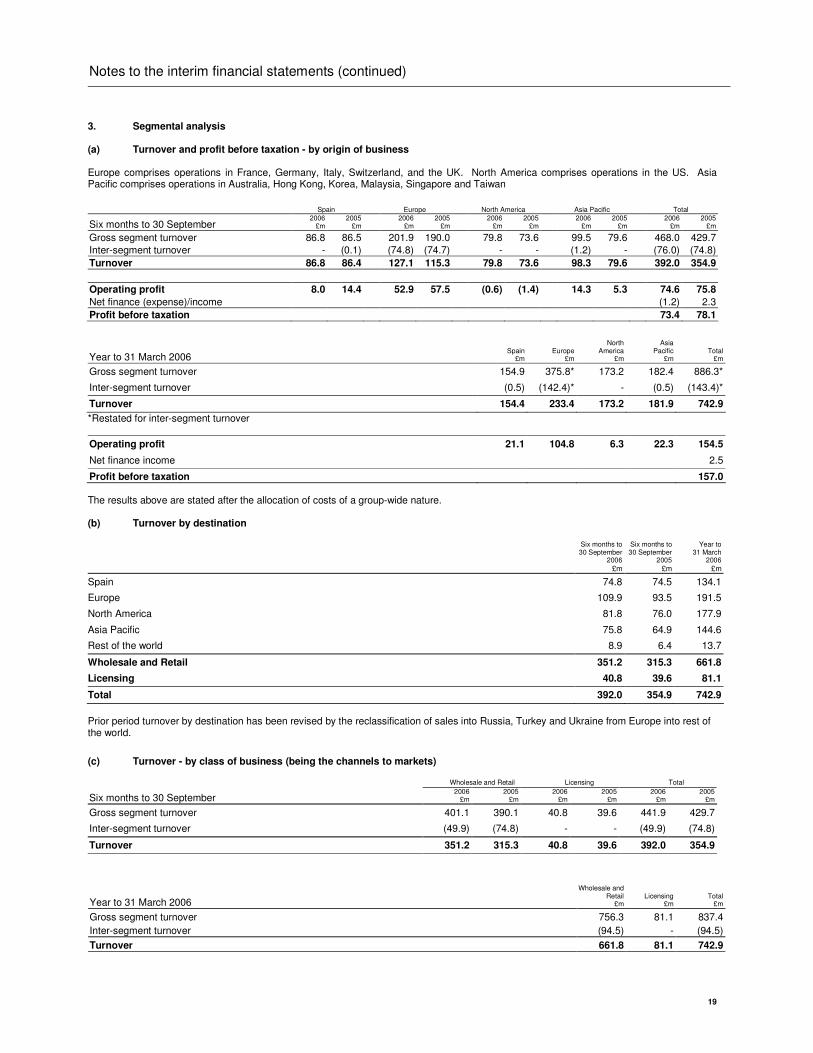
Notes to the interim financial statements (continued)
3. Segmental analysis (a) Turnover and profit before taxation - by origin of business Europe comprises operations in France, Germany, Italy, Switzerland, and the UK. North America comprises operations in the US. Asia Pacific comprises operations in Australia, Hong Kong, Korea, Malaysia, Singapore and Taiwan
Spain Europe North America Asia Pacific Total
Six months to 30 September 2006
£m 2005
£m 2006
£m 2005
£m 2006
£m 2005
£m 2006
£m 2005
£m 2006
£m 2005
£m
Gross segment turnover 86.8 86.5 201.9 190.0 79.8 73.6 99.5 79.6 468.0 429.7
Inter-segment turnover - (0.1) (74.8) (74.7) - - (1.2) - (76.0) (74.8)
Turnover 86.8 86.4 127.1 115.3 79.8 73.6 98.3 79.6 392.0 354.9
Operating profit 8.0 14.4 52.9 57.5 (0.6) (1.4) 14.3 5.3 74.6 75.8
Net finance (expense)/income (1.2) 2.3
Profit before taxation 73.4 78.1
Year to 31 March 2006 Spain
£m Europe
£m
North America
£m
Asia Pacific
£m Total
£m
Gross segment turnover 154.9 375.8* 173.2 182.4 886.3*
Inter-segment turnover (0.5) (142.4)* - (0.5) (143.4)*
Turnover 154.4 233.4 173.2 181.9 742.9
*Restated for inter-segment turnover
Operating profit 21.1 104.8 6.3 22.3 154.5
Net finance income 2.5
Profit before taxation 157.0
The results above are stated after the allocation of costs of a group-wide nature. (b) Turnover by destination Six months to
30 September 2006
£m
Six months to 30 September
2005
£m
Year to 31 March
2006
£m
Spain 74.8 74.5 134.1
Europe 109.9 93.5 191.5
North America 81.8 76.0 177.9
Asia Pacific 75.8 64.9 144.6
Rest of the world 8.9 6.4 13.7
Wholesale and Retail 351.2 315.3 661.8
Licensing 40.8 39.6 81.1
Total 392.0 354.9 742.9
Prior period turnover by destination has been revised by the reclassification of sales into Russia, Turkey and Ukraine from Europe into rest of the world.
(c) Turnover - by class of business (being the channels to markets) Wholesale and Retail Licensing Total
Six months to 30 September 2006
£m 2005
£m 2006
£m 2005
£m 2006
£m 2005
£m
Gross segment turnover 401.1 390.1 40.8 39.6 441.9 429.7
Inter-segment turnover (49.9) (74.8) - - (49.9) (74.8)
Turnover 351.2 315.3 40.8 39.6 392.0 354.9
Year to 31 March 2006
Wholesale and Retail
£m Licensing
£m Total
£m
Gross segment turnover 756.3 81.1 837.4
Inter-segment turnover (94.5) - (94.5)
Turnover 661.8 81.1 742.9
20
Notes to the interim financial statements (continued)
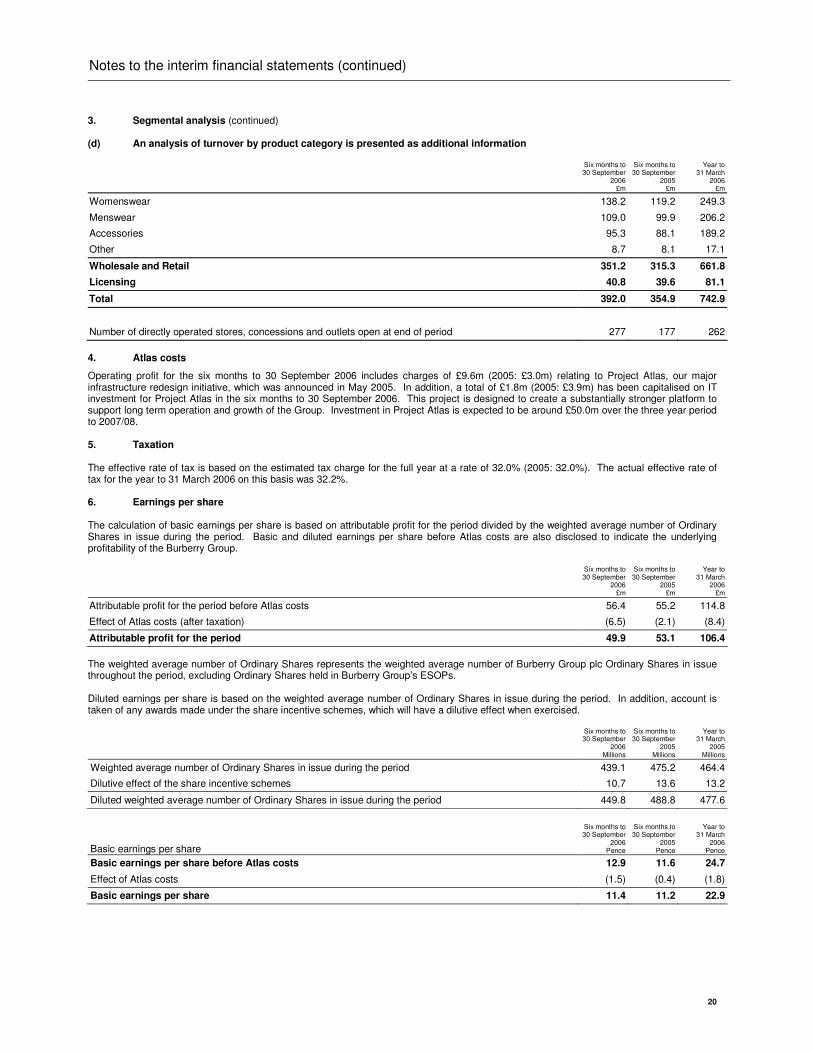
3. Segmental analysis (continued) (d) An analysis of turnover by product category is presented as additional information
Six months to 30 September
2006 £m
Six months to 30 September
2005 £m
Year to 31 March
2006 £m
Womenswear 138.2 119.2 249.3
Menswear 109.0 99.9 206.2
Accessories 95.3 88.1 189.2
Other 8.7 8.1 17.1
Wholesale and Retail 351.2 315.3 661.8
Licensing 40.8 39.6 81.1
Total 392.0 354.9 742.9
Number of directly operated stores, concessions and outlets open at end of period 277 177 262
4. Atlas costs
Operating profit for the six months to 30 September 2006 includes charges of £9.6m (2005: £3.0m) relating to Project Atlas, our major infrastructure redesign initiative, which was announced in May 2005. In addition, a total of £1.8m (2005: £3.9m) has been capitalised on IT investment for Project Atlas in the six months to 30 September 2006. This project is designed to create a substantially stronger platform to support long term operation and growth of the Group. Investment in Project Atlas is expected to be around £50.0m over the three year period to 2007/08. 5. Taxation The effective rate of tax is based on the estimated tax charge for the full year at a rate of 32.0% (2005: 32.0%). The actual effective rate of tax for the year to 31 March 2006 on this basis was 32.2%. 6. Earnings per share The calculation of basic earnings per share is based on attributable profit for the period divided by the weighted average number of Ordinary Shares in issue during the period. Basic and diluted earnings per share before Atlas costs are also disclosed to indicate the underlying profitability of the Burberry Group. Six months to
30 September 2006
£m
Six months to 30 September
2005 £m
Year to 31 March
2006 £m
Attributable profit for the period before Atlas costs 56.4 55.2 114.8
Effect of Atlas costs (after taxation) (6.5) (2.1) (8.4)
Attributable profit for the period 49.9 53.1 106.4
The weighted average number of Ordinary Shares represents the weighted average number of Burberry Group plc Ordinary Shares in issue throughout the period, excluding Ordinary Shares held in Burberry Group’s ESOPs. Diluted earnings per share is based on the weighted average number of Ordinary Shares in issue during the period. In addition, account is taken of any awards made under the share incentive schemes, which will have a dilutive effect when exercised.
Six months to 30 September
2006 Millions
Six months to 30 September
2005 Millions
Year to 31 March
2005 Millions
Weighted average number of Ordinary Shares in issue during the period 439.1 475.2 464.4
Dilutive effect of the share incentive schemes 10.7 13.6 13.2
Diluted weighted average number of Ordinary Shares in issue during the period 449.8 488.8 477.6
Basic earnings per share
Six months to 30 September
2006 Pence
Six months to 30 September
2005 Pence
Year to 31 March
2006 Pence
Basic earnings per share before Atlas costs 12.9 11.6 24.7
Effect of Atlas costs (1.5) (0.4) (1.8)
Basic earnings per share 11.4 11.2 22.9
21
Notes to the interim financial statements (continued)
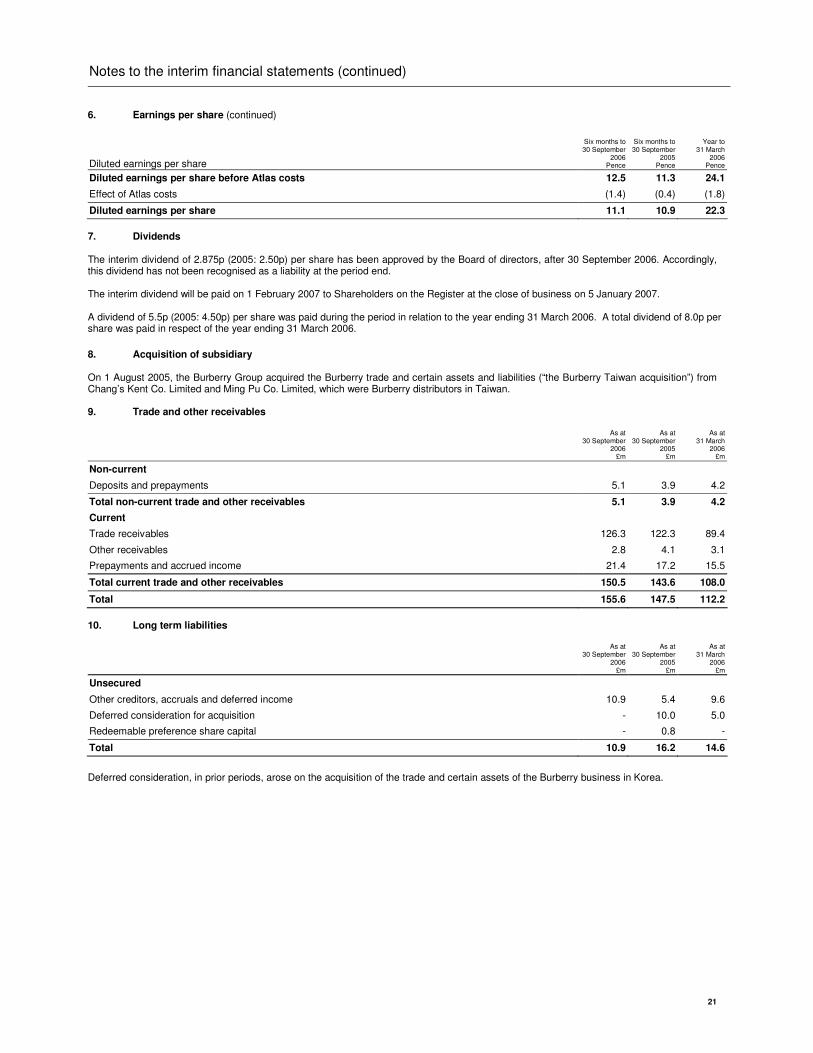
6. Earnings per share (continued)
Diluted earnings per share
Six months to 30 September
2006 Pence
Six months to 30 September
2005 Pence
Year to 31 March
2006 Pence
Diluted earnings per share before Atlas costs 12.5 11.3 24.1
Effect of Atlas costs (1.4) (0.4) (1.8)
Diluted earnings per share 11.1 10.9 22.3
7. Dividends The interim dividend of 2.875p (2005: 2.50p) per share has been approved by the Board of directors, after 30 September 2006. Accordingly, this dividend has not been recognised as a liability at the period end. The interim dividend will be paid on 1 February 2007 to Shareholders on the Register at the close of business on 5 January 2007. A dividend of 5.5p (2005: 4.50p) per share was paid during the period in relation to the year ending 31 March 2006. A total dividend of 8.0p per share was paid in respect of the year ending 31 March 2006. 8. Acquisition of subsidiary On 1 August 2005, the Burberry Group acquired the Burberry trade and certain assets and liabilities (“the Burberry Taiwan acquisition”) from Chang’s Kent Co. Limited and Ming Pu Co. Limited, which were Burberry distributors in Taiwan. 9. Trade and other receivables As at
30 September 2006
£m
As at 30 September
2005 £m
As at 31 March
2006 £m
Non-current
Deposits and prepayments 5.1 3.9 4.2
Total non-current trade and other receivables 5.1 3.9 4.2
Current
Trade receivables 126.3 122.3 89.4
Other receivables 2.8 4.1 3.1
Prepayments and accrued income 21.4 17.2 15.5
Total current trade and other receivables 150.5 143.6 108.0
Total 155.6 147.5 112.2
10. Long term liabilities As at
30 September 2006
£m
As at 30 September
2005 £m
As at 31 March
2006 £m
Unsecured
Other creditors, accruals and deferred income 10.9 5.4 9.6
Deferred consideration for acquisition - 10.0 5.0
Redeemable preference share capital - 0.8 -
Total 10.9 16.2 14.6
Deferred consideration, in prior periods, arose on the acquisition of the trade and certain assets of the Burberry business in Korea.
22
Notes to the interim financial statements (continued)
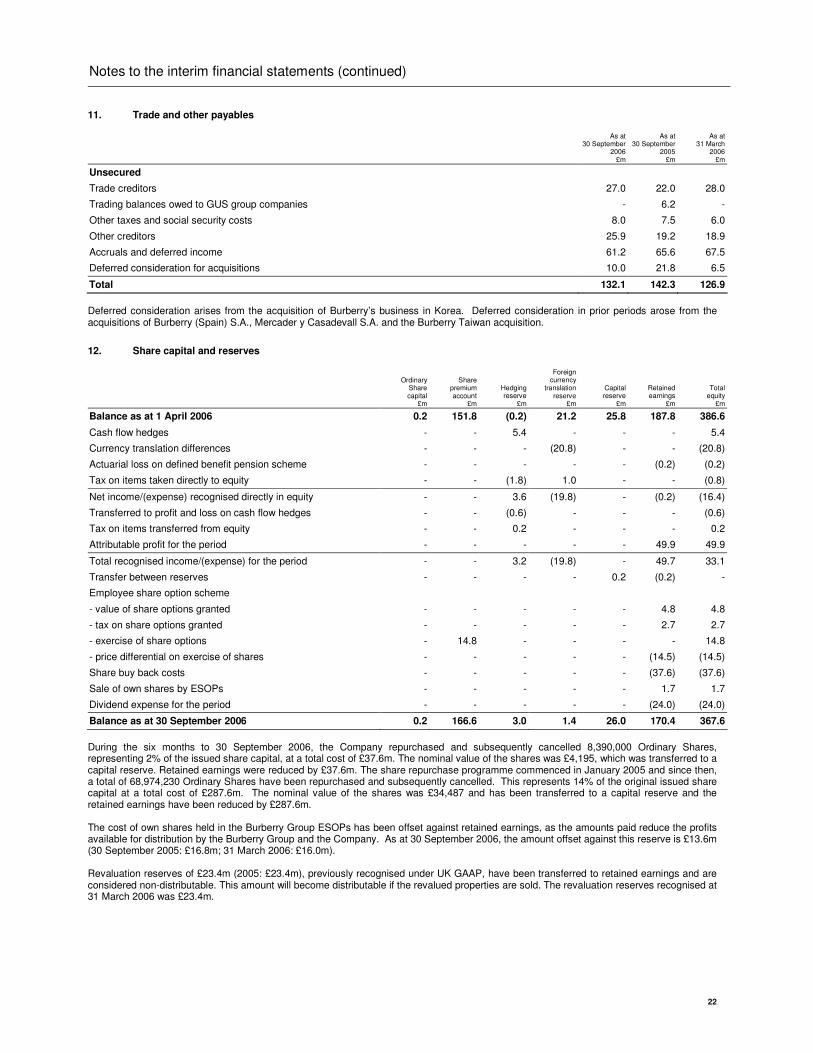
11. Trade and other payables As at
30 September 2006
£m
As at 30 September
2005 £m
As at 31 March
2006 £m
Unsecured
Trade creditors 27.0 22.0 28.0
Trading balances owed to GUS group companies - 6.2 -
Other taxes and social security costs 8.0 7.5 6.0
Other creditors 25.9 19.2 18.9
Accruals and deferred income 61.2 65.6 67.5
Deferred consideration for acquisitions 10.0 21.8 6.5
Total 132.1 142.3 126.9
Deferred consideration arises from the acquisition of Burberry’s business in Korea. Deferred consideration in prior periods arose from the acquisitions of Burberry (Spain) S.A., Mercader y Casadevall S.A. and the Burberry Taiwan acquisition.
12. Share capital and reserves
Ordinary
Share capital
£m
Share premium
account £m
Hedging reserve
£m
Foreign currency
translation reserve
£m
Capital reserve
£m
Retained earnings
£m
Total equity
£m
Balance as at 1 April 2006 0.2 151.8 (0.2) 21.2 25.8 187.8 386.6
Cash flow hedges - - 5.4 - - - 5.4
Currency translation differences - - - (20.8) - - (20.8)
Actuarial loss on defined benefit pension scheme - - - - - (0.2) (0.2)
Tax on items taken directly to equity - - (1.8) 1.0 - - (0.8)
Net income/(expense) recognised directly in equity - - 3.6 (19.8) - (0.2) (16.4)
Transferred to profit and loss on cash flow hedges - - (0.6) - - - (0.6)
Tax on items transferred from equity - - 0.2 - - - 0.2
Attributable profit for the period - - - - - 49.9 49.9
Total recognised income/(expense) for the period - - 3.2 (19.8) - 49.7 33.1
Transfer between reserves - - - - 0.2 (0.2) -
Employee share option scheme
- value of share options granted - - - - - 4.8 4.8
- tax on share options granted - - - - - 2.7 2.7
- exercise of share options - 14.8 - - - - 14.8
- price differential on exercise of shares - - - - - (14.5) (14.5)
Share buy back costs - - - - - (37.6) (37.6)
Sale of own shares by ESOPs - - - - - 1.7 1.7
Dividend expense for the period - - - - - (24.0) (24.0)
Balance as at 30 September 2006 0.2 166.6 3.0 1.4 26.0 170.4 367.6
During the six months to 30 September 2006, the Company repurchased and subsequently cancelled 8,390,000 Ordinary Shares, representing 2% of the issued share capital, at a total cost of £37.6m. The nominal value of the shares was £4,195, which was transferred to a capital reserve. Retained earnings were reduced by £37.6m. The share repurchase programme commenced in January 2005 and since then, a total of 68,974,230 Ordinary Shares have been repurchased and subsequently cancelled. This represents 14% of the original issued share capital at a total cost of £287.6m. The nominal value of the shares was £34,487 and has been transferred to a capital reserve and the retained earnings have been reduced by £287.6m. The cost of own shares held in the Burberry Group ESOPs has been offset against retained earnings, as the amounts paid reduce the profits available for distribution by the Burberry Group and the Company. As at 30 September 2006, the amount offset against this reserve is £13.6m (30 September 2005: £16.8m; 31 March 2006: £16.0m). Revaluation reserves of £23.4m (2005: £23.4m), previously recognised under UK GAAP, have been transferred to retained earnings and are considered non-distributable. This amount will become distributable if the revalued properties are sold. The revaluation reserves recognised at 31 March 2006 was £23.4m.
23
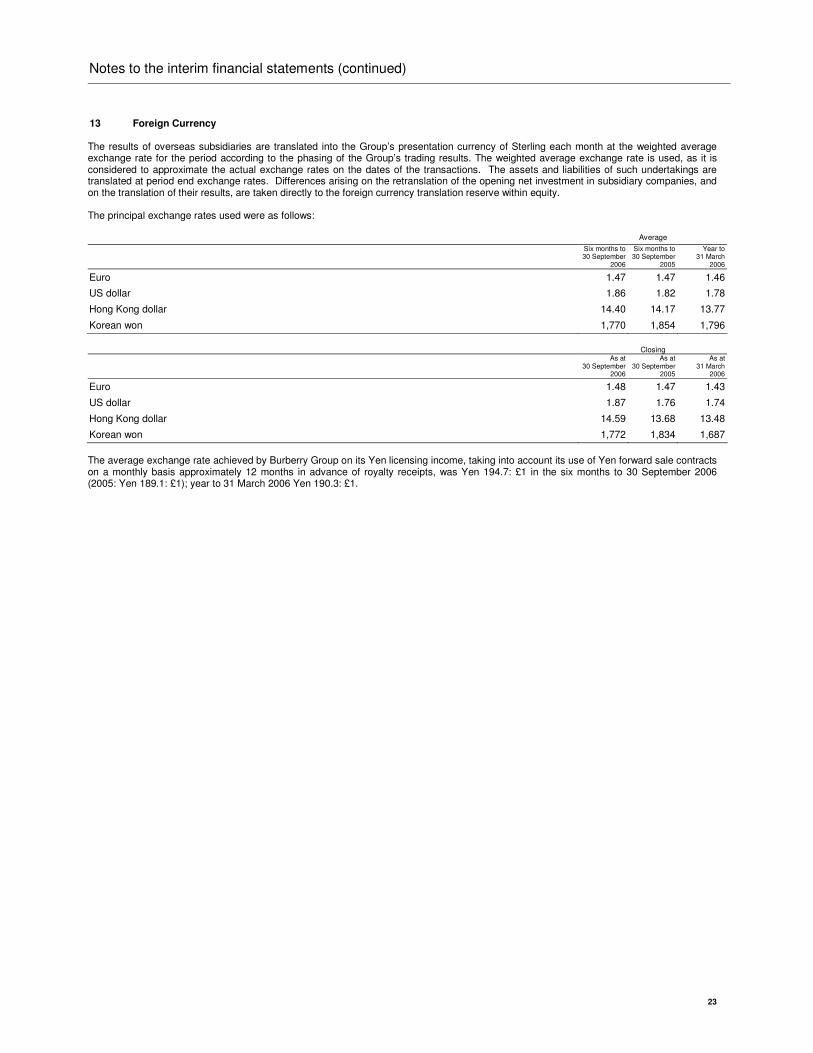
Notes to the interim financial statements (continued)
13 Foreign Currency The results of overseas subsidiaries are translated into the Group’s presentation currency of Sterling each month at the weighted average exchange rate for the period according to the phasing of the Group’s trading results. The weighted average exchange rate is used, as it is considered to approximate the actual exchange rates on the dates of the transactions. The assets and liabilities of such undertakings are translated at period end exchange rates. Differences arising on the retranslation of the opening net investment in subsidiary companies, and on the translation of their results, are taken directly to the foreign currency translation reserve within equity. The principal exchange rates used were as follows: Average
Six months to 30 September
2006
Six months to 30 September
2005
Year to 31 March
2006
Euro 1.47 1.47 1.46
US dollar 1.86 1.82 1.78
Hong Kong dollar 14.40 14.17 13.77
Korean won 1,770 1,854 1,796
Closing As at
30 September 2006
As at 30 September
2005
As at 31 March
2006
Euro 1.48 1.47 1.43
US dollar 1.87 1.76 1.74
Hong Kong dollar 14.59 13.68 13.48
Korean won 1,772 1,834 1,687
The average exchange rate achieved by Burberry Group on its Yen licensing income, taking into account its use of Yen forward sale contracts on a monthly basis approximately 12 months in advance of royalty receipts, was Yen 194.7: £1 in the six months to 30 September 2006 (2005: Yen 189.1: £1); year to 31 March 2006 Yen 190.3: £1.
24
Independent review report to Burberry Group plc
Introduction
We have been instructed by the Company to review the financial information for the six months to 30 September 2006 which comprises the group balance sheet as at 30 September 2006 and the related group income statement, statement of recognised income and expense and cash flow statement for the six months then ended and related notes to the interim financial statements. We have read the other information contained in the interim report and considered whether it contains any apparent misstatements or material inconsistencies with the financial information.
Directors' responsibilities
The interim report, including the financial information contained therein, is the responsibility of, and has been approved by the directors. The Listing Rules of the Financial Services Authority require that the accounting policies and presentation applied to the interim figures should be consistent with those applied in preparing the preceding annual accounts except where any changes, and the reasons for them, are disclosed.
This interim report has been prepared in accordance with the basis set out in note 2.
Review work performed
We conducted our review in accordance with guidance contained in Bulletin 1999/4 issued by the Auditing Practices Board for use in the United Kingdom. A review consists principally of making enquiries of Group management and applying analytical procedures to the financial information and underlying financial data and, based thereon, assessing whether the disclosed accounting policies have been applied. A review excludes audit procedures such as tests of controls and verification of assets, liabilities and transactions. It is substantially less in scope than an audit and therefore provides a lower level of assurance. Accordingly we do not express an audit opinion on the financial information. This report, including the conclusion, has been prepared for and only for the Company for the purpose of the Listing Rules of the Financial Services Authority and for no other purpose. We do not, in producing this report, accept or assume responsibility for any other purpose or to any other person to whom this report is shown or into whose hands it may come save where expressly agreed by our prior consent in writing.
Review conclusion
On the basis of our review we are not aware of any material modifications that should be made to the financial information as presented for the six months to 30 September 2006.
PricewaterhouseCoopers LLP Chartered Accountants London
14 November 2006
Notes:
(a) The maintenance and integrity of the integrity of the Burberry Group plc website is the responsibility of the Directors; the work carried out
by the auditors does not involve consideration of these matters and, accordingly, the auditors accept no responsibly for any changes that may
have occurred to the interim report since it was initially presented on the website.
(b) Legislation in the United Kingdom governing the presentation and dissemination of financial information may differ from legislation in other
jurisdictions.
25
Shareholder information
Registrar Enquiries concerning holdings of the Company’s shares and notifications of the holder’s change of address should be referred to Lloyds TSB Registrars, The Causeway, Worthing, West Sussex, BN99 6DA, telephone: 0870 600 3970. (Or +44 121 415 7047 from outside the UK). In addition, Lloyds TSB Registrars offer a range of shareholder information online at www.shareview.co.uk. A textphone facility for those with hearing difficulties is available by calling: 0870 600 3950 (or +44 121 415 7028 from outside the UK). Share price information
The latest Burberry Group plc share price is available on Burberry’s website and also on the Financial Times Cityline Service on 0906 843 0000 (calls charged at 60p per minute). Share Dealing
Lloyds TSB Registrars offer a telephone and internet dealing service. Terms and conditions and details of the commission charges are available on request. For telephone dealing call 0870 850 0852 between 8.30am and 4.30pm, Monday to Friday, and for internet dealing log on to www.shareview.co.uk/dealing. You will need your Shareholder reference number shown on your share certificate. ShareGift
Shareholders with a small number of Burberry shares, the value of which makes it uneconomic to sell them, may wish to consider donating their shares to the charity ShareGift, (registered charity 1052686) which specialises in using such holdings for charitable benefit. A ShareGift Donation form can be obtained from Lloyds TSB Registrars at the above address. For further information, ShareGift can be contacted as follows: ShareGift 46 Grosvenor Street London W1K 3HN Telephone: +44 (0) 20 7828 1151 Website: www.sharegift.org Internet
A full range of investor relations information on Burberry is available at www.burberrygroupplc.com. This includes web casts of results presentations given to analysts and fund managers together with slides accompanying those presentations. Financial Calendar
Interim dividend record date 5 January 2007 Third quarter trading update 16 January 2007 Interim dividend to be paid 1 February 2007 Second half trading update 17 April 2007 Preliminary announcement of results for the year ended 31 March 2007 May 2007 Annual General Meeting July 2007 Registered Office Burberry Group plc 18-22 Haymarket London SW1Y 4DQ Telephone: +44 (0) 20 7968 0000 Fax: +44 (0) 20 7980 2950