burckhardt compression holding ag results fy 2017 · 2019-01-08 · questions & answers all....
TRANSCRIPT

BURCKHARDT COMPRESSION HOLDING AGRESULTS FY 2017
Winterthur, May 29, 2018
Content
May 29, 2018
FY 2017
Page 2
About Burckhardt Compression M. Pawlicek
Corporate Overview M. Pawlicek
Review Systems Division M. Pawlicek
Review Services Division M. Pawlicek
Financials R. Braendli
Outlook, Guidance & Growth Areas M. Pawlicek
Shareholders R. Braendli
Questions & Answers All

ABOUT BURCKHARDT COMPRESSION
May 29, 2018
FY 2017
Page 3

About Burckhardt Compression
Burckhardt Compression is the worldwide market
leader for reciprocating compressor systems and
the only manufacturer and service provider that
covers a full range of reciprocating compressor
technologies and services. Its customized
compressor systems are used in the upstream oil
& gas, gas transport and storage, refinery,
chemical, petrochemical and industrial gas
sectors. Burckhardt Compression’s leading
technology, broad portfolio of compressor
components and the full range of services help
customers around the world to find the optimized
solution for their reciprocating compressor
systems. Since 1844 its highly skilled workforce
has crafted superior solutions and set the
benchmark in the gas compression industry.
May 29, 2018
FY 2017
Page 4

About Burckhardt Compression
Founded 1844
Division of Sulzer Corporation 1969 – 2002
Management buyout 2002
Shareholders Public listed company SIX (BCHN) since IPO in 2006
> 4’000 Shareholders
Market cap CHF 1.0 bn (31.3.2018)
Headcount (FTEs worldwide) 2’214 (FY 2016: 2’107)
Sales FY 2017 CHF 595 mn (FY 2016: 558 mn)
Systems Division
Services Division
65%
35%
May 29, 2018
FY 2017
Page 5

About Burckhardt Compression
May 29, 2018
Page 6
FY 2017

Market Segments
Gas Transport
and Storage
Petro-
chemical/
Chemical
Industry
Upstream
Oil & Gas
Refinery
Industrial Gas
May 29, 2018
FY 2017
Page 7

Reciprocating Compressor (Crosshead Design)
May 29, 2018
FY 2017
Page 8

CORPORATE OVERVIEW
May 29, 2018
FY 2017
Page 9

Financial SummaryAll Financials FY16/FY17 in accordance with Swiss GAAP FER
Systems Division Services Division Other1) Total
in CHF mn 2017 2016 2017 2016 2017 2016 2017 2016
Sales 384.4 367.2 210.2 190.5 594.6 557.7
Cost of goods
sold-357.2 -330.8 -112.3 -96.5 -469.5 -427.2
Gross profit 27.2 36.5 97.9 94.0 125.1 130.5
Gross profit as
% sales7.1% 9.9% 46.6% 49.4% 21.0% 23.4%
Operating
income-9.0 -1.5 54.4 53.0 -3.7 -3.8 41.7 47.7
Operating
income as %
sales
-2.3% -0.4% 25.9% 27.8% 7.0% 8.6%
1) Includes corporate center and real estate company
May 29, 2018
Page 10
FY 2017

Highlights
Launch of the new Mid-Range Plan for
FY 2018-2022
Opening of the Global Support Center in
Pune, India
Acquisition of service provider CSM in
Edmonton, Canada
New service sales office in Argentina
Collaboration agreement signed with
Kompressorteknik ML AB, Sweden
First orders for Monitoring and
Diagnostics equipment for LNG tankers
Received first joint order for SYCC and
BC compressors in China
May 29, 2018
Page 11
FY 2017

Set Backs
Further reduction of profitability in the
Systems Division due to:
Additional cost for improvements in dual-
fuel applications
Sharp rise in material prices, especially in
China
Under-utilized production capacity
Systems business is still a buyers’
market
Slower than expected recovery of US
market
May 29, 2018
Page 12
FY 2017

REVIEW SYSTEMS DIVISION
May 29, 2018
FY 2017
Page 13

Systems Division
Financials
in CHF mn 2017 2016Change
2016/2017
Order intake 319.8 280.6 +14.0%
Sales 384.4 367.2 +4.7%
Gross profit 27.2 36.5 -25.5%
In % of sales 7.1% 9.9%
EBIT -9.0 -1.5
In % of sales -2.3% -0.4%
Headcount (FTEs) 1’425 1’446 -1.6%
FY 2017
May 29, 2018
Page 14

Systems Division
Key Figures
0
50
100
150
200
250
300
350
400
08 09 10 11 12 13 14 15 16 17
Order intake Sales
0
50
100
150
200
250
300
350
400
08 09 10 11 12 13 14 15 16 17
0
20
40
60
80
100
08 09 10 11 12 13 14 15 16 17
Gross profit EBIT
-20
-10
0
10
20
30
40
08 09 10 11 12 13 14 15 16 17
May 29, 2018
in CHF mn
Page 15
FY 2017

Burckhardt
Compression
Manufacturing /
Assembly Locations
Systems Division
Global Footprint and Capacity Load
FY 2017
May 29, 2018
USA: Capacity
reduced to minimum
level slow
recovery of systems
business expectedSouth Korea: Good
workload from order
backlog in LNGM
China SYCC: Good load
from local market. Spare
capacity in foundry
additional workload as
intercompany parts- and
components supply
increases
India: Sufficient work load from
local market increasing
volume for intercompany
products; Global Support
Center for engineering,
contracting and IT
Switzerland: Low work load; short-time work in some areas since
March 2017; Global support functions for all production sites and
globalization projects (procurement, engineering, R&D)
Page 16

Systems DivisionProfitability Improvement Program
Defend Short-Term Results (30 separate initiatives)
– More aggressive upselling, adjusted to the competitive market environment
– Adapt resource level to the business volume
– Focus on project execution and stop non-urgent spending
– Minimum margins increased for tenders, especially in the Refinery business
Improve Mid-Term Competitiveness
– Global Procurement / Supply Chain
– Leverage our global network: India, China, Korea
– Standardize products and processes
Capture Growth Opportunities
– Decentralize sales force
– Develop solutions for new applications
– Further standardize compressors for the highly competitive Refinery business
May 29, 2018
FY 2017
Page 17

Our Products and Markets
Products
Markets
Laby®
Compressors
Laby®-GI
Compressors
Process Gas
Compressors
API 618
Hyper
Compressors
Standard High
Pressure
Compressors
Components
and Service
Upstream
oil & gas
Gas transport &
storage
Refinery
Petrochemical /
Chemical
industry
Industrial gases
B-Line
M-Line
May 29, 2018
FY 2017
Page 18

Systems Division
Upstream Oil & Gas
Market drivers
& trends
US political support for domestic gas production
Productivity improvements in Enhanced Oil Recovery
Changing energy mix leads to a globally increasing
demand for gas
Oil price development
Growth of middle-class in emerging countries driving
the need for natural gas-based products
Highlights
FY 2017
SYCC received one order in China
Expected market
development
Further development of the onshore business since
production costs have been significantly reduced
Once production costs will be further reduced:
Development of not easy reachable oil and gas fields
Growing enhanced oil recovery
May 29, 2018
FY 2017
Page 19

Systems Division
Gas Transport and Storage
Market drivers
& trends
Changing global energy mix towards gas
Importance of natural gas as a clean and inexpensive
source of energy
Feedstock for the Petrochemical industry changing to
low-cost LPG/LEG (e.g. in the US)
Gas is found in areas where it is not used
Highlights
FY 2017
Several orders received for LPG (delivery 2018-2020)
Orders received for LNG receiving terminals in China
and Europe
Few orders for LNGM fuel gas
Expected market
development
Reduced demand for LNGM in 2017 recovery in 2018
LPGM business continues on a lower level recovery
not before 2019
Positive development for LNG receiving terminals
May 29, 2018
FY 2017
Page 20

Laby®-GI – Fuel Gas Supply System (FGSS)
Compressor 5LP250-5B_1
Total weight 160 tons
Dimensions 13.0x7.0x5.2m
Compressor 6LP190-5C_1
Total weight 112 tons
Dimensions 11.2x6.4x4.4 m
6,400
11,200
4,400
7,000
5,200
13,000
May 29, 2018
FY 2017
Page 21

LNG Tanker «Creole Spirit»
May 29, 2018
FY 2017
Page 22

Systems Division
RefineryMarket drivers
& trends
Older/less efficient technologies trigger new equipment
or replacement of existing
Growing demand for clean fuels due to environmental
regulations (Euro V & VI)
Flexibility to process different crude oil qualities
Strategic importance of refining capacity for
independent supply
Oil producing countries capturing a greater share of
value creation across the process chain
Highlights
FY 2017
Orders from Azerbaijan, China, India, Middle East,
Russia and Southeast Asia
Expected market
development
Continuation of current high market level worldwide
Growing demand for refined products in Emerging
Countries
Investments to process different crude oil qualities
May 29, 2018
FY 2017
Page 23

Systems Division
Petrochemical / Chemical Industry
Market drivers
& trends
Annual ~2% demand growth for plastics based on
increased world population & middle class growth in
India and China
Shift of production to countries with low feed stock
price (e.g. US)
Older technologies/less efficient plants will be
replaced by state-of-the-art facilities which are more
profitable
Highlights
FY 2017
Several orders for polypropylene, polyethylene and
EPDM plants: Canada, China, Nigeria, Russia, Thailand
and USA
Expected market
development
New LDPE projects (high pressure) under discussion
(in China, Middle East and USA)
Continuous growing polyolefin demand in Emerging
Countries
May 29, 2018
FY 2017
Page 24

Systems Division
Industrial Gases
Market drivers
& trends
World population growth leads to increasing demand
for industrial gases (e.g. medical, food & beverage,
fertilizers (CO2), inert gas)
Hydrogen to be used as fuel (busses, cars, trains, fuel
cell power plants)
Pressure to reduce CO2 leads to commercial
applications for CO2
Highlights
FY 2017
Various orders received from Canada, China, India,
Japan, Nepal and Switzerland
Expected market
development
Increasing market activities in all areas in line with
GDP growth
Further potential for O2, H2, CO, CO2 and high pressure
O2 and Air
Further potential for hydrogen in mobility applications
May 29, 2018
FY 2017
Page 25

Secondary Compressor Type K12
Worlds Largest Piston-Compressor
May 29, 2018
FY 2017
Page 26

Secondary Compressor Type K12
Worlds Largest Piston-Compressor
Worlds largest LDPE line
PE production 400'000 tons per year
Possibility to produce 30 different products
High pressure design for tubular reactor >3'000 bar
May 29, 2018
FY 2017
Page 27

REVIEW SERVICES DIVISION
May 29, 2018
FY 2017
Page 28

Services Division
Financials
in CHF mn 2017 2016Change
2016/2017
Order intake 205.4 194.3 +5.7%
Sales 210.2 190.5 +10.3%
Gross profit 97.9 94.0 +4.1%
In % of sales 46.6% 49.4%
EBIT 54.4 53.0 +2.5%
In % of sales 25.9% 27.8%
Headcount (FTEs) 778 649 +19.9%
FY 2017
May 29, 2018
Page 29

Services Division
Key Figures
0
50
100
150
200
08 09 10 11 12 13 14 15 16 17
Order intake Sales
0
50
100
150
200
08 09 10 11 12 13 14 15 16 17
0
20
40
60
80
100
120
08 09 10 11 12 13 14 15 16 17
Gross profit EBIT
0
10
20
30
40
50
60
08 09 10 11 12 13 14 15 16 17
May 29, 2018
in CHF mn
Page 30
FY 2017

Services Division
Business Overview
Market drivers
& trends
High worldwide population of reciprocating
compressors (~72’000 units with a market size of about
CHF 2.7 bn)
Increasing BC & SYCC compressor population
Increasing mean time between overhaul (MTBO) and
reduction of operating costs
Age of some production plants safety aspects
Highlights
FY 2017
High activities in field service and engineering
Further service contracts for Laby®-GIs
Acquisition of CSM in Canada and cooperation with
Kompressorteknik ML AB
Opening of service sales office in Argentina
Expected market
development
Growing demand for high quality services and
components to increase MTBO
Safety issues in aging plants call for new investments
May 29, 2018
FY 2017
Page 31

FINANCIALS
May 29, 2018
FY 2017
Page 32

Order Intake
FY 2017
May 29, 2018
Increase of order intake by 10.6% to
CHF 525.2 mn
+10.3% excluding currency
translation effects
Systems Division: +14.0% to CHF
319.8 mn
Orders from Petrochemical, Gas
Transport & Storage and Refinery
Services Division: +5.7% to CHF
205.4 mn
Significant increase in field service
and engineering
Spare parts orders below the very
high prior year
About 20% OBC business
Page 33
0
100
200
300
400
500
600
07 08 09 10 11 12 13 14 15 16 17
in CHF mn

Sales increase overall by 6.6% to
CHF 594.6 mn
+6.4% excluding currency
translation effects
Systems Division: +4.7% to CHF
384.4 mn
Including some projects originally
scheduled for invoicing in FY 2016
(including the largest Hyper project
in the world)
Services Division: +10.3% to CHF
210.2 mn
Growth in all areas including
Monitoring & Diagnostics and OBC
High volume in engineering, revamp
and repair
May 29, 2018
FY 2017
Sales
Page 34
0
100
200
300
400
500
600
700
07 08 09 10 11 12 13 14 15 16 17
in CHF mn

Sales and Gross Margin by Division
Gross profit in Services Division CHF 3.9 mn above prior year
Slightly lower gross margin due to change in product mix to more Field
Service, Engineering and OBC
Gross margin in Systems Division 2.8 percentage points below prior
year
Additional cost for improvements in dual-fuel applications
Sharp rise in material prices, especially in China
Under-utilized production capacity
May 29, 2018
FY 2017
In CHF mn FY 2014 FY 2015 FY2016 FY2017
Systems
Division
GSP
GP
327.1
78.2 23.9%
332.4
73.0 22.0%
367.2
36.5 9.9%
384.4
27.2 7.1%
Services
Division
GSP
GP
146.5
74.6 50.9%
154.8
78.7 50.8%
190.5
94.0 49.4%
210.2
97.9 46.6%
TotalGSP
GP
473.6
152.8 32.3%
487.2
151.7 31.1%
557.7
130.5 23.4%
594.8
125.1 21.0%
Page 35

SGA and EBIT
SGA amounting to 13.5% of sales
(prior year: 13.9%)
Total SGA CHF 80.5 mn, prior year:
CHF 77.3 mn
– Including first full year of SYCC (prior year 11
months only) and 6 months of CSM Compressor
Inc.
– Including 12 months divisional organization
structure, vs. 6 months only in prior year
EBIT margin within guidance
EBIT CHF 6.0 mn or 12.7% below
prior year
CHF 9.3 mn less gross profit from
Systems Division
CHF 3.9 mn higher gross profit from
Services Division
May 29, 2018
22% 22%
17%
20% 20%
16%
16%15%
9%
7%
0%
5%
10%
15%
20%
25%
0
10
20
30
40
50
60
70
80
90
100
08 09 10 11 12 13 14 15 16 17
FY 2017
EBITin CHF mn ROS
Page 36

EBIT Development FY 2016 to FY 2017
May 29, 2018
Page 37
FY 2017
in CHF mn

Net Income
Net income CHF 3.5 mn or 10.8%
below prior year
CHF -1.9 mn share of results
Arkos Field Services (40%
ownership)
Financial expense CHF -1.9 mn
(prior year CHF -1.8 mn)
Tax rate of 23.5% (prior year
25.1%)
More favorable mix of local tax
rates
May 29, 2018
17%16%
13%
15% 15%
12% 12%11%
6%5%
0%
5%
10%
15%
20%
25%
0
10
20
30
40
50
60
70
80
08 09 10 11 12 13 14 15 16 17
FY 2017
in CHF mn
Page 38

Earnings and Dividend per Share
6.00
5.00 5.00
7.00
9.00
10.00 10.00 10.00
7.00
6.00
0.00
2.00
4.00
6.00
8.00
10.00
12.00
08 09 10 11 12 13 14 15 16 17
Earnings per Share Dividend per Sharein CHFin CHF
20.00
16.68
13.56
15.22
16.4215.87
16.9316.34
9.12 8.51
0.00
5.00
10.00
15.00
20.00
25.00
08 09 10 11 12 13 14 15 16 17for FY 2017 subject to approval by General Assembly
May 29, 2018
FY 2017
Page 39

Balance Sheet Positions
FY 2017
Decrease of balance sheet total by
1.7%
Equity ratio increased by 2.9
percentage points to 42.0%
Balance between advance payments
from customers and Work In
Progress plus advance payments to
suppliers at CHF -42.5 mn (prior year
CHF -42.1 mn)
In CHF mn
FY
2015
FY
2016
FY
2017
Property, Plant &
Equipment
164.5 200.4 193.2
Inventories
- Thereof WIP
- Thereof Adv.
Payments to
Suppliers
199.6
137.3
18.3
250.2
171.4
35.3
210.7
133.8
29.3
Trade Receivables 124.5 209.8 227.7
Trade Payables 49.2 60.0 65.3
Adv. Payments from
Customers
106.4 164.6 120.6
Shareholders Equity
in % of Total Balance
Sheet
50% 39% 42%
May 29, 2018
Page 40

Cash Flow and Net Financial Position
FY 2017
Slightly higher net financial position
Cash outflow from investing
activities includes the acquisition of
CSM (last year included the
acquisition of 60 % of SYCC)
Marginally lower cash flow from
operating activities
Dividend payment of CHF 7.00/share
for FY 2016 (reported under financing
activities)
Slightly decreased borrowings due to
partial repayment of mortgage and
bank loans
In CHF mn 2015 2016 2017
Cash Initial Balance 178.5 125.3 74.9
Cash Flow from
Operating Activities
40.7 46.0 44.4
Cash Flow from
Investing Activities
-63.1 -146.8 -17.2
Cash Flow from
Financing Activities
-30.9 50.9 -28.2
Currency Translation
Differencies
0.0 -0.5 1.2
Cash Position 125.3 74.9 75.1
Borrowings -32.1 -142.1 -137.2
Net Financial Position 93.2 -67.2 -62.1
May 29, 2018
Page 41

Shenyang Yuanda Compressor Co. (SYCC)
Results FY 2017
SYCC “Operation”:
Sales within expectations despite
challenging market environment
in China
EBIT significantly below
expectation due to fast and sharp
rise in material prices in China
within the second half of fiscal
year 2017
SYCC “Depreciation“:
Inventory step-up (WIP);
significant part of future gross
profit included on the initial
balance sheet (purchase price
allocation)
in mn CHF
FY
2017
SYCC
„OPERATION“
FY
2017
SYCC
„DEPRECIATION“
FY
2017
SYCC TOTAL
Sales 110.8 110.8
Gross Profit 13.4 -5.5 7.9
in % of Sales 12.1% 7.1%
EBIT 5.8 -5.5 0.3
in % of Sales 5.3% 0.2%
Net Income 4.9 -4.8 0.1
in % of Sales 4.5% 0.1%
May 29, 2018
Page 42
FY 2017
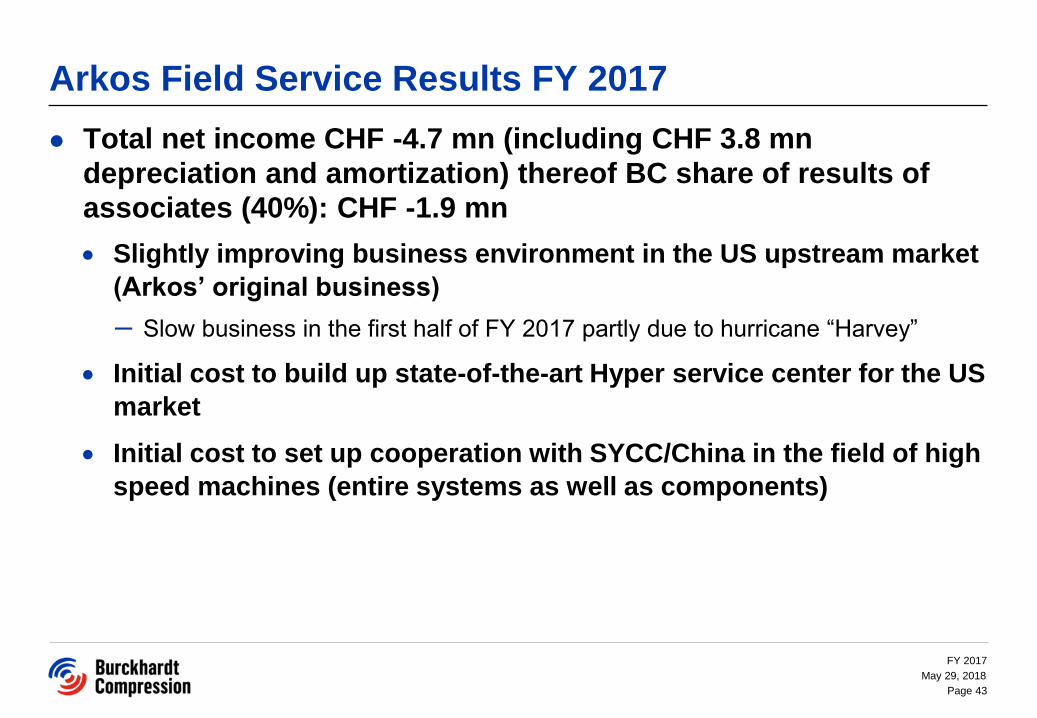
Arkos Field Service Results FY 2017
Total net income CHF -4.7 mn (including CHF 3.8 mn
depreciation and amortization) thereof BC share of results of
associates (40%): CHF -1.9 mn
Slightly improving business environment in the US upstream market
(Arkos’ original business)
– Slow business in the first half of FY 2017 partly due to hurricane “Harvey”
Initial cost to build up state-of-the-art Hyper service center for the US
market
Initial cost to set up cooperation with SYCC/China in the field of high
speed machines (entire systems as well as components)
FY 2017
May 29, 2018
Page 43

Capital Investments (Additions to fixed Assets)
0
5
10
15
20
25
30
35
2009 2010 2011 2012 2013 2014 2015 2016 2017 E2018
1) Including purchase of real estate in the amount of CHF 77.0 mn
2) Including CHF 5.8 mn investments in real estate (construction of a new building of Prognost in Germany and several
modifications to the factory in Winterthur)
3) Including assembly sites USA, South Korea and building expansion in Winterthur as well as early replacement of machining
tools in Winterthur and globalization of IT infrastructure
1)
2)
3)
90 47
May 29, 2018
FY 2017
Page 44

OUTLOOK, GUIDANCE & GROWTH AREAS
May 29, 2018
FY 2017
Page 45

Outlook
Main Developments in Market Segments 1/2
Upstream Oil & Gas
Further development of the onshore business since production costs
have been significantly reduced
Once production costs will be further reduced:
– Development of not easy reachable oil and gas fields
– Growing enhanced oil recovery
Gas Transport and Storage
LNGM low order intake in FY 2017, recovery expected end of FY 2018
environmental regulations play an important role
LPGM business continues on a lower level recovery not expected
before 2019
Further need for LNG import terminals
May 29, 2018
FY 2017
Page 46

Outlook
Main Developments in Market Segments 2/2
Refinery
Continues to be the largest market segment overall and bears the
highest potential to increase our market share (BC & SYCC
compressors) since every player builds API 618 Refinery
compressors it is also the most competitive segment
Petrochemical / Chemical Industry
Will continue to grow but competition in some areas is aggressive
New LDPE projects (high pressure) under discussion (in China,
Middle East and USA)
General
Competitors with their products are also diversifying into other
market segments in order to load their factories
May 29, 2018
FY 2017
Page 47
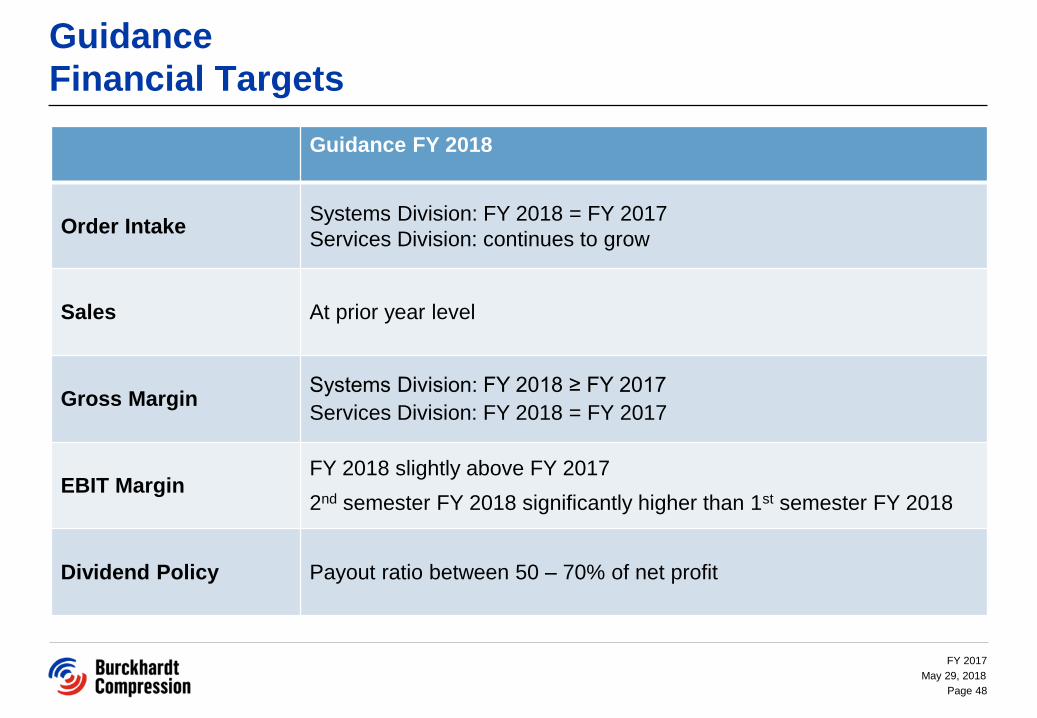
Guidance
Financial Targets
Guidance FY 2018
Order IntakeSystems Division: FY 2018 = FY 2017
Services Division: continues to grow
Sales At prior year level
Gross MarginSystems Division: FY 2018 ≥ FY 2017
Services Division: FY 2018 = FY 2017
EBIT MarginFY 2018 slightly above FY 2017
2nd semester FY 2018 significantly higher than 1st semester FY 2018
Dividend Policy Payout ratio between 50 – 70% of net profit
May 29, 2018
FY 2017
Page 48

Mid-Range Plan 2018-2022 Targets 2022
Presented on January 9, 2018
Systems Division
• Sales CHF 340 mn
• Keep leading market position in all
segments
• Use strong global presence and
Shenyang Yuanda Compressor
• Focus on operational excellence
• EBIT Margin of 0 - 5%
Services Division
• Sales CHF 360 mn
• Grow 6 - 8% per year
• Organic growth on BC and OBC
business
• Further growth through
acquisitions (OBC)
• EBIT Margin of 20 - 25%
BC Group
• Sales CHF 700 mn
• Keep leading market position in
Systems Division
• Become a leading Services
provider
• Strengthen global capabilities
• Live Values & Behaviors
• Improve overall profitability
• EBIT Margin of 10 - 15%
• Sustainable value increase
May 29, 2018
FY 2017
Page 49

Growth Areas
Systems Division
Capitalize on geographical
expansions and acquisitions
Refinery business
Services Division
Grow in all business areas
Further selective geographical
expansion
Services Division
Add-on acquisitions (focus OBC business)
Org
an
ic G
row
thA
cq
uis
itio
ns
May 29, 2018
Page 50
FY 2017

SHAREHOLDERS
May 29, 2018
FY 2017
Page 51

Burckhardt Compression Shareholder Structure
12.40%
6.93%
6.89%
4.99%
3.49%
3.03%3.01%
3.01%
43.01%
13.24%
MBO Shareholder Group
19 Institutional
Shareholders
0.3% - 2.9%
> 4’000 Individual
Shareholders
Ameriprise Financial Inc.
Credit Suisse Funds AG
NN Group N.V.
UBS Fund Management (Switzerland) AG
Atlantic Value General Partner Ltd.
(Mondrian)
Massachusetts Mutual Life Insurance Company
(Oppenheimer)
JO Hambro Capital Management Limited
Status 31.03.2018
May 29, 2018
FY 2017
Page 52

Performance of BCHN Share Compared to the SPI
Index
May 29, 2018
FY 2017
2006 2007 2008 2009 2010 2011 2012 2013 2014 2015 2016 2017 2018
26.6.06 30.3.07 31.3.08 31.3.09 31.3.10 31.3.11 30.3.12 31.3.13 31.3.14 31.3.15 31.3.16 31.3.17 31.3.18
85.00 199.50 317.00 106.00 208.00 244.20 247.50 355.30 455.00 366.75 329.75 271.50 304.80
BCHN
304.80
Page 53

Seven Good Reasons to Invest
One strong brand
Attractive markets
with predictable
long-term
growth potential
Sustainable and predictable dividend policy
Global presence and closeness to the customer
Management, Board
and IPO team own
12.6% of the company
Divisional setup:
• Economic stability in cyclical market conditions
• Agility on the respective markets
Broad experience in any gas compression challenge
May 29, 2018
FY 2017
Page 54

Disclaimer
This document may contain forward-looking statements including, but not limited to, projections of financial developments, market activity, or future performance of products. These forward-looking statements are subject to change based on known or unknown risks and various other factors that could cause actual results or performance to differ materially from the statements made herein.
May 29, 2018
FY 2017
Page 55
