bursting bubbles: portland's distressed housing market
TRANSCRIPT

Heinicke • Bursting Bubbles • Portland’s Distressed Housing Market
PSU Center for Real Estate • Quarterly & Urban Development Journal • 2nd Quarter 2009 • Page 35
Bursting Bubbles: Portland’s Distressed Housing Market Tom Heinicke, Broker, Meadows Group, Inc. 1 As of mid 2008, essentially all leading home price indexes had been confirming declines for all major U.S. Metropolitan Statistical Areas (MSAs), bringing to an end what economists consider the greatest asset bubble in history2. Throughout the nation, these housing bubbles have varied in intensity. Home values almost tripled in a span of a couple of years in places such as Miami or Las Vegas. In Portland, by contrast, price movements reflected a more moderate trajectory, nonetheless producing gains in excess of 90% between 2000 and late 20073. Apart from intensity, Portland’s housing bubble also differed markedly with respect to timing. San Diego and Los Angeles, for instance had maintained consistently high appreciation rates since the late 1990s, whereas the Las Vegas and Phoenix bubbles did not develop until 2003 and 2004 respectively. Portland was even later yet, experiencing its highest appreciation in 2005 and parts of 2006. Home Price Appreciation Index for Selected Metropolitan Areas (S&P/Case-Shiller)
By mid-to-late 2006, at a time when the Portland housing market was in full swing, the bubble had popped in many parts of the country. Portland had been late to the party and would be among the last to leave. Eventually as much as 18 months after the first hot markets had begun to cool down, Portland started showing signs of weariness.
1 www.agent503.com 2 Irrational Exuberance, 2nd edition AND “In come the waves”, Economist, June 16, 2005 3 S&P/Case-Shiller Home Price Indices
L.A., CA Miami, FL Las Vegas, NV Phoenix, AZ Portland, OR
100.00
120.00
140.00
160.00
180.00
200.00
220.00
240.00
260.00
280.00
300.00
Jan-0
0
Jul-0
0
Jan-0
1
Jul-0
1
Jan-0
2
Jul-0
2
Jan-0
3
Jul-0
3
Jan-0
4
Jul-0
4
Jan-0
5
Jul-0
5
Jan-0
6
Jul-0
6
Jan-0
7
Jul-0
7
Jan-0
8
Jul-0
8
Jan-0
9

Heinicke • Bursting Bubbles • Portland’s Distressed Housing Market
PSU Center for Real Estate • Quarterly & Urban Development Journal • 2nd Quarter 2009 • Page 36
Planned Communities, Suburban Developments Take the First Blow During the boom years, Portland's urban growth boundary (UGB) served as a means to protect the city against the perils of endless sprawl. The limited space available to developers within the city limits helped to contain the supply of housing inventory and avoid the deep pain found in fast-growing cities in the nation’s southwest.
Nonetheless, recent nearby incorp-orations and additions to the UGB, such as 800 acres of land on the north side of NW Springville Road in 2002, created potentially lucrative opportunities for developers of master-planned communities. As a result, a record 16,786 building permits were issued in 2005, followed by another 15,325 in 2006.4
In the wake of ever tighter credit markets and an increasingly dismal economic outlook, demand then began to dry up, leaving behind large numbers of desperate sellers and dozens of nearly vacant subdivisions. Happy Valley’s Francesca Lane, in Clackamas County embodied this trend like few other developments in the Portland metropolitan area and soon became the Oregonian’s poster child for developer greed, lofty housing dreams and the inevitable harsh landing5.
“In 2006 young families rol led in to snap up $600,000, stone-fronted homes with Mount Hood views. They came for the country meets cul-de-sac life, solid schools and a 4,000-square-foot edition of the American dream. Speculators trailed on their heels for the next get-rich-quick venture.
One of every five homes or lots on the street has fallen into foreclosure since the neighborhood sprang up three years ago. The street offers a grim picture of how greed
dragged Happy Valley, Oregon, and even the world, into financial turmoil. Francesca Lane is where the country's gamble on high-risk mortgages inflated home values, then crashed down on the freshly manicured lawns”6
4 Number of Building Permits; Portland-Vancouver-Beaverton, OR-WA; Total, 2005;2006 5 Road to ruin: Happy Valley street embodies national housing bust, Oregonian, Dec 06, 2008

Heinicke • Bursting Bubbles • Portland’s Distressed Housing Market
PSU Center for Real Estate • Quarterly & Urban Development Journal • 2nd Quarter 2009 • Page 37
Source: First American Loan Performance
%
Source: Oregonian
1. Buena Vista Custom Homes lot in
foreclosure lawsuit 2. Ditto 3. Investment home with no-down payment
loan, interest-only option and $5,000 monthly payment; purchased for $633,000, re-sold for $515,000
4. Subprime, no-down loan, two-year adjustable rate and interest only option, resold for $450,000
5. No-down loan, five-year adjustable rate, resold for $450,000
6. Home bought for 638K on no-down loan. Then filed for bankruptcy and reported $35,477 in wages. Resold for $470,000
7. Subprime, no-down loan. Resold: $477,000
8. Subprime loan, 11.75% interest, $6,390 monthly payments. Resold: $435,000
9. Developer deeded home to bank in-lieu of foreclosure
10. Ditto.7
With more than 675 empty lots and 35 half-finished homes exposed to the weather, price points soon started to tumble, affecting nearby neighborhoods and eventually leading to one of the highest numbers of foreclosures for any county in the state or Oregon8. The Center for Responsible Lending, a North Carolina nonprofit, estimates 50,000 Clackamas County homes will lose an average of $3,200 in value because of neighboring foreclosures.
Subprime-Related Defaults Usher In Initial Wave of Suburban Distress
Spillover effects from neighboring subdiv-isions contributed to a rising number of distressed property situations throughout the Portland-metro area. However, the bulk of short sales and foreclosures that surfaced in the early stages of the downturn i.e. onwards from Q3/2007, were the result of sub-prime9 lending practices, particularly prevalent among low-income, high risk borrowers.
6 Ibid. 7 Ibid. 8 Clackamas Co. among highest foreclosure rates in Oregon, MSNBC, Mar 19, 2009 9 According to the U.S. Dept. of Treasury guideline: "Subprime borrowers typically have weakened credit histories that include payment delinquencies and possibly more severe problems such as charge-offs, judgments, and bankruptcies. They may also display reduced repayment capacity as measured by credit scores, debt-to-income ratios, or other criteria that may encompass borrowers with incomplete credit histories."
Share of Delinquent Mortgages Nationwide

Heinicke • Bursting Bubbles • Portland’s Distressed Housing Market
PSU Center for Real Estate • Quarterly & Urban Development Journal • 2nd Quarter 2009 • Page 38
Having largely been priced out of property markets in the urban core, a high-risk demographic group has typically sought more affordable alternatives on the outskirts of Portland, as indicated below.
Map of Median Household Income for Portland-Metro Areas – Year 2000 (Subprime-Related Default Hotspots Outlined in Red)
Source: U.S. Census Bureau, 2000
Therefore, on Portland’s eastside a large proportion of the initial wave of defaults has been concentrated in areas bordering the I-205 corridor as well as North and NE Portland.
Average # of Notice Of Default Filings Per Week For Eastside Zip Codes, Q4/2007
Source: First American Title Co.
97203 97217 97211 97213 97215 97214 97236 9726697202 97233
1 2 3 4 5 6

Heinicke • Bursting Bubbles • Portland’s Distressed Housing Market
PSU Center for Real Estate • Quarterly & Urban Development Journal • 2nd Quarter 2009 • Page 39
The vast majority of these homes had a market value that was significantly lower than the median sales price ($285,000) for the Portland-metro area at the time10. In fact, at the median price sold for both bank-owned and short sales in Q4/2007 for zip codes 97206, 97236 and 97266 was roughly $100,000 less than the median for the city at large.
Profile of Eastside Homes In Subprime Distress (Zip Codes: 97206, 97236, 97266)
Average Sold Price Of Short Sales: $ 195,497
Median Sold Price Of Short Sales: $ 173,250
Average Sold Price Of Bank-Owned: $ 188,338
Median Sold Price Of Bank-Owned: $ 169,205
Average Sq. Ft: 1,720
Median Sq. Ft: Source: RMLS, Q4/2007
1,532
Gradually, Distress Turns Endemic
Initially a suburban phenomenon, distress soon spread throughout the Portland metropolitan area accelerating as more and more delinquent borrowers were added to the statistics.
Share of Delinquent Loans Increases by 70%, Year-over-Year
Share of Delinquent Loans, Fourth Quarter (Oregon vs. U.S. Average)
Ranked among the top five states for loan performance as recently as Q4/2007, Oregon appeared to remain largely unscathed by the housing downturn. By the fourth quarter of 2008, however, the share of delinquent loans had reached 5%, up more than 70%.
Mortgage delinquencies for the nation as a whole are reported at 7%, influenced to a large extent by foreclosure hot spots such as Cal-ifornia, Florida and Nevada. Oregon mortgage troubles have yet to reach levels seen during the 1980s timber recession, but delinquencies clearly exceed the fallout from the dot.com bust.11
Source: Mortgage Bankers Association
10 Median Sales Price for Q4/2007, RMLS
6.2%
2002 2007 1982
3.7% 3.0%
5.1%
2008
Oregon
2008
7.0%
U.S.

Heinicke • Bursting Bubbles • Portland’s Distressed Housing Market
PSU Center for Real Estate • Quarterly & Urban Development Journal • 2nd Quarter 2009 • Page 40
Loans that have been delinquent for more than 90 days are typically subject to a notice of trustee sale and typically scheduled for foreclosure proceedings. This process is referred to as “foreclosure starts”. Tracking foreclosure starts provides additional insight into housing distress.
Foreclosure Starts Increase 111% From the Same Time Last Year
N u m b e r o f F o r e c l o s u r e S t a r t s Fourth Quarter (Oregon)
Roughly 5,000 foreclosure starts were recorded for Q4/2008 – more than twice as many as in Q4/2007. On average, 55 foreclosure starts were filed each day in the last quarter of 2008 up from 26 per day one year earlier.
Assuming a linear trend over the next couple of months, foreclosure starts will have increased threefold by the mid 2009 over late 2003.
Source: Mortgage Bankers Association
Oregon’s housing distress phenomenon also appears to have closed the gap with many other States. According to RealtyTrac, an online marketplace for foreclosures, the number of properties in Oregon with at least one foreclosure filing (default, auction, repossession) has risen steadily, placing Oregon among some of the most distressed states in the country by some measures.
Oregon Among Top 5 States For Foreclosure Filings
Number of Foreclosure Filings (1/every HH rate), January 2009
A recent RealtyTrac report showed Oregon among the top five states with the most foreclosure filings on a per household basis for the month of January. One in every 357 homes in Oregon received a foreclosure filing, with less densely populated counties such as Deschutes, Jackson and Clackamas at higher levels.12 Oregon’s February rating improved slightly putting Oregon in 9th place.
1. Nevada (1 in every 76)
2. California ( 1 in every 173)
3. Arizona (1 in every 182)
4. Florida (1 in every 214)
5. Oregon (1 in every 357)
24. Washington (1 in every 874)
Source: RealtyTrac
11 MBA National Delinquency Survey, 4th Quarter 2008, Mortgage Bankers Association 12 The 1/every HH approach is skewed by counties with a large number of foreclosures, but low population density
1,857
2007 2008 2003
2,339
4,939
111%

Heinicke • Bursting Bubbles • Portland’s Distressed Housing Market
PSU Center for Real Estate • Quarterly & Urban Development Journal • 2nd Quarter 2009 • Page 41
Alarming Delinquency Trend Similar Across Tri-County Area
Number of Notices of Default Filed Per Month By County
Multnomah County, the most populous among the three largest Oregon counties, dominates delin-quency filings. In January 2009, roughly 730 Notices of Default were recorded, up 175% from one year ago. Delinquency filings were up threefold for Washington County, Reg-istering 431 filings for the month of January and surpassing Clackamas County, where delinq-uency grew 118%.
Source: First American Title Co.
Not every delinquent homeowner suffers foreclosure. As a result, the actual number of foreclosed properties will differ considerably from delinquency rates for a given area. In spite of the fact that trustee/foreclosure sales are open to the public, most foreclosed properties in Oregon currently revert back to the bank. Market inventory for distressed properties typically also consists of short sales13.
Largest Inventory of Bank-Owned Short Sales - Multnomah County
Number of Bank-Owned and Short Sale Properties Listed For Sale-Mar 26, 2009
Within the tri-county area, Mult-nomah County currently offers the largest inventory of bank-owned and short sale properties. More than 700 short sales and 250 bank-owned properties are available to buyers in Portland’s most populous county.
Washington County trails Mult-nomah by some 100 bank-owned properties and reports roughly 100 fewer short sales. Short sales are least common in Clackamas county.
Source: RMLS
13 A short sale is a sale of real estate in which the proceeds from the sale fall short of the balance owed on the loan.
0
100
200
300
400
500
600
700
800
Jan Feb Mar Apr May June July Aug Sept Oct Nov Dec Jan Feb
2008 2009
Multnomah Clackamas Washington
Washington MultnomahClackamas
100
200
300
400
500
600
700
Bank-Owned Short Sale

Heinicke • Bursting Bubbles • Portland’s Distressed Housing Market
PSU Center for Real Estate • Quarterly & Urban Development Journal • 2nd Quarter 2009 • Page 42
Distress Likely Spurred by Delinquencies on Alt-A Mortgages
It would appear that a significant proportion of the most recent rise in housing distress throughout the Portland metropolitan area can be attributed to a phenomenon that is accelerating nationwide. Homeowners with good credit are falling behind on their payments in growing numbers, even as the problems with mortgages made to people with weak, or subprime, credit are showing their first, tentative signs of leveling off.14 Of particular concern are so-called “Alt-A” mortgages, offered to borrowers in the segment between subprime and prime. This market was created as a means of extending home ownership to those, such as the self-employed, with a reasonable credit standing but unsteady income. Alt-A lenders specialized in loans with limited documentation requirements and exotic features such as negative-amortization mortgages, akin to a credit card, which allow borrowers to pay less than the accrued interest, with the difference added to the loan balance. Negative-amortization and interest-only mortgages seemed appealing to many borrowers while home prices were still rising and homes could be sold prior to payments on principal being required. After spending several years paying only interest or sometimes even less than that, many Alt-A borrowers are now seeing their payments jump 50 % or more. The higher bills come as home prices continue to decline and banks tighten their lending standards, making it harder for people to refinance loans or sell their homes ultimately forcing homeowners into negative equity, under-water positions and pushing up the number of defaults.
Alt-A borrowers typically had a five- or seven-year grace period before payments toward principal were required. By contrast, subprime loans had a two-to-three-year introductory period. That difference partly explains the lag in delinquencies between the two types of loans. Alt-A troubles first made headlines last summer, when IndyMac, the seventh largest mortgage originator in the nation, had to be seized by the FDIC as a result of its over-leveraged Alt-A operations.15 The speed at which Alt-A mortgages have since soured has taken many by surprise.
Moody’s, which had issued a relatively optimistic outlook for Alt-A loans in mid-2008, recently quadrupled its loss projections on bonds backed by
such loans. Of the $59 billion of AAA-rated securities on which Moody’s cut ratings in late January, an overwhelming 91% were subsequently downgraded to junk bond status. Moody’s now expects losses for 2006-07 Alt-A securitizations to top 20%, compared with an historical average of well under 1%. The volume of Alt-A debt nationwide is substantial. Currently an estimated $1.3 trillion of total Alt-A debt exists, including both securitized and unsecuritized loans. According to some sources losses could exceed $600 billion, almost as much as expected subprime losses.16
An estimated 26,000 Portland-area homeowners currently hold an Alt-A mortgage. Portland residents, facing relatively high-priced homes but not-so-high incomes, resorted to Alt-A mortgages more frequently than residents of most other American cities, while using fewer subprime loans.17 Much of the recent data would seem to support that Alt-A and prime delinquencies are indeed a serious and growing problem for Portland and beyond. 14 Housing Lenders Fear Bigger Wave of Loan Defaults, New York Times, Aug 8, 2008 15 IndyMac Bank seized by federal regulators, LA Times, July 12, 2008 16 Move Over, Subprime, Economist, Feb 5, 2009 17 Shaky loans may spur new foreclosure wave, Portland Tribune, Mar 6, 2009
Heinicke • Bursting Bubbles • Portland’s Distressed Housing Market
PSU Center for Real Estate • Quarterly & Urban Development Journal • 2nd Quarter 2009 • Page 43
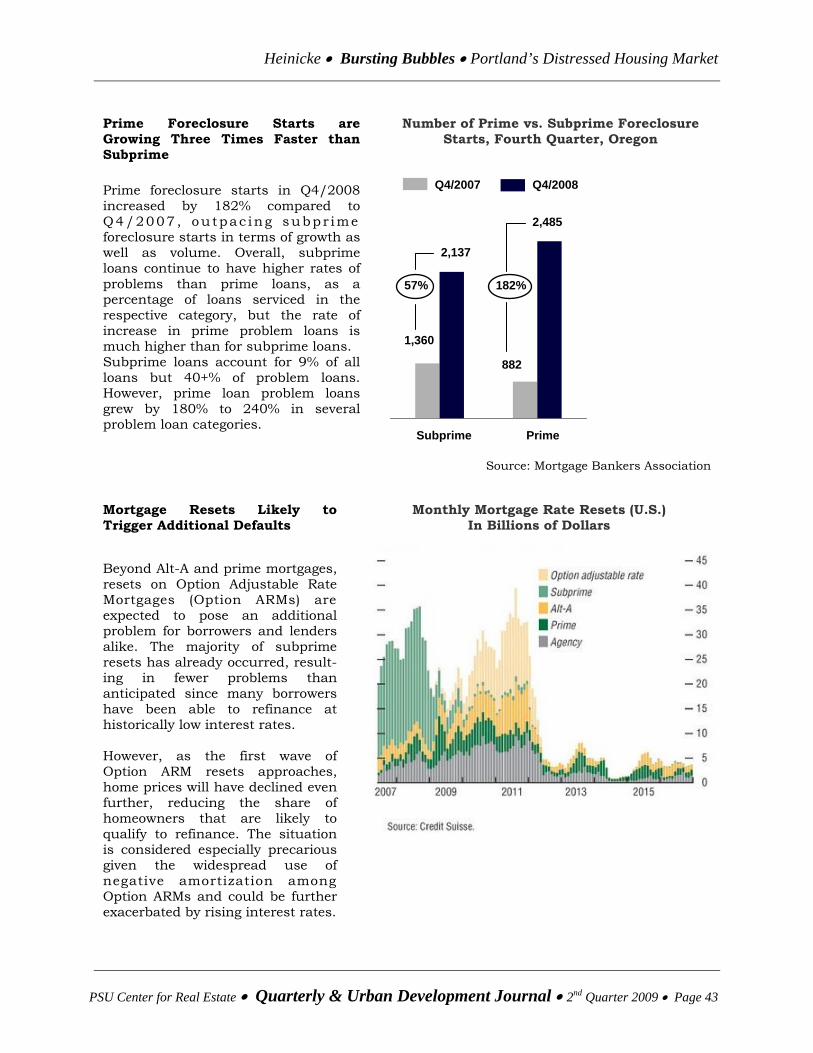
Prime Foreclosure Starts are Growing Three Times Faster than Subprime
Number of Prime vs. Subprime Foreclosure Starts, Fourth Quarter, Oregon
Prime foreclosure starts in Q4/2008 increased by 182% compared to Q4/2007 , ou tpac ing subpr ime foreclosure starts in terms of growth as well as volume. Overall, subprime loans continue to have higher rates of problems than prime loans, as a percentage of loans serviced in the respective category, but the rate of increase in prime problem loans is much higher than for subprime loans. Subprime loans account for 9% of all loans but 40+% of problem loans. However, prime loan problem loans grew by 180% to 240% in several problem loan categories.
Source: Mortgage Bankers Association
Mortgage Resets Likely to Trigger Additional Defaults
Monthly Mortgage Rate Resets (U.S.) In Billions of Dollars
Beyond Alt-A and prime mortgages, resets on Option Adjustable Rate Mortgages (Option ARMs) are expected to pose an additional problem for borrowers and lenders alike. The majority of subprime resets has already occurred, result-ing in fewer problems than anticipated since many borrowers have been able to refinance at historically low interest rates. However, as the first wave of Option ARM resets approaches, home prices will have declined even further, reducing the share of homeowners that are likely to qualify to refinance. The situation is considered especially precarious given the widespread use of negative amortization among Option ARMs and could be further exacerbated by rising interest rates.
Prime Subprime
1,360
2,137
57%
2,485
882
182%
Q4/2007 Q4/2008

Heinicke • Bursting Bubbles • Portland’s Distressed Housing Market
PSU Center for Real Estate • Quarterly & Urban Development Journal • 2nd Quarter 2009 • Page 44
Higher-End Homes Increasingly Affected By Mortgage Crisis
As distressed housing works its way up the food chain, the crisis is spreading from lower-priced neighborhoods to well-heeled parts of town. From high-end downtown condos to 4,000 square foot close-in mansions, distressed properties have become increasingly common.
Delinquency No Longer An Entry-Level Phenomenon
In the Pearl District, borrowers are late on their payments at such high-end condominiums as the Henry or the Waterfront Pearl, where luxury lofts until recently have been selling at a minimum of $500 per square foot. Delinquency has become a regular feature at several South Waterfront developments, notably the John Ross.
Recent Notice Of Default Filings For Multnomah County
Location Purchase Price Mortgage Amount Default Amount
Henry Lofts (Condo) $ 490, 000 $ 343,000 $ 10,565
Pinnacle (Condo) $ 817,500 $ 613,100 $ 24,105
Belmont/Hawthorne (SFH) $ 760,000 $ 608,000 $ 37,337
Forest Heights (SFH) $ 1,100,000 $ 715,000 $ 30,382
Alameda (SFH) $ 875,000 $1,000,000 $ 45,293
Source: First American Title Co.
High-End Distressed Properties Have Been Selling At Significant Discounts
Roughly 50 distressed condos are currently on the market in downtown Portland. More than half of the re-sale inventory at the Shoreline townhouses in the Pearl District is bank-owned. Half a dozen ridge-top mansions in Forest Heights have been substantially discounted since banks took them back. Some of the most competitively priced inventory in the Portland-metro area is either a short sale or bank-owned, placing considerable pressure on conventional sales in recent months. In an effort to move large-ticket inventory off their balance sheets, banks have begun to show more flexibility when negotiating with cash buyers.

Heinicke • Bursting Bubbles • Portland’s Distressed Housing Market
PSU Center for Real Estate • Quarterly & Urban Development Journal • 2nd Quarter 2009 • Page 45
Recent Sales Of Distressed Property In Multnomah County
Location Sale Price Sale Date Previous Sale Price
Previous Sale Date % Decline
Pearl District $ 420,000 Mar, 2009 $ 755,000 Jun, 2006 44%
Sullivan’s Gulch $ 475,000 Mar, 2009 $ 549,000 Jul, 2005 13%
West Linn $ 382,000 Mar, 2009 $ 541,000 Sept, 2006 29%
Downtown $ 700,000 Oct, 2008 $ 1,115,000 Dec, 2006 37%
Forest Heights $ 800,000 Dec, 2008 $ 1,220,000 July, 2006 34%
Source: RMLS
Liquidation Sales, Auctions and Incentive Programs Sought To Unload Inventory Liquidation sales and auctions have been a staple method to unload surplus inventory among developers faced with the prospect of bankruptcy since the early days of the housing market downturn.
Buena Vista Custom Homes conducted a well-publicized December 2007 auction that resulted in 141 homes being sold generating over $65 million in sales18. The December sale is believed to be the largest two-day sale of real estate by one seller in Oregon history. In early 2008, another auction followed with 52 homes from nine of Buena Vista's neighborhoods and 18 buildable lots from three different developments in the Portland metropolitan area. Buyers at the December auction, in particular, were able to purchase homes at significant discounts:
• In Beaverton's Carson Crest neighborhood, a home previously listed at $624,950 was sold at auction for $475,000, discounted 24 percent.
• In Sandy, a home in Buena Vista's Hamilton Ridge development sold for $241,500 after
being previously listed at $321,950, discounted 25 percent.
Pacific Lifestyle Homes and Legend Homes, two of four local home builders to file for reorganization under Chapter 11 of the U.S. Bankruptcy Code in 2008, had formed a joint marketing venture to sell more than 100 completed homes in the Willamette Valley by the end of March.19 List prices ranged between $174,000 and $599,999. The event has been a considerable success, clearing out more than 40% of the available inventory.
18 Oregon Home Builder Announces Second Home Auction, Reuters, Feb 08, 2008 19 Bankrupt home builders form marketing venture…, Portland Business Journal, Jan 22, 2009

Heinicke • Bursting Bubbles • Portland’s Distressed Housing Market
PSU Center for Real Estate • Quarterly & Urban Development Journal • 2nd Quarter 2009 • Page 46
Recent Sales at New Home Liquidation Sale
Location Original Price Sale Price20 Discount %
Hillsboro $ 269,900 $ 209,900 22%
Happy Valley $ 425,200 $ 368,900 13%
Wilsonville $ 536,962 $ 469,900 13%
Tigard $ 412,833 $ 354,900 14%
Wilsonville $ 436,818 $ 387,900 12%
Source: RMLS, Pacific Lifestyle Homes, Legend Homes
Community Financial Corp., a subsidiary of Banner Bank, recently launched “The Great Northwest Home Rush”, a program that is intended to boost sales for builders who owe the bank millions of dollars, by offering mortgages to new homebuyers at less than four percent interest. Loans are available only for properties purchased from a list of roughly 300 homes and lots in the Portland-metro area developed by numerous builders indebted to Banner Bank. Although Banner Bank never engaged in subprime lending, it did provide construction and land loans to dozens of builders during the boom. The bank's publicly traded parent company, Banner Corp., recently reported that it had about $150 million in bad residential construction loans and related lot and land loans on the books at the end of 2008. The program officially ended on Mar 22, 2009 after some 30 homes sold, generating at least $ 50,000 million in loans for Banner. 21
The Real Estate Disposition Company (REDC), one of the nation’s largest residential real estate auction marketing companies, held its largest auction to date in the Portland-metro area in April. Despite attendance of over 1,000 people, bids were accepted for only 35 of 50 properties, subject to seller confirmation. Auction inventory included a wide range of properties from beach homes in Tillamook County to condominiums in the Pearl District and custom homes in upscale neighborhoods.
3,000 Square Foot Forrest Heights Home Among 50+ Properties at Auction
Source: REDC
20 Sale pending. Final price and additional incentives not confirmed 21 Bank offers home loans below 4%, Inman News, Mar 17, 2009

Heinicke • Bursting Bubbles • Portland’s Distressed Housing Market
PSU Center for Real Estate • Quarterly & Urban Development Journal • 2nd Quarter 2009 • Page 47
Outlook: Rapid Recovery Unlikely Much of outlook for the Portland real estate market will depend on how unemployment is affected by the economic downturn in the months ahead. Recent trends have not been very encouraging. So far, lay-off announcements by Oregon’s most prominent and significant employers have been fairly moderate.
• OHSU, Portland largest employer with 12,700 staff, suffered substantial investment losses in 2008 and now needs to reduce expenses by about $30 million, approximately 4 percent of payroll22.
• In February, Nike, the state’s largest publicly traded company announced that it intends to cut its workforce by 4% as part of restructuring efforts23.
• Portland’s PCC Structurals, Inc., a division of Precision Castparts Corp., the second-largest publicly traded company based in Oregon, will cut 10 percent of its salaried workers24.
Nonetheless Oregon’s downward employment trend is well underway. According to Oregon Employment Department officials, the state lost 81,800 jobs in the past 12 months, far exceeding the 64,500 jobs lost between 2001 and 2003 during the previous recession25. The number of unemployed Oregonians jumped to 236,286 in February, more than doubling over the past 12 months. The state's total nonfarm payroll employment fell to 1,636,400. Experts were particularly concerned by February numbers which revealed a one-month loss of 21,700 jobs, seasonally adjusted, the largest since the state began keeping records in 1977. On average, 775 jobs Oregon were lost each day in February.
Oregon Loses 21,7000 Jobs in February, Now #3 In The Nation For Unemployment
Source: Oregonian
As a result of February’s steep drop, unemployment in Oregon jumped a full percentage point - up from January's rate of 9.8 percent. According to David Cooke, a state labor economist,
22 OHSU freezes salaries, plans layoffs, Oregonian, Dec 01, 2008 23 Nike may cut workforce by up to 4% as part of restructuring; MarketWatch, Feb 10, 2009 24 Precision Castparts plans 10% layoffs, DJC, Jan 13, 2009 25 Oregon jobless rate hits 10.8%, Oregonian, Mar 16, 2009

Heinicke • Bursting Bubbles • Portland’s Distressed Housing Market
PSU Center for Real Estate • Quarterly & Urban Development Journal • 2nd Quarter 2009 • Page 48
Oregon hasn't had 10.8 percent unemployment since July 1983. By the end of March, Oregon’s unemployment reached 12.1%. Oregon now has the second-highest unemployment rate in the country, behind only Michigan at 12.6%.
The administration’s Homeowner Affordability and Stability Plan is expected to bring some temporary relief for housing markets as banks suspend foreclosures, while some debt situations are worked out with delinquent borrowers. However, considerable doubt remains as to how the plan will be perceived by lenders, the entities charged with implementing the plan. If billion-dollar bailout funds are not encouraging banks to increase lending, it remains questionable how much can be expected from yet another set of incentives, well intentioned though they might be.26 Action on behalf of lenders is furthermore impeded by the complexity of the plan with multiple programs, federal and state bureaucracies, conditions and caveats. The four-page White House executive summary is confusing to many. How well it may be digested by the average bank officer or low-income subprime borrower is open to question.
Assuming distressed property inventory does indeed level-off, Multnomah County would still face at least another 10-12 months to clear out its share of distressed property, based on the current rate of sales for this category27. That’s assuming demand continues at current levels, in spite of a worsened economic outlook in recent months. It may be more likely that inventory will increase as banks are not inclined to suspend foreclosures indefinitely and many borrowers face increasing pressures to meet payments in a harsh economic climate.
26 Gov't: Bailed-Out Banks Still Not Lending, USA Today, Mar 17, 2009 27 Number of distressed property sales for the month of February 2009 divided by total amount of available distressed inventory for that month. Source: RMLS