business analysis & valuation using financial statements lecture notes professor david m. chen...
TRANSCRIPT
Business Analysis & Valuation
Using Financial Statements
Lecture Notes
Professor David M. ChenGraduate Institute of Finance
Palepu, Krishna G., Paul M. Healy, and Victor L. Bernard
3rd edn, South-Western, Thomson, 2004

ContentI. FrameworkII. Tools
2. Strategy Analysis3 & 4. Overview of & Implementing Accounting Analysis5. Financial Analysis6. Prospective Analysis: Forecasting7 & 8. Prospective Analysis: Valuation Theory & Concepts /
ImplementationIII. Applications
9. Equity Security Analysis10. Credit Analysis and Stress Prediction11. Merger & Acquisitions12. Corporate Financing Policies13. Communication & Corporate Governance

5 Minutes to AccountingBalance Sheet
Sources of fund: Owed or borrowed Trade credits Short-term borrowing Long-term borrowing Invested Common stock Paid-in capital Preferred stock Earned Retained earnings Adjustments
Storage of fund: Current Cash & equivalents Marketable securities Receivables Inventory Prepaid items Long-term investments Land, plant & equipments Others Intangibles Goodwill

Income Statement Statement of Cash Flows
Revenue- Cost of good sold Gross profit- S&A expenses Operating profit+- Non-operating G/L EBT- Income taxes Net income
Net income+ Non-cash expenses- Non-cash revenue+ Net interest expenses Operating cash flow+- Working capital+- Long-term assets+- Debt financing & interest expenses+- Equity financing & dividend payouts Cash

Major Accounting IssuesOff-balance-sheet liabilities
Off-balance-sheet financingDerivatives (financial guarantees) Financing vs. salesPurchases vs. leases
Concealed liabilitiesContingent liabilities
EnvironmentalEmployee relationshipsPending lawsuits

Distorted earningsTiming of revenue recognition
Period-closing salesTiming of expense recognition
Taking a big bathDirty surplus
Asset recognition and measurementMethods of measurement
Fair value vs. historical cost (impairment)Depreciation and amortization Intangible assets
Phantom assetsFraud

II. FrameworkQuestions Addressed
Security analysisActual vs. expected performance?
• Analyst own & consensus forecasts?• Why different?
Valuation given assessment of current & future performance?
Credit analysisCredit risk involved in lending (trades)?
• Management of liquidity & solvency?• Business risk & financial risk?• Loan pricing?

Management consultingIndustry structure?Strategies pursued by various players?
• Relative performance of different firms?Corporate management
Fair market valuation?• Investor communication program adequate?
Search for a potential takeover target• Value could be added by M&A?• M&A financing?
AuditingAccounting policies & accrual estimates consistent with the business
& its recent performance?• Financial reports communicate current status & significant risks of the
business*?

Role of Financial ReportingChanneling savings into business investments
Socialist (communist) model• Through central planning and government agencies to pool
national savings and to direct investments in business enterprises (GOEs).
• Delegation of both the political power and the economic power to central planners.
Capitalist model• The Future of Capitalism*• Capital markets: shareholder vs. capitalist capitalism
(McKinsey). Recreate credible “inside information”
The functioning of capital markets

Information asymmetry & incentive compatibility problems• Cost and credibility of communication.• Lemon markets: unable to differentiate, bad proposals crowed out
good proposals, and investors lose confidence in the market. Financial & information intermediaries
• FSs for laymen vs. for experts?• The level of financial supervision.*
Savings
BusinessIdeas
InformationIntermediaries
FinancialIntermediaries
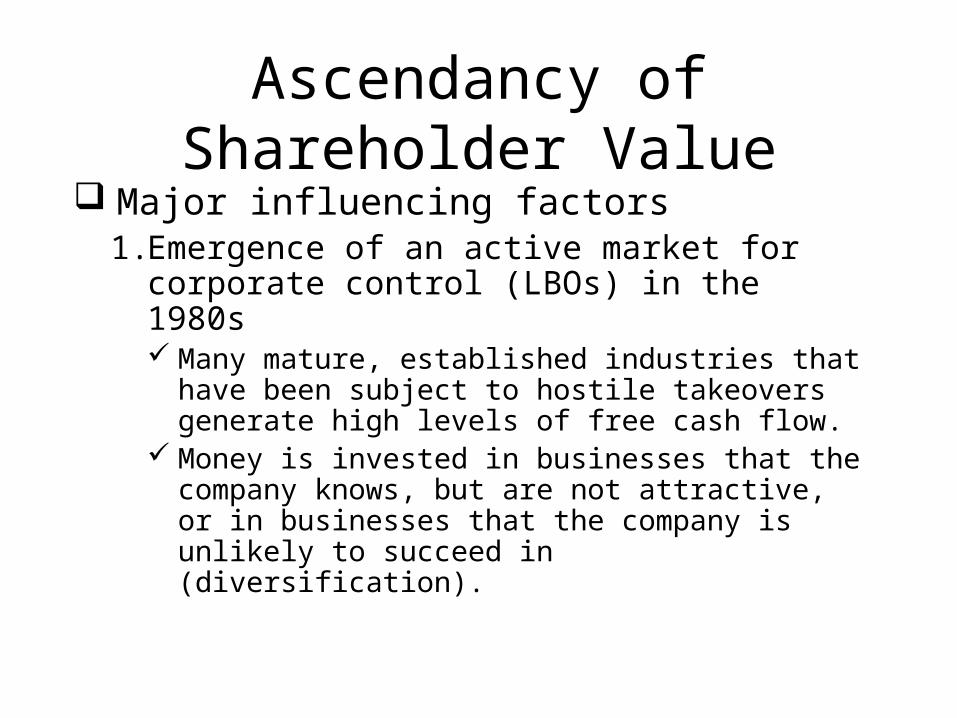
Ascendancy of Shareholder Value
Major influencing factors1. Emergence of an active market for
corporate control (LBOs) in the 1980s Many mature, established industries that have
been subject to hostile takeovers generate high levels of free cash flow.
Money is invested in businesses that the company knows, but are not attractive, or in businesses that the company is unlikely to succeed in (diversification).

LBOs substitute equity with debt, forcing much of the free cash flow back into the capital markets in the form of interest and principle payments.
This can also be accomplished voluntarily through a leveraged recapitalization, where a company takes on debt and uses the proceeds to repurchase a large proportion of its own equity.
The basic premise of the market for corporate control is that managers have the right to manage the corporation as long as its market value cannot be significantly enhanced by an alternative group of managers with an alternative strategy.

2. Growing importance of equity-based features in the pay package of most senior executives. Perceived divergence between managers’ and
shareholders’ interest.• Anxiousness over 10 years of falling corporate
profitability and stagnant share prices.• The increasing attention paid to stakeholder arguments,
which, in the eyes of shareholder value proponents, had become an excuse for inadequate performance.
• Agency theory called for redesigning management’s incentives to be more closely aligned with the interests of the shareholders.

• By 1998, the estimated PV of stock options represented 45% of the median pay package of CEOs.
• A movement developed to require that nonexecutive board members have an equity stack in the companies they represented so that they would be more inclined to pay attention to shareholder returns, if only for self-interest.
• By the late 1990s, 48% of medium and large companies had a stock grant or option package for board members, in contrast to virtually none in 1983.
The widening use of stock options has greatly increased the importance of shareholder returns in the measurement of managerial performance.*

3. Increased penetration of equity holdings as a percentage of household assets. Growing segments of the population are becoming
shareholders through mutual funds and retirement programs.
Among the most vocal proponents of shareholder value are the managers of major retirement systems.
Privatization of large government monopolies where governments became active marketers of the share of these companies.
The old notions of labor vs. capital are losing currency.

4. Growing recognition that many social systems are heading for insolvency. Most of the public pension plans are set up as pay-as-you-go
systems: contributions of workers today are used to pay the retirement of current retirees, however, the number of workers to support one retiree is decreasing.*
Have to move to some form of funded pension system where at least a part of the premiums that workers pay are actually set aside for their retirement.
The challenge is how to make it through the transition: no solution unless the savings in the funded part (raising retirement premiums) of the system generate attractive returns.

Shareholder Capitalism The U.S. corporate focus on shareholder value tends to
limit investment in outdated strategies, even encourage divestment, well before any competing governance model would.
It is hard to claim that the capital markets are shortsighted compared with other corporate governors—the high number and value of technology and internet companies going public in recent years attests to this.
McKinsey Global Institute attributed the U.S. advantage in GDP per capita to much higher factor productivity, especially capital productivity (financial returns).*

Virtuous cycle: the most productive and innovative companies would create the highest returns to shareholders and attract better workers, who would be more productive and increase returns further (Adam Smith).
An economy’s ability to create jobs, or its lack thereof, is the better measure of fairness.
A company that focuses on building shareholder value is served well by being a good corporate citizen: does not come at the expense of other stakeholders.
Market economy: market value added is positively related to labor productivity as well as employment growth.

Business Environment Business Strategy
Business Activities
Accounting Environment Accounting Strategy
Accounting System
Financial Statements
Summarize the economic consequences of business activities
Financial Accounting

From Business Environment to Financial StatementsBusiness environment
Acquire physical and financial resources.Create value for investors.
• Labor markets, product markets (suppliers, customers, competitors), capital markets (shareholders, creditors), regulations.
Business strategyEarns a ROI in excess of the cost of capital
• Scope of business (degree and type diversification), competitive positioning (cost leadership or differentiation), key success factors and risks.

Business activitiesImplementing business strategy
• Investment, operating and financing activities*Accounting system
A mechanism through which business activities are selected (recognized), measured, and aggregated (presentation and disclosure) into FSs.
• Business activities are too numerous to be reported individually, some are proprietary.*
Accounting environmentInstitutional features of accounting systems.
• Capital market structure, contracting and governance, accounting convention and regulation, tax and financial accounting linkage, third party auditing, legal system for accounting disputes.

Accounting strategyManagement discretion
• Choices of accounting policies, estimates, reporting format, supplementary disclosure.
FSsThe influence of the accounting system on the quality of FSs.
Accounting system featuresAccrual accounting
Periodic performance reports• Costs and benefits associated with economic activities vs. actual
payment and receipt of cash• The effects of economic transactions are recorded on the basis of
expected not necessarily actual cash receipts and payments.

Accounting standards and auditingThe expectations of future cash flow consequences are
subjective and rely on a variety of assumptions.• The accounting discretion granted to managers is potentially
valuable because it allows them to reflect inside information, however, they have incentives to use accounting discretion to distort reported profits by making biased assumptions (management performance assessments, accounting based contracts).
• Accounting conventions are responses to concerns about distortion, yet they attempt to limit managers’ optimistic bias by imposing their own pessimistic bias (conservatism, measurability).
• Uniform accounting standards GAAP attempt to reduce managers’ ability to record similar economic transactions in dissimilar ways: SFAS (FASB), IFRS (IASB).

• Increased uniformity comes at the expense of reduced flexibility for managers to reflect genuine business differences in FSs.
• If accounting standards are too rigid, they may induce managers to expend economic resources to restructure business transactions to achieve a desired accounting results.*
• Third party auditing provide a verification of the integrity of the reported FSs, ensures that managers use accounting rules and convention consistently over time, and their accounting estimates are reasonable.
• May also reduce the quality of financial reporting because it constraints the kind of accounting rules and conventions that evolve over time. Auditors are likely to argue against accounting standards producing numbers that are difficult to audit.
• The threat of lawsuits and resulting penalties have the benefits of improving the accuracy of disclosure.

• However, it might also discourage managers and auditors from supporting accounting proposals requiring risky forecasts, such as forward-looking disclosures.
Managers’ reporting strategySome flexibility
• Accounting alternatives and estimates• Voluntary disclosures• Proprietary information• Manipulate investors’ perceptions
Opportunity and challenge in doing business analysis • Separate distortion and noise from information• Gain valuable business insights

From FSs to business analysisGet at managers’ inside information from public FS
data.About current performance and future prospects
• Successful intermediaries have at least as good an understanding of the industry economies as well as a reasonable good understanding of the firm’s competitive strategy.
• Although outside analysts have an information disadvantage, they are more objective.*
Business strategy analysisIdentify key profit drivers and business risks
• Assess the company’s profit potential at a qualitative level.

• Frame the subsequent accounting and financial analysis, i.e., key accounting policies and sustainable profits.
• Make sound assumptions in forecasting future performance.
Accounting analysisEvaluate the degree to which a firm’s accounting
captures the underlying business reality.• Undo any accounting distortions• Improve the reliability of conclusion from financial analysis
(GIGO)*
Financial analysisEvaluate the current and past performance and assess its
sustainability.

• Analysis should be systematic and efficient.• Explore business issues through ratio analysis and cash flow
analysis.Prospective analysis
Forecasting a firm’s future• FS forecasting and valuation• Synthesis of the above analyses• For decision contexts such as securities analysis, credit
evaluation, M&As, debt and dividend policies, and corporate communication strategies.
EMHWhy FS analysis?
• Application outside the capital market context.• Driving force of market efficiency.*

Ch. 2 Strategy Analysis Starting point
Strategic decisions1. The choice of an industry or a set of industries
in which the firm operates.
2. The manner in which the firm intends to compete (competitive position).*
3. The way in which the firm expects to create and exploit synergies across the range of businesses (corporate or group strategy)**

RolesProbe the economics of a firm at a qualitative level
• Subsequent accounting and financial analysis is grounded in business reality.
Identify profit drivers and key risks.• Assess the sustainability of current performance• Make realistic forecasts of future performance
Industry analysisThe profitability of various industries differs
systematically and predictably over time.Industrial organization: influence of industry structure on
profitability.

Degree of Actual and Potential CompetitionRivalry among Threat of Threat ofexisting firms new entrants substitute products
Industry Structure and Profitability
Industry Profitability
Bargaining Power in Input and Output MarketsBargaining power Bargaining power of buyers of suppliers
Firm Profitability

EBIT/BV of assets was 8.8% (average of U.S. companies between 1981-97).
• Bakery products was 43% higher, silver ore mining was 23% lower.*
Degree of actual and potential competitionOne of the key determinants of price
• Perfect competition: price = marginal cost, no abnormal profits• Monopoly profits
Rivalry among existing firms• Industry growth rate: in stagnant industries, the only way existing
firms can grow is by taking share away from the other firms.• Concentration and balance of competitors: the number of firms in an
industry and their relative sizes determine the degree of concentration, which in turn influences the extent to which firms can coordinate their pricing and other moves.*

• Degree of differentiation and switching costs
• Scale/learning economics (learning curve) and the ratio of fixed to variable costs (degree of operating leverage = CM/F)
• Excess capacity and exit barriers*
Threat of new entrants• Economies of scale: might arise from large investment in R&D,
brand advertising, or physical plant & equipment
• First mover advantage: set industry standards, enter into exclusive arrangements with suppliers of cheap new materials, acquire scarce government licenses, achieve learning economies, or impose significant switching costs.
• Access to channels of distribution (dealer network, supermarket shelf) and relationships

• Legal barriers: patents and copyrights, licensing regulationsThreat of substitute products
• Perform the same function, not necessary of the same form (replacement not reproduction).
• Technologies enable efficiency in (reduced) usage.*• Image offered by designer labels.
Bargaining power of buyers and suppliersPrice sensitivity
• Product differentiation and switching costs.• Importance to cost structure.• Importance to product quality or composition.
Relative bargaining power• The extent to which firms will succeed in forcing price down: the
cost of each party of not doing business with the other party

• Number of buyers relative to number of suppliers, volume of purchase, number of alternative products, switching costs, threat of forward or backward integration.*
Limitations of industry analysisThe assumption that industries have clear boundaries.
Competitive strategy analysisCost leadership
Tight cost control• Economies of scale and scope, economies of learning,
efficient production, simpler product design, lower input costs, low distribution costs, little R&D or brand advertising, and efficient organizational processes.
Differentiation

Provide a product or service that is distinct in some important respect valued by the customer.
• Identify one or more attributes of a product that customers value: quality, appearance, variety, reputation or brand image, bundled services, delivery time, or turnkey solutions.
• Position itself to meet the chosen customer need in a unique manner.
• Achieve differentiation at a cost that is lower than the price the customer is willing to pay.
• Investments in R&D, engineering skills, and marketing capabilities.• The organizational structures and control systems need to foster
creativity and innovation.Mutually exclusive
Firms that straddle the two are considered to be “stuck in the middle”

• Not able to attract price conscious customers and unable to provide adequate differentiation to attract premium price customers.
• Firms cannot completely ignore the dimension on which they are not primarily competing: distinctive and high quality yet inexpensive.*
Achieving and sustaining competitive advantageThe capabilities needed to implement and sustain the chosen
strategy• Acquire the core competencies (economic assets) needed and
structure value chain (the set of activities performed to convert inputs into outputs) in an appropriate way.**
• Difficult for competitors to imitate.Questions asked
• Key success factors and risks associated with chosen competitive strategy?

• Having resources and capabilities to deal with?• Making irreversible commitments to bridge the capabilities gap?• Structuring activities consistently?• Creating barriers to imitate?• Having flexibility to address potential changes in the industry
structure that might dissipate competitive advantage?Corporate strategy analysis (scope)*
Multibusiness organization• The average number of segments operated by the top 500 U.S.
companies is 11 in 1992.• An attempt to reduce the diversity and focus on a relatively few
core businesses: diversified companies trade at a discount in the stock market relative to a comparable portfolio of focused companies, M&A of two unrelated businesses often fail to create value, and value can be created through spin-offs and asset sales.

• Managers’ decisions to diversify and expand are driven by a desire to maximize the size rather than shareholder value, incentive misalignment problems, and capital markets find it difficult to monitor and value multibusiness organizations.*
• Evaluate the economic consequences of managing all the different businesses under one corporate umbrella.
Sources of value creation• Relative transaction cost of performing a set of activities inside
the firm versus using the market mechanism, in particular, when coordination among independent firms is costly due to market transaction costs.
• Transaction costs: production process involves specialized assets such as human capital skills, proprietary technology, other organizational know-how that is not easily available in the marketplace, and market imperfection such as information and incentive problem.

• Emerging economies often suffer from market imperfection because of poorly developed intermediation infrastructure.
• Internal advantages: lower communication costs because confidentiality can be protected and credibility can be assured through internal mechanism, headquarters office can play a critical role in reducing costs of enforcing agreements, organizational subunits can share nontradable or nondivisible assets.
• Top management may lack the specialized information and skills necessary to maintain businesses across several different industries. Can be remedied by creating a decentralized organization, hiring specialist managers and providing with proper incentives, but will potentially decrease goal congruence.
Questions asked• Significant imperfections in the product, labor, or financial
markets?

• Special resources such as brand names, proprietary know-how, access to scarce distribution channels, and special organizational processes?
• Good fit between specialized resources and the portfolio of businesses?
• Allocation of decision rights between the headquarters office and business units?
• Internal measurement, information, and incentive system to reduce agency costs?
CasesPersonal computer industry
Intense competition and low profitability• The industry was fragmented with many firms producing virtually
identical products, though top five vendors controlling close to 60% of the market.

• Component cost accounted for more than 60% of total hardware costs and volume purchases reduced these costs, hence intense competition for market share.
• Brand name and service became less important as buyers became more informed about the technology.
• Switching costs were relatively low.• Access to distribution was not a significant barrier (direct
mail & internet-based sales). Computer superstores were willing to carry several brands.
• Very few barriers to entering the industry (assembled in a dormitory room).
• Apple’s and workstations offered competition as substitutes.
• Key hardware and software components were controlled by firms with virtual monopoly (Intel, Microsoft).

• Corporate buyers were highly price sensitive (a significant IT cost).
• Tremendous pressure on firms to introduce new products rapidly, maintain high quality and provide excellent customer support.
Dell’s low-cost competitive strategy• Direct selling: saving on retail markups• Made-to-order manufacturing: a system of flexible
manufacturing (5 days), save inventory working capital and write-off costs.
• Third-party service: telephoned-based and third-party maintenance service (Xerox).*
• Low accounts receivable: pay by credit card or electronic payment.
• Focused investment in R&D: primarily in creating low-cost, high velocity organization that can respond quickly to changes.

Electronic commerceAmazon.com, an online bookseller in 1995 and went public in
1997 with a market cap of $561m and increasing to $36b by April 1999.
• Jeff Bezos moved the company into many other areas, claimed that its brand, loyal customer base, and ability to execute electronic commerce were valuable assets that can be exploited in a number of other online business areas: CDs, videos, gifts, prescription drugs, pet suppliers, and groceries (a “customer” company).
• Traditional retailers such as Barnes & Noble, Wal-Mart, and CVs who are boosting their online efforts also have valuable brand names, execution capabilities, and customer loyalty.
• Expanding rapidly into so many different areas is likely to confuse customers, dilute brand name, and increase the chance of poor execution.*

Ch. 3 Accounting AnalysisOverview
Purpose Improve the reliability of conclusions from
financial analysis (GIGO)Evaluate the degree to which a firm’s accounting
captures its underlying business reality.• Identifying places where there is accounting flexibility• Evaluating the appropriateness of the firm’s
accounting policies and estimates

• Consistent with stated strategyUndo any accounting distortions
• Adjusting a firm’s accounting numbers using cash flow and footnote information
Institutional FrameworkAccrual accounting
Recording of costs and benefits associated with economic activities.
• The effects of economic transactions are recorded on the basis of expected, not necessarily actual, cash receipts and payments.
Revenue• Economic resources earned during a time period• Governed by the realization principle

• The firm has provided all, or substantially all, the goods or services to be delivered to the customer
• The customer has paid cash or is expected to pay cash with a reasonable degree of certainty
Expenses• Economic resources used up in a time period• Governed by the matching and conservatism principles*• Costs directly associated with revenues recognized in the
same period (COGS)• Costs associated with benefits that are consumed in this
time period (period expenses)• Or, resources whose future benefits are not reasonably
certain (R&D, advertising) • Expenses vs. losses

Assets• Economic resources owned by a firm• Likely to produce future economic benefits• And, measurable with a reasonable degree of certainty*• Costs: sacrifice foregone to acquire goods or services, initially as
assets then as expenses.
Liabilities• Economic obligation of a firm arising from benefits received in
the past• Required to be met with a reasonable degree of certainty.*• And, whose timing is reasonably well defined
Equity: net worth (limited liability)

Delegate reporting to managementInvolves complex judgments
• Sales with customer financing*• Potential defaults• R&D assets or contingent liabilities• Contractual commitments such as lease arrangements or post-retirement
plansCosts and benefits
• Use their accounting discretion to reflect inside information in reported FSs
• But have an incentive to distort reported profits by making biased assumptions
• Manipulate accounting numbers in contracts between the firm and outsiders
• GAAPs, external auditing, and legal system to reduce the cost and preserve the benefit (only institutional investors’ supervision is effective).

GAAPsHistorical cost convention to reduce value manipulation
• Limits the information that is available to investors about the potential of the assets
• Fair value and impairmentUniform accounting Standards
• Create a uniform accounting language and increase the credibility of FSs
• Regulate how particular types of transactions are recorded to limit management’s ability to misuse accounting judgment
• Rigid standards work best for economic transactions whose accounting judgment is not predicated on managers’ proprietary information.

At the expense of reduced flexibility to reflect genuine business differences
• Likely to be disfunctional because they prevent managers from using their superior business knowledge.
• May induce managers to expend economic resources to structure business transactions to achieve a desired accounting result.*
SEC has the legal authority to set accounting standards• Typically relies on private sector accounting bodies to
undertake this task• FASB’s SFAS since 1973
IASB’s IFRS after reform since 1998

External auditingAll listed companies are required
• GAASs set by AICPA• Issue an opinion on published FSs• Primary responsibility still rests with corporate managers
Imperfect• Cannot review all of a firm’s transactions• Failure because of lapses in quality or lapses in judgment by
auditors who fail to challenge management for fear of losing future business.
• Outside supervision replaces peer reviews• Also under international harmonization because of capital markets
integration.• Constrain the type of accounting rules and conventions that evolve
over time

• Auditors are likely to argue against accounting standards that produce numbers which are difficult to audit, even if the proposed rules produce relevant information for investors.
Legal systemAdjudicate disputes between managers, auditors,
and investors• The threat of lawsuits and resulting penalties have the
beneficial effect of improving FSs.• The potential for significant legal liability might also
discourage managers and auditors from supporting accounting proposals requiring risky forecasts.

Quality FactorsNoise and bias from accounting rules
Conservatism: not possible• Timing of recognition due to double-entry accounting.• Managerial behavior may not necessarily be consistent with
conservatism.
Dissimilar economic events with similar accounting rules, e.g., R&D
Forecast errorsThe extent of errors depends on a variety of factors
• The complex of the business transactions

• The predictability of the firm’s environment• Unforeseen economic-wide changes.
Managers’ accounting choicesIncentives to exercise discretion to achieve certain objectives
• Accounting based debt covenants• Management compensation• Corporate control contests: in hostile takeovers and proxy fights,
accounting numbers are used extensively in debating managers’ performance.
• Tax considerations• Regulatory considerations: to influence regulatory outcomes such as
antitrust actions, import tariffs, and tax policies.• Capital market considerations (IPOs, ECBs, may simply due to market
timing)

• Stakeholder considerations: labor unions, suppliers, and customers (stockholders, community)
• Competitive considerations: segment disclosure, new entrants.
Level of disclosures• Managers can choose disclosure policies that
make it more or less costly for external users to understand the true economic picture.
• Voluntary disclosures: Letter to the shareholders, MD&A, footnotes (part of FSs)

Steps in accounting analysis1. Identify key accounting policies
Industry characteristics and competitive strategy• Key success factors and risks• Identify and evaluate the accounting policies and estimates the
firm uses to measure them• Evaluate how well they are managed
Examples• Banking: interest and credit risk management (loan loss reserves)• Retail: inventory management• Manufacturer: product quality and innovation, R&D, product
defects after the sale (warranty expenses and reserves)

• Leasing: accurate forecasts of residual values
2. Assess accounting flexibility Little flexibility
• Accounting data are likely to be less informative• R&D of biotechnology companies• Marketing outlays of consumer goods firms
Considerable flexibility• Potential to be informative depending on how managers
exercise it• Expected defaults of bank loans• The point in the development cycles to capitalize outlay by
software developers Common flexibility
• Accounting alternatives allowed

3. Evaluate accounting strategyStrategy questions asked
• Compare to the norms of the industry • Dissimilarity because of unique competitive strategies? (e.g., high
quality low warranty allowance or understating)Strong incentives to use accounting discretion to manage
earnings?Policies and estimates changed
• Justification & impactRealistic in the past
• Seasonality in interim earnings or manipulation• Large period-ending adjustments• A history of write-offs

Structure any significant business transactions to achieve certain accounting objectives?• Hiding losses in SPEs or joint ventures
4. Evaluate the quality of disclosure Questions asked
• Adequate disclosures to assess the firm’s business strategy and its economic consequences (letter to the shareholders)?
• Footnotes adequately explain the key accounting policies and assumptions and their logic?
• Adequately explain current performance (MD&A)?

• If accounting rules and conventions restrict the firm from measuring them appropriately? Adequate additional disclosure to help understand how key success factors are managed, e.g., disclose physical indexes of defect rates and consumer satisfaction. KPIs
• Quality of segment disclosure• Forthcoming with respect to bad news: reasons and
coping strategy.• Investor relations program
5. Identify potential red flagsExamine more closely or gather more information
• Unexplained changes in accounting, especially when performance is poor.
• Unexplained transactions that boost profits.

• Unusual increases in accounts receivables in relation to sales increases: relaxing credit policy or artificially loading up distribution channels
• Unusual increases in inventory in relation to sales increases (FG: demand slowing down, WIP: expect an increase in sales, RM: manufacturing or procurement inefficiencies).*
• Increasing gap between reported income and cash flow from operating activities. If not a steady relationship, might indicate subtle changes in the firm’s accrual estimates.*
• Increasing gap between reported income and tax income: might indicate subtle changes in accounting standards or tax rules.
• Large fourth-quarter adjustments: may indicate aggressive management of interim reporting.

• Tendency to use financial mechanisms such as R&D partnerships, SPEs, and the sale of receivables with recourse: opportunity to understate liabilities and/or overstate assets.
• Unexpected large write-offs: slow to incorporate changing business circumstances into accounting estimates.
• Qualified audit opinions or changes in independent auditors not well-justified: tendency to opinion shop.
• Related-party transactions: lack the objectivity of the marketplace and likely to be more subjective and self-serving.
6. Undo accounting distortion Some progress can be made by using the cash flow
statement and footnotes.

PitfallsCommon misconceptions
Conservatism is not “good” accounting• Evaluate how well accounting captures business reality in an
unbiased manner.• Merck’s research ability and sales force.• Look to alternative sources of information.• Provide opportunities for income smoothing.• Prevent analysts from recognizing poor performance in a timely
fashion.Not all unusual accounting is questionable
• Justified if the business is unusual.• Accounting changes might reflect changed business
circumstances.

Value of accounting data and analysisAccounting data
Perfect earnings foresight one year prior to announcement
• Buy up sell down, 37.5% 1954-1996• Equivalent to 44% of the return given perfect foresight
of the stock price (85.2%)• Perfect foresight of ROE, 43%• Perfect foresight of cash flow, 9%• Earnings management not so pervasive as to make
earnings data unreliable.

Accounting analysisOpportunities for superior analysts to earn positive
profit.• Companies criticized in the financial press for
misleading financial reporting suffered an average stock price drop of 8%.
• Firms appeared to inflate reported earnings prior to an equity issue and subsequently reported poor performance had more negative stock performance after the offer than firms with no apparent inflating.
• Firms subject to SEC investigation for earnings management showed an average stock price decline of 9% when first announced and continued to have poor stock price performance for up to two years.

Ch. 4 Implementing Accounting Analysis
Undo any accounting distortionsRecasting FSs using standard reporting
nomenclature and formatsPerformance metrics based on comparable
definitions across companies and over time• Focus on those accounting estimates and methods
used to measure key success factors and risk.• Assess whether variations reflect legitimate
business differences or differential managerial judgment or bias.
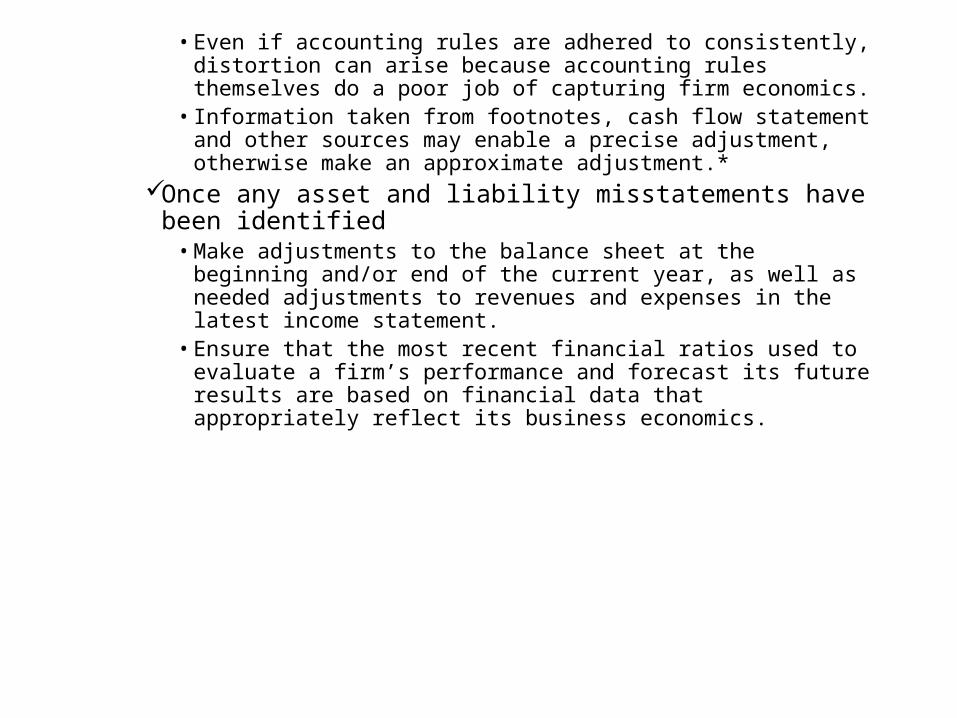
• Even if accounting rules are adhered to consistently, distortion can arise because accounting rules themselves do a poor job of capturing firm economics.
• Information taken from footnotes, cash flow statement and other sources may enable a precise adjustment, otherwise make an approximate adjustment.*
Once any asset and liability misstatements have been identified
• Make adjustments to the balance sheet at the beginning and/or end of the current year, as well as needed adjustments to revenues and expenses in the latest income statement.
• Ensure that the most recent financial ratios used to evaluate a firm’s performance and forecast its future results are based on financial data that appropriately reflect its business economics.

Asset DistortionsDefinition of assets
Resources that a firm owns or controls as a result of past business transactions, and which are expected to produce future economic benefits that can be measured with a reasonable degree of certainty.
Ownership or controlDifficult for accounting rules to capture all of the
subtleties associated with ownership.• Permits managers to groom 打扮 transactions so that
essentially similar transactions can be reported in very different ways: important assets may be omitted from the balance sheet even though the firm bears many of the economic risks of ownership.
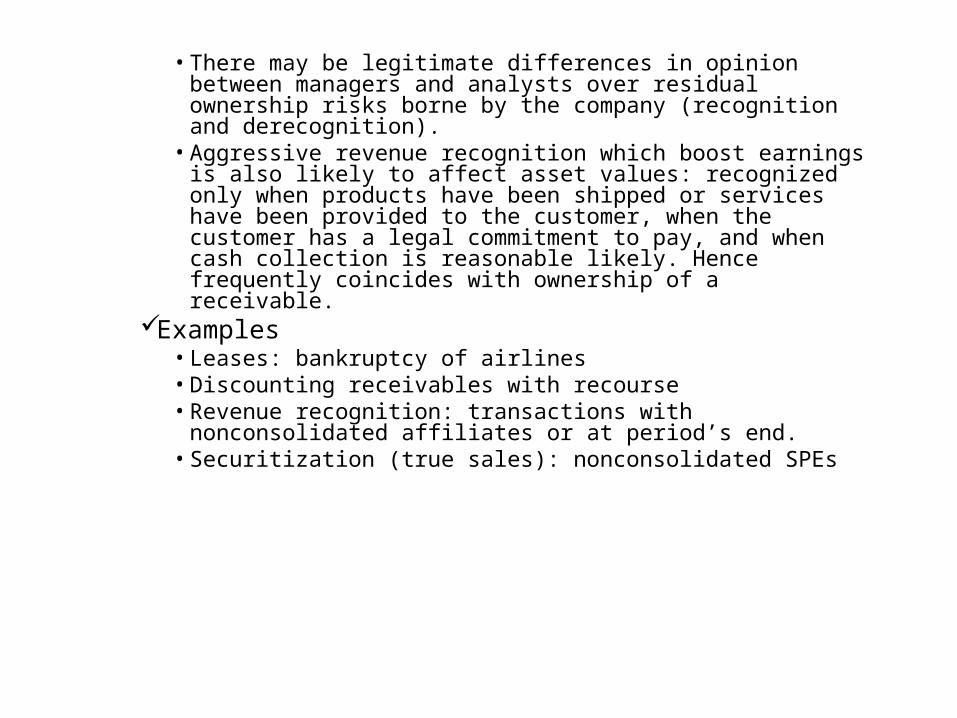
• There may be legitimate differences in opinion between managers and analysts over residual ownership risks borne by the company (recognition and derecognition).
• Aggressive revenue recognition which boost earnings is also likely to affect asset values: recognized only when products have been shipped or services have been provided to the customer, when the customer has a legal commitment to pay, and when cash collection is reasonable likely. Hence frequently coincides with ownership of a receivable.
Examples• Leases: bankruptcy of airlines• Discounting receivables with recourse• Revenue recognition: transactions with nonconsolidated
affiliates or at period’s end.• Securitization (true sales): nonconsolidated SPEs

Future economic benefitsMeasured with reasonable certainty.
• Difficult to accurately forecast the future benefits associated with capital outlays.
• Whether a competitor will offer a new product or service.• Whether the products manufactured at a new plant will be the type that
customers want to buy.• Whether changes in oil prices will make the oil drilling equipment
manufactured less valuable.Accounting rules deal with these challenges by stipulating which
types of resources can be recorded as assets and which cannot.• Yet, economic benefits should not be a yes or no question, nor should be
measured at cost.*Example: R&D expenses
• Generally considered highly uncertain.

• May never deliver promised products, the products generated may not be economically viable, or products may be made obsolete by competitors’ research.
• Exception: SFAS 86 requires software development costs be capitalized once the software reaches the stage of technological feasibility.
ImpairmentsThe possibility that asset values are misstated.
• SFAS 144: an impairment loss (difference between the fair value and book value) be recognized on a long-term asset when its book value exceeds the undiscounted cash flows expected to be generated from future use and sale. Measurement of impairment is based on discounted cash flows

• Markets for many long-term operating assets are illiquid or incomplete, making it highly subjective to decide whether an asset is impaired and to infer its fair value.
The task of impairment judgment is delegated to management, with oversight by the auditor.
• Potentially leaving opportunities for management bias and for legitimate differences in opinion between managers and analysts over asset valuations.
• Independent valuation internal as well as external.
Overstated assetsIncentives to increase reported earnings
Delays in writing down current assets• Impaired if book values fall below realizable values.

• Write-offs are charged directly to earnings.• Where management of inventories and receivables is a key
success factor, analysts need to be particularly cognizant of this form of earnings management: overstocking (offer customer discounts or credit extension).
• Warning signs: growing days’ inventory, days’ receivable, write-down by competitors, and business downturns for major customers.
Underestimated reserves• Allowances for bad debts or loan losses.• Warning signs: growing days’ receivable, business downturns
for major clients, and loan delinquencies.Accelerated recognition of revenue
• Increasing receivables (at the period’s end while cash collection may not be reasonably likely).

Delayed write-downs of long-term assets• Deteriorating industry/firm economic conditions.• Aggressive growth through acquisitions (intangible assets and
goodwill impairments).• Heavy asset-intensive firms in volatile markets.• Warning signs: declining long-term asset turnover, return on
assets lower than the cost of capital, write-downs by other firms, overpayment for or unsuccessful integration of key acquisitions.
Understated depreciation/amortization on long-term assets• Estimates of asset lives, salvage values, and amortization
schedules. 摩爾定律• Heavy asset businesses: airlines, utilities, and semiconductor
foundries.

Case: Dot-com stock market crash in April 2000.• A ripple effect on firms selling equipment to the
telecommunications and internet industries, e.g., Lucent Technologies.
• First sign of a downturn came in the June 2000 quarter, when earnings declined markedly YoY.
• This pattern persists through the next two quarters with reported operating losses of $2.1b and $4.8b, respectively.
• Reported year-end inventory $6.9b was $1.5b higher YoY, yet fourth quarter sales $5.8b declined precipitously from $9.9b previous year.
• Day’s inventory increase from 58 days to 107 days, gross margins declined from 47% to 22%, yet recorded no inventory impairment charge.
• Can assess the problems by talking to Lucent’s customers and by observing the performance of other firms in the industry.
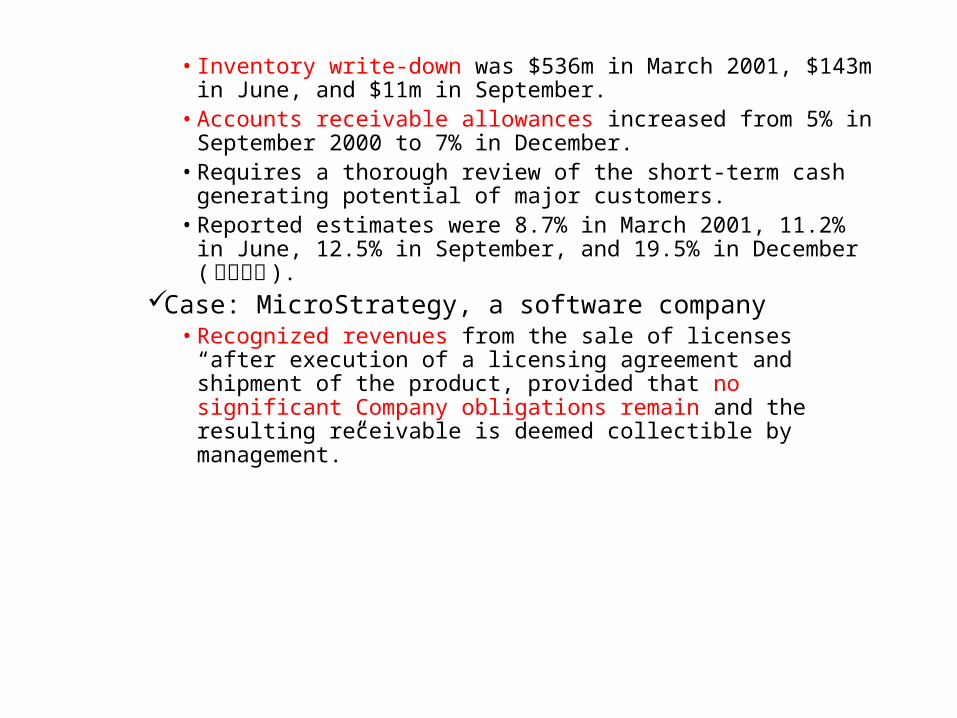
• Inventory write-down was $536m in March 2001, $143m in June, and $11m in September.
• Accounts receivable allowances increased from 5% in September 2000 to 7% in December.
• Requires a thorough review of the short-term cash generating potential of major customers.
• Reported estimates were 8.7% in March 2001, 11.2% in June, 12.5% in September, and 19.5% in December ( 帳齡分析 ).
Case: MicroStrategy, a software company• Recognized revenues from the sale of licenses “after
execution of a licensing agreement and shipment of the product, provided that no significant Company obligations remain and the resulting receivable is deemed collectible by management.”

• Booking two contracts (announced several days after the quarter’s end) worth $27m as quarterly revenues.
• Cost of license revenues is only 3% (should be a prepaid expense, no inventory).
• Restate FSs: Accounts receivable were reduced from $61.1m to $37.6m for 1999 (contracts not fully executed by the Company in the reporting period).
Case: merger between AOL and Time Warner• Enabling AOL to cross-sell TW’s content to its large
subscriber base, goodwill valued at $128b in December 2001.• Disney’s acquisition of ABC had faced difficulties in
realizing their potential.

• Why AOL had to buy TW to access its content (simply sign a long-term licensing agreement)?
• Raised questions about AOL and TW relations with existing customers and suppliers: TW sells to AOL’s competitor Microsoft, AOL’s deals with TW’s competitors, and even if TW content become stale, AOL has no choice but to continue supplying.
• Questions quickly answered when Internet sector stocks crashed.
• Goodwill write-down of $54b in March 2002, additional write-down of $45.5b at the end of 2002.

Understated assetsIncentives to deflate reported earnings
Income smoothing• Performed exceptional well and decided to store away some of
the current strong earnings for a rainy day.• Overstating period expenses
Take a bath• In a particular bad year to create the appearance of a
turnaround in following years.Incentives to understate liabilities
• Neither the assets nor the accompanying obligations are shown on the balance sheet.
• Operating lease, discounting receivables with recourse, offset.

Conservative accounting rules• Expense R&D and advertising outlays• Pooling of interests• Under double-entry accounting, conservative is followed by
aggressive.Common forms
• Overstated write-downs of current assets: can also arise when managers are less optimistic about the future prospects.
• Overestimated reserves• Overestimated write-downs of long-term assets• Overstated depreciation/amortization: accelerated tax
depreciation• Excluded goodwill using pooling*

• Lease assets off balance sheet: whether the lessee has effectively accepted most of the risks of ownership, such as obsolescence and physical deterioration
– SFAS 13 require purchase treatment if any of the following holds: ownership is transferred to the lessee at the end of the lease term; the lessee has the option to purchase for a bargain price at the end of the term; the lease term is 75% or more of the asset’s expected useful life; the present value of the lease payments is 90% or more of the fair value of the asset.
– Opportunities for management to circumvent the spirit of the distinction between capital and operating leases, likely to be an important issue for the heavy asset industries.

• Discounted receivables with recourse: still retains considerable collection risk. *
– SFAS 140 requires to be considered sold if the seller cedes control to the financier beyond the reach of the seller’s creditors should seller file for bankruptcy; the financier has the right to pledge or sell the receivables; and the seller has no commitment to repurchase.
– If with recourse, requires the seller to continue to estimate bad debt losses. Also requires the seller to have experience in estimating the value of the recourse liability (allowances for credit and refinancing risks).
– Affect both income and liability: gains and losses on the sales to be excluded, interest income on the notes receivable and interest expenses on the loan to be recorded.

• Key intangible assets not reported: inflates ROE, will not be mean-reverting to the cost of capital. Make it difficult to assess whether the firm’s business model works (against the matching concept and obscures operating performance). Likely to be important for firms in software, pharmaceutical, branded consumer products, and subscription businesses.*
Case: Lufthansa, German national airline• In 2001, depreciated aircraft over 12 years on a straight-line
basis with estimated residual value of 15% of initial cost, for both financial and tax reporting purposes. British Airways (BA): 20 years & 8% for financial reporting purpose.
• Reflect different fly routes, asset management strategies (newer planes, lower maintenance cost, lower fuel costs, cargos vs. passengers).

Case: Johnson and Johnson• Acquired 234.4m shares of ALZA (book value $1.6b) in June
2001 for a price of 229.6m shares of J&J valued at $12.2b.Case: Japan Airlines (JAL)
• Rents part of flight equipment• Using the operating method though qualify as capital leases.• Depreciate the present value of lease payments and apportion
lease payments between interest expenses and repayment of long-term debt.
Case: Microsoft• Does not capitalize any R&D costs.• Expected life of software is about 3 years.• Capitalize and amortize those passed the stage of technological
feasibility.

Liability DistortionsDefinition of liabilities
Economic obligations arising from benefits received in the past, and the amount and timing is known with reasonable certainty.*
Has an obligation been incurred?A plan to restructure
• By laying off employees: a commitment made?
Software license• Received cash for a five-year contract: report the full amount as
revenues or should some of it represent the on going commitment to the customer for servicing and supporting.

Can the obligation be measured?Environmental cleanup*Pension and post-retirement benefitsFuture warranty and insurance claim
Understated liabilitiesLikely reasons
• Key commitments that are difficult to value and therefore not considered liabilities for financial reporting purposes.
• Incentives to overstate the soundness of financial position or to boost earnings.
Unearned (deferred) revenues understated• Aggressive revenue recognition: cash received but the
product or service has yet to be provided.

• Bundle service contracts with the sale of a product (unless incrementally charged): separating the price of the product from the price of the service is subjective.
Loans from discounted receivablesLong-term liabilities for leasesPension and post-retirement obligations are not fully
recorded• Defined benefits vs. defined contributions.• Estimate the present value of the commitments that have been
earned by employees over their years of working for the firm: future wage rates, retirement ages, worker attribution 耗損rates, life expectancies, health insurance costs, and discount rate.*
• This obligation is offset by any assets that has been committed to fund future plan benefits.

• Are the assumptions made by the firm to estimate realistic? Use sensitivity information to adjust for any optimism.
• Incremental benefit commitments arising from changes to a plan, and changes in the plan funding status arising from abnormal investment returns on plan assets, are smoothed over time rather than recognized immediately.
• The smoothing process understates obligations: The increased obligation from increased plan benefits for current workers has to be amortized over employees’ average expected remaining years of service. The unexpected increase or decrease in value of plan assets in a given year, or the impact of adjustment in actuarial assumptions, is reflected gradually.

• The value of liability reported is the unfunded obligation less the unrecognized.
• The pension cost each year comprises service cost (additional year of service) + interest cost (multiplying the beginning obligation by the discount rate) + amortization of any prior period service costs +/- amortization of actuarial gains and losses (changes in assumptions) – expected return on plan assets (the expected long-term return multiplied by beginning assets under management).
– Actual cost comprises actual return on plan assets and without amortizations of prior period adjustments.

Case: MicroStrategy• Bundles customer support and software updates
with initial licensing agreements.• Conceded in March 2000: overstated revenues
on contracts that involved significant future customization and consulting by $54.5m in 1999.
• Stock price plummeted 94%Case: Computer Associates
• Reported a contingent liability of $218m in 2002 for receivable (from long-term licensing contracts) discounted with recourse.

Equity DistortionsA residual claim
Arise primarily from distortions in assets and liabilities.Unique forms
Debt like equity• Preferred stock with mandatory redemption or put option.
– Overstate equity and understate debt.Hybrid securities
• Convertible debt and debt with warrants attached• Without separating the components, overstate debt and
understate equity.• Understate interest expense if treated as bond, because of low
coupon rate (may even be negative).

• If equity component is separated, it will be a deep discount bond and discount amortization is also an interest expense.
• Some may have put option with put rate compensating investor for the market interest rate, the interest expense should be based on put rate rather than coupon rate. (PLYER)
Stock option expenses• Top management owned or had a claim to 13.2% of their
company’s shares in 1997, almost double the 1989 percentage.• No expense is typically recorded either when they are issued
or when they are exercised. Many managers view options as a low-cost form of compensation.
• Choose APB 25 the intrinsic value method or SFAS 123 the fair value method.
• Overuse of options can encourage earnings management to boost short-term stock prices.*

• Cash and stock bonuses for employees are treated as earnings distributions rather than expenses. Stock bonuses should be expensed at market price rather than at par.*
Case: Amazon.com• On February 3, 1999, completed an offering of $1.25b of
4.75% Convertible Subordinated Note due in 2009.• Several month earlier issued senior notes with an annual
interest rate of 10%.• The value of $1.25b convertible at a 10% discount rate is
only $0.87b, implying the conversion premium was worth at least $0.38b.
Case: Microsoft• Uses stock options extensively and reports by the intrinsic
method (fair value $3.377b, June 2001).

MisconceptionsAssets
If paid for a resource, must be an asset• A mistake or ill-intended*• Impaired• Inconsistent: R&D vs. purchased goodwill
If can’t kick a resource, really isn’t an asset• Rapid write-off or exclusion of intangibles
If bought, yes; if developed, no• Recording acquired but not internally generated
intangibles

Market values only relevant if intend to sell• Avoid an economic loss by simply not selling.* • May be true for operating assets• Gains selling or cherry picking
LiabilitiesPrudent to provide for a rainy day
• Conservative can be as misleading as aggressive• Income smoothing
Off-balance-sheet financing preferable• Underestimate true leverage
EquityDirty surplus for unrealized gains & losses*
• Financial instruments available for sale or used to hedge uncertain future cash flows.
• Foreign operations currency translations.

Multibusiness OrganizationsFinancial Statement Analysis
Professor David M. Chen
Graduate Institute of FinanceFu Jen Catholic University
July 2006

MotivationConglomerates in 1980
Diversification• M&As after oil crises*
Financial engineering in 1985Off-balance-sheet and off-income-statement
• Committed to this area of research since 1983.New economy in 1995
Intellectual properties • Advocating increasing returns (network effect)• Quoted from Professor 林鐘雄 : no suitable data to analyze and
no history to guide. Econometric analysis neglects regime shift.**Asia financial crisis in 1997
All three happened closely together

Accounting Issues1. Fair value vs. historical cost
Off-balance-sheet assets and liabilities• Financial vs. non-financial firm commitments
Impairment assessment• If not measured at fair value through profit or loss
(FVtPL).
2. Tangible vs. intangible assets Purchased vs. self-developed
3. Groups vs. individual firms Definition of control Variable interests
• Consolidation policies and segmental reporting

OthersShareholders’ Equity
• Compound instruments, equity-like debtsTrue sales
• Continuing involvementOff-income-statement expenses
• Boards and employees stock (options) and/or cash bonusDirty surplus
• Unrealized gains or losses recognized as equity adjustments (FVtEA)
Over dilution• Stock dividends recorded at par
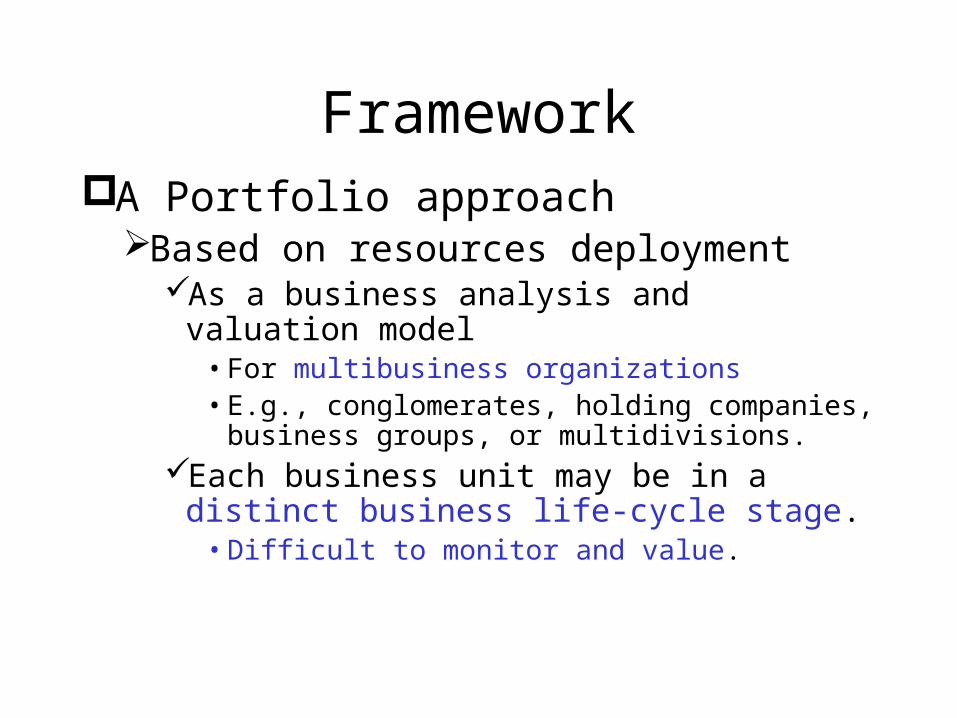
FrameworkA Portfolio approach
Based on resources deploymentAs a business analysis and valuation model
• For multibusiness organizations• E.g., conglomerates, holding companies,
business groups, or multidivisions. Each business unit may be in a distinct
business life-cycle stage.• Difficult to monitor and value.

FirmValue
Firm Growth &Profitability
Product MarketStrategies*
Financial MarketPolicies
OperatingManagement
OperatingInvestments
FinancingDecisions
DividendPolicy
ManagingRevenue &Expenses
ManagingWC & Fixed
Assets
ManagingLiabilities& Equity
ManagingRepurchase & Payout
FinancialInvestments
ManagingFVtPL AfS,
& HtM

FirmValue
Group Growth &Profitability
DiversificationStrategies
IntegrationStrategies*
UnrelatedInvestments**
StrategicInvestments
Managing Risks& Returns
ManagingSubsidiaries
ManagingAssociates
ManagingJoint Ventures
Not recommended
Treated asfinancial investments

Resources deploymentControlling interest (consolidation)
1. Net operating asset (NOA) • Net working capital (NWC)• Net long-term operating asset (NLTOA)
2. Net financial asset (typically negative)• Financial investments (FI)*• Interest-bearing liabilities (IBL)
3. Non-operating/financial Assets (XOFA)• Idle assets,leased assets, non-operating real estates, business units to be
disposed of, etc.4. Future resources**
• In-process research and development (IPR&D)Influential interest
5. Equity-method investments (EMI)

Cash cows
IPR&DReal options
Tangible & Intangible
Operating assets
Business Unit Life-Cycle
Cash furnace
Cash liquidation
M&AExit mechanism

Business unit life-cycle1. Cash furnace ( 金爐 )
Long-term R&D initiatives (IPR&D)• Roadmap, milestones
Valuation• Accounted as expenses though may have positive value implications.• Off-balance-sheet real options • Future investment opportunities
2. Cash cows ( 金牛 )*Tangible and intangible operating assetsValuation
• Fair value of identifiable intangible assets• Goodwill• DCF, economic profit (abnormal earnings)

3. Cash liquidation ( 金拍 )Gravity
• Competition: gradually phase out due to diminishing returns• Innovations: obsolescence
Valuation• Exit mechanism (M&A)*• Mean reverting (discontinuous reengineering)• Liquidation value
Group strategyApportionment of scare resources among these three
stages of life cycle, e.g., 2:7:1.Reflected in the apportionment of scarce equity among
the five categories of net assets.

Financial AnalysisGoal
Assess the performance of a firm in the context of its stated goals and strategy.
ToolsRatio analysis
• How various line items relate to one another.• Evaluate the effectiveness of the firm’s competitive strategies• Frame questions for further probing.• The foundation for making forecasts.
Cash flow analysis• Liquidity• Cash management.*

Comparisons1. Time-series
• Holding firm-specific factors constant and examining the effectiveness of a firm’s strategy overtime.
2. Cross-sectional (same industry)• Holding industry-level factors constant.• See the impact of different strategies on financial ratios
and relative performance.3. Benchmarking
• Rates of return relative to the cost of capital, a competitor’s ROE or a goal.
Standardized format (model)• Facilitate direct comparison across firms and overtime.

Assessing overall profitabilityTraditional decomposition*
ROA = ROS x asset turnover (negatively related? winner takes all)
• On average over long periods, large publicly traded firms in the U.S. generated ROEs in the range of 11-13%.**
• For ratio computation, use beginning balance. In practice, most analysts use ending balance for simplicity.
• Mean-reverting to the cost of equity capital in a long-run competitive equilibrium.
(1 / )NI NI S A
ROE ROA D EE S A E

• ROE > cost of equity capital over the long run → market value > book value, and vice versa.
Exceptions to mean-reverting• Industry conditions and competitive strategy that cause a
firm to generate supernormal 超常 (or subnormal 遜常 ) economic profits, at least over the short run.*
• Distortions due to accounting.**
Proposed modelDecomposing ROE into drivers: operating,
financial, non-operating/financial, IPR&D and EMI.

: current assets
: short-term financial investments
: Long-term financial investments
: equity-method investments in group associates
: fixed assets
: goodwill and intangible assets
: other
CA
STFI
LTFI
EMI
FA
GIA
OOA operating assets
: non-operating/financial assets
: in-process R&D assets*
XOFA
IPRDA

: current liabilities
: interest-bearing
X : non-interest-bearing
: long-term liabilities
: interest-bearing
: non-interest-bearing
: book value of shareholders' equity
CL
IBCL CL
CL CL
LL
IBLL LL
XLL LL
E

Operating:
: Net working capital
: net long-term operating assets
CA LTFI EMI FA GIA OOA XOFA IPRDA CL LL E
CA STFI XCL FA GIA OOA XLL
CL XCL LL XLL STFI LTFI E XOFA EMI IPRDA
NWC CA STFI XCL
NLTOA FA
: net operating assets
Financing:
: net interest-bearing debt
: operating-financial equity
: net operating capital
GIA OOA XLL
NOA NWC NLTOA
NIBD IBCL IBLL SFFI LTFI
OFE E XOFA EMI IPRDA
NOC NIBD OFE NOA
: net capitalNC NIBD E

淨營運資產NOA
流動資產 CA - 短期財務投資 STFI
- 不孳息流動負債XCL
淨週轉資本 NWC
固定資產 FA + 商譽無形資產 GIA + 其他營運資產 OOA
- 不孳息長期負債XLL
淨長期營運資產NLTOA
淨營運資本NOC
=OE
孳息短期負債 IBCL
+ 孳息長期負債 IBLL
- 短期財務投資 STFI
- 長期財務投資 LTFI
淨孳息舉債 NIBD
股東權益 E - 非營運財務資產 XOFA - 權益法投資 EMI - 創新研發資產 IPRDA
營運財務權益 OFE

: net income after tax
: net operating profit after tax
: net financial profit after tax (interest
expense, profits or losses on financial investments)
: profits o
NI NOP NFP XOFP EMIP IPRDE
NI
NOP
NFP
XOFP
r losses on non-operating/financial assets
after tax
: profits or losses on equity-method investments
after tax
: in-process R&D expenses after tax
EMIP
IPRDE

: return on operting equity
: return on financial equity
OE FE XE IE IPRDE
NI NOP NFP XOFP EMIP IPRDEROE
E E E E E ENOP OE NFP FE XOFP XE EMIP IE IPRDE
OE E FE E XE E IE E ERoOE RoFE RoXE RoIE
RoOE OE
RoFE FE
R
: return on non-operating-financial equity
: return on influential (associates) equity
: weight for operating equity
: weight for financial equity
: weight for non-operating-financial eq
OE
FE
XE
oXE XE
RoIE IE
uity
: weight for influential equity
: IPR&D intensiveness = /IE
IPRDE IPRDE E

營運權益報酬率 RoOE 淨營運利潤 NOP / 營運權益 OE
營運權益比 ωOE 營運權益 OE / 股東權益 E
財務權益報酬率 RoFE 淨財務利潤 NFP / 財務權益 FE
財務權益比 ωFE 財務權益 FE / 股東權益 E
其他權益報酬率 RoXE 其他利潤 XOFP / 其他權益 XE
其他權益比 ωXE 其他權益 XE / 股東權益 E
影響權益報酬率 RoIE 影響利潤 EMIP / 影響權益 IE
影響權益比 ωIE 影響權益 IE / 股東權益 E

and O
IF 0, the group utilizes financial leverage. Otherwise,
0 and 0, the group is a net lender.
FE NIBD E NOA OFE NIBD OFE FE
NIBD
NIBD FE NIBD
NOP NFP NOP NOA NFP FERoOFE
OFE NOA OFE FE OFEOFE NIB
RoOA
(1 )
: return on net operating assets /
: net debt/operating-financial equity ratio /
: operating-financial spread =
D NIBDRoFE
OFE OFERoOE NDOFE RoFE NDOFE
RoOE SPRD NDOFE
RoOA NOP NOA RoOE
NDOFR NIBD OFE
SPRD R
: financial leverage effect on
: weight for operating-financial equityOFE
OFE
oOE RoFE
FLE ROE SPRD NDOFE

股東權益報酬率 ROE
=營運權益報酬率 RoOE ‧ 營運權益比 ωOE
+財務權益報酬率 RoFE ‧ 財務權益比 ωFE
+其他權益報酬率 RoXE ‧ 其他權益比 ωXE
+聯屬權益報酬率 RoIE ‧ 聯屬權益比 ωIE
-創新研發支出權益比 ωIPRDE (IPRDE/E)
營運財務利差 SPRD
=營運資產報酬率 RoOE -財務權益報酬率 RoFE
財務槓桿效果 FLE ( 對 ROE 的影響 )
=營運財務利差 SPRD‧ 舉債 / 營運財務權益比 NDOFE ( 淨舉債 NIBD / 營運財務權益 OFE)
‧ 營運財務權益比 ωOFE

Sustainable (earnings) growth rate SGR= ROE x (1 – Dividend payout ratios)
• The rate at which a firm can grow while keeping its policies and profitability unchanged.
• Provides a benchmark against which a firm’s growth plans can be evaluated.
• All the ratios are linked to it, an analyst can examine its key drivers.• If intends to grow at a higher rate, could assess which of the ratios
are likely to change.Historical value of key financial ratios
For each of the years 1984 to 2003• ROE (11.2%), NOP margin (6.3%), operating asset turnover (1.51),
RoOA (7.8%), SPRD (2.6%), net financial leverage (1.06), sustainable growth rate (5.0%).
• Average over the 20 years.

Segmental AnalysisDisaggregated data*
Analysis by individual business segmentsCan reveal potential differences in the performance of
each business unit• to pinpoint areas where a company’s strategy is working and
where it is not.Computing ratios of physical data
• Particularly useful for young firms and young industries where accounting data may not fully capture business economics due to conservative accounting rules.
• Productivity (lead indicators)– Hotel: room occupancy rates– Cellular telephone: acquisition cost per new subscriber,
subscriber retention rate. (KPIs)

margin
where
: product line i's contribution
: revenue of product line i; common cost
: prod
Contribution Approach
i i
ii
i ii ii i
i
i
i
i
PLC CCNOPNOP
S S
PLC S CCPLM CCR
S S S
PLC
S CC
PLM
uct line i's margin ratio /
: product line i's sales mix / , 1
: common cost ratio /
i i
i i ii
PLC S
S S
CCR CC S

margin
: contribution of product line i in segment j
: revenue of product line i in segment j
jj i ij
ijj i
ij ij j j
j iij j
ij ij j jj i
ij
ij
j
PLC CC HONOPNOP
S S
PLC S CC S HO
S S S S S
PLM CCR HOR
PLC
S
S
: sales of segment j ; : segment j's sales mix
: segment j product line i's margin /
: product line i's sales mix / , 1
: segment j's common cost ratio /
: home-offi
ij ji
ij ij ij
ij ij ijj i
j j j
S
PLM PLC S
S S
CCR CC S
HOR
ce expense ratio /HO S

where
: net operating asset of segment j
: return on operating asset of segment j
: weight for net operating asset of segme
j jj
j j jj jj j
j
j
j
j
PLC CCNOPRoOA
NOA NOAPLC CC NOA
RoOANOA NOA
NOA
RoOA
nt j

Home office
Segment I Segment II Sub
Product line 1 Product line 2 Sub Product line 3 Product line 4 Sub
A B Sub C D Sub E F Sub G H Sub
Sales xx xx xx xx xx xx xx xx xx xx
xx xx
Unit cost xx xx xx xx xx xx xx xx xx xx
xx xx
Batch cost xx xx xx xx xx xx xx xx xx xx
xx xx
Product cost xx xx xx xx xx xx xx xx xx xx
xx xx
Prod ctrb xx xx xx xx xx xx xx xx xx xx
xx xx
Prod line cost xx xx xx xx
Prod line ctrb xx xx xx xx xx xx
Segment exp xx xx
Segment ctrb xx xx xx
HO exp xx
NOP xx

Cash Flow Analysis Net income
Non-operating losses (gains)Operating accrualsBonus adjustment (Taiwan special)
Operating cash flow before net working capital investments
Net (investment in) liquidation of non-financial WC Net increase (decrease) in XCL
Operating cash flow before in net long-term operating investments
Net (investment in) liquidation of LTOA Net increase (decrease) in XLL

Cash flow before financial investments (free cash flow from operation, FCFO)
Gains (losses) from FINet (increase) in liquidation of FI
Cash flow before non-operating-financial investments*
Non-operating-financial gains (losses)Net (increase in) liquidation of XOFI
Cash flow before equity-method investments
EMI gains (losses)Net (increase in) liquidation of EMIs

Cash flow before investments in innovative R&D (IPR&D expenses) Net (investment in) liquidation IPR&D assets*
Free 可支配 cash flow (FCF) available to debt and equity (to assets, FCFA)**
(After-tax net interest expense)Net debt (repayment) or issuance
FCF available to equity (FCFE)(Cash dividend payments)Stock (repurchase) or issuance
Net increase (decrease) in cash balance

ForecastingIS projection
Major assumptionsΔS%: sales growth rate
COGS%: COGS/revenue
S&A%: S&A/Sales
NOPT%: tax rate on NOP
NFP%: NFP margin
XOFP%: XOFP margin
EMIP%: EMIP margin
IPRDE%: IPRDE/E

1
1
1
1
1
(1 %)
%
& & %
&
%
%
%
%
%
/
S S S
COGS S COGS
GP S COGS
S A S S A
NOPBT GP S A
T NOPBT NOPT
NOP NOPBT T
NFP FE NFP
XOFP XE XOFP
EMIP EMI EMIP
IPRDE E IPRDE
NI NOP NFP XOFP EMIP IPRDE
EPS NI SHR

BS projectionMajor assumptions
NWCTO: NWC turnover
NLTOATO: NLTOATO turnover
DPO%: dividend payout ratio• Include bonus to employees and board members
STKD%: stock dividend as a percentage of dividend• Include stock bonus to employees
SHR: number of shares outstanding
XE assumed the same as last year

1 1 1
1
1
1 1
/
/
(1 %) % %
(1 %)
0
% % /10
NWC S NWCTO
NLTOA S NLTOATO
NOA NWC NLTOA
E E NI DPO NI DPO STKD NI
IE EMI EMIP
XE XE
IPRDA
OFE E XE IE IPRDA
NIBD NOA OFE
SHR SHR NI DPO STKD

ValuationValuation of OE (VOE)#
DCF: FCF capitalizationΔNOA: net investment in operation
ΔNOA%: NOA growth rate = ΔNOA/NOA = NOP*RI%/NOARI% = NOP reinvestment rate
FCFO: FCF from operation = cash flow before financial investments = NOP - ΔNOA*
FCFA: FCF available to debt and equity (asset)FCFE: FCF available to equity
Economic profit (abnormal earnings) capitalization (NOP – OE x cost of equity)

Valuation of non-operating equitiesValue of XE (VXE)
Liquidation value for idle assets, income-capitalization value for rented assets, market value for real estates, etc.
For business units to be disposed of• Valuation is similar to that of EMI except certain discounts
may have to be taken if put on sale. • May need to estimate cost of disposal or even liquidation
value.Value of IE (VIE)
Listed: EMI measured at market value. Unlisted: refer to valuation by venture capitals or
valuation professionals.

• Any operating synergy associated with strategic alliances would have already been reflected in NOP and hence, incorporated in VOE.
• Non-control discount, volume discount and even loss of synergy value may be relevant depends on strategic considerations.
Value of FE (VFE)Value of FI (VFI)
• FIs are valued as mutual funds with special attention paid to private equities.
Value of IBL (VIBL) • Value of the group (VG) = VOE + VXE + VIE + VFI• Option pricing model: the value of a risky debt is equal to the
price of a risk-free debt with the same maturity minus the price of a put written on the value of the group

• VIBL = Min (IBL, VG), need to determine the maturity of IBL and the volatility of VG.
• The weighted average maturity of IBL may be a candidate for the put option’s maturity, and the riskiness of IBL determine the value of the put (i.e., credit risk discount for IBL).
• The volatility of VG may be estimated as the volatility of a portfolio (i.e., taking into account correlations among VOE, VFI, VXE and VIE).
VFE=VFI - VIBLValue of equity (VE)
VE = VOE + VFE + VXE + VIE + VIPRDVIPRD: value of innovative R&D. May also include
value of future investment opportunities.

Value of equity may be estimated directly as
where denotes cost of equity and g as earnings growth rate.
Or value of the group may be estimated directly as
where denotes c
t
E
E
t
G
G
FCFEVE
r g
r
FCFGVG
r g
r
ost of capital and g the growth rate of
earnings before interest. Then .VE VG VIBL

Credit RatingA simple approach based on Basel 2
Credit risk mitigationStandardized supervisory haircuts for collateral,
paragraphs 152-153.• Treat group assets as collateral for interest-bearing debt.*
Measure default distanceBased either on market or on accountingShort-term rating
• Based on expected one-year performance.Long-term rating
• Based on expected three-year performance.

Debt issue rating Residual maturity Sovereigns Other issuers
AAA to AA-/A-1 <= 1 year 0.5 1
> 1 year, <= 5 year 2 4
> 5 year 4 8
A+ to BBB/A-2
A-3/P-3 & unrated bank securities
<= 1 year 1 2
> 1 year, <= 5 year 3 6
> 5 year 6 12
BB+ to BB- All 15 Non-eligible
Main index equities (including convertible bonds) & gold
15
Other equities (including convertible bonds) listed on a recognized exchange
25
Cash in the same currency 0
UCITs/mutual funds Highest haircut applicable to any security in the funds

ComputationHaircuts
Table of standard supervisory haircuts• The haircut for currency risk is 8%. • For non-eligible instruments (e.g., non-investment grade corporate
debt securities), the haircut to be applied should be the same as the one for equity traded on a recognized exchange that is not part of a main index.
Non-eligible collateral• Real estates, equipments, intangible assets, etc• Haircuts based on domestic banking practice
Short-term vs. long-term rating• The standard supervisory haircuts are for very short-term credit, may
need to adjust to the appropriate time horizon.• May consider stress conditions

Default distanceGroup asset distance (GAdist) = Group asset after
haircut (GAahc) – IBL; GA = NOA + FI + XOFA + EMI + IPRDA
Debt coverage ratio (DCR) = GAahc / IBLInterest coverage ratio (ICR) : EBITDA / interest
expenseNet income forecast adjustment (NIfa) = min (0, net
income forecast), assuming 100% payout ratio. (Three years if long-term rating)
Volatility of market value of equity (VoMVE) = standard deviation of rate of return on equity (SDE) x value per share (VPS) x SHR

Volatility of market value of the group (VoMVG): derived from VoMVE using the option pricing model (refer to Moody’s KMV model).*
Default distance based on market value (DDM) = (MVG – IBL) / VoMVG
EBI volatility based on market (EBIVm) = VoMVG / (MVG/EBI)
Default distance based on accounting using EBIVm (DDAm) = (GAdist + NIfa) / EBIVm
EBI volatility based on accounting (EBIVa) = standard deviation of RoGA x GA
Default distance based on accounting using EBIVa (DDAa) = (GAdist + NIfa) / EBIVa

If it is difficult to measure group variables, alternatively, DDM = MVE / VoMVE*
Net income volatility based on market (NIVm) = VoMVE / (MVE/NI)
Default distance based on accounting using NIVm (DDAm) = (GAdist + NIfa) / NIVm
Net income volatility based on accounting (NIVa) = standard deviation of ROE x E
Default distance based on accounting using NIVa (DDAa) = (GAdist + NIfa) / NIVa
Credit ratingRating based on DCR, ICR, DDM, DDAm and DDAa separately.Observe historical performance of each rating indicator to assign
weight and to compute the weighted average rating.
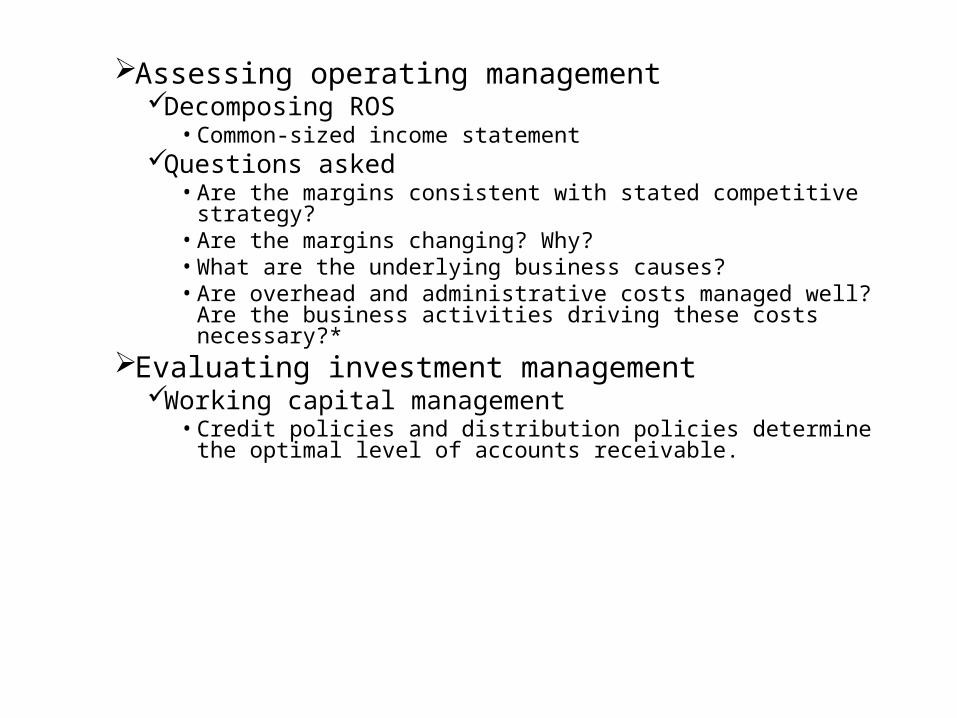
Assessing operating managementDecomposing ROS
• Common-sized income statementQuestions asked
• Are the margins consistent with stated competitive strategy?• Are the margins changing? Why?• What are the underlying business causes?• Are overhead and administrative costs managed well? Are
the business activities driving these costs necessary?*Evaluating investment management
Working capital management• Credit policies and distribution policies determine the
optimal level of accounts receivable.

• Credit policies consistent with the marketing strategy? Artificially increase sales by loading the distribution channels?
• The nature of the production process and the need for buffer stocks determine the optimal level of inventory.
• Use modern manufacturing techniques? Has good vendor and logistics management systems? New products planned? Mismatch between forecasts and actual sales?
• Accounts payable is a routine source of financing for the firm’s working capital.
• Taking advantage of trade credit? Relying too much on trade credit? The implicit costs?
Long-term asset management*• Investment in PP&E consistent with the competitive strategy? • Has a sound policy of acquisition and divestures (including
integrated subsidiaries)?

Operating working capital to sales ratio (turnover)
Operating working capital / sales (reverse)
Days’ receivables (Accounts receivable turnover)
Accounts receivable / sales x 365 (reverse without x 365)
Days’ inventory (turnover) Inventory / cost of goods sold x 365 (reverse without x 365)
Day’s payable (accounts payable turnover)
Accounts payable / purchases or cost of goods sold x 365 (reverse without x 365)
Net long-term assets to sales ratio (reverse turnover)
Net long-term assets /sales (reverse)
Property, plant and equipment to sales ratio (reverse turnover)
PP&E /sales (reverse)

Evaluating financial managementDistinguish interest-bearing liabilities and other forms of
liabilities.• Interest is tax deductible; impose discipline on management to
reduce wasteful expenditures; easier to communicate proprietary information to private lenders than to public capital markets.*
• Covenants restricting operating, investment, and financing decisions.• Firms with low business risk can rely heavily on debt financing
(those with high business risk or intangible assets intensive should not).
• Managers’ attitude towards risk and financial flexibility often determine a firm’s debt policies.
• All risks transferred to the government by setting up national banks as hostages.*
• Include those with implicit interest charge such as capital lease, pension, and off-balance-sheet obligations.

Current ratio Current assets / current liabilities
Quick ratio (Cash + short-term investments + accounts receivable) / current liabilities
Cash ratio (cash + marketable securities) / CL
Operating cash flow Cash flow from operations / CL
Liabilities-to-equity Total liabilities / shareholders’ equity
Debt-to-equity ratio (short-term debt + long-term debt) / E
Net-debt-to-equity (debt – cash & marketable securities) / E
Debt-to-capital ratio Debt / (debt + shareholders’ equity)
Net-debt-to-net-capital Net debt / (net debt + shareholders’ equity)
Interest coverage EBIT / interest expense or
(Cash flow from operations + interest expense + taxes paid) / interest expense

• May want to calculate the coverage ratio of all fixed financial obligations such as interest payment, lease payments, debt repayment (paid after-tax): fixed-charge coverage.
• Borrow money to pay cash dividends or to purchase treasury stock?
Dividend policy• Signaling, clientele

AnalysisQuestions addressed (cash flow)
Internal generating ability• If negative, why? Due to growth, or losses, or difficulty in managing
working capital.
Meet short-term financial obligations• Without reducing operating flexibility?
Investment in growth• Consistent with the business strategy? Rely on external financing?*
Dividend payments• Rely on external financing or from free cash flow? Dividend policy
sustainable?

External financing• Equity, short-term debt, or long-term debt? Consistent with overall
business risk?Excess cash flow after capital investments
• Long-term trend? Deployment of free cash flow?Earnings quality
• Significant differences between net income and operating cash flow? Sources? Due to accounting policies? One-time events?*
• Relationship between cash flow and net income changing over time? Changes in business conditions or accounting policies and estimates?
• The time lag between the recognition of revenues and expenses and the receipt and disbursement of cash flows? Type of uncertainties to be resolved in between?
• Changes in receivables, inventories, and payables normal? Adequate explanation?

Factors State of the product or service*
• Healthy or mature in a steady state (cash cow)
• Incubating or growing state: R&D and advertising & marketing intensive (cash furnace)
• Divesting state (cash liquidation 金拍 )
Growth strategy, industry characteristics, and credit policies.**

Nordstrom vs. TJXNordstrom
A leading fashion specialty retailerOffer a wide variety of high-end apparel, shoes,
and accessories for men, women, and children.• In the middle of implementing a restructuring and
turnaround strategy. As of January 31, 2002, operated 156 stores, including 80 full-line stores, 45 Rack stores, two free-standing shoe stores, and one Last Chance clearing store.
Dissatisfied with inconsistent earnings performance in recent years, introduced a new management team in August 2000.

• Announced a turnaround plan including improving inventory control, expense control, and merchandising, as well as the implementation of new information systems.
• In October 2000, Acquired Faconnable, S.A. of Nice, France, a designer, wholesaler and retailer of high quality women’s and men’s clothing and accessories, operated 24 Faconnable boutiques in Europe and 4 in U.S.*
Had to contend with shifting consumers’ perceptions of the brand.*
• From a single shoe store in 1901, its strategy consistently emphasized the breadth and depth of its quality offerings.
• An aggressive expansion plan in recent years that included opening bigger and more glamorous stores, coupled with unbalanced merchandising strategy that favored stocking the highest quality product, rather than matching the quality of offerings to key price points.

• Resulted in an increase in its average price point & the erosion of its value position.
• Alienated a portion of its core customer base as the brand became increasingly associated with premium pricing.
• Recognized the need to subdue its elitist image by management and securities analysts alike.
• But will it convey a confusing message: is Nordstrom a high-end retailer?
Other key strategies • Makes significant investment in its stores.• Has a credit card operation.• A new perpetual inventory management system was on track
to fully implemented by the second quarter of 2002.• Alterations to merchandising strategy provided more price
balance to the product mix.

TJX CompaniesThe leading off-price apparel and home
fashions retailer in the U.S. and worldwide.Divisions are united by the same strategy
• As of January 31, 2002, operated 1,665 retail outlets through its T.J. Maxx, T.K. Maxx (Europe), Marshall’s, HomeGoods, HomeSense (Canada), A.J. Wright, and Winners stores.
• Offering a rapidly changing assortment of quality, brand-name merchandise at 20-60% below department and specialty store regular prices by buying opportunistically and by operating with a highly efficient distribution network and a low cost structure.*

• For customers, these brands are synonymous with value. Because they are so strong, TJX is able to spend far less than the industry average on advertising specials or promotions. Instead, advertising campaigns keep stores at the top of customers’ minds as places to find great bargains on quality merchandise.
• Continuous improvement to inventory management: allowed buyers to further delay purchase decisions, getting better deals in the process, while maintaining confidence that goods will arrive in stores in a timely manner.
• Stock rating upgraded to Strong Buy: we believe TJX is a long-term growth story with an attractive inventory and new business concepts that are expected to perform well.
Goldman, Sachs & Co.Equity research ratings
RL (Recommended List)• Expected to provide price gains of at least 10 percentage
points greater than the market over the next 6 to18 months.MO (Market Outperformer)
• Expected to provide price gains of at least 5 to10 percentage points greater than the market over the same period.
MP: Market Performer• Expected to provide price gains similar to the market.
MU (Market Underperformer)• Expected to provide price gains of at least 5 percentage
points less than the market.

In addition, Goldman Sachs had one shorter-term rating, Trading Buy
• Expected to provide price gains of at least 20 percentage points sometime in the next 6 to 9 months.
Research conflict• The percentage of issuers being assigned one of the
top two investment ratings ranged from 72% in the first quarter of 1999 to 50% in the last quarter of 2001. The percentage of companies assigned a MU rating did not rise above 1.1% during the relevant period.

Ratio Nordstrom 2000
Nordstrom 2001
TJX
2001
ROE 8.6% 10.1% 41.1%
ROA =
ROS ‧
A turnover
3.3%
1.8%
1.81
3.4%
2.2%
1.56
17.3%
4.67%
3.71
1+D/E 2.58 2.93 2.37
OROA =
NOP/S‧
OA turnover
7.0%
2.5%
2.75
7.1%
3.0%
2.35
35.7%
4.8%
7.41
Leverage gain
= Spread ‧
(Net debt/E)
1.6%
2.3%
0.69
3.0%
3.2%
0.95
5.3%
28.7%
0.19

% of sales Nordstrom 2000
Nordstrom 2001
TJX
2001
Gross profit 34.0% 33.2% 24.1%
SG&A 31.6% 30.6% 15.7%
Other income 2.4% 2.4% 0
Net interest (1.1%) (1.3%) (0.24%)
Income taxes (1.2%) (1.4%) (3.1%)
Unusual gains (0.4%)
NOP 2.5% 3.0% 4.8%
EBITDA 4.2% 5.0% 8.4%
ROS 1.8% 2.2% 4.7%

Ratio Nordstrom 2000
Nordstrom 2001
TJX
2001
Operating WC turnover 6.1 5.2 26.8
Net long-term asset turnover 5.0 4.3 10.2
PP&E turnover 3.9 3.5 11.8
Accounts receivable turnover 9.0 7.8 173.2
Inventory turnover 4.6 4.0 5.6
Accounts payable turnover 9.3 8.1 12.6

Ratio Nordstrom 2000
Nordstrom 2001
TJX
2001
Current 2.14 2.28 1.4
Quick 0.92 0.94 0.16
Cash 0.07 0.03 0.11
Operating cash flow 0.29 0.58 0.75
Liability to equity 1.58 1.94 1.37
Debt to equity 0.74 0.97 0.29
Net debt to equity 0.69 0.95 0.19
Debt to capital 0.43 0.49 0.23
Net debt to net capital 0.41 0.49 0.16
Net debt to equity (+lease) na na 2.23
Interest coverage (earnings)
3.33 3.35 21.54
interest coverage (CF) 5.26 7.02 31.04

Ratio Nordstrom 2000
Nordstrom 2001
TJX
2001
Fixed charges coverage (+lease, earnings based)
2.4 2.4 2.71
Fixed charges coverage (+lease, CF based)
3.57 4.69 3.5
ROE 8.6% 10.1% 41.1%
Dividend payout ratio 45% 39% 9.7%
Sustainable growth rate 4.7% 6.2% 37.1%

• Relationship between ROS and asset turnover: conventionally thought to be negative because price decreases lead to increases in volume, but it can be positive by using resources to promote sales rather than tying them up in low performing assets (high service and maintenance costs). A discount retailer can have a higher NOP margin than a premium retailer.
• Operating ROA can be significantly higher than ROA: utilize non-interest-bearing liabilities to finance operating assets and reduce cash and marketable securities when business is highly profitable.
• Operating ROA would be mean-reverting toward the weighted average cost of capital. For large firms in the U.S. over long periods of time, it is in the range of 9-11%.
• The cost of differentiation has to be commensurate with the price premium earned.

• NOP should exclude nonrecurring items if one is extrapolating current performance into the future.
• Own credit card operations will increase days’ receivables considerably.
• Under severe economic conditions, compare EBITDA with net interest expense. Leasing expenses should be treated as depreciation when making cross-sectional comparison.
• Two measures to evaluate a firm’s tax expense: the ratio of tax expense to sales vs. to earnings. Footnote provides a detailed account of why the average tax rate differs from the statutory rate.
• The benefits of tax planning strategies may be outweighed by the increased business costs (e.g., operations located in tax heavens affect asset utilization).
• Using non-cancelable operating leases potentially inflate operating asset turnovers.

Line items Nordstrom 2000
Nordstrom 2001
TJX
2001
Net income (millions) 101.9 124.7 500.4
Net interest expense AT 38.3 45.8 15.9
Nonoperating losses 32.9 0 70.6
Long-term operating accruals 194.7 228.3 239.3
Operating CF before WC 367.7 398.7 826.2
(Investments) in operating WC (153.6) 60.8 95.3
Operating CF before LTOA 214.2 459.5 921.5
(Investments) in LTOA (314.7) (267.1) (442.6)
Free CF available to debt (100.5) 192.4 478.9

Line items Nordstrom 2000
Nordstrom 2001
TJX
2001
Net interest (expense) AT (38.3) (45.8) (15.9)
Net debt (repayment) 262.2 198.5 302.1*
Free CF available to equity 123.4 345.1 765.1
Dividend (45.9) (48.3) (48.3)
Net stock issuance (79.3) 9.2 (359.0)*
Net increase in cash (1.8) 306.1 357.9
* With abundant cash, still borrow heavily to increase financial leverage. Repurchase stocks when ROE is high to create an even higher ROE. Under price multiple, this is the best way to pay cash dividends.

Ch. 12 M&A, and Joint VenturesHistory
USBecame notorious in the late 1800s in the US
with the activity of the “robber barons” The consolidating activities of J.P. Morgan and
others in the early 1900s.Recent waves
In the booming economy of the late 1960s.In the controversial restructuring wave of the 1980s.The mega-deals at the close of the 1990s.

EuroDriven by the introduction of the Euro.Overcapacity in many industriesSteps taken (albeit halting) to make capital markets shareholder-
friendly.
M&AGeneral functions
An increasingly important means of reallocating resources in the global economy.
Executing corporate strategies.Infrastructure has grown up to facilitate
Including investment bankers, lawyers, consultants, public relations firms, accountants, deal magazine, private investors and investigators.

Winners & losersThe reality is that there are as many answers as there are
deals and vantage points from which to argue.May be good for shareholders of both companies but bad for the
economy if it creates a monopoly position detrimental to consumers.
An individual who loses job or a town that loses its main plant to merger cutbacks are not immediately (and may never be) better off than they were.
Conversely, real improvement in efficiency can lead to higher quality and less costly products.
The economy overall is likely to be more vibrant, opportunity-rich, and create more job if resources are continuously moved out of lower value uses into more profitable ones.

Academic researchEx ante market reactions
Taking into account not only expected costs and benefits of the deal, but also the market’s expectation of whether the deal will actually be consummated.
AssumingThe market is smart and able to size up the price paid, potential
synergies, and integration ability of the management involved to arrive at an unbiased estimate of the likelihood of a deal adding to the value of a company.
Findings Shareholders of acquired companies receiving on average a 20%
premium in a friendly merger and a 35% in a hostile takeover.

Shareholders of acquiring companies, on average, earned small returns that are not even statistically different from zero.
Because competition among acquirers forces the target’s price up to the point where little or no expected benefit to acquiring shareholders is left.
Investors are skeptical about the likelihood of acquirers getting more than they pay for in a deal.
Deals expected to create value For acquirers whose stocks moved significantly near the
announcement of a deal, 42% were winners and 58% losers.1. Bigger value creation overall: if the deal is judged a marginal or
losing position overall, acquirers’ share prices dropped 98% of the time. If there is seen to be substantial juice, it is much more likely that the acquirer will be able to capture a portion while paying a fair price.

2. Lower premium paid (less than 10%): three times as likely to see their stock prices affected favorably by the announcement.
3. Buy subsidiaries or divisions of other companies: could be due to lack of publicly traded price to anchor price negotiations, the desire of sellers to complete a transaction so management can rid itself of a problem division, or perhaps the ability of the acquirer to integrate the business more rapidly and effectively.
4. Better-run acquirers: acquirers whose five-year ROICs were above average for their industries were statistically more likely to see their stock price rise upon announcement of a deal.
Ex post Looking back to see how what did happen compares
with what had been hoped for.

116 acquisition programs of Fortune 200 largest US industrials or Financial Times top 150 UK industrials between 1972 and 1983 A program is judged successful if it earned its cost of capital or
better on funds invested in it, after giving the programs at least 3 years to season.
61% ended in failure, only 23% in success.1. The greatest chance of success was for those programs where
acquirers bought smaller companies (purchase price less than 10% of the acquirer’s MV) in related businesses (the target’s market were similar to those of the acquirer). (45% vs. 14% if target was large and in an unrelated line of business)
2. 92% of the successful US programs, acquirers had high performance core business.

13 LBOs and 8 US corporate buyers of businesses that seemed not to have synergies with the acquiree. Overall these 21 companies were very successful. They made 829 acquisition and 80% believed they had earned
more than the cost of capital. The US corporate acquirers averaged more than 18% return
over a 10-year period, outperforming the S&P 500. The buyout firms reported that return to investors exceed 35%
in the period.1. They focused on quickly improving operating performance at
acquired companies.2. Identified and created big incentive for the top leaders at the
companies and replaced them if their performance did not make the grade.

3. Focused on the cash flow generated by the business, rather than accounting earnings.
4. Used an active and interactive involvement among owners, board members, and management to push the pace of change and created a sense of urgency.
5. Many of the acquirers had their personal wealth involved in each deal. They concentrated on buying at reasonable prices, identifying concrete operating improvements, and extracting their investment within five years. (Management of large corporate acquirers has little direct stake in a business it buys and can be easily deluded into accepting “strategic” arguments for paying more.*)
Reasons for failure Overpay

The more time and effort that has gone into a deal, the harder it is to admit that it won’t create value for shareholders at a given price or on particular terms, regardless of sheer business logic.
1. Overoptimistic appraisal of market potential Assuming market will rebound from a cyclical slump or a
company will turn around. Assuming rapid growth will continue indefinitely. Points out the need for an independent assessment of the
value of a company on a standalone basis as the essential underpinning of any deal.
If you pay a premium, you will either need to capture synergies or improve operations.

2. Overestimation of synergies Synergy either stands for the pipe dreams of management or a hard-
nosed rationale for a deal. Often a little of both. The estimation of deal benefits became disconnected from reality
somewhere along the way. “The Vision Thing” often underlies such situation.
3. Poor due diligence Due diligence has an intensive legal and accounting aspect to it that
involves large number of accountants and lawyers working long hours in unpleasant conditions.
There is also a need for secrecy and speed, since leaks can prompt problems with securities regulators, customers, suppliers and employees.
Many participants are either inexperienced or not sure what they are looking for.

Many people do not want to be the bearer of bad news. Put it all together, sometimes even major problems that should
have been caught slop through and blow up, usually in the year after closing.
4. Overbidding The winner’s curse: if your are the winner in a bidding war, why
did your competitors drop out.
Poor post-acquisition implementation The complex task of integrating two different organizations.
Relationships with customers, employers, and suppliers are often disrupted during the process.
Rather than improving the target’s performance by injecting better management talent, end up chasing much of the talent out.

Death spiralCandidates are screened on basis of industry and company
growth and returns.One or two candidates are rejected on basis of objective
DCF analysis.Frustration sets in. Pressures build to do a deal. DCF
analysis is tainted by unrealistic expectations of synergies.Deal is consummated at large premium.Post-acquisitions experience reveals expected synergies
are illusory.Company’s returns are reduced and stock price falls.

Steps in successful M&A Step 1: Do your homework
Value your own company and understand the changing structure of your industry and the players in it, then you should have a clear vision of the value-adding approach that will work best.
1. Strengthen or leverage core business by gaining access to
New customers or customer segment Complementary or better products and services
2. Capitalize on functional economies of scale In distribution or manufacturing To cut costs and improve product and service quality.

3. Benefit from technology or skills transfer If the niche skills of some companies can be applied to larger volumes
of business or opportunity, they can be a source of real value. Focus on how revenue will increase or costs will fall
The fact of merger itself will disrupt customer relationships, leading to loss of business.
Smart competitors use mergers as prime opportunity to break into new accounts, including recruiting star salespeople or product specialists.
Customers are not shy about asking for price and other concessions in the midst of merger, which salespeople will be eager to offer for fear of losing the business and getting bad publicity.
Managerial hubris creates overly optimistic self-assessments of skills that can be leveraged.

Sales forces might not be integrated to move more product through the same number of salesperson if they do not make exactly the same customer call for the merging companies.
Housekeeping/homework tasksIdentifying the details that are necessary for getting a transaction
evaluated and approved (or not) ahead of time.Knowing who in the organization needs to approve a deal as a formal
matter.What must go to the board of directors and when?Which types of deals must shareholders approve?Are there any restrictions on types of consideration, issuance of
options to an acquired company’s employees, or changes to benefit plans?
Which regulators will need to be consulted and what are the criteria for deal approval?

Are there customer, supplier, employee, or other contracts that contain provisions that would be affected by various types of transactions?
What is the company’s tax profile, how would it be affected by possible transactions?
Step 2: identify and screen candidatesInvestment bankers
Often if a banker approaches you, odds are that the company is being widely shopped.
You will likely end up paying top dollar to acquire it after a time-pressed evaluation and due diligence process.
Actively screen and cultivate candidatesDevelop a database and set of files on all prospective candidates in
your area of interest.It is likely that you will track many candidates for several years.

You will be aware of many candidates as a result of business strategy work.
Winnow the universe of candidates by employing a list of knock-out criteria.
A set of candidates that have solid businesses; offer potential for revenue and cost synergies; fit culturally so they can be integrated with least disruption; are affordable, and are available or at least possible for purchase.
Step 3: assess candidates in depthValuing each candidate
Standalone value: average securities analyst estimates, past performance, management pronouncements.
Identifying strategy for creating valueNet synergies from the combination: how long it will take to capture.

Synergies that can be captured by a competitor.1. Universal: general available to any logical acquirer with capable
management and adequate resources. Economies of scale (leveraging fixed costs) and some exploitable opportunities (raising prices, cutting overhead, and eliminating waste)
2. Endemic: available to only a few acquirers, typically those in the same industry as the seller. Economies of scope (broad-ended geographic coverage) and most exploitable opportunities (redundant sales forces)
3. Unique: only by a specific buyer. Consider restructuring and financial engineering.
Maximize the value to you while minimize the price you have to pay.
Keep tax experts involved.

Step 4: contact, court, and negotiate Many sellers do not want to sell. Hostile bid will make the job of finalizing your assessment of
the target very difficult and set a poor tone for effective integration after the deal.
Purposes of a discreet courtship process1. Learn more about whether there is a good fit.2. Convince the sellers to sell.3. Convince them to sell to you, preferably through exclusive
negotiations Acquirers who fail because they overbid or could not make the
acquisition work, often become targets themselves. Negotiation is an art

Lookout for creative ways to handle stumbling blocks Contingent payment structure such as “earnouts” keyed to
achieve profit targets can help bridge the gap. Payments tied to customer retention. Stay-put payments, stock plans and the like can help ensure key
staff remain long enough.
Step 5: post-merger integration PMM is a fancy phrase for figuring out how to recoup
your investment.I. Define the new business model
1. Unify strategic direction2. Develop new operating model3. Set clear targets, accountability, and performance incentives

Ideally this game plan will begin as part of the deal negotiations, be firmed up between signing and closing, and be ready for implementation immediately after the close.
II. Resolve uncertainty and conflicts Mergers generate tremendous excitement and distress4. Decide top management5. Embrace top performers6. Communicate to get employee buy-in
III. Respond to external pressures7. Sell deal to key customers8. Communicate with external stakeholders9. Keep regulators satisfied
The sooner cash flow improvement can be realized the better from a value perspective.

Joint venturesDiffer from acquisitions
Effectively partnerships and their creation does not usually involve a takeover premium to either party.
To be successful they must be structured to allow effective control.
As a form of alliance, JV can be focused on pieces of the business system (a sales JV or a production or development JV) and can be dissolved after a period of time.
M&As tend to deal with the entire business system of a company and are more permanent in nature.
Findings

1.Both cross-border acquisition and cross-border alliances have roughly the same success rate (about 50%)
2.Acquisitions work well for core businesses and existing geographical areas. Alliances are more effective for edging into related businesses or new geographic areas.
3.Alliances between strong and week rarely work.4.Successful alliances must be able to evolve beyond their
initial objectives. This requires autonomy and flexibility.5.More than 75% of the alliances that are terminated end
with an acquisition by one of the parents.Alliance options

聯盟 新產品市場
上游風險
開發成本
產品科技跳升
產能利用
規模經濟
充實產品線
新地域市場
購併 ● ● ● ● ●
合併 ● ● ● ●
核心 JV ● ● ● ● ●
銷售 JV ● ● ● ●
生產 JV ● ● ● ●
開發 JV ● ● ● ●
產品交換 ● ● ● ●
生產授權 ● ● ● ● ●
技術聯盟 ● ●
開發授權 ● ● ●

Motivation M&As benefit from geographical overlap
Synergies such as consolidation of production facilities, integration of distribution networks, and reorganization of sales forces are more easily achieved by high geographical proximity.
Alliances are usually intended to expand the geographical reach of the partners.
Ownership structure Evenly split JVs have 60% probability of success compared with only
31% if uneven. When one partner is weak, the weak link becomes a drag on the venture’s
competitiveness and hinders successful management. When one parent has a majority stake, it tends to dominate decision making
and puts its own interests above those of the partner, or the JV itself.

Autonomy and flexibilityImportant because the relative power of the parents will
inevitably change, markets and customer needs will shift, and new technologies arise.
Can be built by giving the JV a strong, independent president and a full business system of its own and providing it with an independent, powerful board of directors.
Life spanMore than 75% of the terminated partnerships were acquired
by one of the partners.It is useful to prepare for the break-up of the alliance.Often the natural buyer is the company that is most willing to
invest to build the JV.

Ch. 13 Communication and Governance
Increasingly importantMarket collapses
Accounting misstatementsLack of corporate transparencyGovernance problemsConflicts of interest
• Among intermediaries charged with monitoring management and corporate disclosure.
Challenges

Communicating credibly with skeptical outside investors.
More difficult than ever to raise capital.New regulations
Increase accountability and financial competence for audit committee and external auditors.
Governance overviewManager optimism in reporting
Genuinely positive about prospects• Unwillingly emphasize the positive and downplay the
negativeAgency problems

RetailInvestors
Information Demand Side
Managers
ProfessionalInvestors
InformationAnalyzers
InternalGovernance
Agents
AssuranceProfessionals
$$ Advice
CredibleFinancialStatements
Business & financial information (other sources)
Standard Setters &Capital Market Regulators
Information Supply Side

• Reporting consistently poor earnings increases the likelihood that top management will be replaced, either by the board of directors or by an acquirer who takes over the firm.
Issuing new equity• Entrepreneurs tend to take their firm public after
disclosure of strong reported, but frequently unsustainable, earnings performance.
• Seasoned equity offers typically follow strong, but again unsustainable, stock and earnings performance.
• Appears to be at least partially due to earnings management.

• Rational investors respond by discounting the stock, demanding a hefty new issue discount, and in extreme cases refusing to purchase the new stock.
• This raises the cost of capital and potentially leaves some of the best ventures and projects unfunded.
Financial and information intermediariesInternal governance agencies
• Corporate boards are responsible for monitoring a firm’s management by reviewing business strategy, evaluating and rewarding top management, and assuring the flow of credible information to external parties.
Assurance professionals• External auditors enhance the credibility of financial information
provided by managers.Information analyzers

• Financial analysts and rating agencies are responsible for gathering and analyzing information to provide performance forecasts and investment recommendations to both professional and retail individual investors.
Professional investors• Banks, mutual funds, insurance, and venture capital firms make
investment decisions on behalf of dispersed investors. Responsible for valuing and selecting investment opportunities.
Organizational designDetermine the level and quality of information and
residual information and agency problems in capital markets.
Key design questions.• What are the optimal incentive schemes for rewarding top
managers?

• Should auditors assure that financial reports comply with accounting standards or represent a firm’s underlying economics?
• Should there be detailed accounting standards or a few broad accounting principles?
• What should be the organizational form and business scope of auditors and analysts?
• What incentive schemes should be used for professional investors to align their interests with individual investors?
Economic and institutional factors• The ability to write and enforce optimal contracts.• Proprietary costs that might make disclosure costly for investors.• Regulatory imperfections.
Management communication

Information asymmetryAt least in the short or even medium term.
• Difficult to value new and innovative investments.• Valuations will tend to be noisy.• Make stock prices relatively noisy, leading management at
various times to consider their firms to be either seriously over- or undervalued.
• Undervalue makes it more costly to raise new financing and increases the chance of a takeover by a hostile acquirer, with an accompanying reduction in their job security.
• Overvalue raises the concern about legal liability for failing to disclose information relevant to investors.
A word of cautionDifficult for managers to be realistic.

• It is natural that many managers believe that their firms are undervalued by the market.
• It is part of their job to sell the company to new employees, customers, suppliers, and investors.
• Forecasting the firm’s future performance objectively requires them to judge their own capabilities as managers.
• Many managers may argue that investors are uninformed and that their firm is undervalued. Only some can back that up with solid evidence.
Key analyses• Compare management forecasts with those of analysts.• Is there a significant difference?• Because of different expectations about economy-wide
performance? Managers may understand their own businesses better than analysts, but they may not be any better at forecasting macroeconomic conditions.
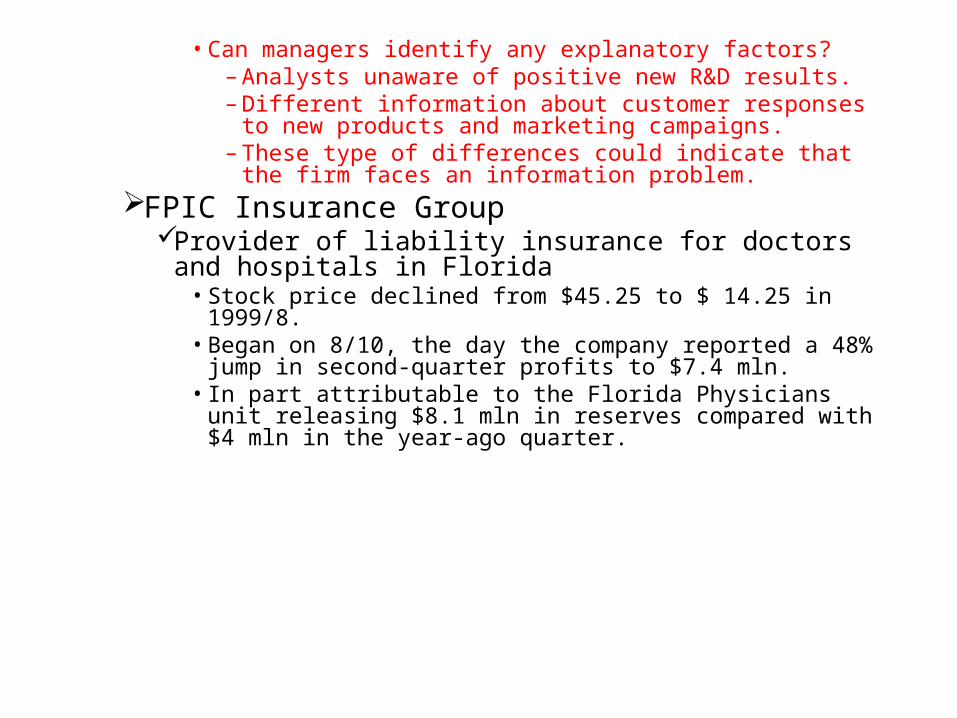
• Can managers identify any explanatory factors?– Analysts unaware of positive new R&D results.– Different information about customer responses to new
products and marketing campaigns.– These type of differences could indicate that the firm faces
an information problem.FPIC Insurance Group
Provider of liability insurance for doctors and hospitals in Florida
• Stock price declined from $45.25 to $ 14.25 in 1999/8.• Began on 8/10, the day the company reported a 48% jump in
second-quarter profits to $7.4 mln.• In part attributable to the Florida Physicians unit releasing $8.1
mln in reserves compared with $4 mln in the year-ago quarter.

• Reported higher-than-expected claims in a health insurance plan offered to Florida Dental Association members.
• Reuters: reflected investors’ concern about the quality of earnings.• Spokeswoman: as far as we are concerned, we had a great quarter.• COO: decision to release the unit’s reserves was normal business
practices and based on expectations of future claims. Had increased its rates for the dental association insurance.
• Was the firm previously overvalued? What events explain the company’s sudden drop in stock value? What options are available to correct the market’s view of the company?
Through financial reportingAccounting reports
• Not only provide a record of past transactions, also reflect management estimates and forecasts of the future, bad debt & lives of tangible assets.

• Investors are likely to be skeptical.Factors that increase the credibility
• Accounting standards and auditing• Monitoring by financial analysts• Management reputation
Limitations • Accounting rule limitations
– No rules or unable to distinguish between poor and successful performers, e.g., quality improvements, human resource development programs, R&D, and customer service.
– Takes time to develop appropriate standards for many new types of economic transactions.
– Compromises between different interest groups.• Auditor and analyst limitations
– Do not have the same understanding of the firm’s business as managers.

– Most severe for firms with distinctive business strategies or operate in emerging industries.
– Auditors’ decisions in these circumstances are likely to be dominated by concerns about legal liability.
– Conflicts of interest can potentially induce auditors to side with management to retain the audit or to sell profitable non-audit services to clients.
– Can also arise for analysts who provide favorable ratings and research on companies to support investment banking services or to increase trading volume.
• Limited management credibility– Managers of new firms, firms with volatile earnings, firms
in financial distress, and firms with poor track records.Accounting communication for FPIC
• Reported a loss reserve of $242.3 mln, 1998.

• Management warned: the uncertainties inherent in estimating ultimate losses on the basis of past experience have grown significantly in recent years, principally as a result of judicial expansion of liability standards and expansive interpretations of insurance contracts.
• May be further affected by, among other factors, changes in the rates of inflation and changes in the propensities of individuals to file claims.
• Relatively greater for companies writing long-tail casualty insurance.
• FPIC has actually quite conservative in prior years’ forecasts and has historically incurred fewer losses than it had initially predicted.
• By being conservative, management may have raised questions about its ability to forecast losses reliably in the future, or given investors the impression that it had been managing earnings.
• Why reversal?

Key analyses• Key business risks that have to be managed effectively? • Process and controls in place to manage risks?• Key business risks reflected in the FSs?• Message sent through estimates or choices of accounting
methods?• Has been unable to deliver on the forecasts underlying these
choices?• The market seems to be ignoring the message?• Communicate about key risks that cannot be reflected in
accounting reports?Other forms of communication
Analyst meetings• Appoint a director of public relations to provide further regular
contact with analysts seeking more information.

• Firms are more likely to host conference calls if they are in industries where FS data fail to capture key business fundamentals on a timely basis.
– Appears to provide new information to analysts about a firm’s performance and future prospects.
• Regulation Fair Disclosure (Reg FD)– Became effective in October 2000.– Firms that provide material nonpublic information to
security analysts or professional investors must simultaneously (or promptly thereafter) disclose the information to the public.
– Has reduced the information that managers are willing to disclose in conference calls and private meetings.
Selected financial policies• Does not provide potentially proprietary information to
competitors.

• Dividend payouts– Dividend payouts tend to be sticky in the sense that
managers are reluctant to cut dividends.– Managers will only increase dividends when they are
confident that they will be able to sustain the increased rate in future years.
• Stock repurchases– An expensive way to communicate with outside investors,
typically pay a hefty premium in tender offer, potentially diluting the value of the shares that are not tendered.
– Fees to investment banks, lawyers, and share solicitation fees are not trivial.
– Firms using stock repurchase to communicate have accounting assets that reflect less of firm value and have high general information asymmetry.

• Financing choices– May be willing to provide proprietary information to a
knowledgeable private investor or a bank that agrees to provide the company with a significant new loan.
– The terms of the new financing arrangement and the credibility of the new lender or stockholder can provide investors with information to reassess the value of the firm.
– The increased concentration of ownership and the role of large block holders in corporate governance can have a positive effect on valuation.
– Such as leveraged buyouts, start-ups backed by venture capital firms, equity partnership investments.*
– Management buyout, takes the firm private and hopes to run the firm for several years and then take the company public again.

• Hedging– If investors are unable to distinguish between unexpected
changes in reported earnings due to management performance and transitory shocks that are beyond managers’ control.
Other communication for FPIC• Announced on 1999/8/12 that it would immediately begin stock
repurchase up to 429,000 shares.• Price recovered from $21 to $26 and subsequently fell further to
$14.25.*Key analyses
• Less costly form of communication?• Sufficient free cash flow to implement a share repurchase program
or to increase dividends?• Changing the mix of owners?• Increasing management ownership?

Auditor analysisUK system
Auditors undertake a broader review than their US counterparts.
• Not only assess whether the FSs are prepared in accordance with UK GAAP, but also to judge whether they fairly reflect the client’s underlying economic performance.
Key proceduresUnderstanding the client’s business and industry to
identify key risks.Evaluating the firm’s internal control system to assess
whether it is likely to produce reliable information.

Performing preliminary analytic procedures to identify unusual events and possible errors.
Collecting specific evidence on controls, transactions, and account balance details to form the basis for the auditor’s opinion.
Presenting a summary of audit scope and findings to the Audit Committee of the firm’s board of directors.
• Detection of fraud is the domain of the internal audit.
Challenges facing audit industryCritical events in mid-1970s
• Federal Trade Commission, concerned with a potential oligopoly by the large audit firms, made a decision to pressure the major firms to compete aggressively with each other for clients.

• Shift in legal standards that enable investors of companies with accounting problems to seek legal redress against the auditor without having to show that they had specifically relied on questionable accounting information in making their investment decisions. They could assert that they had relied on the stock price itself, which has been affected by the misleading disclosures.
• Increasing litigiousness.Audit firms responses
• Lobbied for mechanical accounting and auditing standards and developed standard operating procedures to reduce the variability in audits.
• Aggressively pursuing a high volume strategy, audit partner compensation and promotion became more closely linked to a cordial relationship with top management that attracted new audit clients and retained existing clients. Make it difficult for partners to be effective watchdogs.

• Developing new higher margin, higher growth consulting services, this deflected top management energy and partner talent from audit side to the more profitable consulting part.
Recent regulatory changes• The SEC has banned audit firms from providing certain types
of consulting services to their clients.• The Sarbanes-Oxley Act requires the Audit Committee of the
Board of Directors to become more active in appointing and reviewing the audit.
• Also requires the CEO and CFO to sign off that the financials fairly represent the financial performance of the company.
Role of financial analysis toolsStrategy analysis

• How to narrow the scope of their work, has to decide where to focus attention and time.
• Identify those few key areas of the business that are critical to the organization’s survival and future success.
• These are the areas that investors want to understand. Also likely to be areas worth further testing and analysis to assess their impact on the FSs.
• It is important that the auditor develop the expertise to be able to identify the one or two key risks facing their clients.
Accounting analysis• How the key success factors and risks are reflected in the FSs.• Evaluate management judgment reflected in the key FSs
items, design tests and collect evidence accordingly.

Financial analysis• Part of analytic review• Any unusual performance changes, relative to the past or to
competitors.• Whether clients are facing business problems that might induce
management to conceal losses or to keep key obligations off the balance sheet.
• To ensure that the reasons can be fully explained and to determine what additional tests are required.
Prospective analysis• The market’s perception of a client’s future performance
provides a useful benchmark for affirming or disconfirming the auditor’s assessment of the client’s prospects.
• Is the client failing to disclose some critical information known to the auditor or is the auditor too optimistic or pessimistic?

• Is additional disclosure required to help investors get a more realistic view of the company’s prospects?
• Are the estimates and forecasts made by management realistic?Auditing FPIC
• How well the company manages claim risk?• Why changes reserve policy? Reflects a change in business
model (less risky clients)? Evidence?• Over-reserving in earlier periods? Why did auditor approve it?
Why changes now?• Justifiable? Pressure to meet unrealistic market expectations?*• Information about a representative sample of outstanding
claims. Realistic given prior settlements and experiences for other firms?
• Additional information can the firm provide to investors? Need to be audited?

Audit committee reviewsResponsible for overseeing the work of the auditor and
for reviewing the internal control.• Mandated by many stock exchanges, typically comprise three
to four outside directors who meet regularly before or after their full board meetings.
• Recommendations of the Blue Ribbon Committee on Improving the Effectiveness of Corporate Audit Committees. Define best practices for judging audit committee members’ independence and their qualifications.
• Sarbanes-Oxley Act requires that audit committees take formal responsibility for appointing, overseeing, and negotiating fees with external auditors. Members are required to be independent directors with no consulting or other potential compromising relation to management. At least one has financial expertise.

• Not in a position to catch management fraud or auditors’ failure on a timely basis. How to add value?
• 80/20 rule: devoting most of its time to assessing the effectiveness of those few policies and decisions that have the most impact
• Should be especially proactive in requesting information that helps them evaluate how the firm is managing its key risks, since it can also help them judge the quality of the FSs.
• Need to focus on capital market expectations, not just statutory financial reports. Important to oversee the firm’s investor relations strategy and ensure that management sets realistic expectations for both the short and long term.