business analytics and data warehousing
TRANSCRIPT

BUSINESS ANALYTICS AND DATA WAREHOUSING
TERM PROJECT
A Realistic Data Warehouse Project: An Integration of Microsoft
Access and
Microsoft Excel Advanced Features and Skills
Submitted to
Prof. Pradeep Kumar
Group 2
Aditya Kandi(PGP29098)
Aditya Kumar(PGP29134)
Anupam Debnath(PGP29099)
Chandraboli Roy Choudhury(PGP29073)
Teem Thomas Kottackal(PGP29119)
Samir Majumdar(PGP29086)

Table of Contents
Abstract ................................................................................................................................................... 3
Introduction ............................................................................................................................................ 4
Lowe’s corporation ................................................................................................................................. 4
Objective of the study ............................................................................................................................. 5
Scope of the study .................................................................................................................................. 5
Implementation of the project ............................................................................................................... 5
Dimensional tables .............................................................................................................................. 5
Time Dimension .............................................................................................................................. 6
Location Dimension ........................................................................................................................ 6
Product Dimension.......................................................................................................................... 6
Fact Table Creation ............................................................................................................................. 6
Data Generation ...................................................................................................................................... 6
Modeling dimensions .......................................................................................................................... 6
Time dimension ............................................................................................................................... 6
Location dimension ......................................................................................................................... 7
Product Dimension.......................................................................................................................... 7
Sales unit volume ............................................................................................................................ 7
Sales price ....................................................................................................................................... 7
Extract Transformation and Loading....................................................................................................... 7
Schema Diagram ..................................................................................................................................... 8
Hybrid Schema (SnowFlake and Star) ................................................................................................. 8
Data Analysis and Discussion .................................................................................................................. 9
Cross Tab Queries ............................................................................................................................. 10
Creation of cross tab query: .......................................................................................................... 10
Conclusion ............................................................................................................................................. 12
Implications for Future practice ............................................................................................................ 12
References ............................................................................................................................................ 13

Abstract The main purpose of the project is to construct a realistic data warehouse using Microsoft
Access and Microsoft Excel. MS Excel features such as web query, string editing techniques
and random number generations were used and implemented. MS Access concepts like
crosstab queries and pivot tables also found their respective uses.
Lowe’s Corporation of Wilkes’s County of North Carolina is selected as part of this project.
The data was randomly generated using beta distribution and random generating functions
of Excel and was imported to MS Access. This comprised the ETL part of realistic Data
Warehouse model. This data was further analysed in detail in MS Access through cross tab
queries and pivot tables. Through this we tried to gauge the difference between
dimensional modelling and relational modelling concepts, understand data warehouse
schemas and enterprise data flow concepts.
Lowe’s corporation was chosen as a corporate model mainly to bring in the touch of realism
which was possible due to the availability of product information, store locations and
financial data.

Introduction Business intelligence which is a derived result of data warehousing and data mining has
become one of the important strategic tools in the current business scenario. The business
environment has become more dynamic and competitive in today’s world. So it is
imperative to have a sophisticated information system that can handle huge amounts of
data and aid senior management in strategic decision making. It is apparent that data
warehousing has become one of the important management tools for both profit and non-
profit organizations. On this background, we plan to study the importance of data
warehousing in a corporation and how the data analysis can further aid decision making
process. As part of this study we have selected Lowe’s corporation as a corporate model for
this project.
Lowe’s corporation Lowe’s started as a small hardware store in Wilkes County North Carolina, United States. It
grew to 48th on the Future 500 list of top U.S public corporations. Key product groups of
Lowe’s are Lumber, millwork, appliances, tools, hardware and lawn care. The company is
located in all 50 U.S States in 1534, retail locations and booked a revenue of
$48,283(millions) in 2007. During this fiscal Lowe has recorded 720 million customer
transactions with an average ticket sixe of $67.05. The number of transactions made by
customers at various locations of Lowe’s corporation generates huge chunks of data that
has to be stored, managed and properly analyzed to derive meaningful insights out of it.
These insights will help the senior management of Lowe’s corporation in effective decision
making and understand the consumer behavior to stay ahead of the competition in terms of
revenues and customer retention.
The purpose of this project is to construct a realistic data warehouse for Lowe’s corporation
using numerous advanced features of MS Access and MS Excel. The number of locations and
different types of products which are available at Lowe’s makes it a perfect company for
simulating a data warehousing project. For the project we have generated sample data that
is very similar to after sales data. The data is taken for a year with wider categories of
products at 20 different locations of Lowe’s corporation.

Objective of the study The objective of the study is to create a realistic Data warehouse using the advanced
features of Microsoft Access and Microsoft Excel.
To create a database without using advanced SQL which is complex to understand and
operate for a non-technical manager. Use Microsoft access to store the data and generate
meaningful insights through data analysis.
Scope of the study The scope of the study is to understand the creation of data warehouse and is limited to the
usage of Microsoft Excel and Microsoft Access in doing so.
The scope of this project covers the following things:
Create a data warehouse schema with the help of indexing techniques, random
variable generation and probability distribution techniques.
Find out different dimension tables that are necessary for this data warehouse
project and properly model different dimensions.
Understand the creation of fact table and construct snowflake schema mapping
different dimensions to the fact table.
To understand the challenges in extraction of data using Microsoft Excel and the
importance of Microsoft access in doing the same.
To understand the importance of crosstab queries and pivot table/graphs in
analyzing the data.
We are using random variable generation and probability distribution techniques to
randomly generate the data in the Excel file. Once we are ready with data this is
loaded in to the Access for data analysis. After the data analysis, the study aims to
find out insights on the number of sales for different types of products at different
locations of Lowes Corporation
Implementation of the project
Dimensional tables
The following are the three different dimensions which are considered for the project
1. Time Dimension
2. Location Dimension
3. Product Dimension

Time Dimension
The time dimension table has 365 records in it. Each record representing one day of the
year taken for the study. The other attributes include week number, month number and
quarter number.
Location Dimension
Location dimension table contains 553 records and contains the information on different
stores and their location. It has the following attributes which include store number,
store name, store address, store region, state and pin code. For more details on this
dimension table please refer to store.xls file.
Product Dimension
This table contains all the product information for the different kind of products that are
sold at Lowe’s. It covers product type and product group information. Each product type
is given product type id with a corresponding product name. Also, each product group
has a product group id with product group information. Please refer to product.xls for
more details.
Fact Table Creation
We have used Microsoft Excel to create a realistic fact table with 20,000 records.
The fact table in this case consists of the following fields:
Time dimension ID
Location dimension ID
Product name ID
Sales unit
Sales price
Sales Revenue
Data Generation
Modeling dimensions
Time dimension
This dimension is the proxy for sales demand volume/transaction frequency. The time which
we have considered for this project is 1 year which is 365 days. In case of Lowe’s
corporation which is predominantly home appliances seller the transaction volume is lower
in winter months and higher in late spring and early summer i.e April, May and June. We
have followed a beta distribution to model over the period 1 to 365. The beta distribution
which is followed for modeling this dimension contains two shape parameters and two
range parameters.
int(betainv(rand(),3,4,1,365))

We chose 3 and 4 for shape parameters will generate the data that fits our previous
requirements where the transaction volume is lower in winter and higher in late spring and
summer.
Location dimension
This dimension gives the information about the location of different stores of Lowe’s
corporation. This dimension is modeled using the following Excel function:
randbetween(1,20)
The above function will generate random integers between 1 and 20. In this case we
have assumed Lowe’s corporation is present in 20 locations as there is a limitation on
total number of records in the sales fact table (20,000 records).
Product Dimension
This dimension gives the complete product information which includes product type and
product group in which it falls. This dimension is modeled using the following Excel function
randbetween(1,1724)
The above function will generate random integers between 1 and 1724. The total number of
products which are unique are assumed to be 1724.
Sales unit volume
We have used the beta distribution to generate the numbers of sales unit volume. We have
taken the same shaping parameters as the time dimension to have the same transaction
frequency. This will give us more realistic numbers which are close to actual sales.
The function which is used to generate the numbers:
int(betainv(rand(),3,4,5,50))
Sales price
The random numbers are generated using the following excel function
NORM.INV(RAND(),67,200)+1000
The average ticket size is assumed to 67 and we have generated random numbers ranging
from 67 to 200 for the sales price.
Extract Transformation and Loading This is a process in which data is extracted from disparate sources or multiple applications
developed by different vendors and hosted in different hardware or software. Once the
data is extracted from different sources it undergoes transformation stage where data is
cleaned and finally loaded in to data warehouse. Figure below shows how the ETL process
happens in data warehousing.

.
In our project we are using MS Excel and MS Access to realize the data warehouse for
Lowe’s corporation. So once the modeling of different dimensions is done we are ready with
data in the form of Excel sheets. There are four Excel files
1. Product.xls – gives information about products
2. Store.xls – Contains information about store
3. Time.xls – Contains information about time
4. F1- Sheet holding the fact table information which is sales data.
As part of the loading process, these excel files are imported in to MS access.
Challenges faced during the ETL process
1. Extraction of data from website using MS Excel WebQuery was not feasible due to
unacceptable data arrangement in the website.
2. Data transformation using micro was another roadblock for our project.
3. Sophisticated data extraction tools are not easily available
Schema Diagram
Hybrid Schema (SnowFlake and Star)
After importing the data in to Access, we have created a schema diagram mapping all the
relationships between individual tables. The schema diagram is shown in the below figure.
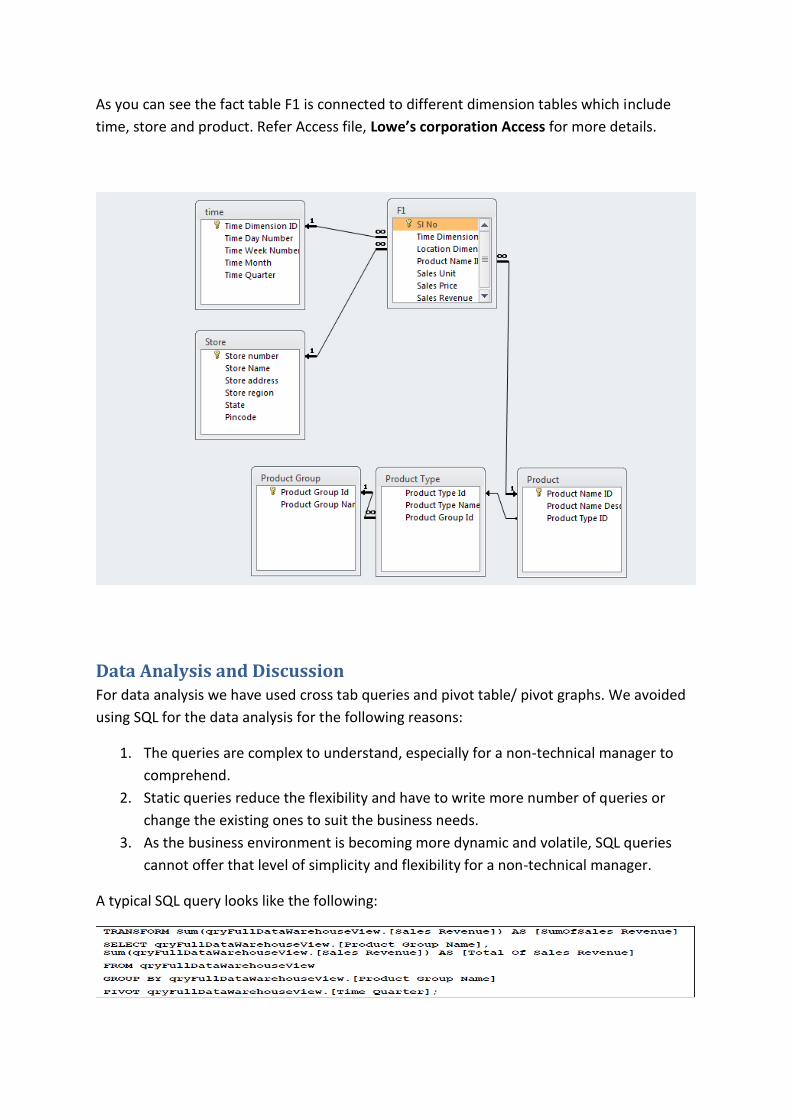
As you can see the fact table F1 is connected to different dimension tables which include
time, store and product. Refer Access file, Lowe’s corporation Access for more details.
Data Analysis and Discussion For data analysis we have used cross tab queries and pivot table/ pivot graphs. We avoided
using SQL for the data analysis for the following reasons:
1. The queries are complex to understand, especially for a non-technical manager to
comprehend.
2. Static queries reduce the flexibility and have to write more number of queries or
change the existing ones to suit the business needs.
3. As the business environment is becoming more dynamic and volatile, SQL queries
cannot offer that level of simplicity and flexibility for a non-technical manager.
A typical SQL query looks like the following:

Cross Tab Queries
A typical cross tab query output looks like the following
1. One, two, or three columns on this side contain row headings. The names of the
fields that you use as row headings appear in the top row of these columns.
2. The row headings appear here. The number of rows in the crosstab datasheet can
grow quickly when you use more than one row heading field, because each
combination of row headings is displayed.
3. The columns on this side contain column headings and summary values. Note that
the name of the column heading field does not appear on the datasheet.
4. Summary values appear here.
Creation of cross tab query:
We can create cross tab query using cross tab query wizard of MS Access. The following are
the steps that are to be followed for creating a cross tab query.
On the Create tab, in the other group, click Query Wizard.
In the New Query dialog box, click Crosstab Query Wizard, and then click OK.
a. Choose the table you want to use for the cross tab query
b. Choose the row headings
c. Choose the column headings
d. Choose a field and function to calculate the summary values
e. Save the query with a name
We have created the following cross tab queries for analysing the data:
Store_crosstab
We have created a cross tab query on the store to identify the number of stores present in
each location for Lowe’s corporation. Refer to Store_crosstab in MS Access file.

Product_store_region_crosstab
This query joins two tables, product and store to give user a picture on the availability of
product in different stores of Lowe’s corporation. Also it gives the information on each
product, how many stores it is available and the quantity that is available in each store.
Refer to Product_store_region_crosstab in MS Access file.
Product/Loc query
This query gives the information of total number of sales of each product as a whole and
also in terms of each location. Refer to Product/Loc query in MS Access file
Product_store_region query
This query is used to display the different kinds of products which are available at each store
in 20 different locations. Refer to Product_store_region query in MS access file.

Conclusion A realistic data ware house for Lowe’s corporation has been created with the help of MS
Excel and MS Access overcoming the challenges at Data generation and ETL process. Data
analysis has been done using cross tab queries on different dimensions to get different
views of the same data. The potential of cross tab queries of MS access has been explored in
this project and successfully implemented using data analysis process. However there are
few things which can be done in future in order to effectively utilize the potential of MS
access and MS Excel. These implications are covered in next section.
Implications for Future practice Product and location data may be created using customized discrete probability
distribution obtained from public sales data instead of creating it using Excel
function.
Addition of real product prices will create more realistic data for analysis.
Getting data from commercial retail marketing Database will yield more realistic
sales data modeling.
Refining beta distribution parameters will also be beneficial.
Improving the Excel web Query process and associated ETL macros will provide more
straightforward data download including price capture from website.
Creating entire ETL process in Visual Basic for application will offer more flexibility,
editing power & control.
Using MySQL in place of MS Access will offer additional advanced DBMS concepts for
investigation like index type selection and creation, query analysis and query
performance measures.
References
Journal of information Technology Education Innovations and practice – A realistic
datawarehouse project using MS access and MS Excel, Miachel.A.King
http://www.paragoncorporation.com/ArticleDetail.aspx?ArticleID=25
http://lowes.knowwhere.com/lowes/cgi/region?country=US®ion=AL&design=def
ault&lang=en&option=&mapid=us
https://www.youtube.com/watch?feature=player_detailpage&v=RVFgjMDeGaw