business calculus ii
DESCRIPTION
Business Calculus II. 5.1 Accumulating Change: Introduction to results of change. Accumulated Change. - PowerPoint PPT PresentationTRANSCRIPT

Business Calculus II
5.1Accumulating Change: Introduction
to results of change
Accumulated Change
• If the rate-of-change function f’ of a quantity is continuous over an interval a<x<b, the accumulated change in the quantity between input values of a and b is the area of the region between the graph and horizontal axis, provided the graph does not crosses the horizontal axis between a and b.
• If the rate of change is negative, then the accumulated change will be negative.
• Example:– Positive- distance travel– Negative-water draining from the pool
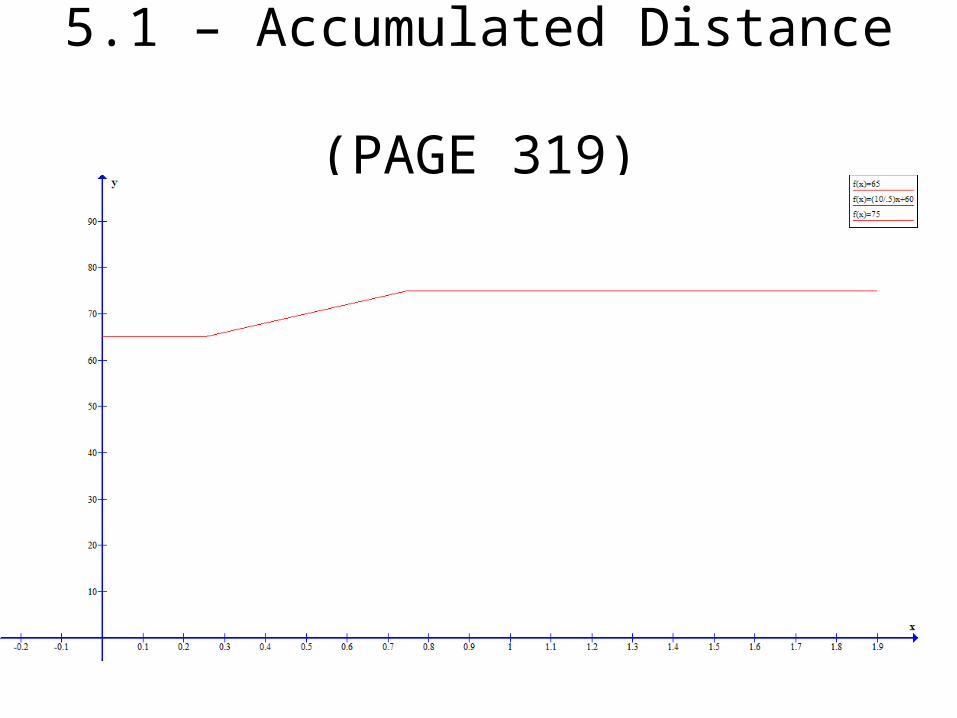
5.1 – Accumulated Distance (PAGE 319)
Accumulated Change involving Increase and decrease
• Calculate positive region (A)• Calculate negative region (B)• Then combine the two for overall change

Rate of Change (ROC)
Function Behavior
Negative Slope Positive SlopePositive Slope
ZeroZero
Minimum
Maximum

Rate of Change (ROC)
Function Behavior
Concave UpIncreasing
Concave DownDecreasing
Inflection Point
• Problems 2, 6, 7, 12 (pages 324-328)
Business Calculus II
5.2 Limits of Sums and the Definite
Integral

Approximating Accumulated Change
• Not always graphs are linear!– Left Rectangle approximation– Right Rectangle approximation– Midpoint Rectangle approximation
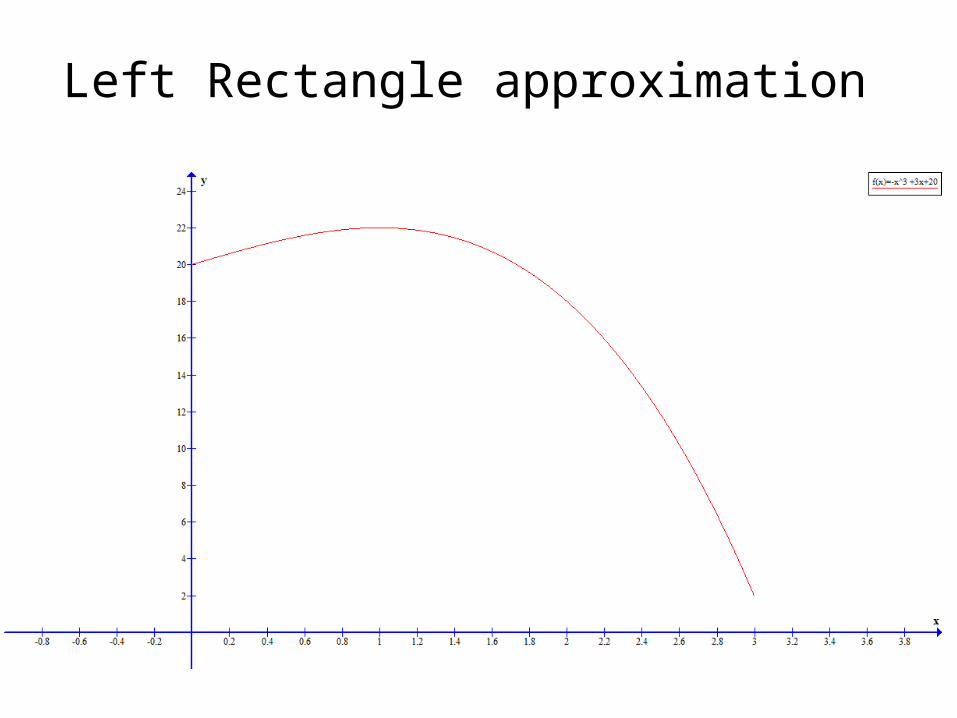
Left Rectangle approximation

Sigma Notation
• When xm, xm+1, …, xn are input values for a function f and m and n are integers when m<n, the sum f(xm)+f(xm+1)+….f(xn)can be written using the greek capital letter sigma () as

Right Rectangle approximation

Mid-Point Rectangle approximation

Area Beneath a Curve
• Area as a Limit of Sums• Let f be a continuous nonnegative function
from a to b. The area of the region R between the graph of f and x-axis from a to b is given by the limit
Where xi is the midpoint of the ith subinterval of length x= (b-a)/n between a and b.

Page 334- Quick Example
• Calculator Notation for midpoint approximation:Sum(seq(function * x, x, Start, End, Increment)
• Start: a + ½ x• End: b - ½ x• Increment: x

Left rectangle
• Calculator Notation :Sum(seq(function * x, x, Start, End, Increment)
• Start: a • End: b - x• Increment: x
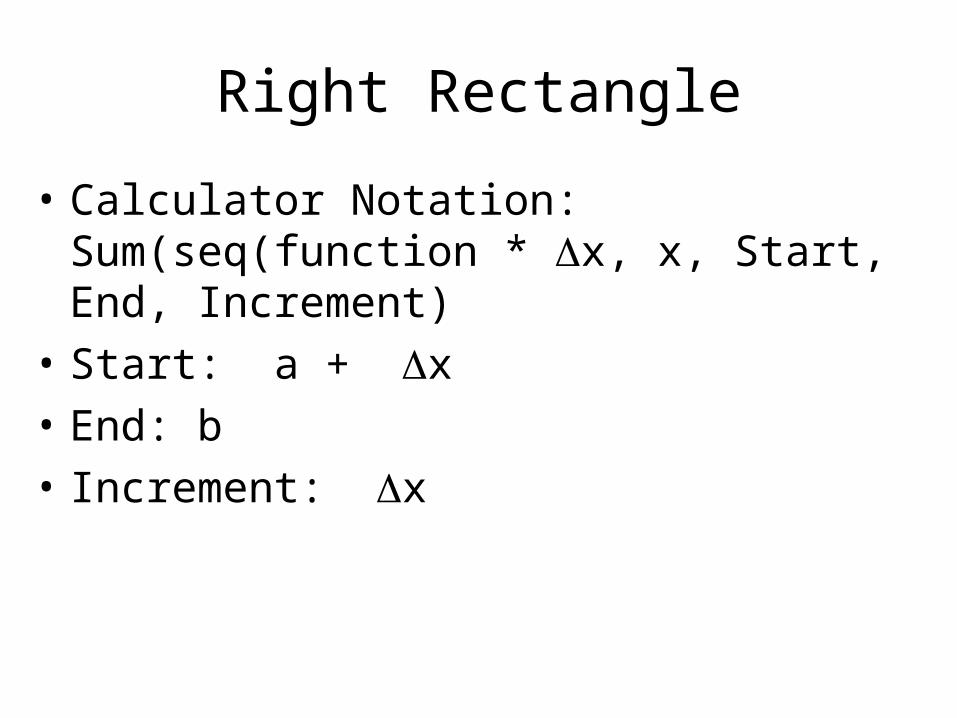
Right Rectangle
• Calculator Notation:Sum(seq(function * x, x, Start, End, Increment)
• Start: a + x• End: b • Increment: x

Related Accumulated Change to signed area
• Net Change in Quantity– Calculate each region and then combine the area.
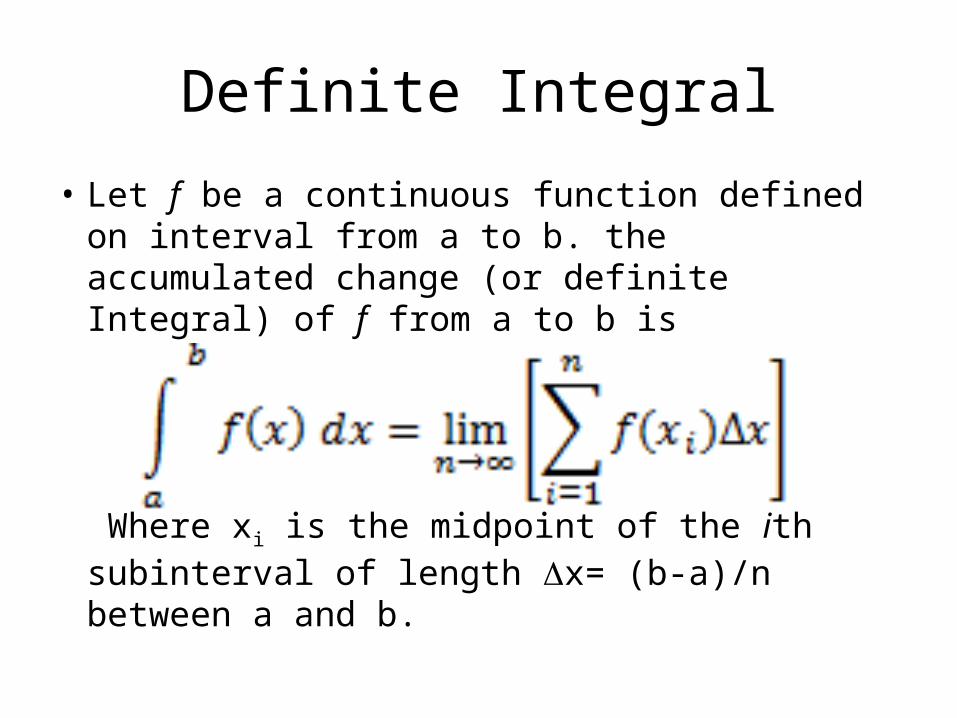
Definite Integral
• Let f be a continuous function defined on interval from a to b. the accumulated change (or definite Integral) of f from a to b is
Where xi is the midpoint of the ith subinterval of length x= (b-a)/n between a and b.
Problems 2, 8 (pages 338-342)

Business Calculus II
5.3 Accumulation Functions
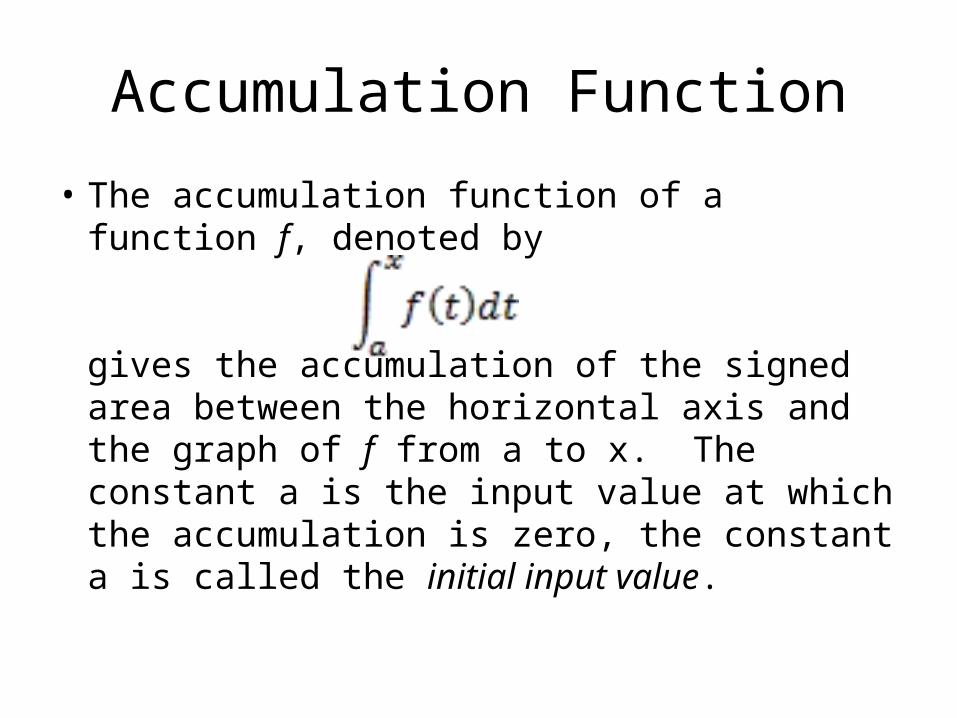
Accumulation Function
• The accumulation function of a function f, denoted by
gives the accumulation of the signed area between the horizontal axis and the graph of f from a to x. The constant a is the input value at which the accumulation is zero, the constant a is called the initial input value.

2. Velocity (page 350)
x 0 1 2 3 4 5 6 7 8 9 10
Area
Acc. Area

4. Rainfall (page 351)x 0 1 2 3 4 5 6AreaAcc. Area

Using Concavity to refine the sketch of an accumulation Function (Page 348)
Increase
Increasedecrease
decrease
Slower
Slower
Faster
Faster
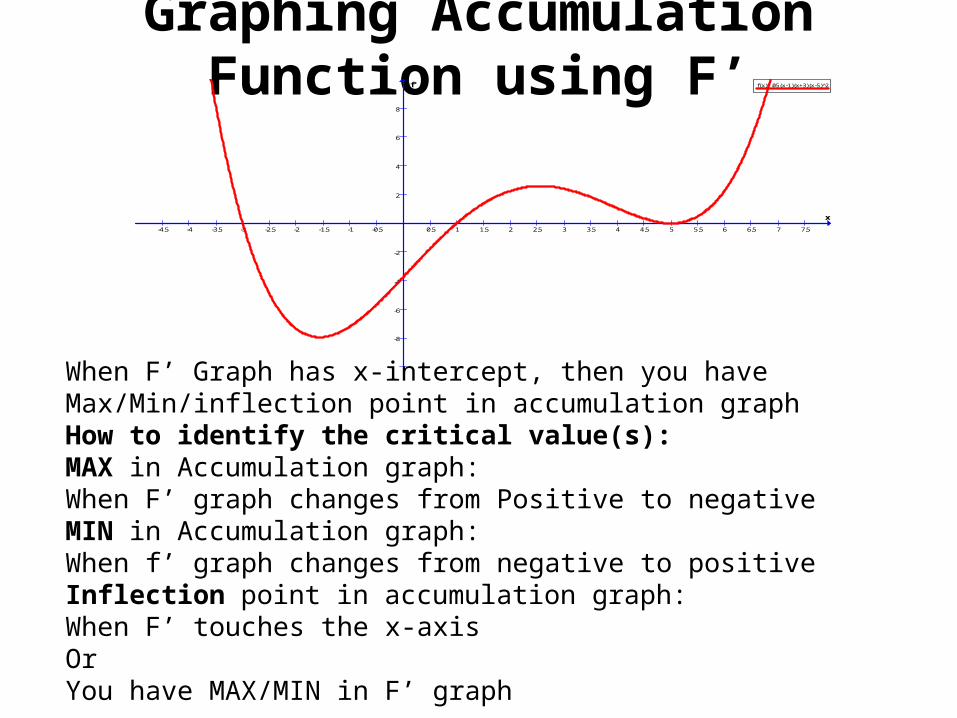
Graphing Accumulation Function using F’f(x)=.05(x-1)(x+3)(x-5)^2
-4.5 -4 -3.5 -3 -2.5 -2 -1.5 -1 -0.5 0.5 1 1.5 2 2.5 3 3.5 4 4.5 5 5.5 6 6.5 7 7.5
-8
-6
-4
-2
2
4
6
8
x
f'
When F’ Graph has x-intercept, then you have Max/Min/inflection point in accumulation graphHow to identify the critical value(s):MAX in Accumulation graph:When F’ graph changes from Positive to negative MIN in Accumulation graph:When f’ graph changes from negative to positiveInflection point in accumulation graph:When F’ touches the x-axis OrYou have MAX/MIN in F’ graph

Graphing Accumulation Function using F’f(x)=.05(x-1)(x+3)(x-5)^2
-4.5 -4 -3.5 -3 -2.5 -2 -1.5 -1 -0.5 0.5 1 1.5 2 2.5 3 3.5 4 4.5 5 5.5 6 6.5 7 7.5
-8
-6
-4
-2
2
4
6
8
x
f'
Max: Positive to negative Positive F’ x-intercept, MAX – in Accumulation graph Negative F’

Graphing Accumulation Function using F’f(x)=.05(x-1)(x+3)(x-5)^2
-4.5 -4 -3.5 -3 -2.5 -2 -1.5 -1 -0.5 0.5 1 1.5 2 2.5 3 3.5 4 4.5 5 5.5 6 6.5 7 7.5
-8
-6
-4
-2
2
4
6
8
x
f'
Min: negative to Positive Positive F’ x-intercept, MIN – in Accumulation graph Negative F’

Graphing Accumulation Function using F’f(x)=.05(x-1)(x+3)(x-5)^2
-4.5 -4 -3.5 -3 -2.5 -2 -1.5 -1 -0.5 0.5 1 1.5 2 2.5 3 3.5 4 4.5 5 5.5 6 6.5 7 7.5
-8
-6
-4
-2
2
4
6
8
x
f'
Inflection Point: F’ Touches the x-axis x-intercept, MIN – in Accumulation graph

Graphing Accumulation Function using F’f(x)=.05(x-1)(x+3)(x-5)^2
-4.5 -4 -3.5 -3 -2.5 -2 -1.5 -1 -0.5 0.5 1 1.5 2 2.5 3 3.5 4 4.5 5 5.5 6 6.5 7 7.5
-8
-6
-4
-2
2
4
6
8
x
f'
Inflection Point: inflection point in F’, also appears as inflection point in accumulation graph Inflection Points in F’
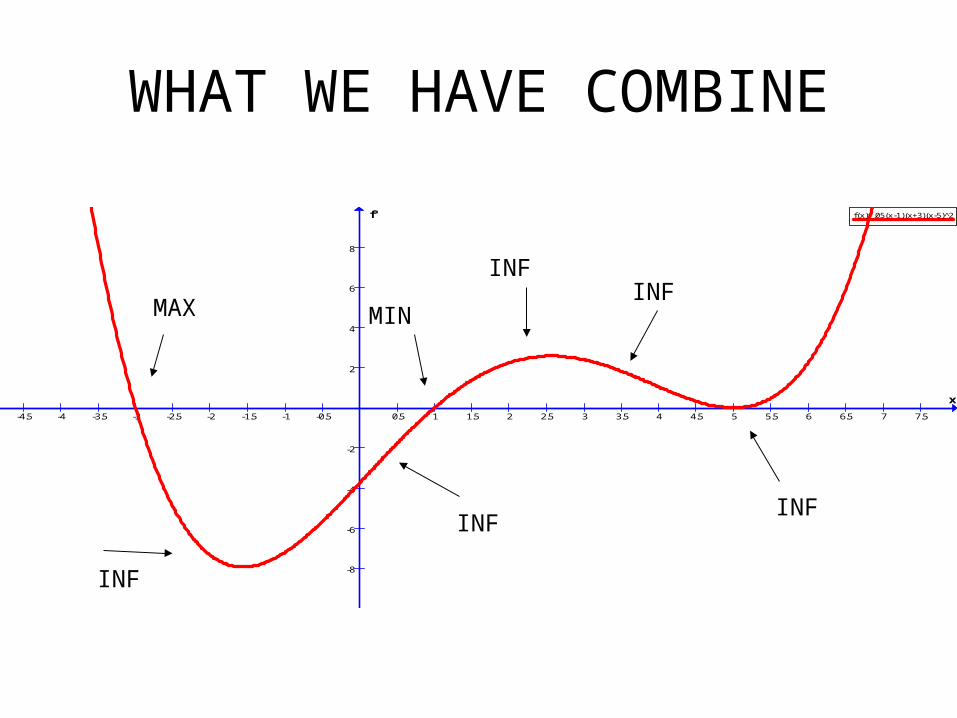
WHAT WE HAVE COMBINE
f(x)=.05(x-1)(x+3)(x-5)^2
-4.5 -4 -3.5 -3 -2.5 -2 -1.5 -1 -0.5 0.5 1 1.5 2 2.5 3 3.5 4 4.5 5 5.5 6 6.5 7 7.5
-8
-6
-4
-2
2
4
6
8
x
f'
MAXINF
INF
MIN
INF
INF
INF

f(x)=.05(x-1)(x+3)(x-5)^2
-4.5 -4 -3.5 -3 -2.5 -2 -1.5 -1 -0.5 0.5 1 1.5 2 2.5 3 3.5 4 4.5 5 5.5 6 6.5 7 7.5
-8
-6
-4
-2
2
4
6
8
x
f'
f(x)=0.05(x^5/5-2x^4+2x^3/3+40x^2-75x)-9
-4.5 -4 -3.5 -3 -2.5 -2 -1.5 -1 -0.5 0.5 1 1.5 2 2.5 3 3.5 4 4.5 5 5.5 6 6.5 7 7.5
-10
-8
-6
-4
-2
2
4
6
8
10
x
f'
Positive area
Start at zero

10-Sketch

12-sketch

14-sketch
Business Calculus II
5.4 Fundamental Theorem

Fundamental Theorem of Calculus (Part I)
For any continuous function f with input x, the
derivative of in term use of x:
FTC Part 2 appears in Section 5.6.

Anti-derivativeReversal of the derivative process
Let f be a function of x . A function F is called an anti-derivative of f if
That is, F is an anti-derivative of f if the
derivative of F is f.

General and Specific Anti-derivative
• For f, a function of x and C, an arbitrary constant,
is a general anti-derivative of f
When the constant C is known, F(x) + C is a specific anti-derivative.

Simple Power Rule for Anti-Derivative
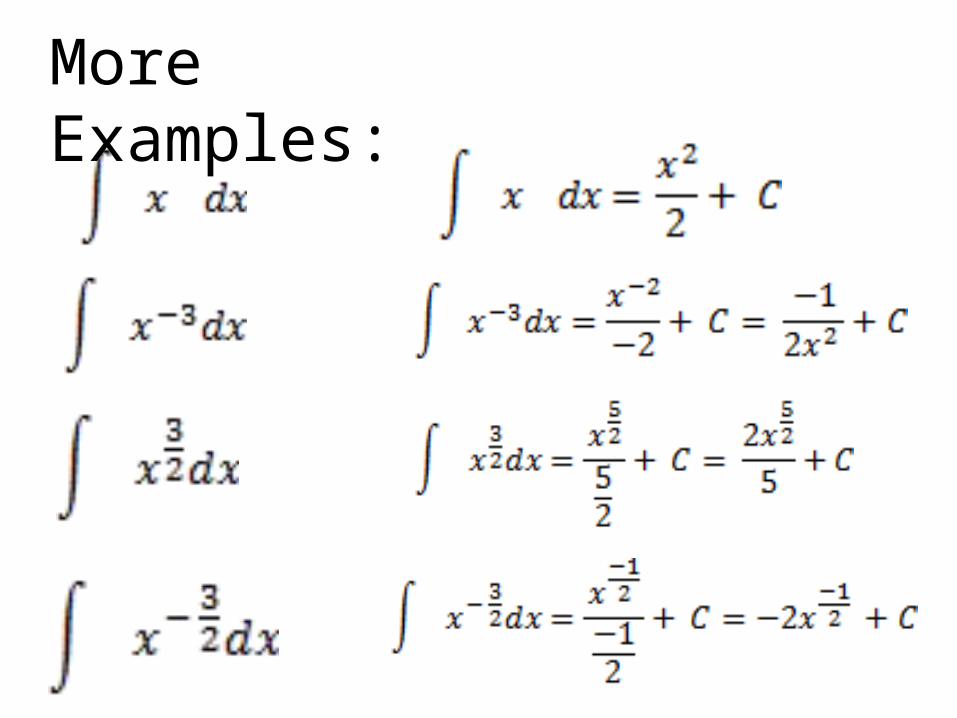
More Examples:

Constant Multiplier Rule for Anti-Derivative

Sum Rule and Difference Rule for Anti-Derivative

Example:

Connection between Derivative and Integrals
• For a continuous differentiable function fwith input variable x,

Example:

Problem: 2,12,14,16,20,22,24,37
Business Calculus II
5.5 Anti-derivative formulas for Exponential, LN
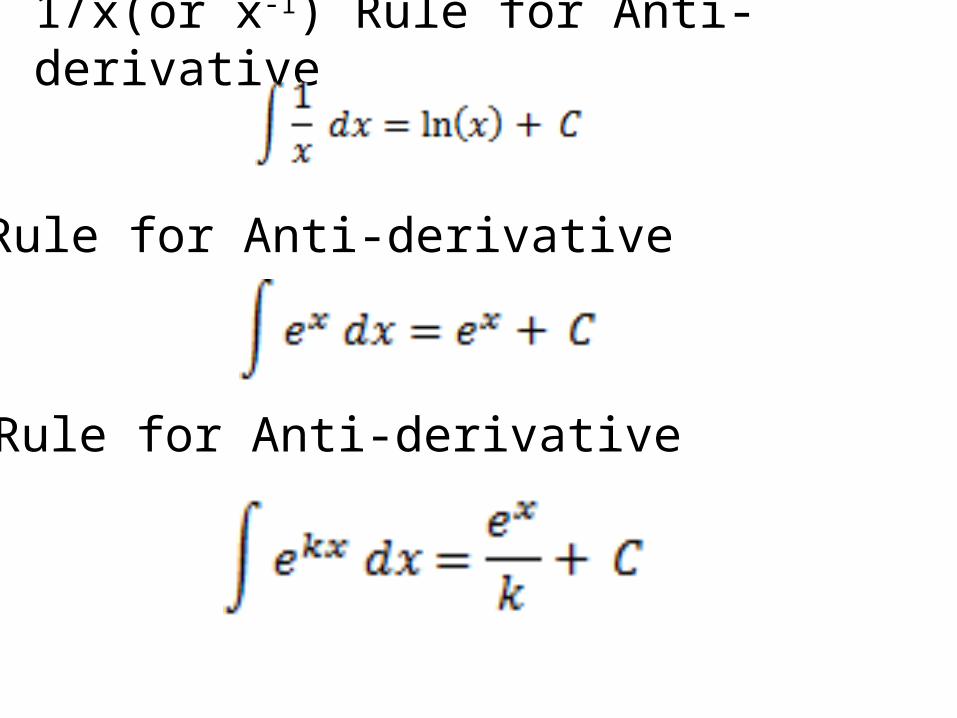
1/x(or x-1) Rule for Anti-derivative
ex Rule for Anti-derivative
ekx Rule for Anti-derivative
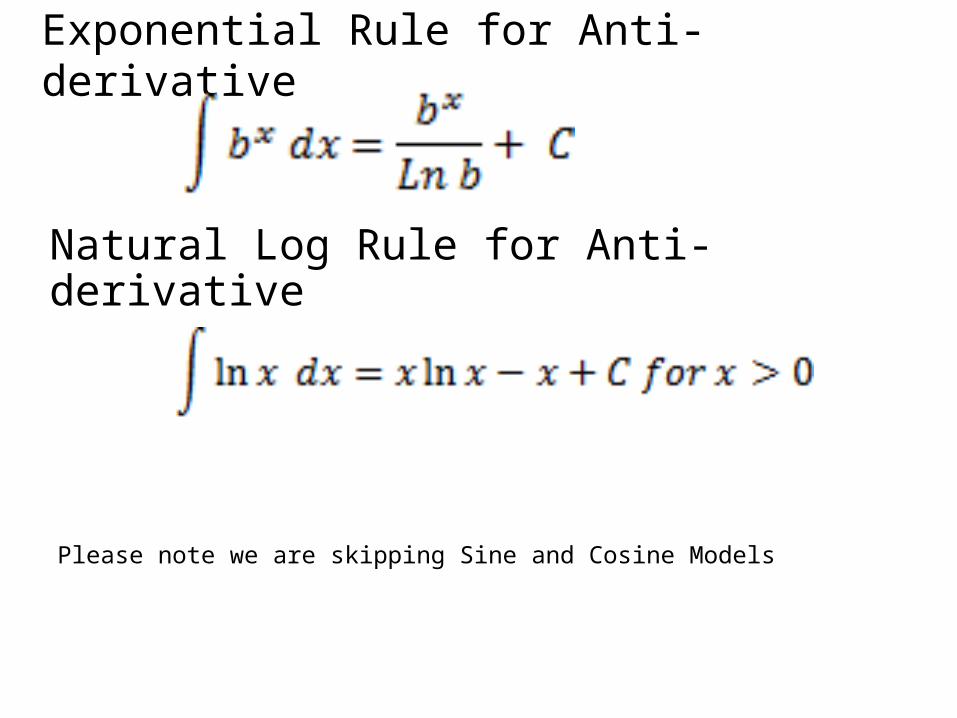
Exponential Rule for Anti-derivative
Natural Log Rule for Anti-derivative
Please note we are skipping Sine and Cosine Models

Example

Example (16 – page 373):
Problems: 2, 6, 8, 10, 20, 24 (page 373-374)
Business Calculus II
5.6 The definite Integral - Algebraically

The fundamental theorem of Calculus(Part 2) – Calculating the Definite
Integral (Page 375)• If f is continuous function from a to b and F is
any anti-derivative of f, then
• Is the definite integral of f from a to b.• Alternative notation
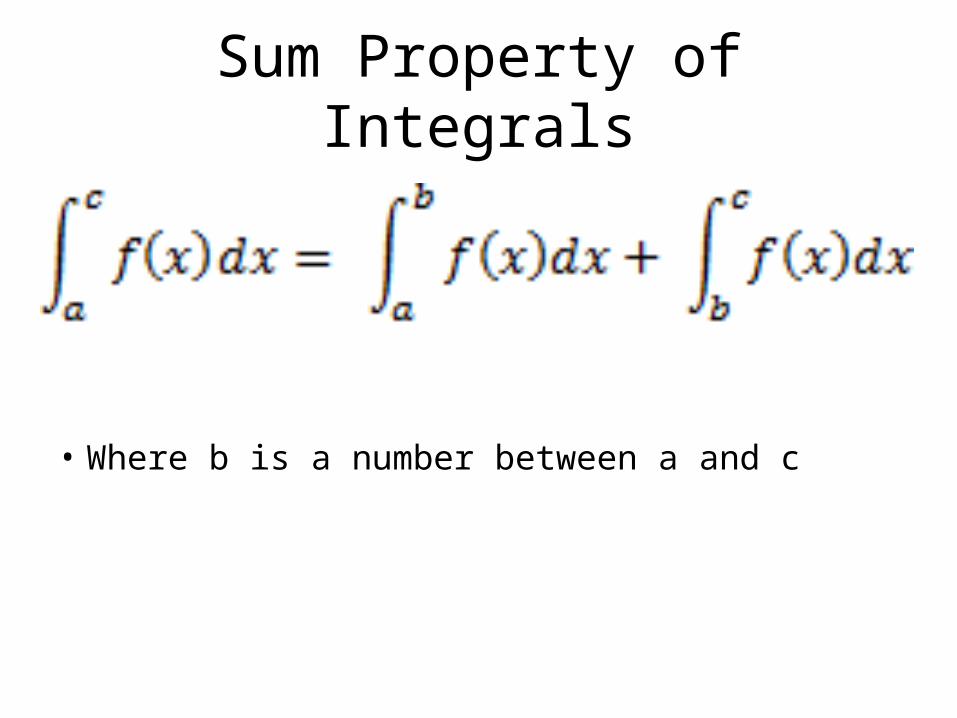
Sum Property of Integrals
• Where b is a number between a and c

Definite Integrals as Areas• For a function f that is non-negative from a to b
= the area of the region between f and the x-axis from a to b

Definite Integrals as Areas• For a function f that is negative from a to b
= the negative of the area of the region between f and the x-axis from a to b

Definite Integrals as Areas• For a general function f defined over an interval
from a to b= the sum of the signed area of the region between f and the x-axis
from a to b= ( the sum of the areas of the region above the a-axis) minus (the
sum of the area of the region below the x-axis)

Problems: 10, 14, 18, 20, 22

Business Calculus II
5.7 Difference of accumulation change

Area of the region between two curves
• If the graph of f lies above the graph of g from a to b, then the area of the region between the two curves is given by

Difference between accumulated Changes
• If f and g are two continuous rates of change functions, the difference between the accumulated change of f from a to b and the accumulated change of g between a and b is the accumulated change in the difference between f-g

Problems: 2, 6, 10, 12, 14

Business Calculus II
5.8 Average Value and Average rate of change
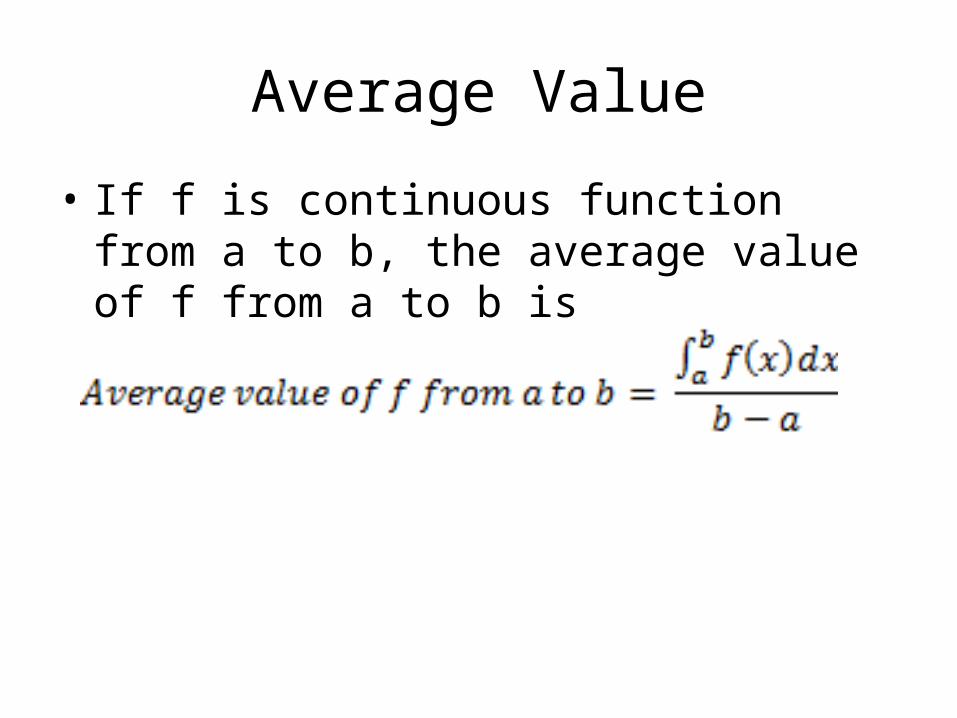
Average Value
• If f is continuous function from a to b, the average value of f from a to b is
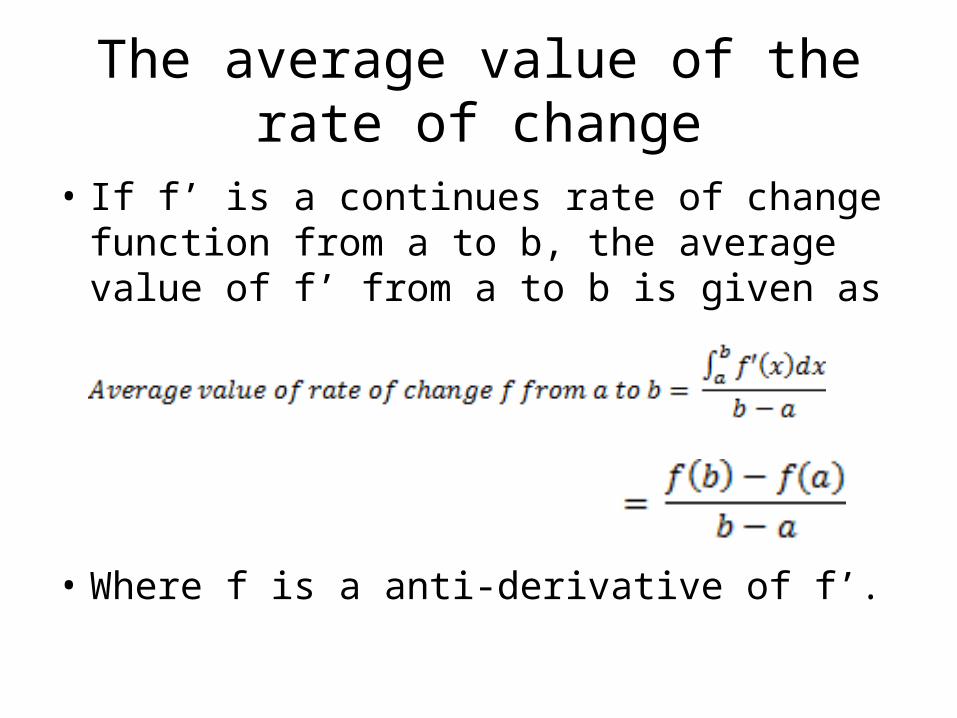
The average value of the rate of change
• If f’ is a continues rate of change function from a to b, the average value of f’ from a to b is given as
• Where f is a anti-derivative of f’.
Problems: 2, 6, 10, 18