business case playbook · web viewthe business case playbook is intended to guide the plm...
TRANSCRIPT
Micron Product Lifecycle Management (PLM)
Business Case Playbook
Ensuring a Plan to Win
PLM Business Playbook
Contents1. Overview of the Product Lifecycle Management (PLM) Process and the Business Case Playbook......4
2. Concept - Activities Prior to the PLM Plan Stage.................................................................................5
2.1 Project Type: Robust or Fast Track Project...............................................................................63. Details of Preliminary High Level Business Case Required for the Plan Stage Gate (Entering into the Plan Stage)...................................................................................................................................................9
4. Stage Gate Reviews.............................................................................................................................9
4.1 Overview of a Stage Gate Review............................................................................................94.2 Business Case Elements Presented at Stage Gate Review......................................................104.3 Stage Gate Decisions..............................................................................................................114.4 The Portfolio Management Team - Stage Gate Decision Making Body..................................114.5 Process Details for Plan Stage................................................................................................134.6 Activities and Outcomes during Plan......................................................................................144.7 Overview of Criteria to Exit Plan............................................................................................14
5. Guidelines..........................................................................................................................................14
5.1 Business Case Element Responsibilities.................................................................................145.2 Business Case Product Groupings..........................................................................................15
6. Business Case Standard Elements.....................................................................................................16
Key Concepts:....................................................................................................................................17
6.1 Business Case Information Overview.....................................................................................17Financial Summary Data....................................................................................................................18
Risk Assessment Worksheet..............................................................................................................18
7. Business Case Standard Elements.....................................................................................................21
7.1 Core Team Members..............................................................................................................217.2 BLM Recommendation...........................................................................................................217.3 Portfolio Roadmap.................................................................................................................227.4 Executive Summary................................................................................................................237.5 Boundary Agreement.............................................................................................................247.6 Financial Summary.................................................................................................................257.7 Value Proposition...................................................................................................................287.8 Comparison to Baseline..........................................................................................................297.9 Product Group........................................................................................................................317.10 Market Size and Opportunity.................................................................................................327.11 Market Position/Share of Market..........................................................................................347.12 Market Trends and Projections..............................................................................................35
© 2015 Micron Technology Inc. | Micron ConfidentialPage 2 Revision Date: August 30, 2016
PLM Business Playbook
7.13 Go to Market..........................................................................................................................367.14 Human Capital Requirements (Gaps).....................................................................................377.15 Critical Risks...........................................................................................................................387.16 Competitive Position Analysis................................................................................................397.17 Key Product Features.............................................................................................................417.18 Project Dependencies............................................................................................................427.19 Program SWOT Analysis.........................................................................................................437.20 Product Technology Roadmap...............................................................................................447.21 Product Derivative Roadmap.................................................................................................457.22 Make Buy Analysis..................................................................................................................467.23 Special Manufacturing Requirements....................................................................................467.24 Special Supply Chain Requirements.......................................................................................477.25 Plan Milestones......................................................................................................................487.26 Customer Services and Support Plan......................................................................................497.27 Core Team: Response.............................................................................................................50
8. Using the PLM Documents Site.........................................................................................................50
8.1 Adding a Document to the PLM Documents Site...................................................................518.2 Updating an Existing Business Case........................................................................................53
9. Dependencies and Data Inputs..........................................................................................................54
9.1 Dependencies.........................................................................................................................549.2 Inputs to the Marketing Business Elements...........................................................................559.3 Inputs to the Project & Finance Elements..............................................................................56
10. Sample Business Cases......................................................................................................................56
11. Revision History.................................................................................................................................57
12. Appendices........................................................................................................................................59
12.1 Input Sources.........................................................................................................................5912.2 Glossary of Terms...................................................................................................................66
© 2015 Micron Technology Inc. | Micron ConfidentialPage 3 Revision Date: August 30, 2016
PLM Business Playbook
Notes:
See Section 7: Business Case Standard Elements for information to complete a project’s Business Case Template.
Please check the PLM SharePoint site for Frequently Asked Questions (FAQs) and to post any questions for which you do not find the answer in this Playbook.
See the Revision History section for a list of changes to the PLM Playbook. Changes are also indicated by a bar to the left of the paragraph.
1. Overview of the Product Lifecycle Management (PLM) Process and the Business Case Playbook
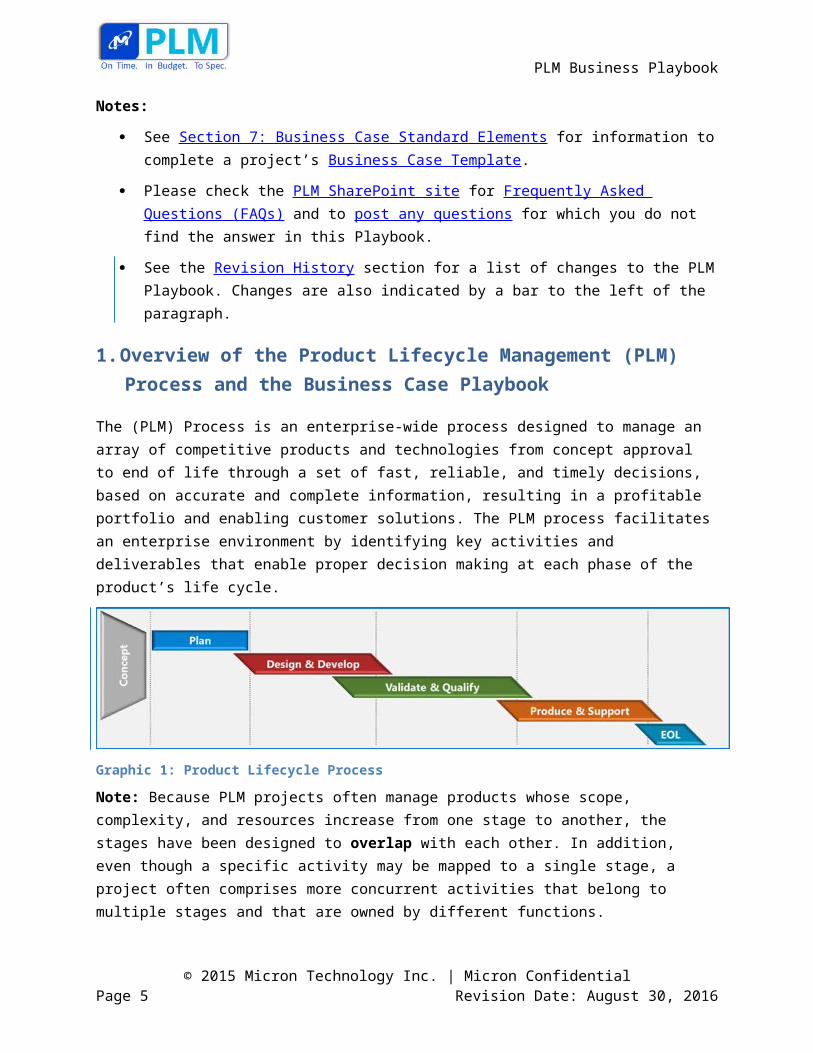
The (PLM) Process is an enterprise-wide process designed to manage an array of competitive products and technologies from concept approval to end of life through a set of fast, reliable, and timely decisions, based on accurate and complete information, resulting in a profitable portfolio and enabling customer solutions. The PLM process facilitates an enterprise environment by identifying key activities and deliverables that enable proper decision making at each phase of the product’s life cycle.
Graphic 1: Product Lifecycle Process
Note: Because PLM projects often manage products whose scope, complexity, and resources increase from one stage to another, the stages have been designed to overlap with each other. In addition, even though a specific activity may be mapped to a single stage, a project often comprises more concurrent activities that belong to multiple stages and that are owned by different functions.
Consistent application of the PLM process across all of Micron’s Business Units (BUs) is essential and will enable:
A clear indication of Micron’s priorities
Defined ownership and accountability for Micron’s products
Specific product objectives tied into key technology ramps ensuring new technology nodes get launched into the right homes
Improved line of sight into the use of Micron’s limited resources and tradeoffs
The business case is a key deliverable of the PLM process. The business case identifies the business need for a product (or multiple products), provides data that shows the need the product(s) satisfies, and how
© 2015 Micron Technology Inc. | Micron ConfidentialPage 4 Revision Date: August 30, 2016
PLM Business Playbook
the product aligns to Micron’s strategic business goals. Specifically, the business case captures available market and customer requirements for the proposed product, including the detailed product and technical requirements, financial expectations, and supporting introduction plans.
The objective of the business case is to do the following:
Project Selection: Institute rigor and common criteria in defining and validating business cases
Execution: Provide integration and communication between cross-functional activities
End of Life: Standardize the end of life (EOL) process and plan to eliminate excessive aged inventory
The Business Case Playbook is intended to guide the PLM Leadership and project core team through developing their business case.
Important! The Business Case Playbook is a work-in-progress. It will be updated as the process evolves. Use this link to access the latest version, or go to the PLM SharePoint site to open the latest version of the Business Case Playbook.
Go to the Table of Contents
2. Concept - Activities Prior to the PLM Plan Stage
During the Concept phase, the BU is responsible for the work and guides this work with their requirements. Marketing, Sales, or Product Development typically identifies a new product and initiates a new project. For most products, Marketing completes an opportunity analysis and develops a Marketing Requirements document. In addition, Marketing requests a financial analysis with inputs from R&D, Manufacturing, Sales, and Engineering to identify potential development and product costs. If Marketing – either a single business unit, or multiple business units – is satisfied with the financial return and value proposition, they request approval to enter the Plan Stage.
If not already identified, a Business Line Manager (BLM) is assigned at this point, and he or she will request a Plan Stage Gate meeting. During the first Stage Gate meeting, a preliminary high-level business case review is required for presentation and a decision whether a project is approved to enter the Plan Stage.
© 2015 Micron Technology Inc. | Micron ConfidentialPage 5 Revision Date: August 30, 2016
PLM Business Playbook
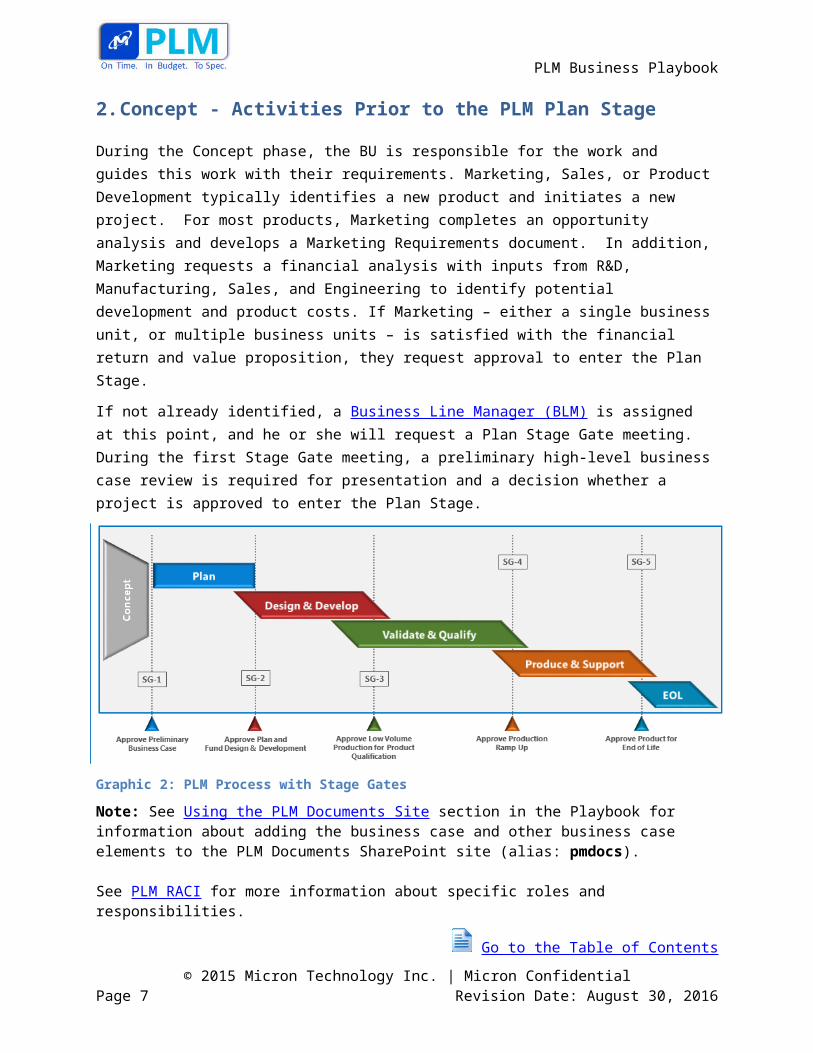
Graphic 2: PLM Process with Stage Gates
Note: See Using the PLM Documents Site section in the Playbook for information about adding the business case and other business case elements to the PLM Documents SharePoint site (alias: pmdocs).
See PLM RACI for more information about specific roles and responsibilities.
Go to the Table of Contents
2.1 Project Type: Robust or Fast Track Project
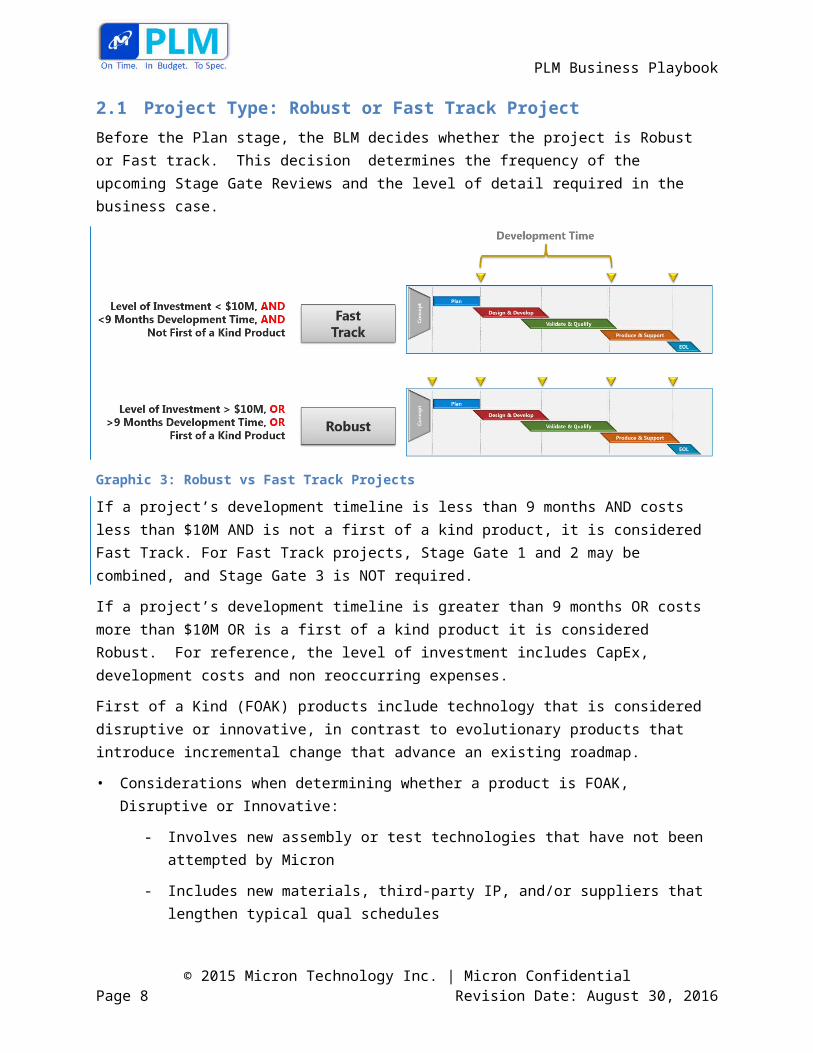
Before the Plan stage, the BLM decides whether the project is Robust or Fast track. This decision determines the frequency of the upcoming Stage Gate Reviews and the level of detail required in the business case.
Graphic 3: Robust vs Fast Track Projects
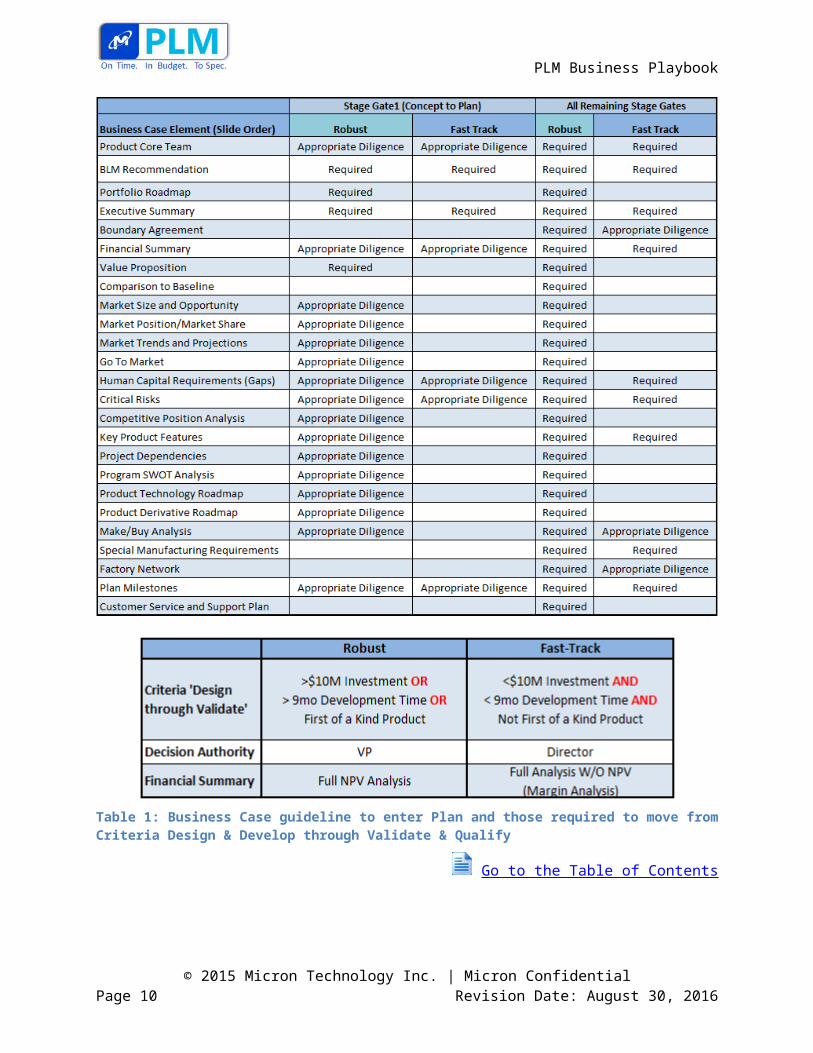
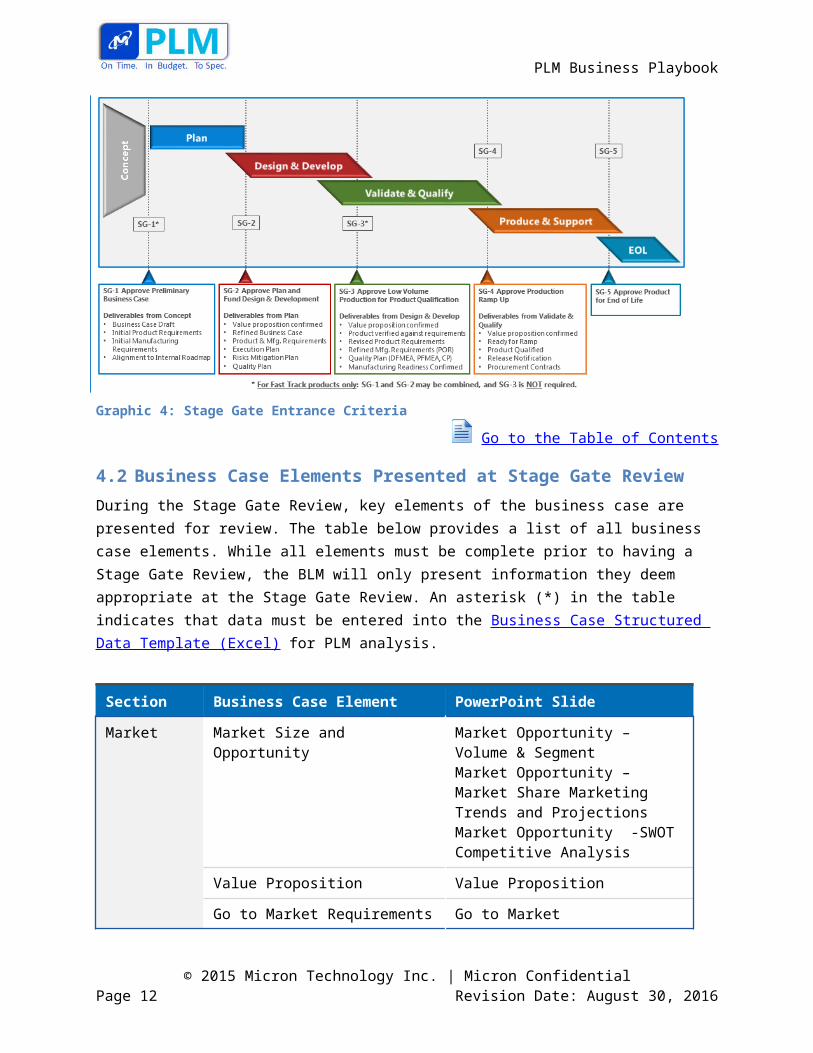
If a project’s development timeline is less than 9 months AND costs less than $10M AND is not a first of a kind product, it is considered Fast Track. For Fast Track projects, Stage Gate 1 and 2 may be combined, and Stage Gate 3 is NOT required.
© 2015 Micron Technology Inc. | Micron ConfidentialPage 6 Revision Date: August 30, 2016
PLM Business Playbook
If a project’s development timeline is greater than 9 months OR costs more than $10M OR is a first of a kind product it is considered Robust. For reference, the level of investment includes CapEx, development costs and non reoccurring expenses.
First of a Kind (FOAK) products include technology that is considered disruptive or innovative, in contrast to evolutionary products that introduce incremental change that advance an existing roadmap.
• Considerations when determining whether a product is FOAK, Disruptive or Innovative:
- Involves new assembly or test technologies that have not been attempted by Micron
- Includes new materials, third-party IP, and/or suppliers that lengthen typical qual schedules
- Introduces new market segments and/or drives the creation of a new product roadmap
- Requires significantly longer R&D investment and/or necessitates new industry standards
- Product architecture creates gaps that require substantive changes to systems that support production operations (CTM, LPI, etc.) and/or the master data model
- Requires unusually early customer engagement and/or co-development
- Requires extended and/or complex coordination between engineering, business units, and customers on qualification part requirements and supply
- Requires new R&D, Operations, or BU organizational structures to properly coordinate and support the product
If a BLM decides a product is appropriate for a Fast Track project, he or she can create a Fast Track project associated with a parent project (Robust). In this case, the data from the Robust parent project can be used as appropriate for the business case of the Fast Track project. As the parent project’s data is updated (if required), the Fast Track project is also updated or refreshed from the Parent project. However, the Fast Track project may make updates to its business case with its own unique data and be presented by new data that does not affect the Robust parent project. It should be noted that a Fast Track project can be created without an association to a Parent project.
The expectations for the Robust and Fast Track business case as shown below. Note that the requirements are different for “Concept Approval (CA) to Plan” as compared to the requirements from “Plan to EOL”. Additionally, there are different requirements for a Fast Track business case.
© 2015 Micron Technology Inc. | Micron ConfidentialPage 7 Revision Date: August 30, 2016
PLM Business Playbook
Table 1: Business Case guideline to enter Plan and those required to move from Criteria Design & Develop through Validate & Qualify
Go to the Table of Contents
© 2015 Micron Technology Inc. | Micron ConfidentialPage 8 Revision Date: August 30, 2016
PLM Business Playbook
3. Details of Preliminary High Level Business Case Required for the Plan Stage Gate (Entering into the Plan Stage)
A business case undergoes a Stage Gate Review to determine whether a project is ready to move into the Plan stage of the PLM Process. To go through the Stage Gate Review, the business case elements must be defined to the level of detail shown in the table above.
Go to the Table of Contents
4. Stage Gate Reviews
Stage Gate Reviews are held throughout the PLM process to validate and reconfirm the product’s viability in the marketplace; to ensure the associated business plan is realizable; and to obtain financing/resources for the next stage. State Gate Reviews are conducted when:
The Business Line Manager (BLM), supported by the product core team, determines that he or she is ready to move to the next stage and/or is seeking additional investment in the project
Events occur that impact the business case in a significant manner requiring an interim Stage Gate review and decision
Go to the Table of Contents
4.1 Overview of a Stage Gate Review
Stage Gate Reviews focus on specific entrance criteria associated with each stage of the PLM process. This is displayed in the graphic below.
Graphic 4: Stage Gate Entrance Criteria
Go to the Table of Contents
© 2015 Micron Technology Inc. | Micron ConfidentialPage 9 Revision Date: August 30, 2016
PLM Business Playbook
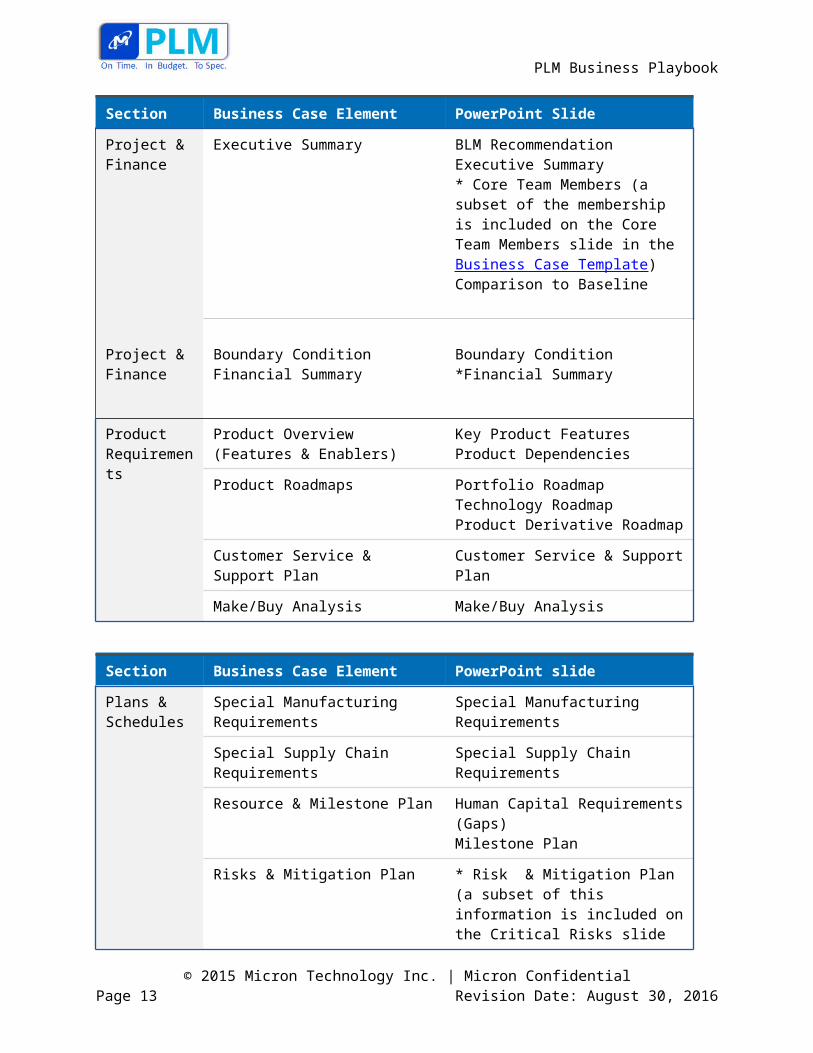
4.2 Business Case Elements Presented at Stage Gate Review
During the Stage Gate Review, key elements of the business case are presented for review. The table below provides a list of all business case elements. While all elements must be complete prior to having a Stage Gate Review, the BLM will only present information they deem appropriate at the Stage Gate Review. An asterisk (*) in the table indicates that data must be entered into the Business Case Structured Data Template (Excel) for PLM analysis.
Section Business Case Element PowerPoint Slide
Market Market Size and Opportunity Market Opportunity – Volume & Segment Market Opportunity – Market Share Marketing Trends and ProjectionsMarket Opportunity -SWOT Competitive Analysis
Value Proposition Value Proposition
Go to Market Requirements Go to Market
Project & Finance
Executive Summary BLM RecommendationExecutive Summary* Core Team Members (a subset of the membership is included on the Core Team Members slide in the Business Case Template) Comparison to Baseline
Project & Finance
Boundary ConditionFinancial Summary
Boundary Condition*Financial Summary
Product Requirements
Product Overview (Features & Enablers)
Key Product FeaturesProduct Dependencies
Product Roadmaps Portfolio RoadmapTechnology Roadmap Product Derivative Roadmap
Customer Service & Support Plan Customer Service & Support Plan
Make/Buy Analysis Make/Buy Analysis
© 2015 Micron Technology Inc. | Micron ConfidentialPage 10 Revision Date: August 30, 2016
PLM Business Playbook
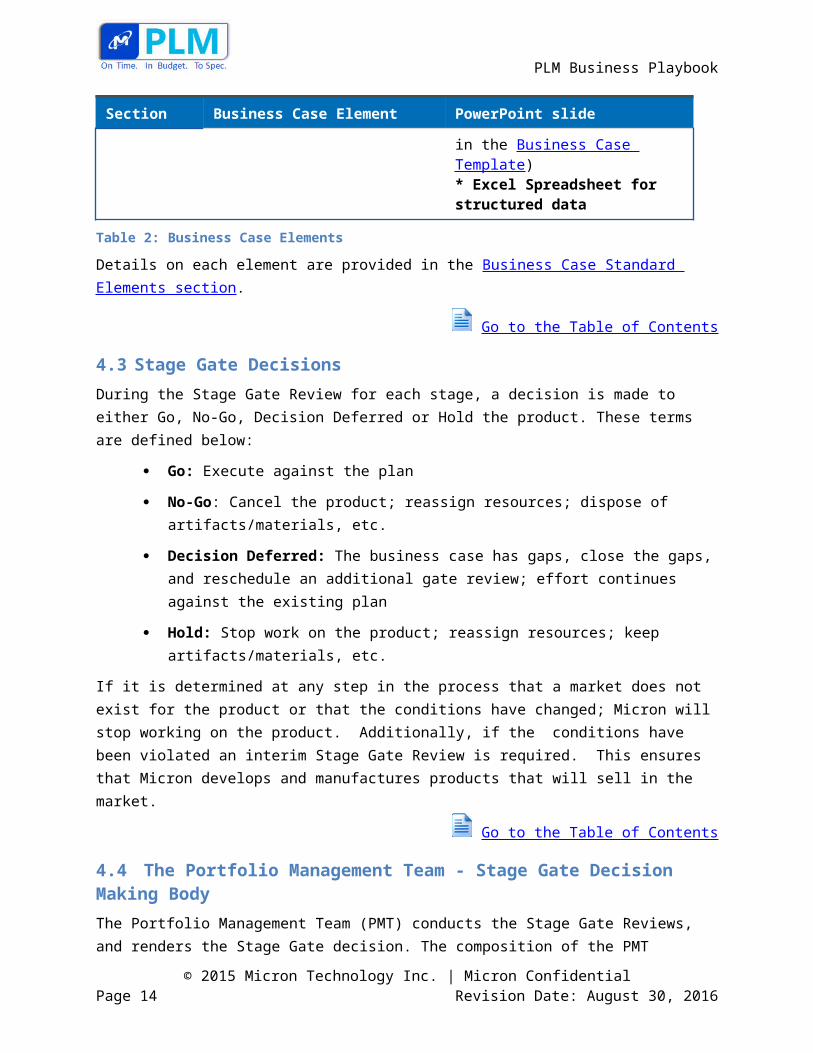
Section Business Case Element PowerPoint slide
Plans & Schedules
Special Manufacturing Requirements Special Manufacturing Requirements
Special Supply Chain Requirements Special Supply Chain Requirements
Resource & Milestone Plan Human Capital Requirements (Gaps)Milestone Plan
Risks & Mitigation Plan * Risk & Mitigation Plan (a subset of this information is included on the Critical Risks slide in the Business Case Template) * Excel Spreadsheet for structured data
Table 2: Business Case Elements
Details on each element are provided in the Business Case Standard Elements section.
Go to the Table of Contents
4.3 Stage Gate Decisions
During the Stage Gate Review for each stage, a decision is made to either Go, No-Go, Decision Deferred or Hold the product. These terms are defined below:
Go: Execute against the plan
No-Go: Cancel the product; reassign resources; dispose of artifacts/materials, etc.
Decision Deferred: The business case has gaps, close the gaps, and reschedule an additional gate review; effort continues against the existing plan
Hold: Stop work on the product; reassign resources; keep artifacts/materials, etc.
If it is determined at any step in the process that a market does not exist for the product or that the conditions have changed; Micron will stop working on the product. Additionally, if the conditions have been violated an interim Stage Gate Review is required. This ensures that Micron develops and manufactures products that will sell in the market.
Go to the Table of Contents
4.4 The Portfolio Management Team - Stage Gate Decision Making Body
The Portfolio Management Team (PMT) conducts the Stage Gate Reviews, and renders the Stage Gate decision. The composition of the PMT depends on the type of project presented for review. The Business Line Manager (BLM) determines the project type during the Plan Stage, which is described in A High Level Overview of the Plan Stage section below. Because the Stage Gate Review to enter the Plan stage does not require a project type to already be selected; this Stage Gate Review’s decision-making body is determined by leadership at the time it is scheduled.
© 2015 Micron Technology Inc. | Micron ConfidentialPage 11 Revision Date: August 30, 2016
PLM Business Playbook
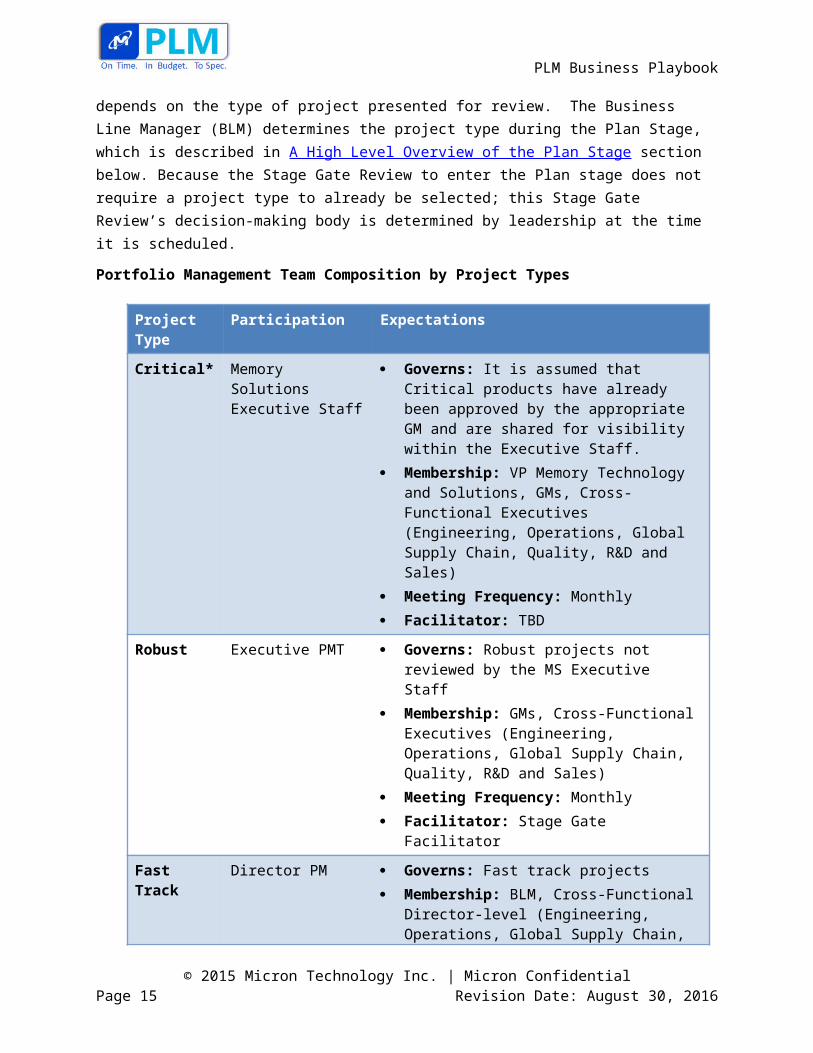
Portfolio Management Team Composition by Project Types
Project Type Participation Expectations
Critical* Memory Solutions Executive Staff
Governs: It is assumed that Critical products have already been approved by the appropriate GM and are shared for visibility within the Executive Staff.
Membership: VP Memory Technology and Solutions, GMs, Cross-Functional Executives (Engineering, Operations, Global Supply Chain, Quality, R&D and Sales)
Meeting Frequency: Monthly Facilitator: TBD
Robust Executive PMT Governs: Robust projects not reviewed by the MS Executive Staff
Membership: GMs, Cross-Functional Executives (Engineering, Operations, Global Supply Chain, Quality, R&D and Sales)
Meeting Frequency: Monthly Facilitator: Stage Gate Facilitator
Fast Track Director PM Governs: Fast track projects Membership: BLM, Cross-Functional Director-
level (Engineering, Operations, Global Supply Chain, Quality, R&D and Sales)
Meeting Frequency: TBD Facilitator: Stage Gate Facilitator
Table 3: PMT Composition per Project Type
*Which products are deemed Critical is at the discretion of the Micron Executive Team.
Representatives from Manufacturing Operations, R&D, Sales, and Supply Chain are also invited to all Stage Gate Review.
The Business Line Manager (BLM), in conjunction with his or her team, determines when a Stage Gate Review is required. The Stage Gate Facilitator schedules the Stage Gate Review. The BLM, Engineering Technical Manager (ETM), Business Program Manager, Engineering Project Manager, Finance Core Team members, as well as other appropriate members of the Core Team, create the business case for the PMT to review.
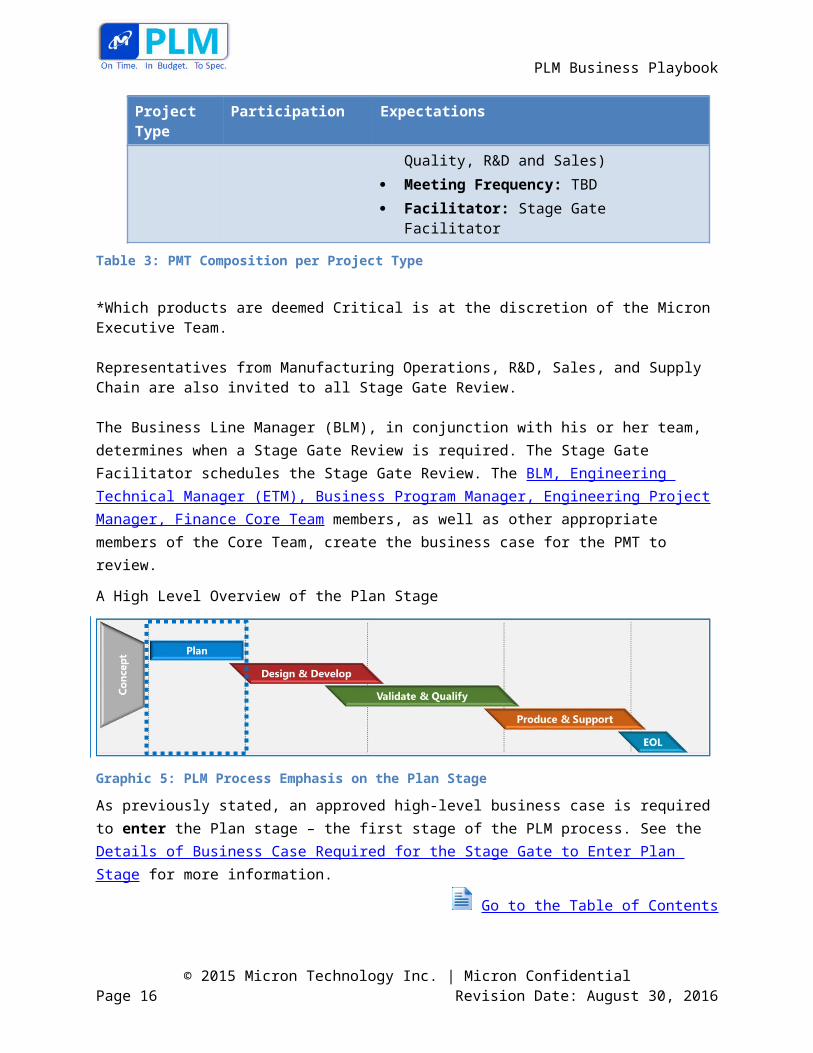
A High Level Overview of the Plan Stage
© 2015 Micron Technology Inc. | Micron ConfidentialPage 12 Revision Date: August 30, 2016
PLM Business Playbook
Graphic 5: PLM Process Emphasis on the Plan Stage
As previously stated, an approved high-level business case is required to enter the Plan stage – the first stage of the PLM process. See the Details of Business Case Required for the Stage Gate to Enter Plan Stage for more information.
Go to the Table of Contents
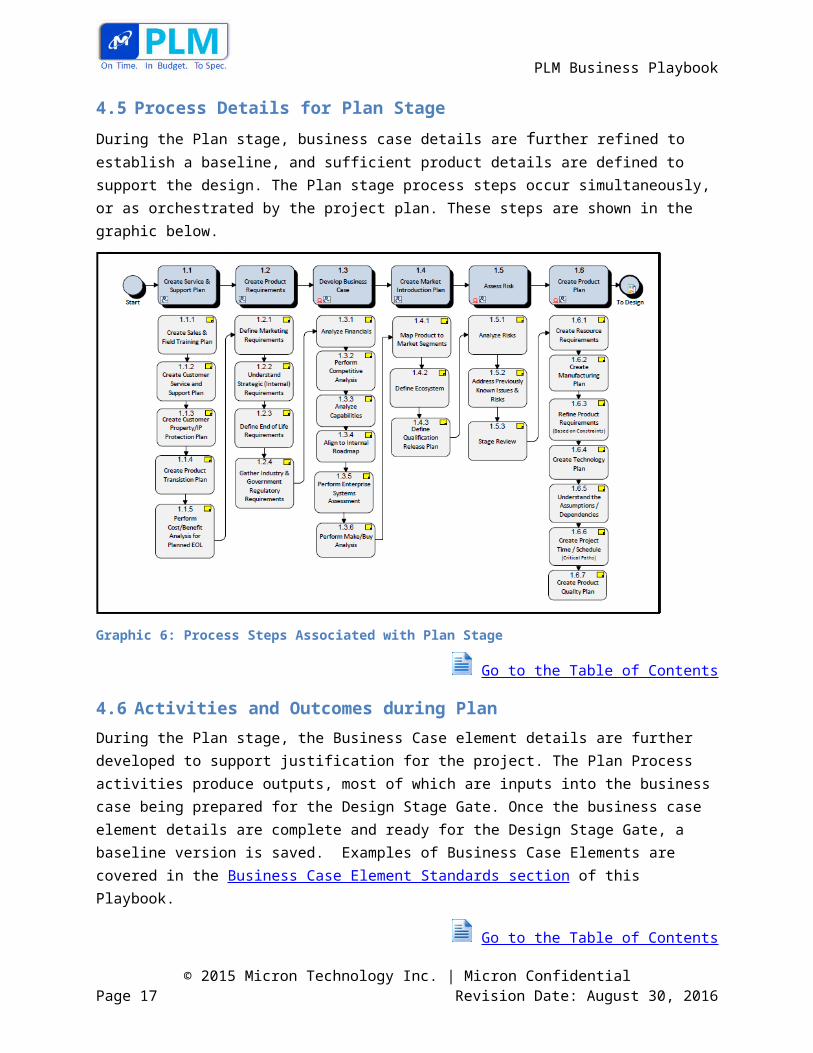
4.5 Process Details for Plan Stage
During the Plan stage, business case details are further refined to establish a baseline, and sufficient product details are defined to support the design. The Plan stage process steps occur simultaneously, or as orchestrated by the project plan. These steps are shown in the graphic below.
Graphic 6: Process Steps Associated with Plan Stage
Go to the Table of Contents
© 2015 Micron Technology Inc. | Micron ConfidentialPage 13 Revision Date: August 30, 2016
PLM Business Playbook
4.6 Activities and Outcomes during Plan
During the Plan stage, the Business Case element details are further developed to support justification for the project. The Plan Process activities produce outputs, most of which are inputs into the business case being prepared for the Design Stage Gate. Once the business case element details are complete and ready for the Design Stage Gate, a baseline version is saved. Examples of Business Case Elements are covered in the Business Case Element Standards section of this Playbook.
Go to the Table of Contents
4.7 Overview of Criteria to Exit Plan
The BLM or Stage Gate Facilitator schedules the Design Stage Gate Review once the business case element details are complete or for a date when they will be complete. The BLM works with the core team to confirm that the latest information is included in the business case and determines any key recommendations or decisions requested. Although all elements are expected to be detailed at the end of the Plan stage, the team must provide an appropriate action plan to complete the element or reasoning for the insufficiency.
Go to the Table of Contents
5. Guidelines
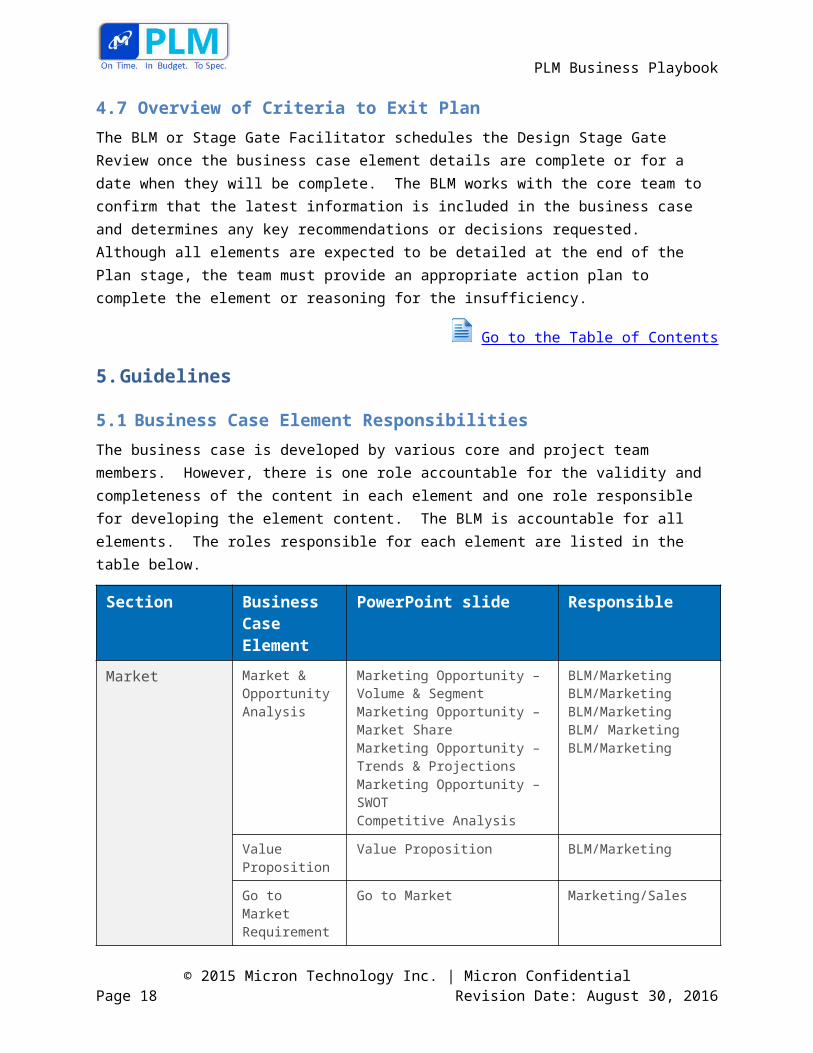
5.1 Business Case Element Responsibilities
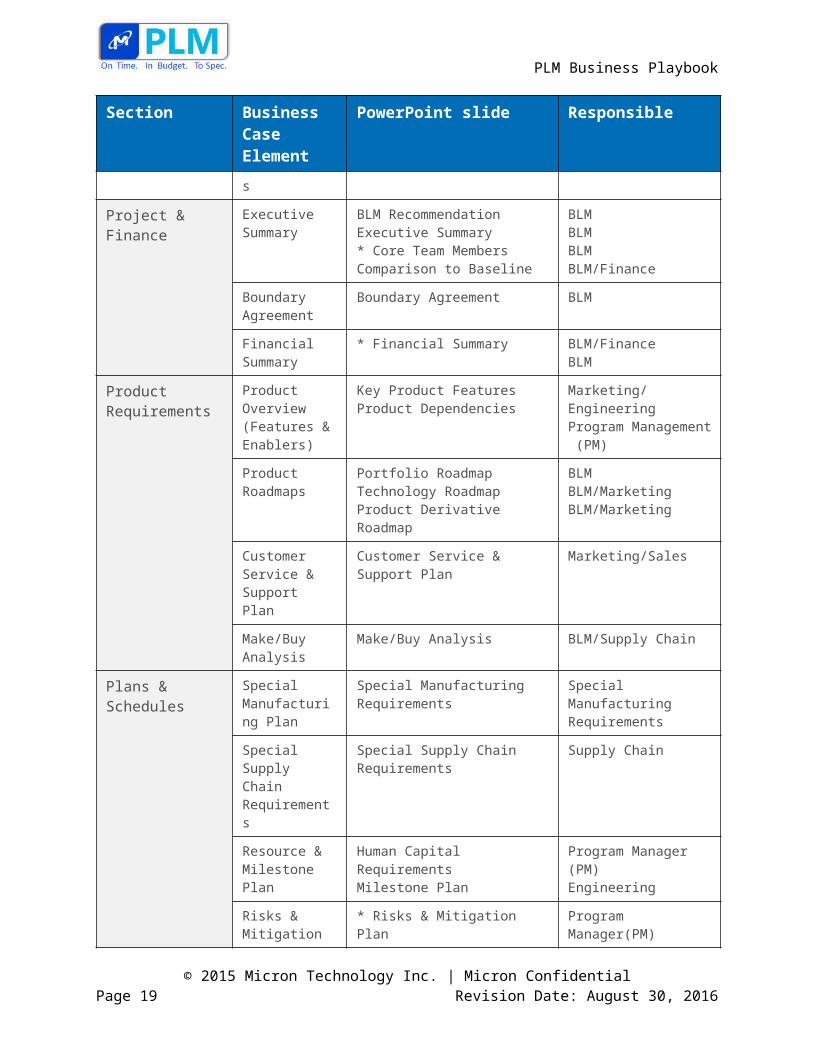
The business case is developed by various core and project team members. However, there is one role accountable for the validity and completeness of the content in each element and one role responsible for developing the element content. The BLM is accountable for all elements. The roles responsible for each element are listed in the table below.
Section Business Case Element
PowerPoint slide Responsible
Market Market & Opportunity Analysis
Marketing Opportunity – Volume & SegmentMarketing Opportunity – Market ShareMarketing Opportunity – Trends & ProjectionsMarketing Opportunity – SWOTCompetitive Analysis
BLM/MarketingBLM/MarketingBLM/MarketingBLM/ MarketingBLM/Marketing
Value Proposition Value Proposition BLM/Marketing
Go to Market Requirements
Go to Market Marketing/Sales
Project & Finance Executive Summary
BLM RecommendationExecutive Summary
BLMBLM
© 2015 Micron Technology Inc. | Micron ConfidentialPage 14 Revision Date: August 30, 2016
PLM Business Playbook
Section Business Case Element
PowerPoint slide Responsible
* Core Team MembersComparison to Baseline
BLMBLM/Finance
Boundary Agreement
Boundary Agreement BLM
Financial Summary
* Financial Summary BLM/FinanceBLM
Product Requirements
Product Overview (Features & Enablers)
Key Product FeaturesProduct Dependencies
Marketing/EngineeringProgram Management (PM)
Product Roadmaps
Portfolio RoadmapTechnology RoadmapProduct Derivative Roadmap
BLMBLM/MarketingBLM/Marketing
Customer Service & Support Plan
Customer Service & Support Plan Marketing/Sales
Make/Buy Analysis
Make/Buy Analysis BLM/Supply Chain
Plans & Schedules Special Manufacturing Plan
Special Manufacturing Requirements
Special Manufacturing Requirements
Special Supply Chain Requirements
Special Supply Chain Requirements Supply Chain
Resource & Milestone Plan
Human Capital RequirementsMilestone Plan
Program Manager (PM)Engineering
Risks & Mitigation Plan
* Risks & Mitigation Plan Program Manager(PM)
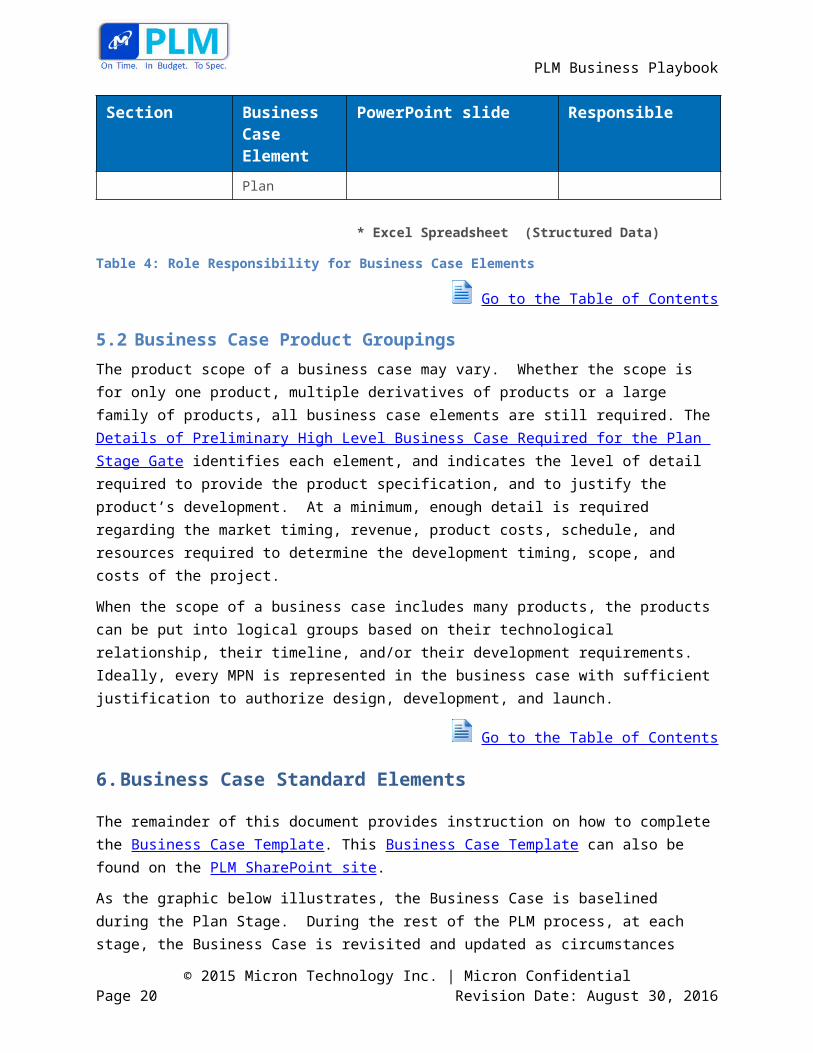
* Excel Spreadsheet (Structured Data)
Table 4: Role Responsibility for Business Case Elements
Go to the Table of Contents
5.2 Business Case Product Groupings
The product scope of a business case may vary. Whether the scope is for only one product, multiple derivatives of products or a large family of products, all business case elements are still required. The Details of Preliminary High Level Business Case Required for the Plan Stage Gate identifies each element, and indicates the level of detail required to provide the product specification, and to justify the product’s development. At a minimum, enough detail is required regarding the market timing, revenue,
© 2015 Micron Technology Inc. | Micron ConfidentialPage 15 Revision Date: August 30, 2016
PLM Business Playbook
product costs, schedule, and resources required to determine the development timing, scope, and costs of the project.
When the scope of a business case includes many products, the products can be put into logical groups based on their technological relationship, their timeline, and/or their development requirements. Ideally, every MPN is represented in the business case with sufficient justification to authorize design, development, and launch.
Go to the Table of Contents
6. Business Case Standard Elements
The remainder of this document provides instruction on how to complete the Business Case Template. This Business Case Template can also be found on the PLM SharePoint site.
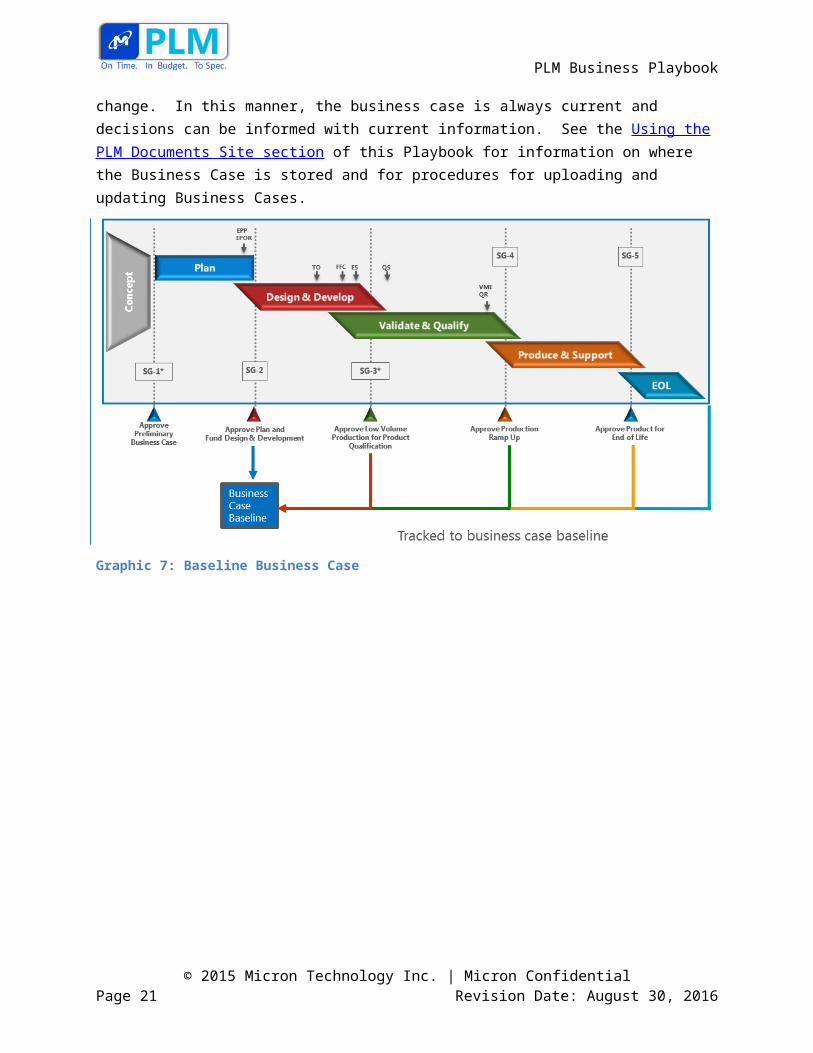
As the graphic below illustrates, the Business Case is baselined during the Plan Stage. During the rest of the PLM process, at each stage, the Business Case is revisited and updated as circumstances change. In this manner, the business case is always current and decisions can be informed with current information. See the Using the PLM Documents Site section of this Playbook for information on where the Business Case is stored and for procedures for uploading and updating Business Cases.
Graphic 7: Baseline Business Case
© 2015 Micron Technology Inc. | Micron ConfidentialPage 16 Revision Date: August 30, 2016
PLM Business Playbook
Key Concepts:
The business case is baselined at Plan Stage Gate and reconfirmed throughout the PLM process
The business case contains a set of common elements to be used for every product
The business case is driven by cross- functional inputs
The business case is the framework to keep team aligned around and confirm the plan to win
Go to the Table of Contents
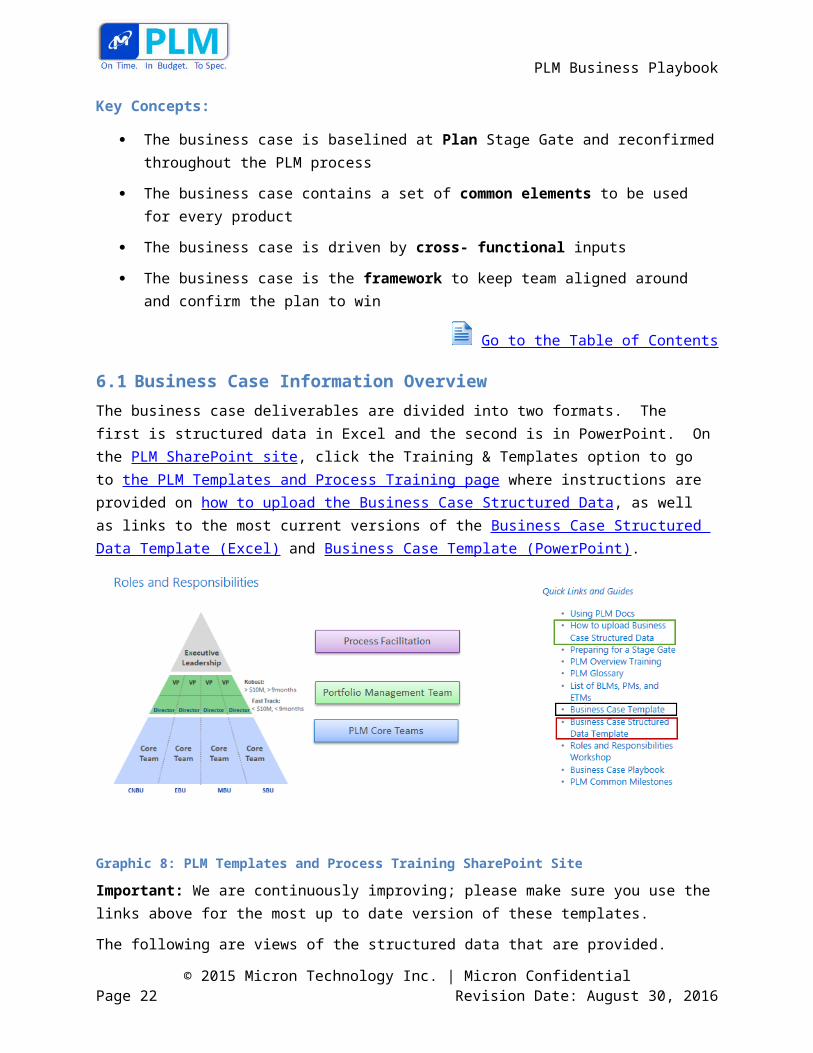
6.1 Business Case Information Overview
The business case deliverables are divided into two formats. The first is structured data in Excel and the second is in PowerPoint. On the PLM SharePoint site, click the Training & Templates option to go to the PLM Templates and Process Training page where instructions are provided on how to upload the Business Case Structured Data, as well as links to the most current versions of the Business Case Structured Data Template (Excel) and Business Case Template (PowerPoint).
Graphic 8: PLM Templates and Process Training SharePoint Site
Important: We are continuously improving; please make sure you use the links above for the most up to date version of these templates.
The following are views of the structured data that are provided.
© 2015 Micron Technology Inc. | Micron ConfidentialPage 17 Revision Date: August 30, 2016
PLM Business Playbook
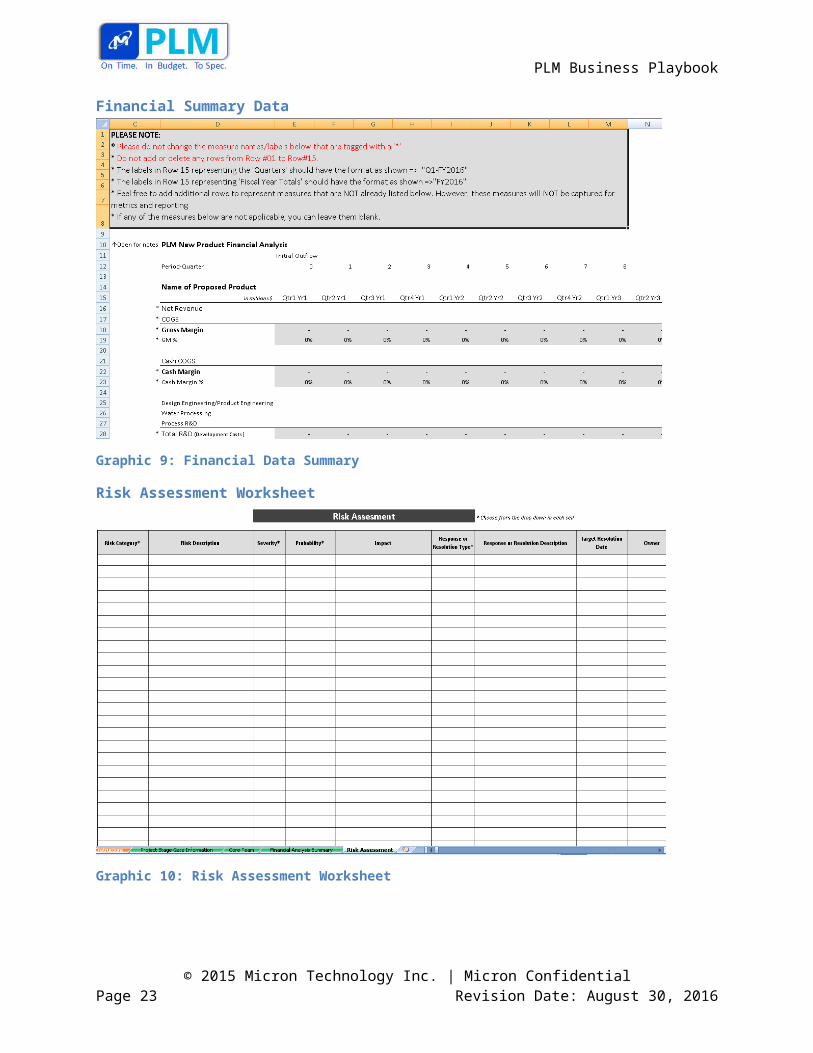
Financial Summary Data
Graphic 9: Financial Data Summary
Risk Assessment Worksheet
Graphic 10: Risk Assessment Worksheet
© 2015 Micron Technology Inc. | Micron ConfidentialPage 18 Revision Date: August 30, 2016
PLM Business Playbook
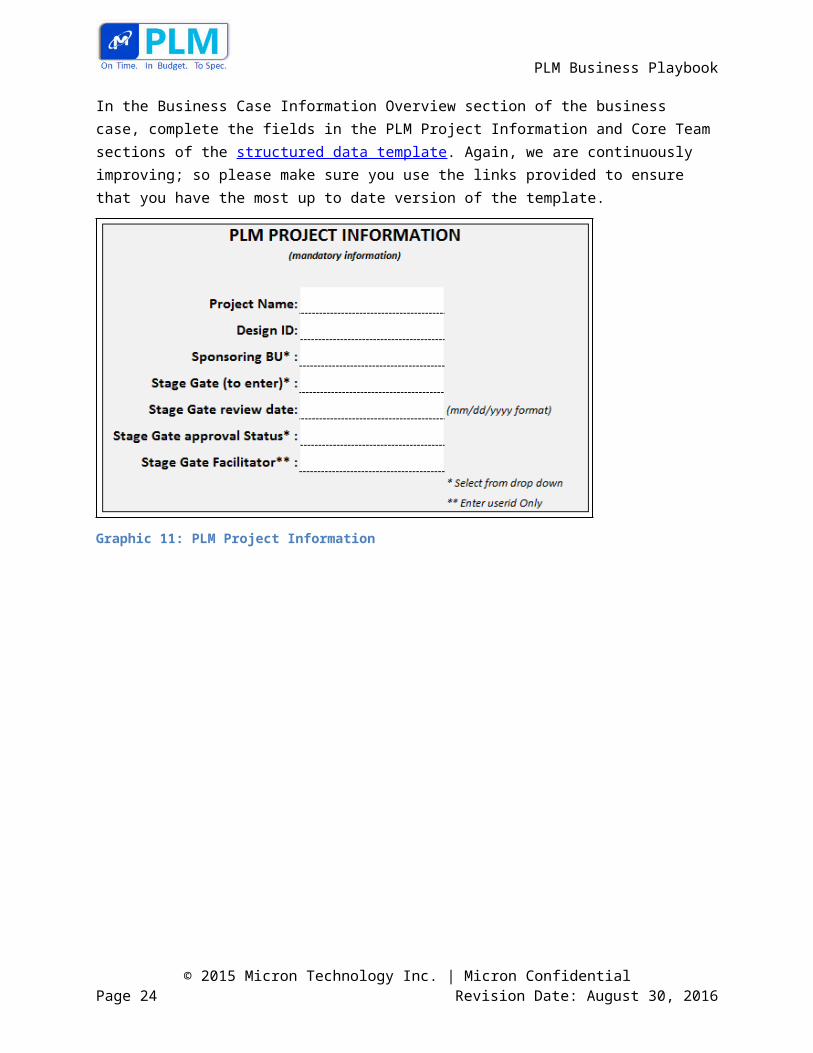
In the Business Case Information Overview section of the business case, complete the fields in the PLM Project Information and Core Team sections of the structured data template. Again, we are continuously improving; so please make sure you use the links provided to ensure that you have the most up to date version of the template.
Graphic 11: PLM Project Information
© 2015 Micron Technology Inc. | Micron ConfidentialPage 19 Revision Date: August 30, 2016
PLM Business Playbook
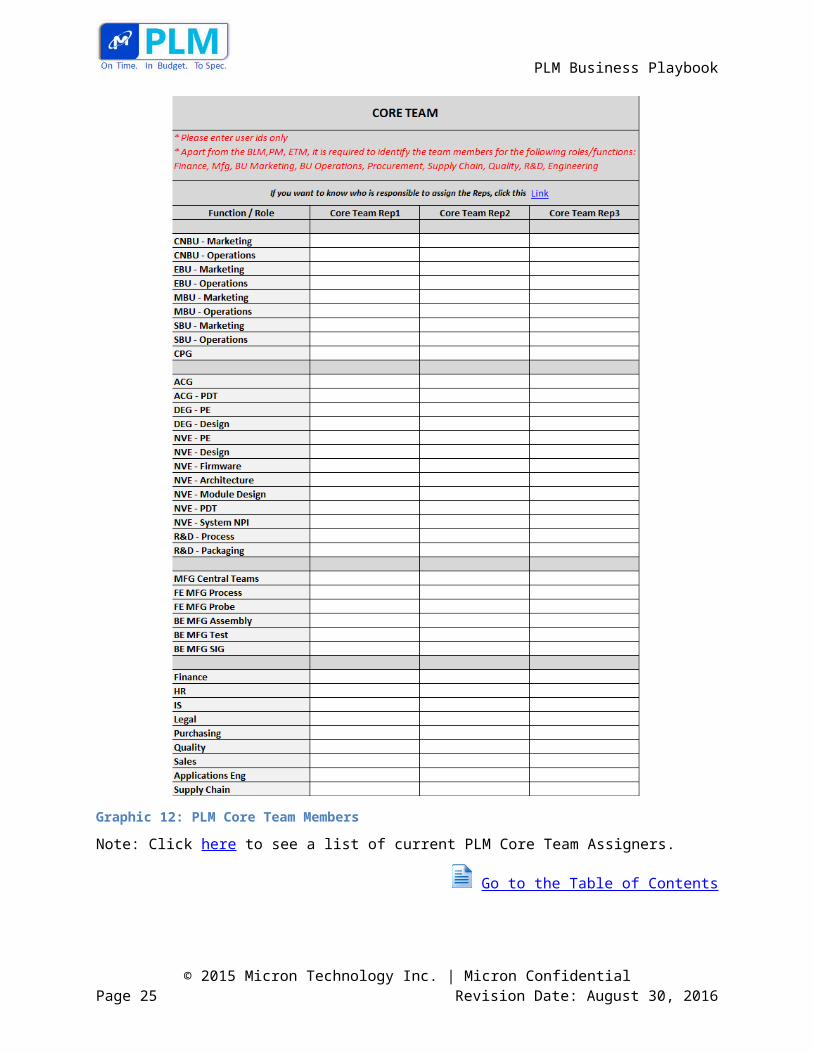
Graphic 12: PLM Core Team Members
Note: Click here to see a list of current PLM Core Team Assigners.
Go to the Table of Contents
© 2015 Micron Technology Inc. | Micron ConfidentialPage 20 Revision Date: August 30, 2016
PLM Business Playbook
7. Business Case Standard Elements
This section provides information about the standard elements that go into a Business Case. The information is presented in the order that this information is used in the Business Case Template and as shown in the table below.
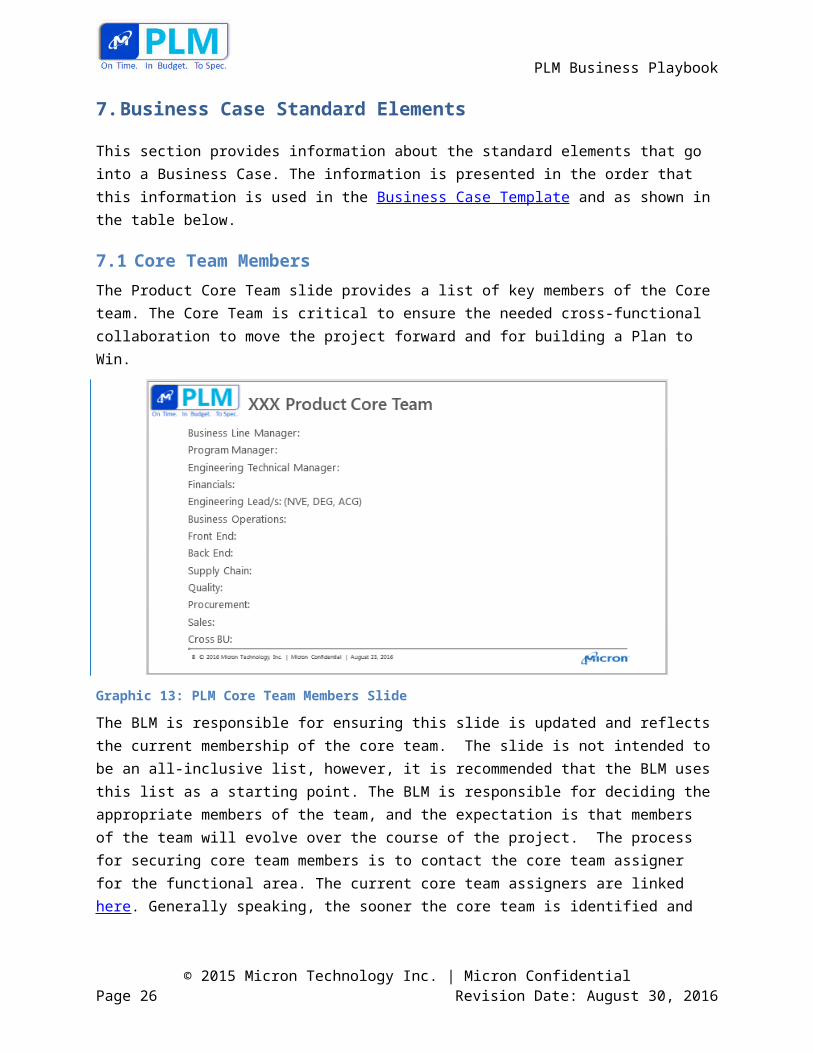
7.1 Core Team Members
The Product Core Team slide provides a list of key members of the Core team. The Core Team is critical to ensure the needed cross-functional collaboration to move the project forward and for building a Plan to Win.
Graphic 13: PLM Core Team Members Slide
The BLM is responsible for ensuring this slide is updated and reflects the current membership of the core team. The slide is not intended to be an all-inclusive list, however, it is recommended that the BLM uses this list as a starting point. The BLM is responsible for deciding the appropriate members of the team, and the expectation is that members of the team will evolve over the course of the project. The process for securing core team members is to contact the core team assigner for the functional area. The current core team assigners are linked here. Generally speaking, the sooner the core team is identified and functioning, the smoother the overall PLM process is. A RAPID tool for the Core Team is located on the PLM SharePoint site.
Go to the Table of Contents
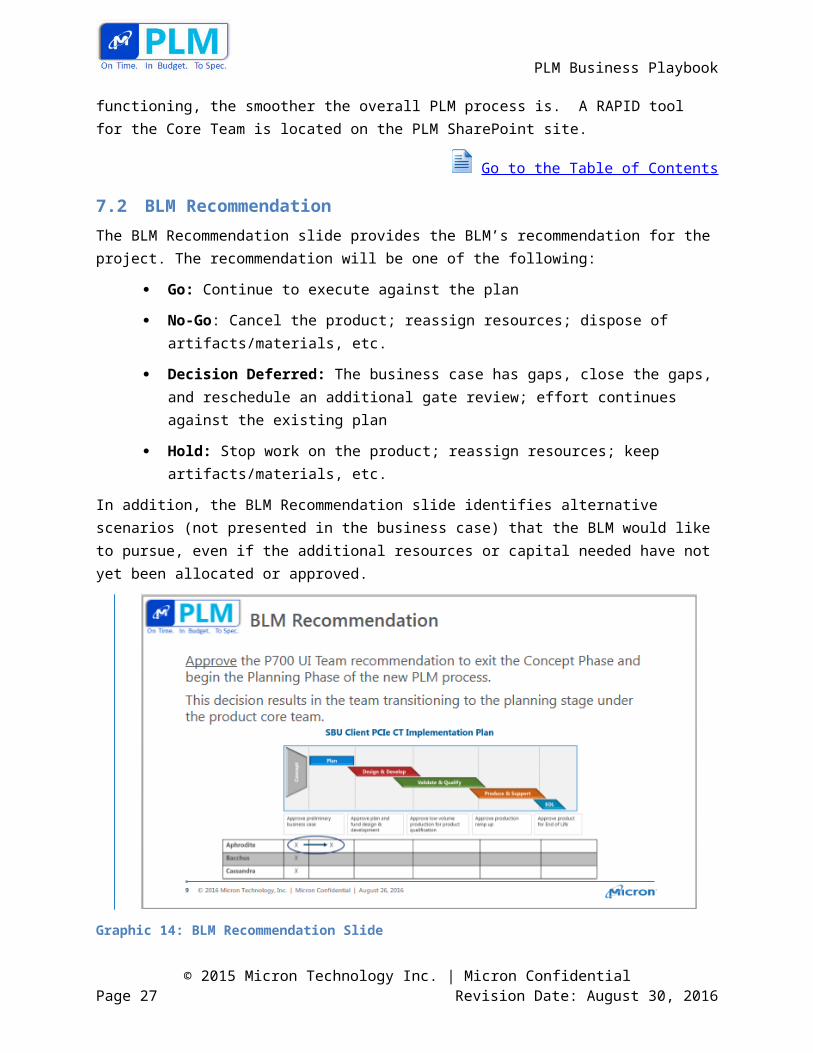
7.2 BLM Recommendation
The BLM Recommendation slide provides the BLM’s recommendation for the project. The recommendation will be one of the following:
Go: Continue to execute against the plan
© 2015 Micron Technology Inc. | Micron ConfidentialPage 21 Revision Date: August 30, 2016
PLM Business Playbook
No-Go: Cancel the product; reassign resources; dispose of artifacts/materials, etc.
Decision Deferred: The business case has gaps, close the gaps, and reschedule an additional gate review; effort continues against the existing plan
Hold: Stop work on the product; reassign resources; keep artifacts/materials, etc.
In addition, the BLM Recommendation slide identifies alternative scenarios (not presented in the business case) that the BLM would like to pursue, even if the additional resources or capital needed have not yet been allocated or approved.
Graphic 14: BLM Recommendation Slide
The intent is to have the Portfolio Management Team (PMT) decide whether this project is to move forward with the presented scenario or to change direction pending the ability to close the gaps. While the PMT provides an endorsement for the team to pursue the change, the BLM must, however, first seek BU agreement to the revised Plan and identify any additional resources or capital needed prior to proceeding for Stage Gate approval.
Ultimately, the BLM Recommendation slide provides a record of the recommendations that were made regarding the project.
Go to the Table of Contents
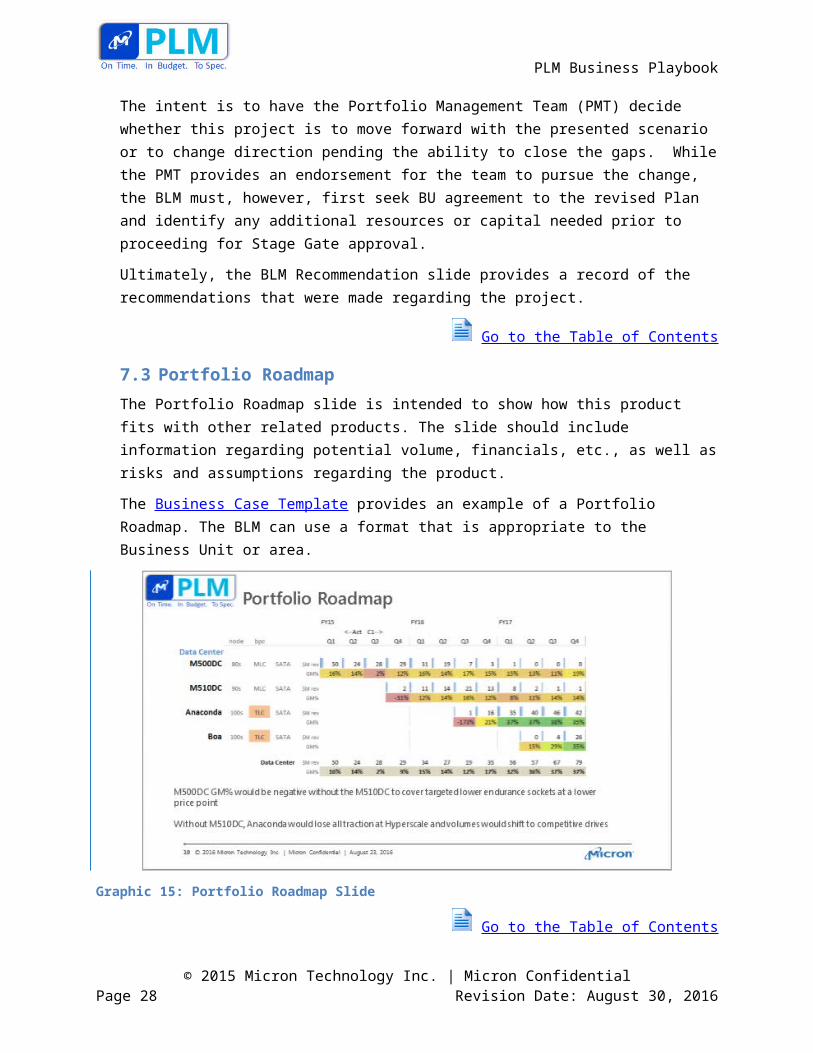
7.3 Portfolio Roadmap
The Portfolio Roadmap slide is intended to show how this product fits with other related products. The slide should include information regarding potential volume, financials, etc., as well as risks and assumptions regarding the product.
© 2015 Micron Technology Inc. | Micron ConfidentialPage 22 Revision Date: August 30, 2016
PLM Business Playbook
The Business Case Template provides an example of a Portfolio Roadmap. The BLM can use a format that is appropriate to the Business Unit or area.
Graphic 15: Portfolio Roadmap Slide
Go to the Table of Contents
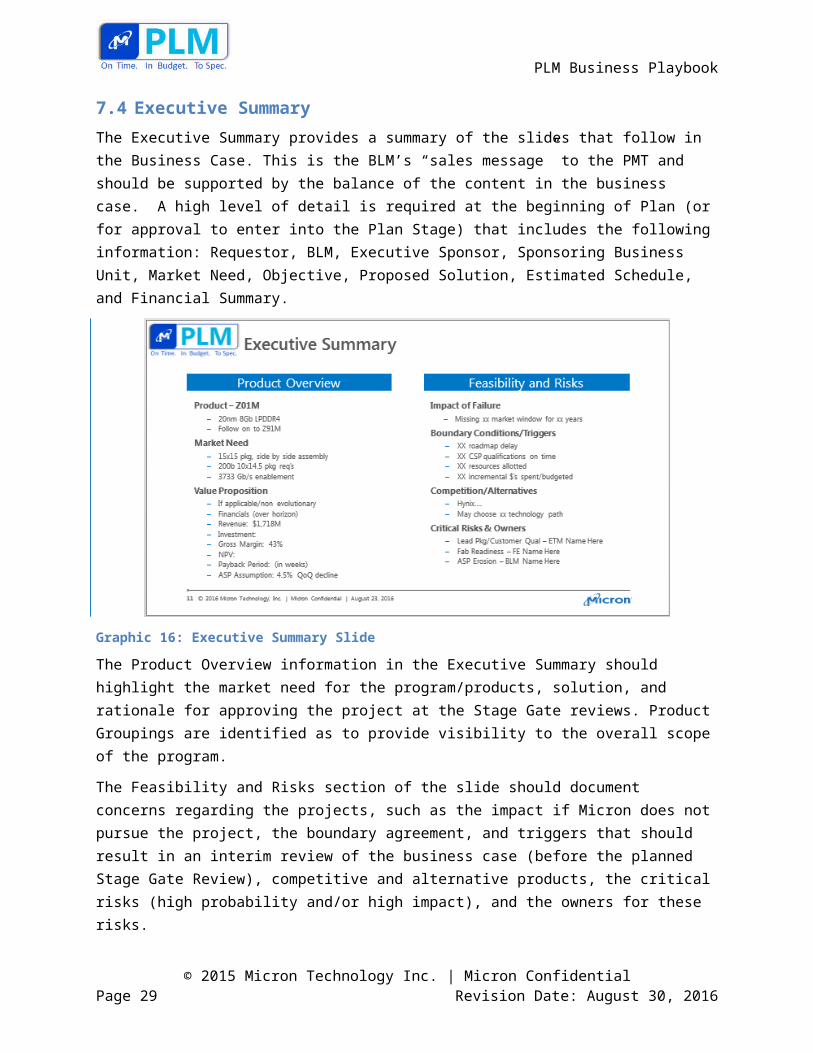
7.4 Executive Summary
The Executive Summary provides a summary of the slides that follow in the Business Case. This is the BLM’s “sales message” to the PMT and should be supported by the balance of the content in the business case. A high level of detail is required at the beginning of Plan (or for approval to enter into the Plan Stage) that includes the following information: Requestor, BLM, Executive Sponsor, Sponsoring Business Unit, Market Need, Objective, Proposed Solution, Estimated Schedule, and Financial Summary.
© 2015 Micron Technology Inc. | Micron ConfidentialPage 23 Revision Date: August 30, 2016
PLM Business Playbook
Graphic 16: Executive Summary Slide
The Product Overview information in the Executive Summary should highlight the market need for the program/products, solution, and rationale for approving the project at the Stage Gate reviews. Product Groupings are identified as to provide visibility to the overall scope of the program.
The Feasibility and Risks section of the slide should document concerns regarding the projects, such as the impact if Micron does not pursue the project, the boundary agreement, and triggers that should result in an interim review of the business case (before the planned Stage Gate Review), competitive and alternative products, the critical risks (high probability and/or high impact), and the owners for these risks.
Go to the Table of Contents
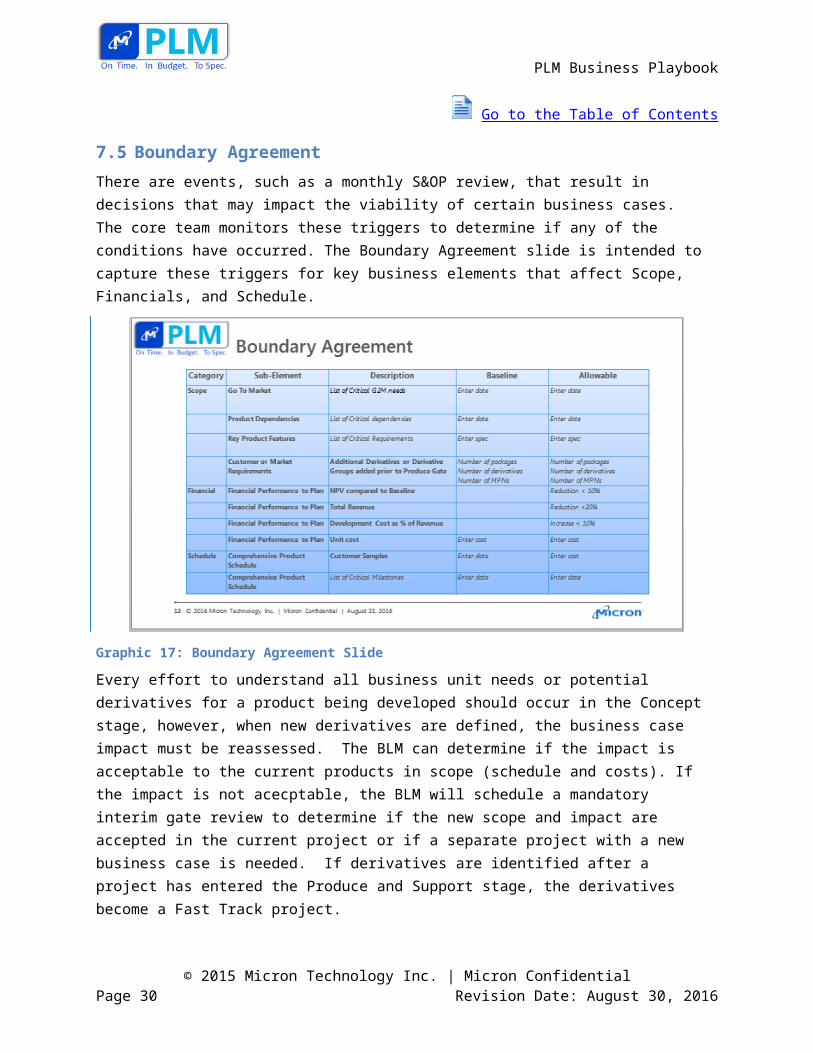
7.5 Boundary Agreement
There are events, such as a monthly S&OP review, that result in decisions that may impact the viability of certain business cases. The core team monitors these triggers to determine if any of the conditions have occurred. The Boundary Agreement slide is intended to capture these triggers for key business elements that affect Scope, Financials, and Schedule.
© 2015 Micron Technology Inc. | Micron ConfidentialPage 24 Revision Date: August 30, 2016
PLM Business Playbook
Graphic 17: Boundary Agreement Slide
Every effort to understand all business unit needs or potential derivatives for a product being developed should occur in the Concept stage, however, when new derivatives are defined, the business case impact must be reassessed. The BLM can determine if the impact is acceptable to the current products in scope (schedule and costs). If the impact is not acecptable, the BLM will schedule a mandatory interim gate review to determine if the new scope and impact are accepted in the current project or if a separate project with a new business case is needed. If derivatives are identified after a project has entered the Produce and Support stage, the derivatives become a Fast Track project.
Go to the Table of Contents
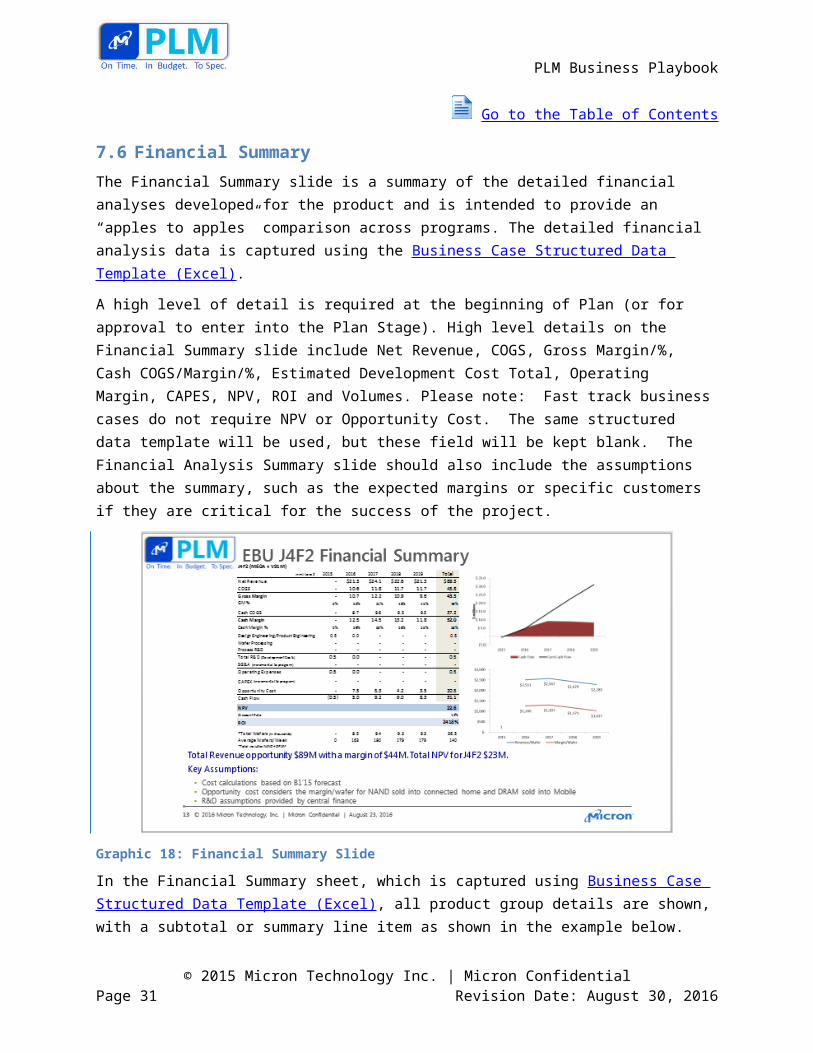
7.6 Financial Summary
The Financial Summary slide is a summary of the detailed financial analyses developed for the product and is intended to provide an “apples to apples” comparison across programs. The detailed financial analysis data is captured using the Business Case Structured Data Template (Excel).
A high level of detail is required at the beginning of Plan (or for approval to enter into the Plan Stage). High level details on the Financial Summary slide include Net Revenue, COGS, Gross Margin/%, Cash COGS/Margin/%, Estimated Development Cost Total, Operating Margin, CAPES, NPV, ROI and Volumes. Please note: Fast track business cases do not require NPV or Opportunity Cost. The same structured data template will be used, but these field will be kept blank. The Financial Analysis Summary slide should also include the assumptions about the summary, such as the expected margins or specific customers if they are critical for the success of the project.
© 2015 Micron Technology Inc. | Micron ConfidentialPage 25 Revision Date: August 30, 2016
PLM Business Playbook
Graphic 18: Financial Summary Slide
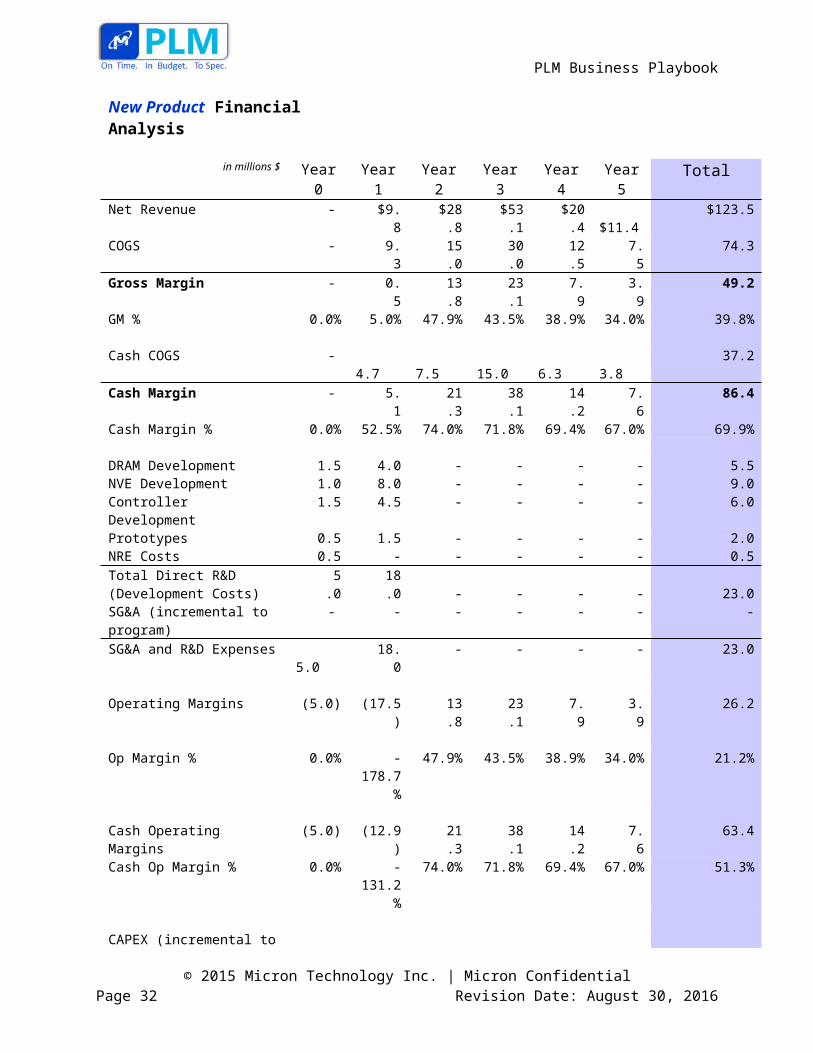
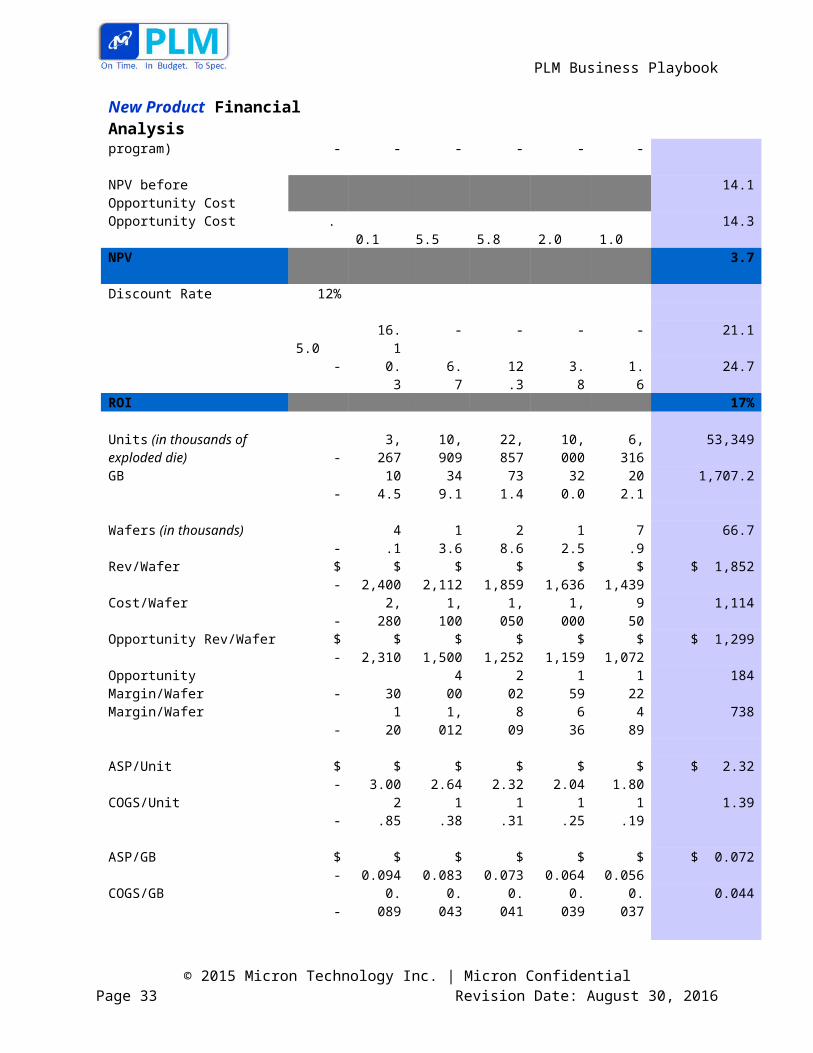
In the Financial Summary sheet, which is captured using Business Case Structured Data Template (Excel), all product group details are shown, with a subtotal or summary line item as shown in the example below.
New Product Financial Analysis
in millions $ Year 0 Year 1 Year 2 Year 3 Year 4 Year 5 TotalNet Revenue - $9.8 $28.8 $53.1 $20.4 $11.4 $123.5 COGS - 9.3 15.0 30.0 12.5 7.5 74.3 Gross Margin - 0.5 13.8 23.1 7.9 3.9 49.2 GM % 0.0% 5.0% 47.9% 43.5% 38.9% 34.0% 39.8%
Cash COGS - 4.7 7.5 15.0 6.3 3.8 37.2 Cash Margin - 5.1 21.3 38.1 14.2 7.6 86.4 Cash Margin % 0.0% 52.5% 74.0% 71.8% 69.4% 67.0% 69.9%
DRAM Development 1.5 4.0 - - - - 5.5 NVE Development 1.0 8.0 - - - - 9.0 Controller Development 1.5 4.5 - - - - 6.0 Prototypes 0.5 1.5 - - - - 2.0 NRE Costs 0.5 - - - - - 0.5 Total Direct R&D (Development Costs)
5.0 18.0 - - - -23.0
SG&A (incremental to program) - - - - - - - SG&A and R&D Expenses 5.0 18.0 - - - - 23.0
Operating Margins (5.0) (17.5) 13.8 23.1 7.9 3.9 26.2
Op Margin % 0.0% -178.7% 47.9% 43.5% 38.9% 34.0% 21.2%
© 2015 Micron Technology Inc. | Micron ConfidentialPage 26 Revision Date: August 30, 2016
PLM Business Playbook
New Product Financial AnalysisCash Operating Margins (5.0) (12.9) 21.3 38.1 14.2 7.6 63.4 Cash Op Margin % 0.0% -131.2% 74.0% 71.8% 69.4% 67.0% 51.3%
CAPEX (incremental to program)
- - - - - -
NPV before Opportunity Cost 14.1 Opportunity Cost . 0.1 5.5 5.8 2.0 1.0 14.3 NPV (5.0) (15.7) 3.7 Discount Rate 12%
5.0 16.1 - - - - 21.1 - 0.3 6.7 12.3 3.8 1.6 24.7
ROI 17%
Units (in thousands of exploded die)
- 3,267 10,909 22,857 10,000 6,316 53,349
GB - 104.5 349.1 731.4 320.0 202.1 1,707.2
Wafers (in thousands) - 4.1 13.6 28.6 12.5 7.9 66.7 Rev/Wafer $ - $
2,400 $ 2,112 $ 1,859 $ 1,636 $
1,439 $ 1,852
Cost/Wafer - 2,280 1,100 1,050 1,000 950 1,114 Opportunity Rev/Wafer $ - $
2,310 $ 1,500 $ 1,252 $ 1,159 $
1,072 $ 1,299
Opportunity Margin/Wafer - 30 400 202 159 122 184 Margin/Wafer - 120 1,012 809 636 489 738
ASP/Unit $ - $ 3.00 $ 2.64 $ 2.32 $ 2.04 $ 1.80 $ 2.32 COGS/Unit - 2.85 1.38 1.31 1.25 1.19 1.39
ASP/GB $ - $ 0.094
$ 0.083 $ 0.073 $ 0.064 $ 0.056
$ 0.072
COGS/GB - 0.089 0.043 0.041 0.039 0.037 0.044
Additional Fields if neededASP/Usable GBGB/UnitNon-Silicon Cost per UnitNon-NAND (or DRAM) Cost per UnitYields
Table 5: New Product Financial Analysis
Go to the Table of Contents
© 2015 Micron Technology Inc. | Micron ConfidentialPage 27 Revision Date: August 30, 2016
PLM Business Playbook
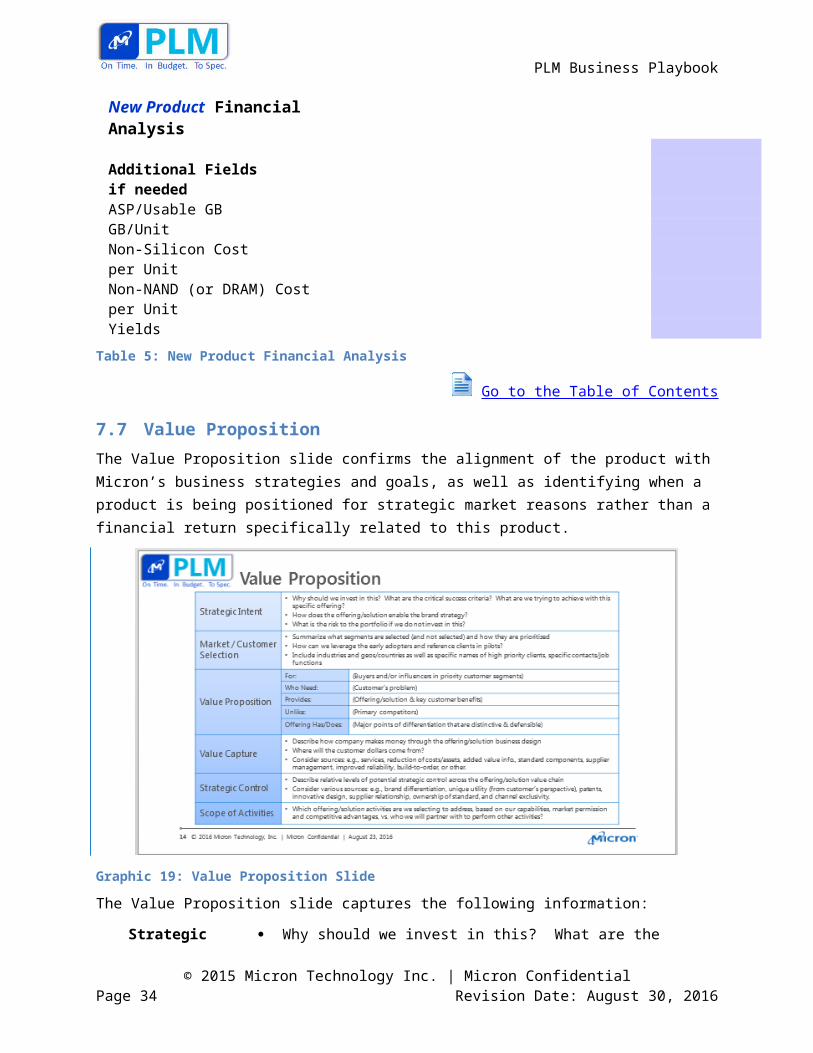
7.7 Value Proposition
The Value Proposition slide confirms the alignment of the product with Micron’s business strategies and goals, as well as identifying when a product is being positioned for strategic market reasons rather than a financial return specifically related to this product.
Graphic 19: Value Proposition Slide
The Value Proposition slide captures the following information:
Strategic Intent Why should we invest in this? What are the critical success criteria? What are we trying to achieve with this specific offering?
How does the offering/solution enable the brand strategy? What is the risk to the portfolio if we do not invest in this?
Market/Customer Selection
Summarize what segments are selected (and not selected) and how they are prioritized
How can we leverage the early adopters and reference clients in pilots?
Include industries and geographies/countries as well as specific names of high priority clients, specific contacts/job functions
Value Proposition For: (Buyers and/or influencers in priority customer segments)
Who Need: (Customer’s problem)
Provides: (Offering/solution & key customer benefits)
Unlike: (Primary competitors)
Offering Has/Does: (Major points of differentiation that are distinctive and defensible)
Value Capture Describe how company makes money through the offering/solution
© 2015 Micron Technology Inc. | Micron ConfidentialPage 28 Revision Date: August 30, 2016
PLM Business Playbook
business design Where will the customer dollars come from? Consider sources: e.g., services, reduction of costs/assets, added
value info, standard components, supplier management, improved reliability, build-to-order, or other.
Strategic Control Describe relative levels of potential strategic control across the offering/solution value chain
Consider various sources: e.g., brand differentiation, unique utility (from customer’s perspective), patents, innovative design, supplier relationship, ownership of standard, and channel exclusivity.
Scope of Activities Which offering/solution activities are we selecting to address, based on our capabilities, market permission and competitive advantages, vs. who we will partner with to perform other activities?
Graphic 20: Information Captured in the Value Proposition
Go to the Table of Contents
7.8 Comparison to Baseline
The Comparison to Baseline slide documents how well the project is doing against its baseline expectations for schedule and risks.
The Comparison to Baseline slide should also include whether the project has changed since its last review (the delta). The three most typical factors affecting the delta are provided at the bottom of the slide: Volume, Costs, Schedule and ASP. The BLM should include other factors, as needed.
Graphic 21: Comparison to Baseline Slide
Among the metrics that are required include:
© 2015 Micron Technology Inc. | Micron ConfidentialPage 29 Revision Date: August 30, 2016
PLM Business Playbook
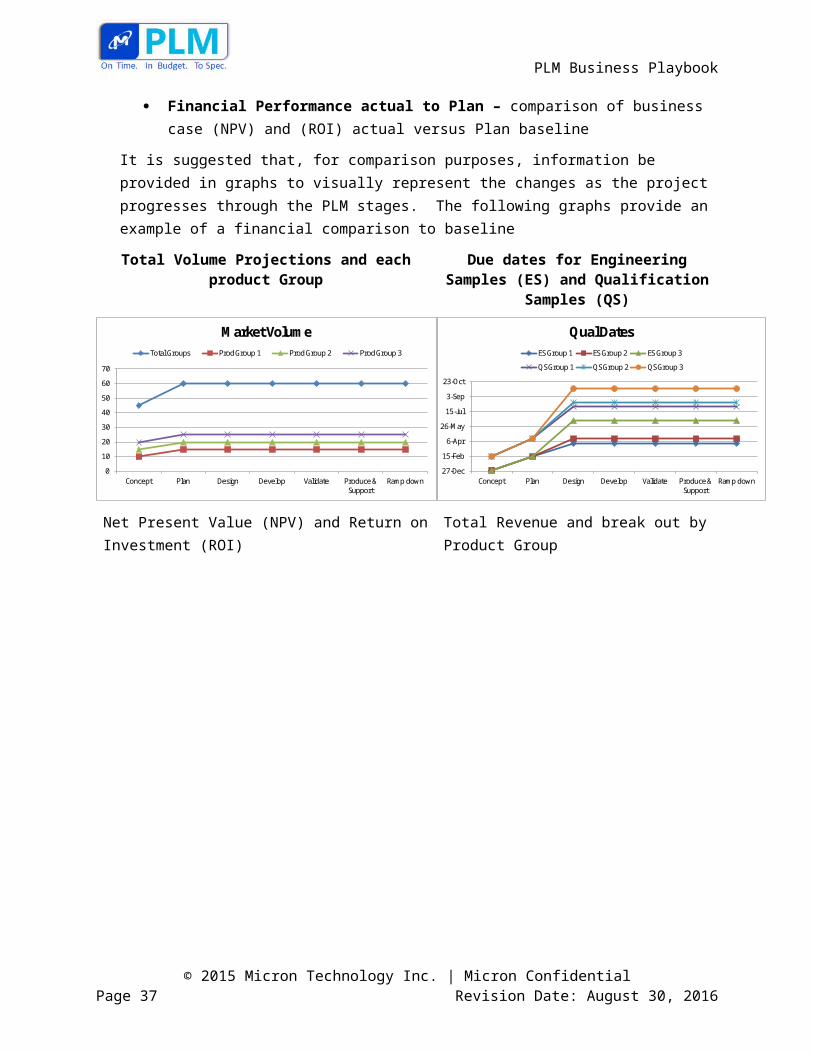
Performance to Engineering Plan – percentage of project achieving planned Performance to key customer commitment dates (ES/QS)
Financial Performance actual to Plan – comparison of business case (NPV) and (ROI) actual versus Plan baseline
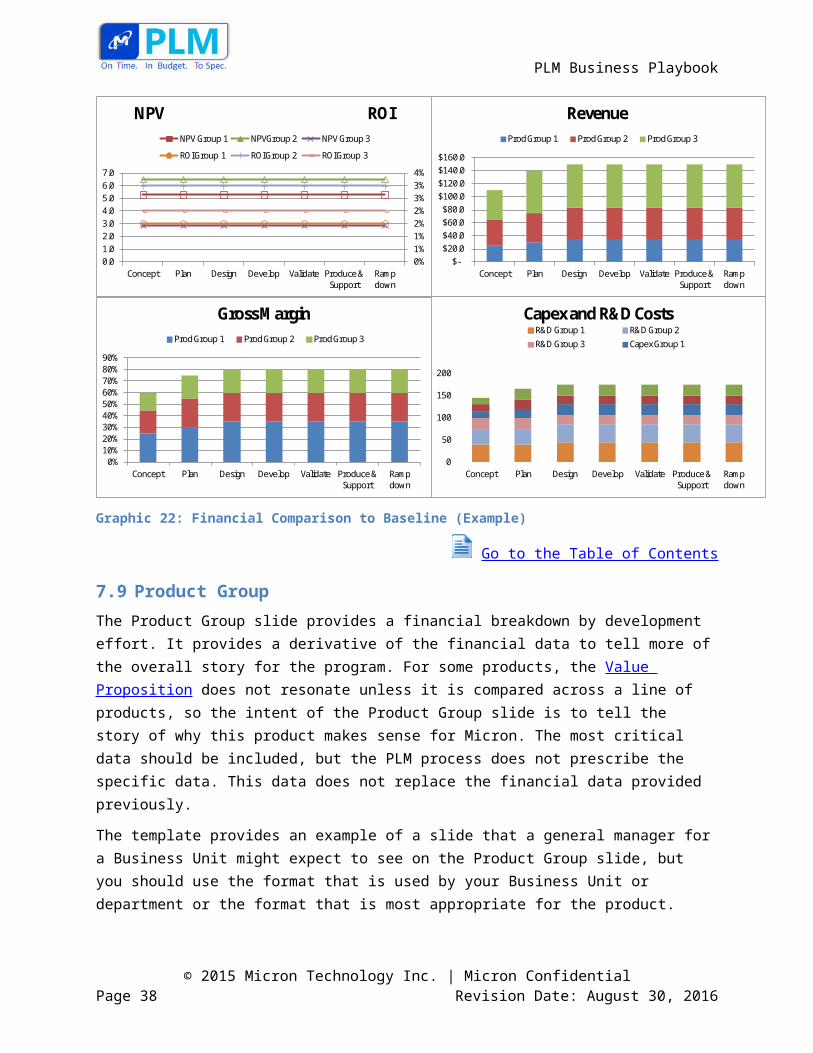
It is suggested that, for comparison purposes, information be provided in graphs to visually represent the changes as the project progresses through the PLM stages. The following graphs provide an example of a financial comparison to baseline
Total Volume Projections and each product Group Due dates for Engineering Samples (ES) and Qualification Samples (QS)
27-Dec
15-Feb
6-Apr
26-May
15-Jul
3-Sep
23-Oct
Concept Plan Design Develop Validate Produce & Support
Ramp down
Qual Dates ES Group 1 ES Group 2 ES Group 3
QS Group 1 QS Group 2 QS Group 3
0
10
20
30
40
50
60
70
Concept Plan Design Develop Validate Produce & Support
Ramp down
Market VolumeTotal Groups Prod Group 1 Prod Group 2 Prod Group 3
Net Present Value (NPV) and Return on Investment (ROI)
Total Revenue and break out by Product Group
$-$20.0 $40.0 $60.0 $80.0
$100.0 $120.0 $140.0 $160.0
Concept Plan Design Develop Validate Produce & Support
Ramp down
RevenueProd Group 1 Prod Group 2 Prod Group 3
0%10%20%30%40%50%60%70%80%90%
Concept Plan Design Develop Validate Produce & Support
Ramp down
Gross MarginProd Group 1 Prod Group 2 Prod Group 3
0
50
100
150
200
Concept Plan Design Develop Validate Produce & Support
Ramp down
Capex and R&D CostsR&D Group 1 R&D Group 2R&D Group 3 Capex Group 1
0%1%1%2%2%3%3%4%
0.01.02.03.04.05.06.07.0
Concept Plan Design Develop Validate Produce & Support
Ramp down
NPV ROINPV Group 1 NPVGroup 2 NPV Group 3
ROI Group 1 ROI Group 2 ROI Group 3
© 2015 Micron Technology Inc. | Micron ConfidentialPage 30 Revision Date: August 30, 2016
PLM Business Playbook
Graphic 22: Financial Comparison to Baseline (Example)
Go to the Table of Contents
7.9 Product Group
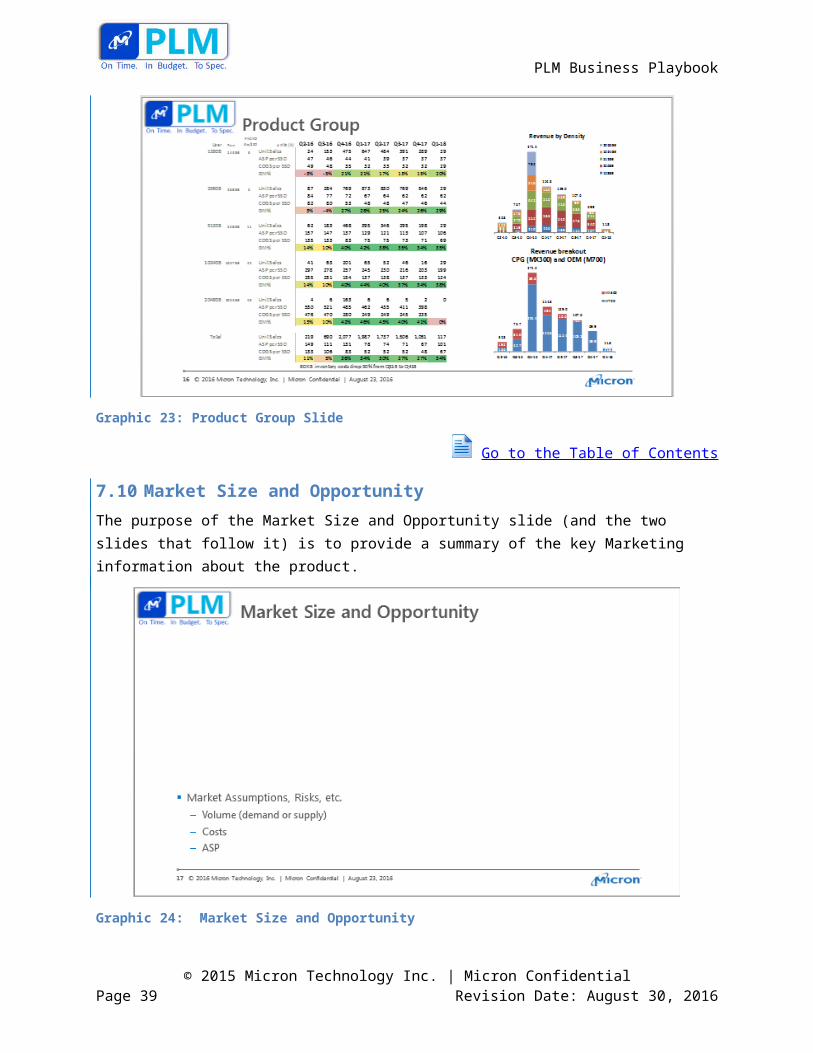
The Product Group slide provides a financial breakdown by development effort. It provides a derivative of the financial data to tell more of the overall story for the program. For some products, the Value Proposition does not resonate unless it is compared across a line of products, so the intent of the Product Group slide is to tell the story of why this product makes sense for Micron. The most critical data should be included, but the PLM process does not prescribe the specific data. This data does not replace the financial data provided previously.
The template provides an example of a slide that a general manager for a Business Unit might expect to see on the Product Group slide, but you should use the format that is used by your Business Unit or department or the format that is most appropriate for the product.
Graphic 23: Product Group Slide
Go to the Table of Contents
7.10 Market Size and Opportunity
The purpose of the Market Size and Opportunity slide (and the two slides that follow it) is to provide a summary of the key Marketing information about the product.
© 2015 Micron Technology Inc. | Micron ConfidentialPage 31 Revision Date: August 30, 2016
PLM Business Playbook
Graphic 24: Market Size and Opportunity
The Volume slide identifies the overall marketing opportunity in terms of Available Market Size – for both Total Available Market (TAM) and Share of the Market (SOM) – growth rate, forecasted profitability, and any market dynamics to watch out for in order to determine the maximum opportunity for the new product(s) and the forecasted sales. The slide should also capture the key assumptions and risks for the project and provides the most common factors (Volume, Costs, and ASP), but the BLM should include other factors, as needed.
The information provided in the Market Size and Opportunity slide should follow the format that is currently used by the BU or area. PLM does not prescribe a particular format.
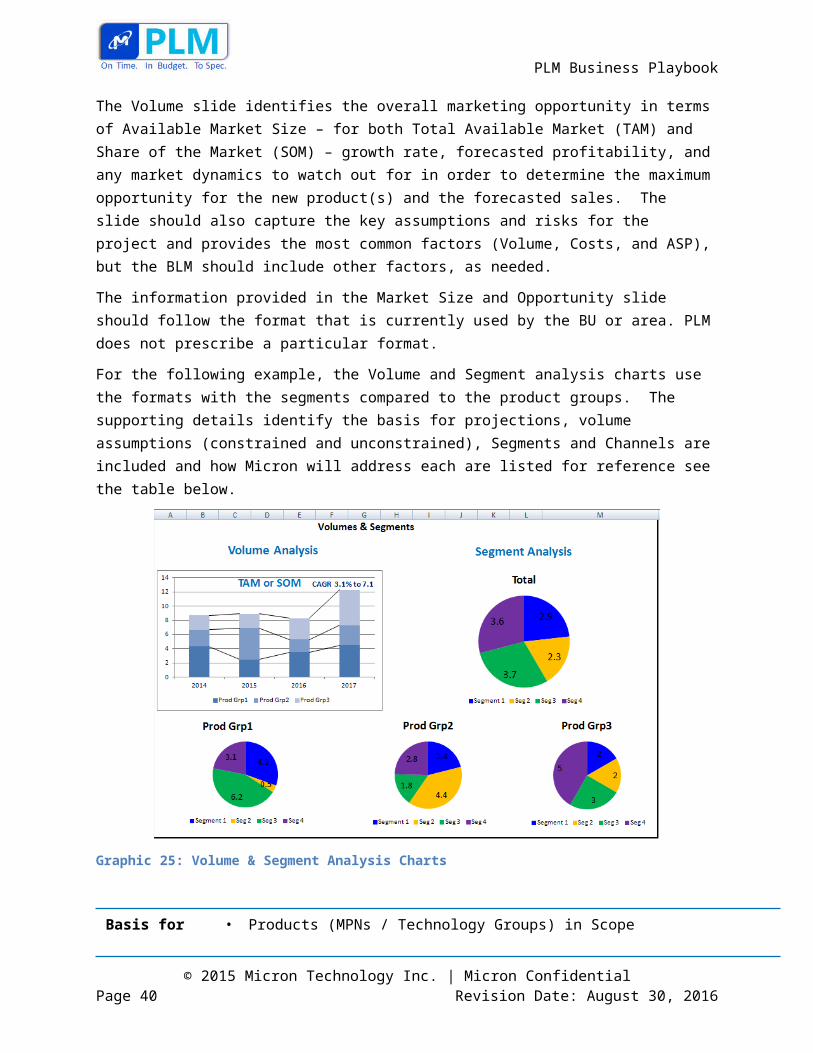
For the following example, the Volume and Segment analysis charts use the formats with the segments compared to the product groups. The supporting details identify the basis for projections, volume assumptions (constrained and unconstrained), Segments and Channels are included and how Micron will address each are listed for reference see the table below.
© 2015 Micron Technology Inc. | Micron ConfidentialPage 32 Revision Date: August 30, 2016
PLM Business Playbook
Graphic 25: Volume & Segment Analysis Charts
Basis for Projections
• Products (MPNs / Technology Groups) in Scope• Data sources• Volume Assumptions (constrained or unconstrained – (resources / silicon)• Delta view (unconstrained plan entrance vs. plan exit)
Opportunity Summary
• Which segments & sub-segments are targeted for this and for how much?• Micron’s position for each
Sales / Channels • Route to Market – Channels, OEMs, Chip Set Vendors• Channels and Revenue split for each
Table 6: Supporting Details for Volume and Segment Data
Go to the Table of Contents
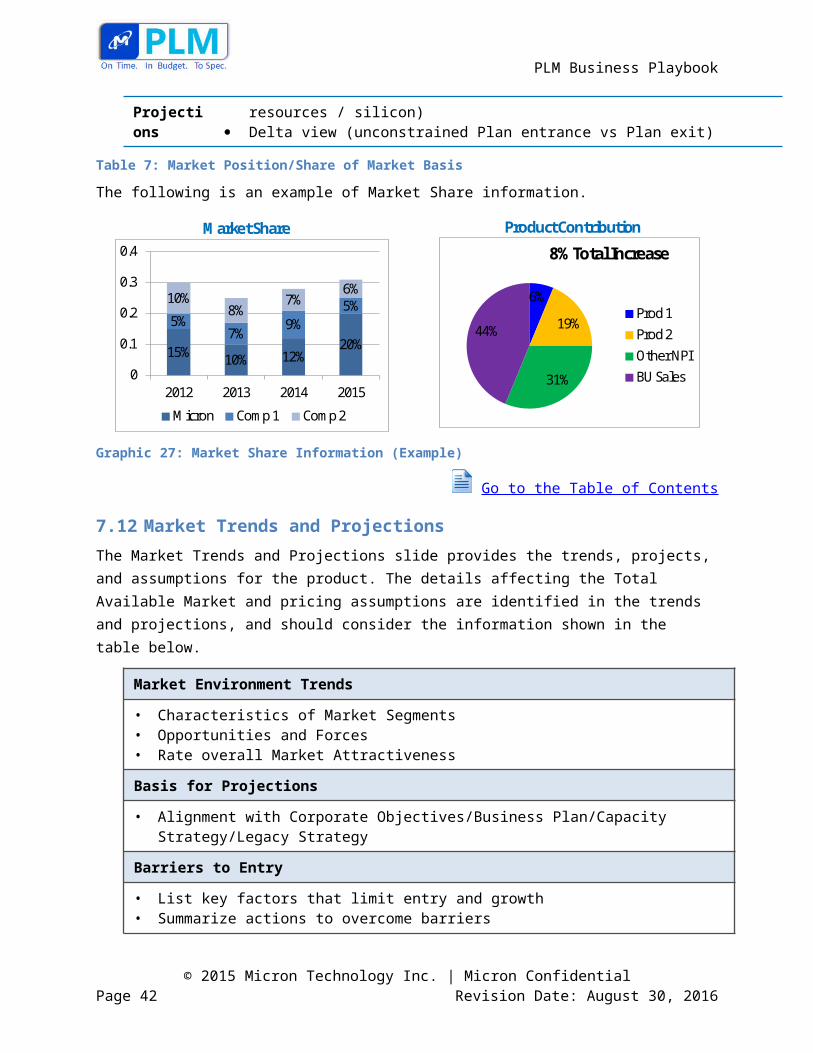
7.11 Market Position/Share of Market
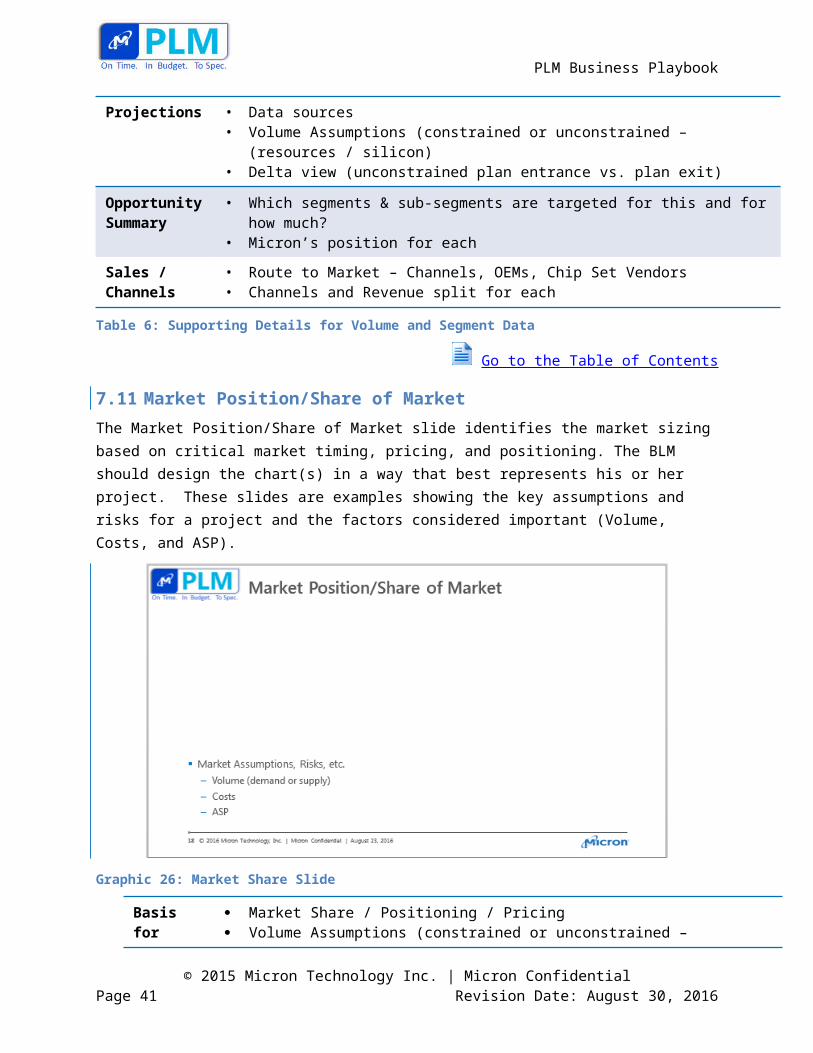
The Market Position/Share of Market slide identifies the market sizing based on critical market timing, pricing, and positioning. The BLM should design the chart(s) in a way that best represents his or her project. These slides are examples showing the key assumptions and risks for a project and the factors considered important (Volume, Costs, and ASP).
© 2015 Micron Technology Inc. | Micron ConfidentialPage 33 Revision Date: August 30, 2016
PLM Business Playbook
Graphic 26: Market Share Slide
Basis for Projections
Market Share / Positioning / Pricing Volume Assumptions (constrained or unconstrained – resources / silicon) Delta view (unconstrained Plan entrance vs Plan exit)
Table 7: Market Position/Share of Market Basis
The following is an example of Market Share information.
15% 10% 12%20%
5%7%
9%5%10%
8%7%
6%
0
0.1
0.2
0.3
0.4
2012 2013 2014 2015
Micron Comp 1 Comp 2
Market Share
6%
19%
31%
44%
8% Total Increase
Prod 1Prod 2Other NPIBU Sales
Product Contribution
Graphic 27: Market Share Information (Example)
Go to the Table of Contents
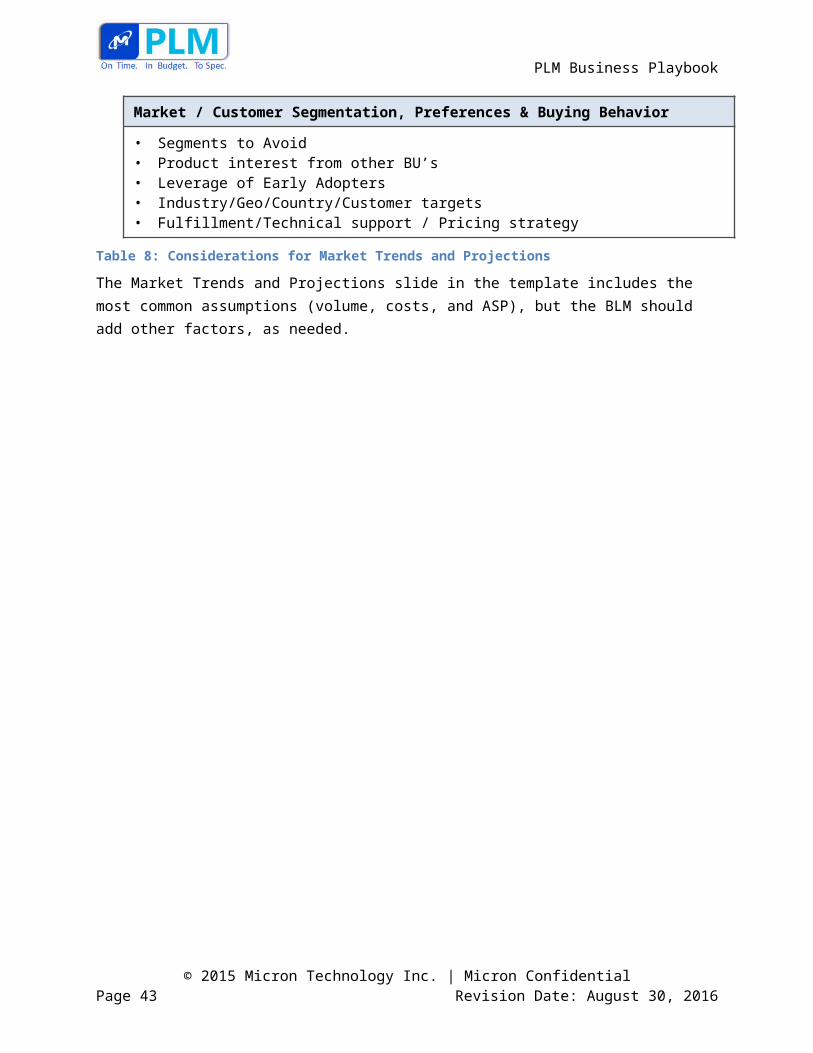
7.12 Market Trends and Projections
The Market Trends and Projections slide provides the trends, projects, and assumptions for the product. The details affecting the Total Available Market and pricing assumptions are identified in the trends and projections, and should consider the information shown in the table below.
© 2015 Micron Technology Inc. | Micron ConfidentialPage 34 Revision Date: August 30, 2016
PLM Business Playbook
Market Environment Trends
• Characteristics of Market Segments• Opportunities and Forces• Rate overall Market Attractiveness
Basis for Projections
• Alignment with Corporate Objectives/Business Plan/Capacity Strategy/Legacy Strategy
Barriers to Entry
• List key factors that limit entry and growth• Summarize actions to overcome barriers
Market / Customer Segmentation, Preferences & Buying Behavior
• Segments to Avoid• Product interest from other BU’s • Leverage of Early Adopters• Industry/Geo/Country/Customer targets• Fulfillment/Technical support / Pricing strategy
Table 8: Considerations for Market Trends and Projections
The Market Trends and Projections slide in the template includes the most common assumptions (volume, costs, and ASP), but the BLM should add other factors, as needed.
© 2015 Micron Technology Inc. | Micron ConfidentialPage 35 Revision Date: August 30, 2016

PLM Business Playbook
Graphic 28: Market Trends and Projections Slide
Go to the Table of Contents
7.13 Go to Market
The Go to Market slide identifies the market elements that will help ensure that, as a product ramps, Micron will be ready to sell the product into the expected markets and segments. The format for this information will differ by Business Unit or area. The template is not intended to be prescriptive, but provides an example of a Go-to-Market strategy.
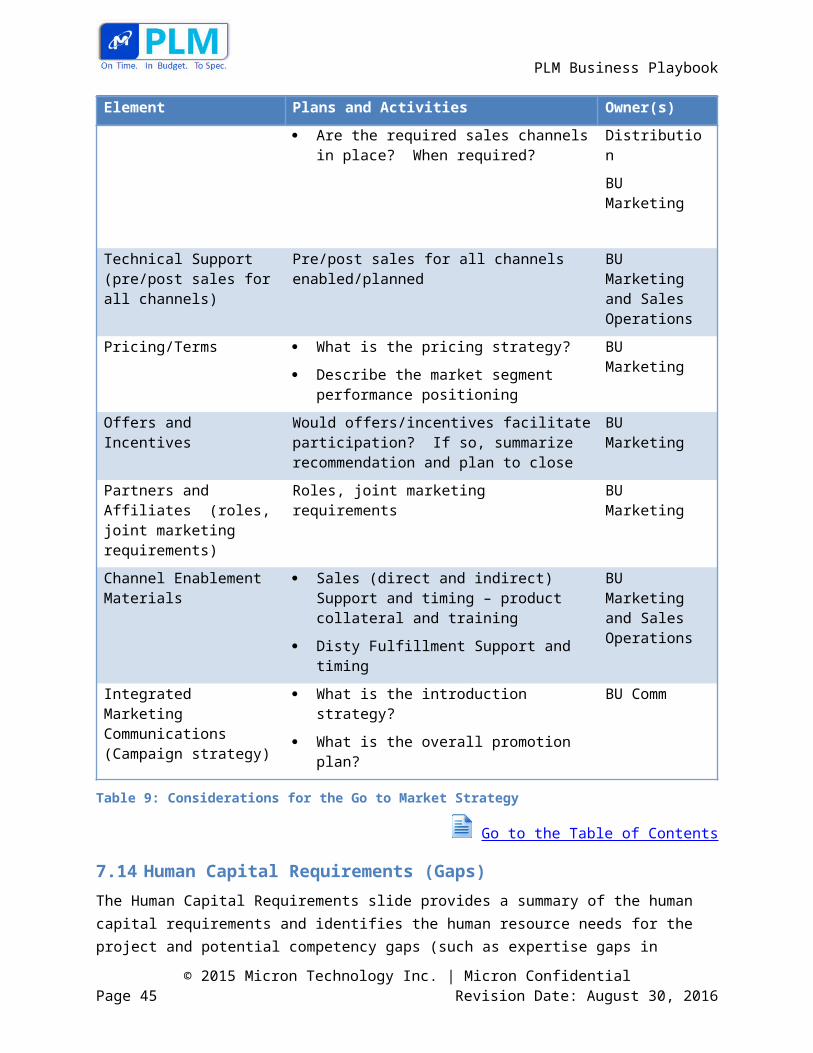
At a minimum, you must define the elements that are driving the positive ROI analysis for the product Solution Enablers:
Element Plans and Activities Owner(s)
Offering
Critical CSV enablement – when specs, samples etc.
Are committed plans in place to deliver these enablers when needed
Critical customer design/sample product and timing
BU Marketing/Business Development
Routes-to-Market What is the sales / distribution strategy?
Are the required sales channels in place? When required?
Sales Operations/Distribution
BU Marketing
Technical Support (pre/post sales for all channels)
Pre/post sales for all channels enabled/planned BU Marketing and Sales Operations
© 2015 Micron Technology Inc. | Micron ConfidentialPage 36 Revision Date: August 30, 2016
PLM Business Playbook
Element Plans and Activities Owner(s)
Pricing/Terms What is the pricing strategy?
Describe the market segment performance positioning
BU Marketing
Offers and Incentives Would offers/incentives facilitate participation? If so, summarize recommendation and plan to close
BU Marketing
Partners and Affiliates (roles, joint marketing requirements)
Roles, joint marketing requirements BU Marketing
Channel Enablement Materials
Sales (direct and indirect) Support and timing – product collateral and training
Disty Fulfillment Support and timing
BU Marketing and Sales Operations
Integrated Marketing Communications (Campaign strategy)
What is the introduction strategy?
What is the overall promotion plan?
BU Comm
Table 9: Considerations for the Go to Market Strategy
Go to the Table of Contents
7.14 Human Capital Requirements (Gaps)
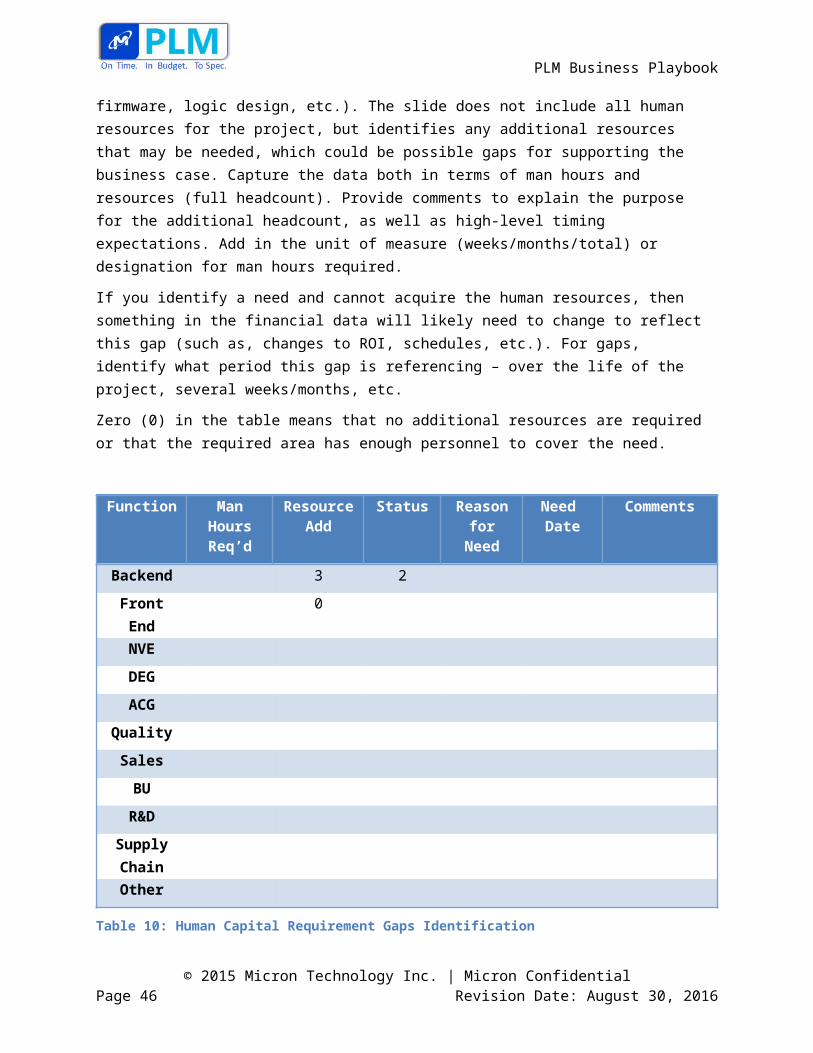
The Human Capital Requirements slide provides a summary of the human capital requirements and identifies the human resource needs for the project and potential competency gaps (such as expertise gaps in firmware, logic design, etc.). The slide does not include all human resources for the project, but identifies any additional resources that may be needed, which could be possible gaps for supporting the business case. Capture the data both in terms of man hours and resources (full headcount). Provide comments to explain the purpose for the additional headcount, as well as high-level timing expectations. Add in the unit of measure (weeks/months/total) or designation for man hours required.
If you identify a need and cannot acquire the human resources, then something in the financial data will likely need to change to reflect this gap (such as, changes to ROI, schedules, etc.). For gaps, identify what period this gap is referencing – over the life of the project, several weeks/months, etc.
Zero (0) in the table means that no additional resources are required or that the required area has enough personnel to cover the need.
Function Man Hours Req’d
Resource Add
Status Reason for Need
Need Date
Comments
Backend 3 2
Front End 0
NVE
© 2015 Micron Technology Inc. | Micron ConfidentialPage 37 Revision Date: August 30, 2016
PLM Business Playbook
DEG
ACG
Quality
Sales
BU
R&D
Supply ChainOther
Table 10: Human Capital Requirement Gaps Identification
Go to the Table of Contents
7.15 Critical Risks
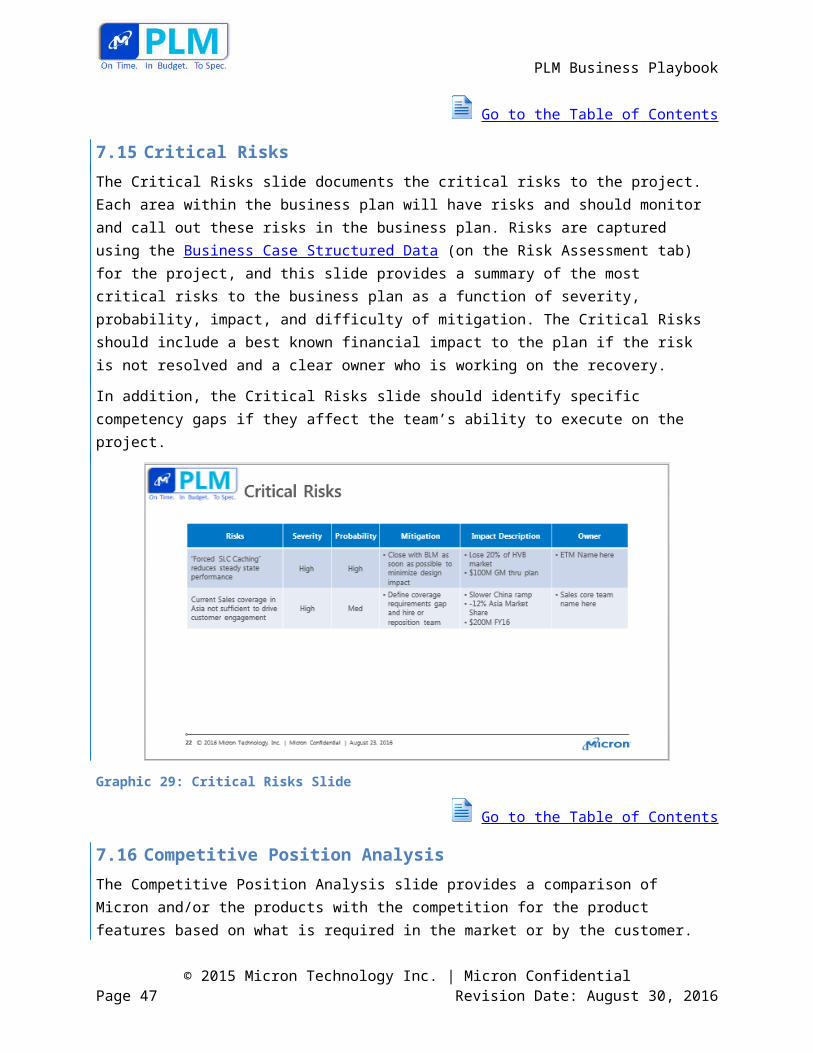
The Critical Risks slide documents the critical risks to the project. Each area within the business plan will have risks and should monitor and call out these risks in the business plan. Risks are captured using the Business Case Structured Data (on the Risk Assessment tab) for the project, and this slide provides a summary of the most critical risks to the business plan as a function of severity, probability, impact, and difficulty of mitigation. The Critical Risks should include a best known financial impact to the plan if the risk is not resolved and a clear owner who is working on the recovery.
In addition, the Critical Risks slide should identify specific competency gaps if they affect the team’s ability to execute on the project.
Graphic 29: Critical Risks Slide
© 2015 Micron Technology Inc. | Micron ConfidentialPage 38 Revision Date: August 30, 2016
PLM Business Playbook
Go to the Table of Contents
7.16 Competitive Position Analysis
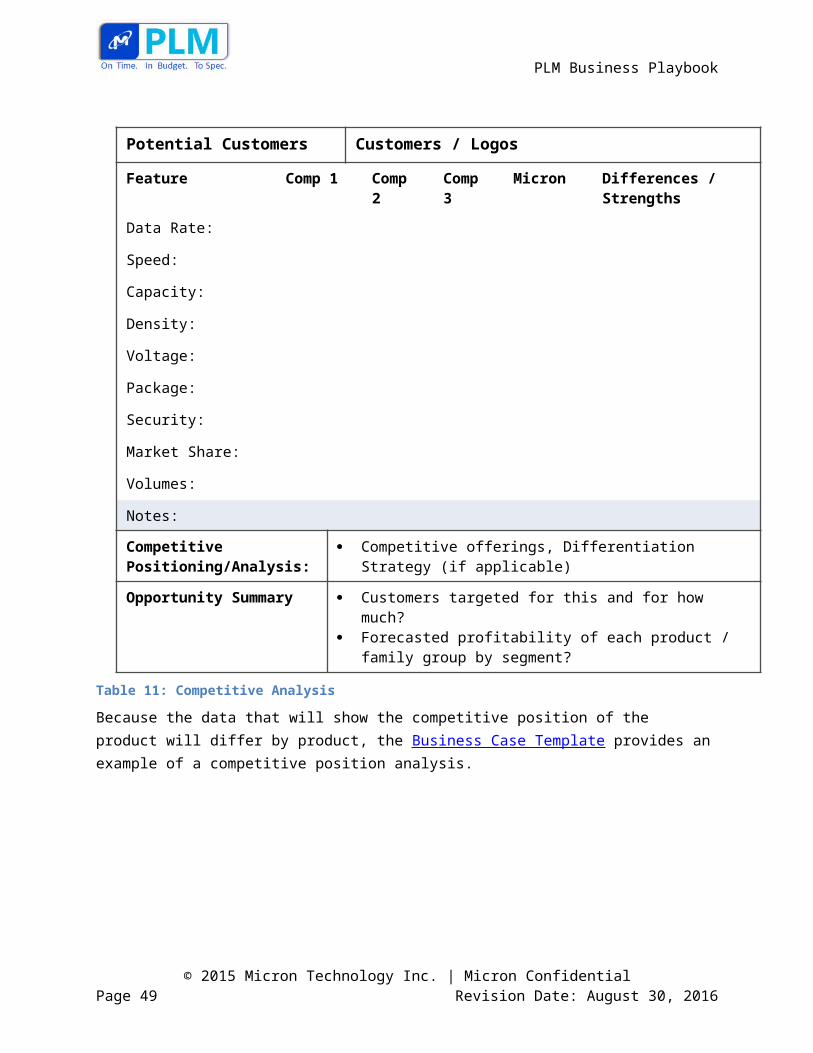
The Competitive Position Analysis slide provides a comparison of Micron and/or the products with the competition for the product features based on what is required in the market or by the customer.
The format of this data will vary by Business Unit or area. At a minimum, the following features are compared: Data Rates, Speed, Capacity, Densities, Packages, Voltages, and Security details. In addition, you must identify the related market share and volumes for Micron and competitors.
© 2015 Micron Technology Inc. | Micron ConfidentialPage 39 Revision Date: August 30, 2016
PLM Business Playbook
Potential Customers Customers / Logos
Feature Comp 1 Comp 2 Comp 3 Micron Differences / Strengths
Data Rate:
Speed:
Capacity:
Density:
Voltage:
Package:
Security:
Market Share:
Volumes:
Notes:
Competitive Positioning/Analysis:
Competitive offerings, Differentiation Strategy (if applicable)
Opportunity Summary Customers targeted for this and for how much? Forecasted profitability of each product / family group by
segment?
Table 11: Competitive Analysis
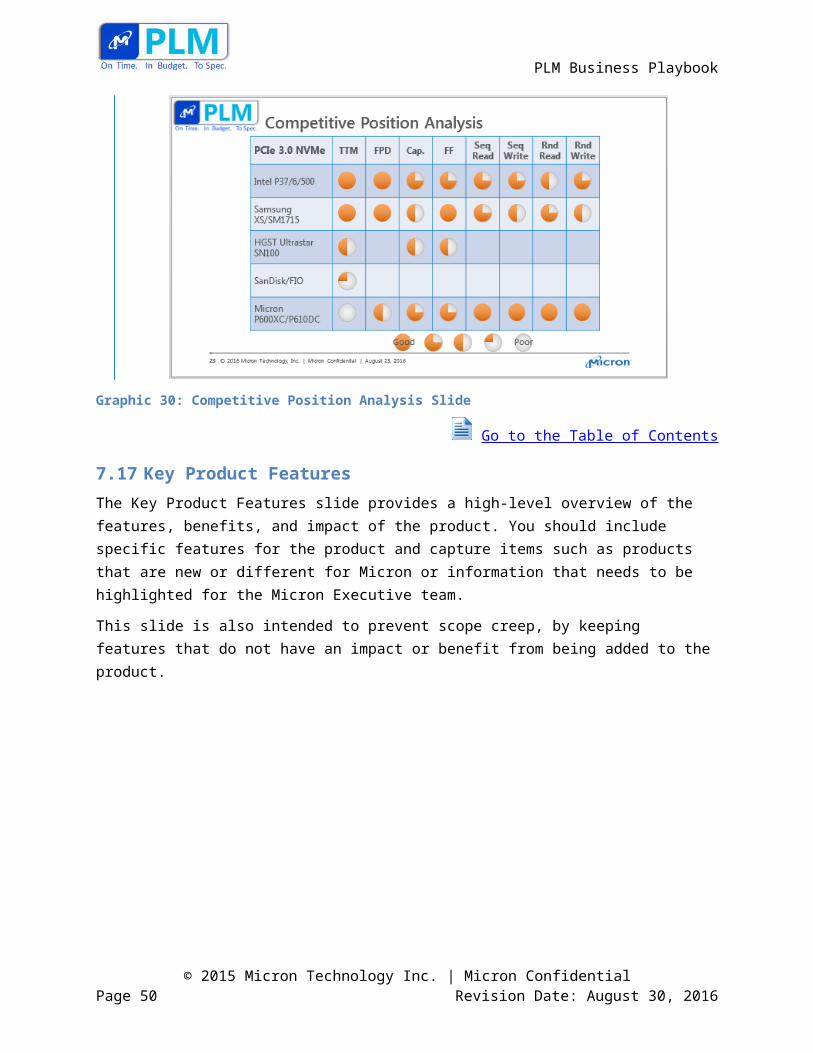
Because the data that will show the competitive position of the product will differ by product, the Business Case Template provides an example of a competitive position analysis.
© 2015 Micron Technology Inc. | Micron ConfidentialPage 40 Revision Date: August 30, 2016
PLM Business Playbook
Graphic 30: Competitive Position Analysis Slide
Go to the Table of Contents
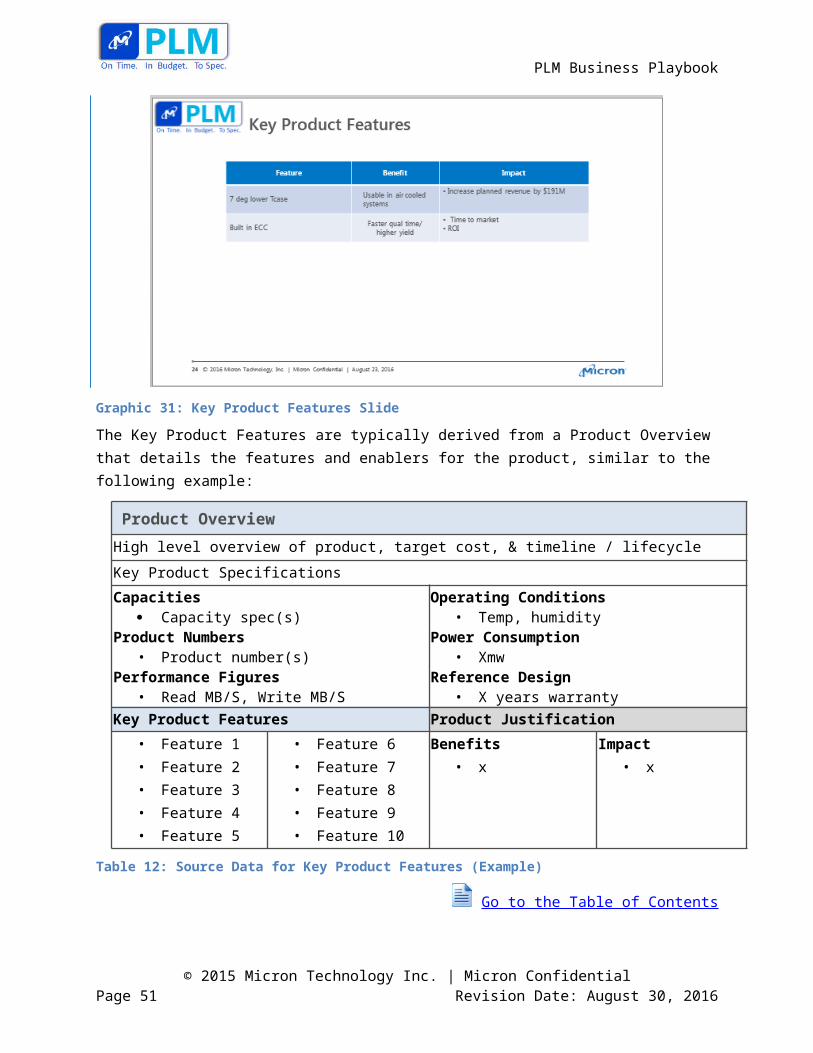
7.17 Key Product Features
The Key Product Features slide provides a high-level overview of the features, benefits, and impact of the product. You should include specific features for the product and capture items such as products that are new or different for Micron or information that needs to be highlighted for the Micron Executive team.
This slide is also intended to prevent scope creep, by keeping features that do not have an impact or benefit from being added to the product.
Graphic 31: Key Product Features Slide
© 2015 Micron Technology Inc. | Micron ConfidentialPage 41 Revision Date: August 30, 2016
PLM Business Playbook
The Key Product Features are typically derived from a Product Overview that details the features and enablers for the product, similar to the following example:
Product Overview High level overview of product, target cost, & timeline / lifecycle
Key Product Specifications Capacities
Capacity spec(s) Product Numbers
• Product number(s)Performance Figures
• Read MB/S, Write MB/S
Operating Conditions• Temp, humidity
Power Consumption• Xmw
Reference Design • X years warranty
Key Product Features Product Justification • Feature 1• Feature 2• Feature 3• Feature 4• Feature 5
• Feature 6• Feature 7• Feature 8• Feature 9• Feature 10
Benefits• x
Impact• x
Table 12: Source Data for Key Product Features (Example)
Go to the Table of Contents
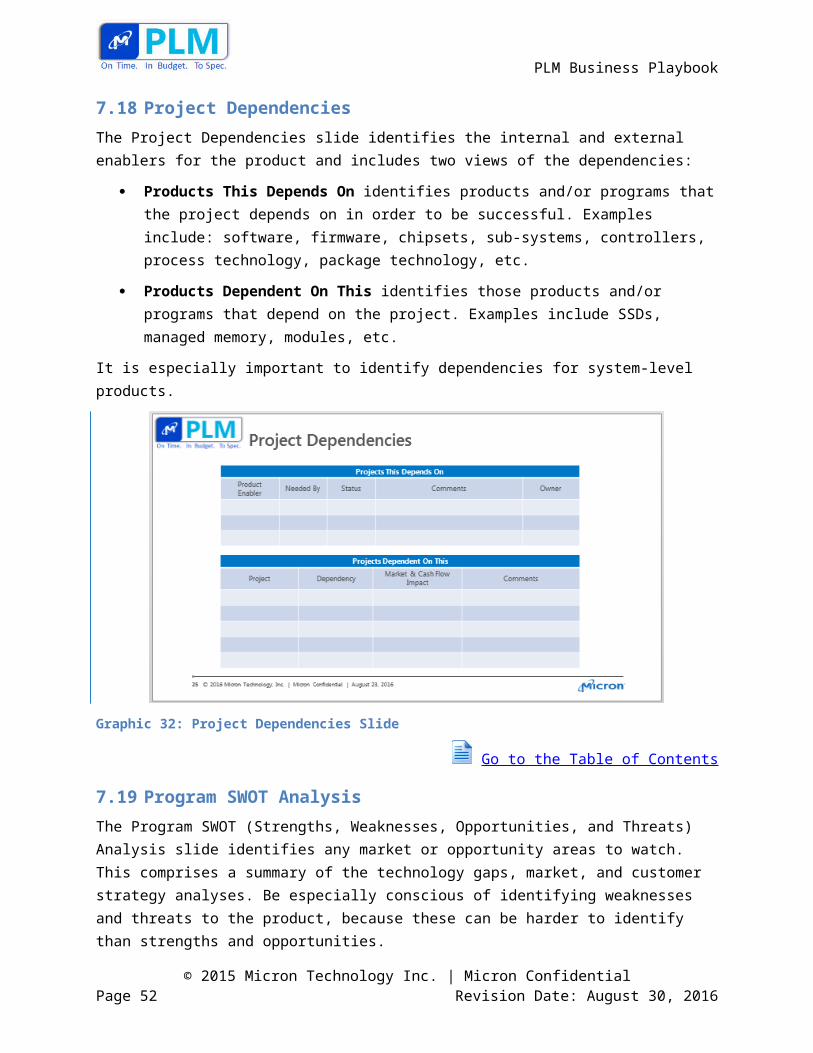
7.18 Project Dependencies
The Project Dependencies slide identifies the internal and external enablers for the product and includes two views of the dependencies:
Products This Depends On identifies products and/or programs that the project depends on in order to be successful. Examples include: software, firmware, chipsets, sub-systems, controllers, process technology, package technology, etc.
Products Dependent On This identifies those products and/or programs that depend on the project. Examples include SSDs, managed memory, modules, etc.
It is especially important to identify dependencies for system-level products.
© 2015 Micron Technology Inc. | Micron ConfidentialPage 42 Revision Date: August 30, 2016
PLM Business Playbook
Graphic 32: Project Dependencies Slide
Go to the Table of Contents
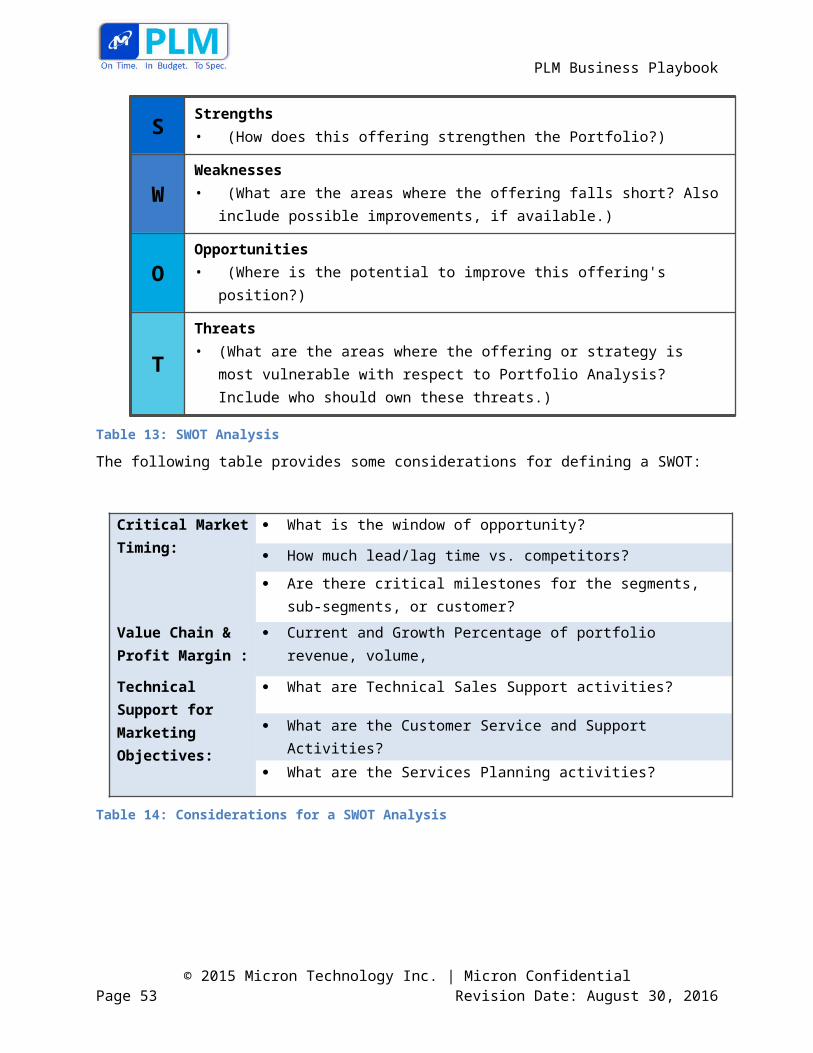
7.19 Program SWOT Analysis
The Program SWOT (Strengths, Weaknesses, Opportunities, and Threats) Analysis slide identifies any market or opportunity areas to watch. This comprises a summary of the technology gaps, market, and customer strategy analyses. Be especially conscious of identifying weaknesses and threats to the product, because these can be harder to identify than strengths and opportunities.
SStrengths• (How does this offering strengthen the Portfolio?)
WWeaknesses• (What are the areas where the offering falls short? Also include possible
improvements, if available.)
OOpportunities• (Where is the potential to improve this offering's position?)
TThreats• (What are the areas where the offering or strategy is most vulnerable with respect to
Portfolio Analysis? Include who should own these threats.)
Table 13: SWOT Analysis
The following table provides some considerations for defining a SWOT:
Critical Market What is the window of opportunity?
© 2015 Micron Technology Inc. | Micron ConfidentialPage 43 Revision Date: August 30, 2016
PLM Business Playbook
Timing: How much lead/lag time vs. competitors?
Are there critical milestones for the segments, sub-segments, or customer?
Value Chain & Profit Margin :
Current and Growth Percentage of portfolio revenue, volume,
Technical Support for Marketing Objectives:
What are Technical Sales Support activities?
What are the Customer Service and Support Activities?
What are the Services Planning activities?
Table 14: Considerations for a SWOT Analysis
Graphic 33: Program SWOT Analysis Slide
Go to the Table of Contents
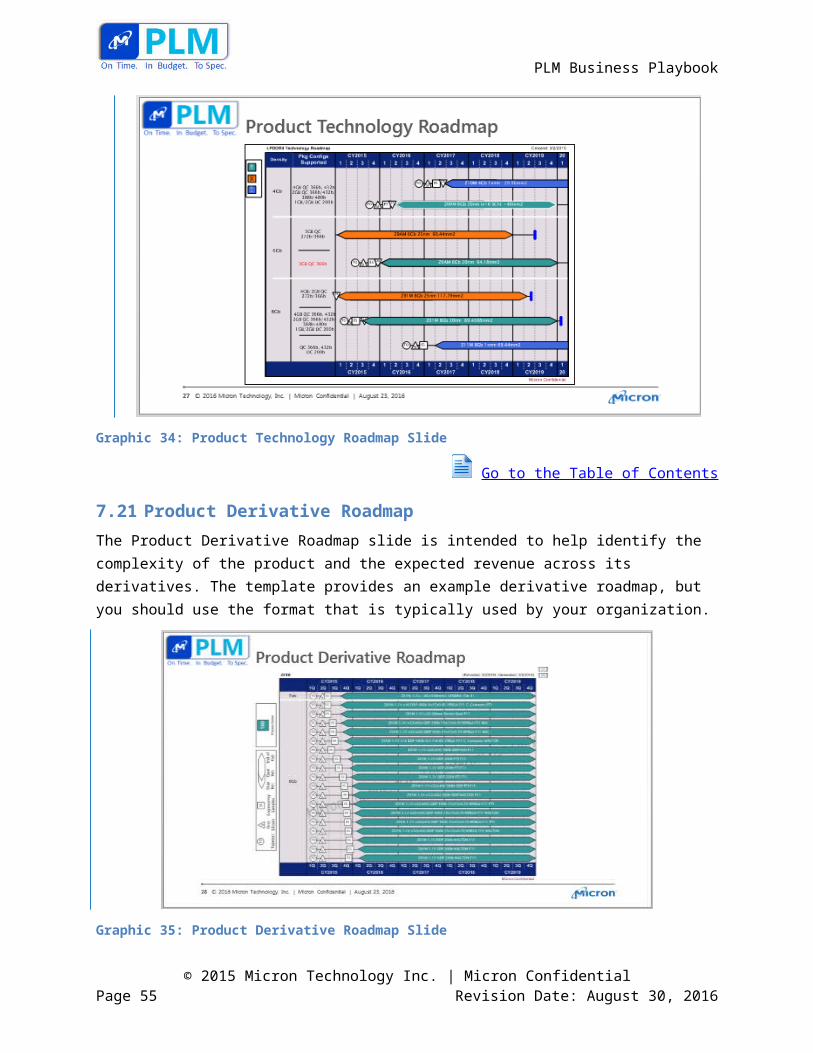
7.20 Product Technology Roadmap
The Product Technology Roadmap slide displays the new product’s positioning based on the key features. The Business Case Template provides an example of a technology roadmap and shows the product compared to other products in the different swim lanes. However, you should replace the example with a roadmap that uses the format most commonly used by your Business Unit or area.
© 2015 Micron Technology Inc. | Micron ConfidentialPage 44 Revision Date: August 30, 2016
PLM Business Playbook
Graphic 34: Product Technology Roadmap Slide
Go to the Table of Contents
7.21 Product Derivative Roadmap
The Product Derivative Roadmap slide is intended to help identify the complexity of the product and the expected revenue across its derivatives. The template provides an example derivative roadmap, but you should use the format that is typically used by your organization.
Graphic 35: Product Derivative Roadmap Slide
Go to the Table of Contents
© 2015 Micron Technology Inc. | Micron ConfidentialPage 45 Revision Date: August 30, 2016
PLM Business Playbook
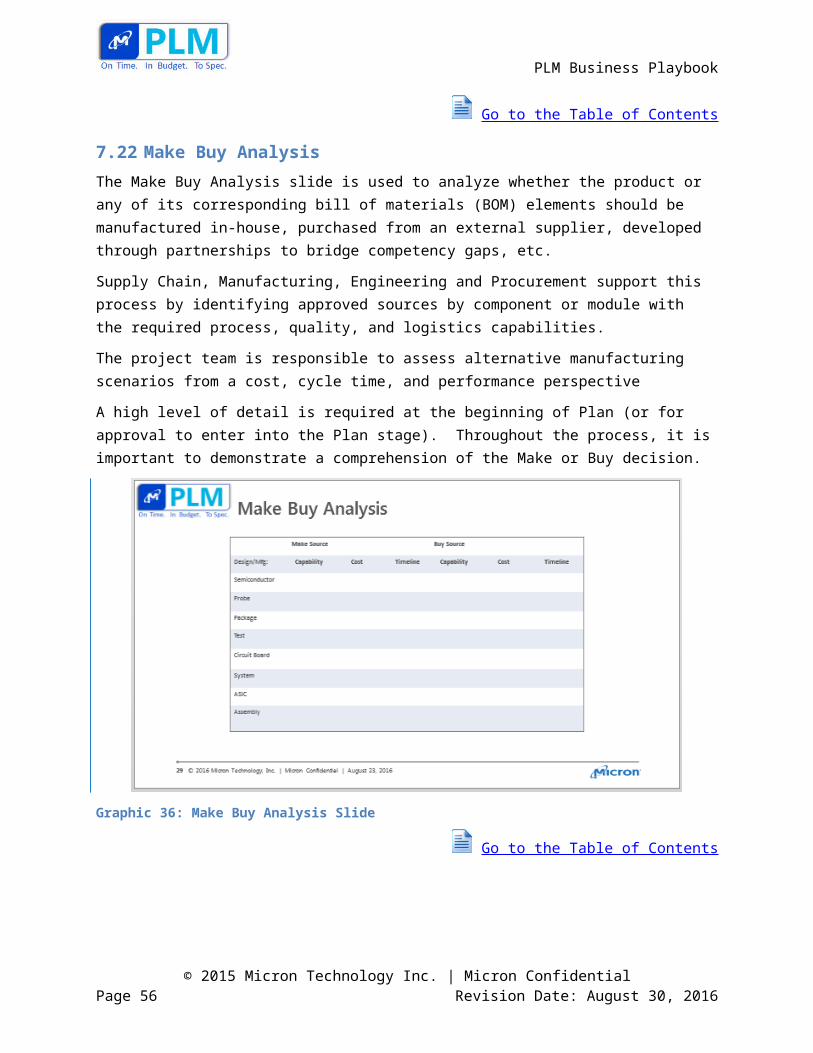
7.22 Make Buy Analysis
The Make Buy Analysis slide is used to analyze whether the product or any of its corresponding bill of materials (BOM) elements should be manufactured in-house, purchased from an external supplier, developed through partnerships to bridge competency gaps, etc.
Supply Chain, Manufacturing, Engineering and Procurement support this process by identifying approved sources by component or module with the required process, quality, and logistics capabilities.
The project team is responsible to assess alternative manufacturing scenarios from a cost, cycle time, and performance perspective
A high level of detail is required at the beginning of Plan (or for approval to enter into the Plan stage). Throughout the process, it is important to demonstrate a comprehension of the Make or Buy decision.
Graphic 36: Make Buy Analysis Slide
Go to the Table of Contents
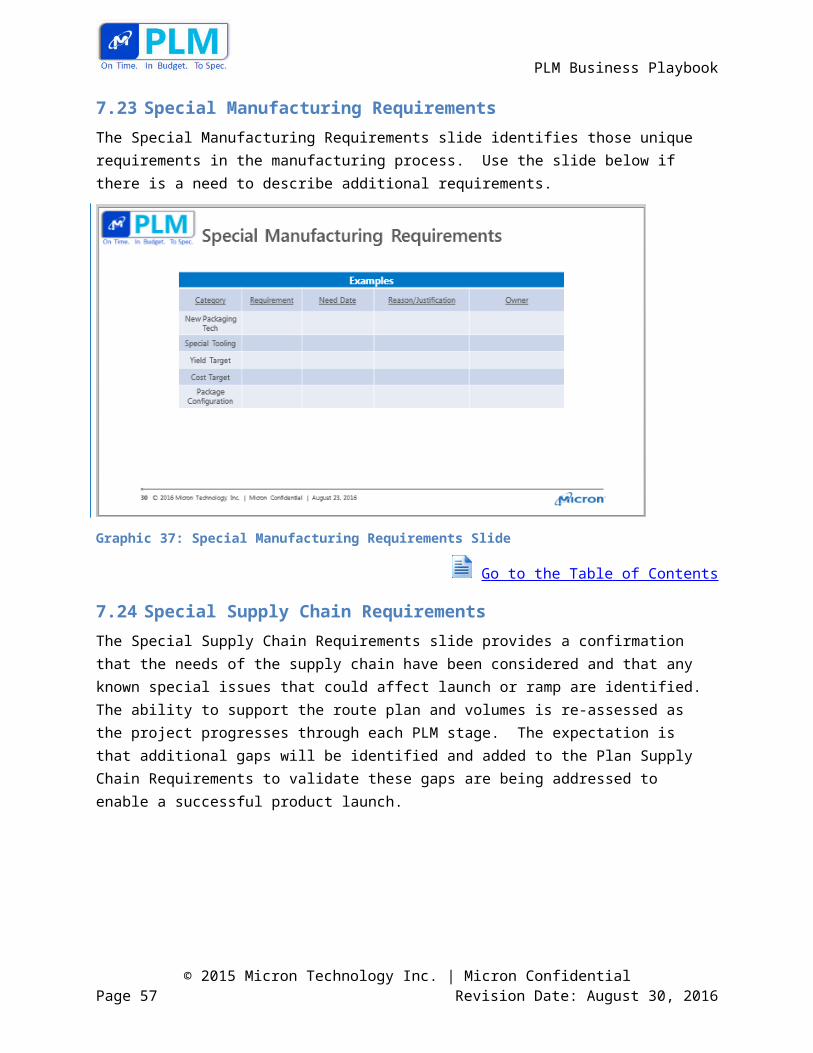
7.23 Special Manufacturing Requirements
The Special Manufacturing Requirements slide identifies those unique requirements in the manufacturing process. Use the slide below if there is a need to describe additional requirements.
© 2015 Micron Technology Inc. | Micron ConfidentialPage 46 Revision Date: August 30, 2016
PLM Business Playbook
Graphic 37: Special Manufacturing Requirements Slide
Go to the Table of Contents
7.24 Special Supply Chain Requirements
The Special Supply Chain Requirements slide provides a confirmation that the needs of the supply chain have been considered and that any known special issues that could affect launch or ramp are identified. The ability to support the route plan and volumes is re-assessed as the project progresses through each PLM stage. The expectation is that additional gaps will be identified and added to the Plan Supply Chain Requirements to validate these gaps are being addressed to enable a successful product launch.
© 2015 Micron Technology Inc. | Micron ConfidentialPage 47 Revision Date: August 30, 2016
PLM Business Playbook
Graphic 38: Supply Chain Requirements Slide
Go to the Table of Contents
7.25 Plan Milestones
The Plan Milestones slide identifies the project’s critical milestones for each product or product group in scope. A high level of detail is required at the beginning of Plan (or for approval to enter into the Plan stage).
Currently, this information is extracted from Agile, but, in future, it will be extracted from the Teamcenter key milestone schedule.
© 2015 Micron Technology Inc. | Micron ConfidentialPage 48 Revision Date: August 30, 2016
PLM Business Playbook
Graphic 39: Plan Milestones Slide
7.26 Customer Services and Support Plan
The Customer Service and Support Plan slide is completed to show that the team has considered what it will take to provide service and support to the customer throughout the sales process until the scheduled end of life. The details as outlined on the slide will show that a plan has been comprehended and documented.
Graphic 40: Customer Services and Support Plan Slide
Go to the Table of Contents
© 2015 Micron Technology Inc. | Micron ConfidentialPage 49 Revision Date: August 30, 2016
PLM Business Playbook
7.27 Core Team: Response
As an input to the Stage Gate Review, every member of the Core Team should be polled to determine whether a Go, No-Go, Decision-Deferred, or Hold action should be taken. This information is captured on the Core Team: Response slide, which should also include any specific comments that the members of the Core Team may have regarding their decision. The ultimate decision is up to the Business Line Manager, but this tracks concerns called out by the various departments.
Graphic 41: Core Team: Response Slide
8. Using the PLM Documents Site
All business cases are stored in the PLM Documents SharePoint site (alias: plmdocs). The expectation is that the business case is updated as it progresses through the various Stage Gate reviews. The PLM Documents site can be accessed from the PLM Documents link on the PLM site (alias: plmnew):
© 2015 Micron Technology Inc. | Micron ConfidentialPage 50 Revision Date: August 30, 2016
PLM Business Playbook
Graphic 42: Accessing the PLM Documents Site
8.1 Adding a Document to the PLM Documents Site
1. Go to PLM Documents SharePoint site (alias: plmdocs).
2. Click Upload.
Graphic 43: Upload Document
The Add a Document dialog box displays.
© 2015 Micron Technology Inc. | Micron ConfidentialPage 51 Revision Date: August 30, 2016
PLM Business Playbook
Graphic 44: Add a Document
Note: If you are uploading an updated version of a business case or a business case element, ensure that (a) the file name exactly matches the existing file and that (b) Add as new version to existing file is selected.
3. Click Browse to locate the file on your computer, and then click Open to upload the file. After the file is uploaded, the following form displays:
Graphic 45: Upload Successful Message
4. Complete the fields on the form. An asterisk * indicates that the information for the field is required.
Field ActionContent Type Select Document.Name* If needed, type a new name for the document. Product Group* Select the appropriate product group, such as Automata or DRAM,
from the drop-down list.Project ID* Select the appropriate product group from the drop-down listPLM Stage* Select the appropriate stage for the business case, such as Concept
Approval, Plan, Design, etc.Deliverable* Select the appropriate deliverable (business case element) from the
drop-down list.
© 2015 Micron Technology Inc. | Micron ConfidentialPage 52 Revision Date: August 30, 2016
PLM Business Playbook
Field ActionBLM* Type the name or e-mail address of the Business Lead Manager for
the project.DID If applicable, select the appropriate design ID from the drop-down
list.Contains If the project requires specific parts, select the parts, and then click
Add> to move them to the selection box.
Table 15: Document Information Fields
5. Click Save to save your business case or business case element.
Go to the Table of Contents
8.2 Updating an Existing Business Case
1. Go to PLM Documents SharePoint site (alias: plmdocs).
2. Open the appropriate Product Group to locate your document.
3. Click the ellipses (…) that are to the right of the document name. A preview window, similar to the following, displays.
Graphic 46: Click the Ellipses (...) to Preview the Business Case
4. Select Edit. The Business Case opens in PowerPoint, and the following message displays:
Graphic 47: PowerPoint Read-Only Message
5. Click Edit Presentation to open an editable version of the Business Case.
6. Make the updates to your Business Case, and save the changes. 7. When you are finished making updates, close the Business Case. You will receive a message
about whether you want to check in the document.
© 2015 Micron Technology Inc. | Micron ConfidentialPage 53 Revision Date: August 30, 2016
PLM Business Playbook
Graphic 48: Check-in Message
8. Click Yes. The Check In dialog box displays.
Graphic 49: Version Comments Dialog Box
9. Provide comments about the changes you made to the business case, and then click OK to check the business case back into the PLM Documents library.
Go to the Table of Contents
9. Dependencies and Data Inputs
This section describes the dependencies between the different business case examples and the data inputs by Information Category. While the Business Elements Standard Elements section included the data inputs for each specific element, if available, this section compares and contrasts the data sources for each category of information.
9.1 Dependencies
The table below shows the different business case examples and how they are dependent on others. These dependencies are required to be in the project plan.
Section Business Case Element DependencyProject & Finance Executive Summary All Elements Required to be completeMarket Market Size and Opportunity Market Value Proposition
Market Go to Market Market Size and Opportunity, Value Proposition
Product Requirements
Product Technology RoadmapProduct Derivative Roadmap
Go to Market
Project & Finance Financial Summary Make Buy Analysis, Human Capital Requirements (Gaps), Market Size and Opportunity
© 2015 Micron Technology Inc. | Micron ConfidentialPage 54 Revision Date: August 30, 2016
PLM Business Playbook
Section Business Case Element DependencyPlans & Schedules
Resource & Milestone Plan Product Overview, Roadmaps, Manufacturing Plan, Supply Chain Requirements
Product Requirements
Make / Buy Analysis Product Overview
Plans & Schedules
Risks & Mitigation Plan All Elements Required to be completePlans & Schedules
Special Manufacturing Requirements
Make /Buy Analysis
Plans & Schedules
Supply Chain Requirements Mfg Plan and any Special Requirements, Market Opportunity AnalysisProduct Customer Service & Support Product Overview
Table 16: Dependencies for Business Case Elements
Go to the Table of Contents
9.2 Inputs to the Marketing Business Elements
The elements for the Marketing Business Case are made up of the following inputs. The sources for these inputs are provided in Appendix: Input Sources. The Market Case elements are shown on the table below.
Input Market Size and Opportunity
Value Proposition Go to Market
Branding Strategy (Alignment) YMarket Segment Analysis Y YMarket Share Analysis Y YMarket Model YGuard bands YCustomer Assessment Y YCustomer Segment Strategy Y Y YCustomer Requirements Y YCompetitive Analysis Y YTechnology Gaps YProduct Mix Strategy Y YPortfolio Strategy YDocumented / Customer Ecosystem Y YSuccess Criteria YDifferentiation Strategy Y
Table 17: Inputs to the Marketing Business Elements
Go to the Table of Contents
© 2015 Micron Technology Inc. | Micron ConfidentialPage 55 Revision Date: August 30, 2016
PLM Business Playbook
9.3 Inputs to the Project & Finance Elements
Examples of inputs for developing the Financial business case elements are defined in the table below. The input sources for these elements are identified in Appendix: Input Sources.
The Project & Finance Business Case elements are shown on the table below:
Executive Summary
Financial Analysis
Input Executive Summary Financial AnalysisExplicit reasons for project YInitial Feasibility Report YScope, Schedule & Budget YAll Business Case Elements YGap ReviewProduct Cost Analysis YDevelopment Cost Analysis YPreliminary Financial Analysis YMargin Analysis YAssumptions used in the Plan (cost profile, etc.) YManufacturing Resource Plan YSensitivity Analysis Parameters (price, Volume, Cost) YGuard Bands (yield, ASP, Cost, etc.) YValue Proposition YRisk & Mitigation PlanTimeline, Schedule & DependenciesGap Analysis & Closure PlanPlan AssumptionsArchitecture (Tops down engineering Plan sufficient to enable schedule, scope & resource)Financial Analysis
Table 18: Inputs to the Project & Finance Elements
Go to the Table of Contents
10. Sample Business Cases
For samples of business cases, see the PLM Documents Site (alias: plmdocs).
© 2015 Micron Technology Inc. | Micron ConfidentialPage 56 Revision Date: August 30, 2016
PLM Business Playbook
Go to the Table of Contents
11. Revision History
Revision Date: August 23, 2016
Section Description of Change
1 Added note that Changes to this version of the PLM Business Case Playbook are indicated by a bar to the left of the paragraph.Updated the Graphic 1 of PLM process. Added note about why the stages overlap each other in the diagram.
2 Updated the Graphic 2 of the PLM process and stage gate reviews.
2.1 Updated Graphic 3 of Fast Track/Robust projects. Added text that, for Fast Track projects, SG1 and 2 may be combined and that SG3 is not required
4.1 Updated Graphic 4 of Stage Gate Entrance Criteria.
4.4 Updated Graphic 5 of the PLM Process Emphasis on the Plan Stage
6 Updated Graphic 7 of the Baseline Business Case.
7.1 Updated Graphic 13 to match the latest version of the Business Case template.
7.2 Updated Graphic 14 to match the latest version of the Business Case template.
7.3 Updated Graphic 15 to match the latest version of the Business Case template.
7.4 Updated Graphic 16 to match the latest version of the Business Case template.
7.5 Updated Graphic 17 to match the latest version of the Business Case template.
7.6 Updated Graphic 18 to match the latest version of the Business Case template.
7.7 Updated Graphic 19 to match the latest version of the Business Case template.
7.8 Updated Graphic 21 to match the latest version of the Business Case template.
7.9 Updated Graphic 23 to match the latest version of the Business Case template.
7.10 Changed Section name from Market Volume and Segment to Market Size and Opportunity to match actual slide title. Also changed wording in first paragraph of Section 7.10 to match as well.
7.11 Updated Graphic 26 to match the latest version of the Business Case template. Also updated title of Section 7.11 (and supporting text) to reflect actual name of the slide.
7.12 Updated Graphic 28 to match the latest version of the Business Case template.
7.15 Changed Section name from Risk and Mitigation Plan to Critical Risks to match actual name of the slide. Updated Graphic 29 to match the latest version of the Business Case template.
7.16 Updated the name of Section 7.16 from Competitive Analysis to Competitive Position Analysis to match actual name of the slide and updated references to title in the text. Updated Graphic 30 to match the latest version of the Business Case template.
7.17 Updated Graphic 31 to match the latest version of the Business Case template.
© 2015 Micron Technology Inc. | Micron ConfidentialPage 57 Revision Date: August 30, 2016
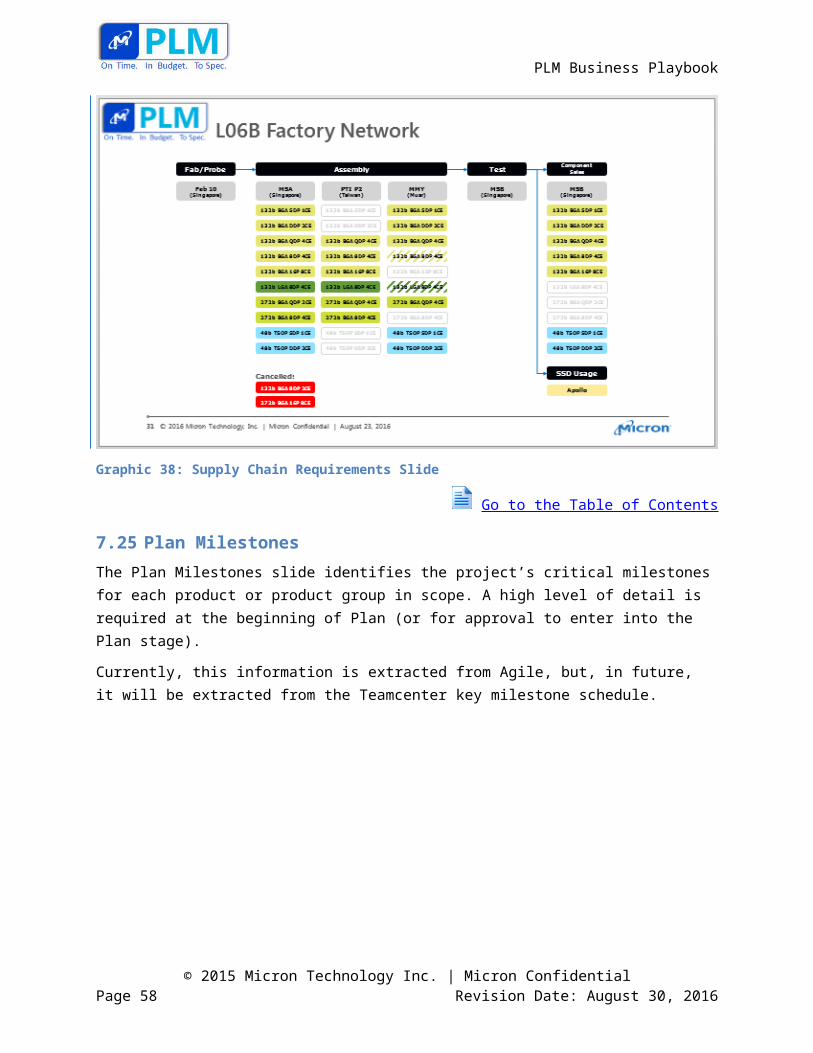
PLM Business Playbook
Revision Date: August 23, 2016
Section Description of Change
7.18 Updated Graphic 32 to match the latest version of the Business Case template.
7.19 Updated Graphic 33 to match the latest version of the Business Case template.
7.20 Updated Graphic 34 to match the latest version of the Business Case template.
7.21 Updated Graphic 35 to match the latest version of the Business Case template.
7.22 Updated Graphic 36 to match the latest version of the Business Case template.
7.23 Updated Graphic 37 to match the latest version of the Business Case template.
7.24 Updated Graphic 38 to match the latest version of the Business Case template.
7.25 Updated Graphic 39 to match the latest version of the Business Case template.
7.26 Moved Customer Service and Support Plan section to after Plan Milestones section to reflect actual order of the slides in the Business Case template. Updated Graphic 40 to match the latest version of the Business Case template.
7.27 Added new section on the Core Team: Response slide.
8 Updated Graphic 42 to show the updated PLM web site
Revision Date: February 9, 2016
Section Description of Change
2.1 Added additional information about First of a Kind (FOAK) products
Revision Date: January 22, 2016
Section Description of Change
7.25 Updated Plan Supply Chain Requirements slide
Revision Date: December 1, 2015
Section Description of Change
Notes Added link to the Revision History
1. Replaced the first paragraph with the current PLM process purpose and replaced the PLM process map with the most recent version.
2 Replaced Graphic 2 with an updated version.
2.1 Clarified expectations around Robust and Fast Track projects. Also added information that child projects from Robust projects will be Fast Track and can use data from parent for the initial business case.
© 2015 Micron Technology Inc. | Micron ConfidentialPage 58 Revision Date: August 30, 2016
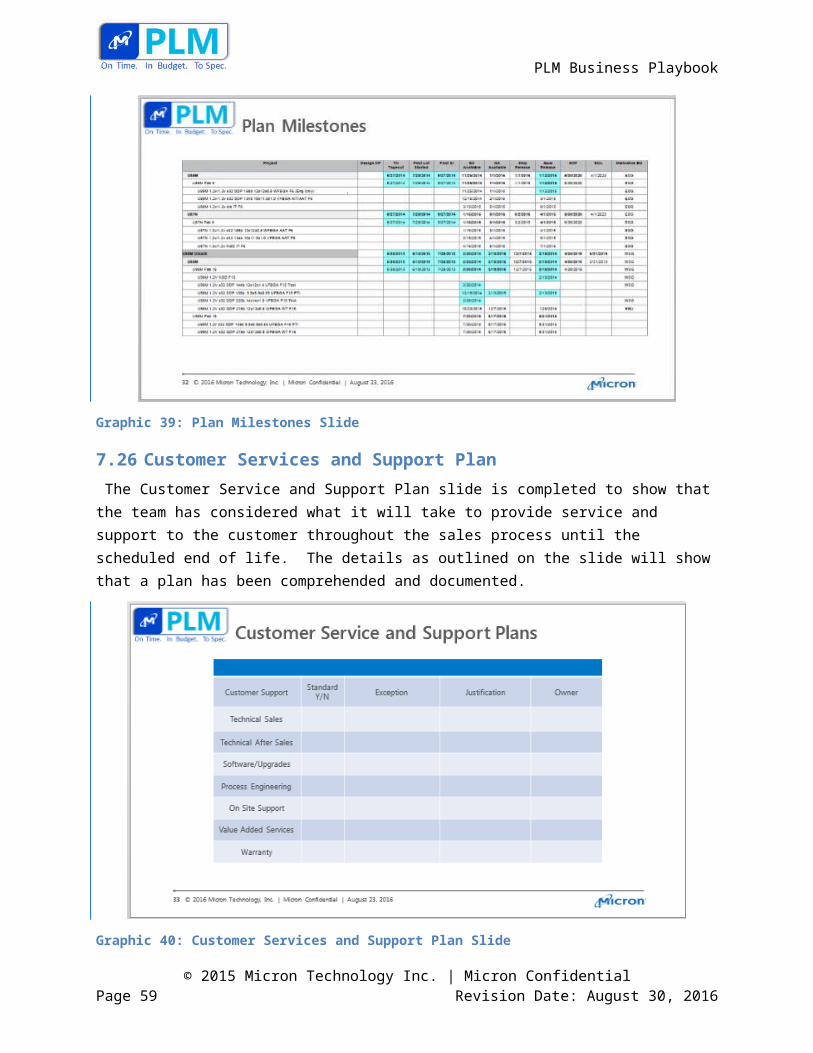
PLM Business Playbook
Revision Date: December 1, 2015
Section Description of Change
4.2 Clarified that all elements must be complete prior to having a Stage Gate Review. The previous version implied that the decision to move into a Stage Gate Review was subjective.
4.4 Clarified membership expectations for projects (Table 3). Also updated which members of the core team are responsible for creating the business case.
5.1 Updated Graphic 6 (Process Steps Associated with Plan Stage) to match the current interactive map view of the Plan Stage. Also added a link to the Plan interactive map
5.3 Clarified expectations regarding expected completeness of business-case elements to exit the Plan stage and move to the Design stage.
7.1 Replaced Graphic 8 with an updated version
8.6 (Second paragraph) Added a note that fast track projects do not require NPV or Opportunity Cost so this data will be blank in the structured data template.
9.0 Added information on how to access the PLM Documents site from the PLM site. Also added screenshot of the correct icon to click to access PLM documents (Graphic 40).
Appendix Move the appendix to the end of the document (rather in front of the link to the sample business cases)
Revision Date: July 12, 2016
2.0 Added the PLM RACI
Go to the Table of Contents
12. Appendices
12.1 Input Sources
Inputs Sources Links
Architecture (top down engineering Plan sufficient to enable schedule scope and resources
NVE: PE/DE Consolidated by PDTL in POR presentation
NVE: http://pwaprod.micron.com/PWA/NVE01/Reference%20Documents/POR/B95A%20PDT%20POR%20Review.pptx
Assumptions used in Plan (cost profile, etc.)
NVE: PE/DE Consolidated by PDTL in POR presentation (slide 6)
FIN: Excel, Financial Forecast, PowerPoint
NVE: http://pwaprod.micron.com/PWA/NVE01/Reference%20Documents/POR/B95A%20PDT%20POR%20Review.pptx
Branding Strategy (Alignment)
Not Provided Not Provided
© 2015 Micron Technology Inc. | Micron ConfidentialPage 59 Revision Date: August 30, 2016
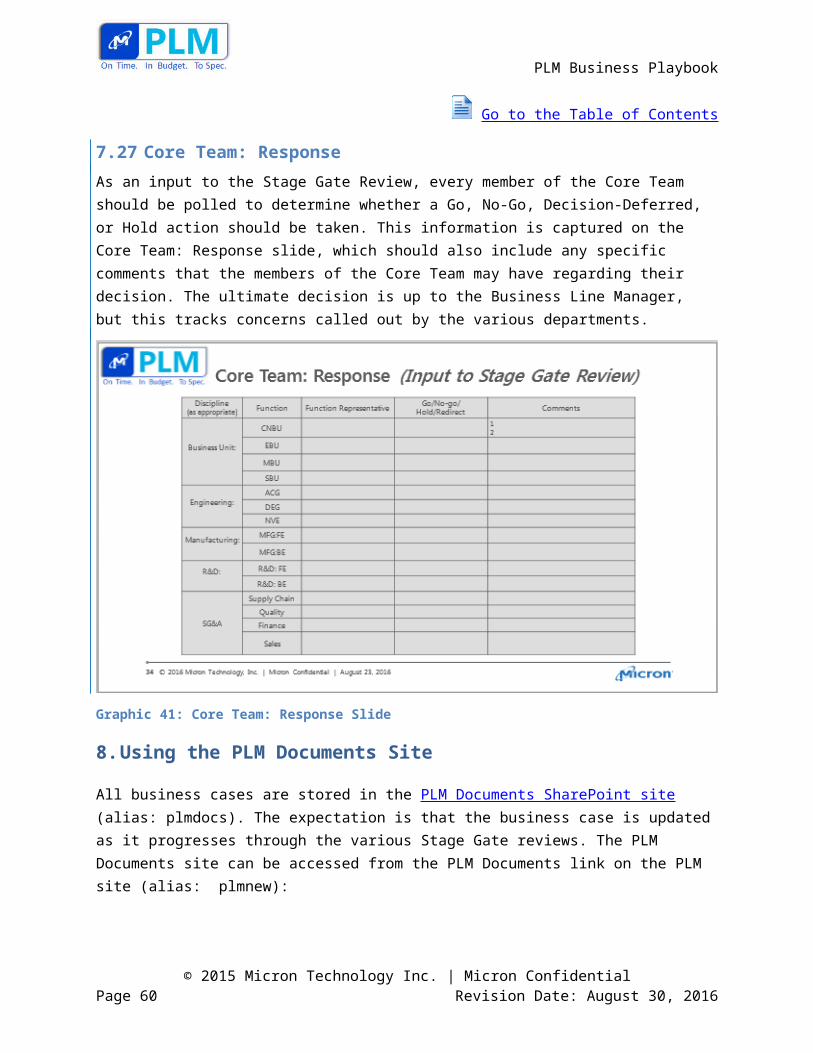
PLM Business Playbook
Inputs Sources Links
Competitive Analysis NVE: BU Marketing via POP Kick-Off Presentation
SSG: Analyst reports, similar horizontal product comparisons
EBU: Competitive analysis reports, analyst reports
9. NVE: http://pwaprod.micron.com/PWA/NVE01/Reference%20Documents/Kick-Off/B95A%20Kickoff%20%20SBS%20043014.pptx
EBU: Competitive analysis info stored at ESG CI http://collab.micron.com/corp/esg/CI/default.aspx(Information used includes competitive performance benchmarking, die size analysis, competitive cost projections, etc.)
Market research/analyst reports from
http://edc.micron.com/MTI/FIN013/NewRes/Forms/AllItems.aspx
Cost Analysis (Investment, Price, Point) Development, Manufacturing (including resources, Capex, headcount, "big ticket" costs)
FIN: TM1, Cognos Connection, Cognos Analyst Cubes, Data Warehouse Development Cost Analysis: Design Engineers - Future should be Engineering Finance (Fred's team)
Not Provided
Cost of Recommendations (Product, Sub-components, sourcing design)
Not Provided Not Provided
Customer Requirements NVE: BU Marketing via POP Kick-Off Presentation
SSG: Customer discussions, Marketing/FAE/Sales/BDM feedback, ecosystem partner discussions
EBU :SFDC, customer discussions, info from FAEs/sales and BDMs, info from ecosystem enabling team in BU
NVE: http://pwaprod.micron.com/PWA/NVE01/Reference%20Documents/Kick-Off/B95A%20Kickoff%20%20SBS%20043014.pptx
Customer Segment Strategy
SSG: Marketing/FAE/Sales/BDM/Architect feedback.[SSG]: Business unit/sales/support/operations capabilities (e.g., OEM vs End
Not Provided
© 2015 Micron Technology Inc. | Micron ConfidentialPage 60 Revision Date: August 30, 2016
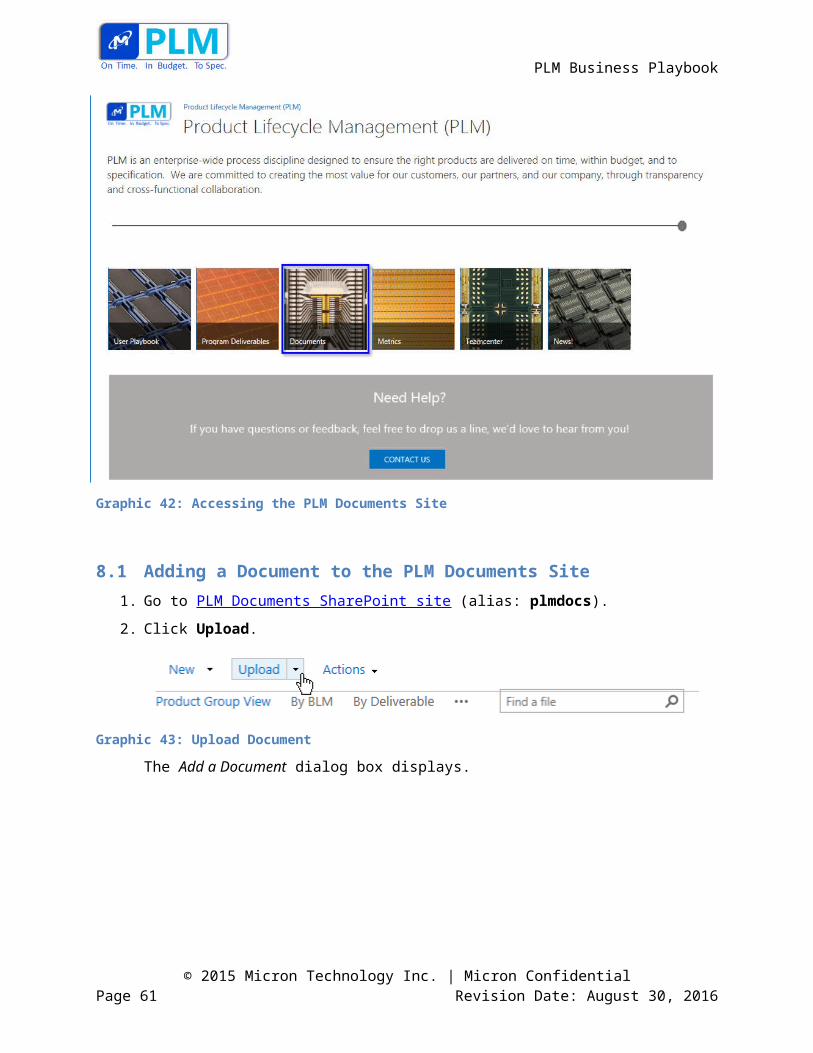
PLM Business Playbook
Inputs Sources Links
User)
EBU:SFDC , customer discussionsDatasheet NVE: BU APPS team, not available
until design review NVE: http://collab.micron.com/mktgsales/DRM/Lists/Design%20Reference%20Matrix/NAND.aspx?FilterName=Design%5Fx0020%5FID&FilterMultiValue=*B95A*
Differentiation Strategy SSG: Competitive analysis reports, market gaps of similar or horizontally comparable products
EBU: Competitive analysis reports
EBU: Competitive analysis info stored at ESG CI (http://collab.micron.com/corp/esg/CI/default.aspx(Information used includes competitive performance benchmarking, die size analysis, competitive cost projections etc.)
7. EBU: Sales profitability cubeEcosystem Requirements (3rd party enablers. ie. controller vendors, alliances, consortiums)
SSG: Customer discussions, Marketing/FAE/Sales/BDM feedback, ecosystem partner discussions
EBU :SFDC, customer discussions, info from FAEs/sales and BDMs, info from ecosystem enabling team in BU
Not Provided
End of Life Conditions & Target Date
Not Provided Not Provided
Engineering Resource Plan
Not Provided Not Provided
Engineering Wafer Allocation
Not Provided Not Provided
Explicit Reason for Project
Not Provided Not Provided
Financial Analysis Not Provided Not Provided Gap Analysis & Closure Plan
NVE: PE/DE Consolidated by PDTL in POR presentation (slide 9)
NVE: http://pwaprod.micron.com/PWA/NVE01/Reference%20Documents/POR/B95A%20PDT%20POR%20Review.pptx
Guard Bands (yield, ASP, Cost, etc.)
Not Provided Not Provided
Initial Feasibility Report NVE: Finance NVE: http://pwaprod.micron.com/PWA/NVE01/Reference%20Documents/B95A%20SCD.aspx
Initial Training Plan Not Provided Not Provided
© 2015 Micron Technology Inc. | Micron ConfidentialPage 61 Revision Date: August 30, 2016
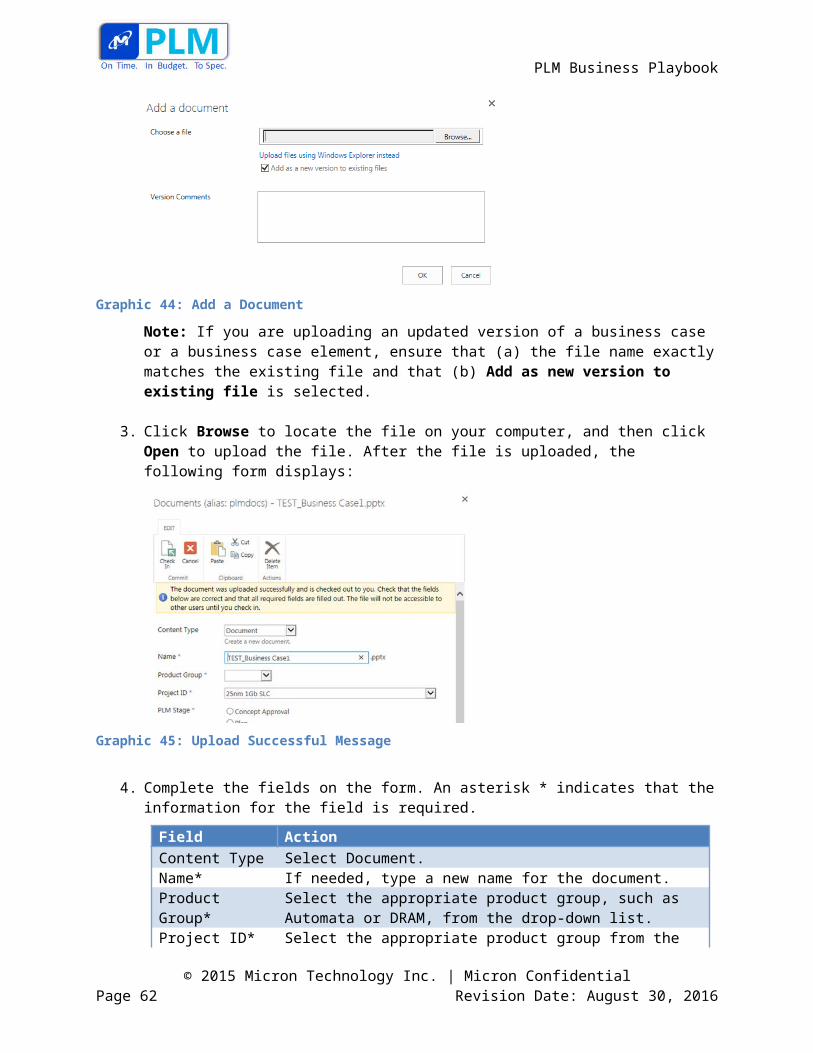
PLM Business Playbook
Inputs Sources Links
Lessons Learned Not Provided Not ProvidedList of Enabling Projects Not Provided Not Provided
Make/Buy Analysis Recommendations (Product, Sub-components, Sourcing, Design)
Not Provided Not Provided
Manufacturing & Equipment Capacity/capability Requirements
Not Provided Not Provided
Manufacturing & Resource Plan
FIN: PLM, Marketing Not Provided
Manufacturing Program Plan (Including Geographic view)
NVE: LPI/CTM but not well defined up front
FIN: Supply Response, Backend MFG
NVE: http://pwaprod.micron.com/PWA/NVE01/Project%20Documents/B95A%20PDT%20Dashboard.pptx
http://pwaprod.micron.com/PWA/NVE01/Project%20Documents/B95A%20Metrics.xlsm
Margin Analysis FIN: Excel, Cognos Analyst (SBU SSDs), Financial Forecast
Not Provided
Market Demand Not Provided Not Provided Market Model (FSG,BU) SSG: SSG market model
EBU: EBU Market model
EBU:
Market Share Analysis SSG: TAM/SAM/SOM model, customer discussions
EBU:BU market model , FSG market data, analyst reports, customer QBR decks
EBU: Market research/analyst reports http://edc.micron.com/MTI/FIN013/NewRes/Forms/AllItems.aspx
Marketing Requirements Not Provided Not Provided
Marketing Segment Analysis
SSG: Analyst reports, customer discussions, nascent technology analysis
EBU: Cognos ,EBU market model, Biz Plan documents, analyst reports
Market research/analyst reports:http://edc.micron.com/MTI/FIN013/NewRes/Forms/AllItems.aspx
EBU Cognos:Sales profitability cube http://c10prod.micron.com/ibmcognos/cgi-bin/cognosisapi.dll?b_action=powerPlayService&m_encoding=UTF-
© 2015 Micron Technology Inc. | Micron ConfidentialPage 62 Revision Date: August 30, 2016
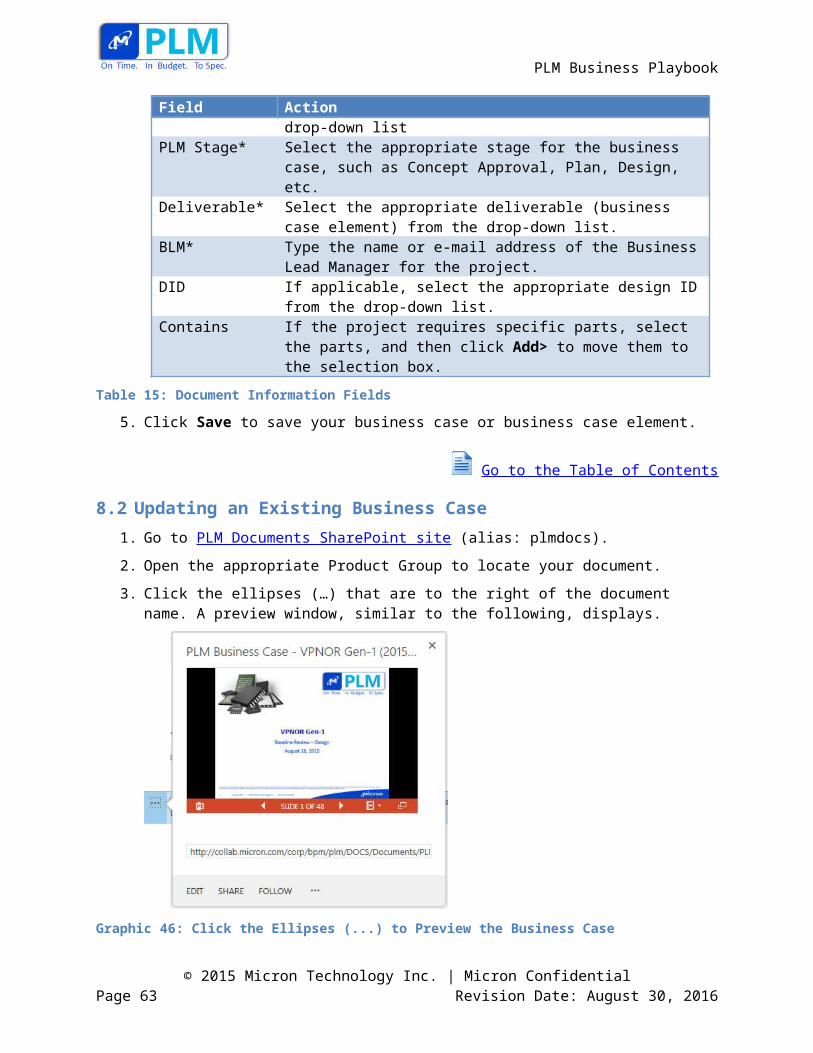
PLM Business Playbook
Inputs Sources Links
8&BZ=1AAABnsU1Pph42qVOy26DMBD8GS9pD43WBhI4cACbCKQ2pEA%7EAJCTWm0Auc4hf18bKrX3zmp3R6PZh9dU26at6rwUyZeZtCzFAzCmWCT8nId8F0dZkB72UZBmMc13Igz2vogy63n03Gye1rw4pW2RADsM02jkaCybu_Gju0gIMwhw7K4SfLHht14CwyebzXPzw7I3W2o5T9qo8WI5v9lHrlJbetLTWZmuV5%7EK3DcQCk80fMur4zHnbWlb_pIn%7E9vqZa%7EJGZFQRKQUCSFIQiQMiQtC3JxbNbtaKKk7PbzfAWPRGWkbARYB8xGYpMB6YPEq0F_BLLCas%7E8BXWJh6wNLrmdXfAMS2Wtj
Marketing Segment Share
NVE: BU Marketing via POP Kick-Off Presentation
NVE: http://pwaprod.micron.com/PWA/NVE01/Reference%20Documents/Kick-Off/B95A%20Kickoff%20%20SBS%20043014.pptx
MPN from BU GUI input into systems Not ProvidedNon-MFG Equipment Capacity (capability)
Not Provided Not Provided
NPN BU Marketing not SC Not Provided Ongoing Engineering Support
Not Provided Not Provided
Other Business Case Elements
Not Provided Not Provided
PLM Database Not Provided Not ProvidedPortfolio Strategy (BU & Micron)
EBU: Cognos EBU: Sales profitability cube
http://c10prod.micron.com/ibmcognos/cgi-bin/cognosisapi.dll?b_action=powerPlayService&m_encoding=UTF-8&BZ=1AAABnsU1Pph42qVOy26DMBD8GS9pD43WBhI4cACbCKQ2pEA%7EAJCTWm0Auc4hf18bKrX3zmp3R6PZh9dU26at6rwUyZeZtCzFAzCmWCT8nId8F0dZkB72UZBmMc13Igz2vogy63n03Gye1rw4pW2RADsM02jkaCybu_Gju0gIMwhw7K4SfLHht14CwyebzXPzw7I3W2o5T9qo8WI5v9lHrlJbetLTWZmuV5%7EK3DcQCk80fMur4zHnbWlb_pIn%7E9vqZa%7EJGZFQRKQUCSFIQiQMiQtC3JxbNbtaKKk7PbzfAWPRGWkbARYB8xGYpMB6YPEq0F_BLLCas%7E8BXWJh6wNLrmdXfAMS2Wtj
© 2015 Micron Technology Inc. | Micron ConfidentialPage 63 Revision Date: August 30, 2016
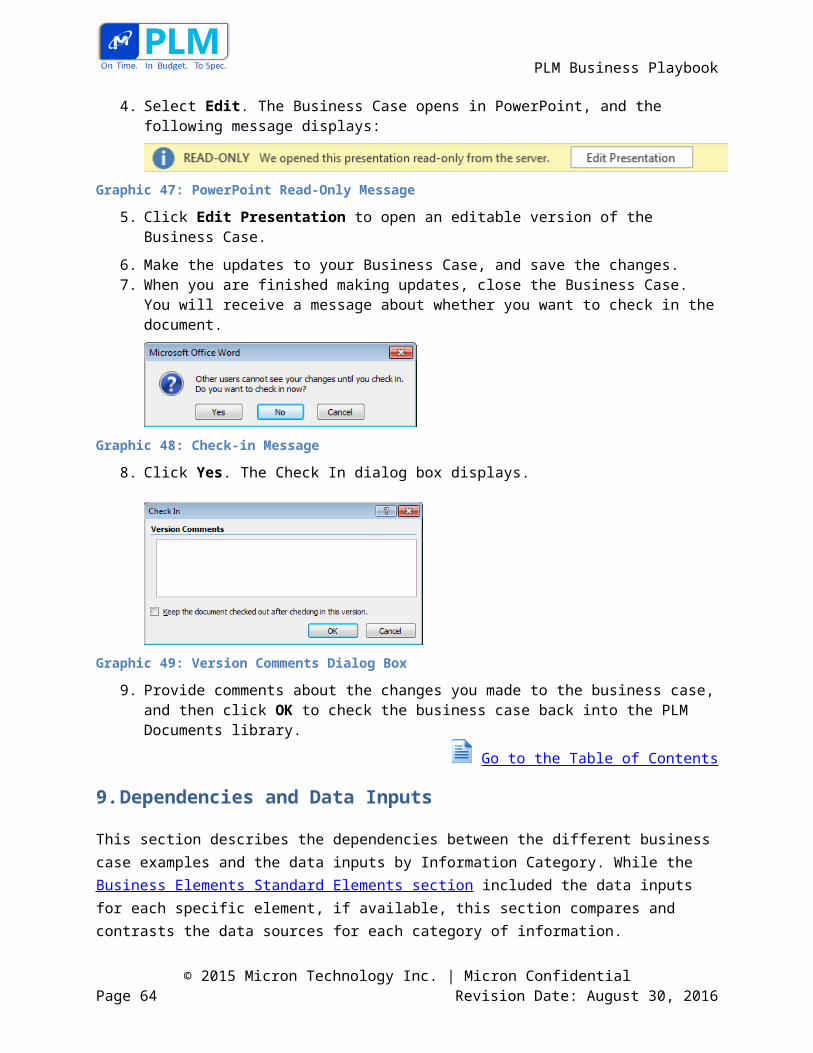
PLM Business Playbook
Inputs Sources Links
Preliminary BOM Partly out of NPN-package and route information. Not consistently used
Not Provided
Preliminary Financial Analysis
FIN: Excel, Cognos Analyst Not Provided
Process Program Plan Not Provided Not Provided
Product Cost Analysis (Investment, Price, Development, Manufacturing including resources Capex, headcount, “big ticket” costs)
FIN: TM1, Cognos Connection, Cognos\Analyst Cubes, Data Warehouse Development Cost Analysis: Design Engineers - Future should be Engineering Finance (Fred's team)
Not Provided
Product Mix Strategy (Family, MPN, etc.)
SSG: Customer discussions, Marketing/FAE/Sales/BDM feedback, analyst reports (which tier of market to address)
EBU: Cognos, SFDC, inputs from customers, sales, FAEs ,BDMs
EBU Cognos:
Sales profitability cube http://c10prod.micron.com/ibmcognos/cgi-bin/cognosisapi.dll?b_action=powerPlayService&m_encoding=UTF-8&BZ=1AAABnsU1Pph42qVOy26DMBD8GS9pD43WBhI4cACbCKQ2pEA%7EAJCTWm0Auc4hf18bKrX3zmp3R6PZh9dU26at6rwUyZeZtCzFAzCmWCT8nId8F0dZkB72UZBmMc13Igz2vogy63n03Gye1rw4pW2RADsM02jkaCybu_Gju0gIMwhw7K4SfLHht14CwyebzXPzw7I3W2o5T9qo8WI5v9lHrlJbetLTWZmuV5%7EK3DcQCk80fMur4zHnbWlb_pIn%7E9vqZa%7EJGZFQRKQUCSFIQiQMiQtC3JxbNbtaKKk7PbzfAWPRGWkbARYB8xGYpMB6YPEq0F_BLLCas%7E8BXWJh6wNLrmdXfAMS2Wtj
Product Requirements NVE: BU Marketing via POP Kick-Off Presentation
NVE: http://pwaprod.micron.com/PWA/NVE01/Reference%20Documents/Kick-Off/B95A%20Kickoff%20%20SBS%20043014.pptx
Product Ship & Release Plan
NVE: PDTL in POR presentation NVE: http://pwaprod.micron.com/PWA/NVE01/Ref
© 2015 Micron Technology Inc. | Micron ConfidentialPage 64 Revision Date: August 30, 2016
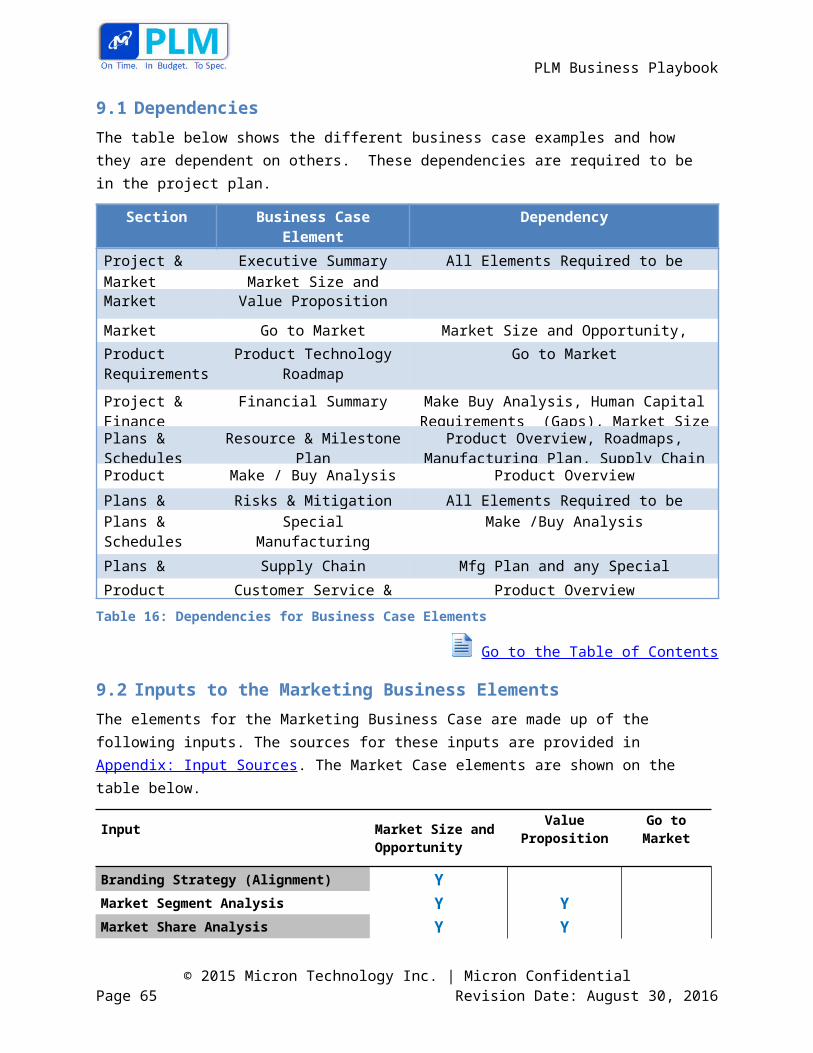
PLM Business Playbook
Inputs Sources Links
(slide 19) erence%20Documents/POR/B95A%20PDT%20POR%20Review.pptx
Product Transition Plan Not Provided Not Provided
Product Warranty Plan Not Provided Not Provided
Revised Product Development Plan
NVE: Prochain/PWA from PDTL NVE:
http://pwaprod.micron.com/pwa/project%20detail%20pages/schedule.aspx?projuid=23c3a5f1-77ae-4879-a81a-1c53359fd1da
Risk & Mitigation Plan Not Provided Not Provided
RMA/Customer Return Plan
Not Provided Not Provided
Sample Plan NVE: LPI/CTM but not well defined up front
NVE: http://pwaprod.micron.com/PWA/NVE01/Project%20Documents/B95A%20PDT%20Dashboard.pptx
Scope, Schedule and Budget Gap Review
NVE: Finance Not Provided
Sensitivity Analysis Parameters (price, volume, cost)
FIN: Excel - simple matrix with range of price and cost changes and what that does to NPV (e.g. +10% ASP changes is $X more NPV
Not Provided
Service Plan Not Provided Not Provided
Sub-Con Plan Not Provided Not Provided
Success Criteria NVE: BU/PE/DE consolidated by PDTL into SCD
SSG: Align to corporate goals, SSG business Plan, product line alignment
EBU: BU biz Plan ,Corporate goals, product line Business Plan
NVE:
http://pwaprod.micron.com/PWA/NVE01/Reference%20Documents/B95A%20SCD.aspx
Supply Response Not Provided Not Provided
© 2015 Micron Technology Inc. | Micron ConfidentialPage 65 Revision Date: August 30, 2016
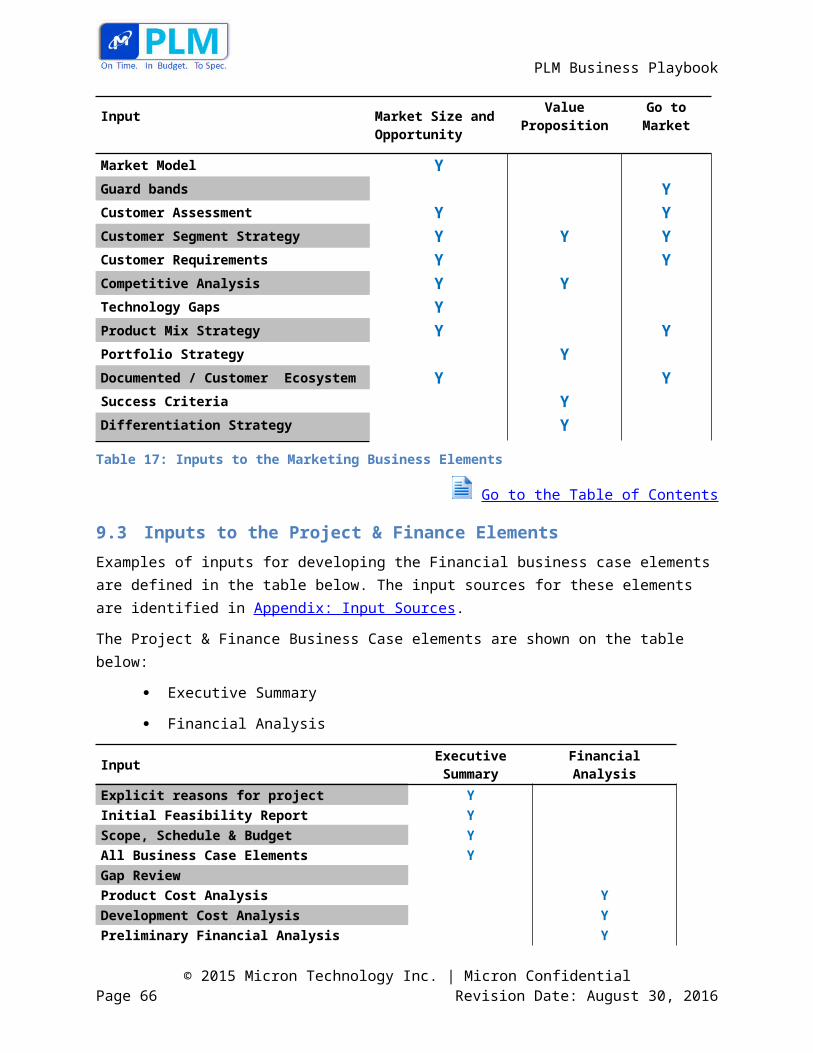
PLM Business Playbook
Inputs Sources Links
Technology Gaps SSG: Competitive analysis, customer discussions
EBU: Competitive analysis reports, analyst reports
EBU: Competitive analysis info stored at ESG CI http://collab.micron.com/corp/esg/CI/default.aspx
(Information used includes competitive performance benchmarking, die size analysis, competitive cost projections, etc.)
Market research/analyst reports from
http://edc.micron.com/MTI/FIN013/NewRes/Forms/AllItems.aspx
Test Service Agreement Not Provided Not Provided
Timeline, Schedule & Dependencies
Not Provided Not Provided
Validation/Tiered Qualification Release Plan
NVE: PE via SCD/PCE/PLM 3.NVE: http://pwaprod.micron.com/PWA/NVE01/Reference%20Documents/B95A%20SCD.aspx
Value Proposition FIN:PLM, Marketing Not Provided
12.2 Glossary of Terms
Term Definition
Assumptions used in Plan Basis for price, costs, volumes and discounts applied to financial analysis
Average Selling Price ($) (/unit, weighted)
Targeted Selling Price in US$ - For multiple products calculate the total revenue for all products and then divide by the total volume for all products. Calculation: ASP = Net Revenue/Units - with Units clearly defined (e.g. exploded die, SSD Units, etc.)
BLM Business Line Manager
Branding Strategy Product alignment with brand strategy
Capex ($M) (incremental) Capital Expenditure in US$ as required for this product or program. Any Capital expenditures included in parent or other project business cases are be included unless the expenditures were transferred to this project
Cash Flow Net income of the product for each year after costs, taxes
© 2015 Micron Technology Inc. | Micron ConfidentialPage 66 Revision Date: August 30, 2016
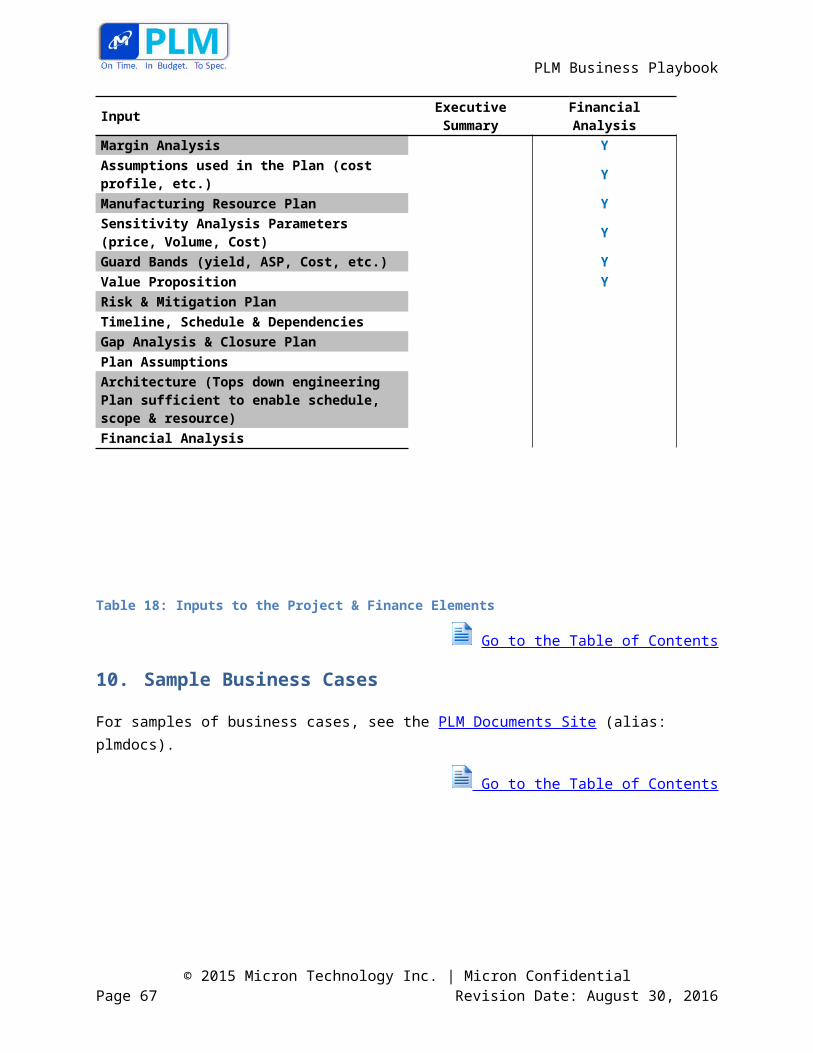
PLM Business Playbook
Term Definition
and disbursements
Cash Margin (%) Annual Revenue minus total operating expense/Total Revenue in US$. Calculation: Cash Margin$/Net Revenue
Cash Margin per Wafer Ratio of the Cash Margin in US$ divided by the Total Annual Wafer Volume. Calculation: Cash Margin $/Wafers
Cash Margin($) Annual Revenue minus total operating expense (cash cost) in US $. Calculation: Net Revenue-Cash COGS (Cost of Goods Sold)
COGS (unit) Cost of Goods Sold. The ratio of the total Direct Cost of the material sold in US$ (Purchased materials, Manufacturing Labor and Manufacturing Overhead) divided by total Annual Revenue in US$. Some detail of assumptions are added (e.g. Non-NAND costs for SSDs, Yield assumptions around Silicon and/or Multi Die Packages
Competitor Analysis Assessment of the strengths & weaknesses of current and potential competitors. Provides an offensive and defensive strategic context to identify opportunities and threats
Cost Analysis (Investment, Price, Point) Development, Manufacturing (including resources, Capex, headcount, "big ticket" costs)
Unit Cost Calculation Details: Wafer Cost, DPW, Die Cost, Package Cost, Assembly Cost, Controller, Yield, RS Cost, Subcon Cost/Yield, OH. This are shown for each product or product group.Development: Cost of all resource labor, equipment, materials and purchases (Capital and non-capital services) used to develop the product. This should be shown for each product or product group
Cost Model Assessment determining the financial attractiveness and viability of product showing full lifecycle costs
Customer Segment Strategy Dividing broad target markets into subsets of customers with common needs and priorities to design and implement strategies to target them
Datasheet Location of validated performance specs
Documented Ecosystem (3rd party enablers (i.e. controller vendors), alliances, consortiums)
Defines the go-to-market enterprises such as OEM’s, ODM’s, Distributors, outsourced vendors
End-of-life Conditions Market and Customer driven end-of-life conditions of a product
© 2015 Micron Technology Inc. | Micron ConfidentialPage 67 Revision Date: August 30, 2016
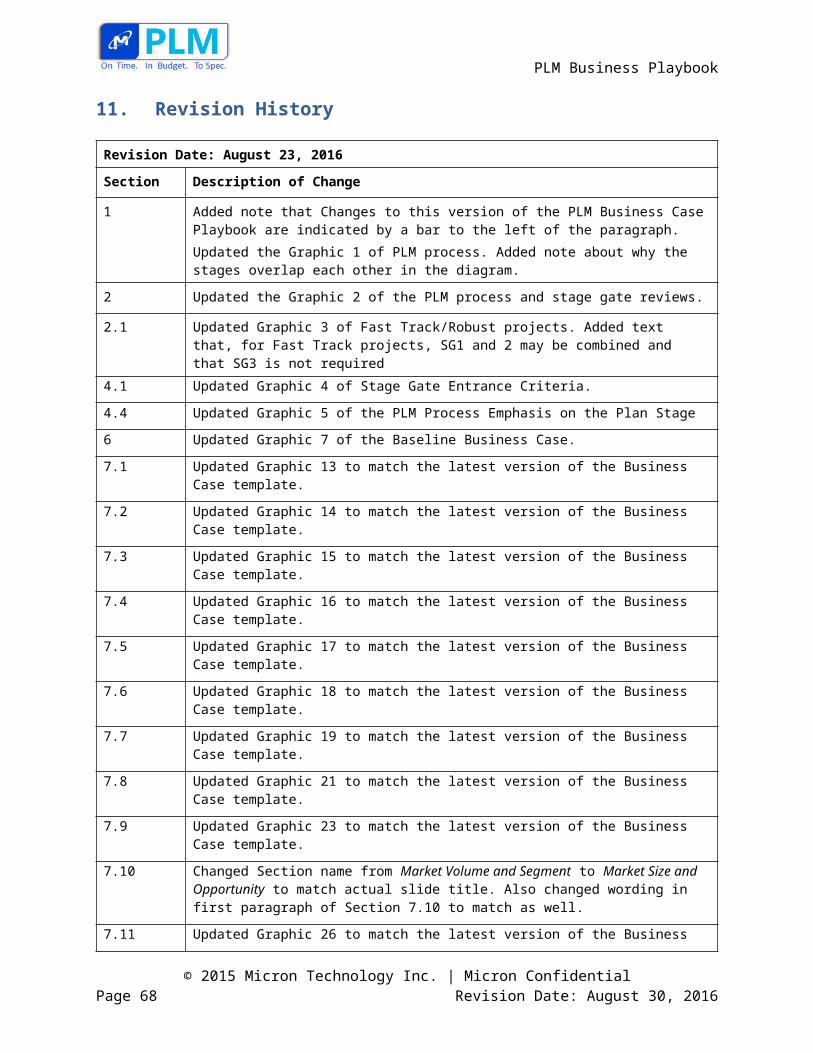
PLM Business Playbook
Term Definition
End-of-life Date Projected end-of-life date of a product
Engineering Resource Plan High level overview of required engineering resources required
Equipment Capacity Maximum output of equipment in given unit of time
Explicit Reason for Project Overview of product value proposition
Financial Analysis (Preliminary)
Initial financial analysis completed during Concept Stage and/or as the approval to enter Plan
Gap Analysis and Closure Plan Plan to close gap between actual product performance and desired performance
Gross Margin ($) Annual Revenue minus Cost of Goods Sold for the Annual Sales in US$
Gross Margin (%) Ratio of the Annual Profit divided by the Annual Revenue in US$. Profit = Revenue - Cost of Goods Sold. Calculation: GM$/Net Revenue
Gross Margin per Wafer Ratio of the Gross Margin in US$ divided by the Total Annual Wafer Volume. Calculation GM$/Wafers
Guardband Definition of thresholds or clip levels that the factors affecting cost, price and volume are within to meet expectations or to not require an escalated approval
Initial Feasibility Report Initial analysis to objectively uncover the strengths and weaknesses of product venture, opportunities and threats present, the resources required and ultimately the prospects for success
Lessons Learned Documented findings from analysis
Major Milestones Scheduled events that indicate completion of a major deliverable or product advancement
Make/Buy Recommendations (Product, Sub-Components, Sourcing, Design)
Choosing between manufacturing a product in-house or purchasing it from an external supplier.
Manufacturing Program Plan (including Geographic view)
Manufacturing resources, activities and schedules to support the product development and introduction. Analysis on capacity, yields, processes, equipment capability and tooling.
Manufacturing Resource Plan Resources requirements and commitments for all resources needed to develop and launch the product being developed including R&D, Engineering, Admin, Sales, Marketing, Manufacturing, Supply Chain, Procurement and any others
© 2015 Micron Technology Inc. | Micron ConfidentialPage 68 Revision Date: August 30, 2016
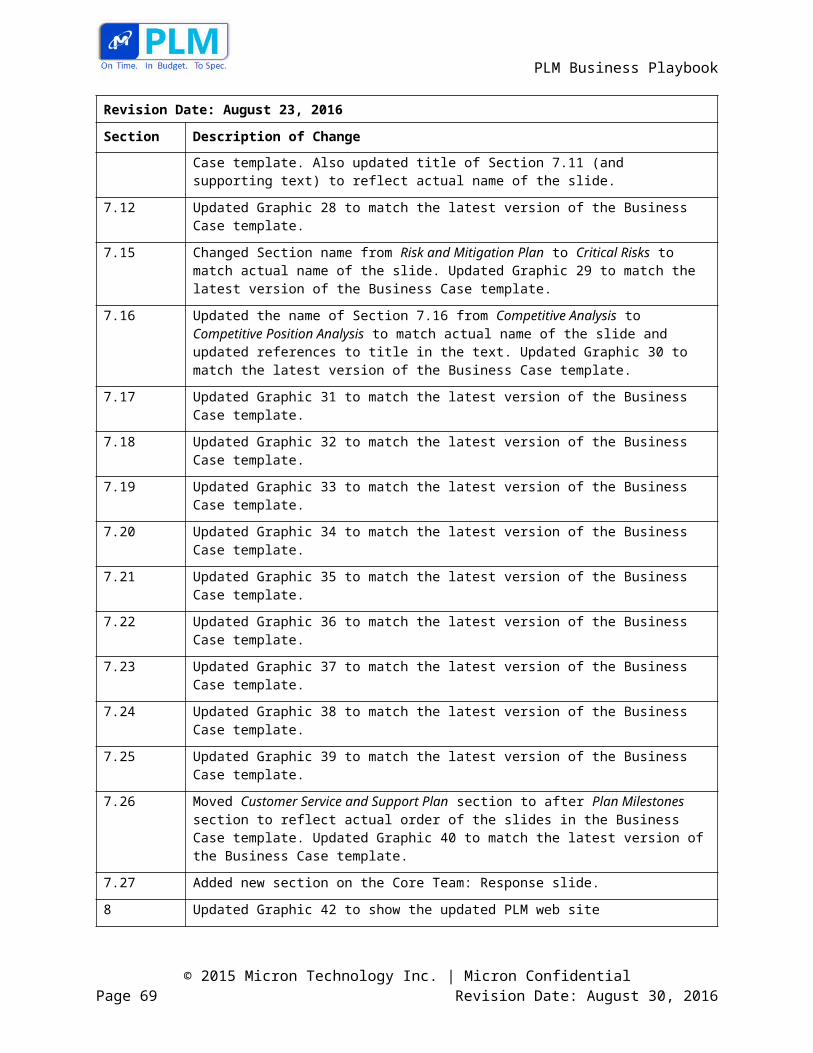
PLM Business Playbook
Term Definition
Margin Analysis Margin Details - Volume, ASP, Unit Cost, Revenue, COGS, GM$, GM% (Sometimes shown in 1Gb or 2Gb UOM). This should be shown for each product or product group
Marketing Requirements Document
Document detailing potential market positioning and performance requirements for specific product
MPN Material Product Number or Marketing Part Number
NPN New Product Notification generated once the project enters the Design Phase
NPV ($) Difference between the sums of discounted incoming and outgoing Cash Flow in present value (PV) over time. The discount rate is a weighted average cost of capital (after tax) or a higher discount rate over time adjusted for risk, opportunity cost, or other factors. Calculation:
t =time of the cash flowi = the discount rate (rate of return that could be earned on investments or opportunity cost of capitalRt = the net cash flow i.e. cash inflow - cash outflow at time tN = the total number of periods
Ongoing Engineering Support Technical and project training for FACQ & Sales
Opportunity Cost This is the measure of the opportunities lost by taking this action. Will depend upon product and decision (e.g. an opportunity cost for a new SSD would be the sales of the raw NAND used in the SSD in the components market. An opportunity cost for a DRAM tech node would be the sales of a previous generation of DRAM that would be replaced by the new tech node)
PLM Product Lifecycle Management
PLM Database Current Agile application transitioning to Teamcenter application - Base timeline, route Plan - process steps, physical route Plan, new data regiments, system, customer, compliance requirements - test processes but not sampling plans
Product Development Cost Total costs associated with developing the product including R&D, Engineering, Manufacturing, Quality & Supply Chain Resources (Finance, Sales, Procurement, Administrative not
© 2015 Micron Technology Inc. | Micron ConfidentialPage 69 Revision Date: August 30, 2016
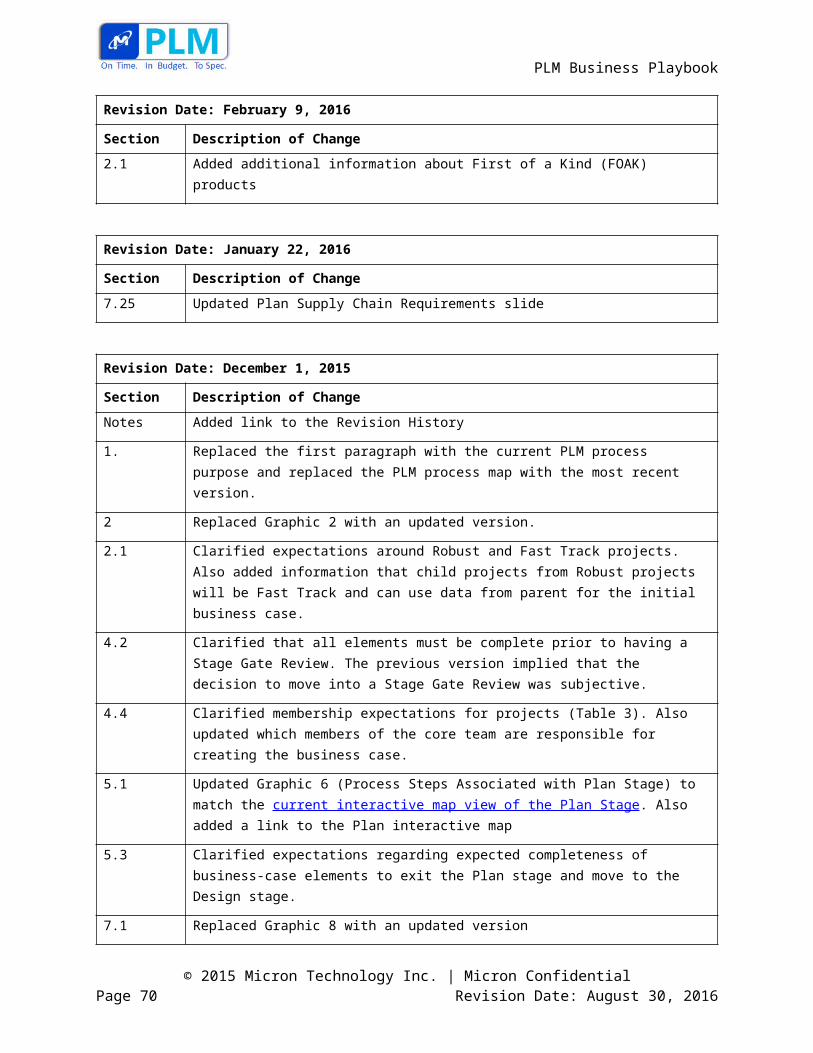
PLM Business Playbook
Term Definition
included) and the materials and non-capital equipment used to develop the product prior to production
Product Release Plan Planning process that surrounds the release of product. Ensures smooth migration from internal testing to customer
Product Requirements Document
Document defining product description, requirements and features
Product Transition Plan Describes the transition Plan for customer(s) in the event a product reaches end of life
Product Warranty Plan Describes the terms and conditions of warranty support post purchase
Revenue ($) Annual Sales Revenue in US$. Calculation : Net Revenue (net of Contra Revenues)
Revenue/Wafer Ratio of Annual Sales Revenue in US$ / Total Wafer Volumes
Risks and Mitigation Plan Process of developing options and actions to enhance opportunities and reduce threats to product plans and objectives
RMA/Customer Return Plan Describes the Return Material Authorization process implemented for a particular product
ROI (%) Return on Investment - Total Profit in US$ divided by the development cost in US$. Calculation: ROI = Total Annual $ Profit - Cost of Development / Cost of Development
Route Includes individual process steps and physical route Plan locations
Sample Plan Plan for product sampling release to customer for test
Scope, Schedule, and Budget Gap Review
Brief statement of the scope, problem or proposal, background information, concise analysis and main conclusions
Sensitivity Analysis (price, volume, cost)
Preferably a table or matrix identifying the levers that will affect Price, volume or cost and the level of impact of each of these have over the life of the product or development effort.
Service Plan Process to support customer’s service requests after purchase
SG&A Costs ($) (Incremental) Sales, General & Administrative costs that are going to be increasing as a result of the product being introducedSelling, General & Administrative Expenses (SG&A) includes
© 2015 Micron Technology Inc. | Micron ConfidentialPage 70 Revision Date: August 30, 2016
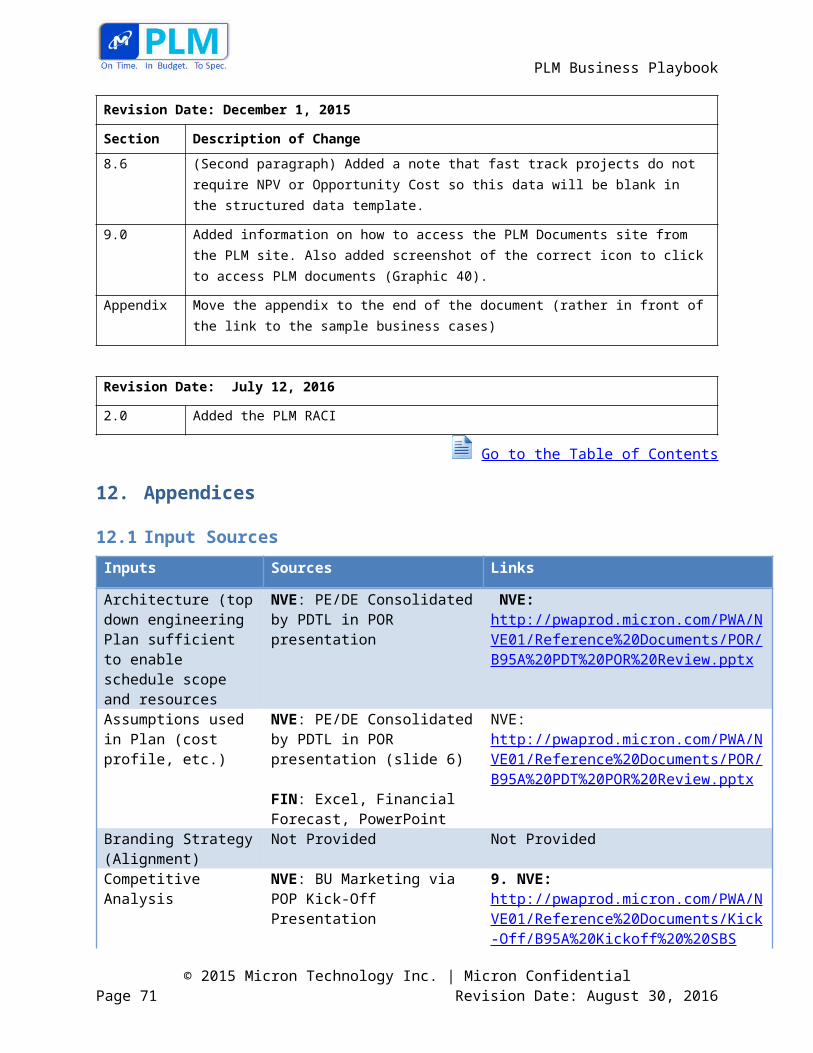
PLM Business Playbook
Term Definition
expenses related to marketing, promoting and distributing products and services. Other major items are corporate administrative expenses such as accounting and finance, planning, human resources, research and development, and maintenance of administrative facilities. Only incremental SG&A should be added here. Examples would be additional Sales or Technical Customer Support resources required to service and sell in the product's market.
Ship Release Material Plan Plan for product shipping release to customer for test or sale
Stage Gate Scheduled point at which development can be examined and any important changes or decisions relating to costs, resources, profits, schedule etc. can be made
Success Criteria Describes the refined product requirements and qualification criteria a product will have to meet
Test Service Agreement Customer required product certification/testing services
Tiered Qualification Release Plan
Plan for product maturity qualification and release
Timeline/Schedule Plan for carrying out a process or procedure, giving lists of intended events and times
Total Wafers Annual Sales Volume defined in Wafer unit of measure
Validation/Qualification Plan A customer / product validation Plan including customer research method, schedule, cost and resources
Value Proposition The strategic intent and market influencers, need and differentiators for the products being developed. A promise of benefits to be delivered by product and impacts resulting from product in the market place
Volume (Gb (bits) or GB (Bytes))
Annual Sales Volume defined in Gigabyte (Gb) unit of measure. Calculation: GB=8*Gb Gb=1024*Mb
Volume (Unit) Annual Sales Volume defined in unit of measure other than wafer or Gb if needed
© 2015 Micron Technology Inc. | Micron ConfidentialPage 71 Revision Date: August 30, 2016
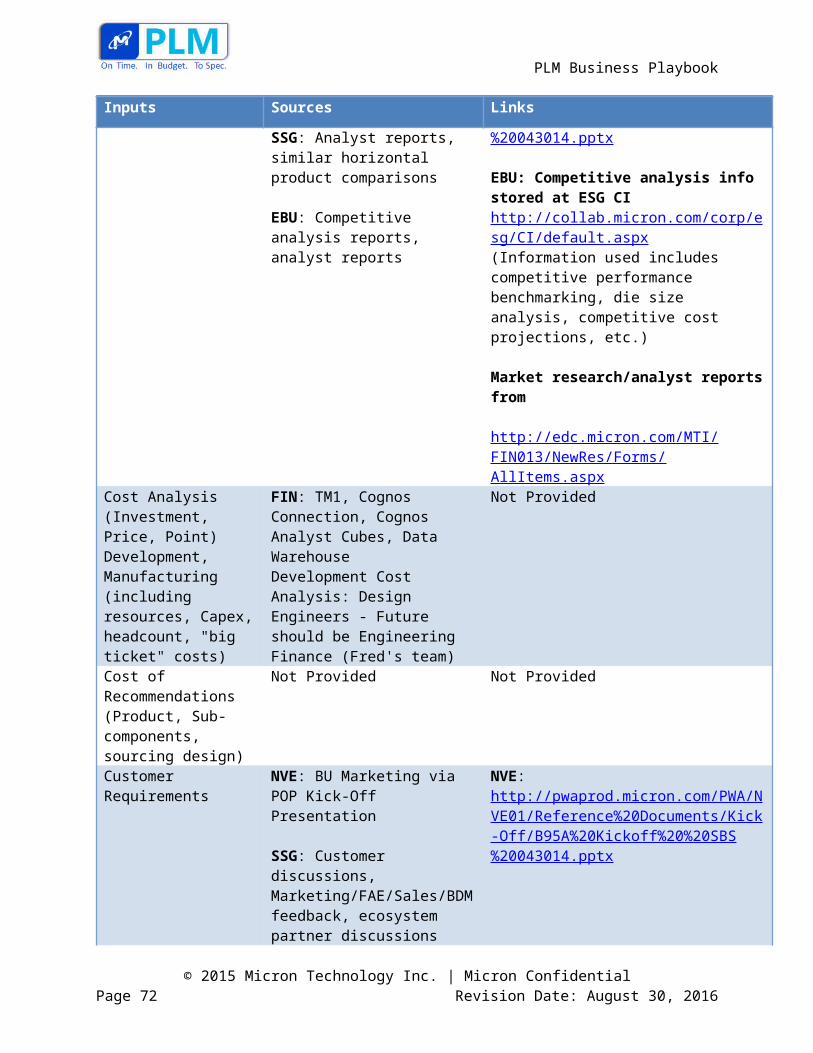
PLM Business Playbook
© 2015 Micron Technology Inc. | Micron ConfidentialPage 72 Revision Date: August 30, 2016