business outlook survey romania 2014
TRANSCRIPT

A vision for growth
Business outlook survey
Romania 2014

Page 2
What is “A vision for growth”?
“A vision for growth” is a survey that explores the perceptions of top executives from major
companies operating in Romania regarding the business outlook for 2014.
This EY report is based on a survey of 117 C-suite level executives from companies in various sectors, who
provided a perspective on how the domestic business environment is perceived at the beginning of 2014.
5 main
findings
1
28% of respondents foresee a significant growth of +10 to +30% for their company’s turnover in 2014
compared with 25% in 2013, while 67% expect a growth rate of +5 to +10%, compared with just 51% at the
beginning of last year.
Only 21% of the respondents expect the profit growth rate of their company to range between +5 to
+10% in 2014 compared with 37% in 2014, but a lower percentage of 26% vs. 31% in 2013 expect the
profit of their company to grow between +10 to +30% in 2014.
At the beginning of 2014, 2% of respondents say the salary increase in their company is expected to
exceed 10%, the same percentage as last year. Most importantly, while 42% said there would be no
salary increase for them in 2013, only 19% say the same at the beginning of 2014.
Unlike last year, when most companies (76%) said that they would continue to stay on the market if it declined, in
2014 only 56% say the same. A still high percentage of companies (56% in 2014 vs. 46% in 2013) though, are
willing to transform the market through innovative approaches in case such a decline occurs.
This year as well, the main companies’ strategy for financing investments appears to be through bank
loans (49% in 2014 vs. 46% in 2013). The intercompany loans, own resources and reinvested profit are
expected to increase to 39% in 2014 compared to 27% at the beginning of 2013.
2
3
4
5
See here the previous edition of the survey

Page 3
A vision for growth Business outlook survey
Romania 2014
Our survey reflects the increased focus
companies have on coping with the
challenging business environment in a way
that secures their potential for growth.
Bogdan Ion, Managing Partner, EY Romania

Page 4
Please indicate the main three elements that you use to define success. (multiple answers)
Question 1
Usually, companies measure their success by a combination of financial results, market share and brand awareness, but
customer satisfaction appears to be very high on their criteria list. In 2014, the distribution of these elements remains quite
similar to the one indicated by respondents at the beginning of 2013 (differences range between 2-3%).
Total Respondents: 117
(Skipped this question: 0)
9%
7%
7%
39%
63%
78%
96%
0% 20% 40% 60% 80% 100% 120%
Other
Number of years on the market
Number of employees
Brand awareness
Market share
Customer satisfaction
Financial results
See here the previous edition of the survey
Page 5
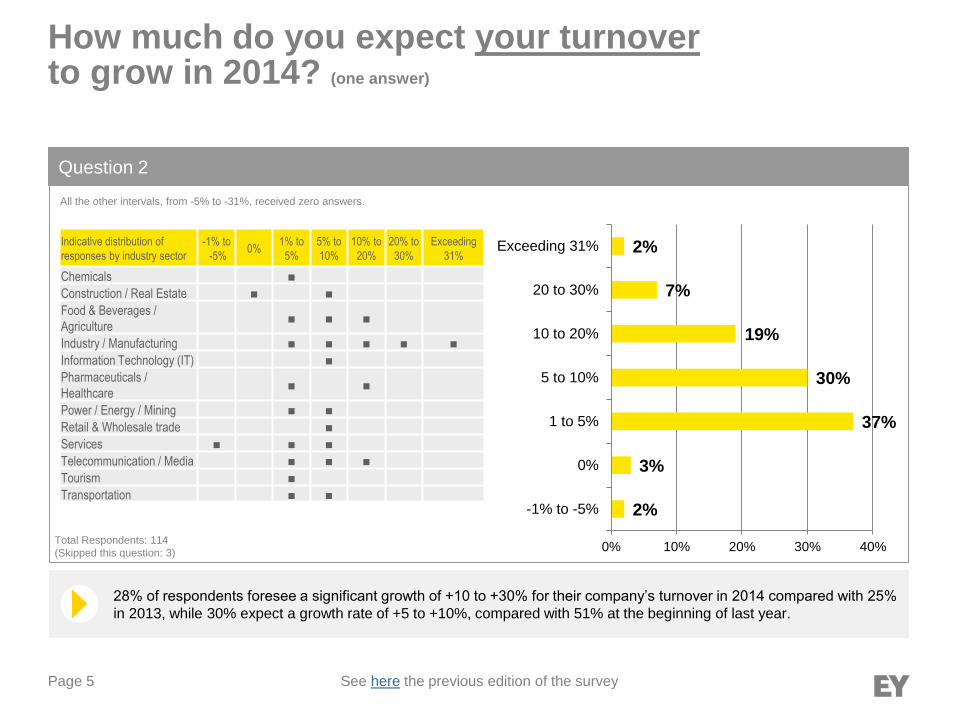
How much do you expect your turnover to grow in 2014? (one answer)
Question 2
28% of respondents foresee a significant growth of +10 to +30% for their company’s turnover in 2014 compared with 25%
in 2013, while 30% expect a growth rate of +5 to +10%, compared with 51% at the beginning of last year.
Total Respondents: 114
(Skipped this question: 3)
All the other intervals, from -5% to -31%, received zero answers.
2%
3%
37%
30%
19%
7%
2%
0% 10% 20% 30% 40%
-1% to -5%
0%
1 to 5%
5 to 10%
10 to 20%
20 to 30%
Exceeding 31%
See here the previous edition of the survey
Indicative distribution of
responses by industry sector
-1% to
-5% 0%
1% to
5%
5% to
10%
10% to
20%
20% to
30%
Exceeding
31%
Chemicals ■
Construction / Real Estate ■ ■
Food & Beverages /
Agriculture ■ ■ ■
Industry / Manufacturing ■ ■ ■ ■ ■
Information Technology (IT) ■
Pharmaceuticals /
Healthcare ■ ■
Power / Energy / Mining ■ ■
Retail & Wholesale trade ■
Services ■ ■ ■
Telecommunication / Media ■ ■ ■
Tourism ■
Transportation ■ ■
Page 6
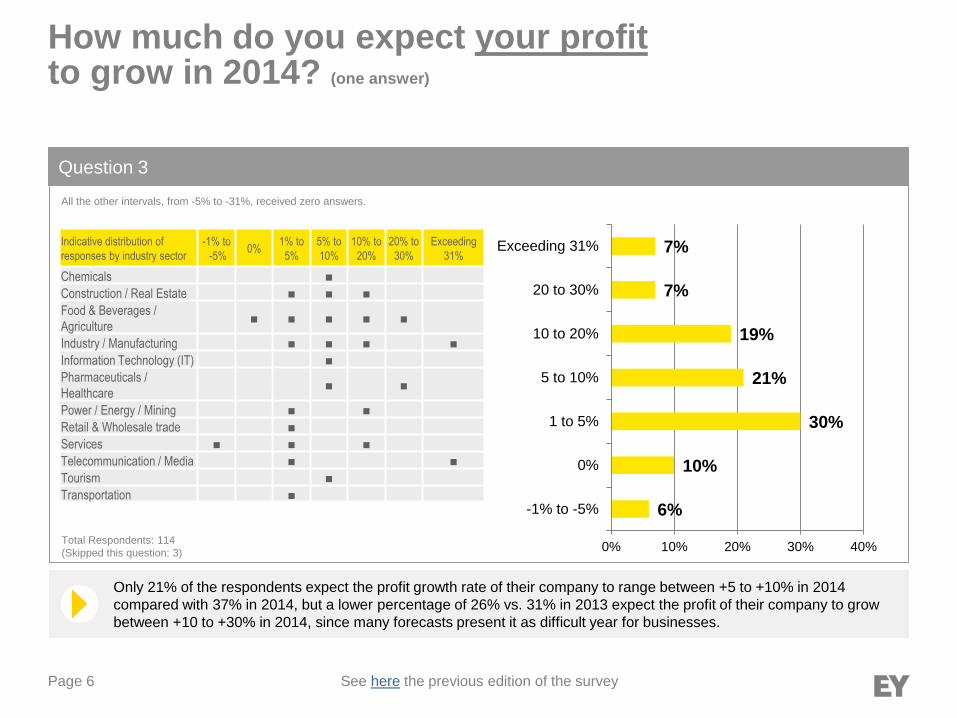
How much do you expect your profit to grow in 2014? (one answer)
Question 3
Only 21% of the respondents expect the profit growth rate of their company to range between +5 to +10% in 2014
compared with 37% in 2014, but a lower percentage of 26% vs. 31% in 2013 expect the profit of their company to grow
between +10 to +30% in 2014, since many forecasts present it as difficult year for businesses.
Total Respondents: 114
(Skipped this question: 3)
All the other intervals, from -5% to -31%, received zero answers.
6%
10%
30%
21%
19%
7%
7%
0% 10% 20% 30% 40%
-1% to -5%
0%
1 to 5%
5 to 10%
10 to 20%
20 to 30%
Exceeding 31%
See here the previous edition of the survey
Indicative distribution of
responses by industry sector
-1% to
-5% 0%
1% to
5%
5% to
10%
10% to
20%
20% to
30%
Exceeding
31%
Chemicals ■
Construction / Real Estate ■ ■ ■
Food & Beverages /
Agriculture ■ ■ ■ ■ ■
Industry / Manufacturing ■ ■ ■ ■
Information Technology (IT) ■
Pharmaceuticals /
Healthcare ■ ■
Power / Energy / Mining ■ ■
Retail & Wholesale trade ■
Services ■ ■ ■
Telecommunication / Media ■ ■
Tourism ■
Transportation ■

Page 7
As the chart shows, 37% of respondents expect no increase in the employees number in 2014, down from 56% in early
2013. The good news is that at the beginning of 2014, 14% of respondents say they expect the number of employees to
grow between +10% to +30%, compared to only 5% in 2013.
How much do you expect your number of employees to grow in 2014? (one answer)
Question 4
Total Respondents: 114
(Skipped this question: 3)
All the other intervals from, -5% to -30%, received zero answers.
5%
9%
37%
30%
5%
9%
5%
0% 10% 20% 30% 40%
-5% to -10%
-1% to -5%
0%
1 to 5%
5 to 10%
10 to 20%
20 to 30%
See here the previous edition of the survey
Indicative distribution of
responses by industry sector
-5% to
-10%
-1% to
-5% 0%
1% to
5%
5% to
10%
10% to
20%
20% to
30%
Chemicals ■
Construction / Real Estate ■ ■
Food & Beverages /
Agriculture ■ ■ ■ ■
Industry / Manufacturing ■ ■ ■ ■ ■
Information Technology (IT) ■
Pharmaceuticals /
Healthcare ■ ■
Power / Energy / Mining ■ ■ ■ ■
Retail & Wholesale trade ■
Services ■ ■ ■
Telecommunication / Media ■ ■
Tourism ■
Transportation ■

Page 8
At the beginning of 2014, 2% of respondents say the salary increase in their company is expected to exceed 10%, the
same percentage as last year. Most importantly, while 42% said there would be no salary increase for them in 2013, only
19% say the same at the beginning of 2014.
How much do you expect the salary level in your company to grow in 2013? (one answer)
Question 5
Total Respondents: 114
(Skipped this question: 3)
19%
60%
19%
2%
0% 20% 40% 60% 80%
0%
1 to 5%
5 to 10%
10 to 20%
All the other intervals, from -1% to -20%, received zero answers.
See here the previous edition of the survey
Indicative distribution of responses
by industry sector 0%
1% to
5%
5% to
10%
10% to
20%
Chemicals ■
Construction / Real Estate ■ ■
Food & Beverages / Agriculture ■ ■ ■
Industry / Manufacturing ■ ■ ■
Information Technology (IT) ■ ■ ■
Pharmaceuticals / Healthcare ■ ■
Power / Energy / Mining ■ ■ ■
Retail & Wholesale trade ■
Services ■ ■
Telecommunication / Media ■ ■
Tourism ■
Transportation ■
Page 9
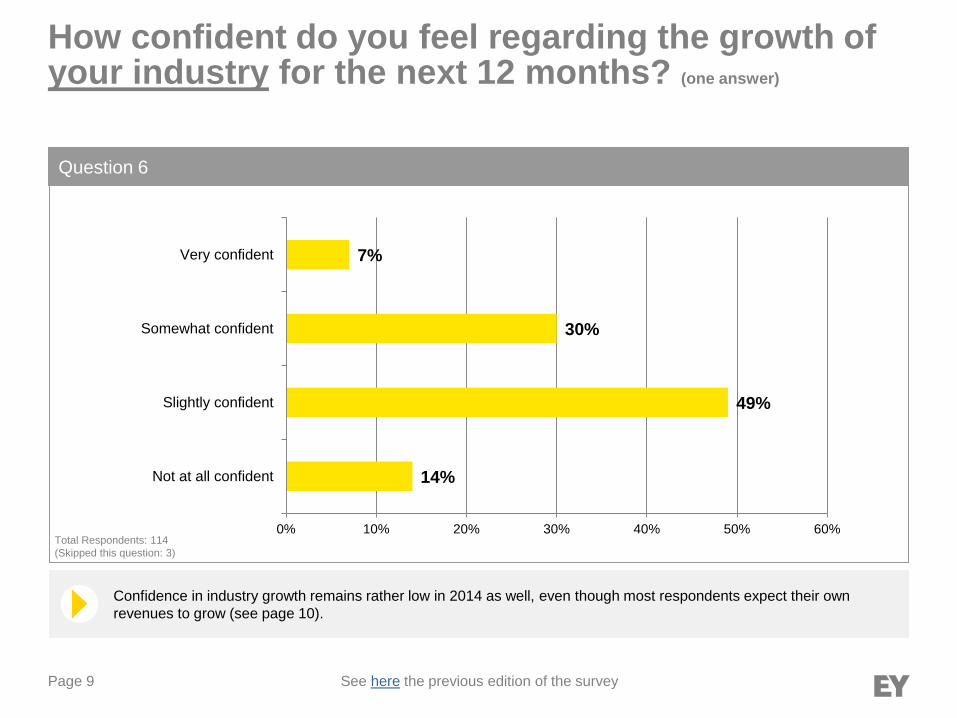
Confidence in industry growth remains rather low in 2014 as well, even though most respondents expect their own
revenues to grow (see page 10).
How confident do you feel regarding the growth of your industry for the next 12 months? (one answer)
Question 6
Total Respondents: 114
(Skipped this question: 3)
14%
49%
30%
7%
0% 10% 20% 30% 40% 50% 60%
Not at all confident
Slightly confident
Somewhat confident
Very confident
See here the previous edition of the survey

Page 10
The gap between the confidence in industry and company growth forecast remains quite remarkable in 2014 as well, which could
show that companies place an important trust in their strategies. A notable increase is seen in the “very confident” section, from 25% in
2013 to 40% in 2014, which may be due to companies feeling better prepared to deal with the challenges in business environment.
How confident do you feel regarding the growth of your company for the next 12 months? (one answer)
Question 7
Total Respondents: 114
(Skipped this question: 3)
0%
23%
37%
40%
0% 5% 10% 15% 20% 25% 30% 35% 40% 45%
Not at all confident
Slightly confident
Somewhat confident
Very confident
See here the previous edition of the survey

Page 11
Low cost as the main strength of the respondents’ competition in the local market decreased from 31% in 2013 to 26% in
2014, competitors’ brand remaining the most important one (37% in 2014 vs. 39% in 2013). A notable increase is seen by
“Research & Development (R&D)” segment, up to 7% in 2014 from only 2% at the beginning of 2013.
Please describe the main strength of your competitors in the local market, Romania. (one answer)
Question 8
Total Respondents: 114
(Skipped this question: 3)
37%
26%
14%
9% 7% 7%
0%
5%
10%
15%
20%
25%
30%
35%
40%
Strong brandawareness (trust)
Low cost Distributionchannels
Partenerships Research &Development
(R&D)
Other
See here the previous edition of the survey

Page 12
To what extent do you expect your customers' demand to change in the next 12 months? (one answer)
Question 9
While 3% of respondents expect their customers’ demand to change dramatically in 2014, 60% foresee it to change only
slightly. All these expectations are rather similar with the ones expressed by respondents at the beginning of 2013.
Total Respondents: 114
(Skipped this question: 3)
60%
37%
3%
0% 10% 20% 30% 40% 50% 60% 70%
Somewhat change
Stay the same
Change dramatically
See here the previous edition of the survey

Page 13
What impact will the change in customers' demand have on your company in the next 12 months? (one answer for each option)
Question 10
Even though the previous chart showed that companies do not expect substantial changes in customers’ demand,
the highest impact (if any) could occur on their Innovation Strategy and Operations (21% each).
Total number of responses: 587
12%
19%
16%
40%
21%
5%
7%
14%
19%
28%
28%
16%
33%
26%
33%
23%
28%
23%
27%
36%
25%
7%
21%
35%
21%
5%
7%
2%
2%
21%
0% 20% 40% 60% 80% 100%
Operations
Marketing
Brand positioning
CSR (Corporate Social Reponsability)
Organizational Structure
Innovation Strategy
Lowest impact (1) (2) (3) (4) Highest impact (5)
See here the previous edition of the survey

Page 14
The high dependency on labor force’s skills indicates that companies are fully aware of the direct link between
employees’ competency level and company’s performance. The difference from last year’s report is that in 2014 the
segment of “very high dependency” increases to 31% from only 16% in the previous year.
How would you rate the dependency of your company's success on the skills of the labor force? (one answer)
Question 11
Total Respondents: 114
(Skipped this question: 3)
0%
2%
14%
53%
31%
0% 10% 20% 30% 40% 50% 60%
No dependency (1)
Low dependency (2)
Medium dependency (3)
High dependency (4)
Very high dependency (5)
See here the previous edition of the survey

Page 15
Which of the following factors best describe the impact of your employees on company's success? (one answer)
Question 12
In 2014, 82% of the respondents (83% in 2013) say that education and skill of labor force play the most important role in
their company’s success.
Total Respondents: 114
(Skipped this question: 3)
9%
9%
82%
0% 10% 20% 30% 40% 50% 60% 70% 80% 90%
Our company’s success is higly influenced by salary costs
Our company's success is dependent onemployee retention
Our company's success is dependent oneducation level and key skills
See here the previous edition of the survey

Page 16
Between 21% and 37% of the respondents agreed that regulatory, tax and legal environment plays a very high role in
their company’s growth in 2014. This was the case in 2013 as well.
To what extent does the legal, tax and regulatory environment play a role in the growth of your company? (one answer for each option)
Question 13
(Total number of responses: 368)
2%
2%
18%
14%
9%
35%
28%
33%
26%
19%
33%
21%
37%
23%
0% 20% 40% 60% 80% 100%
Legal
Tax
Regulatory
Least Important role (1) (2) (3) (4) Highest important role (5)
See here the previous edition of the survey

Page 17
Which of the following best describes your company’s primary strategy for financing its investments in the past year? (one answer)
Question 14
When it comes to financing investments, in the past year companies used mostly bank loans (54% in 2013 vs. 47% in
2012), followed by intercompany loans, own resources and reinvested profit (34% in 2013 vs. 31% in 2012). There was a
steep reduction in the “share capital increase” segment, down to 10% in 2013 from 18% in the previous year.
Total Respondents: 111
(Skipped this question: 6)
34%
54%
2%
10%
0% 10% 20% 30% 40% 50% 60%
Other (intercompany loans, own resources,reinvested profit)
Our company used bank loans to finance itsinvestments
Our company used venture capital to finance itsinvestments
Our company attracted share capital increase tofinance its investments
See here the previous edition of the survey

Page 18
Which of the following best describes your company's preferred strategy for financing its investments in the following 12 months? (one answer)
Question 15
This year as well, the main companies’ strategy for financing investments appears to be through bank loans (49% in 2014
vs. 46% in 2013). The intercompany loans, own resources and reinvested profit are expected to increase to 39% in 2014
compared to 27% at the beginning of 2013.
Total Respondents: 111
(Skipped this question: 6)
39%
49%
0%
12%
0% 10% 20% 30% 40% 50% 60%
Other (intercompany loans, own resources,reinvested profit)
Bank loans
Venture capital
Share capital increase
See here the previous edition of the survey
Page 19
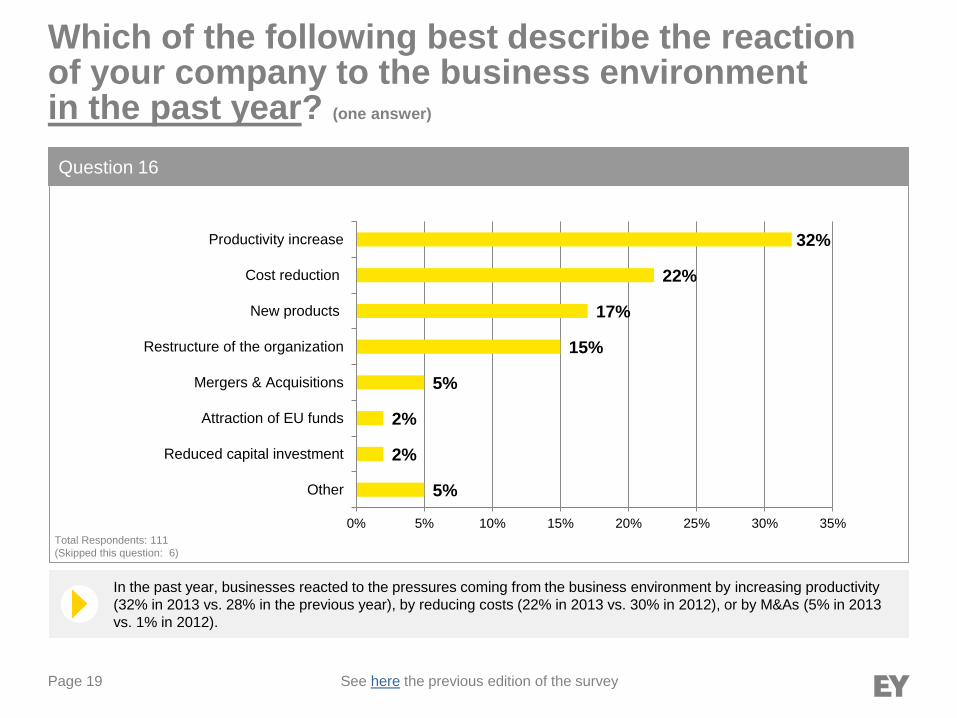
Which of the following best describe the reaction of your company to the business environment in the past year? (one answer)
Question 16
In the past year, businesses reacted to the pressures coming from the business environment by increasing productivity
(32% in 2013 vs. 28% in the previous year), by reducing costs (22% in 2013 vs. 30% in 2012), or by M&As (5% in 2013
vs. 1% in 2012).
Total Respondents: 111
(Skipped this question: 6)
5%
2%
2%
5%
15%
17%
22%
32%
0% 5% 10% 15% 20% 25% 30% 35%
Other
Reduced capital investment
Attraction of EU funds
Mergers & Acquisitions
Restructure of the organization
New products
Cost reduction
Productivity increase
See here the previous edition of the survey

Page 20
Which of the following actions will your company take to increase sales? (multiple answers)
Question 17
At the beginning of 2014, 80% of respondents say their company’s strategy to increase sales consists of introducing new
products/services for existing clients (compared to 75% in 2013), while only 10% say they will be cutting prices (compared
with 18% in 2013).
Total Respondents: 112
(Skipped this question: 5)
5%
7%
10%
22%
24%
29%
32%
80%
0% 10% 20% 30% 40% 50% 60% 70% 80% 90%
Increasing price
Merging with and/or aquiring competitors to increasemarket share
Cutting prices
Adapting existing product/sevice for new geographicmarkets
Increasing investment in marketing and sales
Opening new distribution channels/reorganizingdistribution to use multiple channels
Entering a new geographic markets for existingproducts/services
Introducing new products and/or services for existingclients and to attract new clients
See here the previous edition of the survey
Page 21
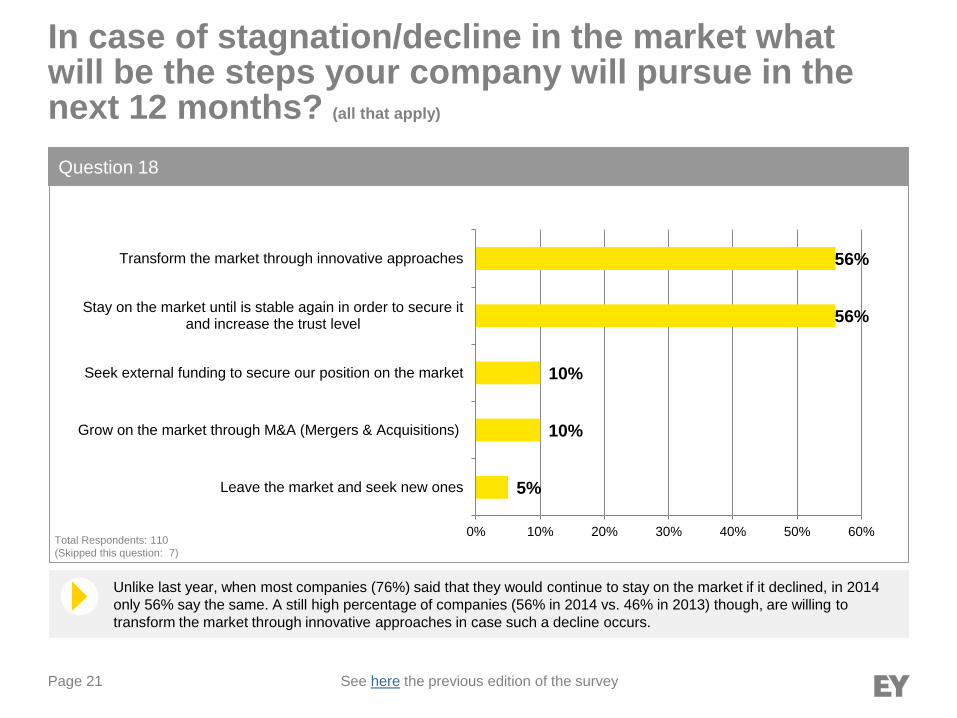
In case of stagnation/decline in the market what will be the steps your company will pursue in the next 12 months? (all that apply)
Question 18
Unlike last year, when most companies (76%) said that they would continue to stay on the market if it declined, in 2014
only 56% say the same. A still high percentage of companies (56% in 2014 vs. 46% in 2013) though, are willing to
transform the market through innovative approaches in case such a decline occurs.
Total Respondents: 110
(Skipped this question: 7)
5%
10%
10%
56%
56%
0% 10% 20% 30% 40% 50% 60%
Leave the market and seek new ones
Grow on the market through M&A (Mergers & Acquisitions)
Seek external funding to secure our position on the market
Stay on the market until is stable again in order to secure itand increase the trust level
Transform the market through innovative approaches
See here the previous edition of the survey

Page 22
Demographics The results of this survey reflect the
responses received to our
questionnaire in the period between
23 Jan. and 6 Feb. 2014, from 117
top executives of major companies
operating in Romania.

Page 23
Romanian company (yes/no) Business type
Demographics
Yes 46% No
54%
3%
23%
74%
0% 20% 40% 60% 80%
Business to Govenrment(you are a supplier forgovernmental entities)
Business to Consumer (yousell directly to individual
costumers)
Business to Business (youonly sell to other companies)
See here the previous edition of the survey

Page 24
Demographics
Industry sector Company revenue level
2%
2%
2%
4%
4%
4%
8%
9%
10%
12%
17%
26%
0% 5% 10% 15% 20% 25% 30%
Chemicals
Retail & Wholesale Trade
Tourism
Information Technology
Pharmaceuticals / Healthcare
Transportation
Telecommunication / Media
Services
Construction / Real Estate
Power / Energy / Mining
Food & Beverage /Agriculture
Industry / Manufacturing
4%
15%
29%
15%
37%
0% 10% 20% 30% 40%
Less than 1 M EUR
1 - 10 M EUR
10 - 50 M EUR
50 - 100 M EUR
100 M EUR +
See here the previous edition of the survey

Page 25
Entity type Job title of respondent
Demographics
2%
3%
3%
5%
8%
13%
28%
38%
0% 10% 20% 30% 40%
Other
Head of business unit
Other C-level executive
Manager
Board member
SVP/VP/Director
CFO/Treasurer/Controller
CEO/President/Managingdirector
3%
5%
36%
56%
0% 10% 20% 30% 40% 50% 60%
State-owned enterprise
Private Equity portfoliocompany
Publicly listed
Privately owned
See here the previous edition of the survey

Page 26
Project team members
Elena Badea Head of Market Enablement
EY Romania
Constantin Măgdălina Knowledge Management Officer,
Marketing, EY Romania
We would like to thank all respondents for their
answers to the questionnaire of this survey.

Page 27
EY | Assurance | Tax | Transactions | Advisory
About EY
EY is a global leader in assurance, tax, transaction and
advisory services. The insights and quality services we
deliver help build trust and confidence in the capital
markets and in economies the world over. We develop
outstanding leaders who team to deliver on our promises
to all of our stakeholders. In so doing, we play a critical
role in building a better working world for our people, for
our clients and for our communities.
© 2014 EYGM Limited.
All Rights Reserved.
ey.com