business process mining for internal fraud risk … · business process mining for internal fraud...
TRANSCRIPT
Business Process Mining for Internal Fraud Risk
Reduction: Results of a Case Study
Mieke Jans Nadine Lybaert Koen VanhoofJan Martijn van der Werf
Abstract
Corporate fraud these days represents a huge cost to our economy.Academic literature merely concentrates on the fight against externalfraud, while internal fraud also represents a major problem. In thispaper we discuss the use of process mining to reduce the risk of internalfraud. This suggestion results in an extension of the IFR2 framework,presented by Jans et al. (2009). Process mining diagnoses processes bymining event logs. This way we can expose opportunities to commitfraud in the process design. We present the extended IFR2 frameworkas a complement to the internal control framework of the COSO andapply this framework in a case company.
1 Introduction
Everybody can recall some kind of fraud that has been all over the news.If it were Enron, WorldCom, Lernout & Hauspie, Ahold, Societe Generaleor another case does not matter. Fact is that fraud has become a seriouspart of our life and hence a serious cost to our economy. Several studies onthis phenomenon report shocking numbers: forty-three percent of companiesworldwide have fallen victim to economic crime in the years 2006 and 2007(PwC, 2007). The average financial damage to companies subjected to thissurvey was US$ 2.42 million per company over two years. Participants ofanother study (ACFE, 2006)1 estimate a loss of five percent of a company’sannual revenues to fraud. Applied to the 2006 United States Gross DomesticProduct of US$ 13,246.6 billion, this would translate to approximately US$662 billion in fraud losses for the United States only. These numbers alladdress corporate fraud.
1”The Association of Certified Fraud Examiners (ACFE) is the world’s premier providerof anti-fraud training and education. Together with nearly 40,000 members, the ACFEis reducing business fraud worldwide and inspiring public confidence in the integrity andobjectivity within the profession.” (www.acfe.com)
1
There are several types of corporate fraud. The most prominent distinctionone can make in fraud classification is internal versus external fraud, a classi-fication based on the relationship the perpetrator has to the victim company.Management fraud is an example of internal fraud, where insurance fraudis a classic example of external fraud.
In this paper we present the ’Extended IFR2 framework’, based on Janset al. (2009)’s IFR2 framework, aimed at internal fraud risk reduction. Riskreduction comprehends both fraud detection and prevention and the frame-work is for both academics to investigate how to reduce internal fraud riskand for organizations. In a previous paper, the IFR2 framework with datamining being the core to reduce internal fraud risk is presented. (Jans et al.,2009) In this paper we complement that framework with a process miningpart, resulting in the extended IFR2 framework. Process mining aims at un-covering a process model based on real transaction logs. This relative newresearch domain can be applied in several ways for the purpose of internalfraud risk reduction.
We start the paper with an introduction in internal fraud and internal con-trol, since our framework is suggested as a complement to the internal controlframework. In the next section we present our framework, followed by anintroduction in process mining. Because the concepts of continuous audit-ing and continuous monitoring have a lot in common with the presentedwork, these concepts are shortly mentioned in Section 5. In Section 6 wepresent the application of our framework in a case company. We end witha conclusion.
2 Internal Fraud and Internal Control
In this paper, we consider the threat of internal fraud. For internal corporatefraud we rely on the definition of ”occupational fraud and abuse” by theACFE: ”The use of one’s occupation for personal enrichment through thedeliberate misuse or misapplication of the employing organization’s resourcesor assets.” (ACFE, 2006) This definition encompasses a wide variety ofconduct by executives, employees, managers, and principals of organizations.Violations can range from asset misappropriation, fraudulent statements andcorruption over pilferage and petty theft, false overtime, using companyproperty for personal benefit to payroll and sick time abuses.
Where the academic field does not pay much of attention to internal fraud(merely to external fraud), it has received a great deal of attention fromother interested parties. The emergence of fraud into our economic worlddidn’t go unnoticed. In 2002, a US fraud standard (SAS 99) was createdand by the end of 2004 also an international counterpart (ISA 240) was ef-fective. Meanwhile, the CEO’s of the International Audit Networks released
2
a special report in November 2006: Global Capital Markets and the GlobalEconomy: A Vision From the CEOs of the International Audit Networks.This report, issued by the six largest global audit networks, is released in thewake of corporate scandals. The authors of this report express their believein mitigating fraud, as they name it ”one of the six vital elements, neces-sary for capital market stability, efficiency and growth”. The remaining fiveelements concern investor needs for information, the alignment and supportof the roles of various stakeholders, the auditing profession, reporting andinformation quality.
The threat of internal fraud was first officially recognized in 1985 when the(US) National Commission on Fraudulent Financial Reporting (known asthe Treadway Commission) was formed. To study the causes of fraudulentreporting and make recommendations to reduce its incidence, the TreadwayCommission issued a final report in 1987 with recommendations for auditors,public companies, regulators, and educators. This report re-emphasized theimportance of internal control in reducing the incidence of fraudulent finan-cial reporting and included a recommendation for all public companies tomaintain internal controls. The Committee of Sponsoring Organizations ofthe Treadway Commission (COSO) 2 was formed to commission the Tread-way Commission to perform its task. In response to this recommendation,COSO developed an internal control framework, issued in 1992 and entitledInternal Control - Integrated Framework. According to the COSO frame-work, internal control is defined as:
A process, effected by the entity’s board of directors, manage-ment, and other personnel, designed to provide reasonable as-surance regarding the achievement of objectives in the followingcategories:
• Effectiveness and efficiency of operations
• Reliability of financial reporting
• Compliance with applicable laws and regulations
In meanwhile, COSO issued in 2004 a revision of the Internal Control - In-tegrated Framework under the title of Enterprise Risk Management Frame-work, expanding on internal control to the broader subject of enterprise riskmanagement. (Cosserat, 2004; Davia et al., 2000; Whittington and Pany,1998) Following this broad definition, internal control can both prevent and
2The sponsoring accounting organizations include the American Institute of CertifiedPublic Accountants (AICPA), the American Accounting Association (AAA), the FinancialExecutives Institute (FEI), the Institute of Internal Auditors (IIA), and the Institute ofManagement Accountants (IMA).
3
detect fraud. And although this definition is stemming from the foundationof the National Commission on Fraudulent Financial Reporting, also otherclasses of fraud than fraudulent financial reporting can be encountered.
Also the studies of PwC and the ACFE mentioned before, reveal some infor-mation concerning the detection of internal fraud. Internal control seems todeliver an effective tool in the fight against internal fraud. So from differentangles, internal control is considered to be a means that has the ability tofight internal fraud. Likewise, in a business environment internal fraud iscurrently dealt with by internal control. As mentioned before, internal con-trol encompasses a wide variety of tasks and settings. Next to a qualitativeapproach (like for example creating a control environment), quantitativedata analyzing is required. It is at this point we believe there lies an op-portunity to combine academic research with practical insights. In anotherpaper by Jans et al. (2009) a data mining approach is proposed as a com-plement to the internal control framework, leading to the IFR2 framework.The focus hereby lies on fraud risk reduction, which includes both fraudprevention and fraud detection, just like internal control. For a detaileddescription of the IFR2 framework, we refer to Jans et al. (2009).
In this paper, we wish to introduce yet another complement to the internalcontrol framework, a second path. Where the first complementary advisefor internal fraud risk reduction is to apply a data mining approach, we nowsuggest to also apply a process mining approach. Process mining is a relativenew research domain and aims to extract an ”a posteriori” process modelfrom stored transaction logs. This enables Delta analysis, i.e. detectingdiscrepancies between the process design constructed in the design phaseand the actual execution in the enactment phase (van der Aalst et al., 2003).This kind of analysis is important in the light of defining opportunities tocommit fraud. Our suggestion is poured into an extension of the IFR2
framework, leading to the extended IFR2 framework. We will discuss theframework and the underlying ideas in the following section.
3 The Extended IFR2 Framework
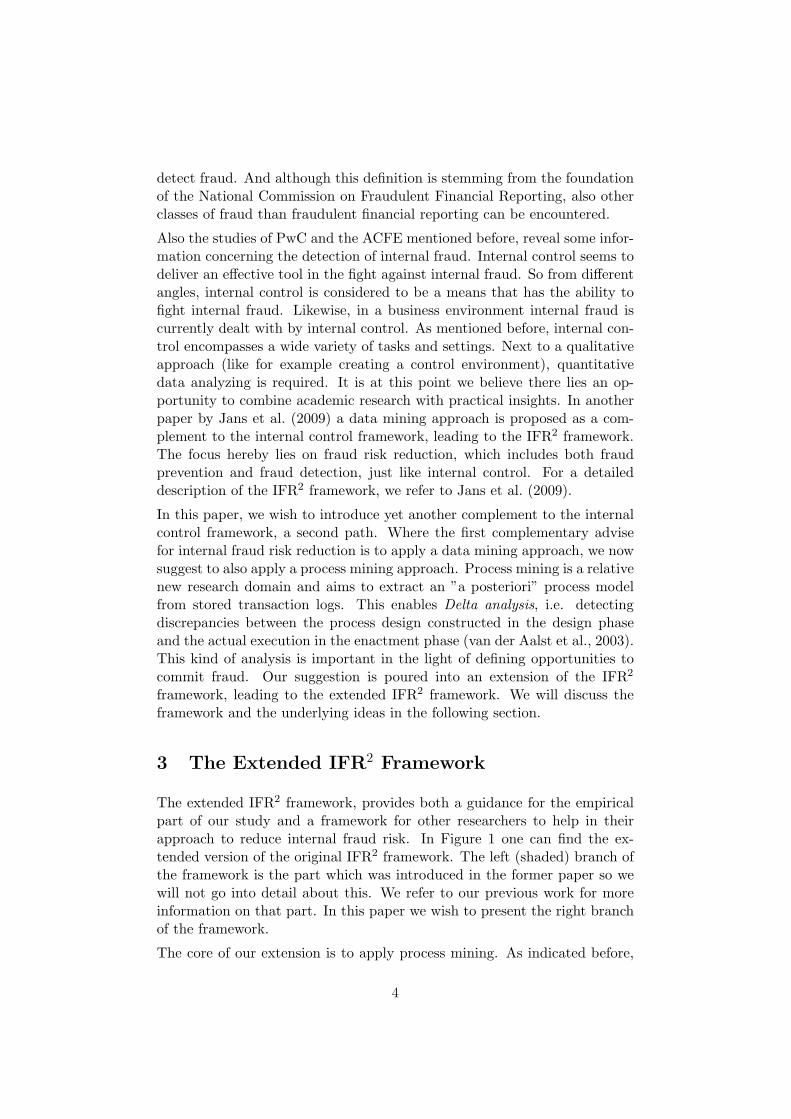
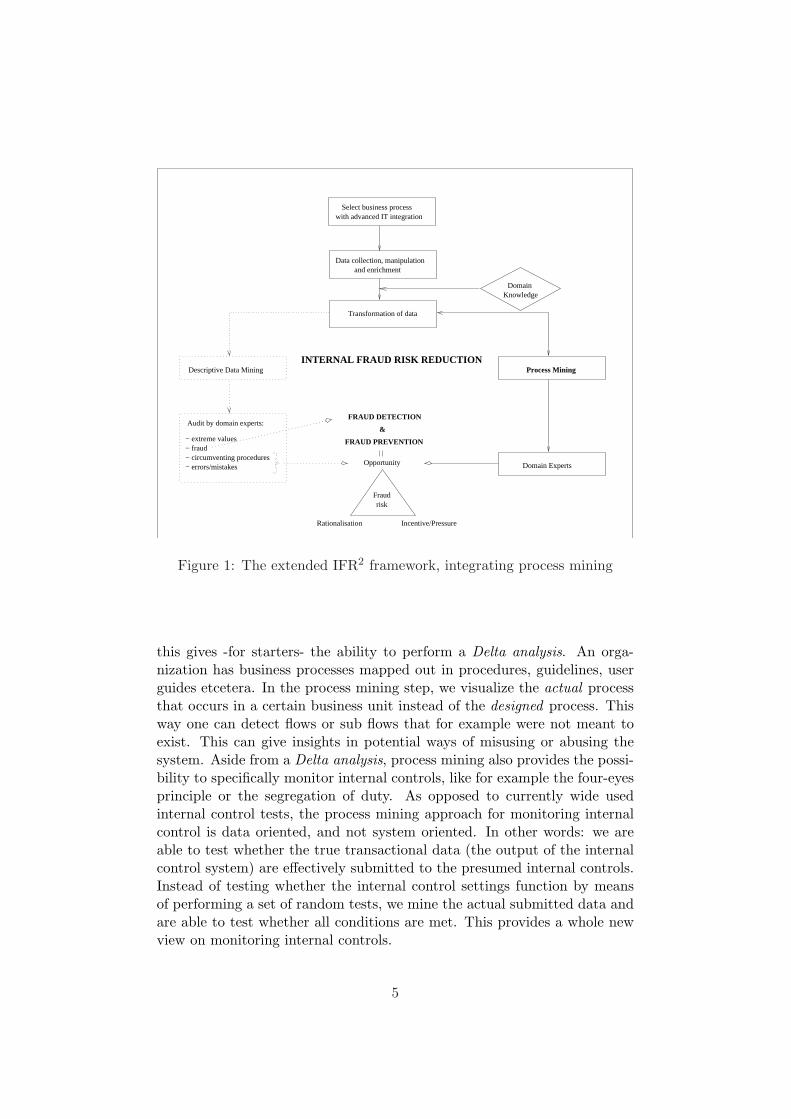
The extended IFR2 framework, provides both a guidance for the empiricalpart of our study and a framework for other researchers to help in theirapproach to reduce internal fraud risk. In Figure 1 one can find the ex-tended version of the original IFR2 framework. The left (shaded) branch ofthe framework is the part which was introduced in the former paper so wewill not go into detail about this. We refer to our previous work for moreinformation on that part. In this paper we wish to present the right branchof the framework.
The core of our extension is to apply process mining. As indicated before,
4
Descriptive Data Mining
Audit by domain experts:
− extreme values− fraud− circumventing procedures− errors/mistakes
with advanced IT integration
FRAUD PREVENTION
FRAUD DETECTION
Fraudrisk
Rationalisation Incentive/Pressure
INTERNAL FRAUD RISK REDUCTION
&
Opportunity
Process Mining
Data collection, manipulation
Select business process
and enrichment
Transformation of data
Domain Knowledge
Domain Experts
Figure 1: The extended IFR2 framework, integrating process mining
this gives -for starters- the ability to perform a Delta analysis. An orga-nization has business processes mapped out in procedures, guidelines, userguides etcetera. In the process mining step, we visualize the actual processthat occurs in a certain business unit instead of the designed process. Thisway one can detect flows or sub flows that for example were not meant toexist. This can give insights in potential ways of misusing or abusing thesystem. Aside from a Delta analysis, process mining also provides the possi-bility to specifically monitor internal controls, like for example the four-eyesprinciple or the segregation of duty. As opposed to currently wide usedinternal control tests, the process mining approach for monitoring internalcontrol is data oriented, and not system oriented. In other words: we areable to test whether the true transactional data (the output of the internalcontrol system) are effectively submitted to the presumed internal controls.Instead of testing whether the internal control settings function by meansof performing a set of random tests, we mine the actual submitted data andare able to test whether all conditions are met. This provides a whole newview on monitoring internal controls.
5
Another advantage of applying process mining is that, just like with thedata mining application, it is not necessary to have a specific fraud in mind.Further surplus value is delivered by the objectivity with which the processmining techniques work, without making any presuppositions. We see theDelta analysis as a starting point to evaluate with an open mind what op-portunities these deviations can mean for a perpetrator. When one has aspecific fraud in mind when interpreting the analysis and looking if there areopportunities to commit this specific fraud, one can be blind for other oppor-tunities. On the other hand, when mining the organizational and the caseperspective (see below), it can be beneficial to have some specific fraud(s)in mind. This is certainly the case when monitoring internal controls. Atthis stage specific internal controls, motivated by specific frauds in mind,are monitored and checked.
After applying process mining, feedback from and to the domain experts isneeded to interpret the results. This will eventually lead to new insightswhether or not there are opportunities to commit fraud. It is the element’Opportunity’ of Cressey’s hypothesis that makes it interesting to gain theseinsights. Cressey’s hypothesis, better known as the ”fraud triangle”, seesthree elements necessary for someone to commit fraud. There has to bepressure (or a ”perceived non-shareable financial need”), a perceived op-portunity and the perpetrator must be able to rationalize its acts. (Wells,2005) The fraud triangle is cited many times in fraud literature and hasbecome an important hypothesis. Opportunity is the only fraud triangleelement an organization can exert influence on and hence is most importantin our framework. Also according to Albrecht et al. (1984)’s ”fraud scale”opportunity is an element of influence on fraud risk.
As can be seen, the process mining part of the framework works primarilyon fraud prevention. However, the information gathered from this analysis,can be used as exploratory research and implemented in the data miningpart. This way, process mining can indirectly also lead to fraud detection.
Before turning to the case study where our extended IFR2 framework is ap-plied, we give a short introduction to process mining and the ProM frame-work.
4 Process Mining
Nowadays many different information systems, like ERP, WFM, CRM andB2B systems, are characterized by the omnipresence of logs. Typically, theseinformation systems record information about the usage of the system byits users. These logs contain information about the instances, also calledcases, processed in the system, the activities executed for each instance, atwhat time the activities were executed and by whom. Some systems also
6
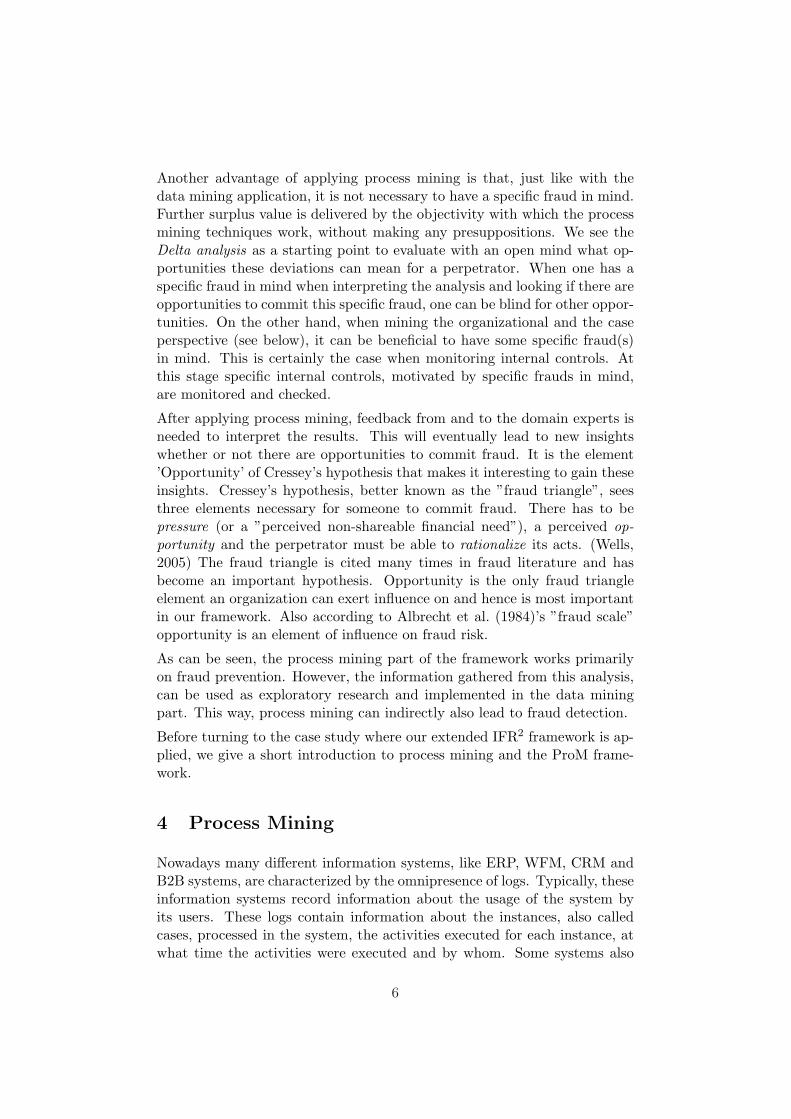
Table 1: An example of an event log, used by van der Aalst et al. (2007).
Case id Activity id Originator Timestamp
case 1 activity A John 9-3-2004:15.01case 2 activity A John 9-3-2004:15.12case 3 activity A Sue 9-3-2004:16.03case 3 activity B Carol 9-3-2004:16.07case 1 activity B Mike 9-3-2004:18.25case 1 activity C John 10-3-2004:9.23case 2 activity C Mike 10-3-2004:10.34case 4 activity A Sue 10-3-2004:10.35case 2 activity B John 10-3-2004:12.34case 2 activity D Pete 10-3-2004:12.50case 5 activity A Sue 10-3-2004:13.05case 4 activity C Carol 11-3-2004:10.12case 1 activity D Pete 11-3-2004:10.14case 3 activity C Sue 11-3-2004:10.44case 3 activity D Pete 11-3-2004:11.03case 4 activity B Sue 14-3-2004:11.18case 5 activity E Clare 17-3-2004:12.22case 5 activity D Clare 18-3-2004:14.34case 4 activity D Pete 19-3-2004:15.56
contain information about the data users entered for each activity. However,this data is not actively used by the organization to analyze the underlyingprocesses supported by the system.
Process mining aims to make a difference. “The basic idea of process miningis to diagnose processes by mining event logs for knowledge” (van der Aalstand de Medeiros, 2005). It allows to analyze these event logs, sometimes alsoreferred to as ‘audit trail’, ‘transaction log’ or ‘history’. Records in theselogs are called events. In process mining, each event needs to refer to an ac-tivity for a specific case. Preferably, each event also refers to the performer,the originator of the event, and a time stamp. For each process under in-vestigation these are the constraining assumptions. If available data fulfillsthese assumptions, process mining can be applied on that particular process.Table 1 shows a classic example of an event log, used by van der Aalst et al.(2007), van Dongen et al. (2005) and van der Aalst and de Medeiros (2005)amongst others. The event log shows an example with 19 events, allocatedto five cases, describing five different activities, performed by six persons.
Event logs are the starting point of process mining. The data of the eventlog can be mined and different aspects about the underlying process can beanalyzed. In general, three different perspectives can be distinguished: theprocess perspective, the organizational perspective and the case perspective.The process perspective or the “How?” question focuses on the ordering ofactivities, i.e. it tries to answer the question “Which paths are followed?”
7
This is typically expressed in graphical process models, using a formalismlike Petri Nets, Event-driven Process Chain (EPC) or BPMN. The orga-nizational perspective or the “Who?” question focuses on the users, theoriginators, that play a role within the process. In this perspective, under-lying relations between performers or between performers and tasks can beexposed. The case perspective or the “What?” question focuses on a case inisolation. Typically, for this analysis, the log needs to be enriched by extradata about the case. This can be data about the complete case, or data fora specific event, like the data submitted at the event (van der Aalst et al.,2007).
In the context of internal fraud risk reduction and the broader frameworkwe place process mining in, an important perspective to start with is theprocess perspective. In a later stage, we turn to the organizational and thecase perspective. Therefore, in this study we will start with the processperspective to expose opportunities to commit fraud within a company. Af-terwards, we turn to the other perspectives, mostly in the light of monitoringcontrols (see Section 5).
For this study, the open-source tool ProM (??, Aal) is used. ProM consistsof many different algorithms to cover the analysis of the three perspec-tives. ProM is designed in such a way that researchers and users can easilydevelop their own plugins and add them to the framework. For more infor-mation about ProM, we refer the reader to van Dongen et al. (2005) and towww.processmining.org.
5 Continuous Auditing and Monitoring
Traditionally, internal audits and their related testing of controls are exe-cuted on a cyclical basis. Auditors typically check random samples, and usesimple checklists to audit an organization. However, with the electronic stor-age of all kinds of data, easily accessible and available in large volumes, newmethods of internal auditing can be developed and implemented. Already,advanced technology has been employed to perform continuous auditing.Continuous auditing is defined as ”a framework for issuing audit reportssimultaneously with, or a short period of time after, the occurrence of therelevant events” (CICA/AICPA, 1999). An important subset of continu-ous auditing is the continuous monitoring of business process controls (Alleset al., 2006). Continuous monitoring of controls is defined by the Institute ofInternal Auditors as ”a process that management puts in place to ensure thatits policies and procedures are adhered to, and that business processes areoperating effectively. Continuous monitoring typically involves automatedcontinuous testing of all transactions within a given business process areaagainst a suite of controls rules. (IIA, 2005) Notice that continuous mon-
8
itoring is a responsibility management bears, while continuous auditing isa task of the internal audit department. However, there is an interactioneffect between the efforts put into place concerning continuous monitoringand continuous auditing. When management performs continuous monitor-ing on a comprehensive basis, the internal audit department can partly relyon this and no longer needs to perform the same detailed techniques as itotherwise would have under continuous auditing. (IIA, 2005)
In her framework, COSO also identifies the monitoring of controls as oneof the five components of internal control. The remaining four componentsare the control environment, the entity’s risk assessment process, the infor-mation system and control activities. Employees need to know that non-compliance with controls is likely to be detected (deterrence effect). Mon-itoring controls also provides feedback concerning these controls (Cosserat,2004).
We can conclude that the (continuous) monitoring of controls is certainly anactivity that contributes to internal fraud risk reduction. The reason that weintroduce the concept of continuous monitoring here, is that process miningprovides a way of implementing such a continuous monitoring system. Pro-cess mining can help in different aspects of monitoring and auditing. As allactions of each case are recorded by the system, one can check the completeprocess, rather than taking random samples. Secondly, process mining canhelp in the discovery, analysis, implementation and verification of businesscontrols. One example is the segregation of duties. It is a common controlincluded in many ERP systems. If one takes the procurement business pro-cess for instance, one person may have the authority to create a purchasingorder and another person has the ability to approve the invoice. This is acontrol on the transactional level. It can however occur that one person hasboth authorities, e.g. the person is allowed to create a purchasing order andto approve an invoice. A control should prohibit that this person is approv-ing invoices of purchase orders that person created himself. Process miningcan verify this property, i.e. it is checked whether there is no purchase orderwhere an invoice is approved by the same person that created the purchaseorder. This example shows that process mining has the potential to assistthe auditor.
6 Case Study at Epsilon
For the application of our suggested framework, the corporation of a casecompany was acquired. This company, which chooses to stay anonymousand is called Epsilon in this study, is ranked in the top 20 of Europeanfinancial institutions. The business process selected for internal fraud riskreduction is procurement, so data from the case company’s procurement
9
cycle is the input of our study. More specifically, the creation of purchasingorders (PO’s) was adopted as process under investigation. This is inspiredby the lack of fraud files (at the compliance department) in this businessprocess within the case company, while one assumes this business process isas vulnerable to fraud as every other business process.
In a first part of the case study, we want to support the ideas of the domainexperts about the process. For this purpose, we perform a process diagnosticstep. A good methodology for process diagnostics by process mining can befound in Bozkaya et al. (2008), which will be the applied methodology in thenext paragraphs. It consists of five phases: log preparation, log inspection,control flow analysis, performance analysis, and role analysis.
In a second part of the case study, we turn to a verification step. Duringthis step, we wish to check whether certain aspects and conditions of theprocess hold or not. This will be elaborated in section ??. We now startwith the five phases of process diagnostics.
7 Log Preparation
As a start, a txt-dump is made out of their ERP system, SAP. All PO’s thatin 2007 resulted in an invoice are subject of our investigation. We restrictedthe database to invoices of Belgium. This raw data is then reorganized intoan event log and a random sample of 10,000 process instances out of 402,108was taken (for reasons of computability). Before creating the event log, thedifferent activities or events a case passes through, have to be identified, inorder to meet the assumptions.
An important assumption at process mining is that it is possible to describethe process under consideration by sequentially recording events. Theseevents are the activities that all together constitute the process. Aside fromthe possibility to determine such sequential events, it is also assumed thatthese events are all linked to one particular case, called a process instance.
It is beyond the scope of this paper to fully describe the procurement processat Epsilon, supported by SAP. What it boils down to (based on interviewingdomain experts) is that a PO is made, signed and released, the goods arereceived, an invoice is received and it gets paid. During this process alldifferent kind of aspects are logged into the ERP system, from which wenow have to create an event log. The first question we must ask ourselvesis ’What would be a correct process instance to allocate events to?’.
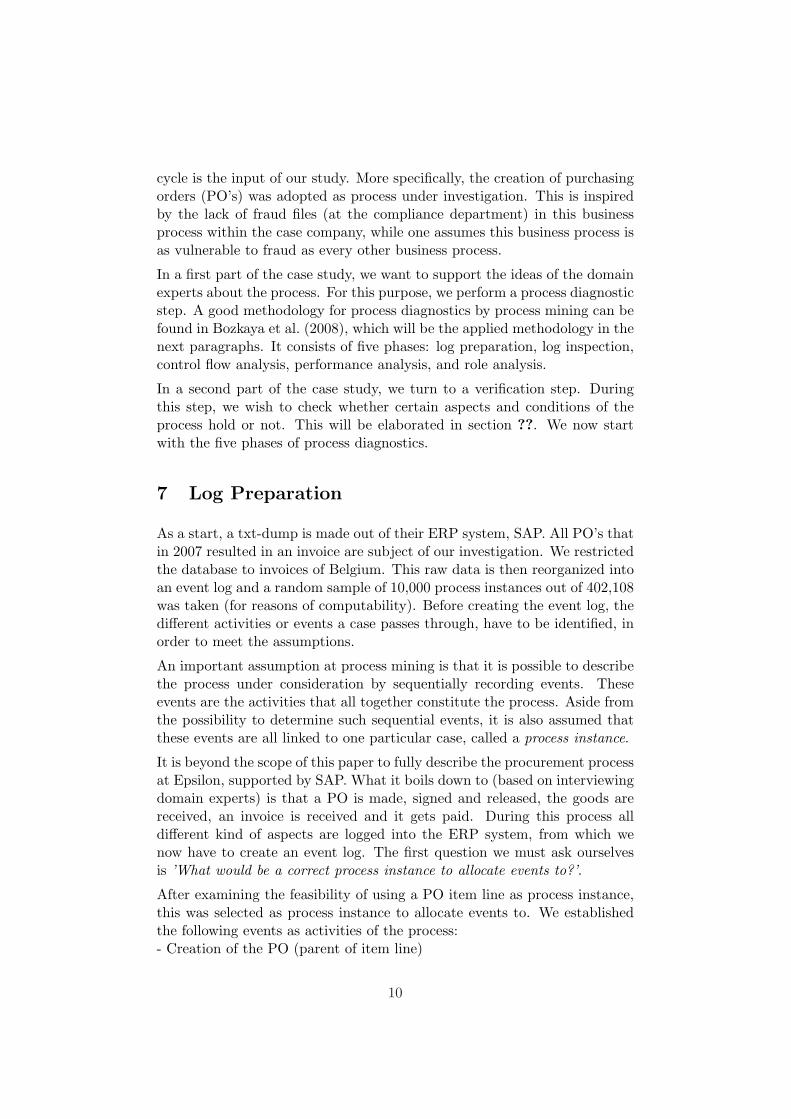
After examining the feasibility of using a PO item line as process instance,this was selected as process instance to allocate events to. We establishedthe following events as activities of the process:- Creation of the PO (parent of item line)
10
Table 2: Model example of event log of the purchasing process
PI-ID WFMElt Event Type Timestamp Originator
450000000190 Create PO Complete 02 Feb 2006 John450000000190 Change Line Complete 30 Nov 2006 John450000000190 Sign Complete 05 Dec 2006 Paul450000000190 Release Complete 06 Dec 2006 Anne450000000190 GR Complete 05 Jan 2007 John450000000190 IR Complete 15 Jan 2007 Matt450000000190 Pay Complete 16 Feb 2007 Marianne450000000210 Create PO Complete 23 Jan 2007 Doug...
- (Change of the particular item line)- Sign of parent PO after last change of item line- Release of parent PO after last change of item line- Goods Receipt on item line (GR)- Invoice Receipt on item line (IR)- Payment (or Reversal) of item lineThe Change of an item line is no imperative event and could occur on severaldifferent moments in the process. This change can trigger a new ’Sign’ and’Release’, but this is not always the case. Also important to note is thedouble dimensionality of the events. ’Create PO’, ’Sign’ and ’Release’ areactivities that occur on the header level of a PO. The remaining events areon the level of a PO line item. This can lead for instance to a ’Sign’ and’Release’ in an audit trail of a particular PO line item (the process instance),while these events are not actually related to this line item, but perhaps toanother line item of the same parent PO. This aspect is important to beaware of when interpreting the results.
The established events in our event log are also called Work Flow ModelElements (WFMElt). After reorganizing the raw data (performed in SASsoftware), the event log contains per Process Instance (PI, being a PO lineitem) different events, being a WFMElt, with a particular Timestamp andOriginator for each event. Also the Event Type must be stated, but this willbe set default to ’Complete’, since we do not have information to distinguishfurther. In Table 2 a model event log is given. Of course, the event log basedon real life data will look differently and not as clean as this example.
For modeling the process underlying these activities and expecting flows,we use a Petri Net representation. A Petri Net is a dynamic structure thatconsists of a set of transitions, places and directed arcs that connect thesetransitions and places in a bipartite manner. Transitions are indicated byboxes and relate to some task, while places are indicated by circles andrepresent passive phases. Places may hold one or more tokens, indicated by
11
black dots. If all input places of a transition contain a token, this transitionis enabled and may fire. When a transition fires, it consumes a token ofeach of the input places and produces a token for each of its output places.The Petri Net in Figure ?? (Not presented yet) represents in this way theprocurement process at the case company.
The first activity flows are straightforward. After the parent PO of anitem line (our process instance) is created, this parent PO can be signedand released, or only released. If only one signature is needed, one onlyhas a release, otherwise this release is preceded by a sign. In reality andalso depicted in our Petri Net, the item line can be changed between thecreation and the Sign - Release activity. It is also possible that the item lineis changed afterwards and a new sign and release could be triggered. Onlyafter a release, an order can be sent to the supplier which will eventuallyresult in a Goods Receipt and an Invoice Receipt. This is an AND-relation,without a specified order. Afterwards the payment can occur. Normally,both a Goods and Invoice Receipt are prerequisites, so we depicted it thisway. However, in some circumstances no Goods Receipt is necessary. Inthese cases the goods receipt indicator must be turned off.
After turning the information from the SAP data base into the suggestedevents and event log, this event log was converted to the MXML format,a generic XML format to store event logs in. At this format, there is alsoadditional space for extra data, in the form of attributes. These attributescan be inserted at each level. The attributes created in our event log arelisted in Table 3. On the level of a process instance, we added the followinginformation: the document type of the parent PO, the purchasing group thatentered this parent PO, and the associated supplier. Although these threeattributes are actually linked to the parent PO and not to a separate itemline, this is useful information. Aside from these first three attributes, wealso included the order quantity and unit of the PO item line, the resultingnet value and whether or not the goods receipt indicator was turned off.3
Next to this PO related information, we also included the total quantityand total value of all Goods Receipts that are linked to this PO item line.We did the same for the related Invoice Receipts and the total value of allPayments that are associated with this process instance.
On the level of the audit trail entry, a work flow model element also carriesunique information. In particular four events are enriched with additionalinformation: ’Change Line’, ’IR’, ’GR’, and ’Pay’. When the event concernsa ’Change Line’, we store information about this change: If it was a changeof the net value, what was the size of this modification? If not the net valuewas changed, but another field, for example the delivery address, this field
3This is important to verify if the ERP system’s internal control on this part is workingefficiently. (A ’Pay’ should not occur without a ’GR’, unless the goods receipt indicatoris turned off).
12
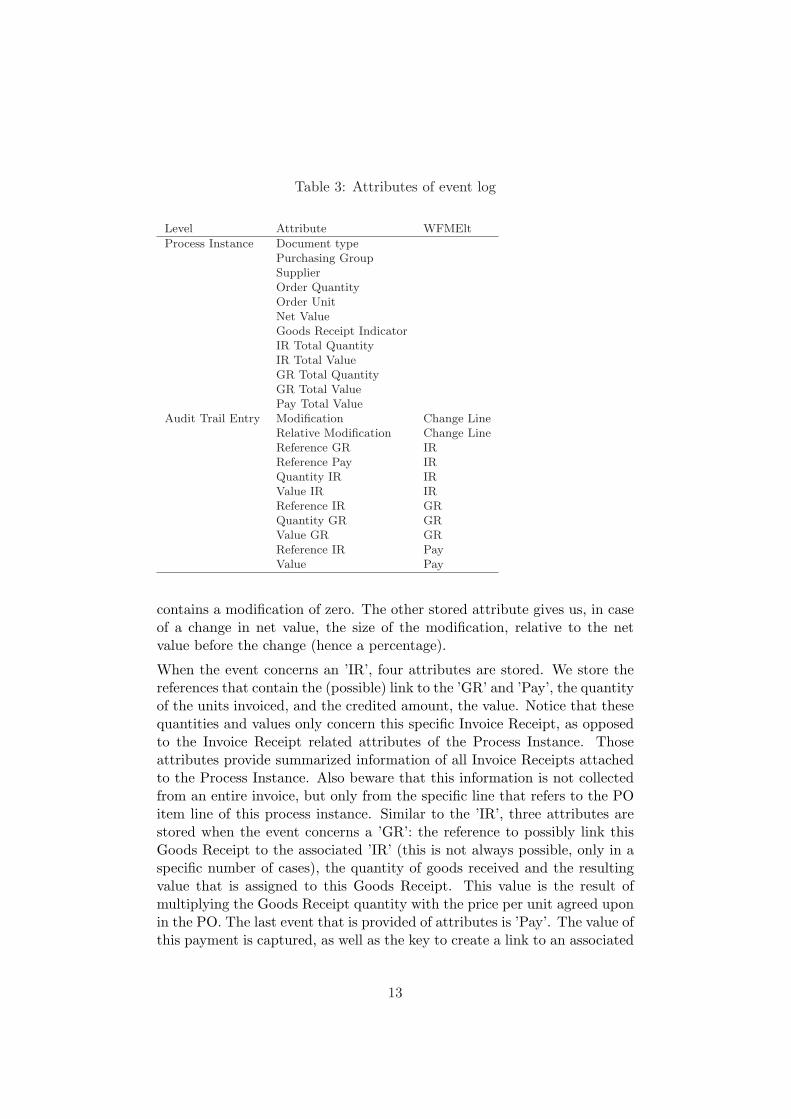
Table 3: Attributes of event log
Level Attribute WFMElt
Process Instance Document typePurchasing GroupSupplierOrder QuantityOrder UnitNet ValueGoods Receipt IndicatorIR Total QuantityIR Total ValueGR Total QuantityGR Total ValuePay Total Value
Audit Trail Entry Modification Change LineRelative Modification Change LineReference GR IRReference Pay IRQuantity IR IRValue IR IRReference IR GRQuantity GR GRValue GR GRReference IR PayValue Pay
contains a modification of zero. The other stored attribute gives us, in caseof a change in net value, the size of the modification, relative to the netvalue before the change (hence a percentage).
When the event concerns an ’IR’, four attributes are stored. We store thereferences that contain the (possible) link to the ’GR’ and ’Pay’, the quantityof the units invoiced, and the credited amount, the value. Notice that thesequantities and values only concern this specific Invoice Receipt, as opposedto the Invoice Receipt related attributes of the Process Instance. Thoseattributes provide summarized information of all Invoice Receipts attachedto the Process Instance. Also beware that this information is not collectedfrom an entire invoice, but only from the specific line that refers to the POitem line of this process instance. Similar to the ’IR’, three attributes arestored when the event concerns a ’GR’: the reference to possibly link thisGoods Receipt to the associated ’IR’ (this is not always possible, only in aspecific number of cases), the quantity of goods received and the resultingvalue that is assigned to this Goods Receipt. This value is the result ofmultiplying the Goods Receipt quantity with the price per unit agreed uponin the PO. The last event that is provided of attributes is ’Pay’. The value ofthis payment is captured, as well as the key to create a link to an associated
13
’IR’.
After collecting all the data necessary for the event log, ProMImport is usedto convert our event log into the desired MXML format.
8 Log Inspection
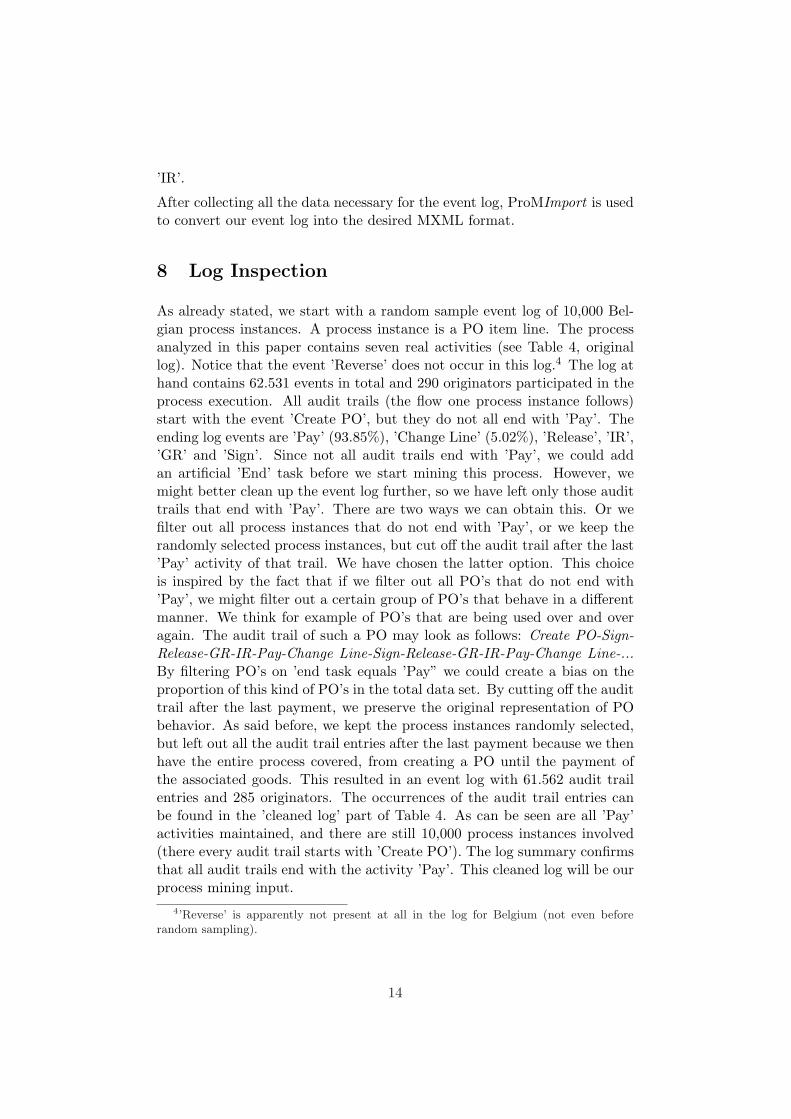
As already stated, we start with a random sample event log of 10,000 Bel-gian process instances. A process instance is a PO item line. The processanalyzed in this paper contains seven real activities (see Table 4, originallog). Notice that the event ’Reverse’ does not occur in this log.4 The log athand contains 62.531 events in total and 290 originators participated in theprocess execution. All audit trails (the flow one process instance follows)start with the event ’Create PO’, but they do not all end with ’Pay’. Theending log events are ’Pay’ (93.85%), ’Change Line’ (5.02%), ’Release’, ’IR’,’GR’ and ’Sign’. Since not all audit trails end with ’Pay’, we could addan artificial ’End’ task before we start mining this process. However, wemight better clean up the event log further, so we have left only those audittrails that end with ’Pay’. There are two ways we can obtain this. Or wefilter out all process instances that do not end with ’Pay’, or we keep therandomly selected process instances, but cut off the audit trail after the last’Pay’ activity of that trail. We have chosen the latter option. This choiceis inspired by the fact that if we filter out all PO’s that do not end with’Pay’, we might filter out a certain group of PO’s that behave in a differentmanner. We think for example of PO’s that are being used over and overagain. The audit trail of such a PO may look as follows: Create PO-Sign-Release-GR-IR-Pay-Change Line-Sign-Release-GR-IR-Pay-Change Line-...By filtering PO’s on ’end task equals ’Pay” we could create a bias on theproportion of this kind of PO’s in the total data set. By cutting off the audittrail after the last payment, we preserve the original representation of PObehavior. As said before, we kept the process instances randomly selected,but left out all the audit trail entries after the last payment because we thenhave the entire process covered, from creating a PO until the payment ofthe associated goods. This resulted in an event log with 61.562 audit trailentries and 285 originators. The occurrences of the audit trail entries canbe found in the ’cleaned log’ part of Table 4. As can be seen are all ’Pay’activities maintained, and there are still 10,000 process instances involved(there every audit trail starts with ’Create PO’). The log summary confirmsthat all audit trails end with the activity ’Pay’. This cleaned log will be ourprocess mining input.
4’Reverse’ is apparently not present at all in the log for Belgium (not even beforerandom sampling).
14
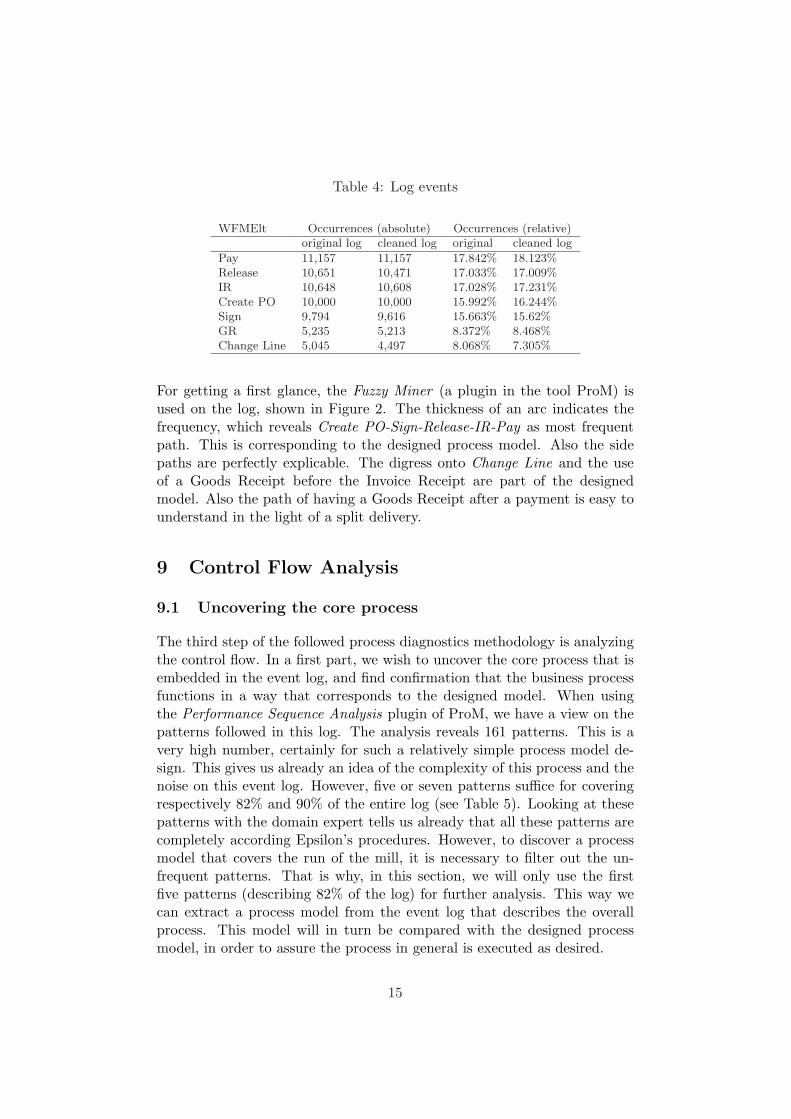
Table 4: Log events
WFMElt Occurrences (absolute) Occurrences (relative)original log cleaned log original cleaned log
Pay 11,157 11,157 17.842% 18.123%Release 10,651 10,471 17.033% 17.009%IR 10,648 10,608 17.028% 17.231%Create PO 10,000 10,000 15.992% 16.244%Sign 9,794 9,616 15.663% 15.62%GR 5,235 5,213 8.372% 8.468%Change Line 5,045 4,497 8.068% 7.305%
For getting a first glance, the Fuzzy Miner (a plugin in the tool ProM) isused on the log, shown in Figure 2. The thickness of an arc indicates thefrequency, which reveals Create PO-Sign-Release-IR-Pay as most frequentpath. This is corresponding to the designed process model. Also the sidepaths are perfectly explicable. The digress onto Change Line and the useof a Goods Receipt before the Invoice Receipt are part of the designedmodel. Also the path of having a Goods Receipt after a payment is easy tounderstand in the light of a split delivery.
9 Control Flow Analysis
9.1 Uncovering the core process
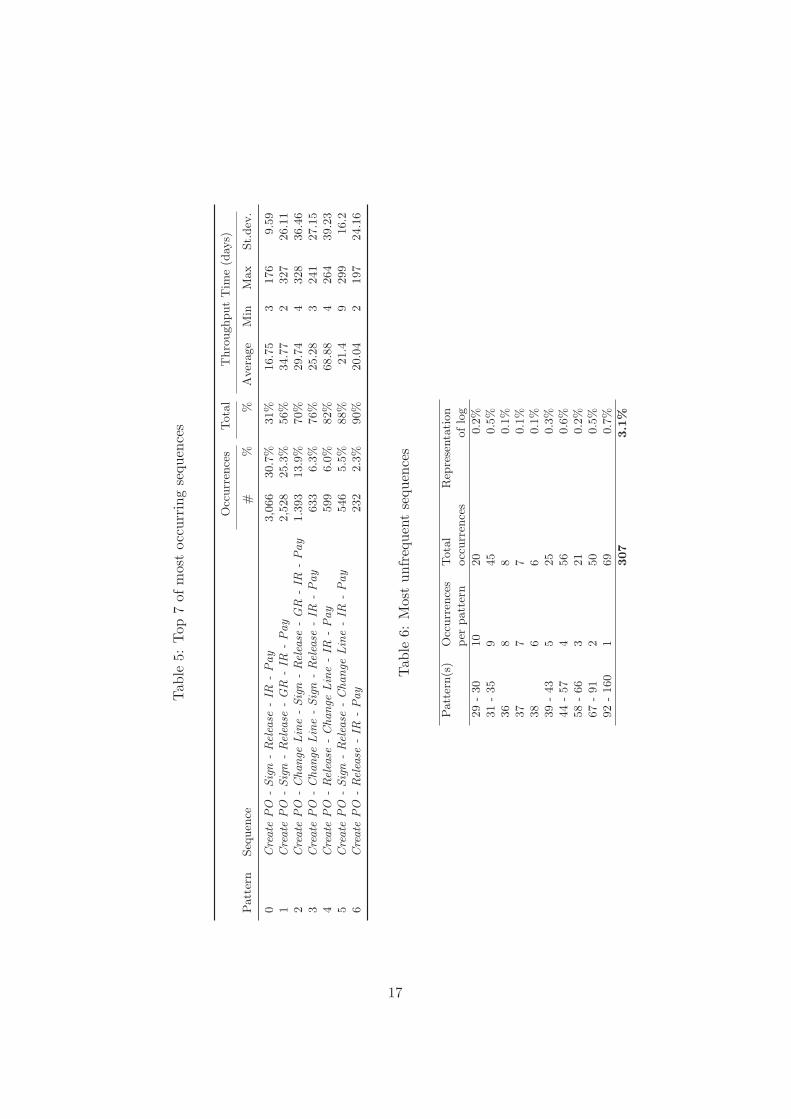
The third step of the followed process diagnostics methodology is analyzingthe control flow. In a first part, we wish to uncover the core process that isembedded in the event log, and find confirmation that the business processfunctions in a way that corresponds to the designed model. When usingthe Performance Sequence Analysis plugin of ProM, we have a view on thepatterns followed in this log. The analysis reveals 161 patterns. This is avery high number, certainly for such a relatively simple process model de-sign. This gives us already an idea of the complexity of this process and thenoise on this event log. However, five or seven patterns suffice for coveringrespectively 82% and 90% of the entire log (see Table 5). Looking at thesepatterns with the domain expert tells us already that all these patterns arecompletely according Epsilon’s procedures. However, to discover a processmodel that covers the run of the mill, it is necessary to filter out the un-frequent patterns. That is why, in this section, we will only use the firstfive patterns (describing 82% of the log) for further analysis. This way wecan extract a process model from the event log that describes the overallprocess. This model will in turn be compared with the designed processmodel, in order to assure the process in general is executed as desired.
15
Create POcomplete
0,962
Change Linecomplete
0,237
0,3820,321
Signcomplete
0,474
0,7820,120
0,068?
0,3140,141
0,0230,467
Releasecomplete
0,651
0,9670,130
0,0100,398
IRcomplete
0,610
0,6710,055
GRcomplete
0,350
0,5110,063
0,049?
Paycomplete
1,000
1,0000,242
0,1171,000
0,0160,046
0,5300,188
0,091?
Figure 2: Fuzzy Miner result
16
Tab
le5:
Top
7of
mos
toc
curr
ing
sequ
ence
s
Occ
urr
ence
sTota
lT
hro
ughput
Tim
e(d
ays)
Patt
ern
Seq
uen
ce#
%%
Aver
age
Min
Max
St.
dev
.
0C
reate
PO
-Sig
n-
Rel
ease
-IR
-Pay
3,0
66
30.7
%31%
16.7
53
176
9.5
91
Cre
ate
PO
-Sig
n-
Rel
ease
-G
R-
IR-
Pay
2,5
28
25.3
%56%
34.7
72
327
26.1
12
Cre
ate
PO
-C
hange
Lin
e-
Sig
n-
Rel
ease
-G
R-
IR-
Pay
1.3
93
13.9
%70%
29.7
44
328
36.4
63
Cre
ate
PO
-C
hange
Lin
e-
Sig
n-
Rel
ease
-IR
-Pay
633
6.3
%76%
25.2
83
241
27.1
54
Cre
ate
PO
-Rel
ease
-C
hange
Lin
e-
IR-
Pay
599
6.0
%82%
68.8
84
264
39.2
35
Cre
ate
PO
-Sig
n-
Rel
ease
-C
hange
Lin
e-
IR-
Pay
546
5.5
%88%
21.4
9299
16.2
6C
reate
PO
-Rel
ease
-IR
-Pay
232
2.3
%90%
20.0
42
197
24.1
6
Tab
le6:
Mos
tun
freq
uent
sequ
ence
s
Patt
ern(s
)O
ccurr
ence
sTota
lR
epre
senta
tion
per
patt
ern
occ
urr
ence
soflo
g
29
-30
10
20
0.2
%31
-35
945
0.5
%36
88
0.1
%37
77
0.1
%38
66
0.1
%39
-43
525
0.3
%44
-57
456
0.6
%58
-66
321
0.2
%67
-91
250
0.5
%92
-160
169
0.7
%
307
3.1
%
17

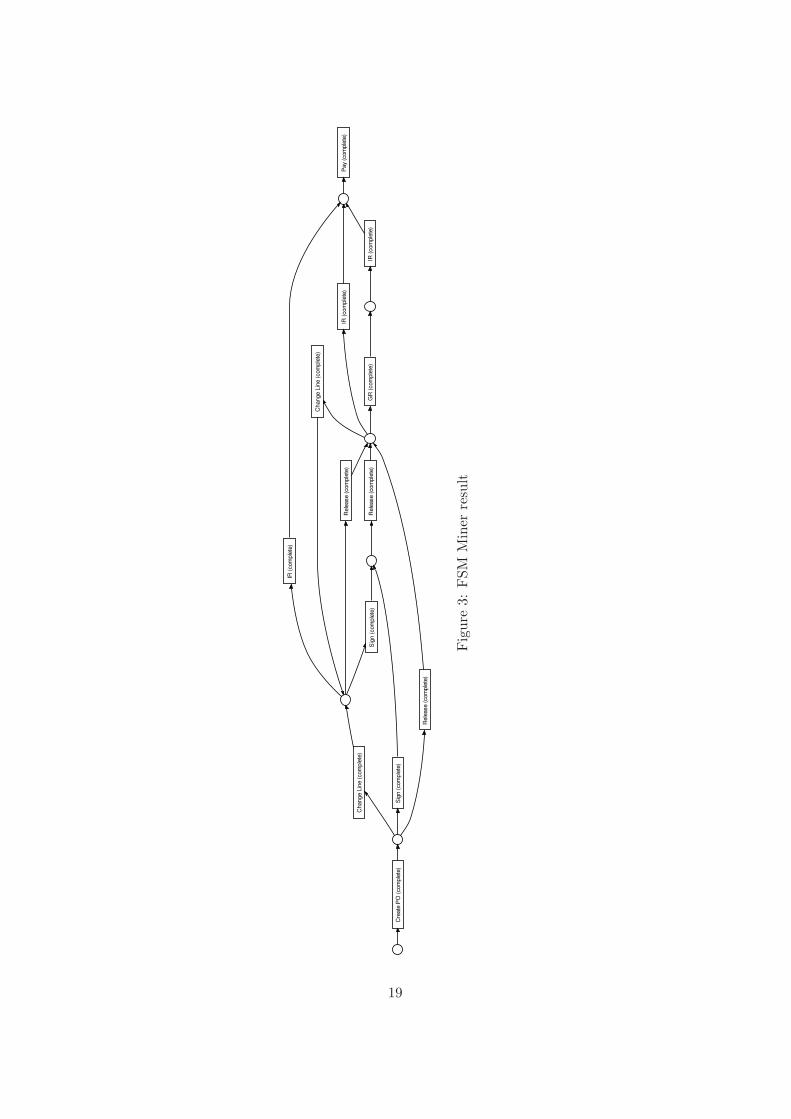
Taking the selection of the log with only patterns 0 till 4 (8,219 cases) andapplying the Final State Machine (FSM) miner, results in the process modeldepicted in Figure 3. Running a conformance check reveals that 8,000 cases,or 80% of the total log, is covered by this process model. This result is usedas a feedback to the domain experts. It was concluded that the generaloutlines of the process are clearly coming forward in the event log. This isseen as a reassuring start.
18
Change L
ine (
com
ple
te)
Cre
ate
PO
(com
ple
te)
GR
(com
ple
te)
IR (
com
ple
te)
Pay
(com
ple
te)
Rele
ase (
com
ple
te)
Sig
n (
com
ple
te)
Rele
ase (
com
ple
te)
IR (
com
ple
te)
Change L
ine (
com
ple
te)
IR (
com
ple
te)
Sig
n (
com
ple
te)
Rele
ase (
com
ple
te)
Fig
ure
3:FSM
Min
erre
sult
19
9.2 Exposing less frequent flows
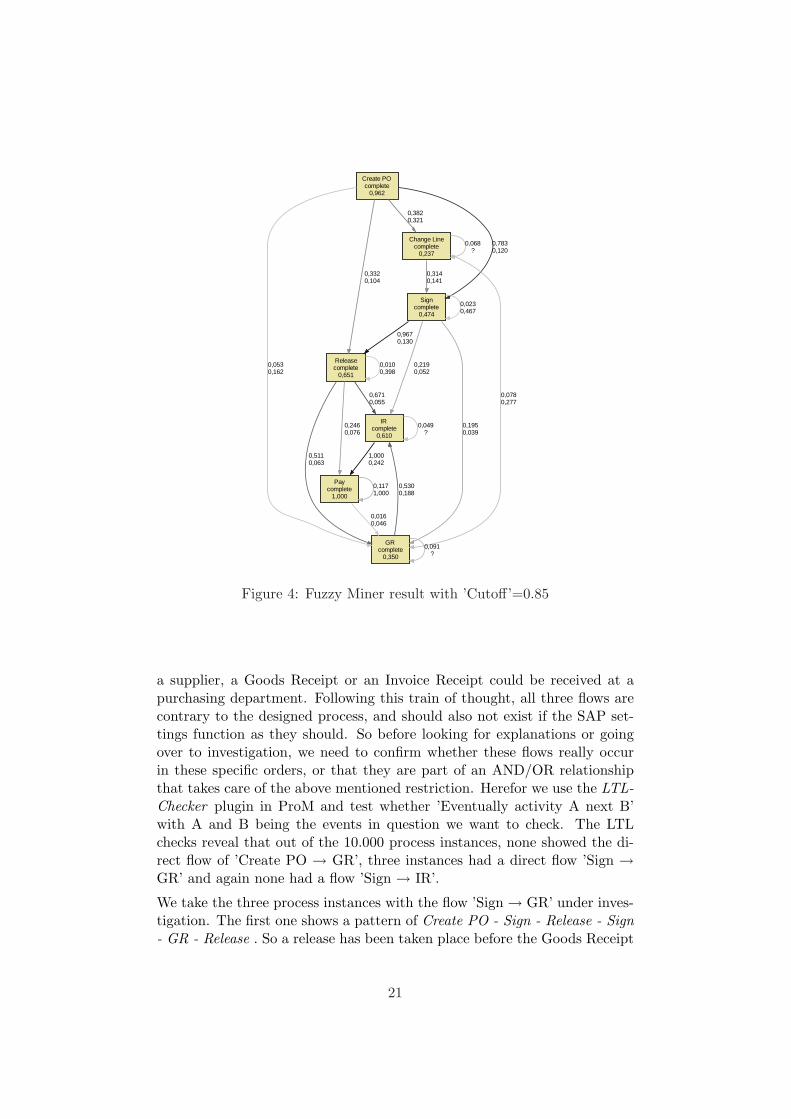
Another contribution the control flow analysis can provide, is to use thecomplete event log (i.e. without selecting only the frequent patterns) and tohave a look at the resulting flows when lower thresholds are used. Loweringthe threshold settings will result in a graph with more edges, exposing flowsthat are less frequently followed. This is a nice and convenient way (visual)of looking at the most important unfrequent paths. Turning back to theapplication of the Fuzzy Miner, we change the settings in such a mannermore flows become apparent. Concretely, we change the ’Cutoff’ edge filterto the values 0.70 and 0.85. These different settings indeed result in modelswith more edges. Elevating the ’Cutoff’ to 0.70 (compared to the defaultsetting of 0.20) revealed two extra flows: ’Create PO → Release’ and ’Sign→ GR’. Elevating the ’Cutoff’ further to 0.85 (depicted in Figure 4) revealedeven four more extra flows (on top of the other two):
- Create PO → GR- Release → Pay- Sign → IR- GR → Change Line
Before discussing the extra six flows, visible at the graph in Figure 4, animportant aspect of interpreting these results has to be highlighted. The arcsfrom one event to another in a resulting graph of the Fuzzy Miner, need tobe seen in an AND/OR relationship, which is not visible at this outputgraph. This means that for instance an arc from activity A to activity Bdoes not per definition mean that B directly follows A. Perhaps this arcshould be interpreted along with another arc, from activity A to activityC. The two flows ’A → B’ and ’A → C’ may represent an AND (or OR)relationship (after A, B and/or C follow) without having B per definitiondirectly after A, the same for C. So looking at the Fuzzy Miner result givesus ideas of extra flows, but deducing direct flows between one activity andanother, needs to be explicitly checked.
In the next paragraphs the six extra flows are discussed with the domainexperts and if necessary explicitly checked. Two flows are very normal:’Create PO → Release’ and ’GR → Change Line’. A ’Change Line’ canoccur at every stage of the process and the fact that the PO is not firstsigned, before it is released is a realistic possibility. However, there arecertain conditions attached to leaving out the ’Sign’. These cab be verifiedin a later stage.
The flows ’Create PO → GR’, ’Sign → GR’ and ’Sign → IR’ each havethe same problem. A release is a prerequisite for ordering goods at a sup-plier (hence the name). Normally speaking, only after placing an order at
20
Create POcomplete
0,962
Change Linecomplete
0,237
0,3820,321
Signcomplete
0,474
0,7830,120
Releasecomplete
0,651
0,3320,104
GRcomplete
0,350
0,0530,162
0,068?
0,3140,141
0,0780,277
0,0230,467
0,9670,130
IRcomplete
0,610
0,2190,052
0,1950,039
0,0100,398
0,6710,055
Paycomplete
1,000
0,2460,076
0,5110,063
0,049?
1,0000,242
0,1171,000
0,0160,046
0,5300,188
0,091?
Figure 4: Fuzzy Miner result with ’Cutoff’=0.85
a supplier, a Goods Receipt or an Invoice Receipt could be received at apurchasing department. Following this train of thought, all three flows arecontrary to the designed process, and should also not exist if the SAP set-tings function as they should. So before looking for explanations or goingover to investigation, we need to confirm whether these flows really occurin these specific orders, or that they are part of an AND/OR relationshipthat takes care of the above mentioned restriction. Herefor we use the LTL-Checker plugin in ProM and test whether ’Eventually activity A next B’with A and B being the events in question we want to check. The LTLchecks reveal that out of the 10.000 process instances, none showed the di-rect flow of ’Create PO → GR’, three instances had a direct flow ’Sign →GR’ and again none had a flow ’Sign → IR’.
We take the three process instances with the flow ’Sign → GR’ under inves-tigation. The first one shows a pattern of Create PO - Sign - Release - Sign- GR - Release . So a release has been taken place before the Goods Receipt
21
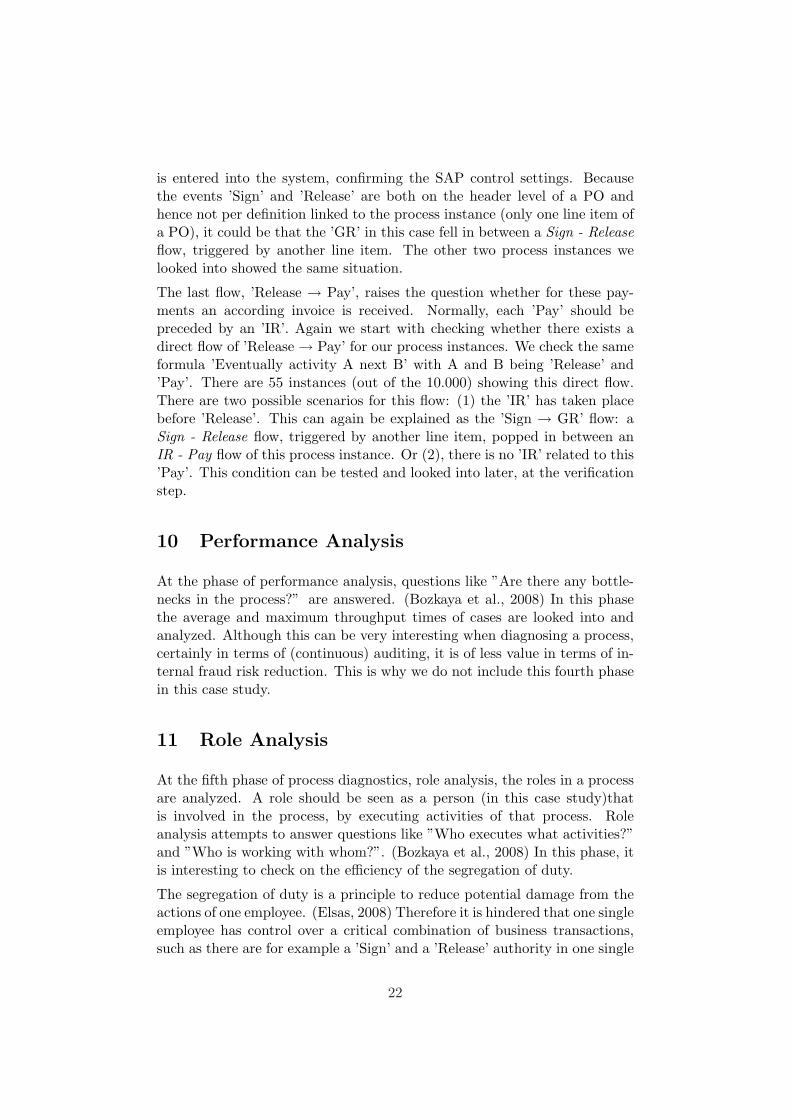
is entered into the system, confirming the SAP control settings. Becausethe events ’Sign’ and ’Release’ are both on the header level of a PO andhence not per definition linked to the process instance (only one line item ofa PO), it could be that the ’GR’ in this case fell in between a Sign - Releaseflow, triggered by another line item. The other two process instances welooked into showed the same situation.
The last flow, ’Release → Pay’, raises the question whether for these pay-ments an according invoice is received. Normally, each ’Pay’ should bepreceded by an ’IR’. Again we start with checking whether there exists adirect flow of ’Release → Pay’ for our process instances. We check the sameformula ’Eventually activity A next B’ with A and B being ’Release’ and’Pay’. There are 55 instances (out of the 10.000) showing this direct flow.There are two possible scenarios for this flow: (1) the ’IR’ has taken placebefore ’Release’. This can again be explained as the ’Sign → GR’ flow: aSign - Release flow, triggered by another line item, popped in between anIR - Pay flow of this process instance. Or (2), there is no ’IR’ related to this’Pay’. This condition can be tested and looked into later, at the verificationstep.
10 Performance Analysis
At the phase of performance analysis, questions like ”Are there any bottle-necks in the process?” are answered. (Bozkaya et al., 2008) In this phasethe average and maximum throughput times of cases are looked into andanalyzed. Although this can be very interesting when diagnosing a process,certainly in terms of (continuous) auditing, it is of less value in terms of in-ternal fraud risk reduction. This is why we do not include this fourth phasein this case study.
11 Role Analysis
At the fifth phase of process diagnostics, role analysis, the roles in a processare analyzed. A role should be seen as a person (in this case study)thatis involved in the process, by executing activities of that process. Roleanalysis attempts to answer questions like ”Who executes what activities?”and ”Who is working with whom?”. (Bozkaya et al., 2008) In this phase, itis interesting to check on the efficiency of the segregation of duty.
The segregation of duty is a principle to reduce potential damage from theactions of one employee. (Elsas, 2008) Therefore it is hindered that one singleemployee has control over a critical combination of business transactions,such as there are for example a ’Sign’ and a ’Release’ authority in one single
22
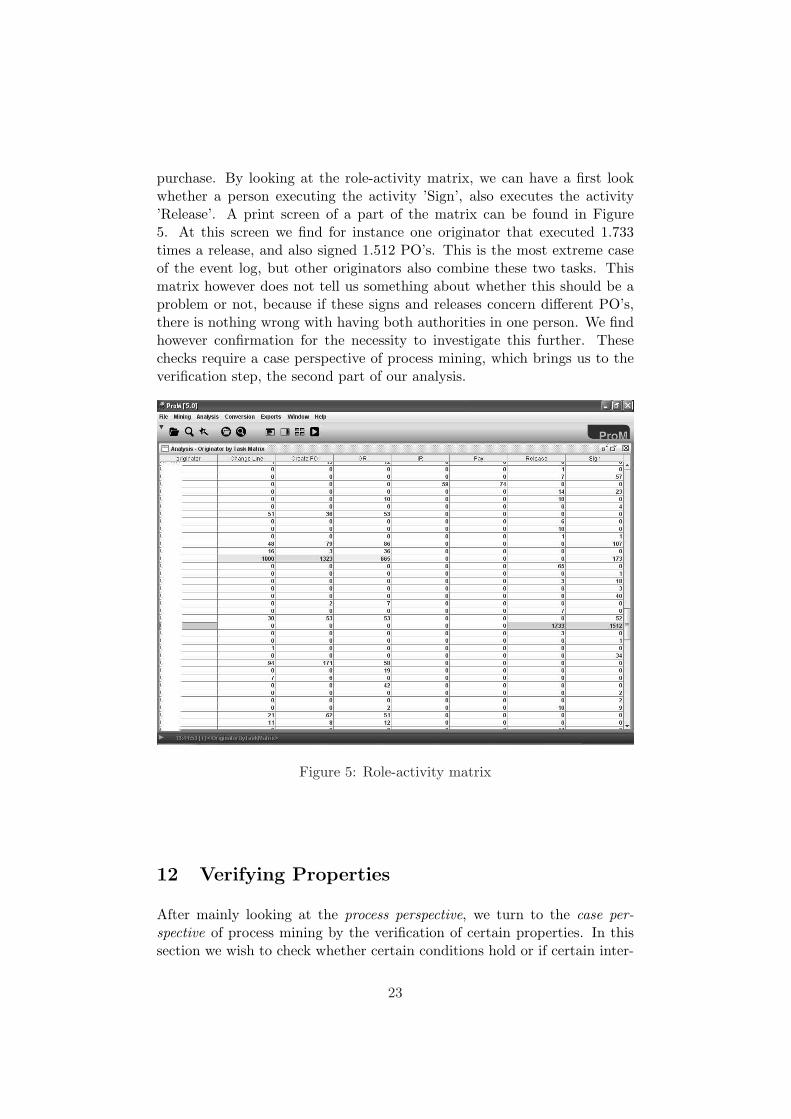
purchase. By looking at the role-activity matrix, we can have a first lookwhether a person executing the activity ’Sign’, also executes the activity’Release’. A print screen of a part of the matrix can be found in Figure5. At this screen we find for instance one originator that executed 1.733times a release, and also signed 1.512 PO’s. This is the most extreme caseof the event log, but other originators also combine these two tasks. Thismatrix however does not tell us something about whether this should be aproblem or not, because if these signs and releases concern different PO’s,there is nothing wrong with having both authorities in one person. We findhowever confirmation for the necessity to investigate this further. Thesechecks require a case perspective of process mining, which brings us to theverification step, the second part of our analysis.
Figure 5: Role-activity matrix
12 Verifying Properties
After mainly looking at the process perspective, we turn to the case per-spective of process mining by the verification of certain properties. In thissection we wish to check whether certain conditions hold or if certain inter-
23
nal controls efficiently function. We classify the checks to execute in threecategories: checks on the segregation of duty, case specific checks and checkson internal control. For all these checks, we use the LTL Checker pluginof ProM. In the following paragraphs the ideas are set forward, but theempirical results still need to be inserted.
12.1 Checks on segregation of duty
As already was confirmed by the role-activity matrix, there is a need tofurther investigating whether the segregation of duty is respected in thisbusiness process. After, together with the domain expert, discussing whatcontrols are interesting for a company to check whether this segregation ofduty is efficient, we came to the following three checks:
- Are ’Sign’ and ’Release’ always executed by two different persons?- Are ’GR’ and ’IR’ always entered by two different persons?- Are ’Release’ and ’GR’ always executed by two different persons?
When designing the right formula to execute the first check, it is importantto take into account that this has to be checked pairwise. If a release takesplace, then a ’change line’ occurs, and the next sign is performed by theprevious releaser, this does not have to pose a problem. As long as therelease, following the last sign, is given by another employee, the segregationof duty is intact.
12.2 Case specific checks
Also some very specific checks, related to the company under investigation,can be formulated. For Epsilon for example, there is always a ’Sign’ neededbefore a release can be given, except in two situations:
- The PO document type has a certain ’value A’and the total PO value is less then ’amount B’.- The supplier is ’X’ and the total PO value is less then ’amount C’.
12.3 Monitoring internal control
Several internal control settings are possible at an ERP environment. Ratherthan just checking if these settings are in place at a specific moment, we cantest the output data whether the internal controls function properly. In thiscase study, we selected two controls. The first internal control we wish to testis if it is ensured that no payment can occur without having an (approved)
24
invoice entered into the system. The second control checks whether thechange of a PO line item appropriately triggers a new sign and/or release.
For the first control, we have to use the attributes ’Reference Pay’ and ’Ref-erence IR’ of the events ’IR’ and ’Pay’ respectively and check whether theseare tuned to each other. The second control builds upon the attribute ’NetValue’ of the process instance and the ’Relative Modification’ and ’Modifi-cation’ attributes of the activity ’Change Line’.
13 Discussion
In this work we introduce the new field of process mining into the businessenvironment. For the case of data mining, it took some decades beforethe application of this research domain was projected from the academicworld into the business environment (and more precisely as a fraud detectionmean and as a market segmentation aid). As for the case of process mining,we wish to accelerate this step and recognize already in this quite earlystage which opportunities process mining offers to business practice. In ourextended IFR2 framework, we point out the usefulness of process mining inthe light of internal fraud risk reduction. Process mining offers the abilityto objectively extract a model out of transactional logs, so this model isnot biased towards any expectations the researcher may have. In the lightof finding flaws in the process under investigation, this open mind settingis a very important characteristic. Also the ability of monitoring internalcontrols is very promising.
Not only for internal fraud risk reduction, but also for the field of continuousauditing and continuous monitoring, process mining has valuable character-istics. We hope to cause a chain of further research in the usefulness ofprocess mining in the business practice; both in the context of fraud riskreduction, as in the context of continuous auditing and/or monitoring. Wealso aim to stimulate business practice to recognize the opportunity processmining offers.
14 Conclusion
In this paper we present the extended IFR2 framework, based on a previouswork of Jans et al. (2009), to apply process mining in the context of internalfraud risk reduction. Process mining offers a lot of possibilities to examine abusiness process. Different aspects can be investigated, with all perspectivesbeing interesting in terms of risk reduction. Also the explicit possibility tomonitor internal controls, offers a new way of looking at continuous moni-toring, a part of internal fraud risk reduction.
25
References
ACFE (2006). 2006 ACFE Report to the nation on occupational fraud andabuse. Technical report, Association of Certified Fraud Examiners.
Albrecht, W. S., K. R. Howe, and M. B. Romney (1984). Deterring Fraud:The Internal Auditor’s Perspective. Institute of Internal Auditors Re-search Foundation.
Alles, M., G. Brennan, A. Kogan, and M. A. Vasarhelyi (2006). Continuousmonitoring of business process controls: A pilot implementation of a con-tinuous auditing system at Siemens. International Journal of AccountingInformation Systems 7, 137–161.
Bozkaya, M., J. Gabriels, and J. M. van der Werf (2008). Process diagnostics:A method based on process mining.
CICA/AICPA (1999). Continuous auditing. Technical report, The CanadianInstitute of Chartered Accountants.
Cosserat, G. W. (2004). Modern Auditing (2 ed.). John Wiley & Sons, Ltd.
Davia, H. R., P. Coggins, J. Wideman, and J. Kastantin (2000). Accoun-tant’s Guide to Fraud Detection and Control (2 ed.). John Wiley & Sons.
Elsas, P. I. (2008). X-raying segregation of duties: Support to illuminate anenterprises’s immunity to solo-fraud. International Journal of AccountingInformation Systems ? (?), ?
IIA (2005). Continuous auditing: Implications for assurance, monitoring,and risk assessment. Information Technology Controls - Global TechnologyAudit Guide (GTAG).
Jans, M., N. Lybaert, and K. Vanhoof (2009). A framework for internal fraudrisk reduction at IT integrating business processes: The IFR2 framework.International Journal of Digital Accounting Research 8 (14).
PwC (2007). Economic crime: people, culture and controls. the 4th bi-ennial global economic crime survey. Technical report, PriceWater-house&Coopers.
van der Aalst, W. and A. de Medeiros (2005). Process mining and secu-rity: Detecting anomalous process executions and checking process con-formance. Electronic Notes in Theoretical Computer Science 121, 3–21.
26
van der Aalst, W., H. Rijers, A. Weijters, B. van Dongen, A. de Medeiros,M. Song, and H. Verbeek (2007, July). Business process mining: Anindustrial application. Information Systems 32 (5), 712–732.
van der Aalst, W., B. van Dongen, J. Herbst, L. Maruster, G. Schimm, andA. Weijters (2003). Workflow mining: A survey of issues and approaches.Data & Knowledge Engineering 47, 237–267.
van Dongen, B., A. de Medeiros, H. Verbeek, A. Weijters, and W. van deAalst (2005). The ProM framework: A new era in process mining toolsupport. Volume 3536, pp. 444–454. Springer-Verlag, Berlin.
Wells, J. (2005). Principles of Fraud Examination. John Wiley & Sons.
Whittington, O. R. and K. Pany (1998). Principles of Auditing (12 ed.).Irwin McGraw-Hill.
27