business results for the first nine months of the fy2010 · 1 business results for the first nine...
TRANSCRIPT

1
Business Results Business Results for the First Nine Months of the FY2010for the First Nine Months of the FY2010
Yamaha Motor Co., Ltd.November 4, 2010
Xeon (Indonesia)

2
AgendaAgenda
● Notice regarding the forecasts of consolidated results: Forecasts of consolidated results stated herein are based on the management’s assumptions and beliefs in light of the information currently available, and involve risks and uncertainties. Please be advised that actual results may differ significantly from those discussed in the forecasts of consolidated results.Potential risks and uncertainties include, but are not limited to, general economic conditions in Yamaha Motor’s major markets, changing consumer preferences, and currency exchange rate fluctuations.
Consolidated Financial Resultsfor the First Nine Months of the FY2010
Consolidated Financial Forecastsfor the FY2010

3
Kozo ShinozakiSenior Executive Officer
Director
Kozo ShinozakiSenior Executive Officer
Director
Consolidated Financial Results for the First Nine Months of the FY2010
andConsolidated Financial Forecasts
for the FY2010
Consolidated Financial Results for the First Nine Months of the FY2010
andConsolidated Financial Forecasts
for the FY2010
4($/€)
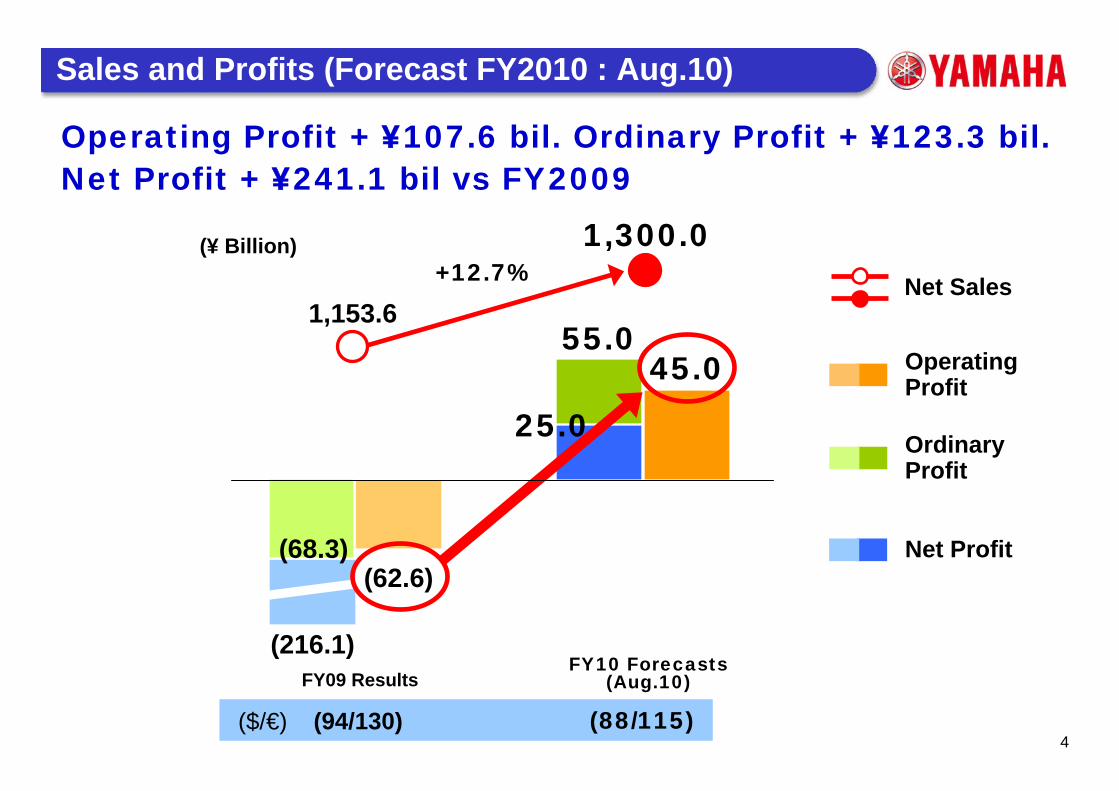
1,153.6
(216.1)
(68.3)(62.6)
(94/130) (88/115)
1,300.0
45.055.0
+12.7%
Sales and Profits (Forecast FY2010 : Aug.10)
Operating Profit
Ordinary Profit
Net Profit
Net Sales
FY09 ResultsFY10 Forecasts
(Aug.10)
25.0
Operating Profit + ¥107.6 bil. Ordinary Profit + ¥123.3 bil.Net Profit + ¥241.1 bil vs FY2009
(¥ Billion)
5
換算R($/€) ($/€) (94/134) (85/108)(86/111) (95/130) (89/117)(89/118)
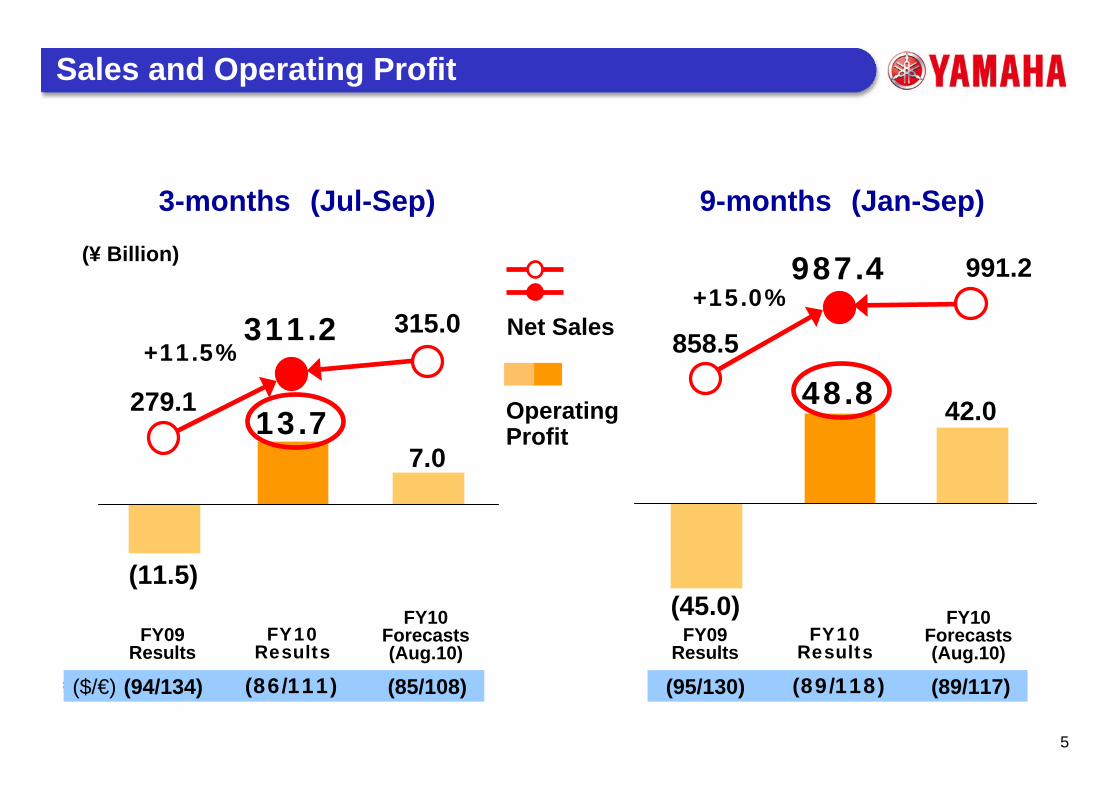
3-months (Jul-Sep) 9-months (Jan-Sep)
279.1
(11.5)
7.0
315.0311.2
13.7
+11.5% 858.5
987.4
(45.0)
48.8 42.0
991.2+15.0%
Sales and Operating Profit
Operating Profit
Net Sales
FY09Results
FY10Results
FY10Forecasts(Aug.10)
FY09Results
FY10Results
FY10Forecasts(Aug.10)
(¥ Billion)

6
(45.0)
48.8+7.4
+45.9
+19.5
+34.8
+100.2
(4.9)(9.0)
-13.9
FY09 Results
Operating Profit
Others
FY10 Results
(vs. 09)(+93.7)
Operating Profit
(¥ Billion)
Changes in Operating Profit vs. FY2009 (3Q : Jan-Sep)
Increase in gross profit due to sales increase
Cost reductionthroughstructural reform
Increase of marginal profit by production recovery Impact of
appreciation(¥) Rise in raw material prices
18ATVs*
111Outboard motors
125MotorcyclesFY09
Production in Japan(K units)
42177137FY10
Depreciation +11.5Personnel +7.7
+8.6Expense reduction
+34.8Total
+7.0Procurement cost reduction
+19.2Fixed cost
reduction by structural reform
* ATVs: All-Terrain Vehicle
Impact of exchange rateUS$ (8.5)EURO (8.0)Other +6.2Total (10.2)
+1.2SG&A expensesOperating Profit (9.0)
Gross profit

7
($/€)
858.5987.4
157.2
407.5
293.8
(45.0)
17.8
(60.9)
(1.8)
48.8
49.4
(19.7)
19.0
189.0
543.4
255.0
(89/118)(95/130)
-13%
+33%
+41.3
+31.6
+20.8
+20%
991.2
190.2
542.7
258.2 46.9
(23.3)
18.4
(89/117)
42.0
Sales and Operating Profit (3Q : Jan-Sep)
Other
Net Sales
Operating Profit
FY09 Results FY10 Results FY10 Forecasts(Aug.10)
(¥ Billion)
Others
Developed markets
Motorcyclesin emerging markets(Asia, Latin America)
Developed markets
Motorcyclesin emerging markets
(YoY )
Others
Developed markets
Developed markets
Others Motorcyclesin emerging markets
(YoY )
Developed Markets : Motorcycles in Japan, the U.S. and Europe; All-Terrain Vehicles (ATVs), Outboard motorsin the U.S. and Europe, personal watercraft, and snowmobile businesses

8
($/€)
1,153.6
1,300.0
212.1
577.3
364.2(62.6)
27.2
(87.9)
(2.0)
△450
50.0
64.0
(36.5)
22.5
256.0
728.0
316.0
(94/130)
-13%
+26%
+51.4
+36.8
+24.5
+21%
1,300.0
250.0
725.0
325.062.5
(37.5)
20.0
45.0
(88/115)(87/115)($/€) (90/133) (85/108)(80/110)
TTL Year
4Q
Sales and Operating Profit (Forecast FY2010)
Improve Operating Profit + ¥5.0 bil. vs Previous Forecasts (Aug.10)
Net Sales
Operating Profit
FY09 ResultsFY10 Forecasts
(4.Nov.10)FY10 Forecasts
(Aug.10)
(¥ Billion)
Others
Developed markets
Motorcyclesin emerging markets(Asia, Latin America)
Developed markets
Others
Motorcyclesin emerging markets
(vs. 09 )
(vs. 09 )
Developed markets
Others
Motorcyclesin emerging markets
Others
Developed markets
Motorcyclesin emerging markets
Developed Markets : Motorcycles in Japan, the U.S. and Europe; All-Terrain Vehicles (ATVs), Outboard motorsin the U.S. and Europe, personal watercraft, and snowmobile businesses

9
Consolidated Financial Results for the First Nine Months of the FY2010
Consolidated Financial Results for the First Nine Months of the FY2010
Manabu OmuraGeneral Manager of
Finance and Accounting Division
Manabu OmuraGeneral Manager of
Finance and Accounting Division
10
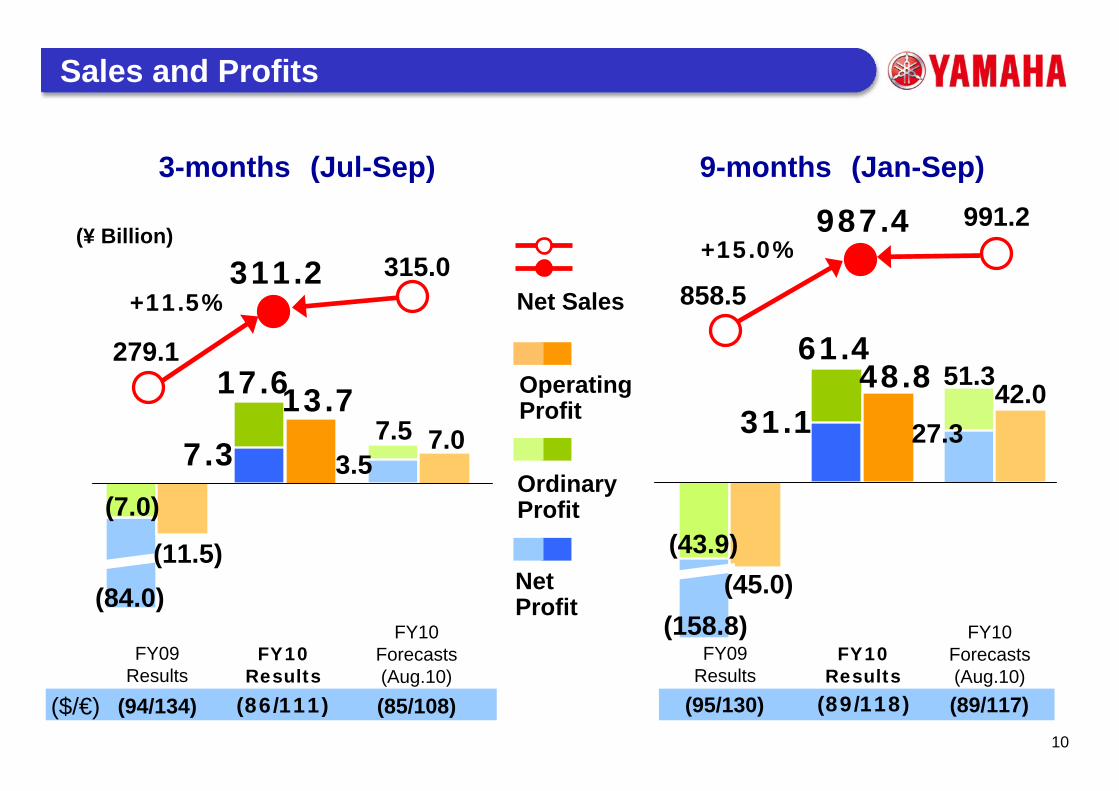
換算R($/€) ($/€) (94/134) (85/108)(86/111) (95/130) (89/117)(89/118)
(84.0)
(7.0)
(11.5)
7.53.5
7.0
(158.8)
(43.9)(45.0)
51.3
27.342.0
279.1
315.0311.2+11.5% 858.5
987.4 991.2+15.0%
13.77.3
17.6 48.831.1
61.4
Sales and Profits
Operating Profit
Ordinary Profit
NetProfit
Net Sales
FY09 Results
FY10 Results
FY10Forecasts(Aug.10)
FY09 Results
FY10 Results
FY10Forecasts(Aug.10)
(¥ Billion)
3-months (Jul-Sep) 9-months (Jan-Sep)

11
換算R($/€)
197.8 216.0
42.024.128.022.529.0
34.8
279.1315.0
858.5
991.2
688.3
133.5
75.1
90.5
987.4
211.8
37.730.731.0
311.2
($/€) (94/134) (85/108)(86/111) (95/130) (89/117)(89/118)
+27.2%+38.0%
+11.5%
+8.5%
+7.1% 692.5
137.8
72.4
88.4
607.8
71.661.1
118.0
+4.8%
+48.0%
+15.0%
+13.2%
+13.2%
Sales by Business Segment
Motorcycles
Marine products
Power products
Other products
FY09 Results
FY10 Results
FY10Forecasts(Aug.10)
FY09 Results
FY10 Results
FY10Forecasts(Aug.10)
(¥ Billion)
3-months (Jul-Sep) 9-months (Jan-Sep)

12
28 265 756 57
1,335
1,42886
124 112
6
1,647
1,511
1,631
10.3 9.04.0
28.4 27.0
131.8 144.0
22.830.8 32.0
4.5
211.8
197.8
216.0
-9.6%
-8.2%
+8.0%
+44.2%
-21.9%
+9.0% +7.1%
1,441
5225
145.9
23.4
8.5-17.5%-28.3%
-17.6%
+10.7%
+35.3%
3.3
Sales of Motorcycles Business (3Q : Jul-Sep)
Unit Sales Sales Amounts
AsiaExcl. Japan
Europe
North America
Japan
Other areas
FY09 Results
FY10 Results
FY10Forecasts(Aug.10)
FY09 Results
FY10 Results
FY10Forecasts(Aug.10)
(¥ Billion)(K units)
13
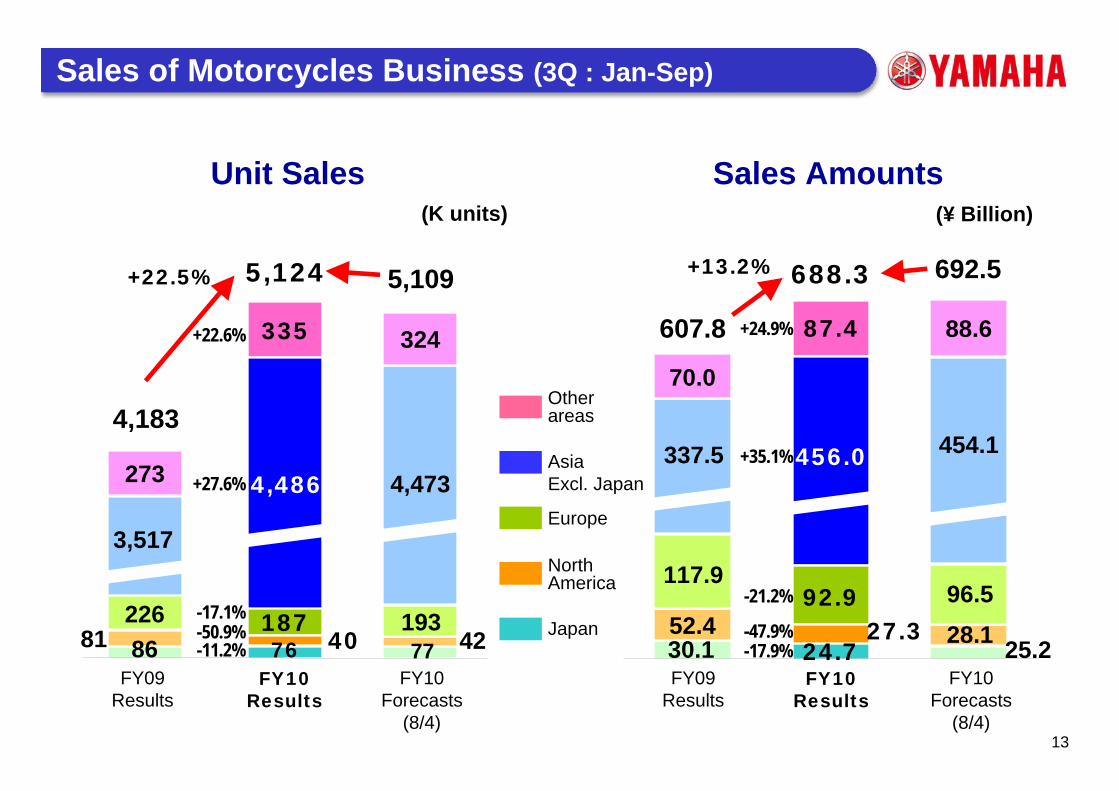
86 7740 42226 193
3,517
4,473273
335 324
81
5,124
4,183
5,109
30.1 25.228.1
117.996.5
337.5 454.1
70.0
87.4 88.6
52.4
688.3
607.8
692.5
-11.2%
-17.1%
+27.6%
+22.6%
-50.9%
+22.5% +13.2%
4,486
18776
456.0
92.927.3
24.7-17.9%-47.9%
-21.2%
+35.1%
+24.9%
(K units)
FY09 Results
FY10 Results
FY10Forecasts
(8/4)
FY09 Results
FY10 Results
FY10Forecasts
(8/4)
(¥ Billion)
Sales of Motorcycles Business (3Q : Jan-Sep)
Unit Sales Sales Amounts
AsiaExcl. Japan
Europe
North America
Japan
Other areas

14
5.7
6.11.6
6.9 7.7
14.4
37.734.8
+12.8%
+53.2%
+8.5%
2.55.8
16.3
5.4
+12.3%
17.9
28.2
4.821.9
23.7
45.2
133.5
118.0
+26.5%
+45.1%
+13.2%
7.0
29.2
57.1
16.6
+8.0%
FY09 Results
FY10 Results
FY09 Results
FY10 Results
(¥ Billion)
AsiaExcl. Japan
Europe
North America
Japan
Other areas
3-months (Jul-Sep) 9-months (Jan-Sep)
Sales of Marine Business
15
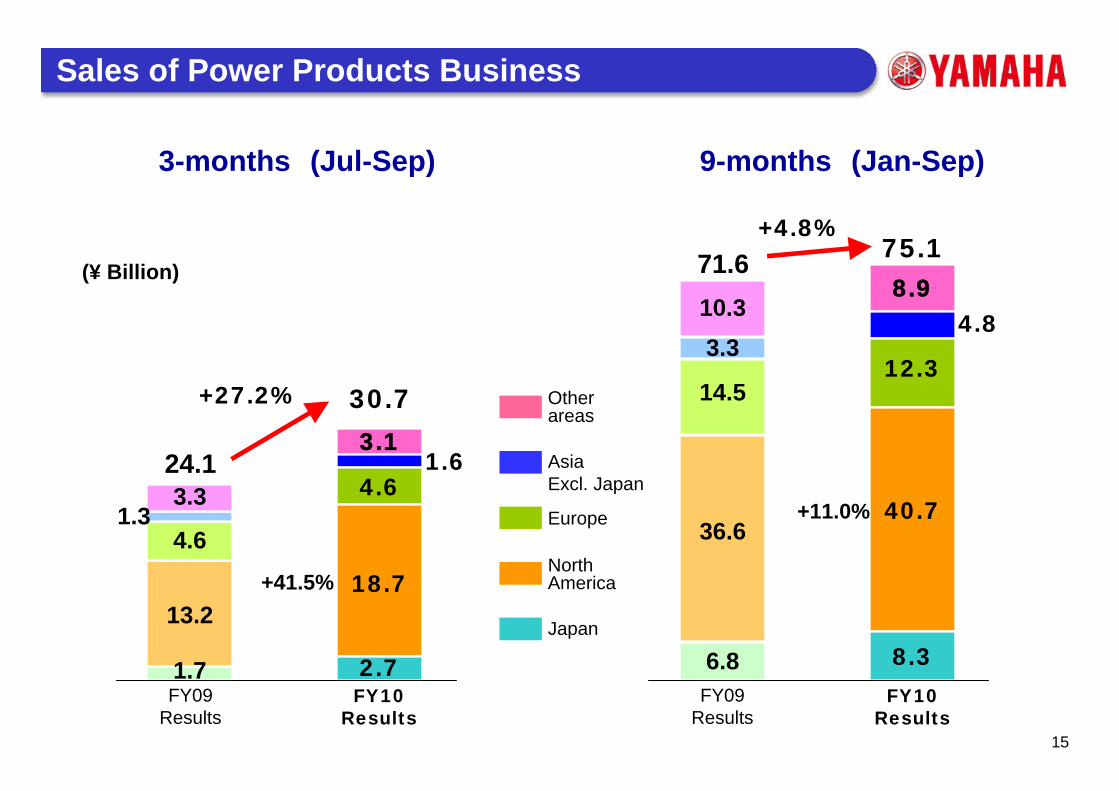
6.8
14.5
3.34.810.3
8.9
36.6
75.171.6
12.3
40.7
8.3
+4.8%
+11.0%
1.7
4.61.3
1.63.3
3.1
13.2
30.7
24.1
+41.5%
+27.2%
4.6
18.7
2.7FY09
ResultsFY10
ResultsFY09
ResultsFY10
Results
(¥ Billion)
AsiaExcl. Japan
Europe
North America
Japan
Other areas
3-months (Jul-Sep) 9-months (Jan-Sep)
Sales of Power Products Business
16
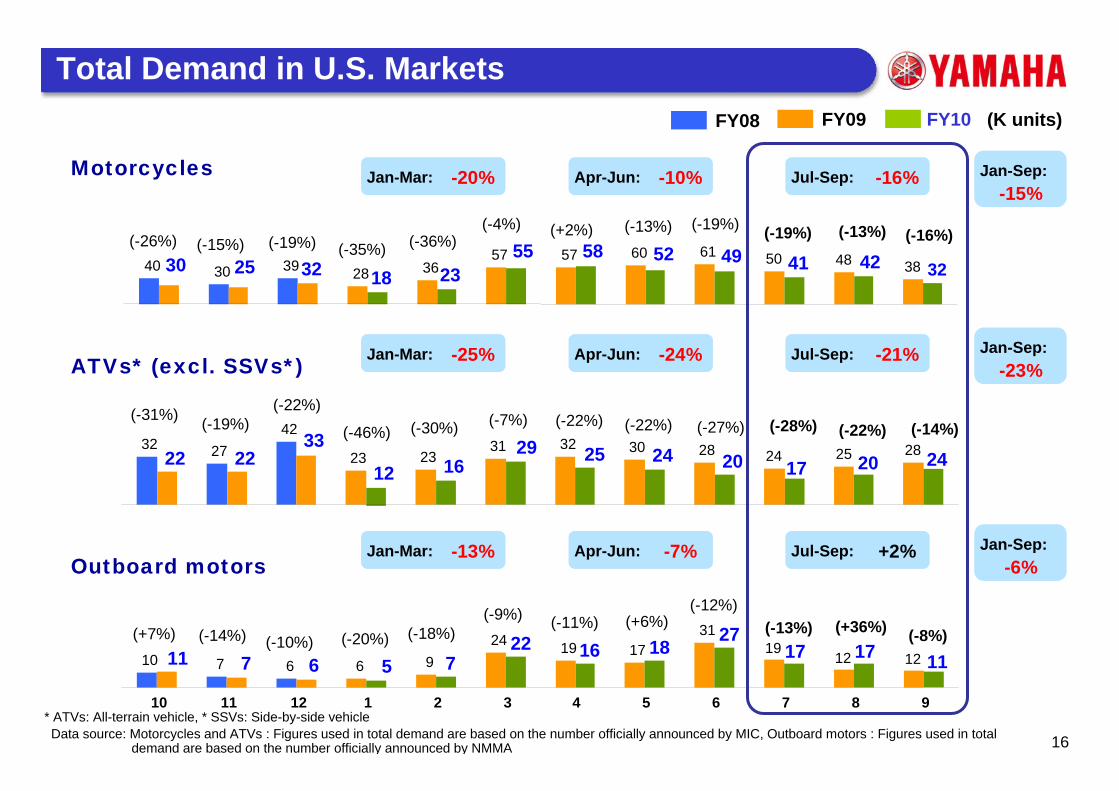
40 30 39 28 3657 57 60 61 50 48 3832 18 23 41 324255 58 52 4930 25
32 2742
23 2331 32 30 28 24 25 28 2422 22
33
12 1629 25 24 20 17 20
10 7 6 6 924 19 17
3119
12 12722 16 18
2717 1711 7 6 5 11
10 11 12 1 2 3 4 5 6 7 8 9
(-19%)(-15%)(-26%)
(-22%)(-19%)(-31%)
(-10%)(-14%)(+7%)
(-4%)(-36%)(-35%)
(-7%)(-30%)(-46%)
(-9%)(-18%)(-20%)
(-19%)(-13%)(+2%)
(-27%)(-22%)(-22%)
(+6%)(-11%)(-12%)
(-16%)(-13%)
(-14%)(-22%)(-28%)
(+36%)(-13%) (-8%)
(-19%)
(K units)
-20%Jan-Mar: -10%Apr-Jun: -16%Jul-Sep:-15%
Jan-Sep:
-25%Jan-Mar: -24%Apr-Jun: -21%Jul-Sep:-23%
Jan-Sep:
-13%Jan-Mar: -7%Apr-Jun: +2%Jul-Sep:-6%
Jan-Sep:
Total Demand in U.S. MarketsFY09 FY10FY08
Motorcycles
ATVs* (excl. SSVs*)
Outboard motors
* ATVs: All-terrain vehicle, * SSVs: Side-by-side vehicleData source: Motorcycles and ATVs : Figures used in total demand are based on the number officially announced by MIC, Outboard motors : Figures used in total
demand are based on the number officially announced by NMMA

17
5 3 4 6
13 1311
16 15
22
1319 16
20 1814
11 13
-16%
-37%+111%
-23%+16%
+46%
Motorcycles ATVs* Outboard motors(K units)Retail Sales
Wholesale
FY09Results
FY10Results
FY10Forecasts(Aug.10)
FY09Results
FY10Results
FY10Forecasts(Aug.10)
FY09Results
FY10Results
FY10Forecasts(Aug.10)
* ATV: All-terrain vehicle
U.S. Business Condition (3Q : Jul-Sep)

18
676944
58
89
120122109143150
62
5969
8890101
117136
124
9683
141
40333636435168
82
7768
81
8991213192833282620
49
37
13
56
(K units)
Motorcycles(wholesale Only)
1Q 2Q 3Q 4QFY08
1Q 2Q 3Q 4QFY09
1Q 2QFY10
Forecasts(11/4)
FY103Q
* ATV: All-terrain vehicle
ATVs(Retail +wholesales)
Motorcycles(Retail +wholesales)
Outboard motors(wholesales only)
Market Stocks in the U.S. and Europe
U.S.
Europe

19
Net Sales (¥ Billion)
86.2
71.883.3
717806
828+42%
14.5 14.215.3
168 160152
+25%
8.67.2 8.3
66 6470+14%
20.6 19.914.9
59 6046
+4%
Unit Sales (K units)
Xeon
SZ Crypton
Luvias
Sales in Emerging Markets (3Q : Jul-Sep)
Indonesia (YIMM) Vietnam (YMVN)
India (IYM) Brazil (YMDB)
(Launched in May.10)
(Launched in Aug. 10)
(Launched in Aug. 10)
(Launched in Mar. 10)
FY09 Results
FY10 Results
FY10 Forecasts(Aug.10)
FY09 Results
FY10 Results
FY10 Forecasts(Aug.10)
Note: Unit sales consist only of sales in each nation, while sales amount includes exports from each nation.

20
9.1 9.3
11.710.2
8.7 8.6 8.3
5.5
2.8
4.95.8
9.3 9.5
3.04.5
580 600
800660
510 500 495
125
325 325
620 600
210270 300
1Q 2Q 3Q 4Q
FY2007
1Q 2Q 3Q 4Q
FY2008
1Q 2Q 3Q 4Q
FY2009
1Q 2Q 3QForecast(Aug.10)
FY2010
3Q
9.6
710Unit sales of surface mounters**
Unit sales(Units)
Net sales(¥ Billion)
* Intelligent Machinery: Industrial robots (including surface mounters)** Unit sales of surface mounters includes peripheral equipment such as printers.
Sales in IM* Business
Sales amount of IM* Business(incl. industrial robots, wheelchairs)
21
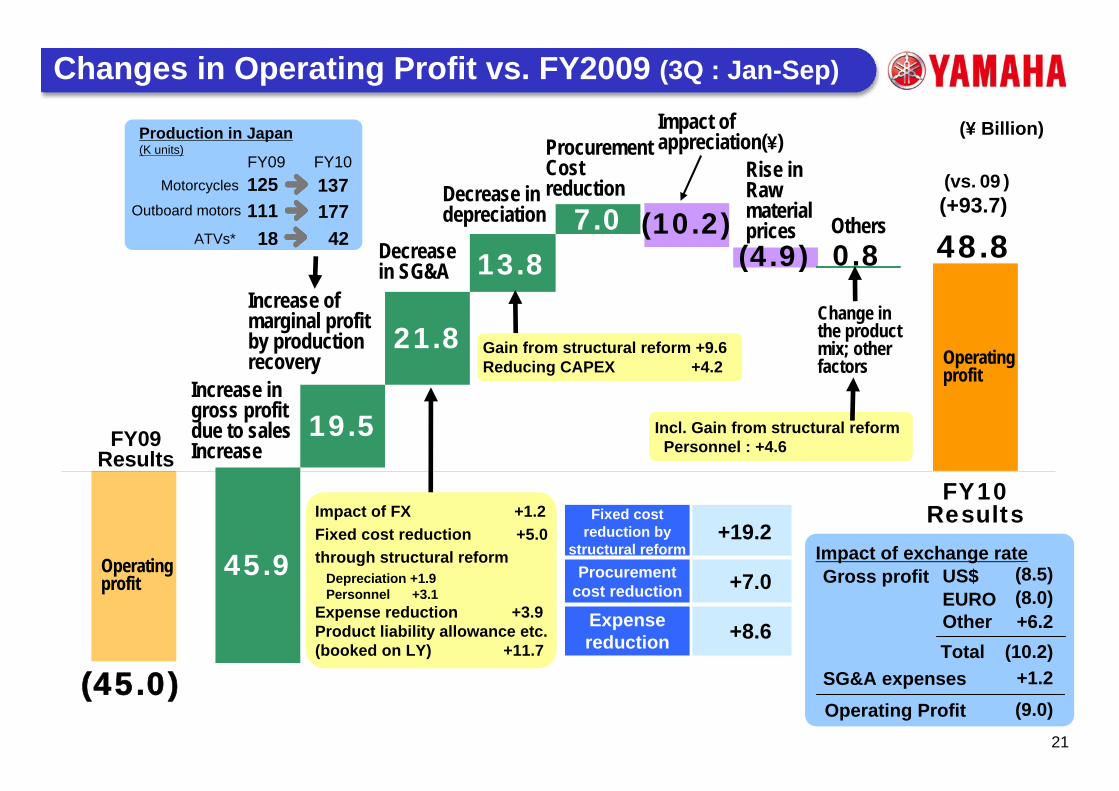
45.9
19.5
21.8
7.013.8 (4.9)
(10.2)0.8
(45.0)
48.8
Operating profit
FY09 Results
Decrease in SG&A
Decrease in depreciation
ProcurementCost reduction
Change in the product mix; other factors
(+93.7)
Operating profit
FY10 ResultsImpact of FX +1.2
Fixed cost reduction +5.0through structural reform
Depreciation +1.9Personnel +3.1
Expense reduction +3.9Product liability allowance etc. (booked on LY) +11.7
Gain from structural reform +9.6Reducing CAPEX +4.2
Incl. Gain from structural reformPersonnel : +4.6
Changes in Operating Profit vs. FY2009 (3Q : Jan-Sep)
18ATVs*
111Outboard motors
125MotorcyclesFY09
Production in Japan(K units)
42177137FY10
Impact of exchange rateUS$ (8.5)EURO (8.0)Other +6.2Total (10.2)
+1.2SG&A expensesOperating Profit (9.0)
Gross profit
Increase ingross profitdue to sales Increase
Increase ofmarginal profitby production recovery
Rise in Rawmaterialprices
Impact of appreciation(¥)
Others
(vs. 09 )
(¥ Billion)
+8.6Expense reduction
+7.0Procurement cost reduction
+19.2Fixed cost
reduction by structural reform

22
(3.2)
33.0
(9.2)
(23.6)
4.7
(2.2)
13.5
48.8
(45.0)
42.0
14.2
38.0
(7.2)(1.3)
7.0
(5.0)
(3.7)
0.5
(0.3)
4.5
(6.2)
13.7
(11.5)
7.05.3
11.9
(3.0)(15.9)
(0.5)
3.7
Operating Profit by Business Segment
Motorcycles
Marine Products
Power Products
Other Products
FY09 Results
FY10 Results
FY10Forecasts(Aug.10)
FY09 Results
FY10 Results
FY10Forecasts(Aug.10)
(¥ Billion)
3-months (Jul-Sep) 9-months (Jan-Sep)

23
(38.1)
19.157.2
(23.5)
117.2
93.8
Cash Flows (3Q : Jan-Sep)
Free CF
Free CF
CF fromOperating activities
Free Cash Flows
CF fromInvesting activities
FY09 Results FY10 Results
(¥ Billion)
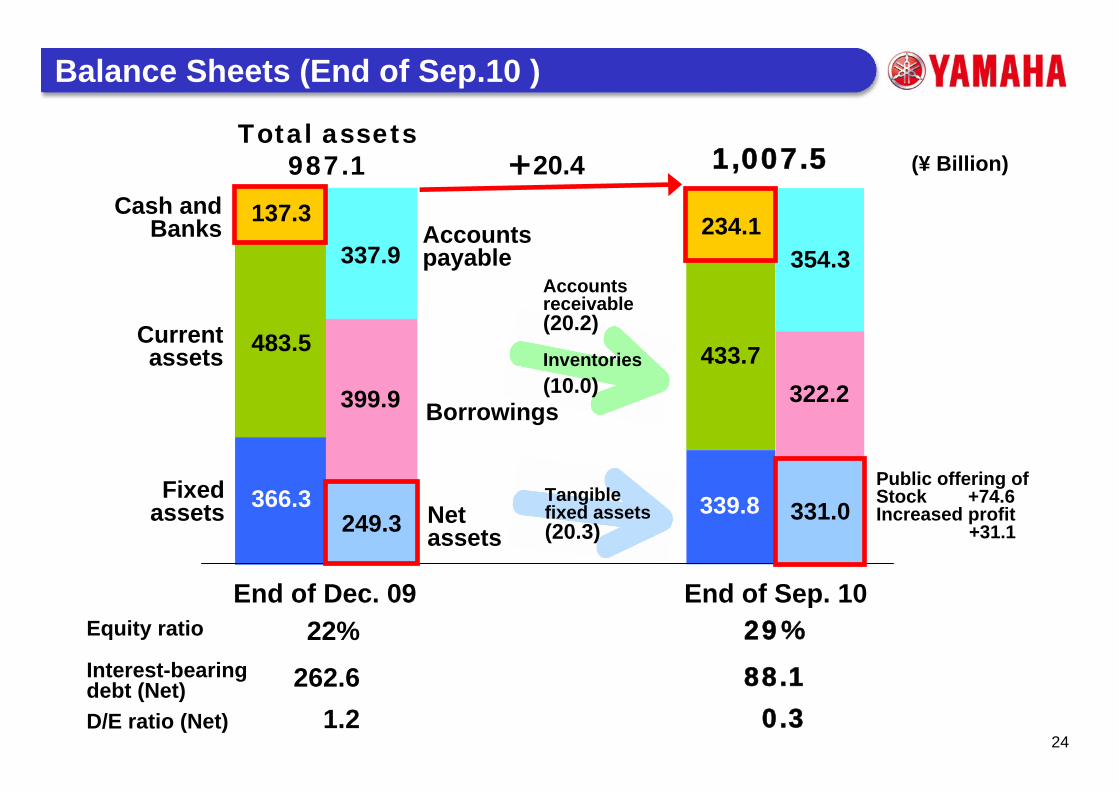
24
1,007.5+20.4
366.3 339.8
483.5 433.7
337.9 354.3
399.9 322.2
137.3 234.1
Total assets987.1
Cash and Banks
Current assets
Fixed assets
End of Dec. 09
Accounts payable
Borrowings
Net assets
Accounts receivable(20.2)Inventories (10.0)
Tangible fixed assets (20.3)
(¥ Billion)
Public offering of Stock +74.6Increased profit
+31.1
88.10.3
262.61.2
Interest-bearing debt (Net)D/E ratio (Net)
29%22%Equity ratioEnd of Sep. 10
249.3 331.0
Balance Sheets (End of Sep.10 )

25

26
AppendixAppendix
U.S. Business Condition (3Q : Jan-Sep)Sales in Emerging Markets (3Q : Jan-Sep)Motorcycles Unit Sales by Category in Indonesia (3Q: Jan-Sep)Impact of Exchange RateChanges in Operating Profit vs. FY2009 (3Q : Jul-Sep)Sales / Operating Profit by Business Segment

27
70
30 31 22 28 28 3345 45
765260
4962
514934 36
-20%
-57%+27%
-32%-6%
+36%
Motorcycles ATVs* Outboard motors(K units)Retail Sales
Wholesales
FY09Results
FY10Results
FY10Forecasts(Aug.10)
FY09Results
FY10Results
FY10Forecasts(Aug.10)
FY09Results
FY10Results
FY10Forecasts(Aug.10)
* ATVs: All-terrain vehicle
U.S. Business Condition (3Q : Jan-Sep)

28
264.7
179.6261.8
1,872
2,4492,471
+32%
49.4 49.244.1
531 523
441+20%
23.117.8
22.7
161172178+11%
57.9 57.245.3
162 163145
+12%
Indonesia (YIMM) Vietnam (YMVN)
India (IYM) Brazil (YMDB)
FY09 Results
FY10 Results
FY10 Forecasts(Aug.10)
FY09 Results
FY10 Results
FY10 Forecasts(Aug.10)
Note: Unit sales consist only of sales in each nation, while sales amount includes exports from each nation.
Unit Sales(K units)
Net Sales(¥ Billion)
Sales in Emerging Markets (3Q : Jan-Sep)

29
Total demand
《Category share》2,470Yamaha
(Share:45%)
(Yamaha)
1,070
1,180
1,540
350
380
500
840
1,8704,140
(54%)
(42%)
(35%)
160(45%)
-2%
+58%
+44%
(Y:+15%)
(Y:+45%)
(Y:+28%)
-2%(Y:+15%)
430
640
1,220
180
(50%)
(42%)
(38%)
(52%)
1,040
1,700
2,430
340
5,510
《19%》
《31%》
《44%》
《6%》
《26%》
《29%》
《37%》
《8%》
(K units)
Total demand Yamaha
(Share:45%)《Category share》
Others
+33%(Y:+32%)
YoYTotal demand
V-ixion
Xeon
Jupiter Z
Vega-ZR
(Launched in Jan. 2010)
(Launched in May. 2010)
(Launched in Nov. 2009)
FY09 Results FY10 ResultsData source: Figures used in total demand are based on the number of wholesale units officially announced by AISI,
and Yamaha figures are based on the number of wholesale units.
Motorcycles Unit Sales by Category in Indonesia (3Q: Jan-Sep)
Automatic(AT)
Mopeds (Standard prices)
Mopeds (affordably prices)

30
Impact of Exchange Rate
4.41.22.7Impact on SG&A expenses
-13.3-9.0-7.4Impact on operating profit
0.52.3-2.9Impact on ordinary profit
-17.84.1-12.1-9.8-10.26.2-8.0-8.5-10.1-0.8-4.7-4.7①+② Total impact on gross profit
118891118610 rate (results: yen)
EUR0.6
3.4
2.2
1.5
0.7
Other
-2.1
-1.8
13.9
-15.7
Total
US$1.7
-4.2
115
130
0.6
8.5
-7.9
EURO
-1.2
87
94
-4.6
3.9
-8.6
US$
Total Year Forecasts (4.Nov.10)
2.0
-0.9
11.3
-12.2
Total
EUR0.5
5.4
1.9
1.1
0.9
Other
US$1.4
-2.8
130
2.1
7.3
-5.2
EURO
-0.6
95
-5.0
2.9
-7.9
US$
3Q (Jan-Sep)3Q (Jul-Sep)
②Impact on gross profit due to the difference of exchange rates used to translate profits/losses
① Impact on gross profit due to the difference of exchange rates used to translate sales
Exchange rate of profits/losses
EUR0.1
US$0.5
Impact of one yen fluctuation
-2.2-0.5-1.3-0.3
10 rate (forecasts(11/4): yen)
1349409 rate (results: yen)
-3.40.7-1.3-2.8Net impact(purchasing rate)
4.50.92.11.5※Difference between exchange rate and purchasing rate (non-operating profits or losses)
-7.9-0.2-3.4-4.3
Exchange rate (sales)
TotalOtherEUROUS$(¥ Billion)
Notes: ① Impact on gross profit due to the difference between the exchange rate used in the year to translate foreign currency-denominated sales into Japanese yen, versus the translation exchange rate applied in the previous year.
② Impact on gross profit due to the difference between the exchange rate used in the year to consolidate foreign currency-denominated items posted in non-consolidated financial statements into Japanese yen, versus the consolidation exchange rate applied in the previous year.
※: Impact on non-operating profits or losses due to the difference between the exchange rate used in the year to translate foreign currency-denominated sales into Japanese yen and purchasing rate of foreign currencies in the same year, versus that difference applied in the previous year.

31
16.6
10.0
1.93.2
5.2
(3.0)
(10.1)
1.513.7
(11.5)
Operating Profit
FY09 Results
Change in the product mix; other factors
(¥ Billion)
(+25.2)
Operating Profit
FY10 Results
Changes in Operating Profit vs. FY2009 (3Q : Jul-Sep)
Decrease in SG&A
Decrease in depreciation
ProcurementCost reduction
Impact of FX +2.7Fixed cost reduction +1.7through structural reform
Depreciation +0.6Personnel +1.1
Gain fromstructural reform +3.2Reducing CAPEX +2.0
Incl. Gain from structuralreform : Personnel +1.7
7ATVs*
33Outboard motors
28MotorcyclesFY09
Production in Japan(K units)
185743
FY10
Impact of exchange rateUS$ (4.7)EURO (4.7)Other (0.8)Total (10.1)
+2.7SG&A expensesOperating Profit (7.4)
Gross profit
Increase ingross profitdue to sales Increase
Increase of marginal profit by production recovery
Rise in Rawmaterialprices Impact of
appreciation(¥)
Others
(vs. 09 )
+5.2Procurement cost reduction
+6.6Fixed cost
reduction by structural reform
32
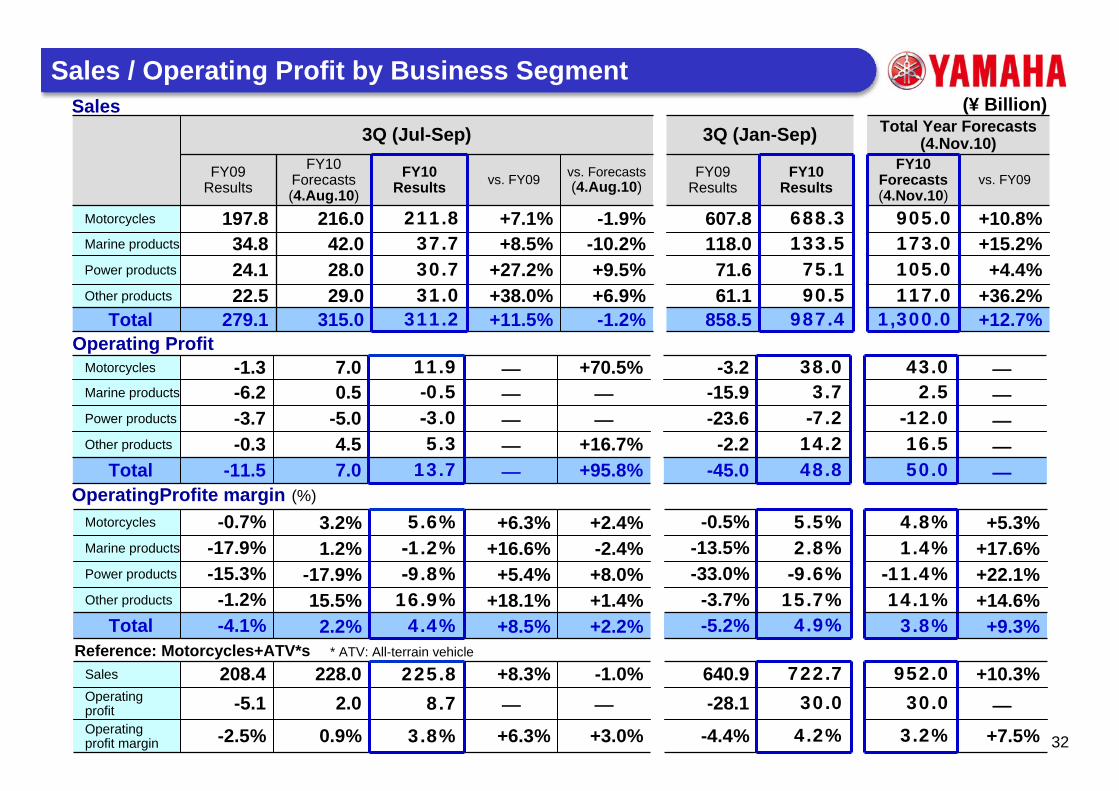
Sales
279.122.524.134.8
197.8
FY09Results
987.490.575.1
133.5688.3
FY10Results
858.561.171.6
118.0607.8
FY09Results
3Q (Jan-Sep)3Q (Jul-Sep) Total Year Forecasts (4.Nov.10)
+12.7%+36.2%+4.4%
+15.2%+10.8%
vs. FY09
1,300.0117.0105.0173.0905.0
FY10Forecasts(4.Nov.10)
-1.2%+11.5%311.2315.0Total
+9.5%+27.2%30.728.0Power products
+38.0%
+8.5%+7.1%
vs. FY09
29.0
42.0216.0
FY10Forecasts(4.Aug.10)
+6.9%
-10.2%-1.9%
vs. Forecasts(4.Aug.10)
31.0Other products
37.7Marine products
211.8Motorcycles
FY10Results
Operating Profit
OperatingProfite margin (%)
Reference: Motorcycles+ATV*s
48.814.2-7.23.7
38.0
-45.0-2.2
-23.6-15.9-3.2
―
―
―
―
―
50.016.5-12.0
2.543.0
+95.8%―13.77.0-11.5Total
――-3.0-5.0-3.7Power products
―
―
―
-0.3
-6.2-1.3
4.5
0.57.0
+16.7%
―
+70.5%
5.3Other products
-0.5Marine products
11.9Motorcycles
4.9%15.7%-9.6%2.8%5.5%
-5.2%-3.7%
-33.0%-13.5%
-0.5%
+9.3%+14.6%+22.1%+17.6%+5.3%
3.8%14.1%-11.4%
1.4%4.8%
+2.2%+8.5%4.4%2.2%-4.1%Total
+8.0%+5.4%-9.8%-17.9%-15.3%Power products
+18.1%
+16.6%+6.3%
-1.2%
-17.9%-0.7%
15.5%
1.2%3.2%
+1.4%
-2.4%+2.4%
16.9%Other products
-1.2%Marine products
5.6%Motorcycles
4.2%
30.0722.7
-4.4%
-28.1640.9
+7.5%―
+10.3%
3.2%
30.0952.0
+3.0%+6.3%3.8%0.9%-2.5%Operating profit margin
―
+8.3%-5.1
208.42.0
228.0―
-1.0%8.7Operating
profit
225.8Sales
* ATV: All-terrain vehicle
Sales / Operating Profit by Business Segment(¥ Billion)

33
Information
http://www.yamaha-motor.co.jp/global/Yamaha Motor website(Global site: English)
You are also welcome to review the IR information on Yamaha Motor’s website.
http://www.yamaha-motor.co.jp/global/ir/For investorsInvestor meeting presentationIR materials
http://www.yamaha-motor.co.jp/global/ir/explanation/http://www.yamaha-motor.co.jp/global/ir/material/