hugo boss nine months results 2013
TRANSCRIPT


Conference Call, Nine Months Results 2013 HUGO BOSS © October 31, 2013
HUGO BOSS Nine Months Results 2013 Mark Langer (CFO) Metzingen, October 31, 2013
2 / 34

Conference Call, Nine Months Results 2013 HUGO BOSS © October 31, 2013
Agenda
3 / 34
Nine Months Results
Operational Highlights
Outlook 2013

Conference Call, Nine Months Results 2013 HUGO BOSS © October 31, 2013
Agenda
4 / 34
Nine Months Results
Operational Highlights
Outlook 2013

Conference Call, Nine Months Results 2013 HUGO BOSS © October 31, 2013
Solid sales and operating profit increases in the first nine months
5 / 34
+2%
Q3 2013
658
Q3 2012
646 165 173
Q3 2012
+5%
Q3 2013
(+5% fx-adjusted)
9M 2012
+3%
9M 2013
1,783 1,739
+4%
9M 2013
407
9M 2012
392
(+4% fx-adjusted)
EBITDA before special items (in EUR million)
Sales (in EUR million)
EBITDA before special items (in EUR million)
Sales (in EUR million)
Third quarter results Nine months results

Conference Call, Nine Months Results 2013 HUGO BOSS ©
Integration of BOSS Selection in the core brand BOSS yields positive results
October 31, 2013 6 / 34

Conference Call, Nine Months Results 2013 HUGO BOSS ©
Moscow store establishes own retail presence in Russia
October 31, 2013 7 / 34
BOSS Flagship Store, Moscow Kuznetsky Most Opening: September 2013
Net size: 693 sqm

Conference Call, Nine Months Results 2013 HUGO BOSS ©
New York flagship store renovated and extended
October 31, 2013 8 / 34
BOSS Store, New York Columbus Circle Re-Opening: September 2013
Net size: 1,084 sqm

Conference Call, Nine Months Results 2013 HUGO BOSS ©
HUGO BOSS celebrates Columbus Circle reopening with impressive video installation
October 31, 2013 9 / 34
“Anthroposcene” 660 sqm video installation
by Marco Brambilla

Conference Call, Nine Months Results 2013 HUGO BOSS ©
Store base in Shanghai upgraded significantly
October 31, 2013 10 / 34
BOSS Store, Shanghai APM Mall Opening: August 2013
Net size: 482 sqm

Conference Call, Nine Months Results 2013 HUGO BOSS ©
Concession business model expanded in both the U.S. and Europe
October 31, 2013 11 / 34
Saks,
Columbus (OH)
Saks, Indianapolis (IN)
Alsterhaus,
Hamburg

Conference Call, Nine Months Results 2013 HUGO BOSS © October 31, 2013
Takeovers account for majority of new additions to retail universe
12 / 34
Number of own retail stores as of September 30, 2013 (December 31, 2012: 840)
* incl. Middle East and Africa.
TOTAL 992 (+152) Openings: 183 thereof takeovers: 110 Closings: 31 EUROPE* 570 (+101)
Openings: 108 thereof takeovers: 63 Closings: 7
ASIA/PACIFIC 226 (+2)
Openings: 22 thereof takeovers: 5 Closings: 20
AMERICAS 196 (+49) Openings: 53 thereof takeovers: 42 Closings: 4

Conference Call, Nine Months Results 2013 HUGO BOSS © October 31, 2013
Agenda
13 / 34
Nine Months Results
Operational Highlights
Outlook 2013

Conference Call, Nine Months Results 2013 HUGO BOSS © October 31, 2013 14 / 34
Improving growth dynamics in Europe
■ Sales momentum picks up over the course of
the quarter
■ Key markets recover from more difficult first
half year
■ Wholesale trading environment continues to
be challenging
in EUR
fx-adjusted Sales growth (in %)
Sales (in EUR million)
9M 2013
1,091
9M 2012
1,051
Q3 2013
423
Q3 2012
398
5
4
8
6
Q3 2013 9M 2013

in EUR
fx-adjusted
Conference Call, Nine Months Results 2013 HUGO BOSS © October 31, 2013 15 / 34
Mixed quarterly performance in the Americas
■ Tough prior year comparison base
■ Deteriorating wholesale sentiment
■ Solid own retail performance
Sales growth (in %)
Sales (in EUR million)
9M 2013
406
9M 2012
400
Q3 2013
143
Q3 2012
152
4
2
0
(6)
Q3 2013 9M 2013

in EUR
fx-adjusted
Conference Call, Nine Months Results 2013 HUGO BOSS © October 31, 2013 16 / 34
Sales growth (in %)
Sales (in EUR million)
9M 2013
247
9M 2012
250
Q3 2013
78
Q3 2012
82
4
(1)
4
(5)
Q3 2013 9M 2013
Trends in Asia broadly unchanged compared to first half year
■ Chinese market environment remains
challenging
■ Robust growth in Hong Kong and Macau
■ Japanese business benefits from repatriation
of local demand

Conference Call, Nine Months Results 2013 HUGO BOSS ©
Retail sales growth accelerates in the third quarter
2
18
5
23
-10 -5 0 5 10 15 20 25
Group
Royalties (2)
(2)
Retail
Wholesale (8)
(10)
fx-adjusted
in EUR
October 31, 2013
Sales growth by channel, y-o-y Q3 2013
(in %)
17 / 34
■ Wholesale development affected by difficult market situation as well as takeover effects
■ Third quarter own retail growth acceleration supported by improving comp store sales (up
4% in Q3, up 2% year-to-date)
■ Royalties sales increase in the nine months period driven by eyewear and kidswear
3
2
4
2
15
18
-10 -5 0 5 10 15 20
Retail
Wholesale (7)
(8)
Group
Royalties
fx-adjusted
in EUR Sales growth by channel, y-o-y 9M 2013 (in %)

Conference Call, Nine Months Results 2013 HUGO BOSS ©
■ Distribution channel mix
■ Reduction of mark downs
■ Non-recurrence of prior year inventory
devaluation effects
+340bp
Q3 2013
63.5
Q3 2012
60.1
9M 2013
63.6
9M 2012
61.1
+250bp
October 31, 2013
Gross margin expands strongly
18 / 34
■ Distribution channel mix
■ Non-recurrence of prior year inventory
devaluation effects
Third quarter First nine months

Conference Call, Nine Months Results 2013 HUGO BOSS ©
■ Tight overhead cost management
limits increases in administration
costs
October 31, 2013
■ Own retail expansion main driver of
higher selling and distribution
expenses
EBITDA margin increases despite own retail driven operating expense growth
19 / 34
*basic and diluted earnings per share.
■ Adverse exchange rate effects
impact financial result
in EUR million 9M 2013 9M 2012 Change in %
Net sales 1,783.1 1,738.5 3
Gross profit 1,134.7 1,061.7 7
in % of sales 63.6 61.1 250 bp
Selling and distribution expenses (636.8) (573.3) (11)
Administration costs and other
operating income and expenses (160.5) (156.8) (2)
Operating result (EBIT) 337.4 331.6 2
in % of sales 18.9 19.1 (20) bp
Financial result (15.7) (15.0) (5)
Earnings before taxes 321.7 316.6 2
Income taxes (74.0) (76.0) 3
Net income 247.7 240.6 3
Attributable to:
Equity holders of the parent
company 244.7 237.7 3
Earnings per share (EUR)* 3.55 3.44 3
EBITDA before special items 407.4 391.7 4
in % of sales 22.8 22.5 30 bp

Conference Call, Nine Months Results 2013 HUGO BOSS © October 31, 2013
Mixed regional profitability developments
*incl. Middle East and Africa.
20 / 34
■ Retail expansion and takeovers affect operating margin development in Europe
■ Moderate margin decline in the Americas despite decreased markdowns
■ Strong gross margin improvement and tight cost management support margin increase in Asia
Segment profit
in EUR million 9M 2013 in % of sales 9M 2012 in % of sales Change in %
Europe* 401.1 36.7 392.0 37.3 2
Americas 106.3 26.2 106.3 26.6 0
Asia/Pacific 87.1 35.3 87.0 34.8 0
Royalties 32.7 84.2 33.8 88.7 (3)
Segment profit operating segments 627.2 35.2 619.1 35.6 1
Corporate units / consolidation 219.8 227.4 (3)
EBITDA before special items 407.4 22.8 391.7 22.5 4

Conference Call, Nine Months Results 2013 HUGO BOSS ©
Working capital efficiency at record levels
0
5
10
15
20
25
30
(270)bp
Q3 2013
18.3
Q2 2013
19.0
Q1 2013
20.0
Q4 2012
20.1
Q3 2012
21.0
Q2 2012
20.8
Q1 2012
20.2
… Q4 2009
24.6
Q3 2009
27.2
Q2 2009
28.5
Q1 2009
29.7
October 31, 2013
Average trade net working capital as a
percentage of sales by quarter (in %)
21 / 34

Conference Call, Nine Months Results 2013
fx-adjusted
HUGO BOSS ©
fx-adjusted
fx-adjusted
■ IT infrastructure and
supply chain
improvements
■ Declining wholesale
sales
■ Ongoing effective
supplier management
Inventories (in EUR million)
Trade
receivables (in EUR million)
Trade
payables (in EUR million)
447
418
(6)%
Sep. 30, 2012
Sep. 30, 2013
262
242
(8)%
Sep. 30, 2012
Sep. 30, 2013
199
205
+3%
Sep. 30, 2012
Sep. 30, 2013
(4)%
(5)%
October 31, 2013
+3%
Broad based trade net working capital improvements
22 / 34
Trade net working capital down 11% to EUR 455 million
Conference Call, Nine Months Results 2013 HUGO BOSS ©
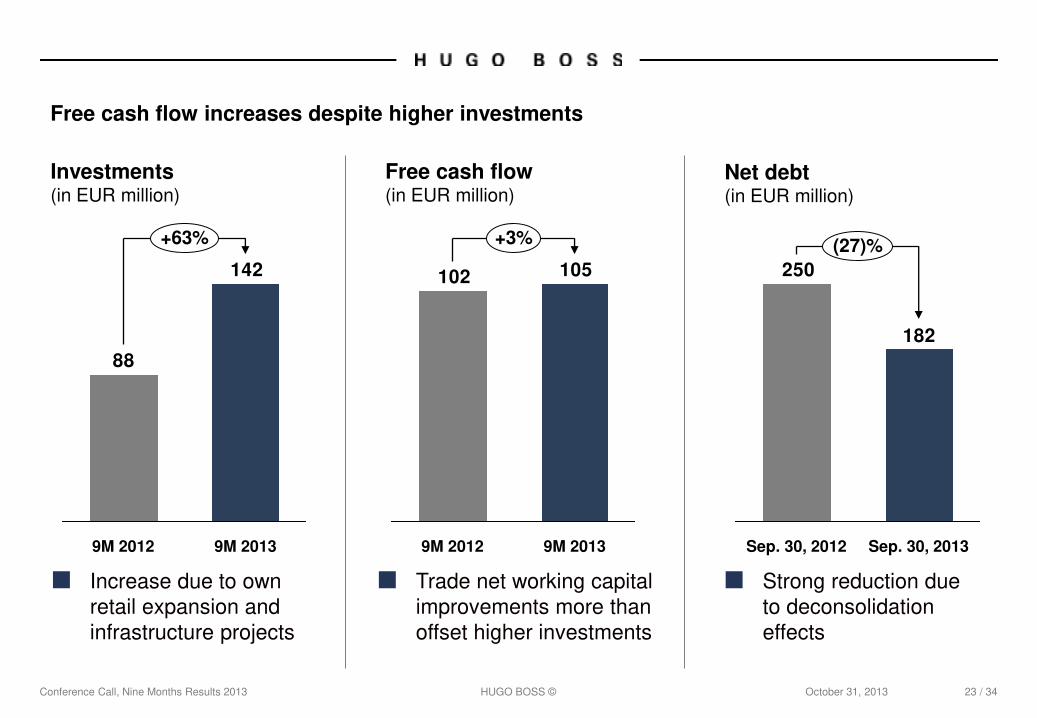
■ Increase due to own
retail expansion and
infrastructure projects
Investments (in EUR million)
■ Strong reduction due
to deconsolidation
effects
Net debt (in EUR million)
142
88
9M 2012 9M 2013
+63%
182
250
Sep. 30, 2013
(27)%
Sep. 30, 2012
■ Trade net working capital
improvements more than
offset higher investments
105102
9M 2013
+3%
9M 2012
October 31, 2013
Free cash flow (in EUR million)
Free cash flow increases despite higher investments
23 / 34

Conference Call, Nine Months Results 2013 HUGO BOSS © October 31, 2013
Agenda
24 / 34
Nine Months Results
Operational Highlights
Outlook 2013
Conference Call, Nine Months Results 2013
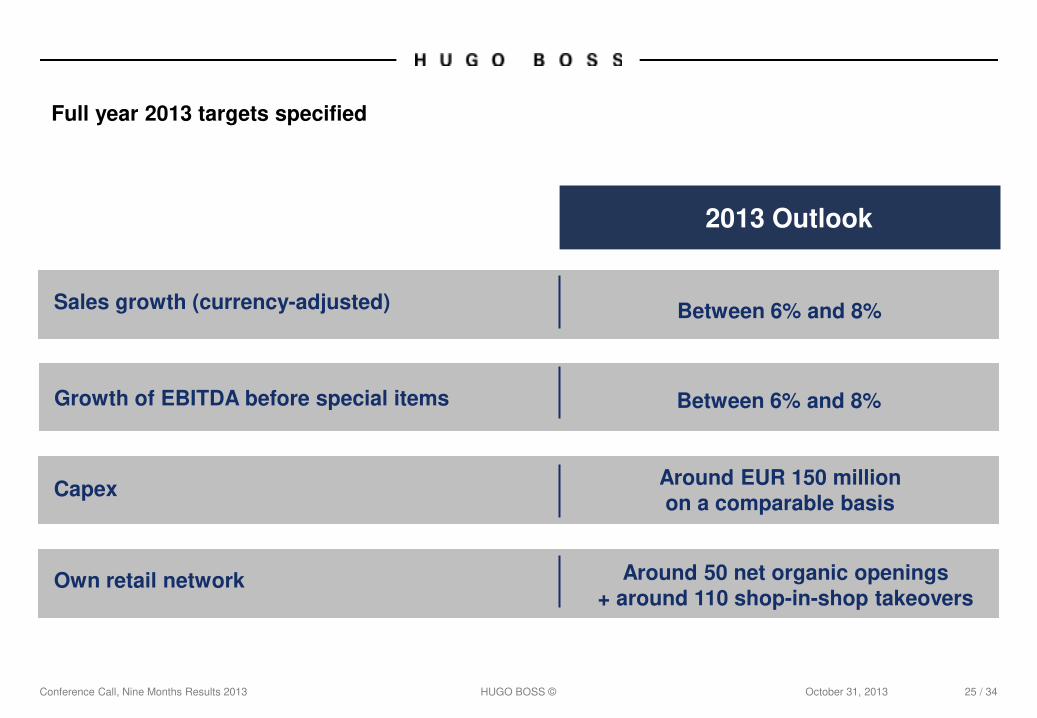
Full year 2013 targets specified
HUGO BOSS ©
Growth of EBITDA before special items 10% to 12%
2013 Outlook
Sales growth (currency-adjusted) Between 6% and 8%
Capex Around EUR 150 million
on a comparable basis
October 31, 2013
Own retail network Around 50 net organic openings
+ around 110 shop-in-shop takeovers
25 / 34
Growth of EBITDA before special items Between 6% and 8%

Conference Call, Nine Months Results 2013 HUGO BOSS © October 31, 2013
Clear strategy execution drives Group results
26 / 34
■ HUGO BOSS has successfully reduced
dependence on the wholesale channel
■ Own retail focus deeply embedded across
the organization
■ Further extension of brand control key to
medium- and long-term growth
Conference Call, Nine Months Results 2013 HUGO BOSS © October 31, 2013 27 / 34
QUESTIONS & ANSWERS

Conference Call, Nine Months Results 2013 HUGO BOSS © October 31, 2013 28 / 34
BACKUP

Conference Call, Nine Months Results 2013
Sales (in EUR million)
Gross margin (in %)
HUGO BOSS ©
EBITDA before special items (in EUR million)
Net debt (in EUR million)
October 31, 2013
Nine months results at a glance
29 / 34
+3%
9M 2013
1.783
9M 2012
1.739
+250bp
9M 2013
63.6%
9M 2012
61.1%
182
250(27)%
Sep. 30, 2013 Sep. 30, 2012
407392
+4%
9M 2013 9M 2012
+4% fx-adjusted

Conference Call, Nine Months Results 2013 HUGO BOSS ©
Profit & loss statement
October 31, 2013 30 / 34
*basic and diluted earnings per share.
in EUR million Q3 2013 Q3 2012 Change in % 9M 2013 9M 2012 Change in %
Net sales 657.9 646.3 2 1,783.1 1,738.5 3
Cost of sales (227.3) (244.9) 7 (613.1) (642.8) 5
Direct selling expenses (12.7) (12.6) (1) (35.3) (34.0) (4)
Gross profit 417.9 388.7 8 1,134.7 1,061.7 7
in % of sales 63.5 60.1 340 bp 63.6 61.1 250 bp
Selling and distribution expenses (221.2) (193.2) (14) (636.8) (573.3) (11)
Administration costs and other operating
income and expenses (46.2) (52.7) 12 (160.5) (156.8) (2)
Operating result (EBIT) 150.5 142.8 5 337.4 331.6 2
in % of sales 22.9 22.1 80 bp 18.9 19.1 (20) bp
Net interest income/expense (1.2) (4.2) 71 (7.1) (11.6) 39
Other financial items (3.2) (2.6) (23) (8.6) (3.4) < (100)
Financial result (4.4) (6.8) 35 (15.7) (15.0) (5)
Earnings before taxes 146.1 136.0 7 321.7 316.6 2
Income taxes (33.6) (32.6) (3) (74.0) (76.0) 3
Net income 112.5 103.4 9 247.7 240.6 3
Attributable to:
Equity holders of the parent company 110.9 103.6 7 244.7 237.7 3
Minority interests 1.6 (0.2) >100 3.0 2.9 5
Earnings per share (EUR)* 1.61 1.50 7 3.55 3.44 3
EBITDA before special items 173.1 165.4 5 407.4 391.7 4
in % of sales 26.3 25.6 70 bp 22.8 22.5 30 bp

Conference Call, Nine Months Results 2013 HUGO BOSS © October 31, 2013
Retail network
*Europe incl. Middle East and Africa.
31 / 34
840
Sep. 30, 2013
992
Closings Asia/Pacific Americas Europe* Dec. 31, 2012
+108
+53 +22 (31)
+ 49 USA + 2 Canada + 1 Brazil + 1 Mexiko
Number of own retail stores:
+ 31 Spain + 24 UK + 23 Germany + 8 France + 4 Austria + 4 Belgium + 4 Netherlands + 3 Switzerland + 2 Ireland + 2 Italy + 1 Poland + 1 Portugal + 1 Russia
+ 8 China + 7 Australia + 4 Singapore + 3 Taiwan

Conference Call, Nine Months Results 2013 HUGO BOSS ©
Financial calendar 2013/2014
Date
October 31, 2013
Event
32 / 34
March 13, 2014 Press and Analysts’ Conference
November 26, 2013 Investor Day, Hong Kong
May 7, 2014 First Quarter Results
May 13, 2014 Annual Shareholders’ Meeting
July 31, 2014 First Half Year Results
November 4, 2014 Nine Months Results

Conference Call, Nine Months Results 2013 HUGO BOSS © October 31, 2013
Forward looking statements contain risks
33 / 34
This document contains forward-looking statements that reflect management's current views with
respect to future events. The words "anticipate ", "assume ", "believe", "estimate", "expect",
"intend", "may", "plan", "project", "should", and similar expressions identify forward-looking
statements. Such statements are subject to risks and uncertainties. If any of these or other risks
and uncertainties occur, or if the assumptions underlying any of these statements prove incorrect,
then actual results may be materially different from those expressed or implied by such statements.
We do not intend or assume any obligation to update any forward-looking statement, which speaks
only as of the date on which it is made.
