hugo bossgroup.hugoboss.com/files/0113_investor_meeting_presentation_2.pdf · integration of boss...
TRANSCRIPT

HUGO BOSS Investor Meeting Presentation January 2013
HUGO BOSS Investor Meeting Presentation HUGO BOSS © January 2013 2 / 67
Agenda
HUGO BOSS Investor Meeting Presentation HUGO BOSS © January 2013 3 / 67
American strategy update
Financial strategy update
Group medium-term strategy
Summary

Agenda
HUGO BOSS Investor Meeting Presentation HUGO BOSS © January 2013 4 / 67
American strategy update
Financial strategy update
Group medium-term strategy
Summary

Continued strong top and bottom line momentum
HUGO BOSS Investor Meeting Presentation HUGO BOSS © January 2013
750
469350
267272275
+19%
2015e
3,000
… 2011
2,059
2010
1,729
2009
+34%
1,562
2008
1,686
2007
1,632
EBITDA before special items
Sales Sales and EBITDA before special items (in EUR million)
5 / 67

Successful execution of medium-term strategy
HUGO BOSS Investor Meeting Presentation HUGO BOSS © January 2013 6 / 67
STRIVING FOR
OPERATIONAL
EXCELLENCE
STRENGTHENING
OUR
BRANDS
EXPLOITING
GLOBAL
GROWTH
OPPORTUNITIES
MAXIMIZING
CONSUMER FOCUS
TO DRIVE RETAIL

Strong portfolio of complementary brands
HUGO BOSS Investor Meeting Presentation HUGO BOSS © January 2013 7 / 67
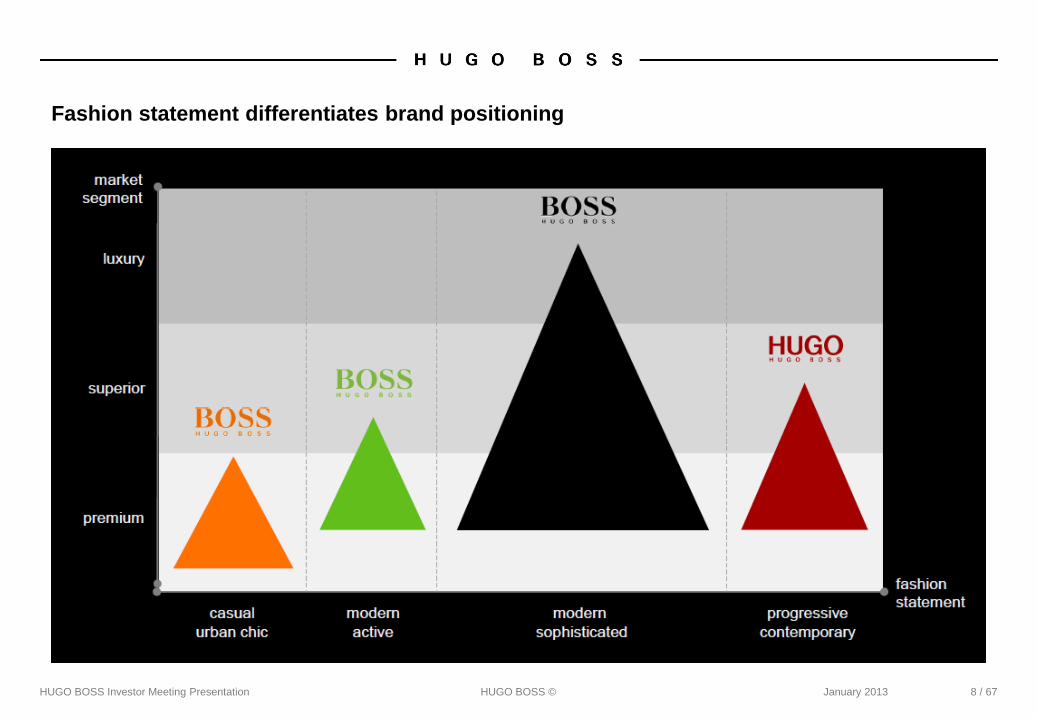
Fashion statement differentiates brand positioning
HUGO BOSS Investor Meeting Presentation HUGO BOSS © January 2013 8 / 67
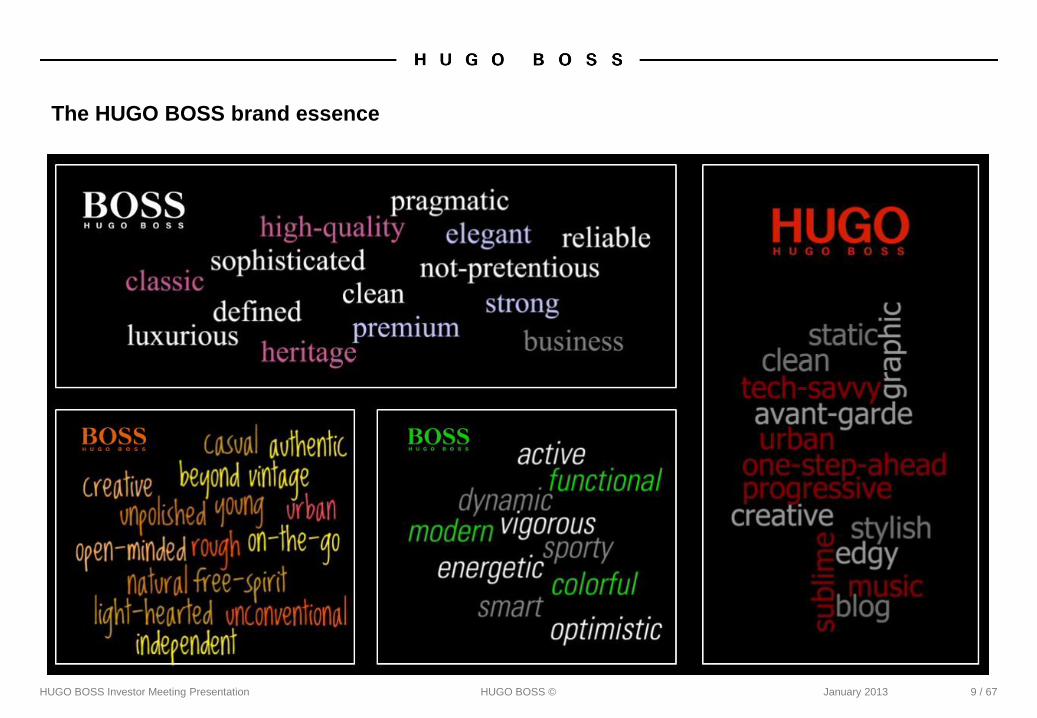
The HUGO BOSS brand essence
HUGO BOSS Investor Meeting Presentation HUGO BOSS © January 2013 9 / 67

The HUGO BOSS brand essence (cont.)
HUGO BOSS Investor Meeting Presentation HUGO BOSS © January 2013 10 / 67

Integration of BOSS Black and BOSS Selection elevates the core brand
HUGO BOSS Investor Meeting Presentation HUGO BOSS © January 2013 11 / 67
■ Strengthens the core brand’s market position in luxury
clothing and sportswear
■ Leverages BOSS growth potential across different
fashion segments from premium to luxury
■ Maximizes the power and global recognition of the
BOSS logo
■ Simplifies communication and retail presentation

Made to Measure demonstrates unrivalled tailoring competence
HUGO BOSS Investor Meeting Presentation HUGO BOSS © January 2013 12 / 67
■ Modern technology and uncompromising
quality “handmade in Germany”
■ Combines excellent craftsmanship,
premium materials and tailor made
service with efficient industrial
manufacturing
■ Permanently offered in several European
flagship stores
■ Rollout in Asia and U.S. under way

HUGO brand the Group’s fashion spearhead
HUGO BOSS Investor Meeting Presentation HUGO BOSS © January 2013 13 / 67
■ Strong positioning as home of
avant-garde design
■ Focus on clean, minimalistic looks
addressing the fashion-forward consumer
■ Targeted expansion of stand-alone
retail presence
■ Significant growth potential in
underpenetrated markets

Strength in sportswear key competitive advantage
HUGO BOSS Investor Meeting Presentation HUGO BOSS © January 2013 14 / 67
Sportswear elegance
Contemporary urban
sportswear
Active sportswear
Collection Occasion to wear
Casual Friday
Luxury Weekend
Daywear
Downtime
Party
Sporty lifestyle
Performance

All brands ready to exploit potential of global sportswear market
HUGO BOSS Investor Meeting Presentation HUGO BOSS © January 2013 15 / 67
■ Offer the best price-value relationship in the premium segment
■ Enhance clarity of product branding
■ Firmly establish BOSS Orange as key premium lifestyle brand at wholesale
■ Convince in leading edge technical innovation
■ Strengthen distribution in golf performance accounts
■ Maximize commercial potential of golf pro cooperations
■ Strengthen product offering in luxury segment
■ Sharpen DNA of ‘Sportswear Elegance’
■ Increase focus on the Asian consumer

Clear womenswear strategy in place
HUGO BOSS Investor Meeting Presentation HUGO BOSS © January 2013 16 / 67
■ Offer excellent and reliable fit with favorable
price-value ratio
■ Grow modern clothing business based on
tailoring expertise
■ Maximize brand potential in leisurewear
■ Grow shoes & accessories supplementing
core apparel offering
■ Introduce party capsules and evening
collection
Product
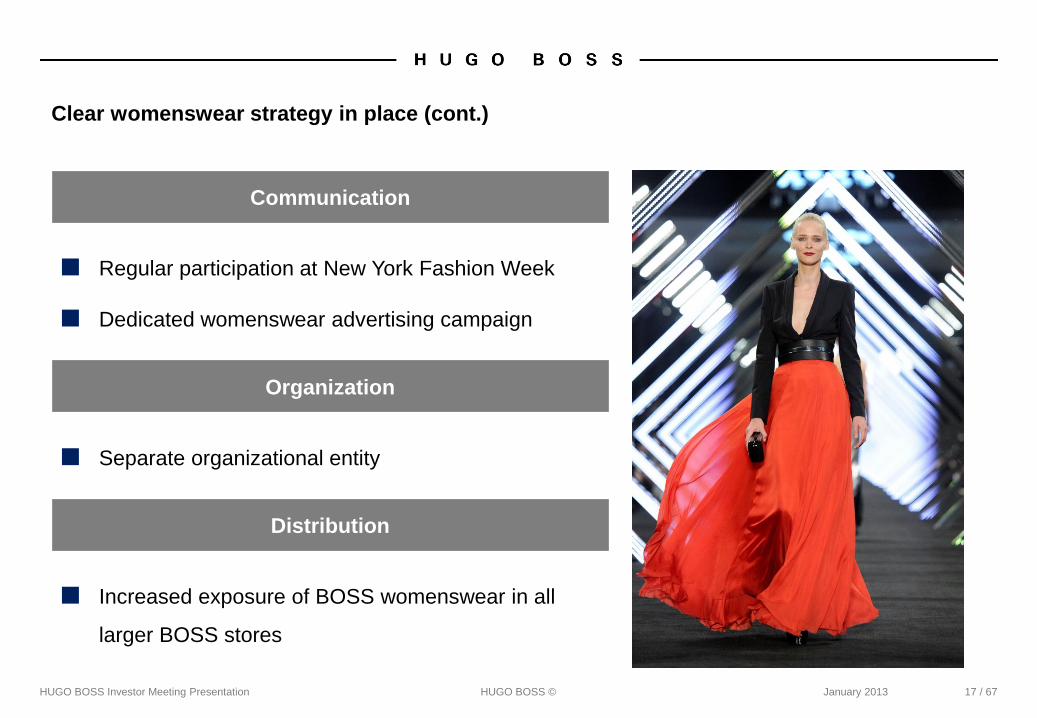
Clear womenswear strategy in place (cont.)
HUGO BOSS Investor Meeting Presentation HUGO BOSS © January 2013 17 / 67
Communication
■ Regular participation at New York Fashion Week
■ Dedicated womenswear advertising campaign
Organization
■ Separate organizational entity
Distribution
■ Increased exposure of BOSS womenswear in all
larger BOSS stores

Unprecedented fashion show presence in 2013
HUGO BOSS Investor Meeting Presentation HUGO BOSS © January 2013 18 / 67
Shanghai, May New York, September

HUGO showcases collections in Berlin
HUGO BOSS Investor Meeting Presentation HUGO BOSS © January 2013 19 / 67
Berlin, January & July

Share of retail sales set to grow further
HUGO BOSS Investor Meeting Presentation HUGO BOSS © January 2013 20 / 67
Wholesale
Retail
Royalties
Sales by distribution channel
2005
3%
75%
22%
2010
3%
57%
40%
2011
2%
53%
45%
2015e
2%
43%
55%
…

Introduction of four season cycle has made HUGO BOSS a true retailer
HUGO BOSS Investor Meeting Presentation HUGO BOSS © January 2013 21 / 67
December January February March April
June July August September October
Spring 2012 Summer 2012
Fall 2012
Winter 2012

Introduction of four season cycle has made HUGO BOSS a true retailer (cont.)
HUGO BOSS Investor Meeting Presentation HUGO BOSS © January 2013 22 / 67
Winter
12% 8%
Fall
40%
46%
Summer
11% 7%
Spring
37% 39%
2012
2011
Seasonal split of wholesale pre-order business
■ Fresher merchandise offering
■ Better adjustment to seasonal differences in
consumer demand
■ Immediate relevance at the point-of-sale
■ Working capital advantages
Development of collection complexity
-7%
2012e 2011

Faster and leaner development process enables market feedback loop
HUGO BOSS Investor Meeting Presentation HUGO BOSS © January 2013 23 / 67

Brand module architecture supports more flexible merchandise offering
HUGO BOSS Investor Meeting Presentation HUGO BOSS © January 2013 24 / 67
“S” Module
“XL” Module
“M” Module

Core range has demonstrated superior performance
Share of core range
HUGO BOSS Investor Meeting Presentation HUGO BOSS © January 2013 25 / 67
0
10
20
30
40
50
60
70
0
5
10
15
20
25
30
35
40
Fall 2012
70%
33%
Spring 2012
67%
28%
Fall 2011
45%
15%
Units sold per style (Fall 2012)
x 4.7
Core range Non core range
Core range style/color (s/c)
as % of total collection s/c
Value share of core range

Heat mapping technology newest in-store design innovation
HUGO BOSS Investor Meeting Presentation HUGO BOSS © January 2013 26 / 67
Purpose Benefits
Enhances understanding of consumer behavior to drive operational performance
■ Generates traffic map
showing the actual
footpath of consumers
in the store over the
course of the day
■ Overlay with
transactional data
offers insights into
correlation between
traffic and sales per
product category
■ Optimizes product
and campaign
positioning
■ Supports optimization
of space utilization
and staff allocation
■ Assesses visual
merchandising
effectiveness
Window Window
Suit wall Shirt wall Bodywear
Shoes / A
ccess
Tie table
Belt Knitwear Outerwear
Knitw
ear
Entrance
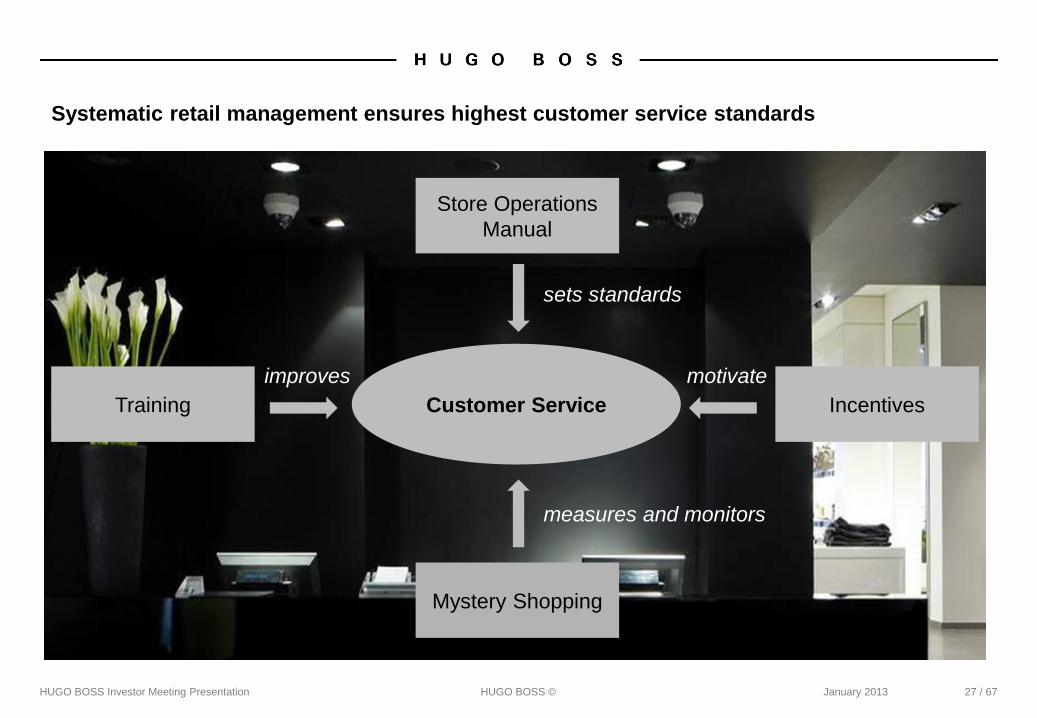
Systematic retail management ensures highest customer service standards
HUGO BOSS Investor Meeting Presentation HUGO BOSS © January 2013 27 / 67
Customer Service Training
Mystery Shopping
Store Operations
Manual
Incentives
sets standards
measures and monitors
improves motivate
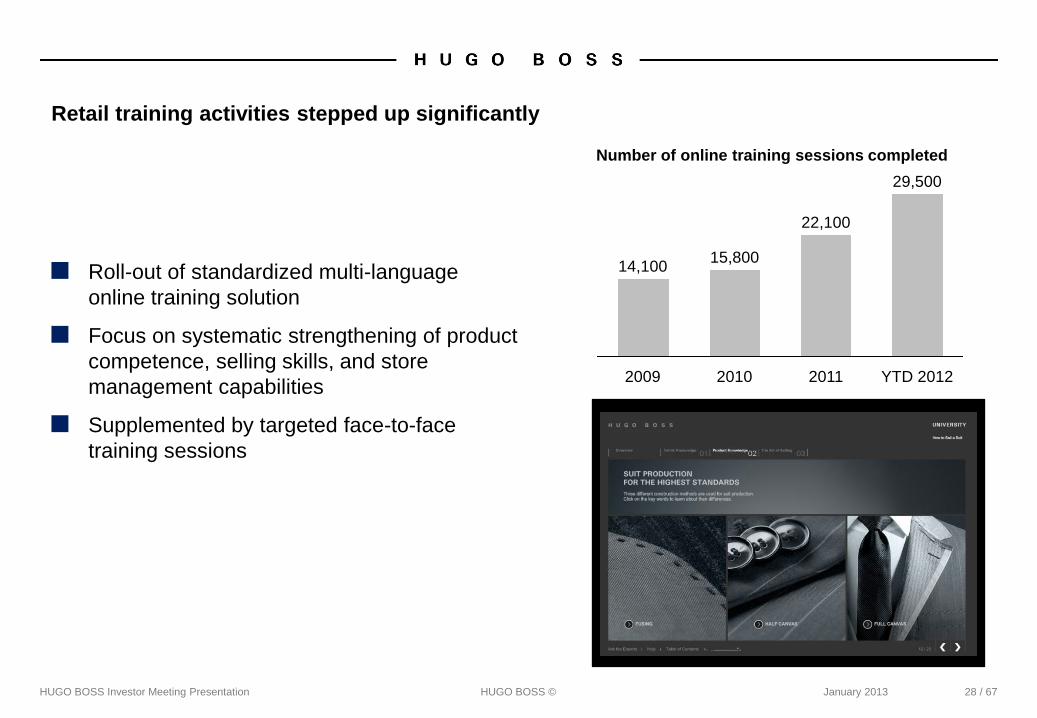
Retail training activities stepped up significantly
HUGO BOSS Investor Meeting Presentation HUGO BOSS © January 2013 28 / 67
■ Roll-out of standardized multi-language
online training solution
■ Focus on systematic strengthening of product
competence, selling skills, and store
management capabilities
■ Supplemented by targeted face-to-face
training sessions
YTD 2012
29,500
2011
22,100
2010
15,800
2009
14,100
Number of online training sessions completed

CRM @ HUGO BOSS - Sharpen the end consumer focus
HUGO BOSS Investor Meeting Presentation HUGO BOSS © January 2013 29 / 67
Understand our customers
Win new customers
Increase customer loyalty
Increase frequency of visits
Increase sales / turnover
Customer data
collection &
quality
Marketing
planning
Analysis &
segmentation
Worldwide HUGO BOSS CRM platform (IT)
HUGO BOSS CRM strategy and guidelines
CRM
activities
Cross-channel knowledge and targeted activities as key competitive advantages

IT and system upgrades improve retail performance management
HUGO BOSS Investor Meeting Presentation HUGO BOSS © January 2013 30 / 67
■ Retail operations almost entirely on SAP
■ Implementation of global retail merchandise
planning solution under way
■ In-store systems provide basis for systematic
performance measurement

Enhanced logistics infrastructure caters to growing retail business
HUGO BOSS Investor Meeting Presentation HUGO BOSS © January 2013 31 / 67
■ Flat-packed goods distribution center Europe
Filderstadt, Germany
New construction
Start of operation: 2014
■ Regional distribution centers Asia
Shanghai and Hong Kong
Relocation and consolidation
Operational since 2011
■ Distribution center Mexico
Mexico City, Mexico
New setup
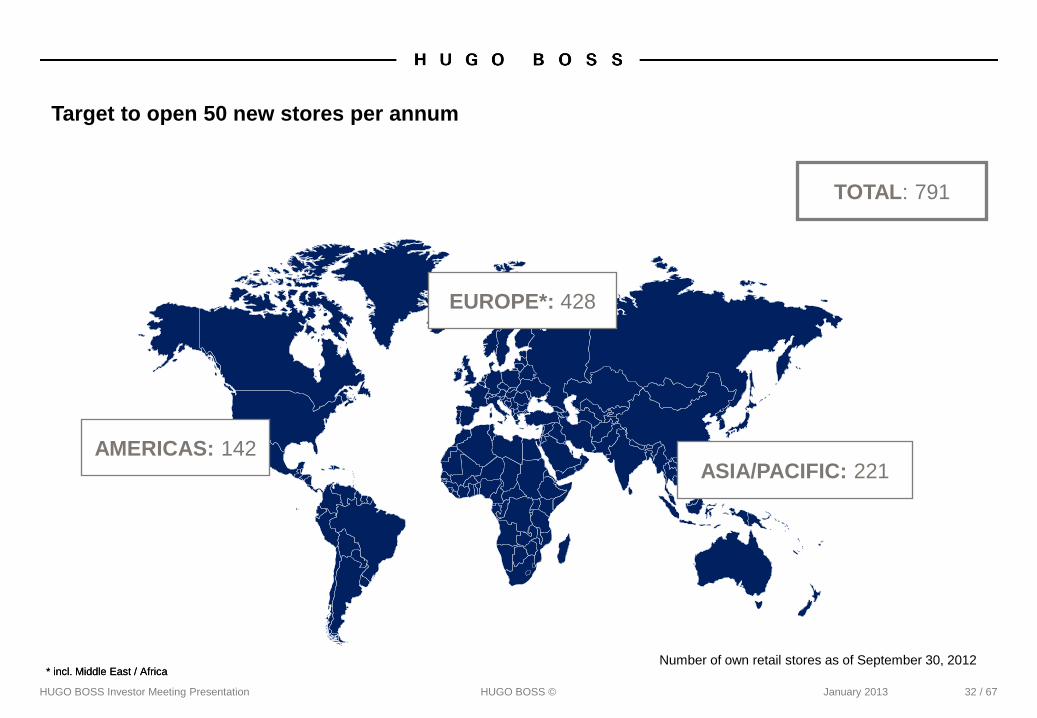
Target to open 50 new stores per annum
HUGO BOSS Investor Meeting Presentation HUGO BOSS © January 2013 32 / 67
* incl. Middle East / Africa Number of own retail stores as of September 30, 2012
* incl. Middle East / Africa
TOTAL: 791
EUROPE*: 428
ASIA/PACIFIC: 221 AMERICAS: 142
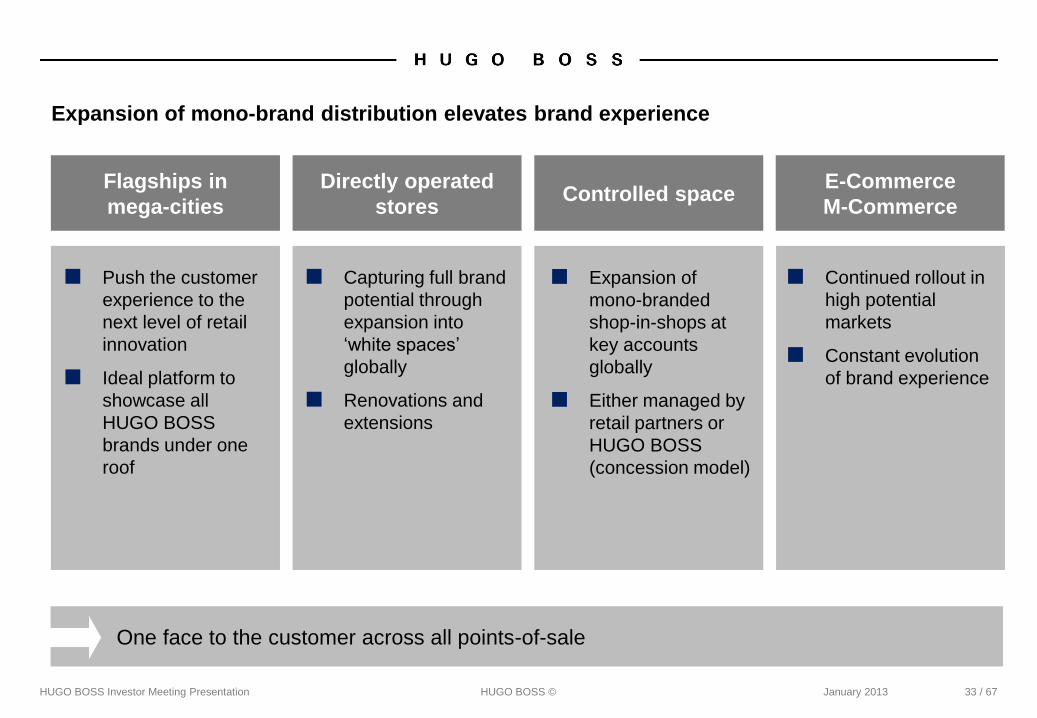
Expansion of mono-brand distribution elevates brand experience
HUGO BOSS Investor Meeting Presentation HUGO BOSS © January 2013 33 / 67
Flagships in
mega-cities
Directly operated
stores Controlled space
E-Commerce
M-Commerce
One face to the customer across all points-of-sale
■ Push the customer
experience to the
next level of retail
innovation
■ Ideal platform to
showcase all
HUGO BOSS
brands under one
roof
■ Capturing full brand
potential through
expansion into
‘white spaces’
globally
■ Renovations and
extensions
■ Expansion of
mono-branded
shop-in-shops at
key accounts
globally
■ Either managed by
retail partners or
HUGO BOSS
(concession model)
■ Continued rollout in
high potential
markets
■ Constant evolution
of brand experience

High-visibility flagship store openings planned in 2013
HUGO BOSS Investor Meeting Presentation HUGO BOSS © January 2013 34 / 67
BOSS Store Shanghai,
Kerry Center
BOSS Store Tokyo,
Omotesando
BOSS Store Shanghai,
APM International
BOSS Store Amsterdam,
Leidsestraat BOSS Store Berlin,
Kurfürstendamm

Wholesale remains an important distribution channel
HUGO BOSS Investor Meeting Presentation HUGO BOSS © January 2013 35 / 67
■ 40+ year business relationships
■ Reliable sell-through performance
■ Grown retail competence
■ Industry-leading delivery and service levels
HUGO BOSS is best positioned for further growth…
…despite structural headwinds
■ Limited space expansion
■ Mono-brand nature of fast growing emerging markets
■ Ongoing consolidation
■ Franchise takeovers
+7%
2011 2010
Average net sales per wholesale POS
45% // Retail
53% // Wholesale
2% // Royalties
38% // Multibrand
15% // Franchise
Sales by distribution channel 2011
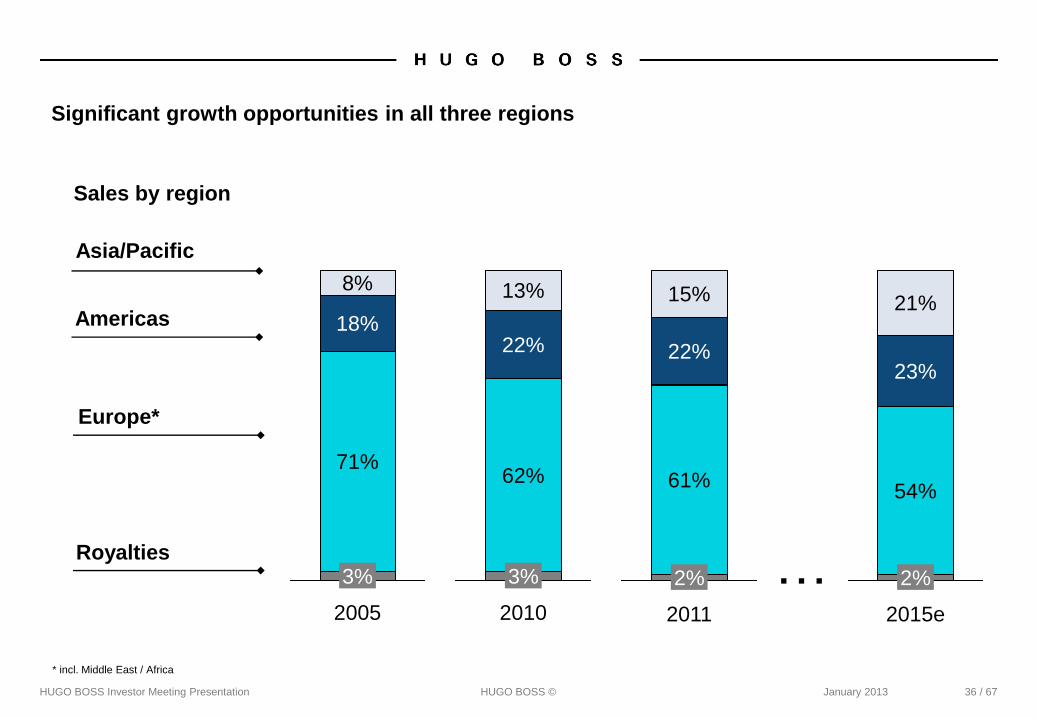
Significant growth opportunities in all three regions
HUGO BOSS Investor Meeting Presentation HUGO BOSS © January 2013 36 / 67
Europe*
Royalties
Americas
Sales by region
2005
3%
71%
18%
8%
2010
3%
62%
22%
13%
2011
2%
61%
22%
15%
2015e
2%
54%
23%
21%
…
Asia/Pacific
* incl. Middle East / Africa

Agenda
HUGO BOSS Investor Meeting Presentation HUGO BOSS © January 2013 37 / 67
American strategy update
Financial strategy update
Group medium-term strategy
Summary
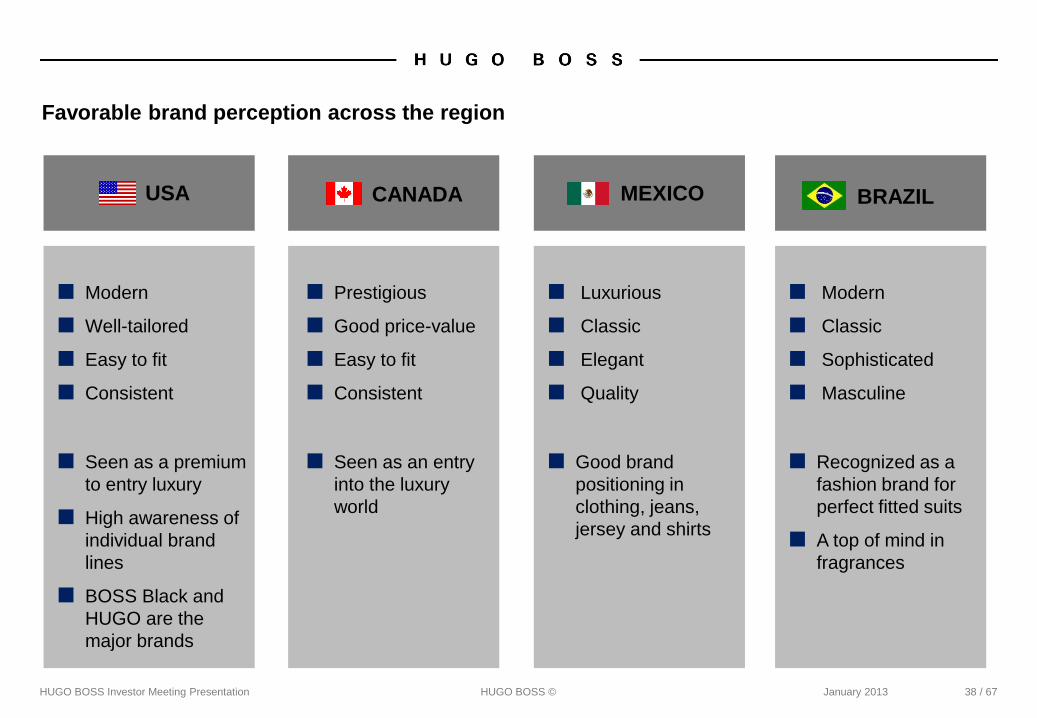
Favorable brand perception across the region
HUGO BOSS Investor Meeting Presentation HUGO BOSS © January 2013 38 / 67
■ Modern
■ Well-tailored
■ Easy to fit
■ Consistent
USA CANADA MEXICO BRAZIL
■ Seen as a premium
to entry luxury
■ High awareness of
individual brand
lines
■ BOSS Black and
HUGO are the
major brands
■ Prestigious
■ Good price-value
■ Easy to fit
■ Consistent
■ Luxurious
■ Classic
■ Elegant
■ Quality
■ Modern
■ Classic
■ Sophisticated
■ Masculine
■ Seen as an entry
into the luxury
world
■ Good brand
positioning in
clothing, jeans,
jersey and shirts
■ Recognized as a
fashion brand for
perfect fitted suits
■ A top of mind in
fragrances

HUGO BOSS has clear competitive advantages in the Americas
HUGO BOSS Investor Meeting Presentation HUGO BOSS © January 2013 39 / 67
Style
■ HUGO BOSS leads the modern, wear-to-work market for men
and women
■ HUGO BOSS has great name recognition in all regional markets
Quality ■ HUGO BOSS is recognized as providing consistency in fit and quality
European lifestyle brand value in the Americas
■ HUGO BOSS is seen as having a strong price/value relationship Price

Broad portfolio of unique brands
HUGO BOSS Investor Meeting Presentation HUGO BOSS © January 2013 40 / 67
U.S.A. Canada Mexico Brazil Americas*
BOSS
BOSS Selection
BOSS Orange
BOSS Green
HUGO
Differentiated brands allow us to speak to different customer segments
*All splits based on full year 2012 sales estimates
76% // BOSS
2% // BOSS Selection
8% // BOSS Orange
7% // BOSS Green
7% // HUGO

Attractive growth opportunities across several categories
HUGO BOSS Investor Meeting Presentation HUGO BOSS © January 2013 41 / 67
HUGO menswear clothing
■ Introduction of suit separates in Fall ‘12 with positive
early response
BOSS womenswear clothing
■ Direct involvement with designers in the U.S. to increase
regionally relevant content
BOSS men’s shoes
■ Development of strong good/better/best strategy with
$295 Italian made shoes for Fall ‘13
BOSS replenishment programs
■ Relaunch of sportswear basics and bodywear
businesses over the course of 2013

Continued store expansion in the Americas
HUGO BOSS Investor Meeting Presentation HUGO BOSS © January 2013 42 / 67
■ Total number of own retail stores in the Americas amounts to 142 stores at the
end of September 2012
■ Around 15 store openings across the region projected for 2013
■ Number of stores in Brazil to double between 2011 and 2013
33 35
22
43
Sep. 30, 2012
142
64
Dec. 31, 2009
108
53
Outlets
Stores
Shop-in-shops
Number of own retail POS // Americas
8
44
19
71
Brazil
Mexico
Canada
USA
Own retail POS in the Americas by country (as of Sep. 30, 2012)

Manhasset, New York, USA
HUGO BOSS Investor Meeting Presentation HUGO BOSS © January 2013 43 / 67

Beverly Center, California, USA
HUGO BOSS Investor Meeting Presentation HUGO BOSS © January 2013 44 / 67

HUGO BOSS wins market share at wholesale
HUGO BOSS Investor Meeting Presentation HUGO BOSS © January 2013 45 / 67
Q1 2012
Q2 2012
Q3 2012
Wholesale
sales
YTD Sep. ’12**
Reported comp store sales growth*
+3.5%
+4.8% +4.7% +3.3%
+9.3% +4.9% +11.2%
+4.4% +3.0% +3.7%
+5.0% +3.0% +5.0%
+14%
* Figures exclude online sales segment whenever available
** Total U.S. wholesale sales
+4.3% +5.3%

Controlled retail space upgrades brand presentation
HUGO BOSS Investor Meeting Presentation HUGO BOSS © January 2013 46 / 67
■ Aggressive development over past two years
■ BOSS collection launched in 18 Neiman
Marcus doors
Shop-in-shop expansion Number of U.S. shop-in-shops
37
2
2013e
~70
2012e
~45
2011 2010
Transition to concession business model
■ Increased sales at retail through:
■ Dominant assortments
■ Controlled merchandising
■ Dedicated sales associates
■ Experience in the Americas region
Holt Renfrew shop-in-shop, Ste Foy, Canada

HUGO BOSS Investor Meeting Presentation HUGO BOSS © January 2013 47 / 67
Target: USD 1 billion net sales in the Americas in 2015
Agenda
HUGO BOSS Investor Meeting Presentation HUGO BOSS © January 2013 48 / 67
American strategy update
Financial strategy update
Group medium-term strategy
Summary

Continued focus on profitable growth
HUGO BOSS Investor Meeting Presentation HUGO BOSS © January 2013 49 / 67
■ Space expansion and comp store sales growth
■ Growth across all regions
■ Above-average increases in underpenetrated
categories
■ Distribution channel mix to benefit
gross margin
■ Comp store sales growth to leverage
retail cost base
■ Marketing expenditures between 6%
and 7% of Group sales
■ Below-average growth of all other
operating expenses
+10%
2,059
3,000
2011 … 2015e
CAGR
+12.5%
469
750
CAGR
2011 … 2015e
Sales (in EUR million)
EBITDA (in EUR million)

Working capital management key focus to maximize free cash flow
HUGO BOSS Investor Meeting Presentation HUGO BOSS © January 2013 50 / 67
Average trade net working capital as a percentage of sales at year-end (in %)
19.9
2011 2010
19.2
2009
24.6
2008
29.2
2007
28.2

Dividend strategy confirmed
HUGO BOSS Investor Meeting Presentation HUGO BOSS © January 2013 51 / 67
0
10
20
30
40
50
60
70
80
90
2.50
2.00
1.50
1.00
0.50
0.00
2011
2.88
70%
2010
2.02
75%
2009
0.96
64%
2008
1.37
85% 3.00
1.45
65%
2006
1.19
64%
2005
1.00
65%
2004
0.84
67%
2003
0.78
67%
2002
0.75
71%
2007
Dividend* and payout ratio**
* Excluding special dividend // ** As a percentage of net profit attributable to the shareholders of the parent company
Dividend policy stipulates distribution of 60% to 80% of consolidated net profit
Payout ratio
Dividend
in EUR in %
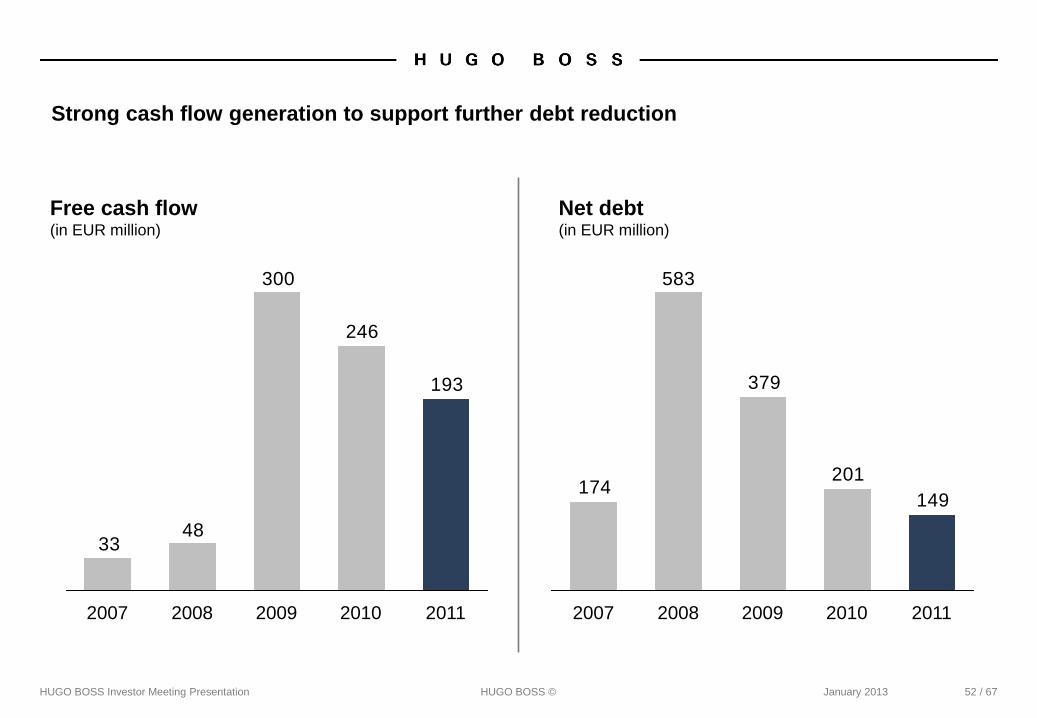
Strong cash flow generation to support further debt reduction
HUGO BOSS Investor Meeting Presentation HUGO BOSS © January 2013 52 / 67
Free cash flow (in EUR million)
Net debt (in EUR million)
149
201
379
583
174
2011 2010 2009 2008 2007
193
246
300
4833
2011 2010 2009 2008 2007

Agenda
HUGO BOSS Investor Meeting Presentation HUGO BOSS © January 2013 53 / 67
American strategy update
Financial strategy update
Group medium-term strategy
Summary

2012 guidance confirmed
Growth of EBITDA before special items 10% to 12%
HUGO BOSS Investor Meeting Presentation HUGO BOSS ©
2012 Outlook
Sales growth (currency-adjusted) Up to 10%
Capex Above prior year level
Own retail network Around 80 net organic openings
January 2013 54 / 67
Growth of EBITDA before special items 10% to 12%
HUGO BOSS on track for achievement of short- and medium-term targets
HUGO BOSS Investor Meeting Presentation HUGO BOSS © January 2013 55 / 67
■ Transformation from wholesale-minded to consumer-
focused company well under way
■ All four strategy pillars contribute to growth
■ Strong performance in the Americas
■ Further progress towards achievement
of medium-term targets in 2013

HUGO BOSS Investor Meeting Presentation HUGO BOSS © January 2013 56 / 67
BACKUP

5-Year Overview
HUGO BOSS Investor Meeting Presentation HUGO BOSS © January 2013 57 / 67
in EUR million 2011 2010 2009 2008 2007Earnings PositionSales 2,058.8 1,729.4 1,561.9 1,686.1 1,632.0Gross Profit 1,264.8 1,027.2 847.1 891.0 845.0EBITDA 467.5 336.1 224.5 236.0 287.1EBITDA before special items 469.0 349.8 267.2 272.4 274.7EBIT 394.1 263.9 155.4 175.0 219.7Net income attributable to equity holders of the parent company 284.5 185.9 104.0 112.1 154.2Financial Position and DividendFree cash flow 193.3 246.3 299.5 48.1 33.0Net debt 149.1 201.1 379.1 583.2 173.6Capital expenditures 108.5 55.6 48.3 118.8 84.7Depreciation/amortization 73.4 72.2 69.1 61.0 67.4Dividend 199,1 139.7 66.6 94.9 100.4Special dividend - - - - 345.1Asset and Liability StructureTotal assets 1,449.0 1,355.4 1,065.4 1,161.6 1,039.3Shareholders' equity 523.2 361.2 205.5 202.9 550.7Trade net working capital 407.4 204.8 223.0 391.9 397.4Non-current assets 524.9 467.2 435.0 463.0 400.5Key FiguresGross profit margin in % 61.4 59.4 54.2 52.8 51.8Adjusted EBITDA margin in %* 22.8 20.2 17.1 16.2 16.8EBIT margin in % 19.1 15.3 10.0 10.4 13.5Total leverage** 0.3 0.6 1.4 2.1 0.6Equity ratio in % 36.1 26.6 19.3 17.5 53.0
* EBITDA before special items/Sales* * Net debt/EBITDA before special items and expenses for the "Stock Appreciation Rights Program"

Sales (in EUR million)
Gross margin (in %)
EBITDA before special items (in EUR million)
Net debt (in EUR million)
Nine months results at a glance
HUGO BOSS Investor Meeting Presentation HUGO BOSS © January 2013 58 / 67
+11%
9M 2012
1,739
9M 2011
1,560
+1.2pp
9M 2012
61.1%
9M 2011
59.9%
250247
+1%
Sep. 30, 2012 Sep. 30, 2011
392372
+5%
9M 2012 9M 2011

Profit & loss statement
HUGO BOSS Investor Meeting Presentation HUGO BOSS © January 2013 59 / 67
* Basic and diluted shares
** Preferred shares were converted into ordinary shares on June 15, 2012
in EUR million Q3 2012 Q3 2011 Change in %Jan.-Sep.
2012Jan.-Sep.
2011 Change in %
Net sales 646.3 615.0 5 1,738.5 1,559.6 11
Cost of sales (245.0) (241.1) (2) (642.8) (596.4) (8)Direct selling expenses (12.6) (12.0) (5) (34.0) (29.0) (17)
Gross profit 388.7 361.9 7 1,061.7 934.2 14in % of sales 60.1 58.8 1.3 pp 61.1 59.9 1.2 pp
Selling and distribution expenses (193.2) (159.1) (21) (573.3) (473.2) (21)Administration costs and other operating income and expenses (52.7) (43.1) (22) (156.8) (139.6) (12)
Operating result (EBIT) 142.8 159.7 (11) 331.6 321.4 3in % of sales 22.1 26.0 (3.9 pp) 19.1 20.6 (1.5 pp)
Net interest income/expense (4.2) (4.1) (2) (11.6) (11.8) 2Other financial items (2.6) 2.0 <(100) (3.4) 1.2 <(100)
Financial result (6.8) (2.1) <(100) (15.0) (10.6) (42)
Earnings before taxes 136.0 157.6 (14) 316.6 310.8 2Income taxes (32.6) (37.9) 14 (76.0) (74.6) (2)
Net income 103.4 119.7 (14) 240.6 236.2 2
Attributable to:Equity holders of the parent company 103.6 118.0 (12) 237.7 231.1 3Minority interests (0.2) 1.7 <(100) 2.9 5.1 (43)
Net income 103.4 119.7 (14) 240.6 236.2 2
Earnings per share (EUR)*Ordinary share 1.50 1.71 (12) 3.44 3.34 3Preferred share** 1.71 3.35
EBITDA before special items 165.4 177.1 (7) 391.7 372.1 5in % of sales 25.6 28.8 (3.2 pp) 22.5 23.9 (1.4 pp)

Sales by distribution channel
HUGO BOSS Investor Meeting Presentation HUGO BOSS ©
17
11
25
2
7
17
19
-1
-5 0 5 10 15 20 25 30
Group
Royalties
Retail
Wholesale
fx adjusted
in euro Sales growth by channel, y-o-y 9M 2012
(in %)
5
16
23
-5
0
16
15
-9
-10 -5 0 5 10 15 20 25
Group
Royalties
Retail
Wholesale
fx adjusted
in euro Sales growth by channel, y-o-y Q3 2012
(in %)
January 2013 60 / 67

Sales by region
HUGO BOSS Investor Meeting Presentation HUGO BOSS ©
*incl. Middle East and Africa
11
16
22
7
7
5
13
6
0 5 10 15 20 25
Group
Asia/Pacific
Americas
Europe*
fx adjusted
in euro Sales growth by region, y-o-y 9M 2012
(in %)
13
5
13
25
-3
0
0
-4
-5 0 5 10 15 20 25 30
Group
Asia/Pacific
Americas
Europe*
fx adjusted
in euro Sales growth by region, y-o-y Q3 2012
(in %)
January 2013 61 / 67

Trade net working capital
HUGO BOSS Investor Meeting Presentation HUGO BOSS ©
0
5
10
15
20
25
30
Q4 2011
19.9
Q3 2011
19.6
Q2 2011
19.3
Q1 2011
19.1
Q4 2010
19.2
Q3 2010
19.9
Q2 2010
20.9
Q1 2010 Q3 2009
27.2
Q2 2009
28.5
Q1 2009
29.7
22.7 +1.4pp
Q3 2012
21.0
Q2 2012
20.8
Q1 2012
20.2
24.6
Q4 2009
Average trade net working capital as a
percentage of sales by quarter (in %)
January 2013 62 / 67
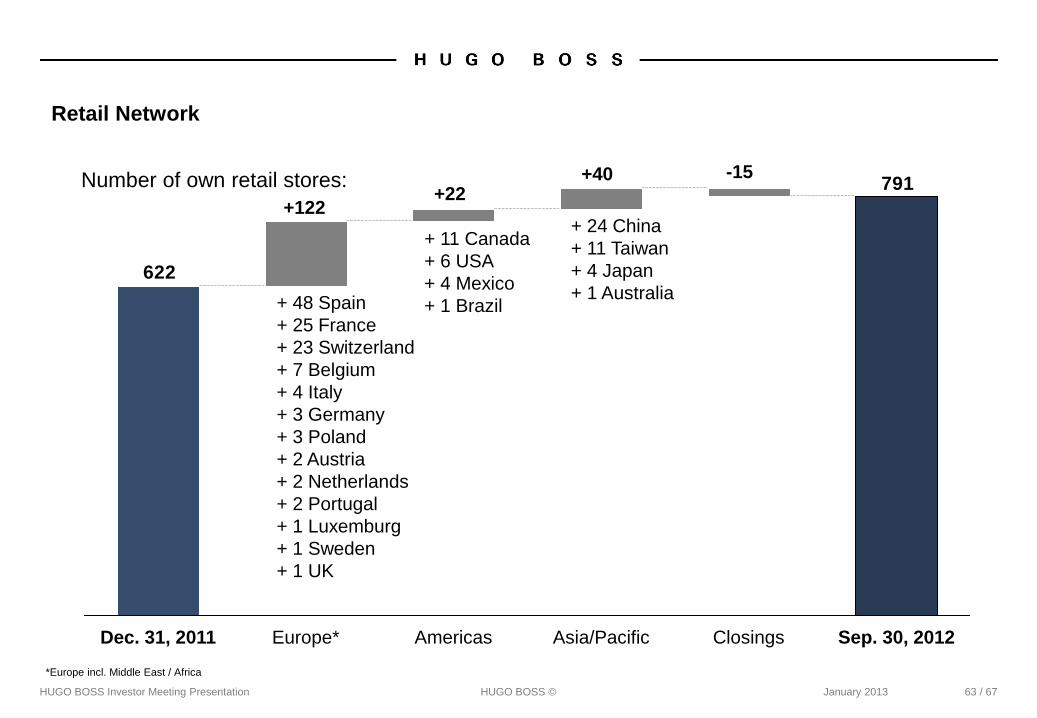
Retail Network
HUGO BOSS Investor Meeting Presentation HUGO BOSS © January 2013
*Europe incl. Middle East / Africa
63 / 67
Number of own retail stores: 791
622
Sep. 30, 2012 Closings Asia/Pacific Americas Europe* Dec. 31, 2011
+122 +22
+40 -15
+ 48 Spain
+ 25 France
+ 23 Switzerland
+ 7 Belgium
+ 4 Italy
+ 3 Germany
+ 3 Poland
+ 2 Austria
+ 2 Netherlands
+ 2 Portugal
+ 1 Luxemburg
+ 1 Sweden
+ 1 UK
+ 11 Canada
+ 6 USA
+ 4 Mexico
+ 1 Brazil
+ 24 China
+ 11 Taiwan
+ 4 Japan
+ 1 Australia

Level I ADR program to launched in January 2013
HUGO BOSS Investor Meeting Presentation HUGO BOSS © January 2013 64 / 67
ADR Details Benefits of ADRs for
U.S. investors
■ Clear and settle according to normal U.S.
standards
■ Offer the convenience of stock quotes and
dividend payments in U.S. dollars
■ Can be purchased/sold in the same way as
other U.S. stocks via a U.S. broker
■ Provide a cost-effective means of
international portfolio diversification
Market OTC
Symbol BOSSY
CUSIP 444560106
Ratio 5 : 1
Country Germany
Effective Date Jan 18, 2013
Underlying SEDOL B88MHC4
Underlying ISIN DE000A1PHFF7
Depositary BNY Mellon
Hong Kong
Joe Oakenfold
email: [email protected]
Tel: +852 2840 9717
New York
Ravi Davis
email: [email protected]
Tel: +1 212 815 4245
London
Mark Lewis
email: [email protected]
Tel: +44 (0)20 7964 6089
For questions about creating HUGO BOSS ADRs, please contact BNY Mellon:
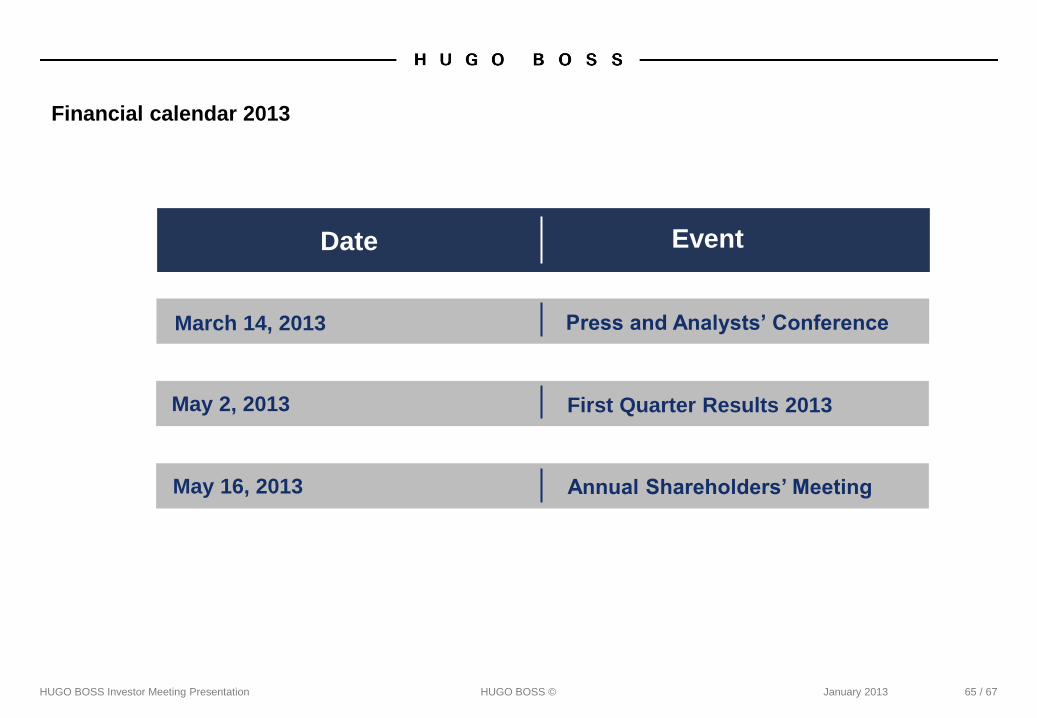
Financial calendar 2013
HUGO BOSS Investor Meeting Presentation HUGO BOSS ©
Date Event
March 14, 2013 Press and Analysts’ Conference
May 2, 2013 First Quarter Results 2013
May 16, 2013 Annual Shareholders’ Meeting
January 2013 65 / 67
Forward looking statements contain risks
HUGO BOSS Investor Meeting Presentation HUGO BOSS © January 2013 66 / 67
This document contains forward-looking statements that reflect management's current views with
respect to future events. The words "anticipate ", "assume ", "believe", "estimate", "expect",
"intend", "may", "plan", "project", "should", and similar expressions identify forward-looking
statements. Such statements are subject to risks and uncertainties. If any of these or other risks
and uncertainties occur, or if the assumptions underlying any of these statements prove incorrect,
then actual results may be materially different from those expressed or implied by such statements.
We do not intend or assume any obligation to update any forward-looking statement, which speaks
only as of the date on which it is made.
