annu al repo rt 2011 - hugo boss · 2020-03-25 · 041 corporate governance report 048 hugo boss...
TRANSCRIPT

AnnuAl RepoRt 2011

GrOUp SaleS
TarGeTS fOr 2011 1
accelerated currency-neutral increase as against previous year
reSUlTS in 2011
Group sales up 19% (up 19% after adjustment for currency effects) to eur 2,059 million
fOrecaST fOr 2012
Further currency-neutral increase
SaleS BY reGiOn
TarGeTS fOr 2011 1
Growth in all regions
reSUlTS in 2011
Double-digit increase in sales in all regi-ons (europe +15%, america +24%, asia +34%, all after adjustment for currency effects)
fOrecaST fOr 2012
Growth in all regions
SaleS BY diSTriBUTiOn cHannel
TarGeTS fOr 2011 1
Double-digit growth in own retail business, growth in wholesale business
reSUlTS in 2011
sales in own retail business up 35% after adjustment for currency effects, sales in wholesale business up 9% after adjustment for currency effects
fOrecaST fOr 2012
Double-digit growth in own retail business, growth in wholesale business
eBiTda BefOre Special iTemS
TarGeTS fOr 2011 1
Greater increase than the increase in sales
reSUlTS in 2011
eBItDa before special items up 34% to eur 469 million, adjusted eBItDa margin up 260 basis points to 22.8%
fOrecaST fOr 2012
Greater increase than the increase in sales
neT deBT
Own reTail STOreS
TarGeTS fOr 2011 1
TarGeTS fOr 2011 1
Further reduction
expansion
reSUlTS in 2011
reSUlTS in 2011
net debt down 26% to eur 149 million
network of own retail stores expanded by 85 stores in net terms to total 622
fOrecaST fOr 2012
fOrecaST fOr 2012
Further reduction
Further expansion
1 Based on the outlook in the 2010 annual report. targets were detailed over the course of the year.
deGree Of TarGeT acHievemenT and fOrecaST

Brand World, page 058
Notes AdditioNAlFiscAl YeArGroup proFileto our shAreholders

01 to our shAreholders 030 Letter to Shareholders032 Managing Board034 Supervisory Board036 Report of the Supervisory Board041 Corporate Governance Report048 HUGO BOSS – Key Share Data049 HUGO BOSS on the Capital Market
02 Group MANAGeMeNt report – Group proFile 058 Business Activities and Group Structure062 Group Management066 Group Strategy076 Employees082 Innovation and Development085 Sourcing and Production089 Sustainability
03 Group MANAGeMeNt report – the FiscAl YeAr 097 Group Sales and Results of Operations111 Profit Development of the Business Segments116 Net Assets and Financial Position128 Overall Statement on the Economic Situation129 Compensation for the Managing and Supervisory Boards130 Special Legal Disclosures133 Report on Risks and Opportunities151 Subsequent Events and Outlook
04 coNsolidAted FiNANciAl stAteMeNts 160 Consolidated Income Statement161 Statement of Comprehensive Income162 Consolidated Balance Sheet164 Statement of Changes in Consolidated Equity166 Consolidated Statement of Cash Flows167 Notes to the Consolidated Financial Statements for Fiscal Year 2011189 Notes to the Consolidated Income Statement196 Notes to the Consolidated Balance Sheet215 Other Disclosures232 Information Concerning the Majority Shareholder243 Managing Board244 Supervisory Board246 Additional Information on the Duties of Supervisory Board and Managing Board Members248 Responsibility Statement – Consolidated Financial Statements249 Auditor’s Report
05 AdditioNAl 254 General Information254 Forward-Looking Statements255 Financial Calendar and Contacts256 Glossary260 Index262 Index of Figures264 Legal Notice
coNteNts

01 to our shAreholders 030 Letter to Shareholders032 Managing Board034 Supervisory Board036 Report of the Supervisory Board041 Corporate Governance Report048 HUGO BOSS – Key Share Data049 HUGO BOSS on the Capital Market
02 Group MANAGeMeNt report – Group proFile 058 Business Activities and Group Structure062 Group Management066 Group Strategy076 Employees082 Innovation and Development085 Sourcing and Production089 Sustainability
03 Group MANAGeMeNt report – the FiscAl YeAr 097 Group Sales and Results of Operations111 Profit Development of the Business Segments116 Net Assets and Financial Position128 Overall Statement on the Economic Situation129 Compensation for the Managing and Supervisory Boards130 Special Legal Disclosures133 Report on Risks and Opportunities151 Subsequent Events and Outlook
04 coNsolidAted FiNANciAl stAteMeNts 160 Consolidated Income Statement161 Statement of Comprehensive Income162 Consolidated Balance Sheet164 Statement of Changes in Consolidated Equity166 Consolidated Statement of Cash Flows167 Notes to the Consolidated Financial Statements for Fiscal Year 2011189 Notes to the Consolidated Income Statement196 Notes to the Consolidated Balance Sheet215 Other Disclosures232 Information Concerning the Majority Shareholder243 Managing Board244 Supervisory Board246 Additional Information on the Duties of Supervisory Board and Managing Board Members248 Responsibility Statement – Consolidated Financial Statements249 Auditor’s Report
05 AdditioNAl 254 General Information254 Forward-Looking Statements255 Financial Calendar and Contacts256 Glossary260 Index262 Index of Figures264 Legal Notice
Notes AdditioNAlFiscAl YeArGroup proFileto our shAreholders

trulY GlobAl As an internationally successful organization, HUGO BOSS has become
synonymous with fashion and lifestyle worldwide. Its roots lie in the small
south-west German town of Metzingen, where the Group still maintains its
headquarters. But HUGO BOSS has a presence that extends around the
globe – to Europe, America and Asia. To major cities, mountain tops and
even to the sea.
HUGO BOSS AG Corporate Headquarters, Metzingen, Germany

Notes AdditioNAlFiscAl YeArGroup proFileto our shAreholders

5 – Ne w Yor k U S A VIP Shopping Experience
1 – be rl iN G Er M A n y HUGO Fashion Show
7 – Arlbe rG AU S T r I A Fascinating Outlook – Horizon Field
2 – Me t z iNGeN G Er M A n y BOSS Selection Made to Measure – Made in Germany
6 – pAr is F r A n c E Well Positioned – Seasonal Image campaigns
8 – sÃo pAulo B r A z I l Dress Me for the Finale – 30-year Partnership between HUGO BOSS and Mclaren Mercedes

3 – shANGhAi c H I n A new Distribution Processes drive Merchandise Management Efficiency
4 – sheNYANG c H I n A Brand Showcase – Own retail
9 – sYdNeY AU S T r A l I A Alex Thomson sets Sail in the HUGO BOSS yacht
Notes AdditioNAlFiscAl YeArGroup proFileto our shAreholders

In July 2011 HUGO presented its Spring/Summer collection for 2012
at the Museum Island Forum in the heart of Berlin. With its austere
industrial mood, this historically important building on the banks of
the river Spree provided the perfect backdrop for the collection‘s
minimalistic and postmodern looks headlining under “Poetic Tailoring”.
1 – be rl iN , Ge r MANY
“poetic tAiloriNG” At the huGo FAshioN show

Notes AdditioNAlFiscAl YeArGroup proFileto our shAreholders


customized tailoring is the consummate expression of HUGO BOSS’ rich
legacy and years of experience in designing and producing suits. Since
2011, “Made to Measure” has embodied the exclusive pinnacle of the
BOSS Selection brand. Specially chosen materials and hand-crafted
details ensure true elegance and style, making a BOSS Selection
Made to Measure suit the ultimate in personal luxury – made in Germany.
2 – Me t z iNGeN, Ge r MANY
boss selectioN MAde to MeAsure – MAde iN GerMANY
Notes AdditioNAlFiscAl YeArGroup proFileto our shAreholders

With major logistics hubs in Shanghai and Hong Kong, HUGO BOSS is creating
the infrastructure that will sustain its expansion strategy in the China region. The
introduction of new processes allows an allocation of merchandise to markets
that is keyed to actual order levels, making delivery to retailers faster and more
flexible for all distribution channels. As a result, the Company can optimize
product range management in its own stores and provide the best possible
service to its retail partners.
3 – shanghai , c h ina
new distribution processes drive merchandise management efficiency

Notes AdditioNAlFiscAl YeArGroup proFileto our shAreholders

With 114 new stores worldwide, including 80 new locations and 34 takeovers,
HUGO BOSS further expanded its shopping network in 2011. In November the
Group opened another directly operated store in Shenyang, the cultural and
commercial capital of north-eastern China. Featuring a fresh store concept, the
venue presents the BOSS Black and BOSS Selection collections on 390 square
meters of sales space. The design and look of the Company’s own stores
is globally consistent, establishing them as the windows to the world of
HUGO BOSS brands.
4 – shenyang, c h ina
Brand showcase – own retail

Notes AdditioNAlFiscAl YeArGroup proFileto our shAreholders


HUGO BOSS is increasingly connecting with new target groups via social
networking sites. One highlight of 2011 was the prize draw – hosted on the
social network Foursquare – for an exclusive shopping experience with the
actress and style icon Chloë Sevigny. The winner, a young Frenchwoman, was
invited to New York for the event. Reports from the HUGO BOSS store in the
Meatpacking District were then posted live on Twitter. HUGO BOSS reached
over 400,000 fans and potential consumers on these online platforms with this
social media campaign.
5 – ne w yor k , usa
VIP shoPPIng exPerIence
notes addItIonalFIscal yeargrouP ProFIleto our shareholders

HUGO BOSS launches seasonal advertising campaigns to boost the profile
and image of its brands. Their scope is not confined to the international print
media. The visuals also feature in outdoor advertising around the world – as
exemplified here at the Arc de Triomphe in Paris.
6 – pAr is, Fr AN ce
well positioNed – seAsoNAl iMAGe cAMpAiGNs

Notes AdditioNAlFiscAl YeArGroup proFileto our shAreholders

One hundred life-sized casts of the human body distributed over an area of
almost 150 square kilometers – Horizon Field, a unique project in the mountains
of the Vorarlberg region, is Austria‘s largest ever landscape installation. The
solid cast iron figures are spectacularly integrated into the countryside, offering
hikers and skiers fascinating views. HUGO BOSS is the lead sponsor of Antony
Gormley‘s spectacular installation, underscoring the close relationship between
art and fashion.
7 – Arlbe rG, Austr i A
FAsciNAtiNG outlook – horizoN Field

Notes AdditioNAlFiscAl YeArGroup proFileto our shAreholders

With its competition “Dress Me for the Finale”, HUGO BOSS celebrated the
30th anniversary of its partnership with Mclaren in 2011. Using an online
configurator, entrants from different countries were asked to design the race
overalls to be worn by lewis Hamilton and Jenson Button during Qualifying
for their home Grand Prix. The competition was flanked by an array of retail
promotions. The fitting climax came at the finale of the Formula One season,
the Brazilian Grand Prix, with two designs being selected from the national
winners and worn by the drivers during the actual race. The two winners were
invited to São Paulo, where they watched the action from the trackside.
8 – sÃo pAulo, br A z il
dress Me For the FiNAle – 30-YeAr pArtNership betweeN huGo boss ANd MclAreN Mercedes

Notes AdditioNAlFiscAl YeArGroup proFileto our shAreholders

In December 2011 the HUGO BOSS yacht entered the international
Sydney Hobart race, one of the world‘s most challenging offshore
yachting events. The course ran from the port of Sydney along the
Australian coastline to Hobart in Tasmania – where the boat crossed
the finishing line in fifth position. The sponsorship activities in the
field of yachting offer HUGO BOSS a further platform for presenting
its core brand BOSS Black. With his spectacular “keel walk” trick
off the Isle of Wight, England, skipper Alex Thomson modeled a
BOSS Black suit while standing on the keel of his yacht.
9 – sYdNeY, Austr Al iA
Alex thoMsoN sets sAil iN the huGo boss YAcht

Notes AdditioNAlFiscAl YeArGroup proFileto our shAreholders

WWW.HUGOBOSS.COM

01To our ShareholderS
To our ShareholderS NoTeS addiTioNalFiScal YearGroup proFile


029
h u G o b o s s Annual Report 2011Contents
030 Letter to Shareholders032 Managing Board034 Supervisory Board036 Report of the Supervisory Board041 Corporate Governance Report048 HUGO BOSS – Key Share Data049 HUGO BOSS On the Capital Market
CONTENTS01 to our shAreholders
Notes AdditioNAlFiscAl YeArGroup proFile

030
h u G o b o s s Annual Report 2011 to our shAreholders
Letter to Shareholders
letter to shAreholders
Dear Shareholders, Dear Readers,
Almost exactly 12 months ago, I held out the prospect of another record year to you in this publi-cation. Not only have we now attained this target, but our performance has actually surpassed our original expectations. Despite 2010 already proving a very good year, HUGO BOSS AG posted overall sales growth of 19% in 2011. Our regions, brands and directly operated stores all made key contributions with double-digit gains. At the same time, we also significantly increased the revenues generated with our retail partners.
This success testifies eloquently to the global appeal of our brands. In times of economic uncer-tainty, cunsumers are more likely to opt for brands that they trust. With our signature high quality and strong brand images we deliver on our pledge to provide value, day after day. This dependability has helped us win over both retail partners and end consumers alike, securing us a key competitive advantage.
The excellent performance not only enabled us to raise our targets for 2011 during the course of the year. It also effectively endorsed our decision to amend the Company’s medium-term outlook upwards. With the financial year just ended, we have taken a significant step towards generating sales of EUR 3 billion by 2015. In this context, 2011 also marked an important milestone in the history of HUGO BOSS, being the first year that we reported more than EUR 2 billion in sales.
Once again, the consistent implementation of our multi-pronged growth strategy proved our main focus during the past months. The company’s evolution into a professional retail organization merits particular recognition. Thanks to this strategic approach, we are already incorporating the experi-ences we have gained with end consumers at our own stores into our planning for future collec-tions. This enables us to respond to market developments swiftly and effectively, and tailor our products more closely to our target groups. Our retail partners, with whose help we will continue to showcase the HUGO BOSS brand world globally, also appreciate this growing expertise. Our new collection cycles have also prompted very positive feedback. With four collections of almost equal status, new themes every month and ongoing deliveries, we can guarantee a retail presentation that is always varied and exciting. The resulting increase in end consumer frequency serves to intensify brand bonding and loyalty.
Besides opening additional directly operated BOSS stores, we have substantially expanded our network through strategic acquisitions of attractive sales space from retail partners. This has enabled us to broaden our market presence, most notably in the Asia region. Not least, our performance in North America proved very successful with both sales channels posting exceedingly strong growth.
Given their distinctive individual profiles and coherent international presentation, our five brands enjoy an excellent standing in their respective segments. Again this year we harnessed the fashion world’s leading events as platforms for communicating the different collection statements. The response from the trade press has been outstanding, particularly to the BOSS Selection presenta-tion at the Pitti Uomo and our HUGO show at the Berlin Fashion Week.

031
Letter to Shareholders H U G O B O S S Annual Report 2011
By redefining the BOSS Selection brand image, we have successfully enhanced its positioning in the luxury segment, which will positively impact the perception of all our brands. BOSS Selection’s thoroughly promising performance in 2011 underscores this achievement.
Another top priority has been to secure our organizational performance for the long term. The decision to build a modern flat packed goods warehouse close to our Metzingen headquarters will guarantee efficient logistics, even if capacities increase – enabling our products to reach end consumers and retail partners around the world more dependably and more quickly.
The achievements of 2011 have reaffirmed our faith in the decisions we have made. This success is more than a well-earned reward for last year’s work. It also gives us the motivation to write yet another chapter in the success story that is HUGO BOSS. I look forward to 2012 with great confi-dence and feel certain that we will continue to generate profitable growth. Notwithstanding the progress of recent years, we are still far from tapping the full potential of HUGO BOSS.
The passion of our employees for fashion and our organization will remain a driving force behind HUGO BOSS. I would like to take this opportunity to thank them for their tireless efforts during the past year. My gratitude also goes to our customers, business partners and shareholders. We will be working hand in hand with them to make 2012 yet another successful year for HUGO BOSS.
Sincerely yours,
ClaUS-DietriCH laHrS
CEO and Chairman of the Managing Board
NOteS aDDitiONalFiSCal YearGrOUp prOFile

032
h u G o b o s s Annual Report 2011 to our shAreholders
Managing Board
MANAGiNG boArd
clAus-dietrich lAhrs
Stuttgart, GermanyChairman of the Managing BoardResponsible for Distribution, Retail, Licenses, Communication and Global Replenishment
christoph AuhAGeN
Stuttgart, GermanyResponsible for Brand Management, Creative Management, Sourcing and Manufacturing
MArk lANGer
Stuttgart, GermanyResponsible for Controlling, Investor Relations, Finance, Legal, Human Resources, Logistics, IT and Central ServicesDirector for Labor Relations

033
Managing Board h u G o b o s s Annual Report 2011
(from left to right) Mark Langer, Claus-Dietrich Lahrs, Christoph Auhagen
Notes AdditioNAlFiscAl YeArGroup proFile

034
h u G o b o s s Annual Report 2011 to our shAreholders
Supervisory Board
supervisorY boArd
dr. hellMut Albrecht
Munich, GermanyManagement ConsultantChairman of the Supervisory Board
ANtoNio siMiNA
Metzingen, GermanyTailor/Chairman of the Works CouncilHUGO BOSS AG, Metzingen, GermanyDeputy Chairman of the Supervisory Board Employee representative
Gert bAuer
Reutlingen, GermanyFirst Authorized Representative of the German Metalworkers’ Union (IG Metall), Reutlingen/Tübingen, GermanyEmployee representative
helMut brust
Bad Urach, GermanyDirector Social AffairsHUGO BOSS AG, Metzingen, GermanyEmployee representative
berNd siMbeck
Metzingen, GermanyAdminstrative employeeHUGO BOSS AG,Metzingen, GermanyEmployee representative
siNAN piskiN
Metzingen, GermanyAdminstrative employeeHUGO BOSS AG,Metzingen, GermanyEmployee representative
dr. MArtiN weckwerth
Frankfurt/Main, GermanyPartnerPermira Beteiligungsberatung GmbH, Frankfurt/Main, Germany
MoNikA lersMAcher
Kornwestheim, GermanySecretary of the German Metalworkers’ UnionIG Metall Area Headquarters, Baden-Württemberg, Stuttgart, GermanyEmployee representative
dAMoN MArcus buFFiNi
Surrey, Great BritainManaging DirectorPermira Advisers LLP, London, Great Britain

035
Supervisory Board h u G o b o s s Annual Report 2011
lucA MArzotto
Venice, ItalyChief Executive OfficerZignago Holding S.p.A., Fossalta di Portogruaro, Italy
GAetANo MArzotto
Milan, ItalyChairman of the Supervisory BoardGruppo Santa Margherita S.p.A., Fossalta di Portogruaro, Italy
dr. klAus MAier
Stuttgart, GermanyManagement Consultant
Notes AdditioNAlFiscAl YeArGroup proFile

036
h u G o b o s s Annual Report 2011 to our shAreholders
Report of the Supervisory Board
report oF the supervisorY boArd
Ladies and Gentlemen,
Once again, the Supervisory Board continued to take great care in fiscal year 2011 in fulfilling its monitoring and advisory duties as established under the law, the Company’s Articles of Association and its Bylaws.
The Managing Board issued detailed verbal and written reports to the Supervisory Board in a timely manner and in a comprehensive fashion on the intended business policy and other fundamental aspects of corporate planning, in particular financial, investment and human resource planning. On the basis of these reports by the Managing Board, the Supervisory Board supported the work of the Managing Board in an advisory capacity in fiscal year 2011 and monitored its management of the Company. Moreover, the Chairman of the Managing Board and the Chairman of the Supervisory Board held regular discussions on key developments and upcoming decisions. In this context the Supervisory Board was always kept informed with regard to both HUGO BOSS AG and the Group companies. The same applies to the strategic development, business progress – in particular sales and the Company’s position – and the development of the key financial figures, particularly the profitability of the Company and, above all, its equity. Any deviations from forecasts and targets were explained individually to the Supervisory Board and reviewed by means of the documentation presented. The Managing Board and Supervisory Board jointly agreed on the Company’s strategic orientation.
If decisions or measures taken by the Managing Board required authorization on the basis of the law, the Articles of Association or the Bylaws, the proposed resolutions – prepared by the committees in some cases – were discussed, reviewed and resolved by the Supervisory Board at its meetings. If necessary, authorizations were issued only after asking for clarification from the Managing Board and extensively discussing the matter with the members of the Managing Board. In urgent cases, the Supervisory Board passed resolutions under the circulation procedure. The Supervisory Board was directly involved at an early stage in all decisions of fundamental significance for the Company. Furthermore, the economic situation as described in the Managing Board’s reports as well as the development prospects of the Group were always discussed carefully in the Supervisory Board.
MAiN topics oF the supervisorY boArd MeetiNGs iN 2011In fiscal year 2011, a total of four Supervisory Board meetings were held in the months of March, May, October and December. The meeting in October was a two-day meeting. The Supervisory Board was complete in most of the meetings. No member of the Supervisory Board attended less than half of its meetings held in fiscal year 2011.
The Supervisory Board meeting in March 2011 focused on the annual financial statements of HUGO BOSS AG and of the HUGO BOSS Group as of December 31, 2010, the audit report prepared by the auditors, and the audit of the dependent company report. At this meeting, the annual financial statements of HUGO BOSS AG as of December 31, 2010 were approved and adopted and the consolidated financial statements of the HUGO BOSS Group were also approved. In addition, the

037
Report of the Supervisory Board H U G O B O S S Annual Report 2011
Supervisory Board’s report to the Annual Shareholders’ Meeting was discussed and adopted, as were – after reviewing the independence of the auditor for the fiscal year 2011 – the proposals for the adoption of resolutions at the Annual Shareholders’ Meeting of HUGO BOSS AG on May 10, 2011. The two-day meeting of the Supervisory Board in October 2011 was used for in-depth discussion of the organization of the Managing Board, the focal points of the Supervisory Board’s activities for 2012, various investment projects, a number of retail projects and employee training and development. At the Supervisory Board meeting in December 2011, the review of the efficiency of the Supervisory Board was conducted, the declaration of compliance with the German Corporate Governance Code for 2011 was discussed and approved, the reports by the committees of the Supervisory Board were discussed in detail, and both the budget and the internal audit planning for 2012 were discussed and resolved.
The sales and earnings developments, investment planning, individual investment projects and the Company’s current risk situation were discussed regularly at the Supervisory Board meetings and approved where necessary. The Supervisory Board also dealt in particular with the further inter-nationalization of business, i.e. the expansion of own retail activities, as well as upcoming invest-ments, compliance issues and the Corporate Governance Code.
COMMITTEES OF THE SUPERVISORY BOARD AND THEIR WORK IN 2011In order to perform its duties efficiently, the Supervisory Board has created a total of five commit-tees: an Audit Committee, a Working Committee, a Personnel Committee, a Nomination Committee and a Mediation Committee as required by law. The Supervisory Board’s decision-making power is transferred to committees where legally permissible. The committees comprehensively addressed the respective topics assigned to them and the chairs of the respective committees always reported in detail to the Supervisory Board on the committee meetings and their results.
The Audit Committee met six times in fiscal year 2011. The main subjects of its meetings were the Company and Group accounting for the annual, half-year and quarterly financial statements and reports, the audit of the annual financial statements and the consolidated financial statements, the risk monitoring system and risk management, the internal control systems, and compliance issues. In this context, the Supervisory Board and the Managing Board mandated a consulting firm to review the effectiveness of the Internal Control System (ICS). The Audit Committee oversaw and monitored this project and reported regularly to the Supervisory Board on its findings. It was concluded that the ICS is effective and efficacious. The Personnel Committee held three meetings, in which it focused on target agreements for the Managing Board, target achievement and the remuneration of the Managing Board, particularly the variable remuneration system. The Working Committee held three meetings in the year under review, in which it dealt with various invest-ments and divestments, the strategy, including in particular preparation for the strategy meeting of the Supervisory Board, the development of the Supervisory Board members, and preparation of the Supervisory Board meetings and resolutions. The Nomination Committee and the Mediation Committee pursuant to Section 27 Paragraph 3 of the German Co-Determination Act (MitbestG) did not need to convene in the past fiscal year.
NOTES ADDITIONAlFISCAl YEARGROUP PROFIlE

038
h u G o b o s s Annual Report 2011 to our shAreholders
Report of the Supervisory Board
corporAte GoverNANceThe Supervisory Board discussed the further development of corporate governance regulations at the Company in the past fiscal year, too, although no changes to the German Corporate Gover-nance Code (GCGC) needed to be taken into account. In December 2011, the Managing Board and Supervisory Board issued a new declaration of compliance pursuant to Section 161 Paragraph 1 Sentence 1 of the German Stock Corporation Act (AktG) on adherence to the recommendations of the Corporate Governance Code at HUGO BOSS AG. The joint report on corporate governance at the Company pursuant to Section 3.10 of the German Corporate Governance Code can be found on page 41. As in the previous years, a review of the efficiency of the Supervisory Board’s activities – as recommended by the Corporate Governance Code – was conducted by means of a standardized, comprehensive questionnaire. The results were discussed in detail and analyzed at the Supervisory Board meeting on December 12, 2011, and the Supervisory Board arrived at a positive conclusion.
Conflicts of interest relating to Managing Board or Supervisory Board members, which are to be immediately disclosed to the Supervisory Board and about which the Annual Shareholders’ Meeting must be informed in accordance with the Corporate Governance Code, did not occur in fiscal year 2011.
Audit oF the ANNuAl FiNANciAl stAteMeNts ANd the coNsolidAted FiNANciAl stAteMeNtsKPMG AG Wirtschaftsprüfungsgesellschaft, Stuttgart, reviewed the annual financial statements of HUGO BOSS AG and the management report for fiscal year 2011 along with the consolidated financial statements and the Group management report for fiscal year 2011 prepared by the Managing Board including the accounting records. The corresponding audit engagement had been awarded by the Audit Committee of the Supervisory Board in accordance with the resolution of the Annual Share-holders’ Meeting held on May 10, 2011. This included an agreement by the auditor to inform the Chairman of the Audit Committee immediately during the audit of any grounds for disqualification or partiality that could not be immediately rectified. There was also an agreement with the auditor to immediately report all findings and incidents of which they become aware during the course of the audit that are of significance to the duties of the Supervisory Board. The auditor also had to inform the Supervisory Board or make a note in the audit report if any facts were ascertained during the audit that would result in the declaration submitted by the Managing Board and the Supervisory Board in accordance with Section 161 Paragraph 1 Sentence 1 of the Stock Corporation Act (AktG) not being correct. There was, however, no cause for any such report by the auditor. In addition, the Supervisory Board obtained the auditor’s declaration of independence pursuant to Section 7.2.1 of the German Corporate Governance Code and assured itself of the auditor’s independence. Commis-sioning non-audit related services to the auditor was also discussed.

039
Report of the Supervisory Board H U G O B O S S Annual Report 2011
The consolidated financial statements of HUGO BOSS AG were prepared pursuant to Section 315a of the German Commercial Code (HGB) on the basis of the International Financial Reporting Standards (IFRS) as applicable in the European Union. The external auditor issued an unqualified audit opinion for both the annual financial statements including the management report as well as the consolidated financial statements including the Group management report.
The report on relations with affiliated companies prepared by the Managing Board was also reviewed by the auditors. The auditors issued the following audit opinion on this report:
“Based on our audit performed in accordance with our professional duties, we confirm that 1. the information in the report is correct, and 2. with respect to the legal transactions cited therein, the Company’s contribution was not inappropriately high.”
The Supervisory Board had at its disposal the audit records and the Managing Board proposal for the appropriation of profits as well as the two audit reports from the external auditors, including the report on relations with affiliated companies pursuant to Section 312 of the German Stock Corporation Act (AktG) and the auditor’s audit of the dependent company report. These documents were initially discussed and reviewed in detail by the Audit Committee and then by the entire Supervisory Board in the presence of the external auditors, who reported on their audit findings. The auditors reported on their main audit findings and commented in detail on the net assets, financial position and earnings situation of the Company and the Group. The auditors further reported that there were no substantial weaknesses in the internal control system and risk management system in respect of the accounting process. They also reported that no occasion had arisen to cause concern about any bias on their part and reported on services that they provided in addition to their audit work. The questions posed by the Supervisory Board and its committees at such time were answered, and the financial statement documents were examined in detail with the auditors and discussed and reviewed by the Supervisory Board and its committees. The audit reports were discussed with the auditors and the related questions were answered by the auditors. The auditors’ findings were subsequently approved. After a final review, the Supervisory Board raised no objections.
At its financial review meeting on March 13, 2012, the Supervisory Board therefore approved the annual financial statements, the consolidated financial statements, and the corresponding management reports for fiscal year 2011 as prepared by the Managing Board. The annual financial statements of HUGO BOSS AG for fiscal year 2011 are thus deemed approved in accordance with Section 172 of the Stock Corporation Act (AktG).
The report on relations with affiliated companies reviewed by the Audit Committee and the Supervisory Board, and the audit report prepared by the auditors on this report were approved by the Supervisory Board. After a final review, no objections were raised to the Managing Board’s statement at the end of the report on relations with affiliated companies.
NOteS AdditiONAlFiScAl YeArGrOUp prOFile

040
H U G O B O S S Annual Report 2011 tO OUr SHAreHOlderS
Report of the Supervisory Board
Finally, in its meeting on March 13, 2012 the Supervisory Board approved the proposal of the Managing Board for the appropriation of profits. In this context the Supervisory Board held intensive discussions on the liquidity situation of the Company, the financing of planned investments and the impact on the capital market. In the course of the discussions, the Supervisory Board came to the conclusion that the proposal was in the best interests of both the Company and its shareholders.
The Supervisory Board would like to thank all employees for their high level of personal commitment and the work they performed, without which HUGO BOSS AG’s success in fiscal year 2011 would not have been possible.
Metzingen, March 13, 2012The Supervisory Board
dr. HellmUt AlBrecHt
Chairman of the Supervisory Board

041
Corporate Governance Report h u G o b o s s Annual Report 2011
corporAte GoverNANce reportpursuant to Section 3.10 of the German Corporate Governance Code
HUGO BOSS has always been convinced that good and transparent corporate governance in compli-ance with national and international standards is a significant factor contributing to the Company’s long-term success. Corporate governance is accordingly part of the Group’s identity and comprises all areas of the Company and the Group. The Managing Board and Supervisory Board consider it their obligation to ensure the ongoing existence of the Company and the creation of sustained value added through responsible long-term corporate governance. HUGO BOSS wants to justify the confidence of investors, financial markets, business partners, employees and the public on a lasting basis and continues to develop corporate governance within the Group.
In the fiscal year 2011, the Managing Board and Supervisory Board discussed in detail fulfilling the requirements of the German Corporate Governance Code (GCGC). As a result, the Declaration of Compliance was submitted in December 2011. It is included at the end of this report and published on the HUGO BOSS AG website, as are previous Declarations of Compliance. HUGO BOSS complies with all of the Code’s recommendations with few exceptions. The Code was last amended by the Government Commission on the German Corporate Governance Code on May 26, 2010 and announced on July 2, 2010. Details on this can be found in the following report by the Managing Board and Supervisory Board.
cooperAtioN, coMpositioN ANd Activities oF the MANAGiNG boArd ANd supervisorY boArdIn the interests of the Company, the Managing and Supervisory Boards work closely together. Both share the goal of increasing enterprise value in a sustainable way. To this end, the Managing Board reports regularly, comprehensively, and promptly to the Supervisory Board on all issues of significance to the budget, business performance, risk exposure, and risk management as well as on topics involving compliance. Any deviations from targets and the budget are discussed with the Supervisory Board and its committees, and the strategic orientation and development of the Group is coordinated and discussed with the Supervisory Board.
HUGO BOSS has long applied the requirement for the members of its Supervisory Board to be independent, as is stressed in the German Corporate Governance Code. The members of the Super-visory Board of HUGO BOSS possess the requisite knowledge, skills and professional experience for the respective committees. None of the current Supervisory Board members has previously occupied a management position within the Company. Likewise, no consulting agreements or other contracts for work and services were entered into between Supervisory Board members and the Company in the year under review.
Furthermore, in accordance with the recommendation of the German Corporate Governance Code the Supervisory Board has established specific targets for its composition and for the composition of the Managing Board, which it already set out in detail in last year’s Corporate Governance Report. These targets have not changed.
The German Corporate Governance Code also stipulates that the Managing Board must give consid-eration to diversity in filling management positions in the Company and in particular must strive to achieve suitable representation of women. The Managing Board is committed to this goal. It has already taken care to ensure diversity among the employees and suitable representation of women to date and will continue to do so in future.
Notes AdditioNAlFiscAl YeArGroup proFile

042
h u G o b o s s Annual Report 2011 to our shAreholders
Corporate Governance Report
The members of the Managing and Supervisory Boards may not pursue any personal interests or grant any unfair advantages to other persons in connection with their activities or when making decisions. In the fiscal year 2011 there were no conflicts of interest of Managing or Supervisory Board members. The persons holding seats on the Managing and Supervisory Boards are listed in the notes under “Supervisory Board and Managing Board”. The positions held by Managing and Supervisory Board members in supervisory boards required by law or comparable domestic or foreign monitoring bodies at commercial enterprises may be found on page 246. No member of the Managing Board takes up more than three supervisory board positions at non-Group listed companies. The relationships with related parties (companies and individuals) are listed in the notes to the consolidated financial statements on page 222.
risk MANAGeMeNt ANd risk coNtrolResponsible handling of risks by the Company is a key element of good corporate governance. The value-based Group management involves a systematic risk management process that allows the Company to identify and measure risks at an early stage and to optimize risk exposure using appropriate measures. One key responsibility is to provide for appropriate risk management and risk control in the Company. The Audit Committee set up by the Supervisory Board is regularly involved in monitoring the effectiveness of internal control, risk management and auditing systems, including with the involvement of the auditors. The systems are continuously developed and adjusted to changing overall conditions. However, by their nature they cannot provide absolute protection against losses from business transactions or even fraudulent activities.
Details on the topic of the internal control, risk management and auditing system can be found in the Risk Report on pages 133 et seq.
AccouNtiNG ANd AuditiNGSince fiscal year 2001, HUGO BOSS AG has been reporting in accordance with the International Financial Reporting Standards (IFRS). The Audit Committee set up by the Supervisory Board is regularly involved in monitoring the accounting process and the audit. With respect to the year under review, the auditor, KPMG AG Wirtschaftsprüfungsgesellschaft, Stuttgart, agreed to inform the Chairman of the Audit Committee immediately during the audit of any grounds for disqualifica-tion or partiality that are not immediately rectified. The auditor was also required to immediately report all findings and incidents of which they become aware during the course of the audit that are of significance to the duties of the Supervisory Board. Moreover, it was agreed that the auditor must inform the Supervisory Board or make a note in the audit report if any facts are ascertained during the audit that do not correspond with the Declaration of Compliance submitted by the Managing Board and the Supervisory Board in accordance with Section 161 of the German Stock Corpo-ration Act (AktG). The Supervisory Board also obtained a declaration of independence from the auditor pursuant to Section 7.2.1 of the German Corporate Governance Code and satisfied itself of the auditor’s independence, with the declaration also relating to commissioning non-audit related services to the auditor.

043
Corporate Governance Report h u G o b o s s Annual Report 2011
corporAte coMpliANceHUGO BOSS AG and the Group companies operate in many different countries and regions and therefore in different legal systems. Corporate compliance, meaning measures to which HUGO BOSS has committed itself to ensure adherence to legal and official regulations, the Company’s internal guidelines as well as codes, and their observance by Group companies, is seen as a major respon-sibility of the Managing Board at HUGO BOSS. This includes – amongst others – antitrust and corruption regulations as well as provisions under capital markets law.
To support the Managing Board in introducing and monitoring an effective compliance management system, a Compliance department was established in 2010 which is responsible for Group-wide coordination of corporate compliance.
HUGO BOSS AG expects all employees to act in a legally unobjectionable way in day-to-day business operations. To facilitate this and to form a relevant basis, in 2010 HUGO BOSS compiled the Group-wide integrity principles in a Code of Conduct and in guidelines which were implemented gradually throughout the Group over the course of 2011. The Code of Conduct and the guidelines focus in particular on regulations on competitive conduct, on avoiding corruption and conflicts of interest, on dealing correctly with Company information and on ensuring fair and respectful working condi-tions. The employees are familiarized with the relevant regulations on an ongoing basis in training sessions.
For support and advice on questions regarding legally correct behavior, employees can turn to their superiors or the Compliance Officer.
cApitAl MArket coMMuNicAtioNIn order to ensure the highest possible degree of transparency and thus to reinforce the trust placed in the Group by shareholders and investors as well as the interested public, the Company reports regularly and promptly on the situation of the Company and any major operational changes. The investor relations activities involve a regular exchange with institutional investors and financial analysts. In addition to the yearly analyst conference on the annual financial statements, telephone conferences are held for financial analysts upon publication of the interim reports on the first and third quarters as well as the half-year results. In addition, an Investor Day was held in 2011 to provide in-depth information on the Group strategy and the medium-term growth plans. The presentations prepared for these events or for investor conferences may be viewed on the Internet at www.group.hugoboss.com.
Notes AdditioNAlFiscAl YeArGroup proFile

044
h u G o b o s s Annual Report 2011 to our shAreholders
Corporate Governance Report
For private shareholders, the Annual Shareholders’ Meeting is the most important investor relations event of the year. The Annual Shareholders’ Meeting serves to provide all shareholders with current and comprehensive information in an efficient manner. If shareholders are not able to attend the Annual Shareholders’ Meeting in person, they have the opportunity to follow the transmission of the speech of the Chairman of the Managing Board on the Internet. They may either cast their vote themselves at the meeting or by proxy via an authorized person of their choice or a representative of the Company acting as per their instructions.
All key information and publications can be viewed on the Company website at www.group.hugoboss.com. The site includes a financial calendar, which shows the most important dates, is updated on an ongoing basis and is a fixed component of the annual report and the interim reports. All press releases and ad-hoc announcements as well as information on current developments are also published on the website. Ad-hoc announcements pursuant to Section 15 of the German Securities Trading Act (WpHG) that directly relate to the Company are published immediately by HUGO BOSS in accordance with the statutory provisions and can be viewed in “News and Releases” under the “Investor Relations” heading on the Company’s website. The same is possible for voting rights notifications. In line with the principle of fair disclosure, it is hence ensured that all shareholders and major target groups are treated equally and that new information is provided to all shareholders and the interested public at the same time. Lastly, those who are interested can find information on new developments in the Group in an electronic newsletter.
disclosure oF securities trANsActioNsPursuant to Section 15a of the Securities Trading Act (WpHG), members of the Managing and Supervisory Boards as well as employees with management responsibilities as defined in the Securities Trading Act (WpHG) are required to disclose the purchase or sale of HUGO BOSS AG securities – called directors’ dealings. Directors’ dealings are published on the Company website under “Directors’ Dealings”.
During the reporting period from January 1 to December 31, 2011, two securities transactions were reported to the Company pursuant to Section 15a of the Securities Trading Act (WpHG).
On November 15, 2011 in Frankfurt/Main, Dr. Hellmut Albrecht, Chairman of the Supervisory Board, purchased 750 preferred shares (ISIN number DE0005245534) of HUGO BOSS AG, Dieselstraße 12, 72555 Metzingen at a price of EUR 67.55 per share, corresponding to a total price of EUR 50,668.27.
Furthermore, on December 15, 2011 in Frankfurt/Main, Dr. Hellmut Albrecht purchased 895 preferred shares (ISIN number DE0005245534) of HUGO BOSS AG, Dieselstraße 12, 72555 Metzingen at a price of EUR 55.79 per share, corresponding to a total price of EUR 49,933.66.
Dr. Hellmut Albrecht is the Chairman of the Supervisory Board of HUGO BOSS AG.

045
Corporate Governance Report h u G o b o s s Annual Report 2011
shAreholdiNGs oF the MANAGiNG boArd ANd supervisorY boArdAs of December 31, 2011, the total holding in HUGO BOSS AG shares by all Managing and Super-visory Board members amounted to less than 1% of the shares issued by the Company. Thus as of this date, there were no shareholdings subject to the reporting requirements of Section 6.6 of the German Corporate Governance Code.
coMpeNsAtioN oF the MANAGiNG boArd ANd supervisorY boArdThe total fixed salary components for members of the Managing Board in the fiscal year 2011 amounted to EUR 2,873 thousand (2010: EUR 3,248 thousand). The fixed salary components paid to members of the Managing Board comprise, besides the salary, benefits such as company cars and other benefits in kind forming part of the salary, as well as other equipment and services necessary for Managing Board members to fulfill their duties.
The variable compensation components with a long-term incentive effect consist of a multi-year bonus granted in line with the achievement of personal targets agreed with the Supervisory Board and the fulfillment of the pre-defined key figures EBITDA before special items and trade net working capital. The bonus for one year is based predominantly on target achievement measured over a period of three years. After the end of the third fiscal year, the bonus is calculated conclusively and paid out. For a transition period during the introduction of the multi-year bonus agreements, the Managing Board members receive advance payments of the expected bonus. If the amount of the outstanding payment is negative, this must be repaid to HUGO BOSS AG by the Managing Board member. Additions to the provision for the multi-year bonus are made proportionally. As of December 31, 2011, there was a provision totaling EUR 4,050 thousand (2010: EUR 3,025 thousand).
Managing Board members holding office as of the reporting date are not eligible to participate in the “Stock Appreciation Rights Program”. For the event of early termination, the employment contracts include regulations which – except for the deviation stated in the Declaration of Compliance from December 2011 – comply with the requirements of the German Corporate Governance Code. For the event of regular termination, the employment contracts do not include any regulations other than pension regulations. No compensation was paid out to Managing Board members leaving the Company in fiscal year 2011 (2010: EUR 2,934 thousand).
In addition, the Company has provided pension benefits for Managing Board members. The amount of future pension benefits is based on each member’s base salary and years of service. Additions to pension provisions for Managing Board members (excluding deferred compensation) amounted to EUR 1,209 thousand in fiscal year 2011 (2010: EUR 1,964 thousand).
According to the German Corporate Governance Code, the compensation of Supervisory Board members is divided into a fixed and a variable component. The variable component is determined on the basis of earnings per share in the consolidated financial statements. The position of the chairman of the Supervisory Board and his deputy are taken into account when determining the level of compensation. The Supervisory Board received total compensation of EUR 1,534 thousand for its services in 2010. For fiscal year 2011, total compensation is expected to be EUR 1,911 thousand, including a provision for the variable component of EUR 1,156 thousand (2010: EUR 738 thousand) .
Notes AdditioNAlFiscAl YeArGroup proFile

046
h u G o b o s s Annual Report 2011 to our shAreholders
Corporate Governance Report
declArAtioN oF coMpliANcePursuant to Section 161 Paragraph 1 Sentence 1 of the German Stock Corporation Act (AktG), the Managing Board and Supervisory Board of HUGO BOSS AG must submit an annual Declaration of Compliance stating whether the recommendations published by the Government Commission on the German Corporate Governance Code in the official section of the electronic Federal Gazette have been and are being complied with. The Declaration must also state which recommendations were not or are not complied with and the reasons for this. The latest amendments to the German Corporate Governance Code in the version dated May 26, 2010 were published in the electronic Federal Gazette on July 2, 2010. The Managing Board and Supervisory Board accordingly submitted the following Declaration of Compliance in December 2011:
“Declaration of Compliance
declaration of the Managing board and supervisory board of huGo boss AG pursuant to section 161 of the German stock corporation Act (AktG)
HUGO BOSS AG, Metzingen, Securities ID Nos. 524 550, 524 553
The Managing Board and Supervisory Board of HUGO BOSS AG herewith declare pursuant to Section 161 Paragraph 1 Sentence 1 of the German Stock Corporation Act (AktG) that since the Compliance Declaration of December 2010 the recommendations of the Government Commis-sion on the German Corporate Governance Code initially as amended on June 18, 2009 – officially published in the electronic Federal Gazette on August 5, 2009 – and since its effectiveness in the version as amended on May 26, 2010 – officially published in the electronic Federal Gazette on July 2, 2010 – have been and are complied with except for:
· Section 2.1.2 Sentence 1 of the German Corporate Governance Code (GCGC): In addition to ordinary shares with voting rights at HUGO BOSS AG there are also preference shares without voting rights. This division has historic reasons.
· Deviating from the recommendation in Section 3.8 Sentence 5 GCGC, the D&O (Directors & Officers) insurance for members of the Supervisory Board does not contain a deductible. HUGO BOSS AG covers the D&O risk via an appropriate pecuniary loss liability insurance in which members of the Supervisory Board are also included. The members of the Supervisory Board hold their offices responsibly and in the interest of the Company. HUGO BOSS AG is of the opinion that a deductible is not an appropriate means for further improving the sense of responsibility. Furthermore, the introduction of a deductible would not lead to a significant reduction of premium payments.
· Deviating from the recommendation in Section 4.2.3 Paragraph 4 Sentence 2 GCGC, the calcula-tion of the severance pay cap is based on the total compensation for the past full fiscal year or, if the member of the Managing Board has already served on the board for two full fiscal years, on the average of the past two full fiscal years because the Supervisory Board is of the opinion that this constitutes a broader and therefore better basis for assessment.

047
Corporate Governance Report h u G o b o s s Annual Report 2011
· Deviating from Section 5.4.6 Paragraph 3 GCGC, the compensation of the members of the Super-visory Board is not reported individually in the Corporate Governance Report. Also, payments made by the enterprise to the members of the Supervisory Board or advantages extended for services provided individually, in particular, advisory or agency services, are not listed on an indi-vidual basis in the Corporate Governance Report. The compensation paid to the members of the Supervisory Board is presented in total in the notes. In the view of HUGO BOSS AG, individual reporting of compensation in the Corporate Governance Report does not provide information relevant to the capital market.
Metzingen, December 2011”
Notes AdditioNAlFiscAl YeArGroup proFile

048
h u G o b o s s Annual Report 2011 to our shAreholders
HUGO BOSS – Key Share Data
huGo boss – keY shAre dAtA
2011 2010
Number of shares 70,400,000 70,400,000
thereof outstanding shares 69,016,167 69,016,167
thereof own shares 1,383,833 1,383,833
common shares 35,860,000 35,860,000
thereof outstanding shares 35,331,445 35,331,445
thereof own shares 528,555 528,555
preferred shares 34,540,000 34,540,000
thereof outstanding shares 33,684,722 33,684,722
thereof own shares 855,278 855,278
share price in eur 1
Common shares
Last (12/31) 55.19 49.23
High 76.75 49.52
Low 43.00 17.78
Preferred shares
Last (12/31) 56.90 56.50
High 80.00 56.52
Low 47.35 22.38
Market capitalization in eur million (12/31) 3,944 3,710
earnings per share (eur)
Common shares 4.12 2.69
Preferred shares 4.13 2.70
price-earnings ratio 2
Last (12/31) 14 21
dividend per share in eur
Common shares 2.88 3 2.02
Preferred shares 2.89 3 2.03
dividend yield in % 4
Last (12/31) 5.08 3 3.59
Amount distributed in eur million 199 3 140
payout ratio in % 5 70 3 75
1 Xetra. 4 Based on preferred shares.
2 Based on closing prices of preferred share. 5 Based on consolidated net profit attributable to shareholders.
3 2011: Dividend proposal.
tYpe oF shAre: No-pAr-vAlue shAres
security id Number (wkN)
international securities identification Number (isiN)
Common shares 524550 DE 000 524 55 00
Preferred shares 524553 DE 000 524 55 34
HUGO BOSS shares are traded on the following stock exchanges: Xetra, Frankfurt/Main, Stuttgart, Duesseldorf, Hamburg, Munich,
Hanover (preferred shares only), Berlin-Bremen (preferred shares only)

049
HUGO BOSS on the Capital Market h u G o b o s s Annual Report 2011
huGo boss oN the cApitAl MArket
Following share price increases in the first six months, the second half of the past fiscal year was characterized by declines and high volatility on the equity markets. huGo boss shares displayed relative strength over the course of the year and performed considerably better than the overall market.
01 — share price performance (Index: December 2006 = 100)
220
200
180
160
140
120
100
80
60
40
20
Dec. 31, 2006 Dec. 31, 2007 Dec. 31, 2008 Dec. 31, 2009 Dec. 31, 2010 Dec. 31, 2011
Preferred share Common share MDAX
Driven by brightening economic indicators in the U.S. and lively M&A activity, the equity markets started the trading year 2011 with slight gains. The severe earthquake in Japan and the growing unrest in the Middle East and North Africa in March temporarily interrupted this development with substantial price corrections. The intensifying debt crisis in the euro zone and the U.S. and the associated fears regarding economic development finally led to considerable losses together with high volatility in the third quarter of 2011. The second bailout package for Greece, the purchases of Spanish and Italian government bonds by the European Central Bank (ECB) and the announcement by the U.S. central bank that it would keep the key interest rate near zero for another two years stabilized the markets for a short time only. Only in the fourth quarter of 2011 did the equity markets recover again slightly. This development was supported by factors including cuts in the key interest rate by the ECB and robust economic data from the U.S. and Germany.
trading year 2011 dominated by debt crisis and economic concerns
Notes AdditioNAlFiscAl YeArGroup proFile

050
h u G o b o s s Annual Report 2011 to our shAreholders
HUGO BOSS on the Capital Market
Following a sharp rise in the share price at the end of 2010, the prices of huGo boss coMMoN ANd
preFerred shAres fell slightly in early 2011. Over the remaining course of the first half of 2011, the positive response to publications of results led to significant increases. However, the share price dropped sharply in line with the general market trend in early August and declined further at the end of the third quarter. After a slight recovery lasting until mid November, the HUGO BOSS shares then closed the fourth quarter at a somewhat lower level again, negatively affected by concerns regarding the development of the general economy and of the sector, particularly in Europe and Asia.
Overall, the DAX shed 15% in 2011. German second-tier stock was also unable to continue its slightly positive development in the first half of 2011, causing the MDAX to fall by a total of 12% over the course of the year. The shares of companies in the fashion and luxury goods industry also closed 2011 with slight price decreases on average. The MSCI World Textiles, Apparel & Luxury Goods Index, which maps the performance of competitors operating in the area of apparel and luxury goods, posted a decline of 4%. In this difficult market environment, HUGO BOSS shares displayed relative strength. The price of the huGo boss preFerred shAres rose slightly by 1%, closing the year at EUR 56.90. The price of the huGo boss coMMoN shAres rose by 12% as against year-end 2010, closing at EUR 55.19.
Change in % 1 year 3 years 5 years 10 years
HUGO BOSS preferred shares 1 1 295 46 138
HUGO BOSS common shares 1 12 219 35 153
DAX (15) 23 (11) 14
MDAX (12) 59 (5) 106
MSCI World Textiles, Apparel & Luxury Goods (4) 111 32 203
1 Xetra, without consideration of reinvested dividend payments.
In accordance with Section 21 of the Securities Trading Act (WpHG), shareholders are required to report the level of their shareholdings if they exceed or fall below certain thresholds. The thresholds for reporting are 3%, 5%, 10%, 15%, 20%, 25%, 30%, 50% and 75% of the voting rights. The Company did not receive any such announcements in the fiscal year 2011.
Pursuant to Section 15a of the Securities Trading Act (WpHG), members of the Managing and Supervisory Boards as well as employees with management responsibilities as defined in the Securities Trading Act (WpHG) are required to disclose the purchase or sale of HUGO BOSS AG securities – called directors’ dealings. Directors’ dealings are published on the Company website under Directors’ Dealings.
During the reporting period from January 1 to December 31, 2011, two securities transactions were reported to the Company pursuant to Section 15a of the Securities Trading Act (WpHG). — Corporate Governance Report, p. 44
huGo boss shares display relative
strength in difficult environment
No voting rights announcements
received
two directors’ dealings

051
HUGO BOSS on the Capital Market h u G o b o s s Annual Report 2011
The Annual Shareholders’ Meeting on June 21, 2010 authorized the Managing Board of HUGO BOSS AG to continue the share buyback program already in place at that time. In accordance with this, the Managing Board is authorized until June 20, 2015 to purchase bearer common and/or non-voting bearer preferred shares of HUGO BOSS AG up to an overall maximum of 10% of its outstanding capital. No use was made of the authorization granted in the past fiscal year.
HUGO BOSS AG therefore continues to hold 528,555 common treasury shares and 855,278 preferred treasury shares. This corresponds to a share of 1.97% or EUR 1,383,833 of the share capital.
In November 2011, Red & Black Holding GmbH, which is controlled by Permira Holdings Limited, placed 4,500,000 HUGO BOSS AG preferred shares with institutional investors as part of an acceler-ated book-building process. In doing so, Red & Black Holding GmbH committed itself to a six-month lock-up period for the remainder of its shareholding. The placement increased the free float of HUGO BOSS preferred shares to 19.1 million shares, equivalent to around 55% of the preferred shares issued.
Own shares 1.47
Free float 10.51
88.02
10.51
1.47
02/01 — shareholder structure at year-end – huGo boss common shares (in %)
Red & Black Holding GmbH 88.02
20112010
Own shares 2.48
Free float 42.24
42.25
55.27
2.48
02/02 — shareholder structure at year-end – huGo boss preferred shares (in %)
Red & Black Holding GmbH 55.28
20112010
level of treasury shares unchanged
increase in free float of huGo boss preferred shares
Notes AdditioNAlFiscAl YeArGroup proFile

052
h u G o b o s s Annual Report 2011 to our shAreholders
HUGO BOSS on the Capital Market
The shareholder structure of the total share capital of HUGO BOSS AG is made up as follows: 65.56% of the shares are held by Permira Holdings Limited via Red & Black Holding GmbH and 1.97% of the capital is held by HUGO BOSS AG as treasury shares. The remaining 32.47% of the shares are in free float. To allow for the selective targeting of institutional investors in HUGO BOSS, an analysis of the free float shareholder base was performed in 2011. The results show that the shareholder structure has again become more international in the past year. Slightly over half of the shares in free float are held by European investors. More than a tenth of the shares are held by American investors. For close to a third of the free float, the investors are not known. This category also includes the group of private shareholders. The Managing Board and Supervisory Board hold less than 1% of the shares issued by the Company. — Corporate Governance Report, p. 45
Great Britain 20
Germany 24
U.S. 8
29
12
4
18
11
26
03 — regional split of free float investor base at year-end (in %)
Not identified 33
Rest of Europe 11
Rest of the World 420112010
The strong relative share price performance and the rise in free float supported the increase in the weighting of HUGO BOSS preferred shares in the MDAX. At the end of December 2011, the huGo boss preFerred shAre took 20th place in the Deutsche Börse ranking on the basis of free float adjusted market capitalization (end of 2010: 38th place). In terms of its trading volume, it was ranked 26th (end of 2010: 41st). The weighting of the HUGO BOSS preferred shares in the MDAX was thus 1.6% at the end of the year (2010: 1.0%). The average daily trading volume for preferred shares in 2011 was 125,488 (2010: 81,517). The common shares, which are traded much less due to the lower free float, recorded an average trading volume of 10,362 per day (2010: 12,061).
04 — Market capitalization at year-end (in EUR million)
2011
2010
2009
2008
2007
3,944
3,717
1,573
1,118
2,767
europe forms focus of investor base
weighting of huGo boss
preferred shares in MdAx increases

053
HUGO BOSS on the Capital Market h u G o b o s s Annual Report 2011
As in previous years, HUGO BOSS AG and its subsidiaries did not issue any bonds in 2011. At the end of 2011 there were therefore no outstanding corporate bonds of HUGO BOSS AG. The Group also does not have a rating from an external rating agency.
HUGO BOSS pursues a profit-based dividend policy under which the shareholders participate appro-priately in the Group’s earnings development. Between 60% and 80% of net income is to be distrib-uted to the shareholders on a regular basis. On the basis of the significant increase in profit in the past fiscal year and the positive expectations for 2012, the Managing Board and Supervisory Board intend to propose to the Annual Shareholders’ Meeting on May 3, 2012 a dividend of EUR 2.89 per preferred share (2010: EUR 2.03) and EUR 2.88 per common share (2010: EUR 2.02) for fiscal year 2011. The proposal corresponds to a payout ratio of 70% of consolidated net income attributable to the equity holders of the parent company in 2011 (2010: 75%). Provided the shareholders approve the proposal, the dividend will be paid out on the day following the Annual Shareholders’ Meeting, i.e. on May 4, 2012. Based on the number of shares outstanding at the end of the year, the amount distributed will total EUR 199 million (2010: EUR 140 million).
No corporate bonds issued
5.001.45
05/01 — dividend per common share (in EUR)
2011 1)
2010
2009
2008
2007
2.88 1
2.02
0.96
1.37
6.45
Ordinary dividend Special dividend
1 2011: Dividend proposal.
5.001.46
05/02 — dividend per preferred share (in EUR)
2011 1)
2010
2009
2008
2007
2.89 1
2.03
0.97
1.38
6.46
Ordinary dividend Special dividend
1 2011: Dividend proposal.
dividend per share rises substantially
Notes AdditioNAlFiscAl YeArGroup proFile

054
h u G o b o s s Annual Report 2011 to our shAreholders
HUGO BOSS on the Capital Market
For HUGO BOSS, good capital market and corporate communication means communicating current developments within the Company promptly and transparently, thereby strengthening the confi-dence of capital market participants and the public in the Group. In 2011, the Managing Board and the Investor Relations department were therefore in regular dialog with institutional and private investors. The Internet is also a valuable instrument for communicating with institutional investors, private shareholders and the interested public. The Investor Relations website of HUGO BOSS AG provides current financial reports, company presentations, press releases, the financial calendar and contact details for the Investor Relations department, in addition to general information and key figures of the Company — www.group.hugoboss.com / Investor Relations
transparent and open communication as
the goal of investor relations activities

02Group ManaGeMent report
— Group profile —
Group profile Notes AdditioNAlfiscAl YeAr


057
h u G o b o s s Annual Report 2011Contents
CONTENTS02 Group MANAGeMeNt report –
Group proFile
058 Business Activities and Group Structure062 Group Management066 Group Strategy076 Employees082 Innovation and Development085 Sourcing and Production089 Sustainability
Notes AdditioNAlFiscAl YeAr

058
h u G o b o s s Annual Report 2011 Group MANAGeMeNt report – Group proFile
Business Activities and Group Structure
busiNess Activities ANd Group structure
huGo boss strives to strengthen and expand its position as one of the global market leaders in the premium and luxury segment of the global apparel market. the Group, which is based in Metzingen in Germany and employs a workforce of approxi-mately 11,000, generated annual sales of eur 2.1 billion in fiscal year 2011 and is among the world’s most profitable apparel manufacturers.
The HUGO BOSS Group is one of the world market leaders in the premium fashion and luxury segment of the apparel market. The Group focuses on developing and marketing high-end women’s and men’s fashion and accessories. The products are predominantly manufactured by independent suppliers. With its brand world, HUGO BOSS targets different, clearly differentiated consumer groups. The brands cover an extensive product range consisting of classic-modern business wear, elegant evening wear and sportswear, shoes and leather accessories, as well as licensed fragrances, eyewear, watches, children’s fashion, home textiles and motorcycle helmets. — Sourcing and
Production, p. 85
Intensive marketing activities and involvement in sponsorship of sport and cultural events enhance the worldwide recognition of HUGO BOSS and the image of its brands. Alongside traditional forms of advertising such as print and out-of-home, the relevant consumer groups are increasingly targeted through new marketing instruments such as social networks. Sport sponsorship activities focus on premium sports such as sailing, golf and Formula 1 and are an ideal vehicle for conveying brand values such as dynamics, perfection and precision. In its cultural sponsorship activities, the Group stresses the similarities between art and fashion in terms of design, aesthetics and creativity. The Company also sets a course with high profile fashion events in the world’s fashion capitals, further highlighting the appeal and acceptance of the Group’s brands for key target groups and charging the HUGO BOSS brand world with emotion.
HUGO BOSS sells its products in 124 countries worldwide. The most important sales region is Europe, with 61% of Group sales in the fiscal year 2011. America accounts for 22% of sales and Asia for 15%. 2% of Group revenues are generated by royalties. — Group Strategy, p. 73 — Profit Development of the Business Segments, p. 111
Today consumers can purchase HUGO BOSS products at more than 6,300 points of sale. In addition to multi-brand points of sale operated by wholesale partners, the importance of monobrand points of sale is growing significantly. HUGO BOSS stores are operated either by franchise partners or by the Group itself. The number of stores operated via franchisees amounts to approximately 1,000. As a result of pushing forward own retail activities, the number of own retail stores rose by 85 to 622 last year. This brings the total number of monobrand stores in the HUGO BOSS Group to more than 1,600 in over 80 countries. At the same time, online sales are becoming increasingly important. The Group currently operates online stores in the U.S., Germany, the UK, the Netherlands, France and Austria. In total, 45% of sales were generated in the Group’s own retail business in the fiscal year 2011. — Group Strategy, p. 70 — Group Sales and Results of Operations, p. 102
positioning in the premium and luxury
segment of the apparel market
targeted brand communication
Global distribution activities
Growing importance of own retail business

BRAND WORLD
Notes AdditioNAlFiscAl YeAr


ModerN / AutheNtic / luxurious
BOSS Selection represents the exclusive pinnacle of the HUGO BOSS brand world: a unique fusion of exquisite design, the finest materials and consummate workmanship. Offering superb apparel, shoes and accessories, the brand caters to sophisticated men with a taste for fashion and style. The largely handcrafted “Tailored Line” and a customized “Made to Measure” service complete the picture.
AdditioNAlNotesFiscAl YeAr


ModerN / sophisticAted / preMiuM
BOSS Black, the HUGO BOSS core brand, stands for contemporary, modern elegance. The range encompasses women’s and men’s collections offering business apparel, sportswear and glamorous styles for special events. The premium assortment is also supplemented with shoes and accessories as well as licensed watches, eyewear, fragrances, children’s fashions and a home collection.
AdditioNAlNotesFiscAl YeAr


sportive / relAxed / eNerGetic
BOSS Green offers premium sportswear that transcends the boundary between fashionable sports apparel and performance golfwear. Melding fashion and lifestyle trends with golf, the collection presents impactful looks in strong colors for both men and women.
AdditioNAlNotesFiscAl YeAr


cAsuAl / urbAN chic / coNteMporArY
The casualwear brand BOSS Orange sends a fun, easy-going message. Shaped by urban trends, the collections appeal to men and women who cultivate and create their own personal style of dressing. Shoes and accessories perfect the outfits along with watches, eyewear and fragrances that are produced under license.
Notes AdditioNAlFiscAl YeAr


proGressive / AvANt-GArde / coNteMporArY
HUGO, the trend brand from HUGO BOSS, is the home of avant-garde design. The men’s and women’s collections feature clean lines and innovative looks. Shoes and accessories complete the outfits; eyewear and fragrances produced under license add the finishing touches.
Notes AdditioNAlFiscAl YeAr

WWW.HUGOBOSS.COM

059
Business Activities and Group Structure h u G o b o s s Annual Report 2011
The Group is managed by HUGO BOSS AG; based in Metzingen, Germany, as the parent company where all of the central management functions are bundled. As a German stock corporation (Aktien-gesellschaft), HUGO BOSS AG has a dual management and control structure. The Managing Board is responsible for managing the Group, while the Supervisory Board advises the Managing Board and oversees its management of the Company. In addition to HUGO BOSS AG, the Group consists of 53 consolidated subsidiaries, which run local business operations. 32 subsidiaries are organized as distribution companies. With few exceptions, all subsidiaries are fully controlled by HUGO BOSS AG. All subsidiaries are run as independent profit centers and thus bear profit responsibility.
The HUGO BOSS Group has given itself a regionally oriented structure and combined its local business operations into three regional organizations: Europe including the Middle East and Africa, Americas, and the Asia/Pacific region. Responsibility for the central functions is divided between the different Managing Board areas. In particular, the Managing Board holds responsibility for the Group strategy. The management and collection development for all brands are also based at the Group headquarters. Further responsibilities based at the Group headquarters include retail manage-ment, sourcing, logistics and IT, human resources management, financial management including corporate financing, and risk management. Besides internal communication, HUGO BOSS AG is also especially responsible for external communication, including maintaining relations with the capital markets.
Sourcing, production and logisticsFinance and controllingITcommunicationOwn retailBrand and creative managementHuman resourceslegal
europeincl. Middle East and Africa
AMericAs
AsiA/pAciFic
MANAGiNG boArd
06 — huGo boss organizational structure
In the three regional organizations, the Group strategy is implemented in the respective market environment in close coordination with the Managing Board and under the leadership of the relevant regional director. Working together with the country managers within their region, the directors are responsible in particular for the regional design of the wholesale and retail sales strategy and for the development of sales and earnings. The regionalization of the sales structures strengthens the Group’s consumer proximity and improves its ability to react to market developments and to adapt to market-specific features. It also allows for fast exchange of best practices through close integra-tion of the national companies.
legal structure of the Group characterized by dual management and control structure
regionally oriented organizational structure
regional organizations implement Group strategy
Notes AdditioNAlFiscAl YeAr

060
h u G o b o s s Annual Report 2011 Group MANAGeMeNt report – Group proFile
Business Activities and Group Structure
07 — key locations/Global market presence
AMericA~ 1,200 Points of sale 124 Own retail stores 2 Showrooms ~ 100 Franchise stores
HEADQUArTErS AMErIcAS
usA , N e w Yo r k
usA, MidwAY / WA rEHOUSE
usA, clevel ANd / PrODUc TIOn

061
Business Activities and Group Structure h u G o b o s s Annual Report 2011
europe incl. Middle East and Africa
~ 4,700 Points of sale 310 Own retail stores 19 Showrooms ~ 750 Franchise stores
AsiA/pAciFic~ 450 Points of sale 188 Own retail stores 2 Showrooms~ 150 Franchise stores
HE ADQUA rT ErS ASIA / PAcIF Ic
h o N G ko N G
H E A D QUA r T Er S G r O U P A n D EU r O P E, DEVElOPMEnT AnD PATTErn DESIGn, PrODUcTIOn, WArEHOUSE
G e r M A N Y, M e t z i N G e N A N d s u r r o u N d i N G A r e A
turkeY, izMir / PrODUc TIOn
itAlY, MorrovAlle ANd scANdicci / DEVElOPMEnT AnD PrODUcTIOn, PATTErn DESIGn
switzerlANd, coldrerio / DEVElOPMEnT AnD PATTErn DESIGn
pol ANd, r AdoM / PrODUc TIOn
Notes AdditioNAlFiscAl YeAr

062
h u G o b o s s Annual Report 2011 Group MANAGeMeNt report – Group proFile
Group Management
Group MANAGeMeNt
the goal of huGo boss management is to generate a sustainable increase in enterprise value. the Group’s internal management system supports the Managing board and the management of the business units in aligning all Group processes with this goal.
corporAte GoverNANce reportThe corporate governance report (pursuant to Section 289a of the German Commercial Code (HGB)) contains the declaration of compliance, information on Group management practices as well as the description of the functions of the Managing and Supervisory Boards. — www.group.hugoboss.
com / Investor Relations / Corporate Governance
MANAGiNG boArd As A whole respoNsible For Group MANAGeMeNtThe HUGO BOSS Group is managed by the Managing Board as a whole, which in particular deter-mines the Group’s strategic orientation. Operational implementation of the Group strategy takes place in close cooperation with the regional and brand directors and the heads of the central functions. The organizational and management structure clearly allocates authorizations and respon-sibilities within the Group and defines the reporting lines. It thus directs all Group resources towards sustainably increasing enterprise value.
keY perForMANce iNdicAtors
sAles ebitdA beForespeciAl iteMs
cApitAlexpeNditure
trAde Net workiNG cApitAl
Free cAsh Flow
08 — key performance indicators of the huGo boss Group
To increase enterprise value, the Group focuses on maximizing free cash flow. A permanent positive free cash flow ensures the Group’s financial independence and its solvency at all times. The main levers for improving free cash flow consist of increasing sales and operating income, defined as EBITDA (earnings before interest, taxes, depreciation and amortization) before special items. The free cash flow development is also supported by systematic management of trade net working capital and disciplined investment activity.
Focus on increasing free cash flow

063
Group Management h u G o b o s s Annual Report 2011
Cash flow from operating activities
Cash flow from investing activities
Free cAsh Flow
09 — definition free cash flow
As a growth-oriented company, HUGO BOSS attaches particular importance to profitably increasing sales. All activities for increasing sales are measured by their potential to increase EBITDA adjusted for special items and the adjusted EBITDA margin (ratio of income to sales) in the long term. As a key driver of free cash flow, EBITDA was identified as the most important key performance indicator. Improving the gross margin is seen as the main lever for increasing the EBITDA margin. Efficiency improvements in own retail and sourcing as well as optimization of the discount policy constitute the most important measures in this context. In addition, operating expenses are monitored strictly with the aim of limiting their increase in relation to sales to a lower than proportional level.
The management of the Group companies is directly responsible for profitable Group growth. Therefore, a portion of the total remuneration of distribution company managers is variable and tied to the achievement of sales and EBITDA targets as well as other key cash flow relevant metrics.
Due to HUGO BOSS’ relatively non-capital-intensive business model, trade net working capital constitutes the key figure for maximizing efficiency in the use of capital.
Until September 30, 2011, the use of capital was managed on the basis of net working capital. The basis for management was then changed to trade net working capital starting from October 2011. The reason for this change is the broader definition of net working capital which, in contrast to trade net working capital, also includes other current liabilities and receivables and current provi-sions. However, these balance sheet items are in some cases influenced by decisions that do not come under the responsibility of the operational distribution units. The switch to trade net working capital serves the purpose of minimizing the influence of exogenous factors on achievement of the operating units’ targets and therefore not diluting the incentive for operational improvements.
Managing inventories, trade receivables and trade payables is the responsibility of the operational business units. These three components are managed through the key figures of DIO (days inven-tories outstanding), DSO (days sales outstanding) and DPO (days payables outstanding), to which the variable remuneration of the distribution units’ management is also partially tied. In addition, the ratio of trade net working capital to sales is the object of management targets, planning and the business units’ monthly reporting.
Inventories
Trade receivables
trAde Net workiNG cApitAl
10 — definition trade net working capital
Trade payables
sales and ebitdA most important metrics for Group management
trade net working capital management to maximize efficiency of capital employment
Notes AdditioNAlFiscAl YeAr
064
h u G o b o s s Annual Report 2011 Group MANAGeMeNt report – Group proFile
Group Management
The value creation potential of proposed investment projects is assessed considering the relevant capital costs. The focus of the Group’s investment activity is currently on the expansion of own retail activities. For this reason, a specific approval process has been established for projects in this area. In addition to qualitative analysis of potential locations, this process also involves in particular assessing the net present value of each project.
The Group’s planning, management and monitoring activities focus on optimizing the key perfor-mance indicators described above. The key elements of the Group’s internal management system are:
· Group planning, · Group-wide, IT-supported reporting and · Investment controlling.
Group planning relates to a rolling three-year period. It is prepared annually as part of the Group-wide budget process, taking into account the current business situation.
Based on central targets set by the Group’s Managing Board, the distribution companies draw up comprehensive earnings, balance sheet and investment planning for the sales markets or business areas for which they are responsible. From this, the development and sourcing units derive their medium-term capacity planning and translate this into cost planning. The bottom-up planning of the business units is checked centrally for plausibility and aggregated into overall Group planning.
The annual planning is revised at regular intervals with regard to the actual business development and existing risks and opportunities to arrive at an extrapolation of the expected consolidated net income in the current year. On the basis of the anticipated cash flow development, the Group Treasury Department also prepares monthly liquidity projections. This allows for early identification of financial risks and timely implementation of measures with regard to financing and investment needs. In addition, the currency-differentiated liquidity planning represents the basis, among other things, for initiating potential currency hedging measures. — Report on Risks and Opportunities,
Financial Risks, p. 137
capital expenditure focus on own retail
three key elements of the Group’s internal
management system
regular updating of Group planning

065
Group Management h u G o b o s s Annual Report 2011
The Managing Board and the management of the Group companies are informed of the opera-tional development on a monthly basis in the form of standardized, largely IT-supported reports with differing levels of detail. This reporting is supplemented with ad-hoc analyses if required. Actual data as generated by the Group-wide reporting system is compared against plan data on a monthly basis. Deviations from targets must be explained and planned countermeasures must be described. Developments with a major influence on consolidated net income must be reported to the Managing Board immediately. Particular importance is also attached to analyzing early indicators suited to provide an indication of future business development. In this context, order intake, the performance of the replenishment business and comp store sales development in own retail are analyzed on at least a weekly basis. In addition, benchmark analyses with major competitors are conducted at regular intervals.
Investment controlling assesses planned and implemented investment projects in respect of their contribution to achieving the Group’s profitability targets. In doing so, only those projects that are expected to contribute to improving the Group’s economic performance are initiated. At regular intervals, the profitability of projects already realized is reviewed by means of subsequent analyses. In the event of deviations from the profitability targets originally set, countermeasures are implemented.
11 — development of key performance indicators (in EUR million)
2,058.8
469.0
407.3
108.5
193.3
1,729.4
2010 Change in %2011
349.8
322.7
55.6
246.3
19%
34%
26%
95%
(22%)
sAles
ebitdA beForespeciAl iteMs
trAde Net workiNG cApitAl
cApitAlexpeNditure
Free cAsh Flow
Focus of Group-wide reporting on analysis of early indicators
investment controlling secures Group profit-ability targets
Notes AdditioNAlFiscAl YeAr

066
h u G o b o s s Annual Report 2011 Group MANAGeMeNt report – Group proFile
Group Strategy
Group strAteGY
huGo boss has set itself ambitious growth targets stipulating considerable increases in sales and earnings. the Group’s strategy is derived from the company’s core competence of developing and marketing high-end apparel, shoes and accesso-ries in the premium and luxury segment. based on the established strengths of the business model, the growth expected in the coming years is primarily rooted in the implementation of strategic initiatives in the following four areas: expansion of own retail activities supported by a stronger focus on the end consumer, strengthening of the individual brand identities, exploitation of global growth opportunities, and improvement of key operational processes.
proveN busiNess Model As bAsis For Future GrowthHUGO BOSS has a successful business model that forms the basis for achieving its ambitious growth targets. The Group aims to generate sales of EUR 3 billion and an operating result (EBITDA before special items) of EUR 750 million in 2015.
Further optimization of the business model’s established strengths will contribute to achieving these targets. These strengths include in particular extensive product expertise, strong brands, a global presence, efficient business processes, highly qualified and motivated employees, and distribution activities that are tailored to the end consumer.
12 — established strengths of huGo boss business model
distributioN
eMploYees brANds
product expertise
GlobAl preseNce
busiNess processes
Ambitious medium-term growth targets

067
Group Strategy h u G o b o s s Annual Report 2011
The core competency of the HUGO BOSS Group is the development and marketing of high-end womenswear and menswear, shoes and leather accessories in the premium and luxury segment. High-quality materials, excellent workmanship and outstanding design are an integral part of the philosophy of all Group brands. Today more than ever, HUGO BOSS benefits from the product expertise it has acquired over many decades. The Company’s traditional strength in classic menswear has been systematically expanded into related areas such as casual wear and womenswear over the past two decades. This knowledge will also be preserved and advanced in future through continuous enhancement of the development processes, which are organized almost entirely internally within the Group, and ongoing optimization of internal production activities. The Group accordingly plans to generate future growth entirely in its traditional areas of expertise and business.
HUGO BOSS targets consumers with an extensive brand portfolio. The brands BOSS Black, BOSS Selection, BOSS Green, BOSS Orange and HUGO are aimed at demanding consumers with a variety of attitudes and requirements. Accordingly, each brand is geared towards a clearly defined target group in terns of its positioning, product range, communication and presentation at the point of sale. While BOSS Selection is positioned in the luxury segment, the other brands address the premium section of their respective market segments. Overall, they complement one another to form a portfolio that ensures wide-reaching coverage of the relevant market for the HUGO BOSS Group. The planned growth of the Company is thus to be achieved entirely with the existing brand portfolio. — HUGO BOSS Brand World, p. 58
The appeal of its brands has brought HUGO BOSS a high level of global recognition. In all of its markets, HUGO BOSS stands for attractive European design, superior quality and an appropriate price-quality ratio. The Group sees considerable potential for commercializing this brand image even more extensively than before in the coming years. Supported by expansion of the distribution network, particularly in Asia, the proportion of sales generated outside Europe is therefore expected to increase steadily in the next few years.
HUGO BOSS has excellent operational processes in production, sourcing, logistics and sales that create significant competitive advantages for the Group. Selective use of its own production sites secures critical expertise for HUGO BOSS and allows development activities to be systematically geared towards subsequent industrial production. The knowledge gained from internal production also allows for profitable management of the external supplier network, which ensures a consis-tently high product quality on the basis of long-standing partnerships. A homogeneous IT landscape provides effective support for the operational processes for all functions and creates the necessary transparency for business decisions. Finally, an efficient logistics infrastructure ensures on-schedule delivery of the correct quantities to the distribution partners. — Sourcing and Production, p. 85
extensive product expertise
strong brands
Global presence
efficient business processes
Notes AdditioNAlFiscAl YeAr

068
h u G o b o s s Annual Report 2011 Group MANAGeMeNt report – Group proFile
Group Strategy
A key element of the HUGO BOSS Group’s market success is the performance and creativity of its employees. HUGO BOSS therefore continuously strives to create a working environment that encourages creativity among the employees, promotes cooperation and enables employees to act efficiently and on their own initiative. A large number of measures and development programs are in place to continuously improve the employees’ professional and social skills. At the same time, the compensation system is organized such that it helps to create a performance-oriented corporate culture and thus gears the employees’ individual goals towards the Group’s goals. — Employees, p. 76
HUGO BOSS maintains business relationships that have been established for decades with the key wholesale partners in its market segment and thus has almost complete market coverage in this distribution channel. In its wholesale activities, the Group sells its products to multi-brand distribu-tors that offer HUGO BOSS products either in category business in a multi-brand environment or exclusively in shop-in-shop sales formats. Another model in wholesale business is distribution via franchise partners that operate HUGO BOSS stores based on contractual specifications. In the Group’s own retail activities, products are sold to the end consumers in directly operated stores or in outlets. In the past three years, the online business has also been established as a third distribu-tion channel. As part of its growth strategy, the Group plans to generate further sales increases in all channels.
highly qualified and motivated employees
distribution activities tailored to the end
consumer

069
Group Strategy h u G o b o s s Annual Report 2011
strAteGic Growth iNitiAtives eNsure coMpANY’s success iN the MediuM terMHUGO BOSS has identified four main growth areas for which strategic initiatives have been defined to sustainably increase sales and earnings. These four areas are further expansion of own retail activities, strengthening of the individual brand identities, exploitation of growth potential, particu-larly in Asia and America, in order to strengthen the global presence, and further improvement of operational processes. The Group-wide D.R.I.V.E. project supports implementation of these initia-tives with a variety of measures.
13 — Mid-term growth strategy
d.r.i.v.e.
Strengthening of individual brand
identities
Strengthening the global presence
Expansion of own retail with focus on the end consumer
Further improvement of operational
processes
Medium-term growth strategy definedt
Notes AdditioNAlFiscAl YeAr

070
h u G o b o s s Annual Report 2011 Group MANAGeMeNt report – Group proFile
Group Strategy
expansion of own retail networkHUGO BOSS is increasingly gearing its distribution activities towards own retail, without neglecting the wholesale business. In doing so, the Group is taking account of the growing consumer demand for mono-brand sales formats, particularly in emerging markets such as China, and the attractive return profile of this distribution channel. The Group expects own retail to account for approximately 55% of sales in 2015 (2011: 45%).
4353576470
2
55
2
45
3
40
3
33
3
27
14 — sales by channel (in %)
2007 2008 2009 2010 2011 … 2015 e
Royalties 3
Own retail 25
Wholesale 72
HUGO BOSS also anticipates continued growth in its wholesale business on the basis of established customer relationships with the leading retailers in the premium and luxury apparel segment. These retailers benefit from the strength of the Group’s brands, which should continue to be reflected in an above-average sell-through performance as compared to the competition. The Group’s dominant market position in the menswear segment offers the Company excellent opportunities to gain sales space in other market segments, too. The Group can also rely on its uniquely dense global showroom network compared to the competition and on its high delivery reliability, which make it an attractive business partner.
Supported by its growing retail expertise, HUGO BOSS expects to play an increasingly active role in managing the sales space of its wholesale partners in future. Depending on individual agreements, responsibility in this regard may be very far-reaching. In addition to providing store concepts and assuming independent responsibility for replenishment, HUGO BOSS also increasingly supports its wholesale partners with sales floor merchandising. This often results in noticeable improvements in sales productivity that benefit both partners.
The Group therefore expects to see continued profitable growth in its wholesale business despite ongoing market consolidation and the associated increasing focus on fewer but bigger customers.
own retail to become most important distri-bution channel in the
medium term
continued growth anticipated in
wholesale business

071
Group Strategy h u G o b o s s Annual Report 2011
Own retail is extremely important for the Group’s future development. Due to the opportunities arising and with regard to the sales and earnings development as well as consumers’ perception of the Group brands, the Group is investing in further expanding its store network and strengthening its retail expertise.
In the coming years, roughly 50 new stores are to be opened annually worldwide. Around 20 of these will be in the Chinese market. HUGO BOSS also sees attractive potential for opening new stores in Europe and selectively in America. The Group has defined store formats that differ in terms of which brands are offered, generally in addition to the BOSS Black core range. The choice of format depends on the store’s location, the immediate market environment and the demographic structure. As well as opening new stores, the Group also examines possibilities for acquiring stores previ-ously operated by franchise partners, depending on the attractiveness and growth prospects of the market in question. Independent management of shop-in-shops previously under the responsibility of wholesale partners also offers interesting potential.
In addition to the expansion of its store network, HUGO BOSS also focuses on further development of its retail expertise in order to optimize the sales performance in existing sales space and thereby increase the earnings contribution of this distribution channel.
Improvements are specified as early as the product development phase, which is governed to a large extent by the planned presentation of the collection on the sales floor. For instance, even before the development process begins, the collection structure is defined in terms of product types, price levels and fashion degree. Products with high sales potential and major importance to the collection statement are combined in a ‘core range’. The Group expects this to result in increased sales productivity in own retail and a sharper brand image.
At the same time, HUGO BOSS is improving its IT infrastructure for optimized planning and management of its retail activities. In addition to the improved performance measurement at store and product level, the Company is better able to manage flows of goods more transparently and therefore more effectively and to react quickly to divergent developments in demand in different sales markets by means of flexible product allocations.
The Company is also intensifying its focus on management of end consumer relationships. System-atic recording, combining and updating of consumer data – while observing strict data protection regulations – is intended initially to improve understanding within the Group of the HUGO BOSS end consumers, their buying behavior and the target groups relevant to HUGO BOSS. Building on this, consumers will in future be targeted more closely across all channels according to their preferences with information and offers that are relevant and interesting for them.
own retail is important growth driver
expansion of the store network planned
continuous develop-ment of retail expertise
efforts stepped up in customer relationship management
Notes AdditioNAlFiscAl YeAr

072
h u G o b o s s Annual Report 2011 Group MANAGeMeNt report – Group proFile
Group Strategy
The HUGO BOSS Group expects online sales to become increasingly important, and is taking account of this by strengthening its online business. In addition to the planned opening of new online stores, for example in the growth market China in the coming year, there will also be a focus on ongoing optimization of the existing stores in the U.S., the UK, Germany, France, the Netherlands and Austria in terms of user friendliness, product range and presentation, and services.
strengthening of individual brand identitiesStrong brands form the basis for the Company’s future success. Each of the Group’s brands fills a closely defined role within the entire HUGO BOSS brand portfolio and is targeted at a clearly differentiated consumer segment. The Group continuously strives to sharpen the positioning of its brands in order to set itself apart from the competition. In addition to developing an unmistakable signature design for the collections, the focus here is on individually tailored communication for the different brands and optimal presentation at the point of sale.
HUGO BOSS sees considerable potential for further growth in all brands. In the businesswear segment, where the Company already has a leading market position, BOSS Selection will be expanded as a major concept in the luxury segment. BOSS Black, which sets itself apart from the competition with its contemporary elegance and perfection, enjoys a high level of confidence among consumers and wholesale partners thanks to its classic-modern orientation combined with the highest standards of quality, design, fit and workmanship. Finally, HUGO targets an extremely fashion-conscious consumer segment with its progressive orientation and avant-garde design. In the sportswear segment, HUGO BOSS primarily scores with BOSS Black and BOSS Orange, which stands for casual collections, and BOSS Green, which does away with the boundaries between fashionable leisurewear and functional golf-wear. — HUGO BOSS Brand World, p. 58
Within the brand portfolio, the Group anticipates above-average growth rates from BOSS Selection in particular, but also from the womenswear and shoes and accessories segments.
BOSS Selection stands for exquisite design, exclusive quality and perfect workmanship. The brand’s modern fashion statement and its outstanding price-quality ratio set it apart from the competitors. The brand’s acceptance among consumers has been further strengthened by the introduction of a clearly distinguishable logo together with an individual corporate design, the expansion of the product portfolio to include high-quality sportswear, and the prominent presentation of the brand at major fashion fairs such as the Pitti Uomo in Florence last year. HUGO BOSS is focusing on further strengthening this brand and expects this to bring not only strong sales growth but also a positive image effect for the rest of the brand portfolio.
expansion of online activities
clear differentiation of brand identities
All brands offer significant growth
opportunities
boss selection targets luxury consumers

073
Group Strategy h u G o b o s s Annual Report 2011
HUGO BOSS has set itself the goal of significantly expanding its market position in the womens-wear segment. The Company has therefore separated this segment from menswear and placed it under independent management as a standalone organizational unit. With a focused brand image, a more feminine signature design, the expansion of the luxury sportswear segment and targeted marketing support, this segment is set to grow faster than the Group as a whole in the medium term.
Particularly in the growing womenswear segment, a product range in which the apparel collections are supplemented with accessories to form complete outfits is strategically important. The Group has therefore set itself the goal of expanding the product area of shoes and accessories. For this purpose, the Group has significantly boosted the design team responsible and made organizational changes to ensure closer cooperation between the relevant development teams.
strengthening the global presenceHUGO BOSS plans to further increase its sales in all regions in the medium term. The proportion of sales generated outside of the European market will rise in the process, due in particular to strong growth in Asia.
5461626769
2
21
23
2
15
22
3
13
22
3
10
20
3
10
18
15 — sales by region (in %)
2007 2008 2009 2010 2011 … 2015 e
Royalties 3
Asia/Pacific 8
Americas 18
Europe 71
In Europe, the Group can count on its strong portfolio of wholesale partners and the appeal that its brands enjoy in this distribution channel. HUGO BOSS aims at further strengthening its consumer relationships by means of a good sell-through performance, high delivery reliability and depend-able replenishment. The Group sees good opportunities in the medium term to use its dominant market position in menswear clothing to its advantage in other areas of the brand portfolio, such as womenswear. Own retail will play an increasingly important role here. In addition to stepping up openings of new stores in Eastern Europe and selectively expanding the retail network in Western Europe, active management of wholesale floor space and significant growth in the online business will also contribute to this.
intensified focus on womenswear
exploiting growth potential in the shoes and accessories segment
increasing sales in the Americas and Asia
europe remains core region for huGo boss
Notes AdditioNAlFiscAl YeAr

074
h u G o b o s s Annual Report 2011 Group MANAGeMeNt report – Group proFile
Group Strategy
HUGO BOSS is enjoying strong momentum on the U.S. market thanks to the very positive percep-tion of its brands by consumers, particularly with regard to modern design, a reliable fit and a favorable value proposition. Opportunities for growth are seen in all distribution channels. In the wholesale business, the Group is focusing on partnerships with retailers in the high-end market segment. Here, optimization of the brand presentation both in category business and also increas-ingly in shop-in-shop formats represents a major growth driver. In own retail, sales space expansion is focusing on smaller cities that have not yet been tapped with directly operated stores. Improve-ments in operational retail management are expected to increase floor productivity further. Strong growth is likewise anticipated for the online business, partly as a result of active multi-channel management. Outside the core market of the U.S., the Group sees good opportunities particularly in Latin America for increasing its market presence in the medium term through further expansion of own retail business.
HUGO BOSS is pressing ahead strongly with its expansion in Asia. The strategy centers on further improving HUGO BOSS’ image as a luxury brand, particularly in China, so as to benefit from the increasing demand for premium and luxury goods among the constantly growing middle class. The BOSS Selection brand plays an important role here in that it demonstrates corresponding product expertise. In addition to PR and marketing activities, directly operated stores – through which a large proportion of sales in Asia are generated – are also particularly important in this context. The Group therefore plans to open new flagship stores in Beijing and Shanghai in 2012. The Group will also substantially increase its presence in the comparatively smaller provincial capitals. This growth will be supported by the expansion of the logistics network, which will allow HUGO BOSS to gain faster access to markets and to offer more effective replenishment. The Group also sees interesting opportunities for growth in wholesale business in countries such as Indonesia and Vietnam.
Further improvement of operational processesThe growing commercial importance of own retail increases the need to gear the Group’s business model even more strongly than before towards the needs of end consumers. By optimizing its operational processes, the Group strives to better meet the specific requirements of own retail and react faster to market changes than it has done in the past. The central measures for achieving this goal form part of the Group-wide D.R.I.V.E. project, whose continued implementation in 2012 represents an important element of HUGO BOSS’ medium-term growth strategy.
All distribution channels offer oppor-tunities for growth in
America
chinese market is engine for develop-
ment in Asia
process changes improve ability to
respond to market developments

075
Group Strategy h u G o b o s s Annual Report 2011
The D.R.I.V.E. project centers on reducing lead times, i.e. the period between the start of collec-tion development and delivery to the customers. By streamlining and standardizing operational processes in product development, sales and production, lead times were shortened from 50 weeks to 38 weeks. Stronger interconnection of the different elements of the value chain is a key element here. For example, technical production considerations are now incorporated in the devel-opment process at a much earlier stage. The considerable reduction in the collections’ complexity also made a significant contribution to reducing the time to market. In addition, the product develop-ment process was geared more strongly towards the presentation of the collections in own retail through the systematic definition of the collection structure and the definition of a “core range”. — Innovation and Development, p. 83
As a result of the reduced lead times, the creative management of the brands is now able to apply knowledge gained from sales in one season directly in the development of the following collection. A shorter time to market also allows for the collection cycle to be changed to four almost equally sized collections per year. HUGO BOSS will thus be able to better gear the product range at the point of sale towards seasonal differences in consumer demand and to offer new incentives to buy on a continuous basis. The Group expects this to have a positive impact on consumer traffic in own retail, resulting in an increase in sales and floor productivity. The continuous offer of attractive collections should also reduce discounts and improve the inventory turnover in own retail. The implementation of the new collection cycle also supports efficiency improvements in the production and sourcing activities. — Sourcing and Production, p. 87 — Innovation and Development, p. 83
In 2012, the global introduction of central D.R.I.V.E. initiatives also in America and Asia will represent an important milestone in the Company’s development. An additional focus will be the ongoing implementation of the defined measures in the operational business processes and in own retail. Based on the first indications gained in own retail regarding the sales and earnings effects of D.R.I.V.E., the Group is confident that wholesale will also take on central D.R.I.V.E. concepts, enabling HUGO BOSS to further increase its appeal as a partner.
d.r.i.v.e. project systematically gears organization towards the needs of end consumers
shorter time to market allows for orientation towards the mirror season
Global launch of the d.r.i.v.e. project will be major focus in 2012
Notes AdditioNAlFiscAl YeAr

076
h u G o b o s s Annual Report 2011 Group MANAGeMeNt report – Group proFile
Employees
eMploYees
the work of the around 11,000 employees of the huGo boss Group worldwide forms the basis of the company’s success. every day they contribute their skills and enthusiasm for fashion to the company, thereby contributing to the uniqueness of the products. the goal of human resources work at the huGo boss Group is to promote team spirit and motivation among the employees in an international environment and to create a working atmosphere in which creativity and perfection can develop freely yet in an organized way as well.
The HUGO BOSS Group offers its employees a working atmosphere in an international environ-ment that is based on team spirit, creativity and openness. Human Resources management at HUGO BOSS aims to fill the corporate culture with life so that each individual employee can bring his or her personal skills, commitment and enthusiasm to the Company and make his or her own contribution to the success of the entire Group.
The goal of Human Resources work at HUGO BOSS is to gain suitable employees for the Company, to systematically promote their development and to retain them in the long term. Only in this way can the implementation of the Group strategy and the Company’s success be guaranteed. Last year, Human Resources management focused primarily on the personnel-related organization of the expansion in the Group’s own retail activities and the increasing internationalization of business operations. Particular emphasis was placed on ensuring standardized and transparent processes for the future and using training to prepare all employees in the Group for the new challenges.
The economic success of the HUGO BOSS Group in 2011 was reflected in an extended workforce. At the end of fiscal year 2011, the total number of HUGO BOSS staff amounted to 11,004. In comparison to the previous year (2010: 9,944 employees), this number thus increased by 1,060 employees, respectively 11%.
16 — Number of employees at year-end
2011
2010
2009
2008
2007
11,004
9,944
9,027
9,593
9,123
targeted promotion of the corporate culture
human resources strategy supports
growth
Number of employees increases in 2011

077
Employees h u G o b o s s Annual Report 2011
This development is due to the positive operational development and the associated higher personnel requirements, particularly in own retail. In own retail business alone, the workforce was increased by 29% or 797 employees last year. The majority of the new employees were hired in Europe and in the growth region Asia, where the expansion of the Group’s own retail business is being driven forward with strong momentum.
Administration 716Research and development 445
Logistics/warehouse 1,371
Group‘s own retail business, sales/marketing 3,521
3,742
492
1,447
4,555
768
17 — Number of employees by functional allocation at year-end
Production 3,891
20112010
Of the total number of employees, 43% (4,687) were employed in industrial activities and 57% (6,317) in commercial and administrative activities at the end of 2011. — Notes to the Consolidated
Financial Statements,note no. 9, p. 194
Commercial and administrative employees 5,675
4,687
6,317
18 — Number of industrial, commercial and administrative employees at year-end
Industrial employees 4,269
20112010
Notes AdditioNAlFiscAl YeAr

078
h u G o b o s s Annual Report 2011 Group MANAGeMeNt report – Group proFile
Employees
The corporate culture at HUGO BOSS is characterized by internationality, openness and diversity. This is also reflected in the regional distribution of the employees. 79% of the Group’s staff work outside of Germany (2010: 79%). Almost a third of the employees at HUGO BOSS AG in Germany has an international background.
Rest of Europe 54
Asia/Pacific 12
Americas 13
21
13
13
53
19 — employees by region at year-end (in %)
Germany 21
20112010
Women account for 60% of employees in the HUGO BOSS Group (2010: 61%). In management, i.e. including all management levels, 46% (2010: 45%) of positions are currently held by women. The Company thus complies with the recommendation of the German Corporate Governance Code according to which the Managing Board is supposed to aim for an appropriate consideration of women when filling managerial positions. — Sustainability, p. 91
in % 2011 2010
Proportion of men of total number of employees 40 39
Proportion of women of total number of employees 60 61
Proportion of men in management 54 55
Proportion of women in management 46 45
Average age in years 34 33
It is highly important to the HUGO BOSS Group to develop and systematically promote young talent within the Company. Each year, the Company therefore supervises a large number of apprentices and students at the Stuttgart and Ravensburg Cooperative State Universities and at the Nagold Specialist Academy for Textiles and Shoes (LDT). Training for skilled occupations is offered in both commercial and industrial/technical areas. In particular by providing training for highly specialized occupation profiles, such as textile laboratory assistants, apparel tailors and textiles business admin-istrators, the Company can maintain and expand valuable knowledge internally. As of December 31, 2011, there were 74 apprentices at the Company (2010: 77). In 2011, 34 apprentices and students at Cooperative State Universities started their training at HUGO BOSS AG. 36 apprentices and students at Cooperative State Universities successfully completed their apprenticeship in 2011.
internationality is a top priority at huGo boss
proportion of women in management
increases
training has a firm place in the company

079
Employees h u G o b o s s Annual Report 2011
In 2011 HUGO BOSS AG also offered around 200 interns the chance to gain practical experience in virtually all the Company’s departments. To find the best-suited internship candidates for the various departments, the Company has joined a cooperation program that allows it to target more than 3,000 students at over 350 German-speaking colleges and universities in Europe. As a “Fair Company” (an initiative by the job and business magazine “Junge Karriere” under the aegis of the newspaper Handelsblatt and the magazine WirtschaftsWoche), HUGO BOSS AG offers internships primarily alongside the interns’ studies and to provide professional orientation; the Company also pays the interns an adequate expense allowance. At the end of the internship, very promising interns can round off their studies by writing a thesis at the Company. In 2011, 40 such theses were supervised at HUGO BOSS.
HUGO BOSS pursues the goal of positioning itself clearly on the market as an interesting and attractive employer for young people. In order to discover young talent at an early stage and gain it for the Company, the Group collaborates closely with national and international colleges and univer-sities and the organizers of creative competitions. HUGO BOSS maintains close contact with the students, both in a large number of company presentations and tours at the Company’s headquar-ters in Metzingen and also with regular lectures by employees from different departments at the colleges and universities themselves. In addition, company-specific project work is increasingly given to the students at the colleges and universities involved in the cooperation. The Company continuously makes use of the contacts formed in this way when recruiting junior staff. In addition, since 1987 the Group has awarded the “HUGO BOSS Fashion Award” to talented young students in exclusive cooperation with the Stuttgart State Fashion School. As well as a cash prize, winners of the award are offered an internship at HUGO BOSS.
The success of HR marketing activities in the past year is reflected, for instance, in the fact that the Company has moved further up in various rankings of Germany’s most popular employers.
The Group aims continuously to improve the knowledge and skills of its employees by providing systematic employee training and development based on a transparent skills model. This enhances not only the performance of the organization as a whole but also the individual employee’s motiva-tion and self-confidence.
huGo boss targets talent at an early stage
Group prepares itself for the future with individual employee training and development
Notes AdditioNAlFiscAl YeAr

080
h u G o b o s s Annual Report 2011 Group MANAGeMeNt report – Group proFile
Employees
Targeted measures help employees to improve their performance in their day-to-day work and to extend their knowledge beyond the requirements of their current position. In addition to an extensive range of on-site training sessions, HUGO BOSS also offers an increasing number of online-based training courses. One key advantage of this type of training is that it can be used throughout the Group in different language versions, thereby facilitating standardized training and development of all employees. Particularly in Group-wide own retail business, a large number of online-based courses are used in employee training with regard to individual products or overarching topics such as customer service and sales. The online training on ‘Textile Basics’ was awarded the ‘red dot award communication design 2011’, reinforcing the Group in its intention to continue on the path taken with regard to online training. In total, the online-based training courses available were completed almost 6,000 times throughout the HUGO BOSS Group in the past fiscal year.
Individual development within the Group is also supported in a variety of ways: through transfers to other departments or roles either within the Group headquarters or at an international subsidiary, through promotion to management positions or through expansion of the employee’s own area of responsibility. Two programs were launched in 2011 to enable particularly talented and committed employees either to embark on a career as a manager via clearly defined development stages or to deepen their specialist knowledge via a specialist career path.
To evaluate the performance, skills and development potential of each individual and document this transparently, all supervisors hold feedback discussions with their employees on an annual basis. In these discussions, the tasks and personal goals for the coming year are documented and the training requirements for achieving the employee’s individual learning objectives are determined.
081
Employees h u G o b o s s Annual Report 2011
In the HUGO BOSS Group, compensation is designed so that individual performance is rewarded fairly and transparently, promoting a culture of motivation and commitment. Clearly documented job descriptions and evaluations are used as a basis for compensation. The compensation of employees in Germany covered by a collective agreement is based on the collective agreement of the Südwest-deutsche Bekleidungsindustrie (Southwest German Textile Industry). The compensation of staff employed in retail is based on the German retail collective agreement. The employees working in retail and sales are entitled to a fixed salary and variable compensation tied to quantitative targets. For example, the compensation of employees in directly operated stores may be linked to the fulfillment of service standards defined uniformly for the entire Group and of guidelines for own retail. Joint incentives are also created for the employees at individual stores for the achievement of specific retail-related key performance indicators. Employees who are not covered by a collective agreement receive - in addition to their base salary – a bonus that is tied to both corporate targets and qualitative and quantitative personal targets. The targets and their achievement are defined and documented once a year in an appraisal interview with the employee’s supervisor.
In addition to the contractually stipulated salary components, the employees are also entitled to the following benefits, among others: Depending on the distance in kilometers, each employee receives a travel allowance and has the opportunity to shop in the HUGO BOSS VIP store at a discount or to take advantage of art and cultural events in the context of the Company’s sponsorship activities. Furthermore, all employees have the opportunity to train at the in-house fitness studio all year long and free of charge. In addition, employees have the option to convert part of their gross salary into pension contributions.
employees’ pay is based on a transparent compensation system
Notes AdditioNAlFiscAl YeAr

082
h u G o b o s s Annual Report 2011 Group MANAGeMeNt report – Group proFile
Innovation and Development
iNNovAtioN ANd developMeNt
As a global leader in the fashion industry, creativity and product innovations are important success factors to huGo boss. the aim of product development is to ensure sustained, modern brand management and differentiation. continuous brand development pursues the goal of systematically tapping and extending the existing earnings potential and designing collections that can be optimally positioned on the sales floors.
As a company that has successfully positioned itself in the premium and luxury segment of the global fashion market, it is highly important for HUGO BOSS to present the consumer with fashion-able, innovative products each season and therefore to keep offering new incentives to buy. On the other hand, the consumer also expects HUGO BOSS products to maintain the same high quality, a guaranteed perfect fit and unmistakable signature design from season to season. Development work at HUGO BOSS therefore focuses on fulfilling the standards for quality, a perfect fit and consis-tent brand management but also for excellent and innovative design.
HUGO BOSS has divided the organization of its brand and creative management, which is operated from the Company’s headquarters in Metzingen, into the segments of menswear and womens-wear. In the menswear segment, responsibility is subdivided into the various Group brands. The menswear segment is thus organized into the areas of BOSS Black Clothing and BOSS Selection, BOSS Black Sportswear, BOSS Green, BOSS Orange and HUGO, each of which is headed by a responsible creative director. In contrast, creative management of the womenswear segment is combined for all brands (BOSS Black, BOSS Orange and HUGO) under the management of a single creative director.
Innovation and development work is organized at the four development centers in Metzingen (Germany), Coldrerio (Switzerland), Morrovalle (Italy) and Scandicci (Italy). The Group’s development departments are usually staffed by skilled fashion designers, tailors, shoe and clothing technicians and engineers.
Under the leadership of the creative directors responsible, the design and development teams manage the individual product categories of the different brands at the Company’s four develop-ment locations. At the Group headquarters in Metzingen, for instance, the Company uses its years of experience in industrial textile production to develop pioneering products in the core area of classic menswear and womenswear clothing. The competence center in Coldrerio (Switzerland) is responsible for both the creative development of the textile product groups of shirts, ties and knitwear and also the overarching management of shoes, leather accessories and bodywear. At the Italian locations in Morrovalle and Scandicci, creative work focuses on the development of shoes and leather accessories.
innovation meets consistency at
huGo boss
specialized brand and creative management
development work distributed across four
locations
Management of the product categories at
different locations

083
Innovation and Development h u G o b o s s Annual Report 2011
In 2011 the number of employees in the Development and Creative teams rose by 11% to 492 employees (2010: 445). Group-wide expenses in connection with the collection development process rose by 17% to EUR 55 million in the past fiscal year (2010: EUR 47 million). The main reason for this development was an increase in personnel expenses. — Employees, p. 76 — Notes to the Consolidated Financial Statements, note no. 9, p. 194
The innovation and development process stands at the beginning of the value chain and therefore plays a decisive role in the subsequent success of the collection.
In the collection development phase, the creative management defines the current collection statement, draws up the color, theme, form and fabric concepts, and establishes target prices. To best meet consumers’ requirements, feedback on the previous collection is systematically gathered and analyzed in the Group’s own retail business and from its wholesale partners before creative development begins. In searching for new ideas, the creative teams also take inspiration from impressions that they gain from areas such as architecture, design and art, as well as from new technologies and social and economic developments.
In the second step, the Creative department hands over its sketches to the Pattern Design depart-ment, where the implementation of the creative ideas is verified in technical tailoring terms. The models are then developed into prototypes in technical development. In order to guarantee the high quality standard of the products, work here focuses on the development of innovative and high-quality manufacturing techniques and the selection of appropriate fabrics. The prototypes undergo extensive tests which, among other things, provide the information on the materials’ physical prop-erties that is required for subsequent series production. The suppliers are already involved in the process in this product development phase, for instance in the selection of raw materials and outer fabrics.
To further simplify and speed up technical development, last year the Company launched a project to facilitate computer-based, virtual development of selected product categories. The virtual prototypes can be discussed and adjusted flexibly directly at the PC, not only with the internal contact persons involved in the process but also with the suppliers worldwide. The close cooperation between the development teams and the manufacturers means that the products can be developed not only more quickly and with a higher quality, but also at a lower cost due to the reduced need for physical prototypes.
Following the prototyping phase is the so called sampling, i.e. the production of a sample collection and its presentation and sale to international wholesale customers. Afterwards the ordered pieces are produced and sold to the end consumer, either through a wholesale partner or own retail.
creative teams expanded further
close interaction between creative department and technical development
Notes AdditioNAlFiscAl YeAr

084
h u G o b o s s Annual Report 2011 Group MANAGeMeNt report – Group proFile
Innovation and Development
End consumers expect an extremely high quality from HUGO BOSS products. The development phase is vital in ensuring this. Close cooperation from an early stage between the Brand and Creative departments, the Pattern Designers and the technical developers is essential. At the development center in Metzingen, the Pattern Designers, who draw the product cuts, and the product devel-opers, who realize it technically and commercially, work together in a very early phase of product creation. As such, they have the opportunity to identify not only potential for improvement but also shortcomings in the designs at an early stage, allowing for them to be counteracted before produc-tion begins. Product development at HUGO BOSS is also characterized by intensive collaboration between the internal Creative and Development teams on the one hand and the external suppliers and technology partners on the other hand. This not only ensures a smooth subsequent production process, but also secures HUGO BOSS its competitive advantage in manufacturing technology and product quality.
Efficiency improvements in the development process play an important role in reducing lead times, which represents a key part of the D.R.I.V.E. project. Considerable progress was made in the past year with regard to simplifying and standardizing core processes. For instance, the Company succeeded in establishing the raw material requirements per product at a much earlier stage than previously. Faster production of prototypes and samples by a development center based directly in Metzingen also allowed substantial time-savings. — Group Strategy, p. 74
Quality assurance begins in the product
creation phase
company project d.r.i.v.e. optimizes the
product development process
085
Sourcing and Production h u G o b o s s Annual Report 2011
sourciNG ANd productioN
the consumer is at the heart of the huGo boss Group’s business activities. Fulfilling consumer demand in both wholesale and own retail on time and in line with the highest quality standards is therefore the maxim of the sourcing and production units. to achieve this goal, huGo boss constantly works to ensure transparent, efficient and flawless structures in the sourcing and production process by selecting suppliers in a targeted manner, strengthening existing supplier rela-tionships on an ongoing basis and adhering to the highest technical production standards at its own production facilities.
As a company that manufactures and operates internationally, standardized, system-supported and well-coordinated purchasing and production processes are an important success factor for HUGO BOSS. Roughly 21% (2011: 24%) of the full product line is produced in HUGO BOSS’ own factories; around 79% (2010: 76%) is manufactured by independent suppliers in commissioned production or purchased as merchandise. Self-producing a significant portion of its traditional clothing product range allows the Group to gain considerable expertise and optimizes quality and product availability.
The Company’s own production sites are in Izmir (Turkey), the largest self-owned facility, Cleveland (USA), Metzingen (Germany), Radom (Poland) and Morrovalle (Italy). The factory in Izmir mainly produces suits, trousers, jackets, shirts and womenswear clothing. At the factory in Cleveland, HUGO BOSS produces suits for the American market. In Metzingen, the focus is on small-series production of suits, jackets and trousers. In addition, the facility manufactures prototypes, sample pieces and individual orders. In particular, the exclusive BOSS Selection Tailored Line and made-to-measure suits are manufactured here. Production in Radom and Morrovalle focuses on shoes.
In 2011, the HUGO BOSS Group worked with around 320 suppliers for contract manufacturing and merchandise. The sourcing volume is distributed across a global network of suppliers so as to spread the risk and make the Group as independent as possible of single sourcing locations and manufacturing companies. As such, the largest manufacturer of merchandise accounted for only around 8% of the total sourcing volume of the HUGO BOSS Group.
Majority of production by independent suppliers
strategic management of the supplier network as a success factor
Notes AdditioNAlFiscAl YeAr

086
h u G o b o s s Annual Report 2011 Group MANAGeMeNt report – Group proFile
Sourcing and Production
Sourcing activities relate to raw materials, contract manufacturing and merchandise. The sourcing of raw materials includes predominantly fabrics but also components such as linings, buttons, thread and zippers. The majority of raw materials used internally and in contract manufacturing are sourced in Europe. Fabrics are predominantly purchased from longtime suppliers in Italy. Contract manufacturing is used chiefly for the production of suits, jackets and trousers. In these product groups, HUGO BOSS primarily works with companies in Eastern Europe. For products created in contract manufacturing, the supplier receives the fabrics and other components to be used as well as the patterns. In contrast, sourcing for casual wear and sportswear is largely based on purchased merchandise. With this type of sourcing, the merchandise suppliers of the HUGO BOSS Group are in most cases provided the necessary patterns but source the raw materials themselves. Merchan-dise in the area of casual wear and sportswear is primarily sourced from Asia, Eastern Europe and North Africa. With the exception of the classic shoe collection, which is produced at the Company’s own plants in Italy and Poland, the shoe and leather accessory product categories are primarily sourced from partners in Asia and Europe.
Measured in terms of their value, half (50%, 2010: 51%) of all HUGO BOSS products (goods produced in own factories, merchandise and goods sourced in commissioned production) are produced in Eastern Europe and Turkey. The Group’s own factory in Turkey plays an important role in this context, accounting for 16% of the production value in total (2010: 17%). 30% of all products come from Asia (2010: 27%). In this region China is the most important single sourcing country for HUGO BOSS. The rest of the goods come from Western Europe (11%, 2010: 11%), North Africa (6%, 2010: 9%) and the Americas (3%, 2010: 2%).
North Africa 9
America 2
Western Europe 11
Asia 27
50
11
30
63
20 — regional split of sourcing and production volume (in %)
Eastern Europe 51
20112010
Forms of sourcing vary depending on the
product groups
Global distribution of sourcing activities

087
Sourcing and Production h u G o b o s s Annual Report 2011
In order to further optimize the sourcing processes for casual wear and sportswear in Asia, last year a new office was opened in Hong Kong to coordinate the sourcing activities for both raw materials and merchandise in Asia. The close supervision locally creates advantages with regard to the quality and speed of workflows.
The selection of suppliers is based on objective technical production criteria. Most important here is ensuring the highest product quality, which requires precise production techniques at the manufac-turing company. In addition to the quality of the goods produced, the supplier’s financial strength, cost structure, productivity, available technologies and innovations as well as production expertise are considered when making the selection. Strict adherence to social and environmental standards at the production sites is an indispensable prerequisite for entering into a business relationship. It is also very important to HUGO BOSS that suppliers have an understanding of the products and their design that meets the high requirements of the premium and luxury goods segment. — Sustainability, p. 89
The Group has a strong interest in long-term cooperation with its suppliers. The joint development of production expertise ensures the high quality for which HUGO BOSS products are known around the world. Close coordination between the manufacturing companies and the technical development department is essential in the HUGO BOSS Group, particularly in light of the shortened lead time. For instance, technical production considerations are integrated in the product development process at a very early stage. The suppliers’ feedback on the fabrics and patterns used in past collections is likewise taken into account in developing new designs. — Innovation and Development, p. 83
Continuous efficiency improvements in cooperation with the suppliers are required in order to effec-tively counteract cost increases in the sourcing processes, especially due to higher labor costs. One important lever here is ensuring that capacity utilization is kept as steady as possible over the course of the year. The change to a collection cycle with four main collections that was initiated with the D.R.I.V.E. project and the resulting more balanced seasonal sourcing activities play an important role in this context. The core range introduced as part of D.R.I.V.E. also encourages more efficient production processes as a result of higher lot sizes. — Group Strategy, p. 74
In addition, the Group is continuing to work on optimizing its planning and sourcing processes so as to reserve production capacity for the required volumes at an early stage and at low costs. For this purpose, the electronic connection between the suppliers and the Company was expanded further in the past year. For instance, going forward orders will be assigned largely automatically to the supplier that can fulfill the order most efficiently based on the data it has reported.
sourcing organization in Asia strengthened
objective criteria as basis for selecting suppliers
close supplier relation-ships are strategically important
d.r.i.v.e. project supports efficiency improvements in production and sourcing
Notes AdditioNAlFiscAl YeAr

088
h u G o b o s s Annual Report 2011 Group MANAGeMeNt report – Group proFile
Sourcing and Production
HUGO BOSS makes very high demands on the quality of its products. In order to fulfill these, quality checks focus on where the product is created – at the supplier itself. For instance, the manufac-turing companies are provided with standardized quality and processing handbooks that document the requirements. The most important processes relevant to quality are also described in a process handbook and are subject to a continual optimization process with the ISO 9001 certification.
To meet the high quality standards, the manufacturing process is automated where economically feasible so as to minimize manufacturing tolerance. Adherence to manufacturing standards is also ensured through fixed controls that are always carried out at certain process steps in the production line. Furthermore, random checks of individual process steps are performed on a regular basis. The extensive hardware and software support for the inspection processes allows for a high degree of standardization and electronic analysis of the results.
Quality assurance encompasses entire production process

089
Sustainability h u G o b o s s Annual Report 2011
sustAiNAbilitY
As an international company, huGo boss is aware of its particular responsibility towards society, employees and the environment. corporate responsibility, under-stood as a business sustainability principle, comprises precisely these economic, social and ecological aspects of responsible business management and seeks a dialog with different stakeholders. the company is meeting the wide range of challenges this entails. Not only in terms of social commitment but also in production and quality processes, in the treatment of employees and in relation to environmental issues, it is important to implement the concept of corporate responsibility operationally and take it into account in strategic decisions.
21 — corporate responsibility at huGo boss
corporAte respoNsibilitY
Production and quality
Employees
Environment
Social commitment
productioN ANd QuAlitYAs defined in the Code of Conduct, HUGO BOSS pledges itself and its suppliers to compliance with internationally recognized minimum labor and social law standards under the conventions of the International Labor Organization (ILO) and the Universal Declaration of Human Rights of the United Nations. — For more information on the Code of Conduct, see Corporate Governance Report, p. 43
The social standards are a fixed component of the contractual regulations with all suppliers and a prerequisite for accepting new business partners. The following aspects are regulated in the social standards: compliance with national laws, prohibition of child labor, prohibition of forced labor, maximum working hours, humane working conditions, prohibition of discrimination, payment of adequate wages, healthy and safe working conditions, entitlement to freedom of association and collective bargaining, and responsible handling of environmental issues.
If there is no national legislation defining matters such as working times and adequate wages, or if it is insufficient, HUGO BOSS’ social standards constitute the minimum standard.
compliance with international social standards
Notes AdditioNAlFiscAl YeAr

090
h u G o b o s s Annual Report 2011 Group MANAGeMeNt report – Group proFile
Sustainability
Social compliance audits are performed globally, both with the Group’s own auditors and also in cooperation with experienced external service providers. The audits firstly ensure compliance with the social standards and secondly help the suppliers to develop their social management.
The audit results are also included in the semi-annual supplier appraisal. If infringements of the social standards and statutory provisions are identified, the audit frequency is increased depending on the seriousness of the infringement and a binding plan of measures with renewed implementation control is agreed together with the suppliers. In exceptional cases, for example repeated warnings without any initiated improvements or serious infringements of the social standards, HUGO BOSS retains the right to terminate the cooperation.
Sandblasting refers to the use of sand jets as a refining method for denim products to achieve a “used” effect. If this method is carried out using quartz sand without sufficient protective measures, these can lead to serious damage to the employees’ health.
As a responsible company, HUGO BOSS previously worked in dialog with the relevant suppliers with alternative blasting agents or refining methods that do not pose a health risk. Although this constitutes a non-hazardous alternative to sandblasting with quartz, the Group resolved last year to discontinue the use of any type of blasting technology in 2012. As such, it is not only blasting agents containing quartz that the Group avoids, but also alternative blasting agents.
As a leading company in the global high-end fashion industry, it is a matter of course for the Group to meet its responsibilities towards the consumers. HUGO BOSS products must not pose health risks. To fulfill this obligation, each supplier is required to sign a written guarantee confirming its compliance with the Restricted Substances List (RSL). The RSL includes stipulations that ensure that the materials used comply with national legislation and HUGO BOSS’ internal guidelines and are not harmful to health in either the production process (e.g. due to emissions) or when used. Compliance is ensured through corresponding audit processes implemented along the supply chain.
eMploYeesSince 2008 the Company has been part of the Germany-wide “Erfolgsfaktor Familie” (Success Factor Family) network and offers a flexible family support model. This is primarily designed to make it easier to return to work after parental leave or maternity leave. For employees in Metzingen, there are specially reserved places in a daycare center or the option to receive financial support for an alternative form of childcare. Around 130 couples with children currently benefit from these offers.
regular examination of compliance with social
standards
No use of sandblasting
targeted product safety requirements
support for work-life balance through family
support, sport and nutrition
091
Sustainability h u G o b o s s Annual Report 2011
With regard to nutrition at the workplace, HUGO BOSS makes an important contribution as an employer to its employees’ health. The Company’s cafeteria follows a balanced nutrition plan with menus changing daily and offers a wide range of fresh fruit and salad.
In addition, all employees have the opportunity to train at the Company’s fitness studio and to participate in subsidized courses such as back training, aerobics or pilates. Many employees in Metzingen also enjoy the soccer field, the beach volleyball field and the HUGO BOSS Run. More than 700 runners took part in this event at the Company’s headquarters in 2011.
As an international company, HUGO BOSS operates in 124 markets worldwide for customers with a wide range of cultural backgrounds. For the Company, diversity means unconditional recogni-tion of social diversity and equal opportunities for all employees in the Group, irrespective of their nationality, gender, religious and political convictions, sexual orientation, age and any disability they may have.
Diversity represents not only an enrichment of the corporate culture but also a clear success factor in international competition. This culture of diversity at HUGO BOSS has already gained the Company several awards from the “Great Place to Work” Institute. HUGO BOSS also emphasized the high priority given to diversity within the Group by joining the UN Diversity Charter in 2008. — Employees, p. 78
eNviroNMeNtThe Group respects the conservation of species and therefore supports the preservation of biodiver-sity. Animal breeding and rearing methods that are not appropriate for the species in question are consequently rejected. Furthermore, for several years the Group has been reducing the use of fur products in the collections. At present, less than 0.09% of the collection includes fur finishing. This is mostly used for appliqués and trimming on collars, hoods and sleeves.
The Company has also maintained an ongoing exchange with individual animal welfare and consumer organizations for many years. Particularly with regard to mulesing, HUGO BOSS has developed through these open dialogs and distances itself from this procedure. Mulesing refers to a painful surgical procedure chiefly used in Australia on Merino sheep to protect them from attack by aggressive species of fly. Although more animal friendly alternatives to this procedure do exist, they are currently still in the development stage. The Company has therefore resolved that wherever possible it will restrict its purchases of Merino wool to sources that can prove they do not use the procedure. With regard to knitwear, this is the case for over 70% of sources.
diversity and openness put into practice at huGo boss
promoting animal welfare and conservation
Notes AdditioNAlFiscAl YeAr

092
h u G o b o s s Annual Report 2011 Group MANAGeMeNt report – Group proFile
Sustainability
Since 2008, environmental data such as greenhouse gases, waste and water consumption have been collected and analyzed in accordance with the guidelines of the internationally recognized Global Reporting Initiative (GRI). The results are used as a basis for optimizing overall logistics in order to increasingly rely on more environmentally friendly ferry services or ocean freight. The idea of “eco-efficiency” – defined by the World Business Council for Sustainable Development (WBCSD) as ”creating more value with less impact” – represents the foundation for new logistics concepts.
Through continuous improvements in the Company’s own operating sites, energy efficiency has been steadily improved over recent years. In the HUGO BOSS plant in Izmir, Turkey, the average energy requirement per item of clothing produced has been cut by more than 32% as against 2004, thereby sustainably reducing greenhouse gas emissions.
Another example of the integration of environmental considerations is the most recent office buildings in Metzingen and in Switzerland. By means of “intelligent” architecture and building tech-nology, energy consumption can be kept as low as possible here. Furthermore, part of the electricity used for the office buildings and warehouses is certified environmentally friendly electricity. This electricity is taken from neither nuclear power stations nor coal or oil-fired power stations and is obtained entirely from ecological energy sources.
sociAl coMMitMeNtUNICEF and HUGO BOSS are united by a longtime partnership. The Company has successfully supported UNICEF’s “Schools for Africa” initiative for many years. This year the BOSS Orange campaign “Today. To help. Together.” made an additional contribution.
HUGO BOSS is likewise dedicated to taking action for children and young people in India together with the children’s rights organization Save the Children e.V., giving them the opportunity to have an education.
Furthermore, the Company gets involved in times of crisis when rapid assistance is required, like recently after the devastating earthquake in Japan. HUGO BOSS also works for children and young people at a national level and since 2011 has been a permanent partner in the Off Road Kids founda-tion, a nationwide charity for street children in Germany.
In addition, HUGO BOSS and the employees at the Group headquarters are closely associated with the Metzingen location. Together with the Works Council, they have donated cash and goods in support of over 100 non-profit regional projects and medical, social and charitable institutions. For example, for many years there have been close ties with the Tübingen children’s cancer ward and the Red Cross.
continuous improve-ments in climate
protection
huGo boss takes action worldwide for
children and young people

GROUP MANAGEMENT REPORT— THE FISCAL YEAR —
03
the FiscAl YeAr Notes AdditioNAl


095
h u G o b o s s Annual Report 2011 Contents
097 Group Sales and Results of Operations111 Profit Development of the Business Segments116 Net Assets and Financial Position128 Overall Statement on the Economic Situation129 Compensation for the Managing and Supervisory Boards130 Special Legal Disclosures133 Report on Risks and Opportunities151 Subsequent Events and Outlook
CONTENTS03 Group MANAGeMeNt report –
the FiscAl YeAr
Notes AdditioNAl

096
h u G o b o s s Annual Report 2011
keY FiNANciAl FiGure 2011
22/01 — sales (in EUR million)
22/03 — Net income (in EUR million)
22/05 — Free cash flow (in EUR million)
22/02 — ebitdA before special items (in EUR million)
22/04 — trade net working capital (in EUR million)
22/06 — capital expenditure (in EUR million)
2,058.8
291.0
193.3
469.0
407.3
108.5
1,729.4
189.2
246.3
349.8
322.7
55.6
2011
2011
2011
2011
20112010
2010
2010
20112010
2010
2010
+19%
+54%
–22%
+34%
+26%
+95%

097
Group Sales and Results of Operations h u G o b o s s Annual Report 2011
Group sAles ANd results oF operAtioNs
the huGo boss Group once again achieved new records in sales and consolidated net income in the past fiscal year. in particular, it succeeded in outperforming the positive growth of the premium and luxury goods industry in 2011. huGo boss thus recorded considerable growth in all regions and distribution channels and with all brands. ebitdA before special items increased by 34% year-on-year to eur 469 million (2010: eur 350 million). the positive business development was driven in particular by the strong growth in the Group’s own retail business, a consistent pricing strategy, and efficiency improvement in key business processes.
GeNerAl ecoNoMic situAtioNThe recovery of the global economy that began in the previous year continued at the beginning of 2011, although political turbulence in the Middle East and the severe earthquake in Japan in the first quarter of 2011 created uncertainty throughout the world. Global economic growth then slowed towards the end of the first half of 2011 due to high levels of sovereign debt in Europe and the U.S. The situation intensified in the second half of the year, primarily due to the debt crisis in the euro zone spreading to larger countries on the periphery such as Italy and Spain.
After moderate growth in the first half of the year, business climate indicators for the euro zoNe
continued to deteriorate in the second half because of increasing uncertainty concerning the financial stability of Greece, Spain, Portugal and Italy in particular. Bond purchases by the European Central Bank (ECB) and cuts in the key interest rate were unable to sustainably reduce the refinancing costs of the countries concerned. In addition to the programs to consolidate government budgets, the economy was burdened by a decline in consumer confidence and restrained corporate investments. In Germany, the economy developed better than average due to companies’ robust investment and export activities and increasing private consumption. However, here too the pace of growth slowed over the course of the year.
The economy in the u.s. could not be revived sustainably last year. In the second half of the year in particular, the mood deteriorated as a result of the European debt crisis and the disagreement in U.S. politics concerning possible austerity measures to reduce U.S. sovereign debt. The announcement of a zero interest rate policy by the Federal Reserve was unable to achieve the desired revival in the economy. Economic activity was slowed down most notably by continued high unemployment, the persistently weak real estate sector and high levels of debt among private households. Only towards the end of the year could signs of an upturn in the U.S. economy be observed. Economic growth in the ceNtrAl ANd lAtiN AMericA region cooled in the past months due to decreasing export activities in the U.S. and the euro zone. The fact that the region nonetheless reported growth was due to increasing domestic demand and capital expenditure.
debt crisis negatively impacts global economic growth
Austerity measures curb growth in the euro zone
high unemployment and private debt burden American economy
Notes AdditioNAl

098
h u G o b o s s Annual Report 2011 Group MANAGeMeNt report – the FiscAl YeAr
Group Sales and Results of Operations
The economy in AsiA continued to develop much more strongly than in the rest of the world. In the second half of the year, however, growth moderated in some national economies in the region as a result of decreasing export activities, restrained investment and more restrictive lending by banks. A decline in domestic and international consumer demand, falling property prices and restrictive lending led to fears of a slowdown of the Chinese economy in particular. Following the severe earth-quake, the Japanese economy stabilized over the rest of the year but also suffered from the decline in demand for exports from the western industrialized countries and the weak rise in domestic demand.
sector perForMANceIn the premium and luxury goods industry, the positive development in 2010 continued in the past fiscal year. Growth rates in the sector were considerably higher than those for the economy as a whole. The luxury goods industry was thus able to elude the negative effects of the global decline in consumer confidence and rising sourcing and labor costs. Assuming constant exchange rates, industry experts expect global sales of high-end textiles, accessories, leather goods, shoes, jewelry, watches, perfume and cosmetics to increase by approximately 13% in 2011.
The development of the premium and luxury goods market differed depending on the individual product category. Watches, jewelry and accessories reported the strongest sales growth with double-digit growth rates. The apparel segment relevant to the HUGO BOSS Group as a basis for comparison saw high single-digit growth, with both menswear and womenswear seeing increases.
In europe, increased sales in the premium and luxury goods industry benefited, in particular, from positive momentum in Russia and Eastern Europe, where growing consumer confidence boosted retail sales. The situation also stabilized as compared to the previous years in Southern European markets. By contrast, the industry’s performance was mixed in Western European core markets. Although increasing demand from tourists supported the sales development, the euro crisis and the turbulence on the financial markets impaired consumer confidence. Whereas German retail developed positively, consumer confidence in the UK deteriorated further in the course of the year as a result of public sector austerity measures and continued high inflation. Overall, the European market for luxury goods grew by around 10% in 2011.
In AMericA, the premium and luxury segment in retail recorded a stronger-than-average perfor-mance, thus decoupling from the general economic development. Private consumption in the U.S. increased slightly in the past months, with growth in the sector also being boosted by tourism. In Latin America, growth was supported most notably by a positive development in Brazil. As a result, more and more luxury goods suppliers expanded their presence in this market. The increase in sales in the premium and luxury goods sector in the Americas amounted to around 12% in 2011.
Asia sees much stronger growth than rest of the
world despite slight slowdown
premium and luxury goods industry
performed better than market as a whole
strong momentum in russia and eastern
europe
sector stands apart from overall economy
in America

099
Group Sales and Results of Operations H U G O B O S S Annual Report 2011
In the ASIA/PACIFIC region, sales in the premium and luxury goods sector rose by just under 30%. The Chinese luxury goods market continued to demonstrate strong organic growth, with sales here posting a higher-than-average increase. In China, the sector is benefiting from the constantly growing middle class with increasing disposable income and from the strong appeal of European premium and luxury brands in particular. The supply of retail space in this market increased further because of sustained strong demand. The Japanese market – one of the world’s most important single markets for the luxury goods industry – declined significantly in the immediate aftermath of the severe earthquake in March 2011, but recovered more substantially than expected over the remaining course of the reporting period. — Subsequent Events and Outlook, p. 152
SAleS PerFOrmAnCeOverall statement on business developmentThe HUGO BOSS Group once again achieved new records in sales and consolidated net income and outperformed significantly the positive growth of the premium and luxury goods industry in fiscal year 2011. HUGO BOSS thus recorded considerable growth in all regions and distribution channels and with all brands. The positive business development was driven in particular by the strong growth in the Group’s own retail business, a consistent pricing strategy, and efficiency improvement in key business processes.
Sales development
23/01 — Sales development (in EUR million)
2011
2010
2009
2008
2007
2,058.8
1,729.4
1,561.9
1,686.1
1,632.0
Growing middle class supports growth in Asia
HUGO BOSS sets new records for sales and consolidated earnings in 2011
nOteS AddItIOnAl

100
h u G o b o s s Annual Report 2011 Group MANAGeMeNt report – the FiscAl YeAr
Group Sales and Results of Operations
HUGO BOSS’ Group sAles amounted to EUR 2,059 million in fiscal year 2011, which meant that sales in the Group currency were up 19% on the previous year’s level (2010: EUR 1,729 million). Currency fluctuations did not have any impact on the development of Group sales in 2011. HUGO BOSS thus posted a 19% year-on-year sales increase in local currencies, too, in the past fiscal year.
23/02 — sales performance by quarter (in EUR million)
Q4/2011
Q4/2010
Q3/2011
Q3/2010
Q2/2011
Q2/2010
Q1/2011
Q1/2010
499.3
422.4
615.0
538.0
405.3
324.8
539.2
444.2
The significant growth of HUGO BOSS in fiscal year 2011 is also reflected in the Group’s sAles
developMeNt duriNG the YeAr. HUGO BOSS started the year 2011 very successfully, with sales of EUR 539 million in the first quarter exceeding the previous year’s level by 21% (Q1 2010: EUR 444 million). The pace of growth was even increased further in the second quarter, when Group sales were up 25% year-on-year at EUR 405 million (Q2 2010: EUR 325 million). HUGO BOSS recorded double-digit growth in the third quarter, too, generating sales of EUR 615 million (2010: EUR 538 million). However, owing to the strong comparative period and the slowdown on some European markets in the second half of the year, the sales growth of 14% was not quite as high as in the two preceding quarters. Sales were increased further in the fourth quarter, not least as a result of the particularly strong development of the Group’s own retail business. At EUR 499 million, the fourth quarter sales exceeded those of the same quarter of the previous year by 18% (Q4 2010: EUR 422 million).
huGo boss increases sales by 19% in local
currencies
sales development during the year high-
lights growth path

101
Group Sales and Results of Operations h u G o b o s s Annual Report 2011
sales by region in EUR million
2011
2010
change in %
currency- adjusted
change in %
Europe 1 1,245.4 1,073.2 16 15
Americas 454.8 380.7 19 24
Asia/Pacific 309.3 230.4 34 34
Royalties 49.3 45.1 9 9
total 2,058.8 1,729.4 19 19
1 Inclusive Middle East/Africa.
HUGO BOSS generated double-digit sales growth in all three regions in fiscal year 2011. Sales in europe including the Middle East/Africa increased by 15% in local currencies in fiscal year 2011. In the reporting currency, they were up 16% year-on-year at EUR 1,245 million (2010: EUR 1,073 million). The AMericAs posted a sales increase of 24% in local currencies in the past fiscal year. In the reporting currency, sales increased by 19% year-on-year in this region to reach EUR 455 million (2010: EUR 381 million). Group sales in AsiA/pAciFic were up 34% year-on-year in local currencies. Sales in the reporting currency were also up 34% year-on-year at EUR 309 million in the fiscal year 2011 (2010: EUR 230 million). The joint venture for the Chinese market contributed to this with additional sales of EUR 28 million. — Profit Development of the Business Segments, p. 111
Royalties 3
Asia/Pacific 13
Americas 22
61
15
22
2
23/03 — sales by region (in %)
Europe 62
20112010
double-digit sales growth in all regions
Notes AdditioNAl

102
h u G o b o s s Annual Report 2011 Group MANAGeMeNt report – the FiscAl YeAr
Group Sales and Results of Operations
sales by distribution channel in EUR million
2011
2010
change in %
currency- adjusted
change in %
Wholesale 1,085.3 993.2 9 9
Group‘s own retail business 924.2 691.1 34 35
Directly Operated Stores 617.7 447.7 38 39
Outlet 273.6 223.7 22 24
Online 32.9 19.7 67 68
Royalties 49.3 45.1 9 9
total 2,058.8 1,729.4 19 19
in EUR million 2011 2010 2009 2008 2007
Wholesale 1,085.3 993.2 1,007.9 1,183.3 1,167.0
Group‘s own retail business 924.2 691.1 510.3 455.8 416.1
Directly Operated Stores 617.7 447.7 303.5 268.6 239.3
Outlet 273.6 223.7 199.1 186.7 176.8
Online 32.9 19.7 7.7 0.5 –
Royalties 49.3 45.1 43.7 47.0 48.9
total 2,058.8 1,729.4 1,561.9 1,686.1 1,632.0
In the wholesAle chANNel, there was a 9% increase in sales in local currencies as well as in Group currency in fiscal year 2011, with sales amounting to EUR 1,085 million (2010: EUR 993 million).The acquisition of stores previously operated by franchisees, particularly in China and Great Britain, also caused a shift in sales from wholesale business to the Group’s own retail. However, this was considerably more than offset by the perceptible recovery in pre-order volumes and the trend in replenishment, with which HUGO BOSS can react to short-term surges in demand from trading partners. The share of the wholesale channel in Group sales decreased from 57% in the previous year to 53% in the reporting period.
Royalties 3
Group‘s own retail business 40
53
45
2
23/04 — sales by distribution channel (in %)
Wholesale 57
20112010
positive sales development in the wholesale channel

103
Group Sales and Results of Operations h u G o b o s s Annual Report 2011
As in the previous years, the Group’s owN retAil busiNess was the major growth driver in fiscal year 2011. The expansion of this distribution channel driven forward with new openings and acquisi-tions of franchise stores, as well as the consistently sustained professionalization of the existing store network, made a decisive contribution to the Group’s positive overall performance in 2011. Sales in the Group’s own retail stores including outlets and online stores increased by 34% in the reporting period to reach EUR 924 million (2010: EUR 691 million). This is equivalent to a 35% increase in sales after adjustment for currency effects. Sales from the Group’s own retail business therefore amounted to 45% of total sales (2010: 40%). — www.hugoboss.com / Store Locator
sales by retail formatSales from directlY operAted retAil stores (dos) were increased by 38% (by 39% after adjust-ment for currency effects) to EUR 618 million (2010: EUR 448 million) in the past fiscal year. On a like-for-like basis, sales increased by 8% year-on-year both in the reporting currency and in local currency.
With sales growth of 22% in the reporting currency to EUR 274 million, outlet stores also contrib-uted to the positive development of sales in the retail channel in fiscal year 2011 (2010: EUR 224 million). Adjusted for currency effects, this equals an increase of 24%.
The international oNliNe retAil Activities are becoming increasingly important. Sales generated from the online stores in Germany, the Netherlands, France, Great Britain, Austria and the U.S. increased by 67% to EUR 33 million in fiscal year 2011 (2010: EUR 20 million). In local currencies, this equals an increase of 68%.
Number of Group’s own retail storesIn fiscal year 2011, the total number of the Group’s owN retAil stores increased by 85 in net terms as compared to the previous year, amounting to 622 (December 31, 2010: 537).
24/01 — Number of Group’s own retail stores
2011
2010
2009
2008
2007
622
537
438
390
333
The Group’s global presence was expanded by 80 new locations and the acquisition of 34 franchise stores, making 114 additional locations in total. The majority of the new openings and acquisitions related to directlY operAted FreestANdiNG stores iNcludiNG outlets. The number of these increased by 83 in net terms to their current level of 359 in fiscal year 2011. The new opening of 23 shop-iN-shop uNits was offset by 21 closures. At the end of the year, the number of shop-in-shop units therefore amounted to 263. In fiscal year 2011, 29 locations were closed as part of the ongoing improvement of the Group’s own retail network.
Group’s own retail business remains major sales driver
Group’s own retail network grows by 85 stores in net terms in 2011
Notes AdditioNAl

104
h u G o b o s s Annual Report 2011 Group MANAGeMeNt report – the FiscAl YeAr
Group Sales and Results of Operations
Asia/Pacific 171
Americas 113
310 (+ 57)
124 (+ 11)
188 (+ 17)
24/02 — Number of Group’s own retail stores by region
Europe 253
20112010
The Group’s own retail network in europe in particular was expanded with 43 new stores and 26 franchise acquisitions. This includes the acquisition of 15 HUGO BOSS monobrand stores from the franchisee Moss Bros in Great Britain and the acquisition of five Ultimate Fashion franchise stores in Poland. The Group also further raised its market presence in this region by opening eleven stores in Great Britain, eight in Spain and six additional sales areas in the Netherlands. Taking closures into account, there was a net increase of 57 stores in the Europe region.
The expansion of the store network in the AMericAs was stepped up in the past fiscal year by the opening of six HUGO BOSS stores in the U.S., five shop-in-shop units in Mexico and an additional location in Brazil. This was offset by the closure of one site in the U.S., resulting in a net expansion of eleven stores in the Americas year-on-year.
The retail network in the region AsiA/pAciFic was expanded by a total of 33 attractive locations through 25 new openings and eight franchise takeovers. In the process, the focus remained concen-trated on expansion in the growth market China. The new openings here included nine within the joint venture with the Rainbow Group. HUGO BOSS also acquired eight locations from the franchise partner Imaginex in China at the start of September. The situation on the Japanese market remained difficult, not least as a result of the earthquake, which is why twelve smaller shop-in-shop units in Japan were closed in fiscal year 2011. However, this was countered by the opening of five new stores on this market. After deducting the number of operations closed, the store network in the Asia/Pacific region expanded by 17 stores in net terms.
Taking into account the roughly 1,000 franchise stores and shops, the HUGO BOSS Group currently has a total of more than 1,600 monobrand stores and shops in over 80 countries. — Key
Locations/Global Market Presence, p. 104
New stores opened in all major european
markets
Group’s own retail network grows in
America as well
expansion in china strengthens retail
network in Asia/pacific

105
Group Sales and Results of Operations h u G o b o s s Annual Report 2011
royalty salesThe royalty business developed positively in fiscal year 2011. Royalty sales concern license income from third parties. Products manufactured by partners include FrAGrANces, eYeweAr, wAtches, chil-
dreN’s FAshioN, MotorcYcle helMets, Mobile phoNes, Mobile Accessories ANd hoMe textiles. External sales with outside licensees increased by 9% as against the previous year to EUR 49 million (2010: EUR 45 million).
Total brANd sAles of HUGO BOSS products worldwide in fiscal year 2011 amounted to EUR 2,564 million (2010: EUR 2,189 million). This figure is based upon HUGO BOSS Group sales minus royalty income and plus sales by HUGO BOSS license partners.
sales by brand
BOSS Green 5BOSS Selection 3
BOSS Orange 15
BOSS Black 68
9
3
14
67
7
25 — sales by brand (in %)
HUGO 9
20112010
HUGO BOSS posted sales increases with all brands in fiscal year 2011. A sales increase of 17% compared to the previous year was achieved in the core brANd boss blAck. Successful brand initia-tives to reposition the luxurY brANd boss selectioN and the cAsuAlweAr brANd boss orANGe
led to sales growth of 43% and 12% respectively compared to the previous year. The preMiuM
sportsweAr brANd boss GreeN also saw further increases in the past fiscal year, recording a 50% growth rate as against the previous year. Sales of the treNdY brANd huGo were up 19% on previous year’s figure.
At 11%, the share of total sales accounted for by woMeNsweAr was only slightly lower than the previous year’s level (2010: 12%). Considerable sales increases were achieved in fiscal year 2011 with all four brands, whose product range encompasses a separate womenswear collection.
royalty business grows by 9% in 2011
sales increases with all brands
Notes AdditioNAl

106
h u G o b o s s Annual Report 2011 Group MANAGeMeNt report – the FiscAl YeAr
Group Sales and Results of Operations
developMeNt oF order situAtioNHUGO BOSS’ business model has changed significantly in recent years. Instead of the pre-order business that dominated in the past, business is increasingly driven by the share of sales achieved either through the Group’s own retail business or from replenishment. Ongoing integration processes along the entire value chain, the gradual reduction in complexity and the continuous market-oriented development of the brand and collection portfolio are necessary in order to meet customers’ changing requirements.
Today, HUGO BOSS provides four up-to-date fashion collections a year for its customers all over the world, and is increasing the number of monthly theme-oriented deliveries. The shAre oF trAdi-
tioNAl pre-order busiNess, i.e. selling pre-ordered goods to trading partners, decreased to 43% of sales in the past fiscal year (2010: 46%). In contrast, classic HUGO BOSS products in particular can now be replenished flexibly. In order to continue ensuring planable production conditions in the light of the changes in distribution, HUGO BOSS does not purely depend on order figures, but also increasingly includes information from the distribution companies and the Group’s own retail stores in its volume planning.
share of pre-order business amounts to
43% of total sales

107
Group Sales and Results of Operations h u G o b o s s Annual Report 2011
eArNiNGs perForMANce
income statement
in EUR million
2011
in % of sales
2010
in % of sales
change in %
Net sales 2,058.8 100.0 1,729.4 100.0 19
Cost of sales (756.5) (36.7) (661.8) (38.3) (14)
Direct selling expenses (37.5) (1.8) (40.5) (2.3) 7
Gross profit 1,264.8 61.4 1,027.2 59.4 23
Selling and distribution expenses
(682.1)
(33.1)
(574.4)
(33.2)
(19)
Administration costs and other operating income/expenses
(188.6)
(9.2)
(188.8)
(10.9)
0
operating income (ebit) 394.1 19.1 263.9 15.3 49
Net interest income/expense (16.2) (0.8) (17.3) (1.0) 6
Other financial items 4.5 0.2 2.5 0.1 80
Net financial result (11.7) (0.6) (14.8) (0.9) 21
earnings before taxes 382.4 18.6 249.2 14.4 53
Income taxes (91.4) (4.4) (59.9) (3.5) (53)
Net income 291.0 14.1 189.2 10.9 54
Attributable to:
Equity holders of the parent company
284.5
13.8
185.9
10.7
53
Minority interests 6.5 0.3 3.3 0.2 94
Net income 291.0 14.1 189.2 10.9 54
per share (eur) 1
Common share 4.12 2.69 53
Preferred share 4.13 2.70 53
ebitdA 467.5 22.7 336.1 19.4 39
Special items (1.5) (0.1) (13.7) (0.8)
ebitdA before special items 469.0 22.8 349.8 20.2 34
income tax rate in % 24 24
1 Basic and diluted earnings per share.
Notes AdditioNAl

108
h u G o b o s s Annual Report 2011 Group MANAGeMeNt report – the FiscAl YeAr
Group Sales and Results of Operations
Notes to the income statement
26 — Gross profit margin (in %)
2011
2010
2009
2008
2007
61.4
59.4
54.2
52.8
51.8
Gross proFit increased by 23% to EUR 1,265 million in fiscal year 2011 (2010: EUR 1,027 million). Thus, the Gross proFit MArGiN was increased by 200 basis points to 61.4% (2010: 59.4%). Since the Group’s own retail business generates a higher gross profit margin, the above-average sales growth in this distribution channel supported the positive development of this key figure. In addition, the consistent enforcement of the pricing strategy in the Group’s own retail business, i.e. the higher share of sales at full price, contributed to the margin improvement.
At EUR 682 million, selliNG ANd distributioN expeNses in fiscal year 2011 were 19% higher than the previous year’s figure of EUR 574 million. Particularly as a result of the global expansion of the Group’s own retail business, distribution expenses increased by EUR 69 million in the past fiscal year. These costs include the additional expenses for 85 net new locations which were opened in fiscal year 2011 in line with the global expansion of this distribution channel. In the reporting period, marketing expenses were up EUR 31 million on the previous year’s figure. A major part of this related to sport sponsorship activities, for example, in connection with the 30th anniversary of the partnership between HUGO BOSS and McLaren, and the partnership concluded at the beginning of the year with Martin Kaymer, who was the No. 1 in the golf world rankings for part of 2011. Marketing expenses as a percentage of sales were at 6% (2010: 5%). The consolidation and optimization of global warehousing capacity contributed to the fact that the increase in logistics expenses in fiscal year 2011 was lower than the increase in sales. Allowances for doubtful accounts and bad debts only played a minor role in fiscal year 2011 due to the continuing consistent management of receivables.
At EUR 189 million in fiscal year 2011, AdMiNistrAtive costs ANd the bAlANce oF other operAtiNG
iNcoMe ANd expeNses were at the previous year’s level (2010: EUR 189 million). At 6%, adminis-trative costs as a percentage of sales were below the previous year’s level (2010: 7%) and were up EUR 5 million year-on-year in absolute terms. The research and development costs incurred in creating the collections were equivalent to 3% of sales and were thus at the previous year’s level. In absolute terms, they increased by EUR 8 million to EUR 55 million (2010: EUR 47 million). Special items played a minor role overall at EUR 1 million (2010: EUR 14 million). This year’s special items related to the structural reorientation of individual markets.
increase in the gross profit margin to 61.4%
expansion of the Group’s own retail
leads to higher distri-bution expenses
decrease in admin-istrative costs as a
percentage of sales

109
Group Sales and Results of Operations h u G o b o s s Annual Report 2011
27/01 — Adjusted ebitdA margin (in %)
2011
2010
2009
2008
2007
22.8
20.2
17.1
16.2
16.8
27/02 — ebitdA before special items by quarter (in EUR million)
Q4/2011
Q4/2010
Q3/2011
Q3/2010
Q2/2011
Q2/2010
Q1/2011
Q1/2010
96.9
76.8
177.1
149.8
63.4
31.4
131.6
91.8
The internal performance indicator ebitdA beFore speciAl iteMs increased by 34% year-on-year to EUR 469 million (2010: EUR 350 million). At 22.8%, the adjusted EBITDA margin improved by 260 basis points in comparison to the previous year (2010: 20.2%).
At EUR 73 million, depreciAtioN increased by 1% as compared to the previous year’s level (2010: EUR 72 million).
operAtiNG iNcoMe (ebit) increased by 49% to EUR 394 million in fiscal year 2011 (2010: EUR 264 million). Higher selling and distribution expenses were overcompensated by the positive sales development in the retail channel as well as the improvement in the gross profit margin.
The FiNANciAl result increased by EUR 3 million to EUR –12 million in fiscal year 2011 (2010: EUR –15 million). The slight increase in interest expenses resulting from higher interest rates was overcompensated by higher interest income from investing cash and cash equivalents, which led to Net iNterest expeNse (interest income less interest expense) of EUR –16 million (2010: EUR –17 million). The partial repayment of the syndicated loan did not have any material impact on the devel-opment of net interest expense. Lower interest expenses were virtually neutralized by a decline in interest income. Other financial items improved to EUR 4 million (2010: EUR 2 million). This includes currency effects that were limited by targeted hedging measures implemented at an early stage. The result from currency effects amounted to EUR +5 million (2010: EUR +7 million).
Adjusted ebitdA margin increases to 22.8%
Notes AdditioNAl

110
h u G o b o s s Annual Report 2011 Group MANAGeMeNt report – the FiscAl YeAr
Group Sales and Results of Operations
eArNiNGs beFore tAxes thus increased by 53% to EUR 382 million (2010: EUR 249 million). At 24%, the tAx rAte was at the previous year’s level (2010: 24%). Changes in the regional earnings mix resulting from differences in regional earnings growth had a neutral effect on the Group’s tax rate in fiscal year 2011.
At EUR 291 million, Net iNcoMe increased by 54% in fiscal year 2011 as compared to the previous year’s level (2010: EUR 189 million). Net income attributable to equity holders amounted to EUR 284 million, 53% higher than the previous year’s figure (2010: EUR 186 million). Minority interests increased to EUR 7 million in the period (2010: EUR 3 million) and primarily related to the 40% share of the Rainbow Group in the joint venture companies in China.
28/01 — earnings per common share (in EUR)
2011
2010
2009
2008
2007
4.12
2.69
1.50
1.62
2.22
28/02 — earnings per preferred share (in EUR)
2011
2010
2009
2008
2007
4.13
2.70
1.51
1.63
2.24
eArNiNGs per shAre increased by 53% year-on-year to EUR 4.12 (2010: EUR 2.69) for the coMMoN
shAres, and also by 53% year-on-year to EUR 4.13 for the preFerred shAres (2010: EUR 2.70).
dividend payout and appropriation of profitsHUGO BOSS AG closed fiscal year 2011 with net income of EUR 88 million (2010: EUR 49 million). The distributable profit after the transfer from net earnings amounted to EUR 203 million (2010: EUR 143 million). In view of a proFit-orieNted distributioN policY, the Managing Board and Supervi-sory Board will recommend to the Annual Shareholders’ Meeting that a divideNd oF eur 2.88 (2010:
eur 2.02) be pAid per coMMoN shAre ANd eur 2.89 (2010: eur 2.03) per preFerred shAre for fiscal year 2011. This corresponds to an amount of EUR 199 million (2010: EUR 140 million). A recommendation will also be made to the Annual Shareholders’ Meeting for the dividend amount attributable to own shares of EUR 4 million to be carried forward (2010: EUR 3 million).
tax rate of 24% at previous year’s level
significant increase in net income

111
Profit Development of the Business Segments h u G o b o s s Annual Report 2011
proFit developMeNt oF the busiNess seGMeNts
huGo boss recorded significant sales growth in all four segments in 2011. At the same time, above-average profitability increases were also achieved in all segments.
chANGes iN preseNtAtioN: AdJustMeNt to seGMeNt reportiNGThe Managing Board of HUGO BOSS AG decided to adjust the presentation of segment reporting compared to the previous year. This adjustment was effective for the first time in the report on the first quarter of fiscal year 2011.
HUGO BOSS has set itself the goal of significantly increasing sales and profit through organic growth in the coming years. The sales regions will be managed on the basis of their value added at Group level in future.
The distribution companies purchase all HUGO BOSS products on the basis of intercompany supply relationships at market prices from the respective HUGO BOSS sourcing units. To assess the profit-ability and value added contribution of the sales regions Europe, Americas and Asia/Pacific at Group level, the margins generated by all Group companies involved in the supply chain will be taken into account in future. This approach is based on the assumption that each individual sales segment is autonomous and leads to the complete elimination of transactions between segments. As a result, the gross profit margin generated at the level of sourcing units will be allocated to the respective distribution company. Earnings by operating segment are now defined as EBITDA before special items of the respective distribution company plus the gross profit margin of the sourcing units and intercompany royalty sales.
This change in presentation means that operating income is no longer allocated to the previously reportable Corporate Center segment as the Group-wide bundling of all central functions. Rather, the bundling of the remaining expenses of the sourcing, production, research and development units now constitutes an operating cost center which it would not be appropriate to allocate directly to the sales regions.
Royalty transactions with external license partners and directly attributable expenses for license management will continue to be presented in the reportable royalties segment. However, internal license income will no longer be taken into consideration as a consequence of it being allocated to the sales regions. Expenses for the global marketing of HUGO BOSS products will no longer be allocated directly to the royalties segment either.
All expenses that are not directly attributable to the sales regions or the royalties segment are recognized in the reconciliation item Corporate units/Consolidation.
To allow the profit development of the segments to be compared over time, the presentation was also adjusted retroactively for the previous year to match the presentation in the reporting period. The Group refrained from additional presentation of past fiscal years on account of the dispropor-tionate effort involved.
Notes AdditioNAl

112
h u G o b o s s Annual Report 2011 Group MANAGeMeNt report – the FiscAl YeAr
Profit Development of the Business Segments
Sales in europe including the Middle East/Africa increased by 15% in local currencies in fiscal year 2011. In the reporting currency, they were up 16% year-on-year at EUR 1,245 million (2010: EUR 1,073 million).Sales increases were posted in all relevant European markets in the past fiscal year. At EUR 378 million, sales in GerMANY were up 17% on the previous year’s level (2010: EUR 324 million). In GreAt
britAiN, sales increased by 41% year-on-year in local currency. Amounting to EUR 156 million, sales in Group currency were 39% higher than in the previous year (2010: EUR 112 million). The takeover of 15 HUGO BOSS monobrand stores of franchisee Moss Bros effective April 1, 2011 contributed to this with an impact on sales of EUR 18 million. In the beNelux couNtries, sales were up 10% on the previous year’s level at EUR 149 million (2010: EUR 136 million). In FrANce, sales increased by 7% compared with the previous year to EUR 140 million (2010: EUR 131 million). Sales in southern European markets also developed positively. For instance, sales on the iberiAN peNiNsulA increased by 21% to EUR 80 million (2010: EUR 66 million). Business in itAlY also developed better than average, achieving a sales increase of 19% to EUR 45 million in the reporting period (2010: EUR 37 million). HUGO BOSS also posted significantly higher sales in the markets of scANdiNAviA and
eAsterN europe, with particularly strong growth of 17% to EUR 78 million in Eastern Europe (2010: EUR 66 million). In switzerlANd, sales in the Group currency increased by 8% to EUR 46 million (2010: EUR 43 million). Adjusted for currency effects, however, there was a 4% decline in sales due to changed consumer behavior as a result of the substantial appreciation of the Swiss franc against the euro.In the Europe region, sales in the Group’s owN retAil busiNess amounted to EUR 483 million (2010: EUR 373 million), whereas sales of EUR 762 million were generated with wholesAle customers (2010: EUR 700 million).
29/03 — earnings development europe
486.3
393.9
20112010
39.0%36.7%in % of sales
20112010
in EUR million
2011
2010
2009
2008
2007
1,245.4
1,073.2
1,041.3
1,170.0
1,151.1
29/02 — share in sales – europe 2011 (2010)29/01 — sales – europe (in EUR million)
other 35% (35)
Germany
benelux
France
Great britain
30% (30)12% (13)
11% (12)
12% (10)
europe

113
Profit Development of the Business Segments h u G o b o s s Annual Report 2011
The segment profit of EUR 486 million in Europe was 23% higher than the previous year’s level of EUR 394 million. In addition to the positive sales development, this increase in profit is also attribut-able to an improvement in the gross profit margin, which was positively influenced in particular by a consistent pricing strategy and the increase in the share of retail business. Furthermore, a lower-than-average increase in fixed costs also contributed to the improvement in the segment’s profit-ability. At 39.0%, the adjusted EBITDA margin therefore improved by 230 basis points in comparison to the previous year (2010: 36.7%).
AMericAs
The AMericAs posted a sales increase of 24% in local currencies in the past fiscal year. In the reporting currency, sales increased by 19% year-on-year in this region to reach EUR 455 million (2010: EUR 381 million). In particular, an increase in sales of 30% in the local currency was achieved in the u.s. at EUR 349 million in the reporting currency, sales increased by 24% there and significantly exceeded the previous year’s figure (2010: EUR 283 million). Double-digit growth rates were achieved both in the wholesale channel and in sales from the Group’s own retail stores. In addition to a sales increase at existing own retail locations, additional sales were also generated through targeted new openings of own retail stores.In both local currency and the reporting currency, sales in cANAdA were up 4% on the previous year’s level, increasing to EUR 66 million (2010: EUR 63 million). In ceNtrAl ANd south AMericA, an increase in sales of 18% in local currencies and 16% in Group currency to EUR 40 million was achieved (2010: EUR 35 million). This increase is due to the positive development of the existing own retail locations as well as targeted new openings in the Mexican and Brazilian markets.
Sales in the Group’s owN retAil busiNess amounted to EUR 205 million in the Americas region (previous year: EUR 161 million). In the wholesAle chANNel, sales of EUR 250 million were generated in the same period (2010: EUR 220 million).
2011
2010
2009
2008
2007
454.8
380.7
312.2
307.0
298.0
other 9% (9)
u.s.
77% (74)
canada
14% (17)
30/02 — share in sales – Americas 2011 (2010)30/01 — sales – Americas (in EUR million)
Notes AdditioNAl
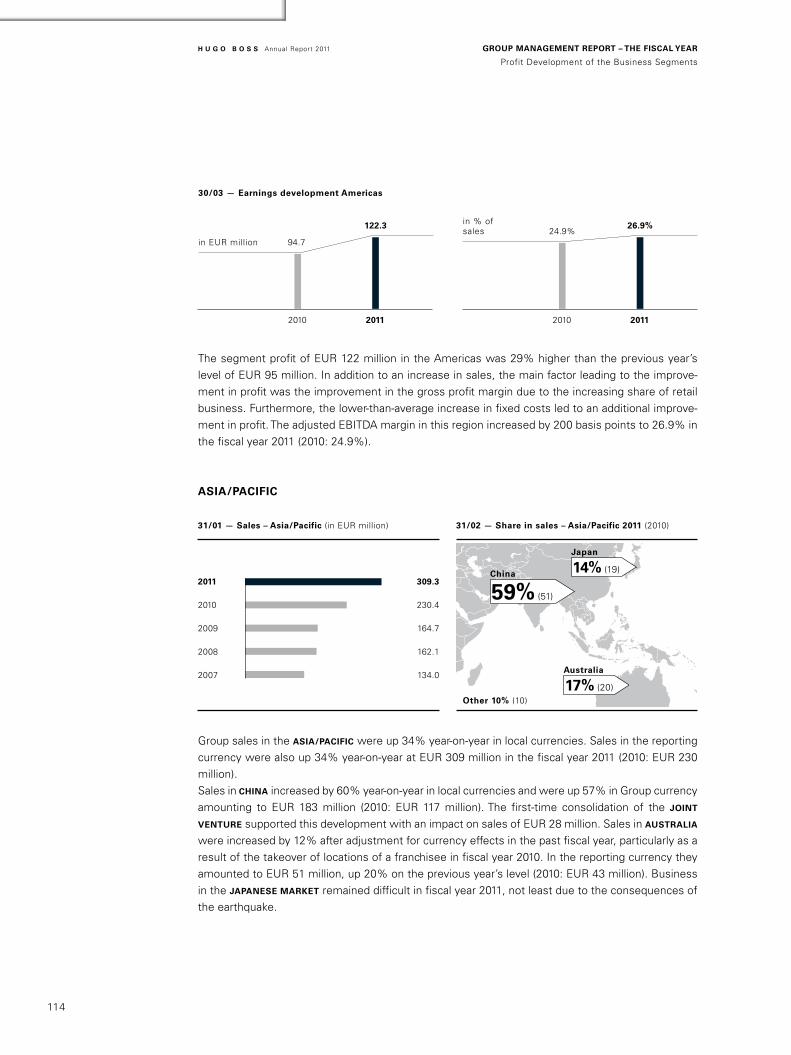
114
h u G o b o s s Annual Report 2011 Group MANAGeMeNt report – the FiscAl YeAr
Profit Development of the Business Segments
30/03 — earnings development Americas
122.3
94.7
20112010
26.9%24.9%
in % of sales
20112010
in EUR million
The segment profit of EUR 122 million in the Americas was 29% higher than the previous year’s level of EUR 95 million. In addition to an increase in sales, the main factor leading to the improve-ment in profit was the improvement in the gross profit margin due to the increasing share of retail business. Furthermore, the lower-than-average increase in fixed costs led to an additional improve-ment in profit. The adjusted EBITDA margin in this region increased by 200 basis points to 26.9% in the fiscal year 2011 (2010: 24.9%).
AsiA/pAciFic
Group sales in the AsiA/pAciFic were up 34% year-on-year in local currencies. Sales in the reporting currency were also up 34% year-on-year at EUR 309 million in the fiscal year 2011 (2010: EUR 230 million). Sales in chiNA increased by 60% year-on-year in local currencies and were up 57% in Group currency amounting to EUR 183 million (2010: EUR 117 million). The first-time consolidation of the JoiNt
veNture supported this development with an impact on sales of EUR 28 million. Sales in AustrAliA were increased by 12% after adjustment for currency effects in the past fiscal year, particularly as a result of the takeover of locations of a franchisee in fiscal year 2010. In the reporting currency they amounted to EUR 51 million, up 20% on the previous year’s level (2010: EUR 43 million). Business in the JApANese MArket remained difficult in fiscal year 2011, not least due to the consequences of the earthquake.
2011
2010
2009
2008
2007
309.3
230.4
164.7
162.1
134.0
other 10% (10)
china
59% (51)
Australia
17% (20)
Japan
14% (19)
31/02 — share in sales – Asia/pacific 2011 (2010)31/01 — sales – Asia/pacific (in EUR million)

115
Profit Development of the Business Segments h u G o b o s s Annual Report 2011
Driven by the joint venture and by further new openings, sales generated in the Group’s owN retAil
busiNess in the Asia/Pacific region climbed to EUR 236 million in fiscal year 2011 (2010: EUR 157 million). Despite the shift in sales from the wholesale channel to the Group’s own retail business as a result of takeovers, sales in the wholesale channel were slightly higher than the previous year’s level at EUR 74 million (2010: EUR 73 million).
31/03 — earnings development Asia/pacific
111.1
80.0
20112010
35.9%34.7%in % of sales
20112010
in EUR million
With sales increasing, segment profit in the Asia/Pacific region also increased by 39% from EUR 80 million in the previous year to EUR 111 million. The significant increase in the share of sales generated from the Group’s own retail stores contributed to an improvement in the gross profit margin. The adjusted EBITDA margin in this region therefore rose by 120 basis points year-on-year, reaching 35.9% in fiscal year 2011 (2010: 34.7%).
roYAlties
32/02 — earnings development – royalties32/01 — sales – royalties (in EUR million)
43.039.2
20112010
in EUR million2011
2010
2009
2008
2007
49.3
45.1
43.7
47.0
48.9
The roYAltY busiNess developed positively in fiscal year 2011. Royalty sales concern license income from third parties. Products manufactured by partners include fragrances, eyewear, watches, chil-dren’s fashion, motorcycle helmets, mobile phones, mobile accessories and home textiles. External sales with outside licensees increased by 9% as against the previous year to EUR 49 million (2010: EUR 45 million). Double-digit growth was achieved particularly in sales with licensees for eyewear, watches and children’s fashion.
The profit of EUR 43 million in the royalties segment was 10% higher than the previous year’s level of EUR 39 million.
Notes AdditioNAl

116
h u G o b o s s Annual Report 2011 Group MANAGeMeNt report – the FiscAl YeAr
Net Assets and Financial Position
Net Assets ANd FiNANciAl positioN
the structure of the statement of financial position continued to improve in fiscal 2011. the partial repayment of the syndicated loan reduced the share of financial liabilities significantly as of the end of the reporting period. by contrast, the share of equity expanded as a result of the positive business performance.
bAlANce sheet structure ANd keY bAlANce sheet rAtiosAs of the end of 2011, totAl Assets rose 7% to EUR 1,449 million (December 31, 2010: EUR 1,355 million). In particular, this change was due to an increase in property, plant and equipment and inventories as a result of the further expansion of the Group’s own retail operations. Cash and cash equivalents declined as a result of the partial repayment of the syndicated loan.
The eQuitY rAtio was up significantly year-on-year at 36% (December 31, 2010: 27%). — Consoli-
dated Balance Sheet, p. 162
Cash and cash equivalents 294.9
Financial liabilities 532.9
Other assets 158.4
Other liabilities 122.6
Inventories 377.3
Provisions and deferred taxes 150.7
Trade receivables 133.4
Trade payables 188.0
426.6 (+ 9%)
523.2 (+ 45%)
174.6 (+ 31%)
225.1 (+ 20%)
200.4 (– 32%)
388.5 (– 27%)
189.5 (+ 20%)
131.9 (+ 8%)
457.9 (+ 21%)
180.3 (+ 20%)
33 — balance sheet structure (in EUR million)
Property, plant and equipment and intangible assets 391.4
Shareholder‘s equity 361.2
2011
2011
1,449.0
1,449.0
2010
2010
1,355.4
1,355.4
Assets
liabilities
total assets climb to eur 1,449 million

117
Net Assets and Financial Position h u G o b o s s Annual Report 2011
The shAre oF curreNt Assets decreased slightly as against the previous year to 64% (December 31, 2010: 66%). Accordingly, the shAre oF NoN-curreNt Assets rose from 34% in the previous year to 36% as of December 31, 2011.
Meanwhile, the structure oF eQuitY ANd liAbilities changed significantly as against the previous year. The partial repayment of the syndicated loan reduced the share of financial liabilities from 39% in the previous year to 27%. By contrast, the share of equity expanded significantly. The positive earnings development also contributed towards an increase in the equity base.
Net AssetsUnder Assets, NoN-curreNt Assets climbed by 9% to EUR 427 million as of the end of the fiscal year (December 31, 2010: EUR 391 million). This was essentially due to the assets of EUR 13 million assumed in the acquisition of 15 HUGO BOSS monobrand stores from Moss Bross in Great Britain. Investments in the further expansion of the Group’s own retail network, the ongoing development of operating IT systems and the Metzingen location also added to the increase in this item.
34 — inventories (in EUR million)
2011
2010
2009
2008
2007
457.9
377.3
306.0
381.4
351.4
As of the end of fiscal year 2011, iNveNtories were up 21% at EUR 458 million (December 31,2010: EUR 377 million). Adjusted for exchange rate effects and the acquisition of the monobrand Moss Bros stores, Inventories rose by 17% year-on-year. A key factor in this increase was the change in delivery windows as a result of the Company-wide D.R.I.V.E. project. This growth also reflects the continued expansion of the Group’s own retail business. The average Days Inventory Outstanding (DIO) was up year-on-year as of the end of the past fiscal year.
rise in non-current assets due to acquisi-tion of Moss bros stores
increase in inventories essentially driven by expansion of own retail business
Notes AdditioNAl

118
h u G o b o s s Annual Report 2011 Group MANAGeMeNt report – the FiscAl YeAr
Net Assets and Financial Position
35 — trade receivables (in EUR million)
2011
2010
2009
2008
2007
174.6
133.4
140.1
201.0
171.3
trAde receivAbles rose 31% year-on-year to EUR 175 million (December 31, 2010: EUR 133 million). Adjusted for currency effects, this marks an increase of 33%. A key driver of this development was the Group-wide D.R.I.V.E. project, which also led to a change in the delivery cycles. As a result, delivery volumes were considerably higher than in the same periods of the previous year, especially in December. Thanks to the systematic monitoring of outstanding accounts and the associatied collection of receivables, the average Days Sales Outstanding (DSO) figure improved slightly as against the previous year.
other Assets rose by 20% year-on-year to EUR 190 million (December 31, 2010: EUR 158 million). This rise was predominantly due to the increase in deferred tax assets. — Notes to the Consoli-
dated Financial Statements, note no. 6, p. 191
cAsh ANd cAsh eQuivAleNts amounted to EUR 200 million as of the end of the reporting period (December 31, 2010: EUR 295 million). This reduction was essentially due to the partial repayment of the syndicated loan.
Under equity and liabilities, provisioNs ANd deFerred tAxes increased to EUR 180 million (December 31, 2010: EUR 151 million). This item includes provisions for pensions and other staff costs of EUR 76 million (December 31, 2010: EUR 73 million). It also contains other provisions totaling EUR 54 million (December 31, 2010: EUR 53 million) and deferred tax liabilities of EUR 50 million (December 31, 2010: EUR 25 million).
36 — trade payables (in EUR million)
2011
2010
2009
2008
2007
225.1
188.0
150.5
124.1
101.0
trAde pAYAbles were up 20% year-on-year at EUR 225 million (December 31, 2010: EUR 188 million). After currency adjustment, this marks a rise of 21%. The increase is essentially due to earlier sourcing of goods as part of the Company-wide D.R.I.V.E. project in order to meet the amended delivery windows in December of fiscal year 2011.
Further improvement in average days sales
outstanding
volume-driven increase in trade payables

119
Net Assets and Financial Position h u G o b o s s Annual Report 2011
As of the end of the reporting period, total curreNt ANd NoN-curreNt FiNANciAl liAbilities
declined by 27% to EUR 389 million (December 31, 2010: EUR 533 million). The decline is mostly due to the partial repayment of the syndicated loan in the amount of EUR 150 million. In addition to the set tranche of the syndicated loan, financial liabilities include negative fair values of interest and currency hedges totaling EUR 22 million (December 31, 2010: EUR 26 million) and the deferred outstanding purchase price payment for the acquisition of shares in joint ventures in China.
other liAbilities increased by 7% year-on-year to EUR 132 million (December 31, 2010: EUR 123 million). In addition to income tax liabilities, this item also includes the deferred liabilities from lease obligations for the Group’s retail stores and for outstanding wage and salary payments, overtime and vacation entitlement. — Notes to the Consolidated Financial Statements, note no. 26, p. 211
37 — trade net working capital (in % of sales)
29.728.5
27.224.6
22.720.9 19.9 19.2 19.1 19.3 19.6 19.9
30%
20%
10%
0%
Q1/2009 Q2/2009 Q3/2009 Q4/2009 Q1/2010 Q2/2010 Q3/2010 Q4/2010 Q1/2011 Q2/2011 Q3/2011 Q4/2011
trAde Net workiNG cApitAl is the HUGO BOSS Group’s key performance indicator for measuring the efficient use of capital. The only three components involved in calculating this figure are the operating figures for inventories, trade receivables and trade payables. — Group Management, p. 62
As against the previous year, trade net working capital rose by 26% to EUR 407 million (December 31, 2010: EUR 323 million). Here, the increase in trade payables partially offset the rise in inventories and trade receivables.
At 19.9% (previous year: 19.2%), the rolling twelve-month average of trAde Net workiNG cApitAl
As A perceNtAGe oF sAles was still close to the historic low as of March 31, 2011. The slight increase as of the end of the reporting period is essentially due to the transition to four collections as part of the Company-wide D.R.I.V.E. project and the associated postponements in the procurement and delivery of goods.
trade net working capital as percentage of sales still at low level
Notes AdditioNAl

120
h u G o b o s s Annual Report 2011 Group MANAGeMeNt report – the FiscAl YeAr
Net Assets and Financial Position
FiNANciAl positioNFinancial management and financing principlesThe most important objective of FiNANciAl MANAGeMeNt at HUGO BOSS is to minimize the Group’s financial expenses while at the same time ensuring sufficient liquidity reserves to meet payment obligations at all times and to be able to provide adequate liquidity for the Group’s ongoing growth. — Report on Risks and Opportunitites, Financing and Liquidity Risks, p. 138
The Group’s most important source of liquidity is cash provided by the operating activities of the individual Group companies. The basis for the liquidity forecast is three-year financial planning and supplementary liquidity planning on a rolling monthly basis with a one-year horizon, which is prepared by all Group companies through a central financial reporting system. Thus, the HUGO BOSS Group is able to monitor its financial status and the future development of cash and cash equivalents at all times and to derive controlling measures if so required.
In day-to-day liquidity management, efficient cAsh MANAGeMeNt sYsteMs are used to leverage excess liquidity at individual Group companies to cover the financial requirements of others (cash pooling). This internal offsetting reduces external financing requirements and thereby optimizes net interest expenses.
treasury responsibilities and functions The Group-wide liquidity management and monitoring of financial risks are bundled centrally in the Treasury Department of HUGO BOSS AG. GlobAl FiNANce MANAGeMeNt is based on Group-wide principles and guidelines. At subsidiary level, finance managers are responsible for compliance with Treasury principles.
A ceNtrAl FiNANciAl reportiNG sYsteM provides all HUGO BOSS Group companies with informa-tion on their daily financial status and the expected cash flows for the next twelve months. Liquidity management is still based on a three-year financial plan and a supplementary monthly liquidity plan for the Group as a whole.
The exterNAl FiNANciNG voluMe of the HUGO BOSS Group is primarily borrowed by HUGO BOSS International B.V. This largely covers the financing requirements of the Group companies. Other HUGO BOSS companies enter into external financing agreements only in indi-vidual cases, such as when the use of local credit and capital markets is economically advantageous. If the Group companies directly enter into external credit transactions, either HUGO BOSS AG or HUGO BOSS International B.V. submit guarantees or letters of comfort depending on requirements.

121
Net Assets and Financial Position h u G o b o s s Annual Report 2011
FinancingMarket capacity, financing costs, investor diversification, flexibility, credit terms and maturities are taken into account when selectiNG FiNANciNG iNstruMeNts. — Notes to the Consolidated Financial
Statements, note no. 25, p. 208 — Notes to the Consolidated Financial Statements, note no. 28, p. 212
The Group’s loNG-terM FiNANciAl FlexibilitY was guaranteed in fiscal 2008 by way of a syndicated loan of EUR 750 million with term of five years. In light of the positive development in cash and cash equivalents, this syndicated facility was restructured in order to reduce borrowing costs. The loan was reduced from EUR 750 million to EUR 450 million. It consists of a fixed tranche of EUR 300 million and a revolving tranche of EUR 150 million. As of the end of the reporting period, only the fixed portion of EUR 300 million had been utilized.In its capacity as an in-house bank, HUGO BOSS International B.V. provided these funds by means of matched maturity intercompany loans to Group companies with high financing requirements. These bullet loans were granted in the local currency of the respective distribution company. To hedge against the resulting foreign currency risk at HUGO BOSS International B.V., forward exchange contracts with appropriate terms were entered into for the key currencies.
To further ensure liquidity, the Group has bilateral credit lines with a total volume of EUR 88 million, EUR 51 million of which had been used as of December 31, 2011. In addition to the unutilized credit lines of EUR 187 million, the Group had cash and cash equivalents of EUR 200 million as of the end of the reporting period, of which EUR 115 million was invested in fixed deposit accounts with a term of up to three months.
Financing conditionsThe sYNdicAted loAN AGreeMeNt includes standard covenants requiring compliance with certain key indicators. In addition to minimum equity, these indicators include an interest cover ratio and a leverage ratio. The interest cover ratio is calculated as the ratio of EBITDA before special items before expenses in connection with the “Stock Appreciation Rights Program” to the net financial result. The leverage ratio is calculated as the ratio of net debt to operating earnings (EBITDA before special items) before expenses in connection with the “Stock Appreciation Rights Program”. — Notes to the Consolidated Financial Statements, note no. 25, p. 208
38 — total leverage1
2011
2010
2009
2008
2007
0.3
0.6
1.4
2.1
0.6
1 Net financial liability/EBITDA before special items and expenses for the „Stock Appreciation Rights Program“.
Notes AdditioNAl

122
h u G o b o s s Annual Report 2011 Group MANAGeMeNt report – the FiscAl YeAr
Net Assets and Financial Position
As in the preceding quarters, HUGO BOSS significantly exceeded the required minimum values as of December 31,2011. As a result of the positive development of operating income and the significant improvement in net debt, the totAl leverAGe in particular again improved considerably year-on-year. As of the end of the reporting period, this ratio was down from 0.6 in the previous year to 0.3. The interest cover ratio also improved from 20.6 in the previous year to 29.0 as of the end of the reporting period.
39 — interest cover 1
2011
2010
2009
2008
2007
29.0
20.6
12.2
10.5
36.9
1 EBITDA before special items and expenses for the „Stock Appreciation Rights Program“/net interest income/expense.
Most of the FiNANciAl liAbilities of the HUGO BOSS Group have a floating and market-driven interest rate and the majority is subject to short-term interest fixing. As of December 31, 2010, of the EUR 330 million in floating-rate financial liabilities, around EUR 313 million were hedged against an increase in interest rates with payer swaps. Other fixed-income loans are not subject to interest rate risk.
off-balance sheet financing instrumentsFinancing is supplemented by off-balance sheet operating leases for the Group’s own retail stores and for logistics and administration buildings. — Notes to the Consolidated Financial Statements, note
no. 30, p. 215
principles of capital management The main objectives of the Group’s capital management are supporting the Group’s operating business activities, maximizing shareholder value and ensuring a solid capital structure. — Report on Risks and Opportunities, Strategic Risks, p. 137
The Group manages its capital structure and adjusts it to account for changes in economic condi-tions. To maintain or adjust the capital structure, the Group can make adjustments to dividend payments to shareholders, repay capital to its shareholders or issue new shares.
As of December 31, 2011 and December 31, 2010, no changes were made to the objectives, guide-lines or processes.
The Group uses the leverage ratio described above to monitor its capital.
significant improve-ment in total leverage

123
Net Assets and Financial Position h u G o b o s s Annual Report 2011
statement of cash flows
40 — Free cash flow (in EUR million)
2011
2010
2009
2008
2007
193.3
246.3
299.5
48.1
33.0
The statement of cash flows is presented in accordance with IAS 7. The cash and cash equivalents shown here are the same as item of the same name in the statement of financial position.
All investments for expanding the Group’s own retail business, the second purchase price payment for the acquisition of shares in the joint venture companies and the acquisition of the Moss Bros monobrand stores were financed from the Group’s own cash flow. Furthermore, the syndicated loan was repaid by EUR 150 million as a result of the high level of cash provided by operating activities.
As anticipated, cash flow from operating activities slowed as against the previous year. It was slightly down on the previous year at EUR 302 million (2010: EUR 308 million). In connection with the higher requirements on net working capital, there was a cash outflow of EUR 58 million as against the previous year (2010: EUR 9 million). Inventories had a negative effect of EUR 73 million (2010: EUR 40 million) on operating cash flow. The main factors driving this development were the ongoing expansion of the Group’s retail operations and the acquisition of the Moss Bros stores. The change in trade receivables and other assets of EUR 40 million (previous year: EUR 1 million) was more than offset by the change in trade payables and other liabilities of EUR 56 million (2010: EUR 31 million). Income tax payments amounted to EUR 98 million in total (2010: EUR 28 million). This also reflects the strong development in consolidated net income, which at EUR 291 million (2010: EUR 189 million) virtually offset the other negative cash flow effects.As a result of the consistently high cash position and the higher interest income this entailed, the net cash outflow for interest expense and income was down to EUR 16 million (2010: EUR 18 million). As the statement of cash flows was adjusted for currency effects, these values cannot be derived from the statement of financial position.
cash flow from operating activities down on previous year
Notes AdditioNAl

124
h u G o b o s s Annual Report 2011 Group MANAGeMeNt report – the FiscAl YeAr
Net Assets and Financial Position
At EUR 108 million, cAsh used iN iNvestiNG Activities was much higher than in the previous year (2010: EUR 62 million). The expansion of the Group’s own retail operations was again a central factor in fiscal year 2011. In addition, the second tranche of the purchase price payment for the acquisition of the joint venture in China resulted in cash outflows of EUR 5 million (HKD 61 million).
The Free cAsh Flow, calculated from the cash provided by operating activities and investing activi-ties, was down by EUR 53 million in fiscal year 2011 to EUR 193 million (2010: EUR 246 million). In particular, this development is due to the significantly higher capital expenditure.
cAsh used iN FiNANciNG Activities amounted to a total of EUR 289 million in fiscal year 2011 (2010: EUR 68 million). In addition to the dividend distribution of EUR 140 million, the second main factor in this was the repayment of EUR 150 million of the syndicated loan.
cAsh ANd cAsh eQuivAleNts amounted to EUR 200 million as of the end of the reporting period (December 31, 2010: EUR 295 million). Unlike in the previous year, currency effects had only a minor impact at EUR 1 million (2010: EUR 3 million).
Net financial liablitiesNet financial liabilities are the total of all financial liabilities due to banks less cash and cash equivalents.
41 — Net financial liabilities (in EUR million)
2011
2010
2009
2008
2007
149.1
201.1
379.1
583.2
173.6
At EUR 349 million, financial liabilities due to banks were down significantly on the previous year’s level as a result of the partial repayment of the syndicated loan at the end of the reporting period (2010: EUR 496 million).
42 — cash and cash equivalents (in EUR million)
2011
2010
2009
2008
2007
200.4
294.9
114.1
24.6
24.5
cash used in investing activities dominated by expansion of own retail
network
repayment of syndi-cated loan drives cash
outflow from financing activities
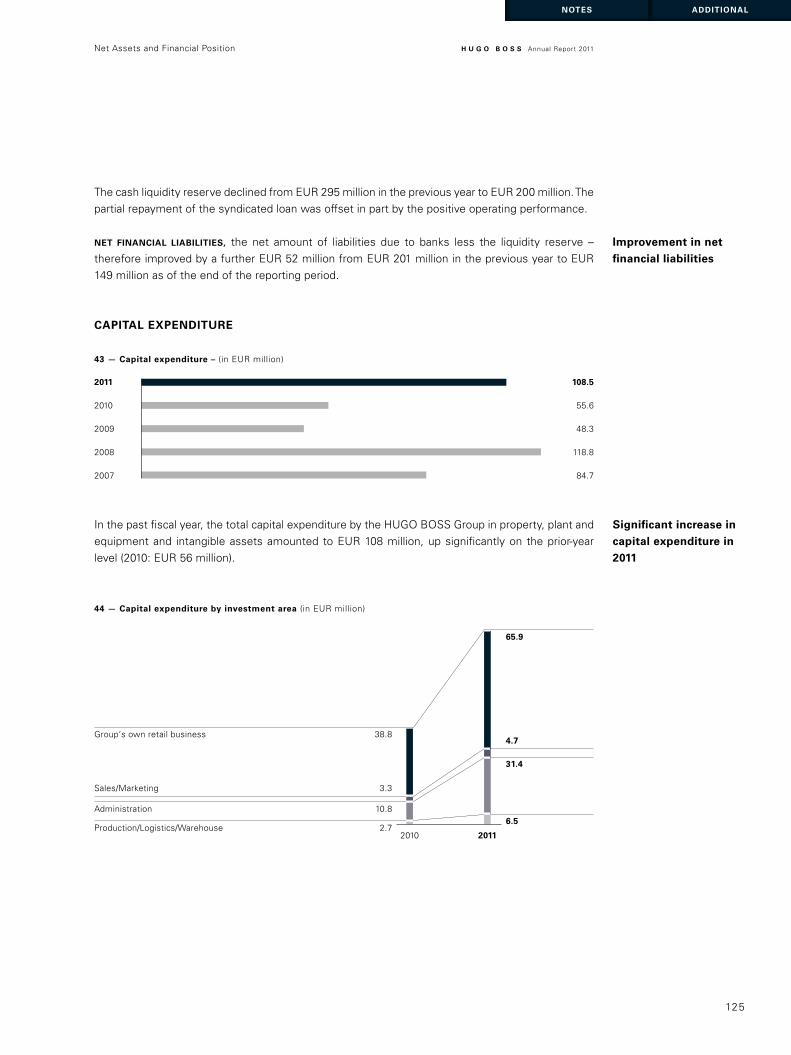
125
Net Assets and Financial Position h u G o b o s s Annual Report 2011
The cash liquidity reserve declined from EUR 295 million in the previous year to EUR 200 million. The partial repayment of the syndicated loan was offset in part by the positive operating performance.
Net FiNANciAl liAbilities, the net amount of liabilities due to banks less the liquidity reserve – therefore improved by a further EUR 52 million from EUR 201 million in the previous year to EUR 149 million as of the end of the reporting period.
cApitAl expeNditure
43 — capital expenditure – (in EUR million)
2011
2010
2009
2008
2007
108.5
55.6
48.3
118.8
84.7
In the past fiscal year, the total capital expenditure by the HUGO BOSS Group in property, plant and equipment and intangible assets amounted to EUR 108 million, up significantly on the prior-year level (2010: EUR 56 million).
Administration 10.8
Production/Logistics/Warehouse 2.7
Sales/Marketing 3.3
65.9
31.4
4.7
6.5
44 — capital expenditure by investment area (in EUR million)
Group‘s own retail business 38.8
20112010
improvement in net financial liabilities
significant increase in capital expenditure in 2011
Notes AdditioNAl

126
h u G o b o s s Annual Report 2011 Group MANAGeMeNt report – the FiscAl YeAr
Net Assets and Financial Position
the GlobAl expANsioN ANd ModerNizAtioN oF the Group’s owN retAil operAtioNs was again at the heart of this in fiscal 2011, accounting for 61% of total investments (2010: 70%). Investments in new stores amounted to EUR 55 million (2010: EUR 29 million). EUR 13 million of this related to the acquisition of 15 HUGO BOSS stores from the franchise partner Moss Bros in the UK and another EUR 1 million to the acquisition of eight HUGO BOSS stores from the franchisee Imaginex in China. In addition, a further EUR 11 million was invested in the renovation and modernization of existing retail locations (2010: EUR 10 million). The expansion of existing showrooms and further smaller investments in the distributioN structure amounted to EUR 5 million (2010: EUR 3 million).
Furthermore, there was capital expenditure for the IT infrastructure of EUR 12 million (2010: EUR 9 million). This essentially related to the ongoing development of the HUGO BOSS logistics and distribution systems. This also includes the connection of new retail sites to the SAP Retail software used throughout the Group. Investments in two office buildings at the Company’s headquarters in Metzingen accounted for EUR 12 million of the investment volume. Other AdMiNistrAtive invest-ments amounted to EUR 7 million.
A further EUR 6 million (2010: EUR 3 million) was invested in the expansion of productioN, loGistics
ANd wArehouse cApAcitY.
Cumulative depreciation and amortization on non-current assets including own work capitalized amounted to EUR 516 million (2010: EUR 450 million).
Existing obligations from investment projects that have already been started amounted to EUR 4 million as of December 31, 2011 (December 31, 2010: EUR 3 million). — Notes to the Consolidated
Financial Statements, note no. 25, p. 208
capital expenditure by region
Corporate Units 11.9
Americas 10.4
Asia/Pacific 15.9
50.5
12.9
10.3
34.8
45 — capital expenditure by region (in EUR million)
Europe 17.4
20112010
Total investments rose by 95% in fiscal year 2011 to EUR 108 million (2010: EUR 56 million). This reflects the Group’s dynamic growth.
Majority of invest-ments relate to Group’s
own retail operations
Administrative area also drives investments

127
Net Assets and Financial Position h u G o b o s s Annual Report 2011
Investments in europe including the Middle East/Africa amounted to EUR 50 million in fiscal year 2011 (2010: EUR 17 million). The key factor driving this development was the expansion and modern-ization of the Group’s own retail operations. Investments here totaled EUR 46 million (2010: EUR 15 million). EUR 13 million of this related to the acquisition of 15 HUGO BOSS stores from the franchise partner Moss Bros in the UK. Other investments in the administrative and distribution structure amounted to EUR 4 million (2010: EUR 2 million).
The investment volume in the AMericAs was EUR 13 million in 2011 (2010: EUR 10 million). Invest-ments in the Group’s own retail operations accounted for EUR 11 million (2010: EUR 8 million). As in the previous year, other investments in administration and distribution in addition to replacement investments in production amounted to EUR 2 million.
In the past fiscal year, investments in AsiA/pAciFic amounted to EUR 10 million (2010: EUR 16 million). The main reason for the decline were the high investments resulting from franchise acquisi-tions in fiscal year 2010. The expansion of retail operations also accounted for most of the capital expenditure in the Asia/Pacific region at EUR 9 million (2010: EUR 15 million). As in the previous year, other investments amounted to EUR 1 million.
Investments in corporAte uNits climbed to EUR 35 million in 2011 (2010: EUR 12 million). In partic-ular, the sharp rise relates to the administrative area at EUR 29 million (2010: EUR 8 million). This included greater capital expenditure of EUR 12 million for the IT infrastructure (2010: EUR 7 million) and investments in two administrative buildings at the Company’s headquarters. Other investments of EUR 6 million (2010: EUR 4 million) primarily related to investments in production, logistics and warehouse capacity.
significant increase in investments in europe bolsters market presence
Asia/pacific invest-ments focus on expansion of own retail
Notes AdditioNAl

128
h u G o b o s s Annual Report 2011 Group MANAGeMeNt report – the FiscAl YeAr
Overall Statement on the Economic Situation
overAll stAteMeNt oN the ecoNoMic situAtioN
In summary, the results of operations, net assets and financial position indicate that the HUGO BOSS Group was in a sound financial position at the time that this Management Report was prepared.
keY FiNANciAl iNdicAtors
2011 2010
Equity ratio in % =Shareholder’s equity
36.1 26.6Total assets
Net financial liability (in EUR million) 149.1 201.1
Total leverage =Net financial liabilities
0.3 0.6EBITDA before SI1 and SAR 2
Trade net working capital (in EUR million) 407.3 322.7
Trade net working capital (in % of sales) 3 19.9 19.2
Interest cover 29.0 20.6
Free cash flow (in EUR million) 193.3 246.3
1 SI = Special items.
2 SAR = Expenses for the „Stock Appreciation Rights Program“.
3 Moving average of trade net working capital in % of sales.

129
Compensation for the Managing and Supervisory Boards h u G o b o s s Annual Report 2011
coMpeNsAtioN For the MANAGiNG ANd supervisorY boArds
this report explains the structure and amount of the compensation for the Managing board and the supervisory board. the structure of Managing board compensation was altered in fiscal year 2010. instead of annual variable components, the total compensation for the Managing board now includes variable compensation compo-nents with a long-term incentive effect.
coMpeNsAtioN oF the MANAGiNG boArdThe total fixed salary components for members of the Managing Board in the fiscal year 2011 amounted to EUR 2,873 thousand (2010: EUR 3,248 thousand). The fixed salary components paid to members of the Managing Board comprise, besides the salary, benefits such as company cars and other benefits in kind forming part of the salary, as well as other equipment and services necessary for Managing Board members to fulfill their duties.
The variable compensation components with a long-term incentive effect consist of a multi-year bonus granted in line with the achievement of personal targets agreed with the Supervisory Board and the fulfillment of the pre-defined key figures EBITDA before special items and trade net working capital. The bonus for one year is based predominantly on target achievement measured over a period of three years. After the end of the third fiscal year, the bonus is calculated conclusively and paid out. For a transition period during the introduction of the multi-year bonus agreements, the Managing Board members receive advance payments of the expected bonus. If the amount of the outstanding payment is negative, this must be repaid to HUGO BOSS AG by the Managing Board member. Additions to the provision for the multi-year bonus are made proportionally. As of December 31, 2011, there was a provision totaling EUR 4,050 thousand (2010: EUR 3,025 thousand).
Managing Board members holding office as of the reporting date are not eligible to participate in the “Stock Appreciation Rights Program”. For the event of early termination, the employment contracts include regulations which – except for the deviation stated in the Declaration of Compliance from December 2011 – comply with the requirements of the German Corporate Governance Code. For the event of regular termination, the employment contracts do not include any regulations other than pension regulations. No compensation was paid out to Managing Board members leaving the Company in fiscal year 2011 (2010: EUR 2,934 thousand).
In addition, the Company has provided pension benefits for Managing Board members. The amount of future pension benefits is based on each member’s base salary and years of service. Additions to pension provisions for Managing Board members (excluding deferred compensation) amounted to EUR 1,209 thousand in fiscal year 2011 (2010: EUR 1,964 thousand).
coMpeNsAtioN oF the supervisorY boArdAccording to the German Corporate Governance Code, the compensation of Supervisory Board members is divided into a fixed and a variable component. The variable component is determined on the basis of earnings per share in the consolidated financial statements. The position of the chairman of the Supervisory Board and his deputy are taken into account when determining the level of compensation. The Supervisory Board received total compensation of EUR 1,534 thousand for its services in 2010. For fiscal year 2011, total compensation is expected to be EUR 1,911 thousand, including a provision for the variable component of EUR 1,156 thousand (2010: EUR 738 thousand).
Notes AdditioNAl

130
h u G o b o s s Annual Report 2011 Group MANAGeMeNt report – the FiscAl YeAr
Special Legal Disclosures
speciAl leGAl disclosures
report oN relAtioNs with AFFiliAted coMpANies The Managing Board of HUGO BOSS AG is required to prepare a report oN relAtioNs with AFFili-
Ated coMpANies in accordance with Section 312 of the German Stock Corporation Act (AktG). This report covers the relations with Permira Holdings Limited, Guernsey and the companies belonging to the HUGO BOSS Group. In terms of its relations with affiliated companies, the Managing Board issued a report and summarized in a declaration “… that the Company received appropriate compen-sation for all transactions in accordance with the conditions known at the time of the respective transaction. The Company did not take nor neglect to take measures at the instigation of or in the interests of Permira Holdings Limited, Guernsey or of its affiliated companies.”
disclosures pursuANt to sectioN 289 pArAGrAph 4 ANd sectioN 315 pArAGrAph 4 oF the GerMAN coMMerciAl code (hGb) The requirements pursuant to Section 289, Paragraph 4 and Section 315, Paragraph 4 of the HGB are listed and explained in the following. The Managing Board sees no need for further explanation as set forth in Section 175, Paragraph 2, Sentence 1 and Section 176, Paragraph 1, Sentence 1 of the German Stock Corporation Act (AktG).
The shAre cApitAl of HUGO BOSS AG continues to consist of 35,860,000 common shares (50.9%) and 34,540,000 non-voting preferred shares (49.1%), equivalent to a share in the issued share capital of EUR 1.00 per common or preferred share. Holders of non-voting preferred shares are entitled to a preferred dividend of EUR 0.01 per share upon distribution of the retained earnings. This means that the dividends paid to bearers of non-voting preferred shares from net retained earnings are EUR 0.01 higher per preferred share than the dividends paid to bearers of common shares. The dividend for preferred shares amounts to no less than EUR 0.01 per share.
Unlike the common shares, the preFerred shAres are NoN-votiNG shAres. There are no legal or statutory restrictions on voting rights or transfer of shares. The Managing Board is not aware of any such agreements between shareholders.
There are shareholdings exceeding 10% of the voting rights. — Notes to the Consolidated Financial
Statements for Fiscal Year, Information Concerning the Majority Shareholder, p. 232
Apart from that, no other shareholders have reported holdings equivalent to more than 10% of the voting rights. Moreover, the Company received no other new reports of shareholdings of 3% or more of the voting rights in HUGO BOSS AG.
HUGO BOSS AG has not issued shares vested with special rights granting powers of control. No special provisions exist with regard to the exercise of shareholder rights by shareholders who are employees of HUGO BOSS AG.

131
Special Legal Disclosures h u G o b o s s Annual Report 2011
The AppoiNtMeNt ANd revocAtioN oF MANAGiNG boArd MeMbers of HUGO BOSS AG is based on Sections 84 and 85 of the German Stock Corporation Act (AktG) and Section 31 of the German Co-Determination Act (MitbestG) in connection with Section 6 of the Articles of Association. Pursuant to Section 6, Paragraph 1 of the Articles of Association, the Managing Board consists of at least two members. The number of Managing Board members is determined by the Supervisory Board pursuant to Section 6, Paragraph 2 of the Articles of Association. The Supervisory Board may appoint a chairman of the Managing Board as well as a deputy chairman. The Supervisory Board can revoke the appointment of a Managing Board member and the appointment of the chairman of the Managing Board for good cause. According to Section 6, Paragraph 3 of the Articles of Association, Managing Board members generally should not be more than 60 years of age at the time of their appointment. The Supervisory Board appoints Managing Board members for a maximum of five years.
Any changes to the Articles of Association must be approved by the Annual Shareholders’ Meeting. Unless otherwise mandated by the German Stock Corporation Act, resolutions are adopted pursuant to Section 17, Sentences 2 and 3 of the Articles of Association by a simple majority of the votes cast and, if a majority of the capital represented upon adoption of the resolution is required, by a simple majority of the share capital represented upon adoption of the resolution. According to Section 20 of the Articles of Association, the Supervisory Board is authorized to adopt modifications to the Articles of Association that affect the wording only.— Report on Risks and Opportunities, Report on the Accounting-related Internal Control System and the Risk Manage-
ment System in accordance with Section 289 Paragraph 5 and Section 315 Paragraph 2 No.5 of the German Commercial Code
(HGB), p. 146
AuthorizAtioN oF the MANAGiNG boArd to iNcreAse the shAre cApitAl (Authorized cApitAl 2009) with the optioN to exclude subscriptioN riGhtsPursuant to a decision of the Annual Shareholders’ Meeting held on May 14, 2009, the Managing Board is authorized, with the consent of the Supervisory Board, to increase the share capital of the company until May 13, 2014 by a total of no more than EUR 35,200,000 through the issuance of new bearer common shares and/or non-voting bearer preferred shares, which correspond to the non-voting bearer preferred shares already issued, in return for cash and/or deposits in kind. Increases in capital can be made in return for cash while maintaining the relationship of the two categories of shares to one another. If authorized capital is used, the shareholders have a subscrip-tion right. However, the Managing Board is authorized to prevent shareholders from transferring their subscription rights from one class of shares to the other, to exempt fractional amounts of the shareholders’ subscription rights, and to participate in the shareholders’ subscription rights with the consent of the Supervisory Board, if a capital increase against deposits in kind is issued for the purpose of acquiring a company or an equity interest in a company.
Notes AdditioNAl

132
h u G o b o s s Annual Report 2011 Group MANAGeMeNt report – the FiscAl YeAr
Special Legal Disclosures
AuthorizAtioN to purchAse ANd use treAsurY shAres, Also excludiNG teNder riGhts ANd subscriptioN riGhts, iNcludiNG the AuthorizAtioN to redeeM purchAsed treAsurY shAres ANd cApitAl reductioNThe Managing Board’s authorization to repurchase shares was renewed at the Annual Shareholders’ Meeting on June 21, 2010. In accordance with this, the Managing Board is authorized until June 20, 2015 to purchase bearer common and/or non-voting bearer preferred shares of HUGO BOSS AG up to an overall maximum of 10% of its capital outstanding on June 21, 2010. HUGO BOSS AG may avail itself in whole or in part of its authorization to purchase treasury shares only for bearer common and/or bearer preferred shares, thereby partially excluding any put options relating to those classes of shares, and do so once or several times in pursuance of one or more objectives. The shares may be purchased via the stock market or by means of a public tender offer to holders of the respective category of shares. Any Company shares repurchased in accordance with this authorization may be resold via the stock market or by means of an offer to all shareholders, excluding shareholders’ subscription rights. They may also be used as consideration for a possible acquisition of enterprises or shareholdings in enterprises, or may be sold at a price that is not substantially lower than the current stock market price, or for listing of the stock on foreign stock markets.
HUGO BOSS International B.V.’s syndicated loan guaranteed by HUGO BOSS AG and the bilateral lines of credit contain standard AGreeMeNts thAt Give AdditioNAl riGhts oF terMiNAtioN to both
pArties to the coNtrAct iF A chANGe oF coNtrol occurs due to A tAkeover bid (change of control clauses).
The Company has not entered into any compensation agreements with members of the Managing Board or employees for the event of a takeover bid.

133
Report on Risks and Opportunities h u G o b o s s Annual Report 2011
report oN risks ANd opportuNities
in addition to ensuring the Group’s continuation as a going concern, the aim of the risk and opportunity policy of the huGo boss Group is to sustainably increase the enterprise value and to achieve its financial and strategic objectives. effective risk management should ensure that risks are detected and minimized at an early stage. As well as further reducing potential risks to the company’s success, the identifica-tion of new opportunities also serves in particular to ensure profitable growth.
risk report The success of the HUGO BOSS Group is based on systematically exploiting opportunities as part of the Group’s medium-term and long-term strategy. In addition, the risk policy pursues the goal of ensuring the Group’s continuation as a going concern, sustainably increasing the enterprise value and achieving its financial and strategic objectives.
risk management The basis for successful risk management is set out in uniform Group-wide standards for systemati-cally dealing with risks. These are laid down for the HUGO BOSS Group by the Managing Board and documented in a Risk Manual which applies to the whole Group and is available to the employees online. Risks are defined as potential negative deviations from the planned operating result (EBIT). Established limits describe the risk-bearing capacity of the HUGO BOSS Group and allow the risks to be classified in risk levels from “low” to “high”. Within pre-defined time intervals depending on the risk level, risks are identified early, analyzed and monitored, resulting in a transparent risk situation. Furthermore, all HUGO BOSS Group employees are committed to acting with awareness of risks and to avoiding risks that could threaten the Group’s continuation as a going concern.
The coordination of Group-wide risk management is centrally guided in HUGO BOSS AG’s Risk and Insurance Management department to recognize risks and opportunities at an early stage in order to analyze, manage, monitor and counteract them if needed with risk-minimizing measures. This department is continuously further developing the tools for the risk management system and ensures that risks and opportunities are recorded systematically and regularly within the defined intervals using a uniform method throughout the Group.
Responsibility for analyzing risks, handling them appropriately and implementing effective risk-reducing measures is decentralized to the individual divisions where the risks may arise. Risk owners are defined for each division. The Managing Board and Supervisory Board are regularly informed about the risk situation, the development of the most important risks, and new risks.
uniform Group-wide standards ensure successful risk management
decentralized risk analysis in the divisions
Notes AdditioNAl

134
h u G o b o s s Annual Report 2011 Group MANAGeMeNt report – the FiscAl YeAr
Report on Risks and Opportunities
Risks are handled in four ways: avoidance, reduction, acceptance and transfer. Consequently, transferring risks to insurance companies is part of risk management. This neutralizes the financial consequences of insurable risks to the furthest extent possible.
huGo boss risk policY
supervisorY ANd MANAGiNG boArd
ceNtrAl risk MANAGeMeNt risk experts/risk owNer
risk MANAGeMeNt sYsteM risk MANAGeMeNt process
coMMuNicAtioN ANd coNsultiNG
re
vie
w A
Nd
Mo
Nit
or
iNG
Analysis: Identification + Quantification
Warning Indicators,
Threshold Values
control: counter Measures
communication
Documentation
Design
Monitor/review
ImplementImprove
46 — huGo boss risk policy
Risks are reviewed at least once a year, and depending on their magnitude also at six-month, quarterly and monthly intervals, to ensure that they reflect the current situation. Individual risk entries are revised or supplemented as necessary. Risks are quantified by estimating their probability of occur-rence and the associated effects on the operating result (EBIT). Different risk scenarios for the best, average and worst cases are considered in order to obtain a picture of the risks as differentiated as possible. This takes into account the potentially strong influence of extreme scenarios which have a low probability of occurrence, but a major impact.Medium-term risk trends are also calculated in addition to the 12-month planning period used for risk quantification.
Irregularities can be recognized at an early stage by continuously monitoring early warning indica-tors. Should a risk materialize, reporting chains are triggered and appropriate pre-defined counter-measures are initiated to guarantee a rapid response.
The HUGO BOSS Group is able to identify risks at an early stage and to respond quickly and appro-priately. The risk management system is also monitored at regular intervals by the Internal Audit department to ensure its proper functioning. As part of the audit of the annual financial statements, the independent auditor verifies that the Managing Board has taken the necessary steps according to Section 91, Paragraph 2 of the German Stock Corporation Act (AktG) in an appropriate manner.
differentiated risk quantification through
examination of scenarios

135
Report on Risks and Opportunities h u G o b o s s Annual Report 2011
The individual risks identified in the HUGO BOSS Group are combined in overarching risk areas, which are in turn allocated to an external, strategic, financial, operational or organizational main risk category.
The main risks are described below, although potential other risk that are not currently known or that are currently classed as immaterial may also adversely affect the Company’s development in the future.
exterNAl risks
strAteGic risks
FiNANciAl risks
operAtive risks
orGANisAtioNAl risks
Financing and liquidity
changes in interest rates
currencies
loans
collection and sector
Brands and corporate image
Investments
Overall economy
Sales markets
47 — risk categories
IT
legal
Personnel
corporate governance
and compliance
Product costs
Dependencies
Suppliers and sourcing markets
Quality
logistics
Distribution
competition
Wholesale
Group‘s own retail business
risk areas and structure of individual risks
48 — Assessment criteria for company risks
≤ 20%
> 20 – 40%
> 40 – 60%
> 60%
low
Financial impactFrequency of occurrence
ModerAte
esseNtiAl
hiGh
verY uNlikelY
possible
probAble
verY likelY
Notes AdditioNAl

136
h u G o b o s s Annual Report 2011 Group MANAGeMeNt report – the FiscAl YeAr
Report on Risks and Opportunities
external risksLike any company that operates globally, the HUGO BOSS Group is exposed to general economic risks. A particularly crucial factor here is the global economic situation, which can result in a risk of reduced demand for textile goods and accessories in the premium fashion and luxury market. The consumer goods sector’s dependency on consumers’ buying behavior results in a general risk for the consumer goods industry that can impact planned sales. However, through advance order entries and the development of its own retail business the HUGO BOSS Group has important early warning indicators that allow the effects of possible general economic risks to be forecasted at an early stage. The HUGO BOSS Group has taken various countermeasures to effectively counteract possible negative impacts of a deterioration in the general economic situation at an early stage. These include strong brand positioning with the aim of increasing market share in a highly competi-tive environment. A business model geared towards international growth also taps new consumer potential and helps to compensate for possible declines in demand in individual markets. The Group also aims for a balanced distribution of sales across different regions to avoid being overly dependent on individual markets. HUGO BOSS will therefore continue to seek to expand in profitable growth regions, notably the Asia/Pacific region. The above-average sales growth of the HUGO BOSS Group in the fiscal year 2011 as compared to the growth rates of the global economy and the luxury sector as a whole shows that these measures were successful and HUGO BOSS enjoys a strong market position. — Subsequent Events and Outlook, Outlook, p. 151
As international company, HUGO BOSS is also subject to risks relating to changes in the sales markets. These risks may arise as a result of changes in the political and regulatory environment or sociocultural developments. As is the case for all companies, terrorist acts and environmental disasters constitute another possible risk to the Company’s net assets, financial position and earnings. In order to minimize country risks with regard to sales, HUGO BOSS products are mainly sold in countries with stable economic and political environments.
strategic risksCollection and sector risks may arise as a result of changing fashion and lifestyle trends. The challenge is twofold – identifying the right trends in time and then quickly making them into an unmistakable collection. HUGO BOSS counteracts this risk with in-depth analysis of target groups and markets as well as by using different design teams for each brand. The collections for the total of four seasons per year are made up of different elements ranging from components that are used over multiple seasons to programs available for a short time only. This means that trends can quickly be integrated in the collection. Initiatives to shorten the product development cycle so as to react faster to market trends have also been implemented. Increased consumer proximity due to the Group’s own retail business also makes a significant contribution to enabling information on trends and buying behavior to be incorporated quickly in the collections. The management considers the probability of collection and industry risks highly unlikely. Potential negative effects are rated as minor. — Group Strategy, p. 66
overall economic risks
sales market risks
collection and sector risks

137
Report on Risks and Opportunities h u G o b o s s Annual Report 2011
Financial success at HUGO BOSS rests on its brand image and its long-term positioning of the Group brands in the premium and luxury market. Protecting and maintaining the brand image is therefore a correspondingly high priority at HUGO BOSS. This is implemented in the form of strategic measures such as clearly defined brand positioning supported by targeted marketing activities and a uniform global brand image with ongoing monitoring and analysis of the markets. The brand’s trademark protection and the prosecution of counterfeiters are a key part of securing the brand image. The HUGO BOSS Group’s corporate image is reflected in its perception by its stakeholders, such as customers, shareholders, suppliers and employees. Corporate communications with external parties are managed centrally through the Communications and Investor Relations departments. Compliance with laws, standards and guidelines is also monitored on a regular basis both within the Company and at suppliers. Negative influences of risks to brand and corporate image could have a moderate impact on the earnings, net assets and financial position of the Group, but are currently considered highly unlikely.
One of HUGO BOSS’ main strategic objectives is the continued expansion of the Group’s own retail business. Retail activities involve investment risks arising from establishing and maintaining stores and from long-term leases and personnel expenses. This inevitably leads to an increase in fixed costs, although this is counterbalanced by the opportunity of rising gross profit margins. In order to minimize the risk of bad investments and unprofitable Group retail activities, decisions regarding new store openings and store closures are made centrally in consultation with the responsible regional directors. The opening of any new store is always preceded by extensive examinations of the location and analyses of its potential and by intensive sales and development planning.Group companies are required to submit monthly reports on the performance of their own retail activities. Continuous monitoring of their performance ensures that the onset of any negative trends at individual stores can be recognized early and countermeasures can be taken, such as possible restructuring. The investment risk is also minimized by a globally uniform store concept, so that in the event of a store closure some of the furniture can be used at other locations. In the context of general investment controlling, the value contribution of all other investments is also examined taking into account the risks entailed. In light of the measures described, the investment risk is considered low and highly unlikely. — Group Management, Investment Controlling, p. 65
Financial risksThe main responsibilities of the HUGO BOSS Group include coordinating and steering the financial requirements within the Group, ensuring the financial independence of the Group as a whole, and reducing financial risks. The HUGO BOSS Group is primarily subject to risks related to changes in interest rates, liquidity, currency exchange rates and counterparty default, which may influence the Group’s earnings, net assets and financial position. These risks are subject to continuous intensive controls. The develop-ment of the exposure is constantly monitored, quantified and – if necessary – hedged in order to minimize balance sheet risks.
risks to the brand image and corporate image
investment risk
Notes AdditioNAl

138
h u G o b o s s Annual Report 2011 Group MANAGeMeNt report – the FiscAl YeAr
Report on Risks and Opportunities
Managing liquidity risk is one of the main responsibilities of the HUGO BOSS AG Treasury Depart-ment. Liquidity risk is the risk that current or future payment obligations may not be met with regard to their maturity, volume and currency due to insufficient available cash. To guarantee the Group’s solvency and financial flexibility at all times, financial requirements are calculated on the basis of a three-year financial plan and currency-differentiated liquidity planning that is prepared on a rolling monthly basis with a planning period of up to one year. The financial requirements are then covered by credit lines and cash.
A syndicated credit line available until 2013 ensures financial flexibility. Due to the strong cash flow generated from operating activities in the past fiscal year, too, the available syndicated credit line originally totaling EUR 750 million was reduced early by a total of EUR 300 million. Utilization of the fixed credit line was reduced by EUR 150 million in this context. In addition, the revolving credit line that had not been utilized at this time was likewise lowered by EUR 150 million. Both measures reflect the reduced financing requirements in recent years and the further liquidity surpluses expected in the future. The credit lines were reduced without payment of any prepayment penalties. As of the reporting date, only the fixed credit line of EUR 300 million had been drawn down.
In addition to the syndicated loan, HUGO BOSS also has short-term bilateral credit lines available amounting to EUR 88 million which increase its flexibility. The liquidity and financing risks are further reduced by an internal financial compensation mechanism and by cash pooling.
In addition to the credit lines in place on December 31, 2011 amounting to EUR 538 million, the Group had liquid funds of EUR 200 million as of the reporting date. Consequently, HUGO BOSS regards the probability of financing and liquidity risks very low and of a minor financial extent. HUGO BOSS does not see any risks from infringements of financial covenants, even in the case of overall economic conditions further deteriorating. — Net Assets and Financial Position, Financing
Conditions, p. 121
Market-driven fluctuations in interest rates firstly impact the level of interest expenses in the HUGO BOSS Group and secondly influence the market value of financial instruments. Significant changes in interest rates could therefore affect the profitability, liquidity and financial position of the Group.
The major part of the financial liabilities of the HUGO BOSS Group are floating-rate debts and are subject to short-term interest fixing. The resulting interest rate risk also represents a cash flow risk. To minimize the effects of future interest rate volatility on financing costs, derivative financial instruments are mainly used in the form of interest rate swaps. Derivatives in an effective hedge relationship as defined in the IFRS impact equity in the event of interest rate changes, whereas derivatives without such hedge relationships are recognized in profit or loss.
Opportunity effects can also occur. These arise as a result of the balance-sheet recognition of non-derivative financial instruments which are measured at cost rather than at fair value. The opportunity risk represents the difference between the two values which is not recognized in the balance sheet or in the income statement.
Financing and liquidity risks
interest rate risks

139
Report on Risks and Opportunities h u G o b o s s Annual Report 2011
Due to the continued low interest level, the shift in the yield curve for the ANAlYsis oF iNterest rAte
seNsitivitY As oF the reportiNG dAte was maintained at +100 / –30 basis points as in the previous year in order to avoid negative interest and to represent realistic scenarios. Taking into account the underlying exposure in EUR and JPY, HUGO BOSS considers the +100 / –30 basis point shift to be appropriate.
2011 2010
in EUR million +100 bp –30 bp +100 bp –30 bp
Cash flow risks 1.3 (0.4) 1.1 (0.4)
Risks from interest rate derivates recognized in income 0.8 (0.3) 0.8 (0.3)
effects on net income 2.1 (0.7) 1.9 (0.7)
Risks from interest rate derivates reflected on the balance sheet
3.1
(0.9)
5.3
(1.6)
effects on Group equity 5.2 (1.6) 7.2 (2.3)
The effects of changes in key interest rates on income and equity were analyzed in accordance with the requirements of IFRS 7. The analysis included floating-rate financial liabilities of EUR 330 million and interest rate derivatives amounting to EUR 313 million. In addition, cash and cash equivalents were also included for the first time in 2011. For this reason, the comparative figures from 2010 have been adjusted accordingly. The effect of interest rate changes on future cash flows is not included in the analysis.
A rise of 100 basis points in the market interest rate as of December 31, 2011 would have resulted in an increase in earnings of EUR 2.1 million (previous year: EUR 1.9 million) and an increase in equity of EUR 5.2 million (previous year: EUR 7.2 million). A decrease of 30 basis points in the market interest rate would have caused earnings to decline by EUR –0.7 million (previous year: by EUR –0.7 million) and Group equity to decline by EUR –1.6 million (previous year: by EUR –2.3 million). The effects from interest rate derivatives would have resulted from changes in fair value. The cash flow risks would have resulted primarily from higher/lower interest income and interest expenses from cash and cash equivalents.
On the basis of the effects of interest rate changes of +100/–30 basis points on the financial instru-ments as shown in the sensitivity analysis, the impact of interest rate change for the HUGO BOSS Group is still regarded as low. In view of the difficulty in forecasting interest rate trends, particularly in the euro area, the management is currently assuming that interest rate changes are possible.
The currency risks of the HUGO BOSS Group mainly result from its operating business as well as from its intercompany financing activities.
In operating business, currency risks occur primarily when sales are realized in a currency other than the company’s functional currency (transaction risk) and due to intercompany financing activities in non-euro companies.
The HUGO BOSS Group is represented by local subsidiaries in the most important core markets. These subsidiaries sell products to local customers within a certain geographic area. The subsid-iaries place the orders arising from this business exclusively within the Group. Intercompany orders are generally denominated in the local currency in order to manage the currency risk centrally. The
currency risks
Notes AdditioNAl

140
h u G o b o s s Annual Report 2011 Group MANAGeMeNt report – the FiscAl YeAr
Report on Risks and Opportunities
currency risk therefore arises from cash flows denominated in the local currencies of subsidiaries. Currency risks of the HUGO BOSS Group arising from business operations are incurred mainly from activities in the U.S., Great Britain, Australia, Canada, Switzerland, Japan, Hong Kong and China and from purchasing activities of the sourcing units denominated in foreign currencies.Furthermore, currency risks arise from the conversion of the net assets of foreign subsidiaries located outside the euro zone and their income and expenses (translation risk), against which the Group does not take hedging measures. — Notes to the Consolidated Financial Statements, Currency
Conversion, p. 177
curreNcY MANAGeMeNt For trANsActioN risks is carried out centrally for all Group companies. The primary goal is to reduce the overall currency exposure by natural hedges. These hedges consist of balancing the currency exposure from business operations across the Group. No further hedging measures are then necessary for the balanced positions.
Forward exchange contracts, swaps and plain vanilla currency options can be used to hedge the remaining exposure. The primary goal of the hedging strategy is to limit the effects of exchange rate fluctuations on the balance sheet. The terms of the derivatives entered into are generally adapted to the underlying hedged item when the derivatives are concluded. The financial derivatives entered into that are traded on the OTC market are used solely to hedge the underlying transactions. In order to obtain the best possible deal, quotes are obtained from a number of banks. Transactions are contracted with the bank quoting best.
Foreign currency risks from financing activities result from financial receivables and liabilities in foreign currencies and from loans in foreign currencies which are granted to Group companies for financing purposes. In the case of loans granted to Group companies, a distinction is made between short-term and long-term contracts. Short-term loans can be drawn down flexibly in line with the character of an overdraft credit line. As of the reporting date, the main long-term loans with repayment on final maturity were hedged with forward exchange contracts. The remaining term was up to 16 months.Group-wide guidelines ensure a strict separation of functions between trading, processing and control of all financial market transactions. These guidelines also constitute the basis for selecting and determining the scope of hedging activities. The goal of currency hedging is to reduce currency effects on the development of the Group’s net income and equity.
The currency risk is calculated based on the balance sheet currency exposure as of December 31, 2011. This procedure is selected on the basis of the HUGO BOSS Group’s hedging strategy, which aims to minimize balance sheet risks.The exposure comprises cash and cash equivalents, receivables and liabilities and intercompany loans held in currencies other than the functional currency of the subsidiary in question. Effects due to the translation of financial statements from foreign subsidiaries outside the euro zone have not been taken into account.
Based on the requirements of IFRS 7, the HUGO BOSS Group has calculated the effects of changes in the most important exchange rates on income and equity. The following sensitivity analyses show the impact on net income and equity if different exchange rates had been in place as of the reporting date. It is assumed that the level at the reporting date is representative for the year as a whole.

141
Report on Risks and Opportunities h u G o b o s s Annual Report 2011
exposure At the reportiNG dAte deceMber 31, 2011
in EUR million usd Gbp Aud cAd chF JpY hkd cNY
Gross currency exposure 36.4 20.5 25.1 14.9 (33.0) 37.3 19.3 (2.9)
Hedging (44.9) (21.0) (11.8) (7.6) 0.0 (29.9) 1.6 0.0
Net currency exposure (8.5) (0.5) 13.3 7.3 (33.0) 7.4 20.9 (2.9)
historic volatility 11.1 8.0 10.9 9.3 14.9 12.5 10.8 10.9
Appreciation of the euro by standard deviation
Net income 0.6 0.0 (1.0) (0.5) 3.3 (0.6) (1.5) 0.2
depreciation of the euro by standard deviation
Net income (0.6) 0.0 1.0 0.5 (3.3) 0.6 1.5 (0.2)
exposure At the reportiNG dAte deceMber 31, 2010
in EUR million usd Gbp Aud cAd chF JpY hkd cNY
Gross currency exposure 37.6 (0.9) 26.2 9.3 (29.0) 32.4 (7.2) (20.1)
Hedging (44.9) 0.0 0.0 (7.3) 0.0 (19.0) 5.9 0.0
Net currency exposure (7.3) (0.9) 26.2 2.0 (29.0) 13.4 (1.3) (20.1)
historic volatility 12.3 9.8 12.2 12.0 9.2 15.4 12.3 10.0
Appreciation of the euro by standard deviation
Net income 0.6 0.1 (2.2) (0.2) 1.9 (1.4) 0.1 1.8
depreciation of the euro by standard deviation
Net income (0.6) (0.1) 2.2 0.2 (1.9) 1.4 (0.1) (1.8)
Historic volatility in the individual foreign currencies was used to take account of the different fluctu-ations in the foreign currencies relevant to the HUGO BOSS Group against the euro and the require-ments of IFRS 7 of a “change considered possible” in the exchange rates. This historic volatility was calculated on the basis of daily fluctuations over the past 12 months. There are no direct effects on the Group equity since there were no currency hedging transactions accounted for directly in equity according to IAS 39 as of the reporting date.
In the event of appreciation of the euro as against the relevant foreign currency exposure by the standard deviation in each case, the Group’s net income would have increased by EUR 0.5 million (previous year: EUR 0.7 million). In the event of equivalent depreciation of the euro, the Group’s net income would have decreased by EUR 0.5 million (previous year: EUR 0.7 million).Based on this sensitivity analysis, currency risk and its influence on the net income of the HUGO BOSS Group is regarded as very low. The management is assuming that changes in the currency pairs relevant to HUGO BOSS are highly likely in fiscal year 2012.
Notes AdditioNAl

142
h u G o b o s s Annual Report 2011 Group MANAGeMeNt report – the FiscAl YeAr
Report on Risks and Opportunities
The credit risk related to financial institutions arises primarily from the investment of liquid funds as part of liquidity management, from short-term deposits of bank balances where necessary, and from trading in derivatives.
With financial instruments, the Group is exposed to a (bank) default risk resulting from the possible counterparty default. The maximum amount of this risk is therefore the positive fair value of the financial instrument in question. To minimize default risk, the HUGO BOSS Group concludes financial instruments only with counterparties with first class credit ratings and adheres to predetermined risk limits. Only in exceptional cases and with the approval of the Managing Board may investments be made or derivative transactions entered into – within narrow limits and terms – with banks with a lower credit rating. HUGO BOSS assumes that the risk concentration is low and considers the probability of default by counterparties to be very low. As the Group works with banks of consis-tently excellent credit standing, counterparty risks are considered highly unlikely. — Notes to
the Consolidated Financial Statements, note no. 25, p. 208
The HUGO BOSS Group employs derivatives to hedge against future expenditure from claims arising from the share-based compensation program “Stock Appreciation Rights Program” that have not yet been settled. The scope of derivative hedging instruments was changed provided that obliga-tions in connection with the “Stock Appreciation Rights Program” did not arise. Therefore, the risk of a negative impact on earnings, net assets and the financial position is regarded as low by the HUGO BOSS Group. — Notes to the Consolidated Financial Statements, notes no. 36, p. 224
operative risksThe high quality requirements for HUGO BOSS products and thus the sourcing and production processes require close partnerships with suppliers. The increased overall sourcing and production volume resulted in even closer cooperation with selected suppliers. depeNdeNcies may arise due to production capacity being concentrated with key suppliers. A possible accumulation risk could also result from regional events that simultaneously affect several suppliers, business areas or product groups. This has practical relevance, e.g. with regard to earthquake risk at the production site in Turkey. Potential losses and relocation options have been identified and the risks of financial loss have been covered to the fullest extent possible with insurance policies. In order to ensure reliable availability of production materials and capacities of a suitable quality and at prices in line with the market, orders to suppliers and utilization of manufacturers’ capacity are coordinated centrally. The supplier structure is reviewed on a regular basis with the aim of identi-fying country risks in good time. Diversification of risks is ensured to the greatest extent possible in line with the volumes, which depend on quality and available production capacity. The potential risk of an excessive concentration on individual external suppliers is countered by an appropriate amount of in-house production. The management currently assumes that a residual risk from the dependence on individual suppliers is probable, but would have a minor impact on the Group’s earnings, net assets and financial position.
credit risk
share price risk
risks relating to the sourcing market

143
Report on Risks and Opportunities h u G o b o s s Annual Report 2011
Wage increases in production – which are particularly likely in emerging economic regions – and rising raw material prices may lead to higher product costs, thus putting pressure on the gross profit margin. The HUGO BOSS Group is counteracting this risk with margin-based collection planning, company-wide measures to improve efficiency in production and sourcing processes, an improvement in the use of materials, and consistent implementation of the pricing strategy. Due to the lead time in the sourcing and production processes, the Group can already react to early warning indicators. In light of the current developments in the emerging economies, it is presently assumed that risks of higher product costs are possible but would have only a minor negative effect on forecast earnings development.
Product quality plays a key role in brand image. Products are subject to standardized Group quality control checks at all stages of production. Traveling quality consultants regularly visit production sites and review compliance with the strict design and production specifications of HUGO BOSS. Incoming controls, supplier checks and quality tests in the Technical Development Center at the Metzingen head office ensure that the high quality standards of HUGO BOSS are complied with and that goods are delivered to customers smoothly and on time. Given this, the probability of quality risks is considered very low and the possible effect on earnings development is regarded as minor. — Sourcing and Production, p. 88
Raw materials and finished goods are stored only in a few selected locations. This consolidation trend will increase due to the establishment of a central distribution center for hanging goods at the Group headquarters in Metzingen. This may result in logistics risks relating, for example, to the failure or loss of warehouses. To counteract the risk of loss of raw materials or finished goods, which equals a loss of sales by disability to supply, strategically important warehouses are operated by the Group itself and comprehensive technical and organizational measures are taken for fire protection and security. Adherence to these measures is monitored on an ongoing basis. In addition, HUGO BOSS uses insurance policies to cover the direct financial risk of loss of goods in warehouses as well as a loss of its production sites. Financial effects are therefore rated low. In addition, the eventuality of logistics risks is considered highly unlikely.
Risks chiefly arise from the possibility that individual directly operated stores could fall short of the originally planned sales targets and, in extreme cases, might have to be closed. These cost risks are discussed under investment cost risks in the area of strategic risks.— Report on Risks and Opportunities, Strategic Risks, p. 136
The increasing share of the Group’s owN retAil busiNess may potentially entail a corresponding increase in inventory risks as a consequence of the general economic situation or weak develop-ment of the Group’s own retail stores. This may result in depreciation of inventories or ultimately in the destruction of goods. Differentiated retail formats and collections tailored to this are used to bring about a constant improvement in efficiency on the sales floors.
Quality risks
logistics risks
distribution risks
Notes AdditioNAl

144
h u G o b o s s Annual Report 2011 Group MANAGeMeNt report – the FiscAl YeAr
Report on Risks and Opportunities
Inventory management will continue to be of major importance. The challenge is to be able to respond to orders from customers at short notice while still optimizing inventories. Replenish-ment is coordinated by a central department to reduce inventory risk and to optimize the inventory position in general. Given the rising share of Group-operated retail, the management feels that inventory risks are possible. However, the effects of these risks on earnings, net assets and the financial position are rated low.
The Company strives to maintain a balanced customer structure to avoid potential dependency on individual customers in the wholesAle chANNel. The expansion of the Group’s own retail activities reduces reliance on the wholesale business. Key figures such as order levels, sales, and delivery rates are monitored on an ongoing basis in real time by the sales controlling department.Losses due to bad debts may be incurred in the wholesale channel. This risk depends on both the general economic development and the customers’ individual financial situation. The HUGO BOSS Group is therefore exposed to negative effects due to trading partners’ inability to pay or insolvency and cumulated defaults due to potential deterioration of the general economy in individual markets and regions. However, this risk is mitigated by the increase in the share of the Group’s own retail business in total sales. The Group-wide credit management system successfully implemented in the past, which operates in accordance with uniform rules, was further intensified by centrally coordinated measures. These measures focus on credit screening and on setting and adhering to customer credit limits, monitoring the receivables’ age structure, and managing doubtful accounts. In some cases, this also resulted in discontinuation of business with customers deemed not cred-itworthy. The Internal Audit department regularly reviews adherence to these Group guidelines. There was no concentration of default risks due to major receivables from individual customers as of the reporting date. Possible risks in connection with default by wholesale partners are therefore considered low overall. — Notes to the Consolidated Financial Statements, note no. 15, p. 201
External conditions such as the coMpetitioN result in changes in demand for HUGO BOSS products and higher price pressure in the sales markets affected.
To reduce the risk of Group companies granting excessive discounts, margin and earnings targets are defined in advance for each individual market and each distribution channel to limit the discounts offered. In addition, the discounts granted are monitored on an ongoing basis, both for wholesale and the Group’s own retail operations, and internal corporate guidelines are complied with. The management assumes that while it is possible for discounts to be granted, this has only a minor impact on the Group’s planned earnings development.

145
Report on Risks and Opportunities h u G o b o s s Annual Report 2011
organizational risksThe uniform IT infrastructure across the Group facilitates smooth business operations. To reduce risks such as system interruptions, data loss, and unauthorized access, a number of measures are implemented in the form of multi-level security and virus plans, issuing access rights, access control systems and independent energy supplies. The management is currently assuming that the occurrence of IT risks is highly unlikely. The extent of the impact of risks in the IT infrastructure is classed moderate.
As part of global business operations, legal and tax risks may arise. To avert litigation to the greatest extent possible, all significant legal transactions of the HUGO BOSS Group are reviewed and approved by the central legal department. The legal department works closely with local attorneys and the Group’s subsidiaries in this process. Liability risks are reduced by insurance policies in effect throughout the organization. Adequate provisions were made in the past fiscal year for court costs and costs for legal counsel. The risk of further legal risks is considered possible, though the management feels that their impact on the earnings, net assets and financial position of the Group would be low.
Tax issues are regularly analyzed and assessed by the central tax department in cooperation with third-party tax consultants. Tax risks are possible for all outstanding assessment periods. Appro-priate provisions have been recognized in the past for tax risks already known about. Beyond this, the management is not aware of any specific risks in addition to the general tax audit risk that could have a negative impact on the planned earnings development of the Group.
Risks relating to personnel arise mainly from shortages of potential staff in the recruitment process, a lack of specialist staff and fluctuation. These risks are limited due to comprehensive profes-sional development measures, performance-oriented compensation and succession planning at an early stage. Employee development and career planning is also promoted in a targeted way with comprehensive talent and performance management. The personnel risks described are considered possible given the current HR requirements within the Group with a moderate effect on planned earnings development at the same time. — Employees, p. 76
HUGO BOSS is characterized by a corporate culture that is based on trust and utilizes flat hierar-chies. Independent thinking and own initiative are promoted at all levels. Despite extensive and multilevel auditing and controlling mechanisms, access to confidential information and the high level of entrepreneurial responsibility may be abused. HUGO BOSS has therefore included appropriate regulations in its employment contracts with all employees in line with good corporate governance. Individuals who are considered insiders as defined by securities legislation are listed in an insider register and are required to comply with the pertinent regulations. The existing authorization regula-tions are also reviewed and updated on a regular basis.
it risks
legal risks
personnel risks
risks relating to corporate governance and compliance
Notes AdditioNAl

146
h u G o b o s s Annual Report 2011 Group MANAGeMeNt report – the FiscAl YeAr
Report on Risks and Opportunities
All HUGO BOSS Group employees are required to adhere to the general code of conduct that applies throughout the Group as well as to additional specific compliance regulations. A compre-hensive training program on compliance was conducted in the past fiscal year. Adherence to the compliance regulations is monitored centrally and reported to the Managing Board. Violations of compliance regulations are therefore considered highly unlikely. Non-compliance could have a moderate financial impact.
In addition, suppliers are contractually obliged to adhere to social standards governing areas such as occupational health and safety, prohibition of child labor and adequate wages. This is monitored by means of regular audits. If infringements of standards and statutory provisions are identified, the audit frequency is increased depending on the seriousness of the infringement and a binding plan of measures with renewed implementation control is agreed together with the suppliers. In serious cases, the cooperation may be terminated. The Managing Board currently considers non-compliance with the Group’s social standard possible. This could have a moderate impact on the earnings, net assets and financial position of the Group. — Sustainability, p. 89 — Corporate Governance Report, p. 41
Assessment of the risk situation by the managementBoth the parent company and all the subsidiaries operate with the same kind of risk analysis and risk management, which is the organizational precondition for early detection of risks. Risks are uniformly quantified in the same way, namely by calculating their influence on EBIT and/or cash flow.
There are no individual or combined risks that could jeopardize the Group’s continuation as a going concern according to current information.
report oN the AccouNtiNG-relAted iNterNAl coNtrol sYsteM ANd the risk MANAGeMeNt sYsteM iN AccordANce with sectioN 289 pArAGrAph 5 ANd sectioN 315 pArAGrAph 2 No. 5 oF the GerMAN coMMerciAl code (hGb)The goal of the Internal Control and Risk Management System as it applies to the accounting process and the preparation of the financial statements of the HUGO BOSS Group is to record, present and value all transactions correctly on the balance sheet. The clear definition of areas of responsibility in the finance department of HUGO BOSS AG and the proper continued professional education of employees, together with the use of the suitable software and uniform prescriptive guidelines, constitutes the basis for a proper, efficient and consistent accounting process. This ensures that the assets and liabilities are recognized, valued and reported correctly in the consolidated financial statements so that they represent a reliable statement about the Group’s earnings, net assets, financial position and cash flow.
Management controls in all business divisions require correct and up-to-date information. This means that business information and reporting systems are extremely important. The quality of control over operations has been greatly improved by the introduction of SAP AFS, SAP Retail and the Business Intelligence Services system (BIS) throughout the Group. BIS contains numerous key performance indicator reports for both the finance department and all operational divisions that can be can accessed daily.
Accounting-related it systems

147
Report on Risks and Opportunities h u G o b o s s Annual Report 2011
In the finance department, the comprehensive monthly reporting package is one of the most important reporting instruments. As part of standardized Group-wide reporting, all HUGO BOSS companies provide detailed information on the most important balance sheet and income statement items, as well as key figures and additional comments. Both the reporting dates and the content for this are stipulated by the central finance department and are binding. There are automated and standardized reporting formats for a large part of the reporting content. Professional responsibility for this lies with the central finance and controlling departments. In addition to centrally updating the master data of the uniform Group-wide chart of accounts, this also involves reviewing the reporting formats on an ongoing basis with regard to compliance with the applicable international standards for financial reporting. In addition, the uniform Group-wide mapping of HUGO BOSS’ transactions is reviewed at regular intervals and corrected if the presentation differs from the actual transactions.
In order to prevent unauthorized access to accounting-related data and to ensure the integrity, availability and authenticity of the data at all times, the SAP Security Policy (part of the IT Security Guideline) was implemented throughout the Group. This guideline also includes requirements for monitoring compliance in the finance department. The IT security for accounting-related processes is supplemented with system-supported controls and workflow-based processes which stipulate a checks-and-balances principle, appropriate separation of functions, and approval processes. These include invoice auditing and authorization, purchasing processes and SAP rights management.
In addition, the IT authorization required by employees is defined by their roles, which reflect jobs or positions within the company. In order to ensure a proper separation of functions in the SAP systems, HUGO BOSS began fully implementing special detection software in 2009. This compares the rights profile of a user with a pre-installed SoD (Segregation of Duties) schedule. The software allows critical rights to be identified and appropriate countermeasures to be initiated.
The Group-wide rights management and role definition also come under the responsibility of the central IT departments of HUGO BOSS AG in Metzingen.
All subsidiaries of the HUGO BOSS Group are independent legal entities. Each market is run by a Managing Director who is responsible for business operations and a Finance Manager for all accounting-related matters. The areas of responsibility of the Finance Manager in each market include continuous monitoring of key performance indicators, monthly reporting of key financial indicators to the central finance department, and preparation of the three-year plan. In addition, new investment projects, particularly in the area of the Group’s own retail business, must be analyzed with reference to their feasibility and profitability and then agreed with the HUGO BOSS AG finance department.
organization of accounting and accounting-related guidelines
Notes AdditioNAl

148
h u G o b o s s Annual Report 2011 Group MANAGeMeNt report – the FiscAl YeAr
Report on Risks and Opportunities
As the functional superior of all Finance Managers, the Chief Financial Officer of HUGO BOSS AG is authorized to issue directives and is therefore responsible for worldwide financial management.
Furthermore, the Finance Managers and Managing Directors of HUGO BOSS companies issue what is known as a CFO Certificate every quarter confirming adherence to certain defined principles and the exercise of management controls. Some of these controls are integrated in the SAP Schedule Manager system. Reports are also submitted on the appropriateness of the controls for ensuring data integrity and data access protection, and on cases of fraud or major violations of the Internal Control System.
In addition to providing active support for all business divisions and Group companies, the central finance department in Metzingen is also responsible for preparing and updating uniform guidelines and instructions for accounting-related processes. This chiefly pertains to preparing and updating a guideline on allowances for doubtful accounts, an investment guideline, the IAS/IFRS accounting manual and clear requirements for intercompany reconciliation. In addition, the first edition of the “FI/CO Bible”, which is updated at regular intervals, was sent to all finance employees in the HUGO BOSS Group in the fiscal year 2010. Based on the mandatory requirements of the Interna-tional Financial Reporting Standards, the “FI/CO Bible” contains detailed instructions on mapping the relevant transactions in the SAP AFS financial accounting system. This includes the presentation in both financial accounting and controlling reports. It ensures uniform Group-wide presentation and accounting while also serving as a reference for all employees in the worldwide finance depart-ments. The central e-mail address which was set up also gives employees the opportunity to quickly address open questions to the central finance departments.
Questions on specific accounting or valuation matters relevant to the HUGO BOSS Group are also dealt with centrally, where they are analyzed and documented before being communicated to the HUGO BOSS Financial Community. Major accounting issues and changes to the relevant IAS/IFRS standards and interpretations are discussed with the Group’s auditors at regular meetings which take place at least once a quarter. Professional development events are also organized at regular intervals, and updates on accounting-related topics are communicated in the Accounting Newsletter and listed on the Group Intranet in the Finance Forum. Training is given in a financial college for junior employees in the finance department. The responsible Finance Managers meet once a year at the Finance Managers’ Meeting.
The Internal Audit department is part of the Internal Control System and reviews the specified controls for compliance and effectiveness as part of its monitoring function. The annual audit plan and the areas it will focus on are agreed with the Managing Board. Ad-hoc audits may be carried out at any time. All audit reports are reported directly to the Chief Financial Officer and to other Managing Board members as appropriate. In addition, the Internal Audit department submits regular reports to the Audit Committee.
149
Report on Risks and Opportunities h u G o b o s s Annual Report 2011
opportuNities reportSystematically identifying and exploiting value-enhancing business opportunities is a key element of ensuring profitable growth of the Company.
On account of the direct connection with the goals and strategy of the relevant business division, responsibility for identifying, assessing and exploiting opportunities lies with the operational management in the regions and central functions. Opportunities are always considered in conjunc-tion with potential risks and are pursued only if they outweigh the risks associated with them and if these risks are considered manageable and limited in terms of their potential effects.
Opportunity management is directly linked with Group planning. Opportunities that have been iden-tified and assessed on the basis of their contribution to the enterprise value are incorporated in the annual budget and long-term strategic planning. In dialog with the operating units, the Managing Board makes the decision on their implementation and allocates the resources required for this.
HUGO BOSS has identified the following major opportunities arising both from the business envi-ronment and also from the Group strategy itself.
Industry experts anticipate strong global growth in the market segment relevant to the premium and luxury goods sector. For instance, some analysts expect the sector’s target group to double by 2025 as a result of a growing middle class. Above-average growth is anticipated in emerging markets. High increases are expected on the Chinese market in particular due to rising per capita income and the high share of total disposable income spent on consumption as compared to other regions of the world. On the basis of its strategic orientation and the strength of its brands, the Group considers itself to be in a good position to benefit from this development in China and other markets. It is working to realize the identified growth potential through market entry and market cultivation strategies specifically tailored to the individual countries.
The importance of monobrand sales formats has increased steadily in recent years, particularly in the fashion industry. Customers in many major growth markets prefer monobrand sales formats to multibrand sales formats of the kind that have been established in Western Europe and North America for decades. Even in these regions, however, monobrand sales space is increasingly being established in traditional multibrand sales formats such as department stores. Retail expertise is indispensible for managing this sales space. The HUGO BOSS Group’s continuous improvement in its capabilities in this area opens up major opportunities for it to generate above-average sales and profit growth from direct sales to end consumers in addition to its established wholesale business. As well as opening new stores, selective acquisition of franchise partners and active management of wholesale floor space offer further attractive opportunities for growth. — Group Strategy, p. 66
decentralized organiza-tion of opportunity management
close links with Group planning
significant growth in the relevant customer segment
Growing importance of new forms of distribution
Notes AdditioNAl

150
h u G o b o s s Annual Report 2011 Group MANAGeMeNt report – the FiscAl YeAr
Report on Risks and Opportunities
In the fiscal year 2011, the HUGO BOSS Group optimized key operational processes in product development, production, sourcing and sales in order to gear itself more strongly towards the needs of end consumers and improve its ability to react to market changes. The Group intends to further increase the appeal of its brands both in its own retail business and in wholesale business in particular through a reduced time to market, a focused product range and more frequent collection changeovers. On this basis, the Group sees considerable opportunities for increasing customer traffic in own retail, tapping new sales potential in wholesale business and generating profit growth through increased efficiency.
The Internet is becoming increasingly important for the premium and luxury segment of the global fashion industry, both as a sales channel and also as a means of communication. A growing number of consumers value the advantages of shopping online in terms of the choice of products, service and comfort. HUGO BOSS has therefore significantly expanded its online distribution and optimized it with regard to user friendliness and service quality. The Group also uses digital media to allow consumers to experience its brands first hand. For instance, in 2011 a competition was held on the HUGO BOSS website allowing visitors to the site to design the driving suits to be worn by the McLaren Formula 1 racing team in the final race of the season. The Group is also increasingly broad-casting fashion shows on the Internet. HUGO BOSS believes that this offers good opportunities for enhancing the image of its brands, strengthening existing consumer relationships and gaining new customers.
HUGO BOSS has a unique positioning in the global fashion market. All of the Group brands stand for excellent quality, outstanding workmanship and modern design. With its brands, the Group appeals to a wide public across the whole spectrum of the premium fashion market – from the avant-garde HUGO brand to the BOSS Orange lifestyle brand. With BOSS Selection, HUGO BOSS also has an authentic product range in the luxury segment. The Group sees good opportunities for further improving customers’ perception of the brands by means of differentiated brand management with regard to products, presentation and communication and thereby achieving positive sales and earnings effects.
HUGO BOSS holds the leading market position particularly in premium menswear in many regions. In the womenswear market, however, it has a much lower penetration in most markets. On the basis of its product expertise and the continuous improvement in its image and credibility in womens-wear, HUGO BOSS is confident that it can increase the appeal of its brands in this consumer segment and gain market share. On the path to achieving this goal, HUGO BOSS sees considerable potential in the areas of shoes and accessories. In combination with its apparel range, HUGO BOSS therefore offers complete outfits, which play an important role in consumers’ buying decisions in the womenswear segment.
More efficient proces-ses gear company
more strongly towards end consumers
Growing importance of the internet for the
brand image
Multi-brand strategy for targeting differ-entiated customer
segments
improvement in the market position in
womenswear, shoes and accessories

151
Subsequent Events and Outlook h u G o b o s s Annual Report 2011
subseQueNt eveNts ANd outlook
huGo boss expects to exceed the previous year’s results in 2012. the implementa-tion of the medium-term growth strategy will help the Group to raise its sales and its operating result to new record levels. All regions and distribution channels are expected to report a year-on-year increase after adjustment for currency effects, with above-average growth anticipated particularly in the Asia/pacific region and in the Group’s own retail business. the operating result (ebitdA before special items) is likely to see stronger growth than sales, primarily due to the expansion of the Group’s own retail business and efficiency improvements.
subseQueNt eveNtsOn January 24, 2012, the HUGO BOSS Group announced its intention to construct a new distribu-tion center in Filderstadt, a flagship outlet in Metzingen and a new office building at the location in Metzingen in the coming years. It is thereby supporting the growth planned for the coming years. The total expenditure is expected to amount to around EUR 150 million.
Between the end of the fiscal year 2011 and the approval for publication of this report on February 17, 2012, there were no further significant macroeconomic, socio-political, sector-related or company-specific changes that the management expects will have a material influence on the results of operations, net assets and financial position of the Company.
outlookThe following report sets out the HUGO BOSS management’s forecasts for the future business performance and describes the anticipated development of the main national economic and sector-specific conditions. It reflects the current knowledge of the management at the time the report was prepared, while also aware that the actual development may differ considerably from these forecasts, either positively or negatively, due to the occurrence of risks and opportunities as described in the report on risks and opportunities. Other than the statutory publication require-ments, the HUGO BOSS Group does not assume any obligation to update the statements contained in this report. — Report on Risks and Opportunities, p.133
huGo boss expands logistics capacity and strengthens the location
No further reportable events
Notes AdditioNAl

152
h u G o b o s s Annual Report 2011 Group MANAGeMeNt report – the FiscAl YeAr
Subsequent Events and Outlook
The global economic development and the growth prospects of the premium and luxury segment for apparel, shoes and accessories have a major impact on the anticipated business development of the HUGO BOSS Group.
Since the second half of 2011, uncertainty regarding the forecast for the general economic develop-ment has increased significantly. The economic outlook seems to depend mainly on the extent to which the European and U.S. governments and central banks will succeed in stemming the repercussions of the sovereign debt crisis. There is general agreement that global economic growth is likely to slow further in 2012. Experts anticipate growth of only around 2% in 2012, with consider-able regional differences.
In the euro zoNe, efforts to reduce debt are likely to curb growth further. Tax hikes and spending cuts are expected to reduce investment and consumer demand. Furthermore, in spite of monetary easing measures by the European Central Bank (ECB), the effects of the banking crisis associated with the sovereign debt crisis on the real economy are difficult to predict. In Central and Eastern Europe, future growth could slow. For the European Union (EU), only stagnating economic growth is anticipated overall in 2012. Germany is expected to see above-average growth compared to the region as a whole. Low unemployment and stable domestic demand should contribute to this.
In the u.s., initial signs of a slow economic recovery can be observed. However, sentiment remains subdued due to the high level of sovereign debt, significant uncertainty regarding the economic outlook, and persistently high unemployment. Economists expect growth of close to 2% in the U.S. for 2012 as a whole. The weaker economic outlook throughout the world is also likely to have an impact on the lAtiN AMericAN economy because of growing trade and capital links. Nonetheless, the region is still forecasted to grow by around 4% year-on-year.
Forecasts for the AsiA region have also been revised downwards by experts in recent months, although relatively strong economic growth of approximately 7% (excluding Japan) is still assumed for 2012. Persistently strong consumer demand and sustained corporate capital expenditure should support expansion. Although fears of growth slowing in China have increased in recent months because of weaker demand for exports and overheating tendencies within China, econo-mists nonetheless anticipate growth of over 8% in 2012. In Japan, a moderate recovery from the consequences of the severe earthquake at the beginning of 2011 is still expected. However, growth in Japan is also heavily dependent on global economic developments because of the country’s substantial export activities.
slowdown in global economic growth
anticipated
sovereign debt crisis impacts growth
prospects in the euro zone
American economy to see moderate growth
continued high speed of growth in Asia

153
Subsequent Events and Outlook h u G o b o s s Annual Report 2011
Following the positive development in the premium and luxury goods sector in 2011, continued growth is expected in 2012 despite global macroeconomic uncertainties. Assuming constant exchange rates, industry experts are forecasting average sector growth of 6% to 7% per year in the medium term.
The difficulty of predicting the consequences of the European sovereign debt crisis and the associ-ated deteriorating prospects for the economy also risk having a negative impact on the premium and luxury goods industry in the short term due to falling consumer confidence and increasingly restrained consumption. However, the development of the sector should continue to be boosted particularly by growing demand in emerging economies. This demand is also expected to foster the sales performance in Europe and the Americas in the form of tourism. Many providers are planning to expand their own store network. Continued high growth rates are also anticipated for the online channel.
In westerN europe and North AMericA, sector growth in 2012 will be driven particularly by the ongoing expansion of own retail activities. Continued consolidation of the sector is expected in both of these markets. Tapping of regions outside the major cities is also likely to increase. Great potential is ascribed to Russia, the Middle East and Latin America.
In AsiA, the Chinese market is likely to remain the major growth driver. As a result of the constantly growing middle class with higher income, the relevant consumer segment for the premium and luxury goods sector is expanding very fast in this market. The menswear segment, which is bene-fiting from an increasingly fashion-conscious consumer segment, is considered capable of gener-ating particularly high growth rates. This development is expected to particularly benefit European brands whose products are perceived by the consumers as particularly high-quality and valuable. The expansion of own retail activities in China is likely to continue particularly in the comparatively smaller cities. In addition to China, other emerging economies in the region are also expected to see above-average growth. In Japan, too, industry experts anticipate a slow recovery of the market.
HUGO BOSS expects to increase its sales further on a currency-neutral basis in 2012. The Group anticipates that this growth will exceed the growth rates for the global economy and the luxury goods sector.
positive outlook for premium and luxury goods sector
demand from emerging economies supports sector growth
continued retail expansion in western europe and North America
china is key engine of sector growth in Asia
Further increase in currency-neutral sales
Notes AdditioNAl

154
h u G o b o s s Annual Report 2011 Group MANAGeMeNt report – the FiscAl YeAr
Subsequent Events and Outlook
All regions will contribute to the forecasted sales increase for the Group as a whole in 2012, with the Asia/Pacific region expected to see the strongest growth. Due in particular to the significant expansion of market presence in China, a double-digit increase in sales is anticipated in this region. In Europe, growth is expected in all major markets. However, the countries directly affected by the debt crisis may see a comparatively weaker development. In the Americas, the U.S. market is likely to remain the major growth driver. Sales in the royalties segment should also develop positively.
Own retail will be the main sales driver for the Group also in 2012. Own retail sales are expected to increase at a double-digit rate, mainly as a result of strong growth in directly operated stores and online. In addition to the positive effects of the expansion of the Group’s own store network, comp store revenues are also forecasted to rise. The Group is benefiting here from further professionaliza-tion of its retail activities and the strong appeal of its brands. Wholesale sales are also expected to increase. This forecast is chiefly based on the trading partners’ positive feedback on the new collec-tions. The acquisitions of stores previously operated by franchise partners that were carried out in the past fiscal year or are planned for the future in, for example, China and Taiwan will lead to a rise in sales in the Group’s own retail business that will more than compensate for the loss of wholesale sales associated with the acquisitions.
The HUGO BOSS Group will continue to expand its own retail activities and increase the number of directly operated stores in 2012. China will be a major focus in terms of store openings, but the Group also sees attractive opportunities for further expansion of its retail network in Europe and, to a lesser extent, in the Americas.
HUGO BOSS plans to increase its operating result (EBITDA before special items) in 2012. EBITDA growth is expected to exceed the increase in sales. The main drivers of this development will be the expansion and improved management of the Group’s own retail business and efficiency increases in product development and sourcing. Operating expenses will grow mainly due to the further expansion of own retail activities and higher marketing expenses for sharpening brand differentia-tion. Research and development costs are also expected to rise. As a result of the EBITDA improve-ment before special items, net income is also forecasted to grow.
Growth in all regions
own retail business remains engine of sales
growth
continued sales space expansion in own retail
increase in operating result

155
Subsequent Events and Outlook h u G o b o s s Annual Report 2011
Strict management of trade net working capital continues to be a high priority so as to generate improvements in operating cash flow. Particular attention is given to reducing the cash conver-sion cycle. Potential for improvement is seen particularly in increasing inventory turnover. The D.R.I.V.E. project is aiming to improve inventory turnover, especially in the own retail business. Overall, the Group expects trade net working capital to grow more slowly than Group sales in 2012. — Further information on D.R.I.V.E. can be found in Group Strategy, p. 69
In 2012 capital expenditure will continue to focus on expanding own retail activities and renovating existing stores and shops. Furthermore, additional spending in connection with the planned construc-tion of a new distribution center for flat-packed goods, a flagship outlet in Metzingen and an increase in office space at the Company’s headquarters are also planned. However, the Group has not yet reached a decision on how these planned measures will be financed, hence their accounting cannot yet be fully anticipated. Without taking into account the expenses to be capitalized in connection with these new projects, the Group’s capital expenditure in 2012 will be roughly on par with the previous year’s level.
The Group anticipates that cash flow will develop strongly in 2012, primarily due to the planned operating result improvement, strict management of trade net working capital, and disciplined investment activity. In addition to the dividend payment, excess funds are to be used to further reduce debt. Accordingly, the Group expects net debt at the end of the year to be lower than in the previous year. Due to the long-term financing through a syndicated loan that was concluded on favorable terms, as well as the strong internal financing capability, the Group is not planning any major financing activities in 2012.
HUGO BOSS pursues a profit-based dividend policy under which the shareholders participate appro-priately in the Group’s earnings development. Between 60% and 80% of net income is to be distrib-uted to the shareholders on a regular basis. On the basis of the significant increase in profit in the past fiscal year and the positive expectations for 2012, the Managing Board and Supervisory Board intend to propose to the Annual Shareholders’ Meeting on May 3, 2012 a dividend of EUR 2.89 per preferred share (2010: EUR 2.03) and EUR 2.88 per common share (2010: EUR 2.02) for fiscal year 2011. The proposal corresponds to a payout ratio of 70% of consolidated net income attributable to the equity holders of the parent company in 2011 (2010: 75%). Provided the shareholders approve the proposal, the dividend will be paid out on the day following the Annual Shareholders’ Meeting, i.e. on May 4, 2012. Based on the number of shares outstanding at the end of the year, the amount distributed will total EUR 199 million (2010: EUR 140 million).
strict management of trade net working capital
own retail focus of investment activities
continued strong cash flow development
dividend per share rises substantially
Notes AdditioNAl

156
H U G O B O S S Annual Report 2011 GrOUp ManaGeMent repOrt – tHe FiScal Year
Subsequent Events and Outlook
The Group plans to generate significant sales and earnings increases in the medium term. The Group strategy is based on organic growth of the existing brand portfolio. In 2015, Group sales are expected to reach EUR 3 billion, with an operating result of EUR 750 million. The Group expects to make further progress towards achieving these goals in 2013. The potential exac-erbation of the sovereign debt crisis and its effects on the real economy, cost inflation in the sourcing processes and loss of appeal of the Group’s brands could jeopardize achieve-ment of these goals. The Group has taken precautions to limit the probability of these or other risks occurring and the effects if they do occur. Details can be found in the Risk Report. — Group Strategy, p. 68 — Report on Risks and Opportunities p. 133
Overall statement on the expected development of the GroupThe HUGO BOSS management expects continued increases in Group sales and earnings in 2012. In its opinion, the Group’s long-term strategic orientation offers additional potential for profitable growth and for the achievement of the sales and earnings targets set for 2015.
Metzingen, February 17, 2012
HUGO BOSS AGThe Managing Board
claUS-DietricH laHrS
cHriStOpH aUHaGen
Mark lanGer
ambitious medium-term growth plans

CONSOLIDATED FINANCIAL STATEMENTS
04
Notes AdditioNAl


h u G o b o s s Annual Report 2011
159
Contents
160 Consolidated Income Statement161 Statement of Comprehensive Income162 Consolidated Balance Sheet164 Statement of Changes in Consolidated Equity166 Consolidated Statement of Cash Flows167 Notes to the Consolidated Financial Statements
for Fiscal Year 2011189 Notes to the Consolidated Income Statement196 Notes to the Consolidated Balance Sheet215 Other Disclosures232 Information Concerning the Majority Shareholder243 Managing Board244 Supervisory Board246 Additional Information on the Duties of Supervisory Board
and Managing Board Members248 Responsibility Statement249 Auditor’s Report
CONTENTS04 coNsolidAted FiNANciAl stAteMeNts
AdditioNAl

160
h u G o b o s s Annual Report 2011 coNsolidAted FiNANciAl stAteMeNts
Consolidated Income Statement
coNsolidAted iNcoMe stAteMeNtof the huGo boss Group for the period from January 1 to december 31, 2011
in EUR thousand Notes – no. 2011 2010
Net sales ( 1 ) 2,058,841 1,729,446
Cost of Sales ( 2 ) (756,552) (661,798)
Direct selling expenses ( 2 ) (37,452) (40,470)
Gross profit 1,264,837 1,027,178
in % of Sales 61.4 59.4
Selling and distribution expenses ( 3 ) (682,155) (574,430)
Administration costs and other operating income/expenses
( 4 )
(188,592)
(188,805)
operating result 394,090 263,943
Net interest income/expense (16,199) (17,285)
Other interest and similar income 4,721 3,283
Interest and similar expenses (20,920) (20,568)
other financial items 4,500 2,497
Financial result ( 5 ) (11,699) (14,788)
earnings before taxes 382,391 249,155
Income taxes ( 6 ) (91,424) (59,927)
Net income 290,967 189,228
Attributable to:
Equity holders of the parent company 284,493 185,895
Minority interests ( 7 ) 6,474 3,333
Net income 290,967 189,228
earnings per share (eur) 1 ( 8 )
Common share 4.12 2.69
Preferred share 4.13 2.70
dividend per share (eur) ( 22 )
Common share 2.882 2.02
Preferred share 2.892 2.03
1 Basic and diluted earnings per share.
2 2011: Recommendation for dividend paymen

Statement of Comprehensive Income h u G o b o s s Annual Report 2011
161
stAteMeNt oF coMpreheNsive iNcoMeof the huGo boss Group for the period from January 1 to december 31, 2011
in EUR thousand 2011 2010
Net income 290,967 189,228
Market valuation of hedges 5,486 2,670
Currency differences 5,314 15,263
income and expense recognized directly in equity 10,800 17,933
total comprehensive income 301,767 207,161
Attributable to:
Equity holders of parent company 295,354 204,403
Minority interests 6,413 2,758
total comprehensive income 301,767 207,161
AdditioNAl

162
h u G o b o s s Annual Report 2011 coNsolidAted FiNANciAl stAteMeNts
Consolidated Balance Sheet
coNsolidAted bAlANce sheetof the huGo boss Group as of december 31, 2011
Assetsin EUR thousand Notes no. 2011 2010
Intangible assets ( 10 ) 141,098 126,937
Property, plant and equipment ( 11 ) 285,530 264,415
Deferred tax assets ( 6 ) 79,236 48,970
Non-current financial assets ( 13 ) ( 28 ) 13,744 20,843
Non-current tax receivables 2,660 3,141
Other non-current assets ( 13 ) 2,679 2,878
Non-current assets 524,947 467,184
Inventories ( 14 ) 457,913 377,330
Trade receivables ( 15 ) 174,576 133,365
Current tax receivables ( 6 ) 8,166 8,847
Current financial assets ( 13 ) ( 28 ) 11,701 10,621
Other current assets ( 13 ) 71,317 61,921
Cash and cash equivalents ( 16 ) 200,396 294,884
Assets classified as held for sale ( 12 ) 0 1,290
current assets 924,069 888,258
total assets 1,449,016 1,355,442

Consolidated Balance Sheet h u G o b o s s Annual Report 2011
163
eQuitY ANd liAbilitiesin EUR thousand Notes no. 2011 2010
Subscribed capital ( 17 ) 70,400 70,400
Own shares ( 18 ) (42,363) (42,363)
Capital reserve ( 19 ) 399 399
Retained earnings ( 20 ) 207,339 161,194
Accumulated other comprehensive income ( 21 ) (20,859) (31,720)
Profit attributable to equity holders of the parent company
284,493
185,895
equity attributable to equity holders of the parent company
499,409
343,805
Minority interests ( 7 ) 23,829 17,416
Group equity 523,238 361,221
Non-current provisions ( 23 ) ( 24 ) 40,880 39,047
Non-current financial liabilities ( 25 ) ( 28 ) 355,042 514,122
Deferred tax liabilities ( 6 ) 49,554 24,878
Other non-current liabilities ( 26 ) 15,558 27,107
Non-current liabilities 461,034 605,154
Current provisions ( 23 ) 89,822 86,807
Current financial liabilities ( 25 ) ( 28 ) 33,464 18,814
Income tax payables ( 6 ) 36,322 37,615
Trade payables ( 27 ) 225,145 187,991
Other current liabilities ( 26 ) 79,991 57,840
current liabilities 464,744 389,067
total equity and liabilities 1,449,016 1,355,442
AdditioNAl

164
h u G o b o s s Annual Report 2011 coNsolidAted FiNANciAl stAteMeNts
Statement of Changes in Consolidated Equity
stAteMeNt oF chANGes iN coNsolidAted eQuitYof the huGo boss Group for the period from January 1 to december 31, 2011
retained earnings
Accumulated other comprehensive income
in EUR thousand
subscribedcapital
own shares
capital reserve
legal reserve
other reserves
difference arising
from currency translation
Market valuation of hedges
profit attributable to
equity holders of the parent
equity attributable to equity holders
of the parent
Minority interests
Group equity
Notes no. ( 17 ) ( 18 ) ( 19 ) ( 20 ) ( 20 ) ( 21 ) ( 21 ) ( 7 )
January 1, 2010 70,400 (42,363) 399 6,641 117,142 (30,691) (19,537) 104,003 205,994 (519) 205,475
Total comprehensive income 15,838 2,670 185,895 204,403 2,758 207,161
Changes in scope of consolidation 15,177 15,177
Allocated to retained earnings 104,003 (104,003)
Dividend payment (66,592) (66,592) (66,592)
Share repurchase
december 31, 2010 70,400 (42,363) 399 6,641 154,553 (14,853) (16,867) 185,895 343,805 17,416 361,221
Total comprehensive income 5,375 5,486 284,493 295,354 6,413 301,767
Changes in scope of consolidation
Allocated to retained earnings 185,895 (185,895)
Dividend payment (139,750) (139,750) (139,750)
Share repurchase
december 31, 2011 70,400 (42,363) 399 6,641 200,698 (9,478) (11,381) 284,493 499,409 23,829 523,238

Statement of Changes in Consolidated Equity h u G o b o s s Annual Report 2011
165
stAteMeNt oF chANGes iN coNsolidAted eQuitYof the huGo boss Group for the period from January 1 to december 31, 2011
retained earnings
Accumulated other comprehensive income
in EUR thousand
subscribedcapital
own shares
capital reserve
legal reserve
other reserves
difference arising
from currency translation
Market valuation of hedges
profit attributable to
equity holders of the parent
equity attributable to equity holders
of the parent
Minority interests
Group equity
Notes no. ( 17 ) ( 18 ) ( 19 ) ( 20 ) ( 20 ) ( 21 ) ( 21 ) ( 7 )
January 1, 2010 70,400 (42,363) 399 6,641 117,142 (30,691) (19,537) 104,003 205,994 (519) 205,475
Total comprehensive income 15,838 2,670 185,895 204,403 2,758 207,161
Changes in scope of consolidation 15,177 15,177
Allocated to retained earnings 104,003 (104,003)
Dividend payment (66,592) (66,592) (66,592)
Share repurchase
december 31, 2010 70,400 (42,363) 399 6,641 154,553 (14,853) (16,867) 185,895 343,805 17,416 361,221
Total comprehensive income 5,375 5,486 284,493 295,354 6,413 301,767
Changes in scope of consolidation
Allocated to retained earnings 185,895 (185,895)
Dividend payment (139,750) (139,750) (139,750)
Share repurchase
december 31, 2011 70,400 (42,363) 399 6,641 200,698 (9,478) (11,381) 284,493 499,409 23,829 523,238
AdditioNAl
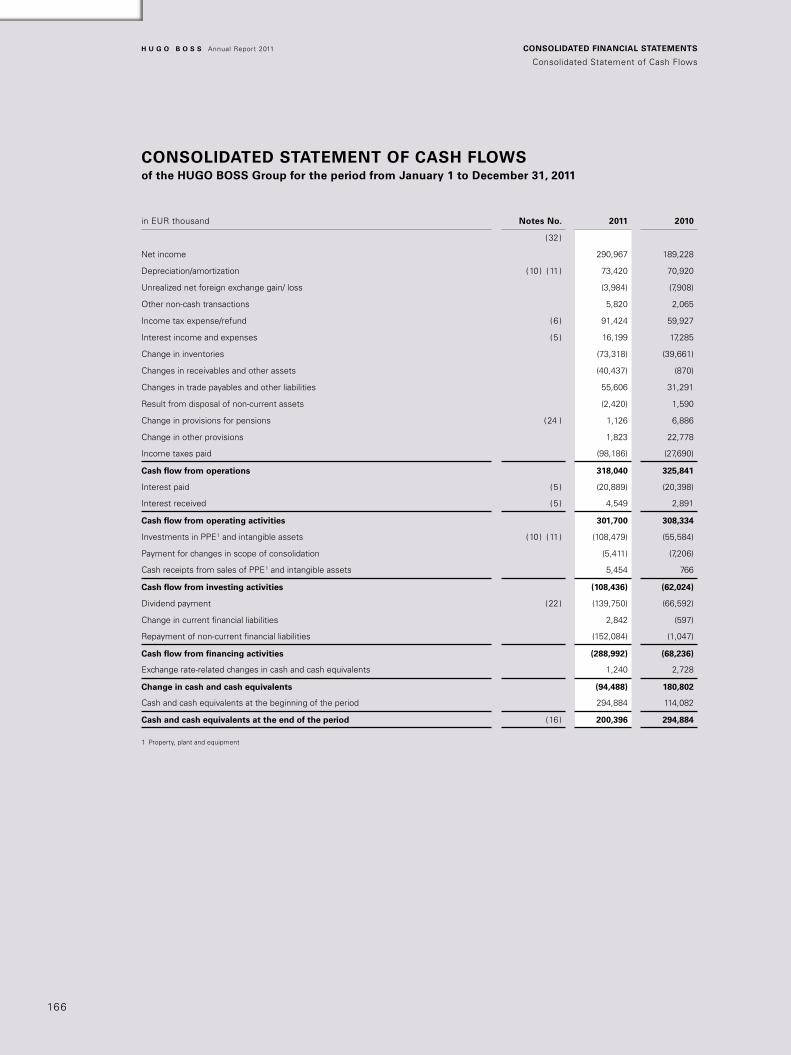
166
h u G o b o s s Annual Report 2011 coNsolidAted FiNANciAl stAteMeNts
Consolidated Statement of Cash Flows
coNsolidAted stAteMeNt oF cAsh Flowsof the huGo boss Group for the period from January 1 to december 31, 2011
in EUR thousand Notes No. 2011 2010
( 32 )
Net income 290,967 189,228
Depreciation/amortization ( 10 ) ( 11 ) 73,420 70,920
Unrealized net foreign exchange gain/ loss (3,984) (7,908)
Other non-cash transactions 5,820 2,065
Income tax expense/refund ( 6 ) 91,424 59,927
Interest income and expenses ( 5 ) 16,199 17,285
Change in inventories (73,318) (39,661)
Changes in receivables and other assets (40,437) (870)
Changes in trade payables and other liabilities 55,606 31,291
Result from disposal of non-current assets (2,420) 1,590
Change in provisions for pensions ( 24 ) 1,126 6,886
Change in other provisions 1,823 22,778
Income taxes paid (98,186) (27,690)
cash flow from operations 318,040 325,841
Interest paid ( 5 ) (20,889) (20,398)
Interest received ( 5 ) 4,549 2,891
cash flow from operating activities 301,700 308,334
Investments in PPE 1 and intangible assets ( 10 ) ( 11 ) (108,479) (55,584)
Payment for changes in scope of consolidation (5,411) (7,206)
Cash receipts from sales of PPE 1 and intangible assets 5,454 766
cash flow from investing activities (108,436) (62,024)
Dividend payment ( 22 ) (139,750) (66,592)
Change in current financial liabilities 2,842 (597)
Repayment of non-current financial liabilities (152,084) (1,047)
cash flow from financing activities (288,992) (68,236)
Exchange rate-related changes in cash and cash equivalents 1,240 2,728
change in cash and cash equivalents (94,488) 180,802
Cash and cash equivalents at the beginning of the period 294,884 114,082
cash and cash equivalents at the end of the period ( 16 ) 200,396 294,884
1 Property, plant and equipment

Notes to the Consolidated Financial Statements for Fiscal Year 2011 h u G o b o s s Annual Report 2011
167
Notes to the coNsolidAted FiNANciAl stAteMeNts For FiscAl YeAr 2011
GeNerAl iNForMAtioN The consolidated financial statements and Group management report of HUGO BOSS AG, Metzingen, were authorized for issue to the Supervisory Board by the Managing Board on February 17, 2012.
The Company is registered as HUGO BOSS AG in the Commercial Register of the Stuttgart local court under HRB 360610.
The Company’s registered offices are in Metzingen, Germany. The address is HUGO BOSS AG, Dieselstrasse 12, 72555 Metzingen.
The preparation of the consolidated financial statements requires – in the case of certain items – that assump-tions are made that may impact the recognition of such items in the consolidated balance sheet and the consol-idated income statement as well as in the disclosure of other financial obligations and contingent liabilities. To improve clarity of presentation, various items in the consolidated balance sheet and in the consolidated income statement have been combined. These items are listed separately and discussed in the notes to the consolidated financial statements. The presentation of the prior-period figures has been adjusted to match that of the figures for the reporting period. All adjustments are explained in more detail under “Changes in presentation”.
The preparation of the consolidated financial statements in EUR thousand may cause rounding differences when adding individual items, since the calculation of the individual items is based on figures stated in euro.
The Group generally classifies assets and liabilities as current when they are expected to be received or settled within 12 months of the reporting date.
bAsis oF preseNtAtioNThe consolidated financial statements of HUGO BOSS AG for the year ending December 31, 2011 were prepared in accordance with the accounting principles of the International Accounting Standards Board (IASB), the Inter-national Financial Reporting Standards (IFRS) as adopted by the European Union (EU), and the additional require-ments of German commercial law pursuant to Section 315a Paragraph 1 of the German Commercial Code (HGB). All International Financial Reporting Standards (IFRS) and International Accounting Standards (IAS) as well as interpretations of the International Financial Reporting Interpretations Committee (IFRIC) applicable to the fiscal year 2011 have been taken into account.
AdditioNAl

168
h u G o b o s s Annual Report 2011 coNsolidAted FiNANciAl stAteMeNts
Notes to the Consolidated Financial Statements for Fiscal Year 2011
ApplicAtioN oF New iFrs ANd AMeNded iAsThe following new and revised IFRS standards and interpretations adopted by the EU were applied by the Group in the fiscal year. This also includes the amendments published by the IASB in May 2010 as part of the continuous project to make annual improvements to the IFRS (“Improvements to IFRS”). The application of these revised standards and interpretations did not materially affect the Group’s financial position or financial performance. However, some additional disclosures were required.
iFrs 7 Financial instruments – disclosuresAs a result of the amendments as part of the annual improvements to IFRS from May 2010, disclosure require-ments for the type and extent of risks arising from financial instruments were clarified. Firstly, the materiality exception under IFRS 7.34b with regard to risk disclosures was removed, meaning that the general materiality principles under IAS 1 apply. It was also clarified that risks must be described not only quantitatively but also qualitatively. If the maximum default risk is equal to the carrying amount, this is not specified. In accordance with IFRS 7.36d, the carrying amounts of renegotiated financial assets that are overdue or impaired are not disclosed. There is also no requirement to disclose collateral held and other forms of securing loans or to estimate the fair values. The amended disclosure requirements described above must be applied to fiscal years beginning on or after January 1, 2011.
iFrs 3 business combinationsIFRS 3 was amended as a result of the annual improvements to IFRSs from May 2010. The measurement option for non-controlling interests at fair value or by their share of net assets is limited to certain instruments. For all other components, fair value measurement is specified. Another amendment relates to non-replaced or volun-tarily replaced share-based payment awards in the context of business combinations. Transitional provisions were also issued for contingent consideration before the effective date for IFRS 3 in 2008. The amendments must be applied to fiscal years beginning on or after July 1, 2010.
iAs 34 interim Financial reportingThe annual improvements to IFRS from May 2010 resulted in amendments to IAS 34 that must be applied to fiscal years beginning on or after January 1, 2011. These relate to the extension of the list of additional disclo-sure requirements for financial instruments such as disclosing significant changes in the business environment that affect the fair value of financial assets and liabilities or disclosures on financial assets that have been reclassified.
iAs 31 interests in Joint venturesIAS 31 was amended as a result of the annual improvements to IFRSs from May 2010. The amendments relate to transitional provisions due to the amended IAS 27 and are effective for fiscal years beginning on or after July 1, 2010.
iAs 28 investments in AssociatesIAS 28 was amended as a result of the annual improvements to IFRSs from May 2010. The amendments relate to transitional provisions due to the amended IAS 27 and are effective for fiscal years beginning on or after July 1, 2010.
iAs 21 the effects of changes in Foreign exchange ratesIAS 21 was amended as a result of the annual improvements to IFRSs from May 2010. The amendments relate to transitional provisions due to the amended IAS 27 and are effective for fiscal years beginning on or after July 1, 2010.

Notes to the Consolidated Financial Statements for Fiscal Year 2011 h u G o b o s s Annual Report 2011
169
iAs 24 related party disclosures A revised definition of related parties was published in IAS 24 in November 2009 already. This amendment results in additional disclosures in the notes for companies that are related to government departments. The amended standard replaces the version amended in 2003 and is effective for fiscal years beginning on or after January 1, 2011.
iAs 1 presentation of the Financial statementsThe amendments as part of the annual improvements to IFRS from May 2010 give rise to amendments relating to the content and presentation of the statement of changes in equity. This amendment applies to fiscal years beginning on or after January 1, 2011.
iFric 19 extinguishing Financial liabilities with equity instruments IFRIC 19 deals with the balance sheet recognition of transactions in which the lender accepts shares or other equity instruments for the full or partial settlement of the financial liability. The standard is effective for fiscal years beginning on or after July 1, 2010.
iFric 14 prepayments of Minimum Funding requirementsThe provisions under IFRIC 14 on determining the limit on the excess value of a pension fund recognized as an asset in accordance with IAS 19 are effective for fiscal years beginning on or after January 1, 2011. Companies with minimum funding requirements may accordingly recognize this prepayment as an asset when prepay-ments of contributions are made.
iFric 13 customer loyalty programsThe amendments to IFRIC 13 as part of the annual improvements to IFRS from May 2010 relate to the fair values of loyalty award credits. The amendments must be applied to fiscal years beginning on or after January 1, 2011.
the Following Financial reporting standards, interpretations and Amendments have been issued, but are not required to be applied for fiscal year 2011:
iFrs 13 Fair value MeasurementIFRS 13 was published in May 2011. The standard defines fair value and governs its calculation. The guide-lines on fair value measurement that were previously in place in individual standards have been replaced by one central standard. In addition, the disclosure requirements have been standardized to the furthest extent possible, including extending the disclosure requirements for non-financial assets. The standard is to be applied for the first time to fiscal years beginning on or after January 1, 2013.
iFrs 12 disclosure of interests in other entitiesIFRS 12 was also published in May 2011 and replaces the provisions on disclosures in the notes under IAS 27, IAS 28, IAS 31 and SIC 12. The standard aims to improve disclosures on consolidated and non-consolidated companies by means of new, extensive disclosures for all types of interests. The standard is to be applied for the first time to fiscal years beginning on or after January 1, 2013.
iFrs 11 Joint Arrangements IFRS 11 was published in May 2011, replacing IAS 31 “Interests in Joint Ventures” and SIC 13 “Jointly Controlled Entities – Non-Monetary Contributions by Venturers”. The standard is geared towards the type of rights and obligations arising from the arrangement rather than the legal form. Joint activities are accordingly joint arrange-ments that transfer rights to the assets and liabilities from the arrangement to the venturers that jointly exercise control. The option of applying the pro-rata consolidation method to account for jointly controlled entities has
AdditioNAl

170
h u G o b o s s Annual Report 2011 coNsolidAted FiNANciAl stAteMeNts
Notes to the Consolidated Financial Statements for Fiscal Year 2011
been removed. The remaining method is accounting for the interest using the equity method. Jointly controlled assets have also been removed. Only joint business activities and joint ventures still remain. The standard is to be applied for the first time to fiscal years beginning on or after January 1, 2013.
iFrs 10 consolidated Financial statementsIFRS 10 was published in May 2011, completely replacing SIC 12 “Consolidation – Special Purpose Entities” and partially replacing IAS 27. The standard introduces a single consolidation model for all entities on the basis of control, irrespective of the type of investee. A comprehensive control concept is used to determine which entities are to be included in the consolidated financial statements. According to this concept, an investor controls another entity if it participates in variable results on the basis of its interest and has the possibility to influence the business activities that are significant to the entity’s economic success. The control concept is therefore independent of whether the entity is controlled through investors’ voting rights or by way of other contractual agreements. The standard is to be applied for the first time to fiscal years beginning on or after January 1, 2013.
iFrs 9 Financial instrumentsIFRS 9 Financial Instruments governs the recognition, classification and measurement of financial instruments and replaces IAS 39. IFRS 9 stipulates firstly that embedded derivatives are not separated if the host contract is a financial asset. The standard also includes the option to recognize changes in value of certain equity instru-ments directly in equity. The regulations for financial liabilities have largely been maintained, with the exception of the presentation of own default risk directly in equity when exercising the fair value option. The standard is to be applied for the first time to fiscal years beginning on or after January 1, 2013.
iFrs 7 Financial instruments Amendments to IFRS 7 to improve disclosures on transfers of financial assets were published in October 2010. These amendments stipulate the extension of disclosures in the notes for transfers of financial assets whereby the transferor retains a continuing involvement in the transferred assets or a continuing involvement must be recognized. An additional disclosure is also required if an unusually high amount is transferred as of the end of a reporting period. The amended standard is to be applied for the first time to fiscal years beginning on or after July 1, 2011.
In December 2011, amendments to IFRS 7 were published regarding the disclosure requirements in the notes. For fiscal years beginning on or after January 1, 2013, amendments to improve the disclosures on offsetting financial assets and liabilities must be taken into account. For fiscal years beginning on or after January 1, 2015, amendments from the disclosures on the initial adoption of IFRS 9 will become effective.

Notes to the Consolidated Financial Statements for Fiscal Year 2011 h u G o b o s s Annual Report 2011
171
iAs 32 Financial instrumentsIn December 2011, amendments to IAS 32 were published regarding the presentation of financial instruments. For fiscal years beginning on or after January 1, 2014, amendments to improve the disclosures on offsetting financial assets and liabilities are stipulated.
iAs 28 investments in associates and joint venturesThe amendment to IAS 28 results from IFRS 10, IFRS 11 and IFRS 12 as published in May 2011. The standard governs accounting for investments in associates and joint ventures using the equity method. The standard is to be applied for the first time to fiscal years beginning on or after January 1, 2013.
iAs 27 consolidated and separate Financial statementsThe amendment to IAS 27 results from IFRS 10 as published in May 2011. The consolidation regulations previ-ously included in IAS 27 have been revised and are now included in IFRS 10 “Consolidated Financial State-ments”. IAS 27 therefore now only includes regulations on separate financial statements. The standard is to be applied for the first time to fiscal years beginning on or after January 1, 2013.
iAs 19 employee benefitsAmendments to IAS 19 were published in June 2011. These include firstly the elimination of the corridor method. Actuarial gains and losses are accordingly recognized immediately in other comprehensive income within equity (SORIE method). Secondly, the amended standard governs the presentation of changes in net liabilities (or in net assets) from defined benefit plans including the immediate recognition of defined benefit cost. Another amendment relates to the net interest components for the expected return on plan assets and interest expense on the pension obligation. Furthermore, full recognition of past service cost in the period of the plan amendment is stipulated. The amended IAS 19 provides for an extension of disclosure and explanation requirements. The amended standard is to be applied for the first time to fiscal years beginning on or after January 1, 2013.
iAs 12 income taxes The amendments to IAS 12 published in December 2010 relate to the measurement of deferred taxes, which depends on whether the carrying amount of an asset is recovered through use or disposal. The amended standard is to be applied for the first time to fiscal years beginning on or after January 1, 2012.
iAs 1 presentation of the Financial statementsThe amendments to IAS 1 published in June 2011 relate to the presentation of other comprehensive income. According to these amendments, other comprehensive income is to be broken down such that items that will later be reclassified to the income statement are reported separately from items that will remain in other comprehensive income. The amended standard is to be applied for the first time to fiscal years beginning on or after July 1, 2012.
AdditioNAl

172
h u G o b o s s Annual Report 2011 coNsolidAted FiNANciAl stAteMeNts
Notes to the Consolidated Financial Statements for Fiscal Year 2011
busiNess coMbiNAtioN
1) Acquisition of franchise partner Moss brosWith effective date April 1, 2011, the HUGO BOSS group acquired 15 HUGO BOSS monobrand stores and the associated fixed assets and inventories from Moss Bros Group PLC, its most important franchise partner in the UK. In addition to eight locations in London and two stores in Manchester, the acquisition also includes a location each in five other English cities. This acquisition is intended to support the development of the Group’s own retail operations . The agreed purchase price payment of EUR 18,573 thousand (GBP 17,288 thousand) was due as of the acquisition date, April 1, 2011, and has already been settled in full
The agreed purchase price payment for the inventories amounted to EUR 5,359 thousand (GBP 4,988 thousand). All acquired inventories were acquired at fair value.
A purchase price payment of EUR 13,214 thousand (GBP 12,300 thousand) was made for the acquired fixed assets, with a fair value of EUR 5,246 thousand (GBP 4,883 thousand) being allocated to the acquired tangible assets.As part of the purchase price allocation, intangible assets in the form of “reacquired rights” were identi-fied. As the requirements for the recognition of reacquired rights were fulfilled for all of the 15 monobrand stores acquired, 15 franchise agreements were valued and recognized. This corresponds to a total value of EUR 7,737 thousand (GBP 7,201 thousand).Following the purchase price allocation, there is remaining goodwill of EUR 232 thousand (GBP 216 thousand), which is allocated to the Europe segment. Further tax use of goodwill is not expected; the goodwill is also subject to an annual impairment test in accordance with IAS 36 and therefore is not subject to scheduled amortization.
In total, transaction costs were incurred in the amount of EUR 512 thousand (GBP 477 thousand). These were recognized immediately as administrative expenses in the consolidated income statement.
If the asset deal had already taken place as of January 1, 2011, this would have had the following effects on the first quarter of 2011:
Group sales: January 1 – March 31, 2011: + EUR 3,616 thousand (+ GBP 3,084 thousand)Consolidated net income: January 1 – March 31, 2011: + EUR 558 thousand (+ GBP 476 thousand)

Notes to the Consolidated Financial Statements for Fiscal Year 2011 h u G o b o s s Annual Report 2011
173
2) Joint venture with the rainbow GroupWith effective date July 1, 2010, HUGO BOSS founded a joint venture with the Rainbow Group, a longtime franchisee in China. HUGO BOSS International B.V., Amsterdam, Netherlands, acquired 60% of the shares and voting rights in a newly founded holding company, HUGO BOSS Lotus Hong Kong Ltd., Hong Kong, holding all shares of Lotus Concept Trading (Macau) Co., Ltd., Macau and Lotus (Shenzhen) Commerce Limited, Shenzhen, China.
When a company obtains control of another company, this constitutes a business combination as defined in IFRS 3. In accordance with IFRS 3, business combinations are to be recognized using the acquisition method. A purchase price allocation must be carried out in this context. Taking into account the twelve-month period, there is remaining goodwill of EUR 10,058 thousand as of December 31, 2011 following the purchase price allocation. This is allocated to the Asia/Pacific segment.
The goodwill arises as a positive difference between the identifiable assets acquired and the liabilities assumed from the company acquired. In comparison to the published annual report for 2010, there was a change in the separate financial statements of Lotus (Shenzhen) Commerce Limited, Shenzhen, China, in the liabilities and other retained earnings items. This change results from the Rainbow Group’s partial waiver of the dividend from fiscal year 2009 which is to be paid to the Rainbow Group under the terms of the purchase agreement. As of December 31, 2011, dividends for fiscal year 2009 were waived in the amount of EUR 4,523 thousand (CNY 37,635 thousand). In each case, the resulting goodwill is allocated to the companies in which it arose and amortized in euro. The increase in other retained earnings took place retroactively as of July 1, 2010 and therefore had an impact on goodwill at the date of first consolidation.
AdditioNAl

174
h u G o b o s s Annual Report 2011 coNsolidAted FiNANciAl stAteMeNts
Notes to the Consolidated Financial Statements for Fiscal Year 2011
scope oF coNsolidAtioN The scope of consolidation of the HUGO BOSS Group covers HUGO BOSS AG and the subsidiaries controlled by HUGO BOSS AG. Generally, control is presumed to exist if the Group has the power to govern the financial and operating policies of an enterprise so as to obtain benefits from its activities. In addition to HUGO BOSS AG, Metzingen, Germany, these include the following companies (equity share of 100% unless otherwise noted):
BIL Leasing Verwaltungs-GmbH & Co. 869 KG, Pöcking, Germany 1, 2
GRAMOLERA Grundstücks-Vermietungsgesellschaft Objekt Ticino mbH, Metzingen, Germany2
HUGO BOSS (Schweiz) AG, Zug, Switzerland HUGO BOSS Australia Pty. Ltd., Preston, Australia HUGO BOSS Belgium BVBA, Diegem, Belgium HUGO BOSS Belgium Retail BVBA, Diegem, Belgium HUGO BOSS Benelux B.V., Amsterdam, Netherlands HUGO BOSS Benelux B.V. CIA, S.C., Madrid, SpainHUGO BOSS Benelux Retail B.V., Amsterdam, Netherlands HUGO BOSS Beteiligungsgesellschaft mbH, Metzingen, Germany 2
HUGO BOSS Canada, Inc., Toronto, Canada HUGO BOSS China Retail Co. Ltd., Shanghai, China HUGO BOSS Cleveland, Inc., Ohio, DE, U.S.A. HUGO BOSS Dienstleistungs GmbH, Metzingen, Germany 2
HUGO BOSS do Brasil Ltda., São Paulo, BrazilHUGO BOSS Fashions, Inc., Wilmington, DE, U.S.A. HUGO BOSS France SAS, Paris, FranceHUGO BOSS Guangdong Trading Co. Ltd., Guangzhou, ChinaHUGO BOSS Hellas LLC, Athen, GreeceHUGO BOSS Holding Netherlands B.V., Amsterdam, Netherlands HUGO BOSS Holding Sourcing S.A., Coldrerio, Switzerland HUGO BOSS Holdings Pty. Ltd., Preston, Australia HUGO BOSS Hong Kong Ltd., Hong KongHUGO BOSS International B.V., Amsterdam, Netherlands HUGO BOSS International Markets AG, Zug, Switzerland HUGO BOSS Internationale Beteiligungs-GmbH, Metzingen, Germany 2
HUGO BOSS Ireland Ltd., Dublin, IrelandHUGO BOSS Italia S.p.A., Mailand, Italy HUGO BOSS Japan K.K., Tokio, Japan HUGO BOSS Licensing, Inc., Wilmington, DE, U.S.A. HUGO BOSS Lotus Hong Kong Limited, Hong Kong 3
HUGO BOSS Magazacilik Ltd. Sti., Izmir, Turkey HUGO BOSS Merchandise Management GmbH, Metzingen, Germany 2
HUGO BOSS Mexico Management Services S.A. de C.V., Mexiko-Stadt, Mexico HUGO BOSS Mexico S.A. de C.V., Mexiko-Stadt, MexicoHUGO BOSS Nordic ApS, Kopenhagen, DenmarkHUGO BOSS Portugal & Companhia, Lissabon, Portugal HUGO BOSS Retail, Inc., Retail, New York, DE, U.S.A.
Notes to the Consolidated Financial Statements for Fiscal Year 2011 h u G o b o s s Annual Report 2011
175
HUGO BOSS Scandinavia AB, Stockholm, SwedenHUGO BOSS Shoes & Accessories Italia S.p.A., Morrovalle, Italy HUGO BOSS Switzerland Retail AG, Zürich, Switzerland HUGO BOSS Textile Industry Ltd., Izmir, Turkey HUGO BOSS Ticino S.A., Coldrerio, SwitzerlandHUGO BOSS Trade Mark Management GmbH & Co. KG, Metzingen, Germany 2
HUGO BOSS Trade Mark Management Verwaltungs-GmbH, Metzingen, GermanyHUGO BOSS UK Ltd., London, Great BritainHUGO BOSS USA, Inc., New York, DE, U.S.A .HUGO BOSS Vermögensverwaltungs GmbH & Co. KG, Metzingen, Germany 2
Lotus Concept Trading (Macau) Co., Ltd., Macau 3
Lotus (Shenzhen) Commerce Limited, Shenzhen, China 3
MSC Poland Sp.z.o.o., Radom, PolandROSATA Grundstücks-Vermietungsgesellschaft mbH & Co. Objekt Dieselstraße KG, Grünwald, Germany 1, 2
ROSATA Grundstücks-Vermietungsgesellschaft mbH & Co. Objekt Metzingen KG, Grünwald, Germany 1, 2
1 Investments with an equity share of 94%.
2 Subsidiaries that make use of the exemption pursuant to Section 264 Paragraph 3 or Section 264b of the German Commercial Code (HGB).
3 Investments with a direct and indirect equity share of 60%.
The following property companies headquartered in Grünwald, Germany were founded in fiscal year 2008: GRETANA Vermietungsgesellschaft mbH & Co. Objekt Lagerimmobilie KGGRETANA Vermietungsgesellschaft mbH & Co. Objekt Lagerlogistik KG
These companies are special purpose entities that are expected to manufacture the planned logistics property including movables and then rent them to HUGO BOSS AG in an operating lease. Because of changes within the HUGO BOSS Group, the leasing agreements were not concluded in fiscal years 2009 to 2011. HUGO BOSS AG has committed to reimbursing the property companies all expenses incurred in the event of the leasing agreement not being signed. HUGO BOSS AG paid these reimbursements in the past fiscal year. It is again not necessary to include these companies in the scope of consolidation for fiscal year 2011.
The full list of shareholdings is disclosed as part of the notes to the financial statements (see note (40)).
AdditioNAl
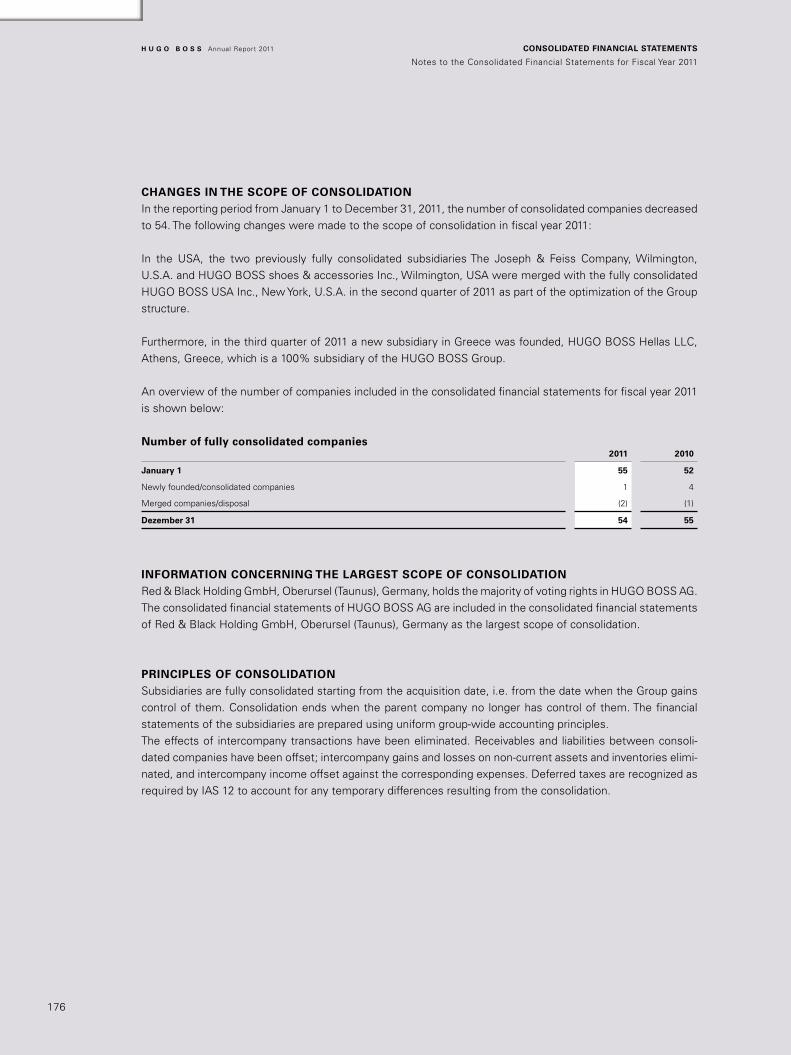
176
h u G o b o s s Annual Report 2011 coNsolidAted FiNANciAl stAteMeNts
Notes to the Consolidated Financial Statements for Fiscal Year 2011
chANGes iN the scope oF coNsolidAtioNIn the reporting period from January 1 to December 31, 2011, the number of consolidated companies decreased to 54. The following changes were made to the scope of consolidation in fiscal year 2011:
In the USA, the two previously fully consolidated subsidiaries The Joseph & Feiss Company, Wilmington, U.S.A. and HUGO BOSS shoes & accessories Inc., Wilmington, USA were merged with the fully consolidated HUGO BOSS USA Inc., New York, U.S.A. in the second quarter of 2011 as part of the optimization of the Group structure.
Furthermore, in the third quarter of 2011 a new subsidiary in Greece was founded, HUGO BOSS Hellas LLC, Athens, Greece, which is a 100% subsidiary of the HUGO BOSS Group.
An overview of the number of companies included in the consolidated financial statements for fiscal year 2011 is shown below:
Number of fully consolidated companies2011 2010
January 1 55 52
Newly founded/consolidated companies 1 4
Merged companies/disposal (2) (1)
dezember 31 54 55
iNForMAtioN coNcerNiNG the lArGest scope oF coNsolidAtioN Red & Black Holding GmbH, Oberursel (Taunus), Germany, holds the majority of voting rights in HUGO BOSS AG. The consolidated financial statements of HUGO BOSS AG are included in the consolidated financial statements of Red & Black Holding GmbH, Oberursel (Taunus), Germany as the largest scope of consolidation.
priNciples oF coNsolidAtioN Subsidiaries are fully consolidated starting from the acquisition date, i.e. from the date when the Group gains control of them. Consolidation ends when the parent company no longer has control of them. The financial statements of the subsidiaries are prepared using uniform group-wide accounting principles.The effects of intercompany transactions have been eliminated. Receivables and liabilities between consoli-dated companies have been offset; intercompany gains and losses on non-current assets and inventories elimi-nated, and intercompany income offset against the corresponding expenses. Deferred taxes are recognized as required by IAS 12 to account for any temporary differences resulting from the consolidation.

Notes to the Consolidated Financial Statements for Fiscal Year 2011 h u G o b o s s Annual Report 2011
177
busiNess coMbiNAtioNsAll business combinations are accounted for using the purchase method. The acquisition cost of a business acquisition is calculated as the sum of the consideration transferred, measured at fair value as of the acquisition date, and the interests without a controlling influence on the company acquired. Identifiable assets acquired and liabilities assumed in a business combination (including contingent liabilities) are measured initially at their fair values at the acquisition date. Minority interests are measured in line with their share in the fair value of the identifiable assets, liabilities and contingent liabilities. Costs incurred in the business combination are recognized as an expense.
GoodwillGoodwill resulting from a business combination represents the difference between the consideration trans-ferred plus the amount of the shares without a controlling influence, and the assets acquired and liabilities assumed. If the consideration is lower than the fair value of the acquired subsidiary’s net assets, the difference is recognized in income immediately.After initial recognition, goodwill is recognized at cost less cumulated impairment. Reported goodwill undergoes an impairment test once a year and if there are indications of potential impairment.
curreNcY trANslAtioN The Group’s reporting currency is the functional currency of the parent company, HUGO BOSS AG. The func-tional currency of the subsidiaries included in the consolidated financial statements is generally the respective local currency. In the case of units which process a significant portion of their sales and purchasing activities and financing in a currency other than the respective local currency, the functional currency is the currency of the primary business environment. Accordingly, the functional currency of HUGO BOSS Textile Industry Ltd., Turkey and HUGO BOSS International Markets AG, Switzerland is the euro, since the majority of business transactions of these companies are negotiated in euro.
Foreign currency transactions and net foreign currency balancesIn the separate financial statements, transactions in foreign currencies are recognized at the time of the trans-action at the currently valid exchange rate. Monetary items (cash and cash equivalents, receivables and liabili-ties) in a foreign currency are translated into the functional currency at each reporting date using the conversion rate on the reporting date. The resulting foreign currency gains and losses are recognized immediately in profit or loss as other financial items.
AdditioNAl

178
h u G o b o s s Annual Report 2011 coNsolidAted FiNANciAl stAteMeNts
Notes to the Consolidated Financial Statements for Fiscal Year 2011
translation of the separate financial statementsAll of the Group companies are economically independent units. The annual financial statements of the foreign Group companies with a functional currency other than the euro are translated into the Group currency (euro) on the basis of the respective functional currency. The currency translation is performed in line with the modified closing rate method in accordance with IAS 21, under which assets and liabilities are translated at the exchange rate on the balance sheet date, while items in the income statement are translated at the average rates for the reporting period. The difference between the translation of the income statement at average rates and of the balance sheet at closing rates is reported under accumulated other comprehensive income in equity. The foreign exchange difference resulting from the translation of equity at historical rates was also taken directly to accumulated other comprehensive income. Exchange differences recognized in accumulated other compre-hensive income are reclassified to the income statement if the Group company in question is sold.
The exchange rates of the most relevant currencies changed as follows in relation to the euro:
currency Average rate closing rate
country 1 EUR = 2011 2010 2011 2010
Australia AUD 1.3485 1.4454 1.2723 1.3136
Brazil BRL 2.3256 2.3358 2.4159 2.2177
China CNY 8.9973 8.9797 8.1588 8.8220
Denmark DKK 7.4507 7.4472 7.4342 7.4535
Great Britain GBP 0.8677 0.8583 0.8353 0.8608
Hong Kong HKD 10.8344 10.3065 10.0510 10.3856
Japan JPY 111.0283 116.4832 100.2000 108.6500
Canada CAD 1.3758 1.3671 1.3215 1.3322
Macau MOP 11.1633 10.6176 10.3381 10.5341
Mexico MXN 17.2748 16.7641 18.0512 16.5475
Norway NOK 7.7940 8.0105 7.7540 7.8000
Sweden SEK 9.0273 9.5523 8.9120 8.9655
Switzerland CHF 1.2338 1.3826 1.2156 1.2504
U.S.A. USD 1.3917 1.3266 1.2939 1.3362
AccouNtiNG policies The financial statements of HUGO BOSS AG and those of its subsidiaries in Germany and abroad have been prepared in accordance with uniform accounting policies as set out in IAS 27.
recoGNitioN oF iNcoMe ANd expeNses Income is recognized when it is probable that the economic benefits associated with the transaction will flow to the Group, and the amount of the income can be measured reliably. Income is measured at the fair value of the consideration received, and is reported after deduction of trade discounts and rebates and excluding value added tax. In addition, the following income recognition criteria must be met.

Notes to the Consolidated Financial Statements for Fiscal Year 2011 h u G o b o s s Annual Report 2011
179
sale of goodsProceeds from the sale of goods are recognized after significant risks and rewards of ownership of the goods have been transferred to the buyer, which generally occurs upon delivery of the goods.
interest incomeInterest is recognized on a time proportion basis taking into account the effective yield of the asset.
royalties and other incomeRoyalties and other income are recognized on an accrual basis in accordance with the substance of the relevant agreement.
Operating expenses are recognized in the income statement on the basis of a direct association between the costs incurred and the corresponding income when the service is utilized or when the expenses are incurred.
FuNctioN costsOperating expenses are generally allocated to the individual functions in line with the functional area of the respective cost center. Expenses relating to cross-functional activities or projects are divided between the relevant function costs on the basis of a suitable allocation principle.
iNveNtoriesRaw materials and supplies as well as finished goods are generally carried at moving average purchase cost, and in some cases at purchase cost calculated on the basis of average costs. Work in progress and finished goods are measured at the cost of conversion. The cost of conversion includes fixed and variable overhead costs based on the normal utilization rate of the production facilities. Borrowing costs have not been taken into account.
Inventories are measured at the lower of cost or net realizable value.
tANGible AssetsTangible assets used in business operations for more than one year are measured at purchase or conversion cost less any accumulated depreciation. The cost of conversion includes all expenditures that are directly attrib-utable to the production process and an appropriate share of production-related overhead costs. Borrowing costs are not capitalized, but are recognized as an expense in the period in which they are incurred. The measure of useful life used as the depreciation basis corresponds to the expected useful life of the asset within the Group. Depreciation based solely on tax regulations is not recognized.
AdditioNAl

180
h u G o b o s s Annual Report 2011 coNsolidAted FiNANciAl stAteMeNts
Notes to the Consolidated Financial Statements for Fiscal Year 2011
Depreciation of buildings is generally based on a useful life of 30 years; depreciation of buildings and leasehold improvements on third-party property is based on the shorter of the lease term or the useful life. The present value of the expected costs for decommissioning/restoring the asset after its use is included in the purchase or conversion cost if the criteria for recognizing a corresponding provision are met.As a general rule, tangible assets are depreciated using the straight-line method. For technical plant and equipment, the useful life ranges from five to 15 years, and for other plant and operating and office equipment from two to 15 years. Useful lives and depreciation methods for property, plant and equipment are reviewed periodically to ensure that depreciation methods and periods reflect the expected economic benefit of the assets.
NoN-curreNt Assets clAssiFied As held For sAleIndividual non-current assets or disposal groups are classified as “non-current assets held for sale” if a sale is very likely and the asset or disposal group can be sold immediately in its current condition. “Non-current assets held for sale” are reported separately in the balance sheet and measured at the lower of the carrying amount or fair value less disposal costs. Scheduled depreciation of assets or disposal groups ends when they are clas-sified as “non-current assets held for sale”.
leAse AGreeMeNtsIf substantially all risks and rewards incidental to ownership of the leased asset are attributable to the Group as lessee, the lessee must recognize the leased asset in its balance sheet (finance lease in accordance with IAS 17). Depreciation methods and useful lives correspond to those of comparable purchased assets. The leased asset is recognized upon commencement of the lease term at an amount equal to the fair value of the leased property or, if lower, the present value of the minimum lease payments. Any initial direct costs are added to the amount recognized as an asset. Liabilities for the future lease payments are recognized at the carrying amount of the leased asset and reported under financial liabilities.
If the lessor retains beneficial ownership (operating lease), the leased assets are accounted for by the lessor. The related lease expenses are generally recognized in profit or loss on a straight-line basis over the lease term.
iNtANGible AssetsAcquired and internally generated intangible assets are capitalized if it is probable that the use of the asset is associated with a future economic benefit and the cost of the asset can be reliably measured. Acquired intangible assets are measured at cost, while internally generated intangible assets are measured at cost of conversion. The cost of conversion includes all costs that are directly attributable to the production of the asset and a proportionate share of production-related overheads. Borrowing costs are not capitalized. Acquired and internally generated intangible assets with a definite useful life are amortized on a straight-line basis over a useful life of two to ten years. So-called “key money” is also included in intangible assets. These are one-time payments made to the previous tenant or to the lessor when lease agreements are concluded for retail opera-tions in a prime location. Differentiation between definite and indefinite useful life is based on the actual circumstances in the countries in which the retail operations are located. Key money with an indefinite useful life currently relates to France, Brazil and Scandinavia.

Notes to the Consolidated Financial Statements for Fiscal Year 2011 h u G o b o s s Annual Report 2011
181
Intangible assets with an indefinite useful life are tested for impairment annually. When indicated, an impair-ment is recorded.
reseArch ANd developMeNt costsResearch costs are expensed as incurred. Development costs are also expensed as incurred unless they meet the criteria for recognition as an internally generated intangible asset.
FiNANciAl iNstruMeNtsIn accordance with IAS 39, a financial instrument is any contract that simultaneously gives rise to a financial asset of one company and a financial liability or equity instrument of another company.
Financial assets include cash and cash equivalents and trade receivables as well as other loans and receivables and derivative financial assets held for trading.
Financial liabilities include trade payables, liabilities due to banks, finance lease liabilities, derivative financial liabilities held for trading, and other financial liabilities.
Financial assets and financial liabilities, to the extent relevant to the HUGO BOSS Group, are classified as follows: a / Financial assets at fair value through profit or loss (FAHfT)b / Loans and receivables (LaR)c / Financial liabilities at fair value through profit or loss (FLHfT)d / Other financial liabilities measured at amortized cost using the effective interest method (FLAC)
The financial assets and liabilities are designated to the aforementioned measurement categories upon initial recognition of the asset or liability. Reclassifications are made at the end of the fiscal year, provided they are permitted and necessary.
FiNANciAl AssetsRegular way purchases and sales of financial assets are accounted for as of the settlement date, i.e. the date on which the Group commits to purchasing or selling the asset.
Financial assets are measured at fair value on initial recognition. In the case of financial assets other than assets “measured at fair value through profit or loss”, transaction costs directly attributable to the acquisition of the assets are also included in the fair value.
AdditioNAl

182
h u G o b o s s Annual Report 2011 coNsolidAted FiNANciAl stAteMeNts
Notes to the Consolidated Financial Statements for Fiscal Year 2011
The fair value recognized in the balance sheet generally corresponds to quoted prices in an active market for the financial asset. If the market for a financial asset is not active, fair value is established by using common valuation techniques and by reference to current market parameters. Valuation techniques include using recent arm’s length market transactions between knowledgeable, willing and independent parties, if available, reference to the current fair value of another instrument that is substantially the same, discounted cash flow analysis, and the use of other valuation techniques. In addition to cash in the narrow sense – i.e. checks, cash on hand and bank balances – cash and cash equivalents also includes short-term investments which can be converted into cash at any time and are subject only to immaterial fluctuations in value. Cash and cash equiva-lents are measured at amortized cost.
After initial recognition, trade receivables and other loans and receivables are measured at amortized cost, if appropriate using the effective interest method less any impairment losses. Any gains and losses are recog-nized in profit or loss when the receivable is derecognized, becomes impaired, or is discharged.
Financial assets are classified as “measured at fair value through profit or loss” if they are acquired with a view to subsequent disposal in the near future. These include derivative financial instruments that are not part of an effective hedging relationship in accordance with IAS 39. All gains or losses from financial assets measured at fair value through profit or loss are recognized in profit or loss.
Financial assets not classified as “measured at fair value through profit or loss” are reviewed for impairment as of each reporting date. If the fair value of a financial asset is less than its carrying amount, the carrying amount of the asset is reduced to the fair value. This reduction represents an impairment loss that is recognized in profit or loss. If, in a subsequent period, the amount of the impairment loss decreases and the decrease can be related objectively to an event occurring after the impairment was recognized, the previously recognized impairment loss is reversed.
A financial asset is derecognized when the contractual rights to the cash flows from the financial asset expire or are transferred. To transfer a financial asset, substantially all the risks and rewards of ownership of the financial asset or control of the financial asset must be transferred.
FiNANciAl liAbilitiesFinancial liabilities are measured initially at fair value less any transaction costs directly attributable to borrowing.
Derivatives that are not part of an effective hedging relationship are classified as “financial liabilities at fair value through profit or loss”. If the fair values are negative, these derivatives are recognized under the item other financial liability. Any gains and losses resulting from subsequent measurement are recognized in profit or loss.

Notes to the Consolidated Financial Statements for Fiscal Year 2011 h u G o b o s s Annual Report 2011
183
After initial recognition, trade payables and interest-bearing loans are measured at amortized cost using the effective interest method. Any resulting gains and losses are recognized in profit or loss when liabilities are derecognized or repaid.
A financial liability is derecognized when the obligation specified in the contract is discharged, cancelled, or expires.
derivAtive FiNANciAl iNstruMeNtsDerivative financial instruments are used by the HUGO BOSS Group solely for the purpose of hedging interest rate risks, currency exposure and share price risks (SAR) arising from operations.
When entering into hedging transactions, specific derivatives are linked to specific hedged items. The require-ments of IAS 39 related to the designation of such transactions as hedging transactions are complied with.
According to IAS 39, all derivative financial instruments are classified as measured at fair value through profit or loss and are measured at fair value, regardless of their designated purpose or intention. Changes in the fair value of the derivative financial instruments are recognized in the income statement.
To the extent that financial instruments qualify as effective hedging instruments within the scope of a hedging relationship as defined by IAS 39 (cash flow hedges), any changes in fair value do not impact net income for the period throughout the term of the derivative. Changes in fair value are recognized directly in equity in the relevant reserve item. The amounts accumulated in equity are recognized in profit or loss for the period in which the hedged cash flow falls due.
The fair value generally corresponds to the market value or stock exchange price. If there is no active market, the fair value is determined on the basis of recognized option pricing models or by means of a bank valuation.
It is the Group’s policy to use effective derivatives for the exclusive purpose of hedging interest rate risks and currency exposure. The substantive and formal requirements under IAS 39 regarding hedge accounting were satisfied both at the time that the hedging contracts were entered into and on the balance sheet date.
iMpAirMeNt oF iNtANGible Assets ANd iteMs oF propertY, plANt ANd eQuipMeNt Intangible assets and items of property, plant and equipment are regularly reviewed for impairment; if there is any indication that an asset may be impaired, the recoverable amount is estimated on the basis of the cash-generating unit (CGU) to which the asset belongs in accordance with IAS 36.
Impairment losses are recognized if the carrying amount of the intangible assets or items of property, plant and equipment exceeds the recoverable amount determined in accordance with the principles above as of the balance sheet date.
AdditioNAl

184
h u G o b o s s Annual Report 2011 coNsolidAted FiNANciAl stAteMeNts
Notes to the Consolidated Financial Statements for Fiscal Year 2011
The recoverable amount is the higher of the fair value less costs to sell and the present value of the future cash flows expected to be derived from the asset (value in use). The present value of the estimated future cash flows from continuing use of the asset is calculated on the basis of the medium-term projections for 2012 to 2014. For the seven subsequent years, the calculation is based on country- and CGU-specific sales and cost trends. The growth rate for perpetuity is based on the long-term country-specific target inflation rates. In addition, the long-term growth rates for the respective products, sector and countries are taken into account in the forecast of future cash flows for the ten-year planning horizon used as a basis. All cash flow forecasts in local currency are discounted using the (pre-tax) discount rate calculated for the HUGO BOSS Group using a WACC model. This discount rate includes both country-specific risk premiums in line with the market (default spreads) and a premium for currency risk (inflation spread). Country-specific marginal tax rates are also used for the WACC calculation. Finally, the beta, the borrowing rate and the capital structure are derived on the basis of a peer group comparison pursuant to IAS 36. In the goodwill impairment tests for the joint venture companies, the calculated cash flows were discounted using (pre-tax) discount rates of 12.0% and 14.0%. The discount rate for the CGU Australia was 12.8% and the rate for the CGU Shoes & Accessories Italia S.p.A. was 12.5%. For all other cash-generating units, the calculated cash flows were discounted at rates between 9.6% and 23.7% in the case of the DOS impairments and impairments for other intangible assets. In the event that the reasons for impairment cease to exist, reversals of impairment losses are recognized by a corresponding increase up to amortized cost. Impairment losses recognized for goodwill are not reversed.
iNcoMe tAxes Current tax refund claims and tax liabilities for the current period are measured at the amount expected to be refunded by the tax authority/paid to the tax authority. The amount is calculated based on the tax rates and tax laws applicable at the reporting date in the countries where the Group operates and generates taxable income.
In accordance with IAS 12, deferred tax assets and liabilities are recognized for all temporary differences between the carrying amounts in the tax accounts of the individual companies and the carrying amounts in the IFRS consolidated financial statements, as well as for specific transactions related to business combinations. Deferred tax assets also include claims for tax reductions resulting from the expected use of loss carryforwards in subsequent years, the realization of which is deemed reasonably certain. Deferred tax assets and liabilities are measured in accordance with the expected tax rates for the periods in which the temporary differences are likely to be reversed. Deferred tax liabilities are recognized if income taxes or withholding taxes will be payable on distributable profits of subsidiaries at the time of a distribution. For these deferred taxes to be recognized, a distribution must be likely in the foreseeable future. Deferred tax liabilities are recognized for temporary differ-ences on shares in subsidiaries except for when the Group is able to control the timing of when the temporary differences are reversed.
liAbilities FroM FiNANce leAsesLiabilities from finance leases are measured upon initial recognition at the fair value of the leased asset or, if lower, at the present value of the minimum lease payments. In subsequent periods, the liability is amortized and measured in accordance with the effective interest method.
The interest portion of the lease obligations is reported in the consolidated income statement over the term of the lease.

Notes to the Consolidated Financial Statements for Fiscal Year 2011 h u G o b o s s Annual Report 2011
185
treAsurY shAresAny treasury shares purchased by the Group are recognized at cost and deducted from equity. The purchase, sale, issue or redemption of treasury shares is recognized directly in equity. In the event of a sale or reissue, any differences between the carrying amount and the consideration are recognized as share premium. The Group cannot exercise the voting rights associated with the treasury shares. Furthermore, no dividends are allocated to these shares.
provisioNsProvisions have been recognized whenever a legal or constructive obligation currently exists towards third parties as a result of a past event and when the obligation is likely to result in a future outflow of resources that can be reliably estimated.
Provisions are reviewed as of each balance sheet date and adjusted to the current best estimate. If the effect of the time value of money is material, the provision equals the present value of the expenditure expected to be required to settle the obligation.
restructuriNG expeNsesRestructuring expenses are recognized in the period in which they are incurred or in which a reliable estimate is possible. Expenses in connection with an early termination of an employment relationship are recognized as expenses and financial obligation if, as part of a formal plan, the Company has demonstrably undertaken to offer benefits on the occasion of the termination of employment, thus promoting voluntarily terminations, or if it has undertaken to accept an early termination before the normal retirement age.
provisioNs For peNsioNs The measurement of provisions for pensions is based on the projected unit credit method prescribed in IAS 19 for defined benefit plans; this method takes into account future salary and pension increases. The present value of the defined benefit obligation at year-end is reduced by the fair value of the plan assets transferred to funds, provided these fulfill the requirements set forth in IAS 19.7. Actuarial gains and losses are immediately recognized in income.
coNtiNGeNt liAbilities ANd coNtiNGeNt Assets Contingent liabilities are not recognized in the consolidated balance sheet. They are disclosed in the notes, unless there is a very low probability that they will result in an outflow of economic benefits. Likewise, contin-gent assets are not recognized in the consolidated balance sheet. They are disclosed in the notes, provided an associated inflow of economic benefits is considered likely.
seGMeNt reportiNGSegment reporting in the HUGO BOSS Group is based on the internal organizational and reporting structure in line with the management approach. The data on the basis of which the internal performance indicators are calculated are derived from the financial statements prepared in accordance with IFRS.
AdditioNAl

186
H U G O B O S S Annual Report 2011 COnSOlidated FinanCial StatementS
Notes to the Consolidated Financial Statements for Fiscal Year 2011
JUdGmentS made in tHe aPPliCatiOn OF tHe COmPanY’S aCCOUntinG POliCieS In preparing the consolidated financial statements, the management makes judgments, estimates and assump-tions which impact the amount of the income, expenses, assets and liabilities reported as of the end of the reporting period and the disclosures of contingent liabilities. These estimates and assumptions are made so as to give an accurate view of the net assets, financial position and earnings situation of the Group. The underlying assumptions are reviewed on an ongoing basis. However, the actual amounts may differ from the original estimates.
In applying the Group’s accounting methods, the management made the following judgments that significantly influence the amounts in the consolidated financial statements.
a / Measurement of directly operated stores (DOS) When testing intangible assets and property, plant and equipment related to directly operated stores (DOS) for impairment, the following assumptions have been made: ∙ Each DOS is defined as a cash-generating unit. ∙ The future cash flows used for impairment tests are derived and discounted based on budget plans and
medium term forecasting for the individual DOS. The cash flows used as the basis contain material assumptions with regard to the growth rates of the respective products, sectors and countries as well as estimates of the country- and CGU-specific future sales and cost trends. The management assumes that the assumptions and estimates on which the discounted cash flows are based are appropriate. However, changes in the economic conditions and the sector-specific growth assumptions could have an impact on the impairment tests which could lead to additional impairment losses or reversals of impairment losses in the future.
b / Specific valuation allowances for receivables The recoverability of trade receivables is determined on the basis of the estimated probability of default.
Accordingly, specific valuation allowances are recognized for trade receivables due from customers in their full amount when insolvency proceedings against such customers’ assets have been initiated (to the extent that existing collateral is not recoverable). Specific valuation allowances for past due receivables are based on individually determined percentages between 1% and 100%. All HUGO BOSS Group subsidiaries are obligated to maintain an aging structure of their trade receivables. This ensures that a risk-adjusted write-down is possible. External expert opinions have been obtained to determine the value of collateral during such impairment reviews. If the financial situation of the customer deteriorates, the amounts required to be derecognized could exceed the valuation allowances made, which could adversely impact financial performance.
c / Inventory measurement Write-downs are recognized for inventory risks resulting from a partial reduction in marketability due to long
storage periods. Reductions ranging from 1% to 95% are applied to raw materials based on inventory range and marketability
analyses. No write-downs are recognized for work in progress. The carrying amount of finished goods and merchandise is based on the net realizable value that can be obtained via the Group’s own sales channels.
Impairments recognized to account for lower expected sales prices both on the level of the distribution companies and from the Group’s perspective are anticipated on the basis of marketability and inventory range analyses.

Notes to the Consolidated Financial Statements for Fiscal Year 2011 h u G o b o s s Annual Report 2011
187
d / Intercompany profit elimination The HUGO BOSS distribution companies normally buy finished goods and merchandise exclusively from
the Group’s own production and purchasing units. For the merchandise still in inventory delivered internally within the Group, gains on intercompany deliveries are eliminated during consolidation.
Intercompany profits are not eliminated if the balance sheet value of the distribution company has fallen below Group cost because of local write-downs.
The intercompany profit to be eliminated is calculated as the difference between the carrying amount of the merchandise at the level of the distribution company (after local write-downs) and Group cost. In addition, merchandise valued at Group cost is reviewed for impairment from the perspective of the HUGO BOSS Group. Additional write-downs must be recorded if Group cost is higher than anticipated net realizable value. The anticipated net realizable value from the perspective of the Group is based on the Group’s own global sales channels, in particular the warehouse and outlet capacities.
e / Stock appreciation rights (SAR) Measurement of obligations from the stock appreciation rights plan requires certain definitions to be made
with respect to parameters such as the future volatility of HUGO BOSS preferred shares. These definitions are based on bank estimates.
f / Provisions Since the HUGO BOSS Group operates in several different countries, it is subject to a large number of
different legal conditions. In view of the complexity of the international regulations, it is possible that differ-ences between the actual events and the assumptions made/changes to such assumptions may neces-sitate adjustments to the Group’s reported provisions in the future. Provisions for possible effects of legal matters are recognized on the basis of reasonable estimates. The amount of such provisions is based on various factors such as the interpretation of the respective regulations by local consultancies. Any differ-ences between the original estimate and the actual outcome could impact the net assets, financial position and earnings situation of the Group in the respective period.
g / Fair value of financial instruments If the fair value of the financial assets and financial liabilities recorded on the balance sheet cannot be
determined using data from an active market, it is calculated using valuation procedures, including the discounted cash flow method. The input parameters used in the model are, when possible, based on observable market data. If this is not possible, a measure of judgment is used to determine fair value. Judgment affects such input parameters as liquidity risk, credit risk and volatility. Changes in assumptions with regard to these factors may have an effect on the fair value recorded for the financial instruments.
AdditioNAl

188
h u G o b o s s Annual Report 2011 coNsolidAted FiNANciAl stAteMeNts
Notes to the Consolidated Financial Statements for Fiscal Year 2011
chANGes iN preseNtAtioNThe management believes that the following changes result in a more accurate presentation of earnings, net assets and the financial position of the Group. To allow the financial statements of the Group to be compared over time, the presentation of the items in the financial statements was also adjusted retroactively for the prior periods to match the presentation in the reporting period.
segment reportingStarting with the report on the first quarter of 2011, the Managing Board of HUGO BOSS AG decided to adjust the presentation of segment reporting compared to the previous year. HUGO BOSS has set itself the goal of significantly increasing sales and profit through organic growth in the coming years. The sales regions will therefore be managed on the basis of their value added at Group level in future.
Earnings by operating segment are now defined as EBITDA before special items of the respective distribution company plus the gross profit margin of the sourcing units and intercompany royalty sales. As a result, the gross profit margin generated at the level of sourcing units will be allocated to the respective distribution company.
This change in presentation means that operating income is no longer allocated to the previously reportable Corporate Center segment as the Group-wide bundling of all central functions. Rather, the bundling of the remaining expenses of the sourcing, production, research and development units now constitutes an operating cost center direct allocation of which to the sales regions would not be appropriate.
Royalty transactions with external license partners and directly attributable expenses for license management will continue to be presented in the operative royalties segment. However, internal license income will no longer be taken into consideration as a consequence of it being allocated to the sales regions. Expenses for the global marketing of HUGO BOSS products will no longer be allocated directly to the royalties segment either. All expenses that are not directly attributable to the sales regions or the royalties segment are recognized in the reconciliation item Corporate units/Consolidation.Consequently, the presentation of the segment report for the current fiscal year and for the comparative period January 1 – December 31, 2010, was adjusted. Further information can be found in note 33, Segment reporting.

Notes to the Consolidated Income Statement h u G o b o s s Annual Report 2011
189
Notes to the coNsolidAted iNcoMe stAteMeNt
1 // sAles
in EUR thousand 2011 2010
Sale of goods 2,009,512 1,684,330
Royalties 49,329 45,116
2,058,841 1,729,446
2 // cost oF sAles ANd direct selliNG expeNses
in EUR thousand 2011 2010
Cost of goods 694,000 599,198
Own production 62,552 62,600
Direct selling expenses 37,452 40,470
794,004 702,268
The cost of conversion includes the cost of materials, which corresponds to the amount of inventories recog-nized as expense in the fiscal year. The item also includes costs for incoming freight and duties.
The cost of sales for fiscal year 2011 includes inventory impairment losses totaling EUR 34,439 thousand (2010: EUR 24,361 thousand). The impairment losses were attributable in particular to finished goods and raw materials, which had to be written down due to their limited recoverability.
Direct selling costs primarily include sales commissions, freight and duties charges as well as credit card fees.
3 // selliNG ANd distributioN expeNses
in EUR thousand 2011 2010
Expenses for own retail business, indirect sales and marketing organization 442,427 373,468
Marketing spendings 121,707 90,884
Logistics and sourcing expenses 115,638 103,377
Bad Debts/Losses 2,383 6,701
682,155 574,430
Alongside personnel expenses, rental expenses are the largest item in the expenses for the Group’s own retail business, indirect selling and marketing organization.
AdditioNAl

190
h u G o b o s s Annual Report 2011 coNsolidAted FiNANciAl stAteMeNts
Notes to the Consolidated Income Statement
In addition to personnel and rental expenses for wholesale distribution, the expenses for indirect selling and marketing organization also include other expenses for brand management, retail services and regional sales management.
Distribution expenses consist of gross distribution expenses of EUR 138,660 thousand (2010: EUR 107,704 thousand), and income from distribution expenses of EUR 16,953 thousand (2010: EUR 16,820 thousand). Income from distribution expenses charged is largely composed of charges for shop fittings, marketing materials, advertising, and sponsorship activities.
The total other taxes on selling and distribution expenses are EUR 2,045 thousand (2010: EUR 1,512 thousand).
4 // AdMiNistrAtive costs ANd other operAtiNG expeNses/iNcoMe
in EUR thousand 2011 2010
General administration costs 131,730 127,183
Research and development costs 55,399 47,286
Special items 1,463 14,336
188,592 188,805
Administrative expenses consist largely of rent for premises, maintenance costs, IT operating costs, legal and consulting fees, as well as the personnel expenses of the respective functional areas.
In the HUGO BOSS Group, research and development expenses are incurred primarily for the creation of fashion collections.
The total research and development costs of EUR 55,399 thousand (2010: EUR 47,286 thousand), breaks down as follows: EUR 35,611 thousand (2010: EUR 30,590 thousand) for personnel expenses, EUR 1,663 thousand (2010: EUR 1,306 thousand) for depreciation and amortization, and EUR 18,125 thousand (2010: EUR 15,390 thousand) for other operating expenses.
Special items continued to be incurred in the fiscal year 2011 in connection with the structural realignment of individual markets. In contrast, closures of directly operated stores and showrooms played only a minor role in the past fiscal year.
Significant income was created in administrative costs and other operating expenses/income by charging other costs and services totaling EUR 9,105 thousand (2010: EUR 11,616 thousand), and reversing provi-sions in the amount of EUR 4,342 thousand (2010: EUR 7,868 thousand), of which EUR 661 thousand (2010: EUR 6,224 thousand) is attributable to special items.
The total other taxes on administrative costs and other expenses/income amount to EUR 2,696 thousand (2010: EUR 2,004 thousand).

Notes to the Consolidated Income Statement h u G o b o s s Annual Report 2011
191
5 // FiNANciAl result
in EUR thousand 2011 2010
interest income 4,721 3,283
Interest income due to bank deposit 3,245 2,120
Other interest income 1,476 1,163
interest expense (20,920) (20,568)
Interest expenses from financial liabilities (20,920) (20,568)
Net interest income/expense (16,199) (17,285)
Exchange rate gains/losses from receivables and liabilities 8,710 10,460
Gains/losses from hedging transactions (4,038) (3,430)
Other financial expenses/ income (172) (4,533)
other financial items 4,500 2,497
Financial result (11,699) (14,788)
Other financial expenses comprise the balance of interest expense from pension provisions and the recognized return on plan assets in the amount of EUR 342 thousand (2010: EUR 743 thousand).
Other interest and similar income include interest rate swaps in the amount of EUR 10,539 thousand (2010: EUR 11,933 thousand).The gains from receivables and liabilities amount to EUR 4,672 thousand after hedging transactions (2010: EUR 7,030 thousand). In fiscal year 2011, foreign currency effects were thus reduced by means of further hedging transactions.
6 // iNcoMe tAxes
in EUR thousand 2011 2010
Current taxes 97,968 60,053
Deferred taxes (6,544) (126)
91,424 59,927
Corporate income taxes, including the German solidarity surcharge, trade taxes charged to the German Group companies, and similar income taxes incurred by foreign Group companies, are reported as income taxes.
HUGO BOSS AG remains subject to a domestic income tax rate of 28.0% (2010: 28.0%). As in the previous year, tax rates abroad range between 0% and 41%.
In fiscal year 2011, current income taxes included expenses relating to other reporting periods in the amount of EUR 6,096 thousand (2010: EUR 1,913 thousand). Income relating to other reporting periods totaled EUR 548 thousand (2010: EUR 1,112 thousand).
Deferred taxes are calculated on the basis of the tax rates applicable or anticipated in the relevant countries in accordance with the legal situation prevailing at the time of realization.
AdditioNAl

192
h u G o b o s s Annual Report 2011 coNsolidAted FiNANciAl stAteMeNts
Notes to the Consolidated Income Statement
The following table shows a reconciliation of the anticipated income tax expense that would theoretically result given the application at Group level of the current domestic income tax rate of 28.0% (2010: 28.0%) with the income tax expense actually reported by the Group. The domestic income tax rate used takes into account the corporate income tax rate (including the German unification solidarity surcharge) of 15.8% (2010: 15.8%) and the trade tax rate of 12.2% (2010: 12.2%).
in EUR thousand 2011 2010
Pre-tax result 382,391 249,155
Anticipated income tax 107,074 69,763
Tax effect of permanent items 11,226 (3,326)
Tax rate-related deviation (26,387) (11,875)
Tax refunds/back taxes 5,841 737
Valuation allowance on deferred tax assets (9,319) 7,600
Tax effects from distributable profit of subsidiaries 5,237 0
Other deviations (2,248) (2,972)
income tax expenditure reported 91,424 59,927
Income tax load 24% 24%
The income tax burden was reduced by tax-free earnings in the amount of EUR 5,481 thousand (2010: EUR 9,574 thousand). The opposing tax effects from non-deductible operating expenses amounted to EUR 8,395 thousand (2010: EUR 5,750 thousand) and other permanent effects totaled EUR 8,312 thousand (2010: EUR 498 thousand).
In addition to the effects from the creation or reversal of temporary differences between the carrying amounts in the consolidated financial statements and those in the financial statements for tax purposes, expenses for deferred taxes included income from changes in the tax rates amounting to EUR 2,491 thousand (2010: EUR 67 thousand). Income from the correction of temporary differences in the previous year which were not taken into account was included in the amount of EUR 889 thousand (2010: EUR 2,857 thousand) under Other deviations.
Deferred taxes in the consolidated balance sheet relate to the following items:
2011 2010
in EUR thousand
deferred tax assets
deferred tax liabilities
deferred tax assets
deferred tax liabilities
Provisions and other liabilities 25,908 (4,035) 22,639 (6)
Tax loss carryforwards 25,449 0 23,790 0
Inventory measurement 31,798 (5,714) 18,765 (4,931)
Recognition and measurement of non-current assets 8,016 (18,343) 10,023 (11,352)
Receivables measurement 6,649 (195) 9,615 (174)
Market valuation of financial instruments 4,073 (9,881) 225 (2,518)
Tax effects from distributable profit of subsidiaries 0 (5,237) 0 0
Other differences in recognition and measurement 3,807 (6,149) 220 (5,897)
105,700 (49,554) 85,277 (24,878)
Impairments 1 (26,464) 0 (36,307) 0
79,236 (49,554) 48,970 (24,878)
1 Including unrecognized tax loss carryforwards.

Notes to the Consolidated Income Statement h u G o b o s s Annual Report 2011
193
Deferred tax assets are recognized for all deductible temporary differences, unused tax and interest losses are carried forward and unused tax credits to the extent to which it is probable that future taxable profit will be generated against which these deductible temporary differences and the unused tax and interest losses and unused tax credits can be offset.
EUR 25,964 thousand (2010: EUR 27,868 thousand) of the deferred tax assets and EUR 33,091 thousand (2010: EUR 13,526 thousand) of the deferred tax liabilities are long-term. The entire amount is reported as long-term in the balance sheet.
Deferred tax assets on loss carryforwards and temporary differences are not recognized or impaired if there are doubts as to their future recoverability. To calculate these write-downs, all positive and negative factors that might impact the achievement of sufficient future taxable income are taken into consideration.
The impairments of deferred taxes relate to temporary differences in the amount of EUR 3,953 thousand (2010: EUR 12,604 thousand) and in the amount of EUR 22,511 thousand (2010: EUR 23,703 thousand) from loss carryforwards which will probably not be usable in the future.
Distributable profits at foreign subsidiaries are partly to be distributed to Germany in the coming years. The German tax expense incurred on distribution in the amount of EUR 1,200 thousand (2010: EUR 0 thousand) was recognized as a liability under deferred taxes. In addition, deferred taxes were recognized for distributable profits of subsidiaries that distribute to other subsidiaries to the extent that withholding taxes are incurred for future distributions. Deferred tax liabilities were recognized in the amount of EUR 4,037 thousand (2010: EUR 0 thousand) for these withholding tax expenses.
Other deferred tax liabilities on distributable profits at subsidiaries totaling EUR 403,540 thousand (2010: EUR 388,288 thousand) were not recognized, as these profits are currently intended to remain permanently invested. On distribution of the profits to Germany, these would be subject to 5% of German taxation or might give rise to foreign withholding taxes. Distributions therefore generally lead to additional tax expense. Since these profits are not intended to be distributed in the foreseeable future, it is not likely that the temporary differences will be reversed in the foreseeable future.
As in the previous year, deferred tax income in the amount of EUR 3,895 thousand (2010: EUR 5,773 thousand) was recognized directly in equity in connection with accounting for changes in the fair values of derivatives in a hedging relationship with no gain or loss recognized.
Unused income tax loss carryforwards mainly relate to foreign Group companies as follows:
in EUR thousand 2011 2010
Expiry within
1 year 0 0
2 years 2,259 567
3 years 1,176 2,084
4 years 411 1,690
5 years 27,992 16,036
after 5 years 38,074 47,490
unlimited carryforward 7,018 4,065
total tax loss carryforwards 76,930 71,932
AdditioNAl

194
h u G o b o s s Annual Report 2011 coNsolidAted FiNANciAl stAteMeNts
Notes to the Consolidated Income Statement
7 // MiNoritY iNterests iN coNsolidAted Net iNcoMe The consolidated financial statements include companies in which HUGO BOSS AG holds less than 100% of the equity. In accordance with IAS 27, the related minority interests are reported in equity separately from the equity held by the shareholders of the parent company in the consolidated balance sheet. Minority interests in consolidated net income are also reported separately in the consolidated income statement.
8 // eArNiNGs per shAre Pursuant to IAS 33, earnings per share (EPS) are calculated by dividing the profit attributable to equity holders of the parent company by the weighted average number of shares outstanding during the fiscal year.
The stock option program did not have any dilutive effects in the reporting periods shown. The participation rights from the “Stock Appreciation Rights Program” solely grant a claim to cash settlement, not a claim to HUGO BOSS AG shares.
Neither on December 31, 2011 nor on December 31, 2010 were any shares outstanding that could have diluted earnings per share.
in EUR thousand 2011 2010
Net income attributable to equity holders of the parent company 284,493 185,895
Average number of shares outstanding 1
Common shares 35,331,445 35,331,445
Preferred shares 33,684,722 33,684,722
EPS common shares in EUR 2 4.12 2.69
EPS preferred shares in EUR 2 4.13 2.70
1 Regardless of own shares.
2 No dilution: stock options program based on Stock Appreciation Rights (SAR).
9 // AdditioNAl disclosures oN the coNsolidAted iNcoMe stAteMeNt
personnel expenses
in EUR thousand 2011 2010
Own production 40,724 51,354
Logistics and sourcing expenses 69,061 65,443
Research and development costs 35,611 30,590
Expenses for own retail business, indirect sales and marketing organizsation 167,161 141,746
General administration costs 62,602 68,333
Special items (972) 10,979
374,187 368,445

Notes to the Consolidated Income Statement h u G o b o s s Annual Report 2011
195
In previous fiscal years, provisions were recognized for the structural realignment of individual markets. In fiscal year 2011, individual provisions were reversed due to the completion of these realignment measures, resulting in remaining income of EUR 972 thousand (2010: expense of EUR 10,979 thousand) in the special items.
in EUR thousand 2011 2010
Wages and salaries 316,635 313,923
Social security 52,319 48,095
Expenses and income for retirement benefits and aid 5,233 6,427
374,187 368,445
Employer contributions for defined contribution pension plans amount to approximately 8% (2010: approxi-mately 6%) of personnel expenses.
Employees as of December 31:2011 2010
Industrial employees 4,687 4,269
Commercial and administrative employees 6,317 5,675
11,004 9,944
The number of employees was calculated based on the number of employees as of December 31, taking into account part-time employees on a pro-rata basis.
Annual average of employees:2011 2010
Industrial employees 4,589 4,115
Commercial and administrative employees 5,776 5,203
10,365 9,318
depreciation/amortization
in EUR thousand 2011 2010
Own Production 4,403 4,967
Logistics and sourcing expenses 7,275 7,021
Research and development costs 1,663 1,307
Expenses for own retail business, indirect sales and marketing organization 44,128 40,679
General administration costs 15,951 17,528
Special items 0 708
73,420 72,210
Amortization of intangible assets and depreciation of property, plant and equipment totals EUR 73,420 thousand (2010: EUR 72,210 thousand). The breakdown of depreciation/amortization into the corresponding balance sheet items is given in the following information on the consolidated balance sheet.
AdditioNAl

196
H U G O B O S S Annual Report 2011 COnSOlidated FinanCial StatementS
Notes to the Consolidated Balance Sheet
nOteS tO tHe COnSOlidated BalanCe SHeet
FiXed aSSetS
in EUR thousand
Property, plant and equipment
intangible assets
total non- current assets
Cost of acquisition
Balance on dec. 31, 2009 594,536 163,950 758,486
Changes in the scope of consolidation 6,306 26,612 32,918
Currency translation effects 20,945 1,637 22,582
Additions 44,738 10,846 55,584
Disposals (27,565) (1,016) (28,581)
Transfers (715) 715 0
Balance on dec. 31, 2010 638,245 202,744 840,989
Changes in scope of consolidation (767) (1,366) (2,133)
Currency translation effects 8,589 2,956 11,545
Additions 79,365 29,114 108,479
Disposals (14,976) (1,732) (16,708)
Transfers (25,573) (10,100) (35,673)
Balance on dec. 31, 2011 684,883 221,616 906,499
depreciation/amortization
Balance on dec. 31, 2009 324,096 62,563 386,659
Changes in scope of consolidation 2,057 3 2,060
Currency translation effects 13,527 1,388 14,915
Additions 59,396 12,814 72,210
Disposals (25,246) (961) (26,207)
Balance on dec. 31, 2010 373,830 75,807 449,637
Changes in scope of consolidation (151) 0 (151)
Currency translation effects 5,773 514 6,287
Additions 57,726 15,694 73,420
Disposals (12,211) (1,364) (13,575)
Transfers (25,614) (10,133) (35,747)
Balance on dec. 31, 2011 399,353 80,518 479,871
Carrying amount on dec. 31, 2011 285,530 141,098 426,628
Carrying amount on dec. 31, 2010 264,415 126,937 391,352
Land charges in connection with land and buildings amounted to EUR 33,667 thousand (2010: EUR 33,661 thousand).

Notes to the Consolidated Balance Sheet h u G o b o s s Annual Report 2011
197
10 // iNtANGible Assets
in EUR thousand
Franchises, industrial property rights 1
internally deve-loped software
Goodwill
total
cost of acquisition
balance on dec. 31, 2009 130,532 5,603 27,815 163,950
Changes in scope of consolidation 16,388 0 10,224 26,612
Currency translation effects 1,637 0 0 1,637
Additions 10,846 0 0 10,846
Disposals (1,016) 0 0 (1,016)
Transfers 715 0 0 715
balance on dec. 31, 2010 159,102 5,603 38,039 202,744
Changes in scope of consolidation (1,200) 0 (166) (1,366)
Currency translation effects 2,956 0 0 2,956
Additions 28,855 0 259 29,114
Disposals (1,732) 0 0 (1,732)
Transfers (9,063) 0 (1,037) (10,100)
balance on dec. 31, 2011 178,918 5,603 37,095 221,616
depreciation/amortization
balance on dec. 31, 2009 54,729 5,603 2,231 62,563
Changes in scope of consolidation 3 0 0 3
Currency translation effects 1,388 0 0 1,388
Additions 12,814 0 0 12,814
Transfers (961) 0 0 (961)
balance on dec. 31, 2010 67,973 5,603 2,231 75,807
Changes in scope of consolidation 0 0 0 0
Currency translation effects 514 0 0 514
Additions 15,694 0 0 15,694
Disposals (1,364) 0 0 (1,364)
Transfers (9,095) 0 (1,038) (10,133)
balance on dec. 31, 2011 73,722 5,603 1,193 80,518
carrying amount on dec. 31, 2011 105,196 0 35,902 141,098
carrying amount on dec. 31, 2010 91,129 0 35,808 126,937
1 And similar rights, including licenses.
In addition to trademark rights (EUR 14,992 thousand) and key money (EUR 19,006 thousand), the item Fran-chises and industrial property rights includes software from the “Columbus” IT project (EUR 33,900 thousand) and other software licenses (EUR 16,165 thousand). The changes from the scope of consolidation result from the purchase price allocation for the joint venture companies carried out as part of initial consolidation. Intan-gible assets of EUR 14,980 thousand were identified at Lotus (Shenzhen) Commerce Ltd., Shenzhen, China and at Lotus Concept Trading (Macau) Co., Ltd., Macau. These include the business licenses and the franchise agreements. In addition, the monobrand stores of the franchise partner Moss Bros in the Great Britain were acquired in fiscal year 2011. The purchase price allocation performed in this context identified franchise agree-ments totaling EUR 6,153 thousand as intangible assets.
AdditioNAl

198
h u G o b o s s Annual Report 2011 coNsolidAted FiNANciAl stAteMeNts
Notes to the Consolidated Balance Sheet
The “Columbus” IT project started in fiscal year 2003 and resulted in the purchase of new software for the entire enterprise management. This affected the purchasing, production control, logistics, distribution and financial systems (worldwide). Over the lifetime of the “Columbus” project, intangible assets with an acquisition cost of EUR 61,130 thousand (2010: EUR 56,836 thousand) were recognized on the balance sheet for the ERP system, consisting of the industry solution SAP AFS as well as SAP Retail for the Group’s own retail stores. Of this amount, EUR 27,230 thousand (2010: EUR 20,797 thousand) had been amortized as of the balance sheet date.
As of the balance sheet date, key money in the amount of EUR 19,006 thousand (2010: EUR 12,241 thousand) had been recognized. Of this, EUR 6,480 thousand (2010: EUR 5,537 thousand) is allocated to key money with an indefinite useful life and EUR 12,526 thousand (2010: EUR 6,704 thousand) to key money with a definite useful life.
In accordance with IAS 38, goodwill is classified as an asset with an indefinite useful life, and relates primarily to the menswear segment in Australia (EUR 6,874 thousand) and men‘s shoes and leather accessories (EUR 18,710 thousand). Goodwill also resulted from the initial consolidation of the joint venture companies (EUR 10,058 thousand) and from the acquisition of the monobrand stores in the Great Britain in fiscal year 2011 (EUR 259 thousand; GBP 216 thousand).
The trademark rights presented in the item Franchises and industrial property rights in the amount of EUR 14,992 thousand, which are primarily related to the menswear segment in the U.S.A., are also classified as assets with indefinite useful lives.
In fiscal years 2011 and 2010, no impairment loss for goodwill or for trademark rights was incurred.
In contrast, impairment losses on intangible assets with indefinite useful lives totaled EUR 640 thousand (2010: EUR 571 thousand). These losses were mainly due to key money amounts attributed to individual stores. Impairment losses were calculated using impairment tests and are allocated to depreciation/amortization in the relevant functional areas.

Notes to the Consolidated Balance Sheet h u G o b o s s Annual Report 2011
199
11 // propertY, plANt ANd eQuipMeNt
in EUR thousand
landand buildings
technical
equipment andmachinery
other equipment,
operating and office equipment
construction in progress
total
cost of acquisition
balance on dec. 31, 2009 134,848 41,429 416,803 1,456 594,536
Changes in scope of consolidation 0 0 6,306 0 6,306
Currency translation effects 839 1,162 18,933 11 20,945
Additions 327 1,113 39,525 3,773 44,738
Disposals (23) (1,788) (25,754) 0 (27,565)
Transfers 275 69 2,211 (3,270) (715)
balance on dec. 31, 2010 136,266 41,985 458,024 1,970 638,245
Changes in scope of consolidation 0 0 (767) 0 (767)
Currency translation effects 4,399 579 3,608 3 8,589
Additions 19,101 3,115 46,932 10,217 79,365
Disposals (1,399) (1,012) (12,565) 0 (14,976)
Transfers 65,007 39,132 (123,729) (5,983) (25,573)
balance on dec. 31, 2011 223,374 83,799 371,503 6,207 684,883
depreciation/amortization
balance on dec. 31, 2009 40,917 29,855 252,860 464 324,096
Changes in scope of consolidation 0 0 2,057 0 2,057
Currency translation effects 417 970 12,138 2 13,527
Additions 6,476 3,516 49,404 0 59,396
Disposals 0 (1,717) (23,529) 0 (25,246)
balance on dec. 31, 2010 47,810 32,624 292,930 466 373,830
Changes in scope of consolidation 0 0 (151) 0 (151)
Currency translation effects 2,905 515 2,353 0 5,773
Additions 12,127 5,241 40,357 1 57,726
Disposals (1,180) (847) (10,184) 0 (12,211)
Transfers 39,507 22,639 (87,294) (466) (25,614)
balance on dec. 31, 2011 101,169 60,172 238,011 1 399,353
carrying amount on dec. 31, 2011 122,205 23,627 133,492 6,206 285,530
carrying amount on dec. 31, 2010 88,456 9,361 165,094 1,504 264,415
The acquired fixed assets of the franchise partner Moss Bros have a residual carrying amount of EUR 5,198 thousand as of the reporting date December 31, 2011.
Impairment losses on property, plant and equipment totaled EUR 3,515 thousand (2010: EUR 6,529 thousand) and are allocated to depreciation/amortization in the relevant functional areas in the consolidated income statement. Impairment losses were mainly also attributable to property, plant and equipment of certain stores. They were taken after conducting impairment tests.
AdditioNAl

200
h u G o b o s s Annual Report 2011 coNsolidAted FiNANciAl stAteMeNts
Notes to the Consolidated Balance Sheet
12 // NoN-curreNt Assets held For sAle
In the fourth quarter of 2010, the former office building of HUGO BOSS Shoes & Accessories S.p.A., Morrovalle, Italy, was classified as a “non-current asset held for sale” due to the intention to sell it in fiscal year in 2011 and the fact that there was an offer to buy. The sale of the building took place in the second quarter of 2011. HUGO BOSS Shoes & Accessories S.p.A., Morrovalle, Italy is allocated to the “Corporate Units”.
13 // FiNANciAl ANd other Assets
2011 2010
in EUR thousand
thereofcurrent
thereof non-current
thereofcurrent
thereof non-current
Financial assets 25,445 11,701 13,744 31,464 10,621 20,843
Tax refund claimsand prepayments
17,332
17,332
0
12,933
12,908
25
Other assets 56,664 53,985 2,679 51,866 49,013 2,853
99,441 83,018 16,423 96,263 72,542 23,721
Financial assets includes positive fair values from currency hedging transactions in the amount of EUR 11,171 thousand (2010: EUR 19,000 thousand) and rent deposits for directly operated stores in the amount of EUR 14,274 thousand (2010: EUR 12,464 thousand). The decrease in this item as compared to the previous year is chiefly attributable to sold options in connection with hedging transactions for obligations from the “Stock Appreciation Rights Program” (SAR).
Impairment losses on other assets in the fiscal year 2011 amounted to EUR 279 thousand (2010: EUR 939 thousand).
Other assets include receivables from credit card companies, bonus receivables from supplier relationships and advance payments for service contracts and rents.
14 // iNveNtories
in EUR thousand 2011 2010
Finished goods and merchandise 380,602 311,056
Raw materials and supplies 72,379 62,225
Work in progress 4,932 4,049
457,913 377,330
The carrying amount of inventories recognized at the lower net realizable amount is EUR 164,450 thousand (2010: EUR 124,111 thousand). In fiscal year 2011, impairment losses on finished goods and raw materials in particular amounted to EUR 34,439 thousand (2010: EUR 24,361 thousand).

Notes to the Consolidated Balance Sheet h u G o b o s s Annual Report 2011
201
15 // trAde receivAbles
in EUR thousand 2011 2010
Trade receivables 174,576 133,365
Trade receivables do not bear interest and generally have a maturity of 30 to 90 days.
All recognizable risks are accounted for by means of appropriate impairment losses. Specific shortfalls result in the claims in question being written off.
The development of impairment losses on doubtful accounts is as follows:
in EUR thousand 2011 2010
Allowances for doubtful accounts as of January 1 36,760 31,604
Additions 11,739 6,702
Use ( 1,895) ( 2,088)
Release ( 13,162) 12
Currency differences 79 530
Allowances for doubtful accounts as of december 31 33,521 36,760
Any income or expense from allowances on trade receivables is shown under selling and distribution expenses.
As of December 31, the aging structure of trade receivables was as follows:
in EUR thousand 2011 2010
carrying amount 174,576 133,365
thereof: neither due, nor impaired 119,987 88,514
thereof: overdue, but not impaired 54,589 44,851
≤ 30 days 24,888 25,253
> 30 to 60 days 17,080 10,549
> 60 to 90 days 6,224 5,227
> 90 to 120 days 1,862 1,900
> 120 to 180 days 2,147 614
> 180 to 360 days 1,493 985
> 360 days 895 323
As of the reporting date, there was no indication that any creditors would default on their payment obligations with regard to receivables that were neither due nor impaired. The total of overdue but not impaired receivables (EUR 54,589 thousand) is equivalent to the difference between overdue receivables (EUR 88,110 thousand) and the valuation allowances (EUR 33,521 thousand) recognized on them.
AdditioNAl

202
h u G o b o s s Annual Report 2011 coNsolidAted FiNANciAl stAteMeNts
Notes to the Consolidated Balance Sheet
16 // cAsh ANd cAsh eQuivAleNts
in EUR thousand 2011 2010
Balances with banks and other cash items 188,595 289,228
Checks/ec-cash 2,555 3,199
Cash in hand 9,246 2,457
200,396 294,884
In addition to cash in the narrow sense – i.e. checks, cash on hand and bank balances – cash and cash equiva-lents also includes short-term investments which can be converted into cash at any time and are subject only to immaterial fluctuations in value.
As of the reporting date, the bank balances item includes short-term investments totaling EUR 115,000 thousand (2010: EUR 245,600 thousand).
17 // subscribed cApitAl The fully paid-up share capital in HUGO BOSS AG at December 31, 2011 totals EUR 70,400,000. The nominal value per share is EUR 1. It is divided into 70,400,000 no-par value bearer shares, and can be broken down as follows:
in EUR thousand 2011 2010
Common shares 35,860,000 shares 35,860 35,860
Non-voting preferred shares 34,540,000 shares 34,540 34,540
70,400 70,400
The Managing Board of HUGO BOSS AG has authorized capital of EUR 35,200,000 at its disposal until May 13, 2014, subject to the consent of the Supervisory Board. Authorized capital allows the Company to increase its share capital on one or more occasions by issuing new common or preferred shares.
The dividends paid to holders of non-voting preferred shares from net retained earnings are EUR 0.01 higher per preferred share than the dividends paid to holders of common shares. However, the dividend for preferred shares amounts to no less than EUR 0.01 per share.
18 // treAsurY shAresThe number of treasury shares has remained unchanged since the previous year:
2011 2010
Common shares 528,555 528,555
Share of subscribed capital in % 0.8 0.8
Preferred shares 855,278 855,278
Share of subscribed capital in % 1.2 1.2
A resolution was passed at the Annual Shareholders’ Meeting of June 21, 2010 to extend the authorization to acquire own shares up to June 20, 2015.

Notes to the Consolidated Balance Sheet h u G o b o s s Annual Report 2011
203
19 // cApitAl reserve The capital reserve contains premiums on the issuance of shares.
20 // retAiNed eArNiNGs Retained earnings reflect income earned in the past by the companies included in the consolidated financial statements, provided such income was not paid out as dividends, as well as effects on income resulting from consolidation adjustments for prior periods.
21 // AccuMulAted other coMpreheNsive iNcoMe Accumulated other comprehensive income reflects differences arising from the currency translation of foreign subsidiaries’ financial statements with a negative impact on equity of EUR –9,478 thousand (2010: EUR –14,853 thousand) and the effects of the measurement of financial instruments after taxes, neither of which is recognized in income. Deferred tax income not recognized in the income statement amount to EUR 3,895 thousand (2010: EUR 5,773 thousand).
With respect to income and expenses recognized in equity, please refer to the Statement of Comprehensive Income.
22 // divideNdIn accordance with the German Stock Corporation Act (AktG), the dividend payout to shareholders is based on net retained earnings for the year amounting to EUR 203,097 thousand as reported in the HUGO BOSS AG financial statements. The dividend proposed to the Annual Shareholders’ Meeting for distribution from the net retained earnings of HUGO BOSS AG in 2011 amounts to EUR 199,103 thousand. This corresponds to EUR 2.88 per common share and EUR 2.89 per preferred share. A recommendation will also be made to the Annual Shareholders’ Meeting for the dividend amount attributable to own shares of EUR 3,994 thousand to be carried forward.
In 2011, dividends totaling EUR 139,750 thousand were paid out for outstanding shares for the fiscal year 2010 (in 2010 for the fiscal year 2009: EUR 66,592 thousand). This equates to EUR 2.02 (2009: EUR 0.96) per common share and EUR 2.03 (2009: EUR 0.97) per preferred share.
23 // provisioNs
in EUR thousand 2011 2010
Provisions for pensions 20,662 19,319
Other non-current provisions 20,218 19,728
Non-current provisions 40,880 39,047
current provisions 89,822 86,807
130,702 125,854
Other provisions amounting to EUR 110,040 thousand (2010: EUR 106,535 thousand) comprise current provisions of EUR 89,822 thousand (2010: EUR 86,807 thousand) and other non-current provisions of EUR 20,218 thousand (2010: EUR 19,728 thousand).
AdditioNAl

204
h u G o b o s s Annual Report 2011 coNsolidAted FiNANciAl stAteMeNts
Notes to the Consolidated Balance Sheet
Other provisions changed as follows during the fiscal year 2011:
in EUR thousand
balance onJan. 1, 2011
currencydifferences
Addition
use
release
balance ondec. 31, 2011
Provisions for personnel expenses 53,623 396 28,404 (25,902) (1,279) 55,242
Costs of litigation, pending legal disputes
5,450
55
3,841
(1,336)
(440)
7,570
Miscellaneous provisions 47,462 1,506 33,896 (17,419) (18,217) 47,228
106,535 1,957 66,141 (44,657) (19,936) 110,040
Provisions for personnel expenses relate mainly to profit sharing and bonuses, severance payments, outstanding vacation entitlements, wages and salaries.
Overall, the company expects that EUR 20,218 thousand (2010: EUR 19,728 thousand) of the provisions for personnel expenses will become due for the payment after more than twleve months.
Provisions for litigation costs and pending legal disputes include litigation costs for trademark protection. These provisions are classified as current provisions.
Miscellaneous provisions mainly include provisions for product returns that are expected to be settled within twelve months. Provisions for possible effects of legal and fiscal matters were also recognized on the basis of reasonable estimates.
24 // provisioNs For peNsioNs ANd siMilAr obliGAtioNsThe amount of the benefit obligations was determined using actuarial methods in accordance with IAS 19, with actuarial gains and losses being recognized in profit or loss in the period in which they occurred.
in EUR thousand 2011 2010
Provisions for pensions 17,130 16,006
Provisions for similar obligations 3,532 3,313
20,662 19,319
Pension provisions are created for obligations based on pension benefits and for ongoing payments to eligible active and former employees of the HUGO BOSS Group. Pension commitments based on the retirement plans are determined largely by the period of service of the eligible employees. With company pensions, a distinc-tion is generally made between two types of pension system: defined contribution pension plans and defined benefit pension plans. In the HUGO BOSS Group, the pension plans are mostly defined benefit pension plans. The HUGO BOSS Group also offers Managing Board members and executives the option to acquire additional pension benefits by means of deferred compensation agreements.

Notes to the Consolidated Balance Sheet H U G O B O S S Annual Report 2011
205
The company retirement plan is mostly funded by plan assets, to which the reinsurance policies are attributed as qualifying insurance policies in accordance with IAS 19.7 in conjunction with IAS 19.102 et seq.Calculation of pension expenses is based on planned service cost and expected returns on plan assets. Based on the calculation principles set forth in IAS 19, the following is a summary of the current funding status of pension commitments in fiscal year 2011:
in EUR thousand 2011 2010
Change in present value of benefit obligation
Present value of benefit obligation on January 1 65,899 49,199
Currency differences 515 2,586
Service cost 5,624 5,382
Interest cost 2,634 2,449
Actuarial gains/losses 67 4,005
Benefits paid (1,988) (3,314)
Contribution by participants of the plan 5,708 5,592
Other changes in benefit obligation 409 0
Present Value of benefit obligation on December 31 78,868 65,899
Change in plan assets
Fair value of plan assets on January 1 49,893 39,929
Currency differences 313 1,768
Expected return on plan assets 2,292 1,707
Benefits paid (1,223) (2,714)
Actuarial gains/losses 190 (138)
Contribution by the employer 3,050 1,741
Contribution by participants of the plan 5,708 5,592
Asset Ceiling gem. IAS 19.58 (642) 200
Other changes in benefit obligation 2,157 1,808
Fair value of plan assets on December 31 61,738 49,893
Funding status of the benefits funded by plan assets 17,130 16,006
Pensions funded by provisions 0 0
Provisions for pensions 17,130 16,006
The change in present values as compared to the previous year resulted partly from the change in the discount rate in Germany from 4.65% to 4.50%. This change is reflected in the actuarial gains and losses.
Pension expenses consist of service costs for the period, interest expense, expected return on plan assets, actuarial gains and losses, net income/expense based on the asset ceiling pursuant to IAS 19.58, and any other changes in the present value of the benefit obligation and the plan assets.

206
h u G o b o s s Annual Report 2011 coNsolidAted FiNANciAl stAteMeNts
Notes to the Consolidated Balance Sheet
For commitments from deferred compensation, current service costs are only incurred in the year the deferral takes place. Additional work performed does not lead to an increase in the pension commitments. For pension commitments from previous years, employee contributions are reported in net terms at the service cost and the associated actuarial gains and losses. Interest expenses are reported under the other financial result.
in EUR thousand 2011 2010
Current service costs 5,624 5,382
Interest costs 2,634 2,449
Expected return on plan assets (2,292) (1,707)
Actuarial gains/losses recognized (123) 4,143
Asset ceiling (642) (200)
Past service cost 0 0
pensions expenses for the period 5,201 10,067
The amounts for the current and the four preceding reporting periods are as follows:
in EUR thousand 2011 2010 2009 2008 2007
Present value of benefit obligation 78,868 65,899 49,199 40,249 33,954
Fair value of plan assets 61,738 49,893 39,929 31,441 24,469
Funding status of the benefits funded by plan assets 17,130 16,006 9,270 8,808 9,485

Notes to the Consolidated Balance Sheet h u G o b o s s Annual Report 2011
207
The actuarial calculation used to determine the present value of the defined benefit obligations also included relevant influencing values as well as the planned service cost and the expected return on plan assets. In addition to assumptions regarding life expectancy, the following assumptions were made here, taking into account country-specific circumstances:
Actuarial assumptions 2011 2010
discount rate
Germany 4.50% 4.65%
Mexico 8.25% 9.25%
Switzerland 2.40% 2.50%
rate of compensation increase
Germany 1.75% 1.75%
Mexico 0.00% 0.00%
Switzerland 0.00% 0.00%
expected salary increase
Germany 2.50% 2.50%
Mexico 4.75% 4.75%
Switzerland 4.00% 4.00%
expected rate of return on plan assets
Germany 4.50% 4.50%
Mexico 0.00% 0.00%
Switzerland 2.40% 2.50%
The expected total return on plan assets was calculated on the basis of common market expectations for the period during which the obligations were fulfilled.
Employee contributions to defined benefit plans in fiscal year 2011 totaled EUR 7,530 thousand (2010: EUR 7,400 thousand). For fiscal year 2012, the Group expects employee contributions to defined benefit plans to total EUR 1,496 thousand.
For fiscal year 2012, the Group expects employer contributions to plan assets to amount to EUR 3,707 thousand and employee contributions to EUR 1,496 thousand.
Pension obligations for Germany were calculated using biometric principles in accordance with the 2005 G mortality tables compiled by Prof. Dr. Klaus Heubeck. In addition, the assumptions upon which the calculation of pension provisions is based are subject to economic fluctuations, such as interest rate changes. Deviations in the corresponding parameters could have an influence on the present value and fund assets reported on the balance sheet in future periods.
AdditioNAl

208
h u G o b o s s Annual Report 2011 coNsolidAted FiNANciAl stAteMeNts
Notes to the Consolidated Balance Sheet
25 // FiNANciAl liAbilities Financial liabilities include all interest-bearing and non-interest-bearing obligations in existence as of the relevant reporting date. They consist of the following:
in EUR thousand 2011 2010
Non-current financial liabilities 355,042 514,122
Current financial liabilities 33,464 18,814
388,506 532,936
in EUR thousand
2011
with remaining termup to 1 year
2010
with remaining termup to 1 year
Financial liabilities due to banks 349,464 4,392 495,961 1,722
Other financial liabilities 39,042 29,072 36,975 17,092
388,506 33,464 532,936 18,814
Other financial liabilities include liabilities from financial instruments with negative fair values totaling EUR 21,917 thousand (2010: EUR 25,740 thousand) and liabilities from finance leases in the amount of EUR 1 thousand (2010: EUR 15 thousand).

Notes to the Consolidated Balance Sheet h u G o b o s s Annual Report 2011
209
The tables below show the maturities of and conditions for financial liabilities:
Financial liablities due to banks
2011 2010
Remaining term
weighted average
interest rate
carrying amount
eur thous.
weighted average
interest rate
carrying amount
eur thous.
up to 1 year 2.46% 4,392 3.70% 1,722
1 to 5 years 1.70% 321,642 1.46% 468,665
more than 5 years 3.77% 23,430 3.89% 25,574
The weighted average interest rates for 2010 have been adjusted due to the presentation of a bank loan before hedging transactions.
other financial liabilities
2011 2010
Remaining term
weighted average
interest rate
carrying amount
eur thous.
weighted average
interest rate
carrying amount
eur thous.
up to 1 year 1.16% 29,072 3.12% 17,092
1 to 5 years 1.97% 9,011 3.17% 19,315
more than 5 years 4.06% 959 4.41% 568
Under other financial liabilities with a remaining term of up to one year, the weighted average interest rate is strongly influenced by non-interest bearing liabilities. More information on the objectives, methods and processes of capital management is available in the Manage-ment Report in the chapter “Financial position”.
AdditioNAl

210
h u G o b o s s Annual Report 2011 coNsolidAted FiNANciAl stAteMeNts
Notes to the Consolidated Balance Sheet
The following table shows the contractual undiscounted cash flows for non-derivative financial liabilities and for derivative financial instruments with negative fair values:
expected cash flows
2011 in EUR thousand
carrying amount
total cash flows
< 1 year
1– 5 years
> 5 years
Non-derivative financial liabilities
Financial liabilities due to banks 349,464 372,958 11,523 332,159 29,276
Liabilities from finance leases 1 1 1 0 0
derivative financial liabilities
Freestanding derivatives 6,641 6,874 690 5,054 1,130
Derivatives subject to hedge accounting 15,276 15,367 11,314 4,053 0
Other financial liabilities 17,124 17,124 17,124 0 0
Financial liabilities 388,506 412,324 40,652 341,266 30,406
expected cash flows
2010 in EUR thousand
carrying amount
total cash flows
< 1 year
1– 5 years
> 5 years
Non-derivative financial liabilities
Financial liabilities due to banks 495,961 535,271 10,337 490,594 34,340
Liabilities from finance leases 15 15 14 1 0
derivative financial liabilities
Freestanding derivatives 3,100 3,315 617 1,979 719
Derivatives subject to hedge accounting 22,640 22,914 10,787 12,127 0
Other financial liabilities 11,220 11,220 5,727 5,493 0
Financial liabilities 532,936 572,735 27,482 510,194 35,059
The residual carrying amounts of certain long-term loans were added to the values as of December 31, 2010.

Notes to the Consolidated Balance Sheet h u G o b o s s Annual Report 2011
211
26 // other liAbilities
2011 2010
in EUR thousand
thereofcurrent
thereofnon-current
thereofcurrent
thereofnon-current
Other liabilities 95,549 79,991 15,558 84,947 57,840 27,107
from taxes (26,161) (26,161) 0 (18,501) (18,501) 0
from social security (4,407) (4,407) 0 (3,800) (3,800) 0
95,549 79,991 15,558 84,947 57,840 27,107
In addition to liabilities for taxes and social security, other liabilities primilary include deferred liabilities from rent obligations for directly operated retail business and for outstanding wage and salary payments, overtime and vacation entitlement.
27 // trAde pAYAbles
in EUR thousand 2011 2010
Trade payables 225,145 187,991
Trade payables have terms to maturity of up to one year.
AdditioNAl

212
h u G o b o s s Annual Report 2011 coNsolidAted FiNANciAl stAteMeNts
Notes to the Consolidated Balance Sheet
28 // AdditioNAl disclosures oN FiNANciAl iNstruMeNtsThe following table shows the carrying amounts and fair values of all financial instruments recognized in the consolidated financial statements.
carrying amounts and fair values by class of financial instruments
2011 2010
in EUR thousand
iAs 39
category
carrying amount
Fair value
carrying amount
Fair value
Assets
Cash and cash equivalents LaR 200,396 200,396 294,884 294,884
Trade receivables LaR 174,576 174,576 133,365 133,365
Other financial assets 25,445 25,445 31,464 31,464
thereof:
Freestanding derivatives FAHfT 11,171 11,171 19,000 19,000
Derivatives subject to hedge accounting n.a. 0 0 0 0
Other financial assets LaR 14,274 14,274 12,464 12,464
liabilities
Financial liabilities due to banks FLAC 349,464 353,314 495,961 497,573
Trade payables FLAC 225,145 225,145 187,991 187,991
Other financial liabilities 39,042 39,042 36,975 36,975
thereof:
Liabilities from finance leases n.a. 1 1 15 15
Freestanding derivatives FLHfT 6,641 6,641 3,100 3,100
Derivatives subject to hedge accounting n.a. 15,276 15,276 22,640 22,640
Other financial liabilities FLAC 17,124 17,124 11,220 11,220
totals for categories of financial instruments according to iAs 39:
Loans and Receivables LaR 389,246 389,246 440,713 440,713
Financial Assets Held for Trading FAHfT 11,171 11,171 19,000 19,000
Financial Liabilities Measured at Amortised Cost FLAC 591,733 595,583 695,172 696,784
Financial Liabilities Held for Trading FLHfT 6,641 6,641 3,100 3,100
The fair value of financial assets and financial liabilities is indicated with the amount for which the relevant instrument could be exchanged in a current transaction between willing parties. The methods and assumptions used in determining fair value are as follows:
Cash and cash equivalents, trade receivables, other financial assets, trade payables and other current liabilities come very close to their carrying value, primarily due to the short maturities of these instruments.
Notes to the Consolidated Balance Sheet h u G o b o s s Annual Report 2011
213
The fair value of bank loans and other financial liabilities, liabilities from financial leases and other non-current financial liabilities is calculated by discounting the future cash flows using interest rates currently available for borrowing at similar conditions, credit risks and maturities.
The fair value of financial assets available for sale will be determined, if available, on the basis of market prices in active markets.
The Group enters into derivative financial instruments with various parties, primarily with financial institutions with good credit quality (investment grade). Financial transactions with parties with a lower credit rating require the approval of the Managing Board and are concluded to a limited extent only. Derivatives valued using a valuation method with input parameters observable on the market primarily include interest rate swaps and currency forward contracts. The most frequently used valuation methods include the forward price and swap models using present value calculations. These models take account of different measures, such as the cred-itworthiness of counterparties, foreign exchange spot and forward rates, yield curves and forward rates of the underlying commodities.
As of December 31, 2011, the derivative positions are valued at market prices (marked-to-market) minus the allowance for creditworthiness, which is based on the default risk of the counterparty of the derivative. The changes in credit risk of the counterparty had no significant impact on the assessment of the effectiveness of the hedging relationship.
hierArchY oF FAir vAluesThe Group uses the following hierarchy to determine and report the fair value of financial instruments by valuation method:
Level 1: Listed (non-adjusted) prices in active markets for similar assets or liabilitiesLevel 2: Method in which all the input parameters that have a significant impact on the determination of fair
value are either directly or indirectly observableLevel 3: Method in which the input parameters that have a significant impact on the determination of fair value
are not based on observable market data
As of December 31, 2011, level 2 applies to all financial instruments in the categories FAHfT and FLHfT and to derivatives with hedging relationships that are measured at fair value.
AdditioNAl

214
h u G o b o s s Annual Report 2011 coNsolidAted FiNANciAl stAteMeNts
Notes to the Consolidated Balance Sheet
Net GAiNs or losses bY cAteGorY oF FiNANciAl iNstruMeNts
in EUR thousand
interest
income and expenses
changes in fair value
currency translation
bad debt losses
disposal of
financial instruments
2011
2010
Derivatives (FAHfT und FLHfT)
0
(4,762)
0
0
3,378
(1,384)
11,052
Loans and Receivables (LaR)
4,721
0
5,729
(2,383)
0
8,067
(5,528)
Financial Liabili- ties Measured at Amortised Cost (FLAC)
(20,920)
0
2,981
0
0
(17,939)
(7,998)
Interest from financial instruments is reported under net interest income/expense (see note (5) to the consoli-dated income statement).
Valuation allowances on trade receivables attributable to Loans and Receivables are classified as other operating expenses.
Gains and losses from the translation of receivables and liabilities denominated in foreign currencies, changes in fair value and the effects of disposals of currency hedges are reported under the other financial result.
The effects from the change in fair value of the call options to hedge the SAR provisions are recognized in personnel expenses and in the other financial result (also see note (36) Share-based payments).

Other Disclosures h u G o b o s s Annual Report 2011
215
other disclosures
29 // coNtiNGeNt liAbilities No provisions have been recognized for the following contingent liabilities, which are recognized at nominal value, as the associated risks are considered unlikely to materialize.
in EUR thousand 2011 2010
Contingent liabilities from the provision of collateral for third-party liabilities 1,018 933
Other contingent liabilities 0 0
1,018 933
30 // other FiNANciAl obliGAtioNs operating leasesIn addition to finance leases, a substantial number of leases exist that qualify as operating leases due to their economic substance, meaning that the leased asset is accounted for by the lessor.
Operating leases particularly relate to rental agreements for properties used for the Group’s retail activities, storage space, as well as for office space used by Group companies. These rental agreements are predomi-nantly based on minimum lease payments. There are also leases that contain agreements on contingent rents (in particular contingent on sales).
In fiscal year 2011, rental expenses in the amount of EUR 141,773 thousand (2010: EUR 127,659 thousand) were recognized for operating leases. Contingent rental expenses totaled EUR 33,652 thousand (2010: EUR 14,262 thousand).
Under operating lease agreements, the following payments become due in subsequent periods:
2011 in EUR thousand
due2012
due2013-2016
due after 2016
total
Sum of future minimum lease payments (operating leases) 132,626 363,526 187,459 683,611
Other obligations 13,241 537 0 13,778
145,867 364,063 187,459 697,389
2010 in EUR thousand
due2011
due2012-2015
due after 2015
total
Sum of future minimum lease payments (operating leases) 110,904 301,998 180,492 593,394
Other obligations 10,585 8,646 2 19,233
121,489 310,644 180,494 612,627
As in the previous year, the Group did not generate substantial revenues from subleases in fiscal year 2011.
Finance leasesIn fiscal year 2011, these did not include land within property, plant and equipment attributed to the Group’s beneficial ownership as per IAS 17 (2010: EUR 9 thousand). They included operating and office equipment totaling EUR 1 thousand (2010: EUR 6 thousand).
AdditioNAl

216
h u G o b o s s Annual Report 2011 coNsolidAted FiNANciAl stAteMeNts
Other Disclosures
Under finance lease agreements, the following payments become due in subsequent periods:
in EUR thousanddue
2012due
2013 – 2016due
after 2016
Minimum lease payments (1) 0 0
Discounts 0 0 0
Present value (1) 0 0
other financial obligationsThe HUGO BOSS Group has entered into advertising and sponsorship agreements which result in other financial obligations. This results in the following payments in subsequent years:
2011 in EUR thousand
due2012
due 2013 – 2016
due after 2016
total
Advertising and sponsoring contracts 12,477 19,671 0 32,148
12,477 19,671 0 32,148
2010 in EUR thousand
due 2011
due 2012 – 2015
due after 2015
total
Advertising and sponsoring contracts 9,336 24,204 0 33,540
9,336 24,204 0 33,540
There are also purchase commitments for investments in the amount of EUR 4,060 thousand (2010: EUR 2,975 thousand). EUR 2,204 thousand of this relates to property, plant and equipment (2010: EUR 1,966 thousand) and EUR 1,856 thousand relates to intangible assets (2010: EUR 1,009 thousand). In both 2011 and 2010, the purchase commitments were due within one year. There are no further financial obligations.
31 // hedGiNG policies ANd FiNANciAl derivAtives The following table summarizes the nominal amounts and fair values of financial derivatives:
2011 2010
in EUR thousand
Nominalamounts
Fair values
Nominalamounts
Fair values
Assets
Currency hedging contracts 50,579 3,245 56,343 4,008
Interest hedging contracts 0 0 0 0
Call options (SAR-Hedges) 9,964 7,926 21,846 14,992
liabilities
Currency hedging contracts 63,572 (3,552) 24,216 (734)
Interest hedging contracts (312,550) (18,365) (313,030) (25,006)
Call options (SAR-Hedges) 0 0 0 0
(188,435) (10,746) (210,625) (6,740)
Other Disclosures h u G o b o s s Annual Report 2011
217
The nominal amounts shown reflect the hedged amount of the respective underlying transaction. The fair values of financial derivatives are carried as other financial assets or other financial liabilities. The fair values do not necessarily represent the amounts that will be realized in the future under prevailing market conditions.
In addition, financial assets include the fair values of call options to hedge the Stock Appreciation Rights Program in the amount of EUR 7,926 thousand (2010: EUR 14,992 thousand).
The fair value of derivative financial instruments recognized includes a fair value of EUR 4,530 thousand (2010: EUR 15,900 thousand) from financial assets and liabilities classified as held for trading.
As of December 31, 2011, expenses totaling EUR –11,381 thousand (2010: EUR –16,867 thousand) resulting from the change in fair value of interest hedges were recognized directly in equity in the item accumu-lated other comprehensive income after deducting deferred taxes. Expenses from interest hedges totaling EUR –10,025 thousand (2010: expenses totaling EUR –11,933 thousand) were transferred from accumulated other comprehensive income to profit and loss in the fiscal year 2011. No effects from currency hedging transac-tions were reclassified from equity to the profit or loss for the period in the fiscal year 2011 (2010: expenses totaling EUR –7,853 thousand).
As a Group with international operations, HUGO BOSS is subject to risks arising from movements in exchange rates and interest rates as a result of its ordinary business operations. Derivative financial instruments are employed to mitigate these risks. Only marketable instruments with adequate liquidity are used. The utilization of financial derivatives is subject to internal guidelines and controls at HUGO BOSS.
When using financial derivatives, the HUGO BOSS Group is exposed to the risk of counterparty default. HUGO BOSS reduces this risk by concluding such transactions exclusively with leading financial institutions with very good to good credit ratings.
currency risksThe information required under IFRS 7 on currency risks as well as a corresponding sensitivity analysis are presented in detail in the chapter entitled Risk Report in the Management Report. As in the previous year, the currency risk is calculated based on the exposure already recognized, as the hedging strategy continues to be aimed at limiting balance sheet risks.
interest risksThe information required under IFRS 7 on interest rate risks as well as a corresponding sensitivity analysis are presented in detail in the chapter entitled Risk Report in the Management Report.
Risks arising from stock appreciation rights are presented in detail in note (36).
AdditioNAl

218
h u G o b o s s Annual Report 2011 coNsolidAted FiNANciAl stAteMeNts
Other Disclosures
32 // Notes to the coNsolidAted stAteMeNt oF cAsh Flow The HUGO BOSS Group’s cash flow statement shows the changes that occurred in cash and cash equivalents during the year under review on the basis of cash transactions. Pursuant to IAS 7, cash flows are reported separately according to source and application in operating activities, investing activities, and financing activi-ties. Cash flows from current business activities are derived indirectly based on the Group’s net income. By contrast, cash flows from investing and financing activities are calculated directly from inflows and outflows.
The changes in the Group’s cash and cash equivalents are a result of the development of individual cash flows after taking exchange rate-related changes into account.
Cash and cash equivalents as presented in the cash flow statement include all cash items reported on the balance sheet, meaning that in addition to cash in the narrow sense – i.e. checks, cash on hand and bank balances – it also includes short-term investments which can be converted into cash at any time and are subject only to immaterial fluctuations in value. Cash and cash equivalents are measured at amortized cost.
other non-cash transactionsNon-cash income and expenses relate particularly to unrealized foreign currency gains/losses, changes in the fair value of derivative financial instruments which affect profit or loss and other non-cash changes in financial liabilities.
Non-cash investing activitiesIn fiscal year 2011, the acquisition and initial consolidation of the joint venture companies resulted in an addition to assets of EUR 30,858 thousand. No such effect was recognized in fiscal year 2011.
Non-cash financing activitiesIn fiscal year 2011, the acquisition and initial consolidation of the joint venture companies resulted in an addition to financial liabilities of EUR 11,200 thousand. No such effect was recognized in fiscal year 2011.

Other Disclosures h u G o b o s s Annual Report 2011
219
33 // seGMeNt reportiNG The Managing Board of HUGO BOSS AG leads the Group by geographic areas. The HUGO BOSS national distribution companies are responsible for the sales of all HUGO BOSS products that are not sold as licensed products by third parties in their respective regions. The Managing Directors of the national companies are responsible to the competent regional directors, who report to the Managing Board of HUGO BOSS AG. This organizational structure ensures that Group targets are implemented directly while taking account of particular market conditions.
The operating segments are therefore divided into the three regions of Europe, Americas, and Asia/Pacific as well as the royalties segment. The respective distribution companies of the HUGO BOSS Group are allocated to the reportable regional sales segments, while the royalties segment separates out all of HUGO BOSS’ licensing business with third parties.
The chief operating decision maker of the HUGO BOSS Group is defined as the Managing Board of HUGO BOSS AG.
The management of the regional business units is aligned to the value added contribution at Group level.The most important key figure for management and allocation of resources by the Managing Board is EBITDA before special items. The segment profit is therefore defined as EBITDA before special items of the respective distribution units plus the gross profit margin of the sourcing units and intercompany royalty sales.
Group financing (including interest income and expense) and income taxes are managed on a Group-wide basis and are thus not assigned to individual business segments.
Managing the operating figures inventories and trade receivables is the responsibility of the sales regions. These items are reported on a regular basis to the Managing Board. Thus, segment assets only comprise trade receivables and inventories.
Liabilities are not part of segment reporting. As a result, segment liabilities are not disclosed.
The Group’s internal reporting is structured in such a way that it reports in compliance with the International Financial Reporting Standards (IFRS).
The Managing Board reviews certain effects recognized in the statement of comprehensive income on a regular basis, including impairment losses and depreciation/amortization in particular.
Capital expenditure is also reported to the Managing Board on a regular basis as part of the internal reports and is therefore a component of segment reporting.
AdditioNAl

220
h u G o b o s s Annual Report 2011 coNsolidAted FiNANciAl stAteMeNts
Other Disclosures
All expenses and assets that are not directly attributable to the sales regions or the royalties segment are recognized in the following reconciliation statements under Corporate units/Consolidation.
europe 1
Americas
Asia/pacific
royalties
total operating
segments
in EUR thousand Jan. – dec. 2011 Jan. – dec. 2011 Jan. – dec. 2011 Jan. – dec. 2011 Jan. – dec. 2011
Net sales 1,245,399 454,793 309,320 49,329 2,058,841
segment profit 486,314 122,347 111,070 43,002 762,733
in % of net sales 39.0 26.9 35.9 87.2 37.0
Segment assets 145,043 154,028 78,332 16,609 394,012
Capital expenditure 50,511 12,881 10,288 8 73,688
Impairments (1,301) (1,659) (1,195) 0 (4,155)
thereof tangible assets (1,086) (1,659) (770) 0 (3,515)
thereof intangible assets (215) 0 (425) 0 (640)
Depreciation/Amortization (19,654) (11,644) (11,597) 0 (42,895)
SAR expenses and hedging 0 0 0 0 0
1 incl. Middle East and Africa.
europe 1
Americas
Asia/pacific
royalties
total operating
segments
in EUR thousand Jan. – dec. 2010 Jan. – dec. 2010 Jan – dec. 2010 Jan. – dec. 2010 Jan. – dec. 2010
Net sales 1,073,178 380,748 230,375 45,145 1,729,446
segment profit 393,861 94,654 80,024 39,171 607,710
in % of net sales 36.7 24.9 34.7 86.8 35.1
Segment assets 120,083 112,162 64,735 16,639 313,619
Capital expenditure 17,444 10,323 15,877 6 43,650
Impairments (3,803) (2,615) (86) 0 (6,504)
thereof tangible assets (3,287) (2,560) (86) 0 (5,933)
thereof intangible assets (516) (55) 0 0 (571)
Depreciation/Amortization (18,375) (11,535) (8,490) 0 (38,400)
SAR expenses and hedging (5,359) (484) (17) (342) (6,202)
1 incl. Middle East and Africa.
reconciliation
sales in EUR thousand
Jan. – dec. 2011
Jan. – dec. 2010
Net sales operating segments 2,058,841 1,729,446
Corporate units/consolidation 0 0
Net sales huGo boss Group 2,058,841 1,729,446

Other Disclosures h u G o b o s s Annual Report 2011
221
operating income in EUR thousand
Jan. – dec. 2011
Jan. – dec. 2010
segment profit operating segments 762,733 607,710
Depreciation/Amortization operating segments (42,895) (38,400)
Impairments operating segments (4,155) (6,504)
Special items operating segments (1,431) (6,679)
operating income (ebit) operating segments 714,252 556,127
Corporate units/consolidation (320,162) (292,184)
operating income (ebit) huGo boss Group 394,090 263,943
Net interest income/expenses (16,199) (17,285)
other financial items 4,500 2,497
earnings before taxes huGo boss Group 382,391 249,155
capital expenditures in EUR thousand
Jan. – dec. 2011
Jan. – dec. 2010
capital expenditures operating segments 73,688 43,650
Corporate units/consolidation 34,791 11,934
capital expenditures huGo boss Group 108,479 55,584
depreciation/amortization in EUR thousand
Jan. – dec. 2011
Jan. – dec. 2010
depreciation/Amortization operating segments (42,895) (38,400)
Corporate units/consolidation (26,370) (26,710)
depreciation/Amortization huGo boss Group (69,265) (65,110)
impairments in EUR thousand
Jan. – dec. 2011
Jan. – dec. 2010
impairments operating segments (4,155) (6,504)
Corporate units/consolidation 0 (596)
impairments huGo boss Group (4,155) (7,100)
sAr expenses and hedging in EUR thousand
Jan. – dec. 2011
Jan. – dec. 2010
sAr expenses and hedging operating segments 0 (6,202)
Corporate units/consolidation 3,378 (1,570)
sAr expenses and hedging huGo boss Group 3,378 (7,772)
AdditioNAl

222
h u G o b o s s Annual Report 2011 coNsolidAted FiNANciAl stAteMeNts
Other Disclosures
segment assets
in EUR thousand
Jan. – dec. 2011
Jan. – dec. 2010
segment assets operating segments 394,012 313,619
Corporate units/consolidation 238,477 197,076
Current tax receivables 8,166 8,847
Current financial assets 11,701 10,621
Other current assets 71,317 61,921
Cash and cash equivalents 200,396 294,884
Assets classified as held for sales 0 1,290
current assets huGo boss Group 924,069 888,258
Non current assets 524,947 467,184
total Assets huGo boss Group 1,449,016 1,355,442
34 // disclosure oF relAted pArtY trANsActioNs Related parties include all companies and persons that meet the definition of a related party as set forth in IAS 24.9 with respect to Permira Holdings Limited, Guernsey.
During the reporting period from January 1 to December 31, 2011, the following transactions with related parties took place that were subject to reporting requirements:
In fiscal year 2011, HUGO BOSS AG and Red & Black Holding GmbH, Oberursel (Taunus), the direct parent company of HUGO BOSS AG, concluded a service contract. This service contract includes the preparation of the quarterly and annual financial statements of Red & Black Holding GmbH, Oberursel (Taunus), for which HUGO BOSS AG receives appropriate annual compensation in line with the market of EUR 50 thousand (December 31, 2010: EUR 60 thousand).
In the period from January 1 to December 31, 2011, the Company entered into legal transactions in the form of deliveries of goods in the amount of EUR 14 thousand (December 31, 2010: 22 thousand) with Permira Holdings Limited, Guernsey, the ultimate parent company of the HUGO BOSS Group, and/or with its affiliated companies.
Senior management members are able to shop at HUGO BOSS as part of the benefits in kind granted to them as part of their salary and for personal use. Other than this, no significant transactions occurred between companies included in the HUGO BOSS Group and senior management members or their close relatives.
In 2008, HUGO BOSS AG also introduced the Management Participation Program (MPP for short), a form of share-based compensation for members of the top management. In the context of the MPP, managers can invest indirectly in Red & Black TopCo S.à r.l., Luxembourg, which represents a related party as set forth in IAS 24.9.
For further information, please see note (36).

Other Disclosures h u G o b o s s Annual Report 2011
223
35 // supervisorY boArd ANd MANAGiNG boArd Members of the Supervisory Board and the Managing Board are listed on pages 243 to 246.
compensation Managing boardOn the basis of a resolution passed by the Annual Shareholders’ Meeting on June 21, 2010, information on individual compensation is not provided.
The total fixed salary components for members of the Managing Board in the fiscal year 2011 amounted to EUR 2,873 thousand (2010: EUR 3,248 thousand). The fixed salary components paid to members of the Managing Board comprise, besides the salary, benefits such as company cars and other benefits in kind forming part of the salary, as well as other equipment and services necessary for Managing Board members to fulfill their duties.
The variable compensation components with a long-term incentive effect consist of a multi-year bonus granted in line with the achievement of personal targets agreed with the Supervisory Board and the fulfillment of the pre-defined key figures EBITDA before special items and trade net working capital. The bonus for one year is based predominantly on target achievement measured over a period of three years. After the end of the third fiscal year, the bonus is calculated conclusively and paid out. For a transition period during the introduction of the multi-year bonus agreements, the Managing Board members receive advance payments of the expected bonus. If the amount of the outstanding payment is negative, this must be repaid to HUGO BOSS AG by the Managing Board member. Additions to the provision for the multi-year bonus are made proportionally. As of December 31, 2011, there was a provision totaling EUR 4,050 thousand (2010: EUR 3,025 thousand).
Managing Board members holding office as of the reporting date are not eligible to participate in the “Stock Appreciation Rights Program”.
For the event of early termination, the employment contracts include regulations which – except for the deviation stated in the Declaration of Compliance from December 2011 – comply with the requirements of the German Corporate Governance Code. For the event of regular termination, the employment contracts do not include any regulations other than pension regulations. No compensation was paid out to Managing Board members leaving the Company in fiscal year 2011 (2010: EUR 2,934 thousand).
In addition, the Company has provided pension benefits for Managing Board members. The amount of future pension benefits is based on each member’s base salary and years of service. Additions to pension provisions for Managing Board members (excluding deferred compensation) amounted to EUR 1,209 thousand in 2011 (2010: EUR 1,964 thousand). For active members of the Managing Board, provisions for pension obligations were recognized in the amount of EUR 4,058 thousand (2010: EUR 2,849 thousand). The corresponding plan assets in the form of reinsurance policies amount to EUR 3,921 thousand (2010: EUR 2,457 thousand). The pension obligations for the former members of the Managing Board and their surviving dependants amounted to EUR 2,697 thousand (2010: EUR 2,694 thousand), after netting against the reinsurance policies qualifying as plan assets. These people received total compensation during 2011 amounting to EUR 186 thousand (2010: EUR 192 thousand).
AdditioNAl

224
h u G o b o s s Annual Report 2011 coNsolidAted FiNANciAl stAteMeNts
Other Disclosures
compensation supervisory boardThe Supervisiory Board received total compensation of EUR 1,534 thousand for its services in 2010. For fiscal year 2011, total compensation is expected to be EUR 1,911 thousand, including a provision for the variable component of EUR 1,156 thousand (2010: EUR 738 thousand) calculated on the basis of earnings per share in the consolidated financial statements.
In total, members of the Managing Board and the Supervisory Board hold less than 1% (2010: less than 1%) of the shares issued by HUGO BOSS AG.
36 // shAre-bAsed pAYMeNts „stock Appreciation rights program“During fiscal year 2001, HUGO BOSS AG introduced a Stock Appreciation Rights Program (SAR) for Managing Board members and executives.
As part of the Stock Appreciation Rights Program, executives of HUGO BOSS AG and its subsidiaries are granted a certain number of participation rights. These rights enable them to benefit from any increase in the value of the Company’s shares. The participation rights solely grant a claim to cash settlement, not a claim to HUGO BOSS AG shares.
1) program change 2009In December 2009, the management of HUGO BOSS AG resolved to revise the conditions of the Stock Appre-ciation Rights Program in order to avoid additional expenditure for hedging instruments. Effective December 14, 2009, all eligible executives were therefore offered the following program change:1 / Waiver of participation rights and all rights to tranches issued in the years from 2005 to 2008 against a
compensation payment2 / Adjustment of the exercise conditions of the tranche issued in 2009The compensation payment for the waiver of the rights to tranches 5 to 8 corresponded to the sum of the option value of each tranche multiplied by the number of participation rights. The relevant option values were determined by external banks on behalf of HUGO BOSS AG using a standard valuation model on December 14, 2009. The reference value used for the share price was the unweighted average of the closing price of preferred shares of HUGO BOSS AG in Xetra trading on the Frankfurt Stock Exchange during the five trading days immediately preceding December 14, 2009.
To limit the effects arising from extraordinary, unforeseen upward and downward movements in the share price, both the minimum and the maximum gain possible per option exercised for the participation rights of tranche 9 were defined in the program change. This called for the compensation to be granted to be at least equal to the difference between the price calculated for a preferred share on the basis of HUGO BOSS AG’s market capitalization in the last five trading days immediately preceding December 14, 2009 and the strike price of preferred shares upon issue, but at the most EUR 33.20. In addition, the program change allowed eligible parties to exercise up to one third of the participation rights of tranche 9 early before the end of the vesting period, effective December 14, 2009. The first time this was possible was December 14, 2009. In this case, the exercise gain corresponded to the minimum compensation defined above of EUR 11.77.
The program change permitted the extension of the holding period to three years, ending on December 31, 2011 (two years before the program change), with the exercise period being reduced correspondingly to two years, ending on December 14, 2013 (three-year exercise period before the program change). The overall term of tranche 9 issued in fiscal year 2009 remained unchanged at five years.

Other Disclosures h u G o b o s s Annual Report 2011
225
Following a continuous increase in the share price, the maximum gain possible per option exercised for the participation rights of tranche 9 was already exceeded in October 2010. Under the program modified in 2009, tranche 9 could be exercised in full for the first time starting from the beginning of 2012.
2) early termination of tranche 9As the Stock Appreciation Rights Program causes considerable administrative expense in both the HR depart-ment and the Finance department of the HUGO BOSS Group, the management of HUGO BOSS AG resolved to terminate tranche 9 early and offered all holders of participation rights in tranche 9 a payout of the maximum gain possible per share exercised as of December 15, 2010. The early termination of the program does not result in any additional expenses provided the share price is EUR 45.00 or higher at the end of 2011, too. The expenses from the pro-rata additions to the provision for tranche 9 from 2011 are simply brought forward to 2010.
As of December 31, 2010, the price for preferred shares was EUR 56.50, significantly higher than the share price required for the maximum gain on exercise (EUR 45.00).
Participation rights for tranches 7 and 8 that are still held may continue to be exercised after the program change in 2010 under the regulations governing the original option conditions.
3) Framework stock Appreciation rights programWith the exception of the terminated tranche 9, the remaining tranches of the Stock Appreciation Rights Program have six-year terms. After the initial lock up period of two years, the four-year exercise period shall commence. Participation rights for tranches 5 to 8 that were still held could still be exercised after the program change in 2009 under the regulations governing the original option conditions. If growth in HUGO BOSS AG market capitalization exceeds MDAX growth by 5 percentage points (exercise hurdle) at the expiry of the lock-up period or during the subsequent exercise period, participation rights in tranches 7 and 8 may be exercised.The compensation to be paid corresponds to the difference between the market capitalization as reflected in the average price of a HUGO BOSS AG preferred share during the five trading days preceding the date of exercise and the strike price of the preferred share in line with the conditions. The strike price corresponds to the average price of HUGO BOSS AG preferred shares during the 20 trading days preceding the date of issue.
In order to limit the risk arising from share price fluctuations in connection with the Stock Appreciation Rights Program (SAR), and hence the potential impact on the cash flow and earnings of HUGO BOSS AG, a corre-sponding hedging program was resolved in late 2007 to come into force from fiscal year 2008. Under the terms of this program, HUGO BOSS AG acquired term-equivalent U.S. call options for HUGO BOSS preferred shares from independent banks in the first quarter of fiscal year 2008. The subscription right is 1:1, i.e. each option corresponds to one preferred share. The total investment volume was just under EUR 33 million.
If the corresponding call options are sold back to the issuing bank when SARs are exercised by employees, the outflow of funds from the exercise of SARs is offset by an inflow of funds from the sale of the call options.
AdditioNAl

226
h u G o b o s s Annual Report 2011 coNsolidAted FiNANciAl stAteMeNts
Other Disclosures
The obligations arising from the SARs for HUGO BOSS AG, which are recognized in the form of corresponding provisions, and the call options used for hedging are regularly recognized as income at their fair value at the respective reporting date. The measurement of the call options and SAR obligations is based on the market values provided by the issuing banks. As the values of the call options and the corresponding SARs are identical at the respective reporting date, the resulting earnings effects largely offset each other.
Changes in the value of SARs already in the exercise period and the corresponding hedging transactions are offset against personnel expenses.
In fiscal year 2011, the stock appreciation rights did not result in any earnings effects in personnel expenses, as the hedging transactions offset the expense from the revaluation of the SAR provision (previous year: expense of EUR 7,626 thousand).
The income reported in the financial result for the valuation and sale of hedging transactions for which SAR provisions are no longer recognized amounted to EUR 3,378 thousand (2010: expenses of EUR 146 thousand).
For fiscal year 2011, this resulted in total income of EUR 3,378 thousand (2010: expenses of EUR 7,772 thousand) for the Stock Appreciation Rights Program. The provision recognized for the participation rights amounted to EUR 2,885 thousand as of December 31, 2011 (2010: EUR 2,647 thousand). The provision for exercisable option rights amounted to EUR 2,885 thousand as of December 31, 2011 (2010: EUR 2,647 thousand). The derivatives that function as hedges recorded a fair value of EUR 2,757 thousand (2010: EUR 2,512 thousand) as of the reporting date.
On May 8, 2008, the majority of the Annual Shareholders’ Meeting of HUGO BOSS AG resolved to distribute a special dividend. In line with the currently valid exercise requirements of the SAR program, the SAR parameters were adapted to EUREX conditions. A so called R-factor of 87.24% was calculated, meaning the previous strike prices (100%) and quantities were adjusted by this factor. This results in the following adjusted strike prices:
tranche 7 tranche 8
Date of Issue
January 2007
January 2008
Strike Price (EUR) pre special dividend 39.08 42.11
Strike Price (EUR) post special dividend 34.09 36.74
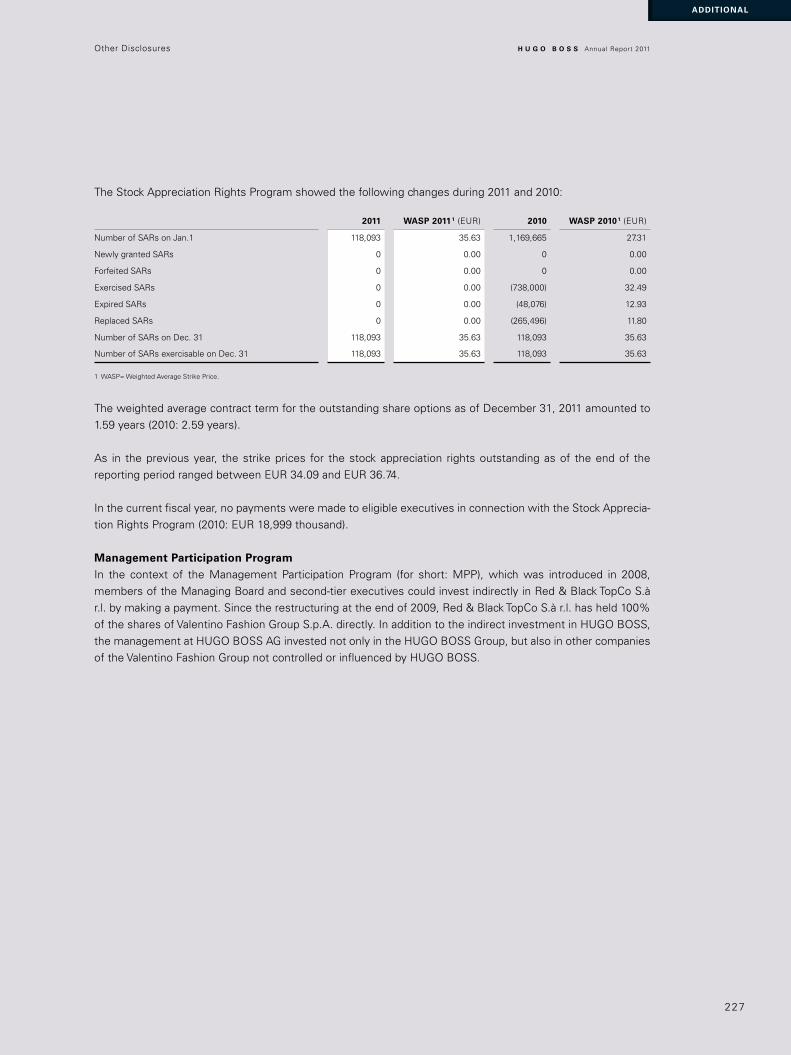
Other Disclosures h u G o b o s s Annual Report 2011
227
The Stock Appreciation Rights Program showed the following changes during 2011 and 2010:
2011 wAsp 2011 1 (EUR) 2010 wAsp 2010 1 (EUR)
Number of SARs on Jan.1 118,093 35.63 1,169,665 27.31
Newly granted SARs 0 0.00 0 0.00
Forfeited SARs 0 0.00 0 0.00
Exercised SARs 0 0.00 (738,000) 32.49
Expired SARs 0 0.00 (48,076) 12.93
Replaced SARs 0 0.00 (265,496) 11.80
Number of SARs on Dec. 31 118,093 35.63 118,093 35.63
Number of SARs exercisable on Dec. 31 118,093 35.63 118,093 35.63
1 WASP= Weighted Average Strike Price.
The weighted average contract term for the outstanding share options as of December 31, 2011 amounted to 1.59 years (2010: 2.59 years).
As in the previous year, the strike prices for the stock appreciation rights outstanding as of the end of the reporting period ranged between EUR 34.09 and EUR 36.74.
In the current fiscal year, no payments were made to eligible executives in connection with the Stock Apprecia-tion Rights Program (2010: EUR 18,999 thousand).
Management participation programIn the context of the Management Participation Program (for short: MPP), which was introduced in 2008, members of the Managing Board and second-tier executives could invest indirectly in Red & Black TopCo S.à r.l. by making a payment. Since the restructuring at the end of 2009, Red & Black TopCo S.à r.l. has held 100% of the shares of Valentino Fashion Group S.p.A. directly. In addition to the indirect investment in HUGO BOSS, the management at HUGO BOSS AG invested not only in the HUGO BOSS Group, but also in other companies of the Valentino Fashion Group not controlled or influenced by HUGO BOSS.
AdditioNAl

228
h u G o b o s s Annual Report 2011 coNsolidAted FiNANciAl stAteMeNts
Other Disclosures
The indirect investment in Red & Black TopCo S.à r.l. is carried out via a German limited partnership with Red & Black Management Beteiligungs GmbH & Co. KG (for short: MPP KG). MPP KG has an interest of 0.07% in the voting capital of Red & Black TopCo S.à r.l. and thus holds so-called Class D shares. The company agreement was signed for an indefinite period of time, but at least until the end of 2024. The legal status of MPP KG managers is regulated in the company agreement. The maximum investment in MPP KG is determined indi-vidually. The managers are registered in the commercial register as limited partners of MPP KG.
At the end of 2010, the MPP for managers already participating (old managers) was modified and managers who were not yet participating “new managers” were again offered a participation in MPP KG.
The new managers acquired shares in the MPP KG limited partnership in December 2010 at the current market value. The old managers continue to hold the shares in MPP KG that they acquired already in 2008. Shares in MPP KG held by the old managers are neither exchanged nor sold.
Following the restructuring of the MPP in the event of an IPO or sale of the HUGO BOSS Group (exit), the management of HUGO BOSS is to participate only in the exit profits attributable to HUGO BOSS (HB AG profits) via MPP KG. All profits and costs attributable to the Valentino Fashion Group S.p.A. are neutralized when calcu-lating the HB AG profits. The participation right in these HB AG profits arises pro-rata over a multi-year vesting period ending on December 31, 2014.
As part of the modification of the MPP, the subordination to individual financing instruments and the ratchet of these Class D shares no longer apply. The restructuring with regard to the Articles of Association created so-called liquidation preferences. These give priority for certain capital before distribution of the HB AG profits to the limited partners and create financial compensation for the investors for the decline in value of the Class D shares as compared to the current market value which has since occurred.
If MPP shares attributable to a manager are sold as part of an exit, the manager is entitled to a proportionate amount of the HB AG profits generated after deduction of liabilities and liquidation preferences. The manager’s entitlement to the payout of his portion of the remaining sales proceeds is linked to the manager in question not having left the HUGO BOSS Group at the time of the exit. Limits on the entitlement to payouts of the pro-rata portion of sales proceeds only exist for managers who leave the Company before an exit. If a manager leaves the Company before the exit, Red & Black TopCo S.à.r.l. has the right to acquire the shares held by the manager in question. The manager leaving is qualified as a so-called “good leaver” or “bad leaver” during the determination of the acquisition price.

Other Disclosures h u G o b o s s Annual Report 2011
229
As shareholders of the Red & Black TopCo S.à.r.l., the members of the Managing Board and second-tier execu-tives are entitled to receive future sales proceeds from exit events as well as profit distributions. Under the circumstances described before, no personnel expenses will affect HUGO BOSS’ profit or loss.
As in the previous year, the MPP did not influence the profit or loss for the period of the HUGO BOSS Group in fiscal year 2011, as no transactions that would have needed to be measured at fair value have been carried out since MPP was established. No financial assets or liabilities were recognized as a result of the MPP on December 31, 2010 or on the reporting date.
37 // eveNts AFter the bAlANce sheet dAte On January 24, 2012, the HUGO BOSS Group announced its intention to construct a new distribution center in Filderstadt, a flagship outlet in Metzingen and a new office building at the location in Metzingen in the coming years. It is thereby supporting the growth planned for the coming years. The total expenditure is expected to amount to around EUR 150 million.
Between the end of the fiscal year 2011 and the approval for publication of this report on February 17, 2012, there were no further significant macroeconomic, socio-political, sector-related or company-specific changes that the management expects will have a material influence on the results of operations, net assets and financial position of the Company.
38 // corporAte GoverNANce code The Managing and Supervisory Board of HUGO BOSS AG submitted the declaration of compliance prescribed by Section 161 of the German Stock Corporation Act (AktG) in December 2011. The declaration is permanently available to shareholders on the Company’s website.
39 // Auditor’s Fee The auditor’s fee for fiscal year 2011 amounted to EUR 471 thousand (2010: EUR 723 thousand), of which EUR 348 thousand (2010: EUR 588 thousand) related to audit services, EUR 106 thousand (2010: EUR 0 thousand) to other services, EUR 17 thousand (2010: EUR 56 thousand) to other advisory services, and EUR 0 thousand (2010: EUR 79 thousand) to tax advisory services. In the previous year, this information on the auditor’s fee referred to the auditors of the consolidated financial statements and the KPMG companies in Germany and abroad associated with them via KPMG Europe LLP. For fiscal year 2011, information is provided only on the fees to KPMG AG Wirtschaftsprüfungsgesellschaft, Stuttgart, as the auditor of the consolidated financial statements.
AdditioNAl

230
h u G o b o s s Annual Report 2011 coNsolidAted FiNANciAl stAteMeNts
Other Disclosures
40 // list oF shAreholdiNGs
earnings equity
in EUR thousand company
head office
2011
2010
2011
2010
HUGO BOSS Holding Netherlands B.V. Amsterdam, Netherlands 1,177 475 653,362 652,185
HUGO BOSS Internationale Beteiligungs-GmbH 2 Metzingen, Germany 0 0 524,800 524,800
HUGO BOSS International B.V. Amsterdam, Netherlands 162,635 102,845 447,725 279,604
HUGO BOSS AG Metzingen, Germany 87,710 54,904 434,162 486,209
HUGO BOSS Ticino S.A. Coldrerio, Switzerland 63,154 42,826 86,817 74,034
HUGO BOSS USA, Inc. 4 New York, DE, U.S.A. 24,866 14,483 77,940 56,970
HUGO BOSS Hong Kong Ltd. Hong Kong 15,106 16,134 45,282 38,018
Lotus (Shenzhen) Commerce Ltd. 3 Shenzhen, China 12,288 5,426 43,575 27,570
HUGO BOSS Benelux B.V. Amsterdam, Netherlands 19,846 15,239 42,548 37,702
HUGO BOSS Lotus Hong Kong Ltd. 3 Hong Kong 1,897 (142) 35,197 37,801
HUGO BOSS Textile Industry Ltd. Izmir, Turkey 14,481 1,200 28,678 14,197
HUGO BOSS International Markets AG Zug, Switzerland 21,068 14,757 28,480 18,443
HUGO BOSS Trade Mark Management GmbH & Co. KG 2
Metzingen, Germany
81,007
74,002
26,719
25,230
HUGO BOSS Canada, Inc. Toronto, Canada 2,867 2,263 19,590 16,471
HUGO BOSS UK Limited London, Great Britain 13,127 10,791 17,929 14,622
HUGO BOSS France SAS Paris, France 13,741 (8,929) 17,246 3,505
HUGO BOSS Italia S.p.A. Milan, Italy 1,312 535 13,545 22,233
HUGO BOSS Holdings Pty. Ltd. Preston, Australia 0 0 12,363 12,363
HUGO BOSS China Retail Co. Ltd. Shanghai, China 2,902 4,119 11,924 8,068
HUGO BOSS Australia Pty. Ltd. Preston, Australia (50) 1,279 11,023 11,870
Lotus Concept Trading (Macau) Co. Ltd. 3 Macau 6,835 3,111 8,909 6,530
HUGO BOSS Benelux B.V. CIA S.C Madrid, Spain 11,999 2,720 6,542 (5,457)
HUGO BOSS Mexico S.A. de C.V. Mexico City, Mexico 2,970 2,822 5,938 5,190
HUGO BOSS Shoes & Accessories Italia S.p.A. Morrovalle, Italy 634 237 5,835 5,202
HUGO BOSS Switzerland Retail AG Zurich, Switzerland 2,902 561 5,373 2,359
HUGO BOSS Nordic ApS Copenhagen, Denmark 3,730 3,224 5,295 4,236
HUGO BOSS Belgium Retail BVBA Diegem, Belgium 680 664 3,307 2,627
HUGO BOSS (Schweiz) AG Zug, Switzerland 3,133 3,840 3,146 4,324
HUGO BOSS do Brasil Ltda. São Paulo, Brazil (1,035) 348 2,812 4,149
HUGO BOSS Belgium BVBA Diegem, Belgium 889 750 2,532 2,343
HUGO BOSS Benelux Retail B.V. Amsterdam, Netherlands 420 220 2,313 1,893
HUGO BOSS Guangdong Trading Co. Ltd. Guangzhou, China 131 96 2,239 1,937
HUGO BOSS Dienstleistungs GmbH Metzingen, Germany (122) (164) 1,377 1,458
MSC Poland Sp.z.o.o. Radom, Poland 55 (54) 1,146 1,216

Other Disclosures h u G o b o s s Annual Report 2011
231
earnings equity
in EUR thousand company
head office
2011
2010
2011
2010
HUGO BOSS Scandinavia AB Stockholm, Sweden (49) (1,921) 1,070 1,117
HUGO BOSS Ireland Limited Dublin, Ireland 1,038 (215) 923 (115)
HUGO BOSS Mexico Management Services S.A. de C.V.
Mexico City, Mexico
127
144
627
551
HUGO BOSS Holding Sourcing S.A. Coldrerio, Switzerland (661) (9) 586 1,250
HUGO BOSS Trade Mark Management Verwaltungs-GmbH 2
Metzingen, Germany
1
1
33
32
HUGO BOSS Merchandise Management GmbH 2 Metzingen, Germany 0 0 24 24
HUGO BOSS Vermögensverwaltungs GmbH & Co. KG 2
Metzingen, Germany
(27)
(2)
(25)
2
HUGO BOSS Beteiligungsgesellschaft mbH 2 Metzingen, Germany 0 0 (116) (116)
ROSATA Grundstücks-Vermietungsgesellschaft mbH & Co. Objekt Dieselstrasse KG 1 2
Grünwald, Germany
61
47
(130)
(191)
HUGO BOSS Hellas LLC Athens, Greece (490) 0 (220) 0
HUGO BOSS Magazacilik Ltd. Sti. Izmir, Turkey (1,851) (563) (932) 979
GRAMOLERA Grundstücks-Vermietungs-gesellschaft Objekt Ticino mbH 2
Metzingen, Germany
(362)
(1,117)
(2,223)
(1,861)
ROSATA Grundstücks-Vermietungsgesellschaft mbH & Co. Objekt Metzingen KG 1 2
Grünwald, Germany
155
84
(2,585)
(2,739)
HUGO BOSS Portugal & Companhia Lisbon, Portugal (2,004) (2,419) (4,956) (2,952)
BIL Leasing Verwaltungs-GmbH & Co. 869 KG 1 2 Pöcking, Germany (780) (537) (6,796) (6,015)
HUGO BOSS Japan K.K. Tokyo, Japan (4,100) (3,843) (38,275) (31,108)
1 Investments with an equity share of 94%
2 Subsidiaries that make use of the exemption pursuant to Section 264 Paragraph 3 and Section 264b, respectively of the German Commercial Code (HGB)
from publishing the financial statements.
3 Investments with an direkt and indirect equity share of 60%.
4 Subgroup financial statements.
AdditioNAl

232
h u G o b o s s Annual Report 2011 coNsolidAted FiNANciAl stAteMeNts
Information Concerning the Majority Shareholder
iNForMAtioN coNcerNiNG the MAJoritY shAreholder
· On October 17, 2005, HUGO BOSS AG received the following notification from V.F.G. International N.V., Amsterdam, Netherlands, pursuant to Section 21 of the German Securities Trading Act (WpHG) of March 12, 2003:“Referring to our notification of March 12, 2003, we hereby inform you that on September 28, 2005 the Company changed its name from Marzotto International N.V. to V.F.G. International N.V.We continue to hold 78.76% of the voting share capital.”
Metzingen, October 2005The Managing Board
· On August 8, 2007, HUGO BOSS AG received from the following companies and individuals the following correction of the notifications on voting rights dated August 3, 2007 pursuant to Section 21 Paragraph 1 and Section 22 of the German Securities Trading Act (WpHG).
7. red & black holdco s.à r.l.Red & Black HoldCo S.à r.l. notified us of the following:The share of voting rights in HUGO BOSS AG, Dieselstrasse 12, 72555 Metzingen, Germany, held by Red & Black HoldCo S.à r.l., Luxembourg (address: 282, route de Longwy, L -1940 Luxembourg), exceeded the thresh-olds of 3%, 5%, 10%, 15%, 20%, 25%, 30%, 50%, and 75% on August 2, 2007. The share of voting rights now amounts to 80.23% (28,770,683 voting rights), of which a share of 78.76% (28,242,128 voting rights) is attributable to Red & Black HoldCo S.à r.l. as a result of the shares held by V.F.G. International N.V., Amsterdam, Netherlands, pursuant to Section 22 Paragraph 1 sentence 1 No. 1 in conjunction with sentence 3 of the Securi-ties Trading Act. V.F.G. International N.V. is controlled by Red & Black HoldCo S.à r.l. indirectly via Red & Black Topco S.à r.l., Red & Black Lux S.à r.l., Red & Black S.r.l., and Valentino Fashion Group S. p. A., Milan, Italy. A further share of voting rights amounting to 1.47% (528,555 voting rights) is attributable to Red & Black HoldCo S.à r.l. as a result of the own shares held by HUGO BOSS AG indirectly via Red & Black Topco S.à r.l., Red & Black Lux S.à r.l., Red & Black S.r.l., Valentino Fashion Group S. p. A., and V.F.G. International N.V. pursuant to Section 22 Paragraph 1 sentence 1 No. 1 in conjunction with sentence 3 of the Securities Trading Act.
8. red & black holdco 2 s.à r.l.Red & Black HoldCo 2 S.à r.l. notified us of the following:The share of voting rights in HUGO BOSS AG, Dieselstrasse 12, 72555 Metzingen, Germany, held by Red & Black HoldCo 2 S.à r.l., Luxembourg (address: 282, route de Longwy, L -1940 Luxembourg), exceeded the thresholds of 3%, 5%, 10%, 15%, 20%, 25%, 30%, 50%, and 75% on August 2, 2007. The share of voting rights now amounts to 80.23% (28,770,683 voting rights), of which a share of 78.76% (28,242,128 voting rights) is attributable to Red & Black HoldCo 2 S.à r.l. as a result of the shares held by V.F.G. International N.V., Amsterdam, Netherlands, pursuant to Section 22 Paragraph 1 sentence 1 No. 1 in conjunction with sentence 3 of the Securities Trading Act. V.F.G. International N.V. is controlled by Red & Black HoldCo 2 S.à r.l. indirectly via Red & Black Topco 2 S.à r.l., Red & Black Lux 2 S.à r.l., Red & Black 2 S.r.l., and Valentino Fashion Group S. p. A., Milan, Italy. A further share of voting rights amounting to 1.47% (528,555 voting rights) is attributable to Red & Black HoldCo 2 S.à r.l. as a result of the own shares held by HUGO BOSS AG indirectly via Red & Black Topco 2 S.à r.l., Red & Black Lux 2 S.à r.l., Red & Black 2 S.r.l., Valentino Fashion Group S. p. A., and V.F.G. International N.V. pursuant to Section 22 Paragraph 1 sentence 1 No. 1 in conjunction with sentence 3 of the Securities Trading Act.

Information Concerning the Majority Shareholder h u G o b o s s Annual Report 2011
233
9. p4 sub l.p.1P4 Sub L.P.1 notified us of the following:The share of voting rights in HUGO BOSS AG, Dieselstrasse 12, 72555 Metzingen, Germany, held by P4 Sub L.P.1, Guernsey (address: Trafalgar Court, Les Banques, St Peter Port, Guernsey, Channel Islands), exceeded the thresholds of 3%, 5%, 10%, 15%, 20%, 25%, 30%, 50%, and 75% on August 2, 2007. The share of voting rights now amounts to 80.23% (28,770,683 voting rights), of which a share of 78.76% (28,242,128 voting rights) is attributable to P4 Sub L.P.1 as a result of the shares held by V.F.G. International N.V., Amsterdam, Netherlands, pursuant to Section 22 Paragraph 1 sentence 1 No. 1 in conjunction with sentence 3 of the Securities Trading Act. V.F.G. International N.V. is controlled by P4 Sub L.P.1 indirectly via Red & Black HoldCo 2 S.à r.l., Red & Black Topco 2 S.à r.l., Red & Black Lux 2 S.à r.l., Red & Black 2 S.r.l., and Valentino Fashion Group S. p. A., Milan, Italy. A further share of voting rights amounting to 1.47% (528,555 voting rights) is attributable to P4 Sub L.P.1 as a result of the own shares held by HUGO BOSS AG indirectly via Red & Black HoldCo 2 S.à r.l., Red & Black Topco 2 S.à r.l., Red & Black Lux 2 S.à r.l., Red & Black 2 S.r.l., Valentino Fashion Group S. p. A., and V.F.G. International N.V., pursuant to Section 22 Paragraph 1 sentence 1 No. 1 in conjunction with sentence 3 of the Securities Trading Act.
10. permira iv l.p.1Permira IV L.P.1 notified us of the following:The share of voting rights in HUGO BOSS AG, Dieselstrasse 12, 72555 Metzingen, Germany, held by PermiraIV L.P.1, Guernsey (address: Trafalgar Court, Les Banques, St Peter Port, Guernsey, Channel Islands), exceeded the thresholds of 3%, 5%, 10%, 15%, 20%, 25%, 30%, 50%, and 75% on August 2, 2007. The share of voting rights now amounts to 80.23% (28,770,683 voting rights), of which a share of 78.76% (28,242,128 voting rights) is attributable to Permira IV L.P.1 as a result of the shares held by V.F.G. International N.V., Amsterdam, Netherlands, pursuant to Section 22 Paragraph 1 sentence 1 No. 1 in conjunction with sentence 3 of the Securi-ties Trading Act. V.F.G. International N.V. is controlled by Permira IV L.P.1 indirectly via P4 Sub L.P.1, Red & Black HoldCo 2 S.à r.l., Red & Black Topco 2 S.à r.l., Red & Black Lux 2 S.à r.l., Red & Black 2 S.r.l., and Valentino Fashion Group S. p. A., Milan, Italy. A further share of voting rights amounting to 1.47% (528,555 voting rights) is attributable to Permira IV L.P.1 as a result of the own shares held by HUGO BOSS AG indirectly via P4 Sub L.P.1, Red & Black HoldCo 2 S.à r.l., Red & Black Topco 2 S.à r.l., Red & Black Lux 2 S.à r.l., Red & Black 2 S.r.l., Valentino Fashion Group S. p. A., and V.F.G. International N.V. pursuant to Section 22 Paragraph 1 sentence 1 No. 1 in conjunction with sentence 3 of the Securities Trading Act.
11. permira iv Managers l.p.Permira IV Managers L.P. notified us of the following:The share of voting rights in HUGO BOSS AG, Dieselstrasse 12, 72555 Metzingen, Germany, held by PermiraIV Managers L.P., Guernsey (address: Trafalgar Court, Les Banques, St Peter Port, Guernsey, Channel Islands),exceeded the thresholds of 3%, 5%, 10%, 15%, 20%, 25%, 30%, 50%, and 75% on August 2, 2007. The share of voting rights now amounts to 80.23% (28,770,683 voting rights), of which a share of 78.76% (28,242,128 voting rights) is attributable to Permira IV Managers L.P. as a result of the shares held by V.F.G. International N.V., Amsterdam, Netherlands, pursuant to Section 22 Paragraph 1 sentence 1 No. 1 in conjunction with sentence 3 of the Securities Trading Act. V.F.G. International N.V. is controlled by Permira IV Managers L.P. indirectly via Permira IV L.P.1, P4 Sub L.P.1, Red & Black HoldCo 2 S.à r.l., Red & Black Topco 2 S.à r.l., Red & Black Lux 2 S.à r.l., Red & Black 2 S.r.l., Permira IV L.P.2, Red & Black HoldCo S.à r.l., Red & Black Topco S.à r.l., Red & Black Lux S.à r.l, Red & Black S.r.l., and Valentino Fashion Group S. p. A., Milan, Italy. A further share of voting rights amounting to 1.47% (528,555 voting rights) is attributable to Permira Managers IV L.P. as a result of the own shares held by HUGO BOSS AG indirectly via Permira IV L.P.1, P4 Sub L.P.1, Red & Black HoldCo 2 S.à r.l., Red & Black Topco 2 S.à r.l., Red & Black Lux 2 S.à r.l., Red & Black 2 S.r.l., Permira IV L.P.2, Red & Black HoldCo S.à r.l., Red & Black Topco S.à r.l., Red & Black Lux S.à r.l., Red & Black S.r.l., Valentino Fashion Group S. p. A., and V.F.G. International N.V. pursuant to Section 22 Paragraph 1 sentence 1 No. 1 in conjunction with sentence 3 of the Securities Trading Act.
AdditioNAl

234
h u G o b o s s Annual Report 2011 coNsolidAted FiNANciAl stAteMeNts
Information Concerning the Majority Shareholder
12. permira iv Managers limitedPermira IV Managers Limited notified us of the following:The share of voting rights in HUGO BOSS AG, Dieselstrasse 12, 72555 Metzingen, Germany, held by PermiraIV Managers Limited, Guernsey (address: Trafalgar Court, Les Banques, St Peter Port, Guernsey, Channel Islands), exceeded the thresholds of 3%, 5%, 10%, 15%, 20%, 25%, 30%, 50%, and 75% on August 2, 2007. The share of voting rights now amounts to 80.23% (28,770,683 voting rights), of which a share of 78.76% (28,242,128 voting rights) is attributable to Permira IV Managers Limited as a result of the shares held by V.F.G. International N.V., Amsterdam, Netherlands, pursuant to Section 22 Paragraph 1 sentence 1 No. 1 in conjunc-tion with sentence 3 of the Securities Trading Act. V.F.G. International N.V. is controlled by Permira IV Managers Limited indirectly via Permira IV Managers L.P., Permira IV L.P.1, P4 Sub L.P.1, Red & Black HoldCo 2 S.à r.l., Red & Black Topco 2 S.à r.l., Red & Black Lux 2 S.à r.l., Red & Black 2 S.r.l., Permira IV L.P.2, Red & Black HoldCo S.à r.l., Red & Black Topco S.à r.l., Red & Black Lux S.à r.l., Red & Black S.r.l., and Valentino Fashion Group S. p. A., Milan, Italy. A further share of voting rights amounting to 1.47% (528,555 voting rights) is attributable to Permira Managers IV Limited as a result of the own shares held by HUGO BOSS AG indirectly via Permira Managers IV L.P., Permira IV L.P.1, P4 Sub L.P.1, Red & Black HoldCo 2 S.à r.l., Red & Black Topco 2 S.à r.l., Red & Black Lux 2 S.à r.l., Red & Black 2 S.r.l., Permira IV L.P.2, Red & Black HoldCo S.à r.l., Red & Black Topco S.à r.l., Red & Black Lux S.à r.l., Red & Black S.r.l., Valentino Fashion Group S. p. A., and V.F.G. International N.V. pursuant to Section 22 Paragraph 1 sentence 1 No. 1 in conjunction with sentence 3 of the Securities Trading Act.
13. permira iv l.p.2Permira IV L.P.2 notified us of the following:The share of voting rights in HUGO BOSS AG, Dieselstrasse 12, 72555 Metzingen, Germany, held by PermiraIV L.P.2, Guernsey (address: Trafalgar Court, Les Banques, St Peter Port, Guernsey, Channel Islands), exceeded the thresholds of 3%, 5%, 10%, 15%, 20%, 25%, 30%, 50%, and 75% on August 2, 2007. The share of voting rights now amounts to 80.23% (28,770,683 voting rights), of which a share of 78.76% (28,242,128 voting rights) is attributable to Permira IV L.P.2 as a result of the shares held by V.F.G. International N.V., Amsterdam, Netherlands, pursuant to Section 22 Paragraph 1 sentence 1 No. 1 in conjunction with sentence 3 of the Securi-ties Trading Act. V.F.G. International N.V. is controlled by Permira IV L.P. 2 indirectly via Red & Black HoldCo S.à r.l., Red & Black Topco S.à r.l., Red & Black Lux S.à r.l., Red & Black S.r.l., and Valentino Fashion Group S. p. A., Milan, Italy. A further share of voting rights amounting to 1.47% (528,555 voting rights) is attributable to Permira IV L.P.2 as a result of the own shares held by HUGO BOSS AG indirectly via Red & Black HoldCo S.à r.l., Red & Black Topco S.à r.l., Red & Black Lux S.à r.l., Red & Black S.r.l., Valentino Fashion Group S. p. A., and V.F.G. International N.V. pursuant to Section 22 Paragraph 1 sentence 1 No. 1 in conjunction with sentence 3 of the Securities Trading Act.

Information Concerning the Majority Shareholder h u G o b o s s Annual Report 2011
235
14. p4 co-investments l.p.P4 Co-Investments L.P. notified us of the following:The share of voting rights in HUGO BOSS AG, Dieselstrasse 12, 72555 Metzingen, Germany, held by P4 Co-Investments L.P., Guernsey (address: Trafalgar Court, Les Banques, St Peter Port, Guernsey, Channel Islands), exceeded the thresholds of 3%, 5%, 10%, 15%, 20%, 25%, 30%, 50%, and 75% on August 2, 2007. The share of voting rights now amounts to 80.23% (28,770,683 voting rights), of which a share of 78.76% (28,242,128 voting rights) is attributable to P4 Co-Investments L.P. as a result of the shares held by V.F.G. Inter-national N.V., Amsterdam, Netherlands, pursuant to Section 22 Paragraph 1 sentence 1 No. 1 in conjunction with sentence 3 of the Securities Trading Act. V.F.G. International N.V. is controlled by P4 Co- Investments L.P. indirectly via Red & Black HoldCo S.à r.l., Red & Black Topco S.à r.l., Red & Black Lux S.à r.l., Red & Black S.r.l., and Valentino Fashion Group S. p. A., Milan, Italy. A further share of voting rights amounting to 1.47% (528,555 voting rights) is attributable to P4 Co-Investments L.P. as a result of the own shares held by HUGO BOSS AG indirectly via Red & Black HoldCo S.à r.l., Red & Black Topco S.à r.l., Red & Black Lux S.à r.l., Red & Black S.r.l., Valentino Fashion Group S. p. A., and V.F.G. International N.V. pursuant to Section 22 Paragraph 1 sentence 1 No. 1 in conjunction with sentence 3 of the Securities Trading Act.
15. permira investments limitedPermira Investments Limited notified us of the following:The share of voting rights in HUGO BOSS AG, Dieselstrasse 12, 72555 Metzingen, Germany, held by PermiraInvestments Limited, Guernsey (address: Trafalgar Court, Les Banques, St Peter Port, Guernsey, Channel Islands), exceeded the thresholds of 3%, 5%, 10%, 15%, 20%, 25%, 30%, 50%, and 75% on August 2, 2007. The share of voting rights now amounts to 80.23% (28,770,683 voting rights), of which a share of 78.76% (28,242,128 voting rights) is attributable to Permira Investments Limited as a result of the shares held by V.F.G. International N.V., Amsterdam, Netherlands, Pursuant to Section 22 Paragraph 1 sentence 1 No. 1 in conjunc-tion with sentence 3 of the Securities Trading Act. V.F.G. International N.V. is controlled by Permira Investments Limited indirectly via Red & Black HoldCo S.à r.l., Red & Black Topco S.à r.l., Red & Black Lux S.à r.l., Red & Black S.r.l., and Valentino Fashion Group S. p. A., Milan, Italy. A further share of voting rights amounting to 1.47% (528,555 voting rights) is attributable to Permira Investments Limited as a result of the own shares held by HUGO BOSS AG indirectly via Red & Black HoldCo S.à r.l., Red & Black Topco S.à r.l., Red & Black Lux S.à r.l., Red & Black S.r.l., Valentino Fashion Group S. p. A., and V.F.G. International N.V. pursuant to Section 22 Paragraph 1 sentence 1 No. 1 in conjunction with sentence 3 of the Securities Trading Act.
AdditioNAl

236
h u G o b o s s Annual Report 2011 coNsolidAted FiNANciAl stAteMeNts
Information Concerning the Majority Shareholder
16. permira iv Gp l.p.Permira IV GP L.P. notified us of the following:The share of voting rights in HUGO BOSS AG, Dieselstrasse 12, 72555 Metzingen, Germany, held by PermiraIV GP L.P., Guernsey (address: Trafalgar Court, Les Banques, St Peter Port, Guernsey, Channel Islands), exceeded the thresholds of 3%, 5%, 10%, 15%, 20%, 25%, 30%, 50%, and 75% on August 2, 2007. The share of voting rights now amounts to 80.23% (28,770,683 voting rights), of which a share of 78.76% (28,242,128 voting rights) is attributable to Permira IV GP L.P. as a result of the shares held by V.F.G. International N.V., Amsterdam, Netherlands, pursuant to Section 22 Paragraph 1 sentence 1 No. 1 in conjunction with sentence 3 of the Securi-ties Trading Act. V.F.G. International N.V. is controlled by Permira IV GP L.P. indirectly via Permira IV L.P.1, P4 Sub L.P.1, Red & Black HoldCo 2 S.à r.l., Red & Black Topco 2 S.à r.l., Red & Black Lux 2 S.à r.l., Red & Black 2 S.r.l., Permira IV L.P.2, P4 Co-Investments L.P., Red & Black HoldCo S.à r.l., Red & Black Topco S.à r.l., Red & Black Lux S.à r.l., Red & Black S.r.l., and Valentino Fashion Group S. p. A., Milan, Italy. A further share of voting rights amounting to 1.47% (528,555 voting rights) is attributable to Permira IV GP L.P. as a result of the own shares held by HUGO BOSS AG indirectly via Permira IV L.P. 1, P4 Sub L.P.1, Red & Black HoldCo 2 S.à r.l., Red & Black Topco 2 S.à r.l., Red & Black Lux 2 S.à r.l., Red & Black 2 S.r.l., Permira IV L.P.2, P4 Co-Investments L.P., Red & Black HoldCo S.à r.l., Red & Black Topco S.à r.l., Red & Black Lux S.à r.l., Red & Black S.r.l., Valentino Fashion Group S. p. A., and V.F.G. International N.V. pursuant to Section 22 Paragraph 1 sentence 1 No. 1 in conjunction with sentence 3 of the Securities Trading Act.
17. permira iv Gp limitedPermira IV GP Limited notified us of the following:The share of voting rights in HUGO BOSS AG, Dieselstrasse 12, 72555 Metzingen, Germany, held by PermiraIV GP Limited, Guernsey (address: Trafalgar Court, Les Banques, St Peter Port, Guernsey, Channel Islands), exceeded the thresholds of 3%, 5%, 10%, 15%, 20%, 25%, 30%, 50%, and 75% on August 2, 2007. The share of voting rights now amounts to 80.23% (28,770,683 voting rights), of which a share of 78.76% (28,242,128 voting rights) is attributable to Permira IV GP Limited as a result of the shares held by V.F.G. International N.V., Amsterdam, Netherlands, pursuant to Section 22 Paragraph 1 sentence 1 No. 1 in conjunction with sentence 3 of the Securities Trading Act. V.F.G. International N.V. is controlled by Permira IV GP Limited indirectly via Permira IV GP L.P., Permira IV L.P.1, P4 Sub L.P.1, Red & Black HoldCo 2 S.à r.l., Red & Black Topco 2 S.à r.l., Red & Black Lux 2 S.à r.l., Red & Black 2 S.r.l., Permira IV L.P.2, P4 Co-Investments L.P., Red & Black HoldCo S.à r.l., Red & Black Topco S.à r.l., Red & Black Lux S.à r.l., Red & Black S.r.l., and Valentino Fashion Group S. p. A., Milan, Italy. A further share of voting rights amounting to 1.47% (528,555 voting rights) is attributable to Permira IV GP Limited as a result of the own shares held by HUGO BOSS AG indirectly via Permira IV GP L.P., Permira IV L.P.1, P4 Sub L.P.1, Red & Black HoldCo 2 S.à r.l., Red & Black Topco 2 S.à r.l., Red & Black Lux 2 S.à r.l., Red & Black 2 S.r.l., Permira IV L.P.2, P4 Co-Investments L.P., Red & Black HoldCo S.à r.l., Red & Black Topco S.à r.l., Red & Black Lux S.à r.l., Red & Black S.r.l., Valentino Fashion Group S. p. A., and V.F.G. International N.V. pursuant to Section 22 Paragraph 1 sentence 1 No. 1 in conjunction with sentence 3 of the Securities Trading Act.

Information Concerning the Majority Shareholder h u G o b o s s Annual Report 2011
237
18. permira Nominees limitedPermira Nominees Limited notified us of the following:The share of voting rights in HUGO BOSS AG, Dieselstrasse 12, 72555 Metzingen, Germany, held by PermiraNominees Limited, Guernsey (address: Trafalgar Court, Les Banques, St Peter Port, Guernsey, Channel Islands), exceeded the thresholds of 3%, 5%, 10%, 15%, 20%, 25%, 30%, 50%, and 75% on August 2, 2007. The share of voting rights now amounts to 80.23% (28,770,683 voting rights), of which a share of 78.76% (28,242,128 voting rights) is attributable to Permira Nominees Limited as a result of the shares held by V.F.G. International N.V., Amsterdam, Netherlands, pursuant to Section 22 Paragraph 1 sentence 1 No. 1 in conjunction with sentence 3 of the Securities Trading Act. V.F.G. International N.V. is controlled by Permira Nominees Limited indirectly via Permira Investments Limited, Red & Black HoldCo S.à r.l., Red & Black Topco S.à r.l., Red & Black Lux S.à r.l., Red & Black S.r.l., and Valentino Fashion Group S. p. A., Milan, Italy. A further share of voting rights amounting to 1.47% (528,555 voting rights) is attributable to Permira Nominees Limited as a result of the own shares held by HUGO BOSS AG indirectly via Permira Investments Limited, Red & Black HoldCo S.à r.l., Red & Black Topco S.à r.l., Red & Black Lux S.à r.l., Red & Black S.r.l., Valentino Fashion Group S. p. A., and V.F.G. International N.V. pursuant to Section 22 Paragraph 1 sentence 1 No. 1 in conjunction with sentence 3 of the Securities Trading Act.
· On March 14, 2008, HUGO BOSS was notified of the following voting rights announcement pursuant to section 21 paragraph 1 and section 22 WpHG (German Securities Trading Act) of the entities mentioned inthe following:“On March 11, 2008 Red & Black 2 S.r.l., Milan (Address: via San Paolo 10, 20121 Milan, Italy) was mergedinto Red & Black S.r.l., Milan (Address: via San Paolo 10, 20121 Milan, Italy). Thereby Red & Black 2 S.r.l. has lapsed. Legal successor is Red & Black S.r.l. Against the background of the above mentioned merger we inform you in the name and by order of Red & Black S.r.l., Milan (Address: via San Paolo 10, 20121 Milan, Italy) pursuant to 21 paragraph 1, 22 WpHG (German Securities Trading Act) about the following:
As legal successor of red & black s.r.l. 2, Milan (address: via san paolo 10, 20121 Milan, italy): The proportion of voting rights of Red & Black S.r.l. 2, Milan (address: via San Paolo 10, 20121 Milan, Italy), held in HUGO BOSS AG, Dieselstraße 12, 72555 Metzingen, Germany, fell below the limits of 75%, 50%, 30%, 25%, 20%, 15%, 10%, 5% and 3% on March 11, 2008 and has stood at 0.00% since this day (no votingrights). For the company itself: The proportion of voting rights of Red & Black S.r.l., Milan (address: via San Paolo 10, 20121 Milan, Italy), held in HUGO BOSS AG, Dieselstraße 12, 72555 Metzingen, Germany, continues to amount to more than 75% of the voting rights as of March 11, 2008, namely 89.49% of voting rights (32,092,026 voting rights). A proportion of voting rights of 88.02% (31,563,471 voting rights) shall be attri-butable to Red & Black S.r.l. from the shares held by V.F.G. International N.V., Amsterdam, Netherlands, pursuant to section 22 paragraph 1 sentence 1 no. 1 in conjunction with sentence 3 WpHG (German Securi-ties Trading Act). V.F.G. International N.V. is a company controlled indirectly by Red & Black S.r.l. via ValentinoFashion Group S.p.A., Milan, Italy. A further proportion of voting rights of 1.47% (528,555 voting rights) shall be attributable to Red & Black S.r.l. from the own shares held by HUGO BOSS AG pursuant to section 22paragraph 1 sentence 1 no. 1 in conjunction with sentence 3 WpHG (German Securities Trading Act).”
Metzingen, March 14, 2008The Managing Board
AdditioNAl

238
h u G o b o s s Annual Report 2011 coNsolidAted FiNANciAl stAteMeNts
Information Concerning the Majority Shareholder
· On March 25, 2008, HUGO BOSS was notified of the following voting rights announcements pursuant to section 21 paragraph 1 and section 22 WpHG (German Securities Trading Act) of Red & Black S.p.A.:Red & Black S.r.l, Milan, Italy has been converted in Red & Black S.p.A. Milan, Italy. Also after the effective-ness of the conversion of form on March 19, 2008 the company Red&Black S.p.A. held in HUGO BOSS AG, Metzingen, Germany voting rights of more than 75%. With effect of the conversion of form on March 19, 2008 the proportion of the voting rights of Red & Black S.p.A. Milan, Italy, held in HUGO BOSS AG, Metzingen, Germany is 89.49% (32,092,026 voting rights). Thereof the proportion of voting rights of 88.02% (31,563,471 voting rights) shall be attributable to Red & Black S.p.A. from shares held by V.F.G. International N.V., Amsterdam, Netherlands, pursuant to section 22 paragraph 1 sentence 1 no. 1 in conjunction with sentence 3 WpHG (German Securities Trading Act). V.F.G. International N.V. is a company controlled indi-rectly by Red & Black S.p.A. via Valentino Fashion Group S.p.A., Milan, Italy. A further proportion of voting rights of 1.47% (528,555 voting rights) shall be attributable to Red & Black S.r.l. from the own shares held by HUGO BOSS AG pursuant to section 22 paragraph 1 sentence 1 no. 1 in conjunction with sentence 3 WpHG (German Securities Trading Act).
Metzingen, March 26, 2008The Managing Board
· On April 23, 2008, HUGO BOSS was notified of the following voting rights announcements pursuant to section 21 paragraph 1 and section 22 WpHG (German Securities Trading Act) of Red & Black TopCo S.à r.l., Luxembourg as of Red & Black Lux S.à r.l., Luxembourg.On April 21, 2008 Red & Black TopCo 2 S.à r.l., Luxembourg was merged into Red & Black TopCo S.à r.l., Luxembourg. Also on April 21, 2008, in a second step, Red & Black Lux 2 S.à r.l., Luxembourg was merged into Red & Black Lux S.à r.l., Luxembourg. Thereby Red & Black TopCo 2 S.à r.l. and Red & Black Lux 2 S.à r.l. have lapsed. Legal successor of Red & Black TopCo 2 S.à r.l. is Red & Black TopCo S.à r.l.; Legal successor of Red & Black Lux 2 S.à r.l. is Red & Black Lux S.à r.l. Against the background of the above mentioned merger Red & Black TopCo S.à r.l. as well as Red & Black Lux S.à r.l. inform pursuant to section 21 paragraph 1, 22WpHG (German Securities Trading Act) about the following:
1. red & black topco s.à r.l., as legal successor of red & black topco 2 s.à r.l., luxembourg: The proportion of voting rights of Red & Black TopCo 2 S.à r.l., Luxembourg held in HUGO BOSS AG, Diesel-straße 12, 72555 Metzingen, Germany, fell below the limits of 75%, 50%, 30%, 25%, 20%, 15%, 10%, 5% and 3% on April 21, 2008 and has stood at 0.00% since this day (no voting rights).
For the company itself: The proportion of voting rights of Red & Black TopCo S.à r.l., Luxembourg held in HUGO BOSS AG, Metzingen, Germany, continues to amount to more than 75% of the voting rights as of April 21, 2008, namely 89.49% of voting rights (32,092,026 voting rights). A proportion of voting rights of 88.02% (31,563,471 voting rights) shall be attributable to Red & Black TopCo S.à r.l. from the shares held by V.F.G. International N.V., Amsterdam, Netherlands, pursuant to section 22 paragraph 1 sentence 1 no. 1 in conjunction with sentence 3 WpHG (German Securities Trading Act). V.F.G. International N.V. is controlled by Red & Black TopCo S.à r.l. indirectly via Red & Black Lux S.à r.l., Luxembourg, Red & Black S.p.A., Milan, Italy, and Valentino Fashion Group S.p.A., Milan, Italy. A further proportion of voting rights of 1.47% (528,555 voting rights) shall be attributable to Red & Black TopCo S.à r.l. from the own shares held by HUGO BOSS AG pursuant to section 22 paragraph 1 sentence 1 no. 1 in conjunction with sentence 3 WpHG (German Securities Trading Act).

Information Concerning the Majority Shareholder h u G o b o s s Annual Report 2011
239
2. red & black lux s.à r.l., as legal successor of red & black lux 2 s.à r.l., luxembourg: The proportion of voting rights of Red & Black Lux 2 S.à r.l., Luxembourg held in HUGO BOSS AG, Metzingen, Germany, fell below the limits of 75%, 50%, 30%, 25%, 20%, 15%, 10%, 5% and 3% on April 21, 2008 and has stood at 0.00% since this day (no voting rights).For the company itself: The proportion of voting rights of Red & Black Lux S.à r.l., Luxembourg held in HUGO BOSS AG, Metzingen, Germany, continues to amount to more than 75% of the voting rights as of April 21, 2008, namely 89.49% of voting rights (32,092,026 voting rights). A proportion of voting rights of 88.02% (31,563,471 voting rights) shall be attributable to Red & Black Lux S.à r.l. from the shares held by V.F.G. International N.V., Amsterdam, Netherlands, pursuant to section 22 paragraph 1 sentence 1 no. 1 in conjunction with sentence 3 WpHG (German Securities Trading Act). V.F.G. International N.V. is controlled by Red & Black Lux S.à r.l. indirectly via Red & Black S.p.A., Milan, Italy, and Valentino Fashion Group S.p.A., Milan, Italy. A further proportion of voting rights of 1.47% (528,555 voting rights) shall be attributable to Red & Black Lux S.à r.l. from the own shares held by HUGO BOSS AG pursuant to section 22 paragraph 1 sentence 1 no. 1 in conjunction with sentence 3 WpHG (German Securities Trading Act).
Metzingen, April 24, 2008The Managing Board
· On May 2, 2008, HUGO BOSS was notified of the following voting rights announcements pursuant to sec- tion 21 paragraph 1 and section 22 WpHG (German Securities Trading Act) of Valentino Fashion Group S.p.A., Milan, Italy (until May 1, 2008 trading under the name of Red & Black S.p.A., Milan, Italy), registered in the company register Milan on June 26, 2007 under the number 05786030964:1. On May 1, 2008 Valentino Fashion Group S.p.A., Milan, Italy registered in the company register on February 15, 2005 under the number 047403870962 (hereinafter referred to as “Valentino Old”) was merged into Red & Black S.p.A., Milan, Italy. Thereby Valentino Old has lapsed. Legal successor is Red & Black S.p.A., Milan, Italy.2. In the course of the above mentioned merger the company Red & Black S.p.A. was renamed Valentino Fashion Group S.p.A. (hereinafter referred to as “Valentino New”) on May 1, 2008.3. Against the background of the above mentioned merger and renaming, Valentino New pursuant to section 21 paragraph 1 and section 22 WpHG makes the following notification:
As the legal successor of valentino old: The proportion of voting rights of Valentino Old held in HUGO BOSS AG, Dieselstraße 12, 72555 Metzingen, Germany, fell below the limits of 75%, 50%, 30%, 25%, 20%, 15%, 10%, 5% and 3% on May 1, 2008 and has stood at 0.00% since this day (no voting rights).For the company itself: The proportion of voting rights of Valentino New held in HUGO BOSS AG, Diesel-straße 12, 72555 Metzingen, Germany, continues to amount to more than 75% of the voting rights as of May 1, 2008, namely 89.49% of voting rights (32,092,026 voting rights). A proportion of voting rights of 88.02% (31,563,471 voting rights) shall be attributable to Valentino New from the shares held by V.F.G. Inter-national N.V., Amsterdam, Netherlands, pursuant to section 22 paragraph 1 sentence 1 no. 1 in conjunction with sentence 3 WpHG (German Securities Trading Act). V.F.G. International N.V. is a company controlled by Valentino New. A further proportion of voting rights of 1.47% (528,555 voting rights) shall be attributable to Valentino New from the own shares held by HUGO BOSS AG pursuant to section 22 paragraph 1 sentence 1 no. 1 in conjunction with sentence 3 WpHG (German Securities Trading Act).
Metzingen, May 2, 2008The Managing Board
AdditioNAl

240
h u G o b o s s Annual Report 2011 coNsolidAted FiNANciAl stAteMeNts
Information Concerning the Majority Shareholder
· On August 6, 2008, HUGO BOSS AG received from the following companies the following notifications on voting rights pursuant to Section 21, Paragraph 1 and Section 22 of the German Securities Trading Act (WpHG):The proportion of voting rights of Permira Holdings LLP, London, UK, held in HUGO BOSS AG, Dieselstrasse 12, 72555 Metzingen, Germany, exceeded the limits of 75%, 50%, 30%, 25%, 20%, 15%, 10%, 5% und 3% on August 04, 2008 and has stood at 89.49% of the voting rights since this day (32,092,026 shares). A proportion of voting rights of 88.02% (31,563,471 voting rights) of the shares held by V.F.G. Internati-onal N.V. is attributable to Permira Holdings LLP, pursuant to section 22 paragraph 1 sentence 1 no. 1 in conjunction with sentence 3 WpHG (German Securities Trading Act). V.F.G. International N.V. is a company controlled by Permira Holdings LLP indirectly via Permira Holdings Limited, Permira IV Managers Limited, Permira IV Managers L.P., Permira IV GP Limited, Permira IV GP L.P., Permira IV L.P.1, P4 Sub L.P.1, Red & Black HoldCo 2 S.à r.l., Permira IV L.P.2, P4 Co-Investments L.P., Permira Investments Limited, Permira Nominees Limited, Red & Black HoldCo S.à r.l., Red & Black TopCo S.à r.l., Red & Black Lux S.à r.l. and Valentino Fashion Group SpA. A further proportion of voting rights of 1.47% (528,555 shares) is attributable to Permira Holdings LLP of the own shares held by HUGO BOSS AG via Permira Holdings Limited, Permira IV Managers Limited, Permira IV Managers L.P., Permira IV GP Limited, Permira IV GP L.P., Permira IV L.P.1, P4 Sub L.P.1, Red & Black HoldCo 2 S.à r.l., Permira IV L.P.2, P4 Co-Investments L.P., Permira Investments Limited, Permira ominees Limited, Red & Black HoldCo S.à r.l., Red & Black TopCo S.à r.l., Red & Black Lux S.à r.l., Valentino Fashion Group S.p.A and V.F.G. International N.V. pursuant to section 22 paragraph 1 sentence 1 no. 1 in conjunction with sentence 3 WpHG (German Securities Trading Act).
Metzingen, August 7, 2008The Managing Board

Information Concerning the Majority Shareholder h u G o b o s s Annual Report 2011
241
· On September 24, 2009, HUGO BOSS AG received from the following companies the following notifica-tions on voting rights pursuant to Section 21, Paragraph 1 and Section 22 of the German Securities Trading Act (WpHG):The proportion of voting rights of Permira Holdings LLP, London, UK, held in HUGO BOSS AG, Dieselstrasse 12, 72555 Metzingen, Germany, fell below the limits of 75%, 50%, 30%, 25%, 20%, 15%, 10%, 5% and 3% on September 21, 2009 and now stands at 0.00% (no voting rights). For clarification, please note that the proportion of voting rights of all other companies for which their current proportion of voting rights subject to reporting requirements that have up to now been attributable to HUGO BOSS AG remain unaffected by the fact that the party obligated to report has gone below the limits as reported above. Permira Holdings Limited, and not Permira Holdings LLP, is now the controlling company in the existing structure.
Metzingen, September 25, 2009The Managing Board
· On December 23, 2009, HUGO BOSS AG received from the following companies the following notifications on voting rights pursuant to Section 21, Paragraph 1 and Section 22 of the German Securities Trading Act (WpHG):
1. valentino Fashion Group s.p.A.Valentino Fashion Group S.p.A., Milan, Italy, notified us of the following: We, the Valentino Fashion Group S.p.A., hereby inform you pursuant to section 21 paragraph 1 WpHG (German Securities Trading Act) that on December 23, 2009 our proportion of voting rights held in HUGO BOSS AG went below the limits of 75%, 50%, 30%, 25%, 20%, 15%, ,10%, 5% and 3% and now amounts to 0.00% (0 voting rights). For clarification, please note that the proportion of voting rights of all other companies to which their current proportion of Valentino Fashion Group S.p.A. voting rights attributable to HUGO BOSS AG shares remain unaffected by the fact that the Valentino Fashion Group S.p.A. has gone below the limits as reported above. Permira Holdings Limited remains the controlling company in the existing structure.
2. blitz F09-vier-sechs GmbhBlitz F09-vier-sechs GmbH, Frankfurt/Main, Germany, notified us of the following:We, Blitz F09-vier-sechs GmbH, hereby inform you pursuant to section 21 paragraph 1 WpHG (German Securities Trading Act) that on December 23, 2009 our proportion of voting rights held in HUGO BOSS AG exceeded the limits of 3%, 5%, 10%, 15%, 20%, 25%, 30%, 50% and 75% and now stands at 89.49% (32,092,026 voting rights).A proportion of voting rights of 88.02% (31,563,471 voting rights) shall be attributable to Blitz F09-vier-sechs GmbH from the shares held by V.F.G. INTERNATIONAL N.V., Rotterdam, Netherlands, pursuant to section 22 paragraph 1 sentence 1 no. 1 WpHG (German Securities Trading Act).A further proportion of voting rights of 1.47% (528,555 voting rights) shall be attributable to Blitz F09-vier-sechs GmbH from the own shares held by HUGO BOSS AG pursuant to section 22 paragraph 1 sentence 1 no. 1 in WpHG (German Securities Trading Act). For clarification: The above voting rights limits were exceeded because of an internal Group restructuring. Permira Holdings Limited remains the controlling company in the existing structure.
Metzingen, December 28, 2009The Managing Board
AdditioNAl

242
h u G o b o s s Annual Report 2011 coNsolidAted FiNANciAl stAteMeNts
Information Concerning the Majority Shareholder
· On March 24, 2010, HUGO BOSS AG was notified of the following voting rights announcements pursuant to section 21 paragraph 1 and section 22 WpHG (German Securities Trading Act) of the entities mentioned in the following:
1. v.F.G. international N.v., Amersfoort, Netherlands:On March 23, 2010 the proportion of voting rights of V.F.G. International N.V., Amersfoort, Netherlands held in HUGO BOSS AG has gone below the limits of 75%, 50%, 30%, 25%, 20%, 15%, 10%, 5% und 3% and amounts to 0,00% (no shares) on this day.
2. red & black holding Gmbh (formerly blitz F09-vier-sechs Gmbh), München, Germany:On March 23, 2010 the proportion of voting rights of (formerly Blitz F09-vier-sechs GmbH), München, Germany held in HUGO BOSS AG, Metzingen, Deutschland, amounts still to more than 75% of the voting rights, namely 89,49% of the voting rights (32.092.026 shares). Thereof a proportion of voting rights of 88,02% (31.563.471 shares) of Red & Black Holding GmbH pursuant to § 21 Abs. 1 WpHG are held directly. A further proportion of voting rights of 1,47% (528,555 shares), own shares held by HUGO BOSS AG, pursuant to section 22 paragraph 1 sentence 1 No. 1 WpHG, shall be attributable to Red & Black Holding GmbH. For clarification it is mentioned that the proportions of voting rights of all other companies, of which their former proportion of voting rights with HUGO BOSS AG has been attributed to V.F.G. International N.V., are unaffected by the shortfall of the above mentioned limits of V.F.G. International N.V.. The controlling company in the existing structure remains Permira Holdings Limited.
Metzingen, March 26, 2010The Managing Board
Apart from that, no other shareholders have reported holdings equivalent to more than 10% of the voting rights. Moreover, the Company received no other new reports of shareholdings of 3% or more of the voting rights in HUGO BOSS AG.

Managing Board h u G o b o s s Annual Report 2011
243
MANAGiNG boArd
clAus-dietrich lAhrs
Stuttgart, GermanyChairman of the Managing BoardResponsible for Distribution, Retail, Licenses, Communication and Global Replenishment
christoph AuhAGeN
Stuttgart, GermanyResponsible for Brand Management, Creative Management, Sourcing and Manufacturing
MArk lANGer
Stuttgart, GermanyResponsible for Controlling, Investor Relations, Finance, Legal, Human Resources, Logistics, IT and Central ServicesDirector for Labor Relations
AdditioNAl

244
h u G o b o s s Annual Report 2011 coNsolidAted FiNANciAl stAteMeNts
Supervisory Board
supervisorY boArd
dr. hellMut Albrecht
Munich, GermanyManagement ConsultantChairman of the Supervisory Board
ANtoNio siMiNA
Metzingen, GermanyTailor/Chairman of the Works CouncilHUGO BOSS AG, Metzingen, GermanyDeputy Chairman of the Supervisory Board Employee representative
Gert bAuer
Reutlingen, GermanyFirst Authorized Representative of the German Metalworkers’ Union (IG Metall), Reutlingen/Tübingen, GermanyEmployee representative
helMut brust
Bad Urach, GermanyDirector Social AffairsHUGO BOSS AG, Metzingen, GermanyEmployee representative
berNd siMbeck
Metzingen, GermanyAdminstrative employeeHUGO BOSS AG,Metzingen, GermanyEmployee representative
siNAN piskiN
Metzingen, GermanyAdminstrative employeeHUGO BOSS AG,Metzingen, GermanyEmployee representative
dr. MArtiN weckwerth
Frankfurt/Main, GermanyPartnerPermira Beteiligungsberatung GmbH, Frankfurt/Main, Germany
MoNikA lersMAcher
Kornwestheim, GermanySecretary of the German Metalworkers’ UnionIG Metall Area Headquarters, Baden-Württemberg, Stuttgart, GermanyEmployee representative
dAMoN MArcus buFFiNi
Surrey, Great BritainManaging DirectorPermira Advisers LLP, London, Great Britain

Supervisory Board h u G o b o s s Annual Report 2011
245
lucA MArzotto
Venice, ItalyChief Executive OfficerZignago Holding S.p.A., Fossalta di Portogruaro, Italy
GAetANo MArzotto
Milan, ItalyChairman of the Supervisory BoardGruppo Santa Margherita S.p.A., Fossalta di Portogruaro, Italy
dr. klAus MAier
Stuttgart, GermanyManagement Consultant
AdditioNAl

246
h u G o b o s s Annual Report 2011 coNsolidAted FiNANciAl stAteMeNts
Additional Information on the Duties of Supervisory Board and Managing Board Members
AdditioNAl iNForMAtioN oN the duties oF supervisorY boArd ANd MANAGiNG boArd MeMbers
The following members of HUGO BOSS’ Supervisory Board also hold positions on bodies at the companies specified below: 1
Dr. Hellmut Albrecht MME Moviement AG 2 Munich, Germany
Pro-Beam AG & Co. KGaA 2 Planegg, Germany
Gert Bauer ElringKlinger AG Dettingen/Erms, Germany
Monika Lersmacher Berthold Leibinger GmbH Ditzingen, Germany
Dr. Klaus Maier Diehl Stiftung & Co. KG Nuremberg, Germany
Titan X Holding AB Mjällby, Sweden
Valeo SA Paris, France
Galeria Kaufhof GmbH Cologne, Germany
Gaetano Marzotto Zignago Holding S.p.A. Fossalta di Portogruaro, Italy
Santa Margherita S.p.A. 2 Fossalta di Portogruaro, Italy
Zignago Vetro S.p.A. Fossalta di Portogruaro, Italy
Valentino Fashion Group S.p.A. Milan, Italy
Luca Marzotto Zignago Holding S.p.A. Fossalta di Portogruaro, Italy
Santa Margherita S.p.A. Fossalta di Portogruaro, Italy
New High Glass Inc. Miami, FL, U.S.
Federvini - Sindacato A 2 Rome, Italy
Vetri Speciali S.p.A. Trento, Italy
Zignago Vetro S.p.A. Fossalta di Portogruaro, Italy
Banca Populare Friuladria S.p.A. Pordenone, Italy
Dr. Martin Weckwerth Valentino Fashion Group S.p.A. Milan, Italy
1 The members not stated have no seats on executive or advisory bodies at any other company.
2 Holding the post of Chairman.

h u G o b o s s Annual Report 2011
247
publicationThe financial statements of HUGO BOSS AG are published in the electronic German Federal Gazette (eBundes-anzeiger), filed with the Commercial Registry at the Stuttgart Local Court and published on the HUGO BOSS webpage.
Metzingen, February 17, 2012
HUGO BOSS AGThe Managing Board
clAus-dietrich lAhrs
christoph AuhAGeN
MArk lANGer
AdditioNAl

248
h u G o b o s s Annual Report 2011 coNsolidAted FiNANciAl stAteMeNts
Responsibility Statement
respoNsibilitY stAteMeNt
To the best of our knowledge, and in accordance with the applicable reporting principles, the consolidated financial statements give a true and fair view of the assets, liabilities, financial position, and profit or loss of theGroup, and the Group management report includes a fair review of the development and performance of the business and the position of the Group, together with a description of the principal opportunities and risks associated with the expected development of the Group.
Metzingen, February 17, 2012
HUGO BOSS AGThe Managing Board
clAus-dietrich lAhrs
christoph AuhAGeN
MArk lANGer

Auditor’s Report h u G o b o s s Annual Report 2011
249
Auditor’s report
We have audited the consolidated financial statements prepared by the HUGO BOSS AG, Metzingen, comprising the balance sheet, the income statement and statement of comprehensive income, statement of changes in equity, statement of cash flows and the notes to the consolidated financial statements, together with the group management report for the business year from January 1 to December 31, 2011. The preparation of the consolidated financial statements and the group management report in accordance with International Financial Reporting Standards (IFRSs) as adopted by the European Union (EU) and the additional requirements of German commercial law pursuant to § 315a sec. 1 of the German Commerical Code (HGB) are the respon-sibility of the parent company’s management. Our responsibility is to express an opinion on the consolidated financial statements and on the group management report based on our audit.
We conducted our audit of the consolidated financial statements in accordance with § 317 HGB and German generally accepted standards for the audit of financial statements promulgated by the Institut der Wirtschafts-prüfer (Institute of Public Auditors in Germany) (IDW). Those standards require that we plan and perform the audit such that misstatements materially affecting the presentation of the net assets, financial position and results of operations in the consolidated financial statements in accordance with the applicable financial reporting framework and in the group management report are detected with reasonable assurance. Knowledge of the business activities and the economic and legal environment of the Group and expectations as to possible misstatements are taken into account in the determination of audit procedures. The effectiveness of the accountingrelated Internal Control System and the evidence supporting the disclosures in the consolidated financial statements and the group management report are examined primarily on a test basis within the framework of the audit. The audit includes assessing the annual financial statements of those entities included in consolidation, the determination of entities to be included in consolidation, the accounting and consolidation principles used and significant estimates made by management, as well as evaluating the overall presentation of the consolidated financial statements and the group management report. We believe that our audit provides a reasonable basis for our opinion.
Our audit has not led to any reservations.
In our opinion, based on the findings of our audit, the consolidated financial statements comply with IFRSs, as adopted by the EU, the additional requirements of German commercial law pursuant to § 315a Abs. 1 HGB and give a true and fair view of the net assets, financial position and results of operations of the Group in accordance with these requirements. The group management report is consistent with the consolidated financial statements and as a whole provides a suitable view of the Group’s position and suitably presents the opportunities and risks of future development.
Stuttgart, February 17, 2012
KPMG AGWirtschaftsprüfungsgesellschaft
GöttGeNs Gloss
Wirtschaftsprüfer Wirtschaftsprüferin
AdditioNAl


ADDITIONAL
05
AdditioNAl


h u G o b o s s Annual Report 2011
253
Contents
254 General Information254 Forward-Looking Statements255 Financial Calendar and Contacts256 Glossary260 Index262 Index of Figures264 Legal Notice
CONTENTS05 AdditioNAl

254
h u G o b o s s Annual Report 2011 AdditioNAl
General Information / Forward-Looking Statements
GeNerAl iNForMAtioN
Our Company’s performance is best reflected in the consolidated financial statements. Like many other orga-nizations, we have refrained from including the figures from the separate financial statements of the parent company HUGO BOSS AG in this report for the sake of clarity of presentation. To receive a copy of these statements, which continue to be prepared in accordance with the German Commercial Code (HGB), please contact:
huGo boss AGInvestor Relations
Dieselstraße 1272555 Metzingen, Germany
Phone +49 (0) 7123 94 - 1326E-Mail [email protected]
ForwArd-lookiNG stAteMeNts
This document contains forward-looking statements that reflect management’s current views with respect to future events. The words “anticipate,” “assume,” “believe,” “estimate,” “expect,” “intend,” “may,” “plan,” “project,” “should,” and similar expressions identify forward-looking statements. Such statements are subject to risks and uncertainties. If any of these or other risks or uncertainties occur, or if the assumptions underlying any of these statements prove incorrect, then actual results may be materially different from those expressed or implied by such statements. We do not intend or assume any obligation to update any forward-looking statement, which speaks only as of the date on which it is made.

Financial Calendar and Contacts h u G o b o s s Annual Report 2011
255
FiNANciAl cAleNdAr ANd coNtActs
FiNANciAl cAleNdAr
MArch 14, 2012
Press and Analysts’ Conference
April 26, 2012
Publication of the First Quarter Report 2012
MAY 3, 2012
Annual Shareholders’ Meeting
JulY 31, 2012
Publication of the First Half Year Report 2012
october 30, 2012
Publication of the Nine Months Report 2012
coNtActs
iNvestor relAtioNs
Phone +49 (0) 7123 94 - 1326
e-mail [email protected]
deNNis weber
Head of Investor Relations
Phone +49 (0) 7123 94 - 86267
Fax +49 (0) 7123 94 - 886267
dr. hJördis ketteNbAch
Head of Corporate Communication
Phone +49 (0) 7123 94 - 2375
Fax +49 (0) 7123 94 - 2051
reQuest For ANNuAl reports
www.group.hugoboss.com / Order Service

256
h u G o b o s s Annual Report 2011 AdditioNAl
Glossary
b
brANdWith its brand world including the core brand BOSS Black, the luxury brand BOSS Selection, the premium sportswear brand BOSS Green, the casualwear brand BOSS Orange and the trendy brand HUGO, HUGO BOSS targets different, clearly differentiated groups.
c
cAsh Flow stAteMeNtThe aim of the cash flow statement is to create trans-parency regarding changes in a company’s liquidity funds. It describes in detail the type, amount and sources of the cash flows.
coMpliANceCompliance means to undertake all reasonable measures in order to ensure adherence to the laws, statutory regulations and the company’s internal policies and their observance by group companies.
core rANGeThe core range is a pre-defined range developed in line with the requirements of each collection. The core range is at the heart of every collection and largely defines its statement.
corporAte GoverNANceCorporate governance defines the principles and legal framework for management and monitoring at the Company. In Germany, these principles are set out in the Corporate Governance Code.
coveNANtsCovenants are clauses in a loan agreement or contractual obligations given by a borrower for the term of a loan agreement. They generally relate to the observation of upper and/or lower limits for certain key financial performance indicators. As a condition of its syndicated loan, the HUGO BOSS Group must meet certain key performance indicators.
d
dAYs iNveNtorY outstANdiNG (dio) Time between receiving goods as inventory and the sale of the finished product.
dAYs pAYAbles outstANdiNG (dpo)Time between receiving an invoice and making payment on trade payables.
dAYs sAles outstANdiNG (dso)Time between issuing an invoice and receiving payment on trade receivables.
derivAtivesA derivative is a financial instrument, whose change in value is linked to an underlying asset such as shares, bonds, currencies or commodities or to market indexes and which is settled at a future date. It does not require an initial net investment or a compa-ratively low initial net investment.
directlY operAted stores (dos)Directly operated stores are monobrand stores (cf. monobrand sales format) and shops operated directly by HUGO BOSS.
directors’ deAliNGsDirectors’ dealings are own-account transactions entered into by members of the management with HUGO BOSS AG securities. Pursuant to Section 15a of the German Securities Trading Act (WpHG), members of the management are required to disclose such transactions.
diversitYDiversity refers to heterogeneity and differences among employees, executives and members of the Supervisory Board of HUGO BOSS AG. For example, diversity can relate to the nationality, gender or age of specific groups of people.
GlossArY

Glossary h u G o b o s s Annual Report 2011
257
e
ebit earnings before interest and taxes. EBIT is a key business performance indicator which shows a company’s operating profit in a certain period not including taxes and interest.
ebitdA beFore speciAl iteMsearnings before interest, taxes, depreciation and amortization not including special items (cf. special items). EBITDA is a key performance indicator which measures operating profitability depreciation effects from investment activity. EBITDA before special items is the most important performance indicator for the HUGO BOSS Group.
ebitdA MArGiNThe EBITDA margin describes the ratio of EBITDA (cf. EBITDA before special items) to sales revenues.
F
FrANchiseFranchise is a distribution system of providing goods and services according to a business model. Franchise is based upon a close and ongoing colla-boration between legally and financially independent undertakings. As franchisor, HUGO BOSS supplies its trading partners, which operate franchise stores, with the HUGO BOSS store concept as well as the corresponding marketing know how for selling the HUGO BOSS products.
Free cAsh FlowFree cash flow is calculated by adding up the operating cash flow and the cash flow from investing activities. To increase its enterprise value, HUGO BOSS focuses on maximizing free cash flow.
Free FloAtShares of the HUGO BOSS AG in free float are conti-nuously available for trading on the equity market. They are not held by institutional investors, i.e. they are not held in order to pursue long-term strategic objections.
G
GoodwillGoodwill resulting from a business combination represents the difference between the consideration transferred plus the amount of the shares without a controlling influence, and the assets acquired and liabilities assumed.
Group’s owN retAil busiNess In the Group’s own retail business, sales of HUGO BOSS products are made directly to the end customer via directly operated stores (cf. directly operated stores), outlet stores and the HUGO BOSS online store, in contrast to sales in wholesale business (cf. wholesale).
i
iFrs (iNterNAtioNAl FiNANciAl reportiNG stANdArds)IFRS are international financial reporting standards for companies that are issued by the International Accounting Standards Board (IASB). They provide worldwide transparent and comparable accounting of consolidated financial statements, and make it easier to compare publicly traded companies.
l
like-For-like sAles developMeNtSales trend within the Group’s own retail business (cf. Group’s own retail business) for comparable areas, i.e. not including newly opened or recently closed points of sale.

258
h u G o b o s s Annual Report 2011 AdditioNAl
Glossary
M
MAde to MeAsureAs part of the BOSS Selection brand, the Made to Measure line offers particularly high-quality bespoke suits. The Made to Measure line emphasizes the exclusivity of the BOSS Selection brand while focusing on the desire for individual style.
MoNobrANd sAles ForMAtContrary to multi-brand sales formats, monobrand sales formats are used to sell the products of only one brand at one particular point of sale.
N
Net FiNANciAl liAbilitiesNet financial liabilities comprise all interest-bearing financial and other liabilities less non-operating cash and cash equivalents and short-term investments
o
out-oF-hoMe MediAOut-of-home media refers to forms of advertising which reach customers outside their homes and offices. This includes traditionally for example adverti-sing pillars and billboards, but also advertisement on busses, telephone boxes or at airports.
p
poiNts oF sAle (pos)All businesses where HUGO BOSS products are sold – i.e. stores, shops and the online store (cf. stores) – are points of sale. They can be operated directly by the Group (cf. Group’s own retail business) or by wholesale partners (cf. wholesale).
preorderPreorders are orders received for future deliveries. Wholesale partners place orders on a seasonal basis in the HUGO BOSS showrooms (cf. showroom) for the goods presented there (collection). In addition, goods can be reordered irrespective of season using the HUGO BOSS replenishment (cf. replenishment).
r
repleNishMeNtReplenishment of goods which allows HUGO BOSS to react to short-time surges in demand from trading partners.
roYAltYA royalty is the permission to use another’s trademark for commercial purposes in exchange for the payment of a sum of money (royalty fee). Granting of royalties enables HUGO BOSS to benefit from the expertise and potentially different distribution structure of the licensee. Products manufactured for HUGO BOSS by licensees include fragrances, eyewear, watches, children’s fashion, motorcycle helmets, mobile phones, mobile accessories and home textiles.
s
sAles AreA productivitYThe sales area productivity measures the sales potential per square meter and year. The key figure shows the sales success of the Group’s own retail business (cf. Group’s own retail business).
seAsoNA collection is delivered and sold over a particular period of time (season).

Glossary h u G o b o s s Annual Report 2011
259
seGMeNtsUnder IFRS 8 (cf. IFRS), a segment is a component of an entity that engages in non-derivative business acti-vities from which it may earn revenues. The operating segment results (cf. EBITDA before special items) are regularly reviewed by a company‘s responsible governing body. The HUGO BOSS Group has defined the following segments: Europe, Americas, Asia/Pacific and Royalties (cf. Royalty).
showrooMThe showroom is where the collection is presented to wholesale customers (cf. wholesale) who can then place their orders.
speciAl iteMsHUGO BOSS defines special items as expenses with no direct connection to the business activity. This includes for example expenses relating to structural realignment or reorganization of individual business segments.
stock AppreciAtioN riGhts (sAr proGrAM)The SAR program was created by HUGO BOSS for Managing Board members and executives. As part of this program, executives of HUGO BOSS AG and its subsidiaries were granted a certain number of parti-cipation rights. These rights enable them to benefit from any increase in the value of the Company’s shares. The participation rights solely grant a claim to cash settlement, not a claim to HUGO BOSS AG shares.
stores A store is a sales area with its own entrance, selling exclusively HUGO BOSS products via the appropriate shop concept. Stores can be operated directly by the Group (cf. directly operated stores) or as franchises (cf. franchise).
t
tAilored liNeUnder the BOSS Selection brand, HUGO BOSS offers particularly high-quality suits, partly handcrafted, distinguished by exclusive materials and a particularly flexible fit. Together, these suits form the Tailored Line.
tiMe to MArketThe period of time between development of a product and its delivery to the market.
trAde Net workiNG cApitAlTrade net working capital is calculated as the total of inventories and trade receivables less trade payables.
w
wholesAleIn contrast to the direct sale of goods via the Group’s own retail business (cf. Group’s own retail business), sales in wholesale business are made indirectly via retail partners’ sales space. Wholesale purchases HUGO BOSS goods either through traditional preorder (cf. preorder) business or via replenishment (cf. replenishment) and sells them on to the end customer.

260
H U G O B O S S Annual Report 2011 AdditiOnAl
Index
A
Accounting policies 171 – 180Administrative expenses 104, 184Annual Shareholders‘ Meeting 051, 057Appropriation of profits 105Audit of financial statements 050, 219, 241Auditor‘s report 241
B
Balance sheet 151 – 153, 190 – 206Balance sheet structure 111 – 112Brand positioning 075 – 076Brands 064 – 065, 073, 075 – 076, 100Business activities 064 – 065
C
Capital expenditure 069 – 072, 119 – 120Capital reserve 153, 197Capital structure 117Cash and cash equivalents 112, 118, 196Cash flow 069 – 070, 117 – 118, 156, 210Cash flow statement 156, 182, 210Changes in presentation 181 – 182Compensation report 122Compliance 050 – 051Contacts 247Contingent liabilities 207Corporate Governance 044, 047 – 053Cost of sales and direct selling expenses 183Covenants 116, 129Currency risk 130 – 132, 209
d
Declaration of compliance 052 – 053Depreciation/amortization 104,120,189Development 084 – 085Directly operated stores (DOS) 098 – 100Diversity 047 – 049, 080Dividend 054, 059, 105, 144, 197D.R.I.V.E. 074 – 075, 087, 140, 144
E
EBIT 104EBITDA 069 – 071, 102, 104, 107 – 110, 143, 145Economic conditions 094 – 095, 141 – 142Employees 079 – 083, 188 – 189Events after the balance sheet date 141
F
Financial assets 174 – 175Financial calendar 247Financial instruments 174, 176, 204 – 206Financial liabilities 201 – 202Financial management 115Financial result 104, 185Financial risks 129 – 133Fixed assets 190
G
Glossary 248 – 251Group management 069 – 072Group strategy 073 – 078Group‘s own retail business 068, 071, 076 – 077, 096 – 100, 119 – 120, 143 – 145
i
Income statement 103 – 105, 150, 183 – 189Income taxes 104, 177, 185 – 187Innovation 084 – 085Intangible assets 112, 173, 191 – 192Internal control system 136 – 138Inventories 112 – 114, 172, 194Investor Relations 051, 059
K
Key financial indicators 121
l
Leasing 173, 177, 207 – 209Liabilities 113 – 114, 201 – 203
indEx

Index H U G O B O S S Annual Report 2011
261
M
Majority shareholders 058, 222 – 234Management Participation Program (MPP) 218 – 219Managing Board 036 – 039, 043, 047 – 053, 122, 235Market presence 068Marketing expenses 103 – 104, 183 – 184Minority interests 187
N
Net assets 111 – 114Net working capital 069 – 071, 112 – 114, 144 – 145
O
Online store 077, 099Opportunities report 138 – 140Organizational structure 066 – 067Other assets 194Other financial obligations 207 – 208Other operating expenses/income 104, 184Outlook 141 – 145
P
Personnel expenses 188 – 189Product development 084 – 085, 087 – 088Production 086 – 089, 133Property, plant and equipment 172 – 173, 193Provisions 197 – 198Provisions for pensions 198 – 201Purchasing 086 – 089, 133
Q
Quality assurance 085
R
Receivables 112 – 114, 179, 195Results of operations 094 – 105Retained earnings 197Risk management 126 – 127Risk management system 136 – 138Risk report 126 – 138Royalities/licenses 064 – 065, 100, 110
S
Sales 094 – 101, 106 – 110, 183Scope of consolidation 167 – 169Sector performance 095, 142Segment reporting 107 – 110, 210 – 212Selling expenses 103 – 104, 183 – 184Share 054 – 059Shareholder structure 058Shareholders‘ equity 111 – 112, 129 – 132, 154 – 155, 220 – 221Sponsorship 065, 208Statement of changes in equity 154 – 155Statement of comprehensive income 151Stock Appreciation Rights (SAR) 214 – 217Strategy 073 – 078Subscribed capital 196Subsidiaries 066, 167 – 169Supervisory Board 040 – 046, 122, 236 – 238Suppliers 086 – 089, 133
T
Tax rate 104Training 080 – 081
W
Wholesale business 096 – 098, 101

262
h u G o b o s s Annual Report 2011 AdditioNAl
Index of Figures
01 Share price performance 49
02/01 Shareholder structure at year-end – HUGO BOSS common shares 51
02/02 Shareholder structure at year-end – HUGO BOSS preferred shares 51
03 Regional split of free float investor base at year-end 52
04 Market capitalization at year-end 52
05/01 Dividend per common share 5305/02 Dividend per preferred share 53
06 HUGO BOSS organizational structure 59
07 Key locations/Global market presence 60
08 Key performance indicators of the HUGO BOSS Group 62
09 Definition free cash flow 63
10 Definition trade net working capital 63
11 Development of key performance indicators 65
12 Established strengths of HUGO BOSS business model 66
13 Mid-term growth strategy 69
14 Sales by channel 70
15 Sales by region 73
16 Number of employees at year-end 76
17 Number of employees by functional allocation at year-end 77
18 Number of industrial, commercial and administrative employees at year-end 77
19 Employees by region at year-end 78
20 Regional split of sourcing and production volume 86
21 Corporate responsibility at HUGO BOSS 89
22/01 Sales 9622/02 EBITDA before special items 9622/03 Net income 9622/04 Trade net working capital 96 22/05 Free cash flow 9622/06 Capital expenditure 96
23/01 Sales development 9923/02 Sales performance by quarter 10023/03 Sales by region 10123/04 Sales by distribution channel 102
iNdex oF FiGures

Index of Figures h u G o b o s s Annual Report 2011
263
24/01 Number of Group’s own retail stores 10324/02 Number of Group’s own retail stores
by region 104
25 Sales by brand 105
26 Gross profit margin 108
27/01 Adjusted EBITDA margin 10927/02 EBITDA before special items
by quarter 109
28/01 Earnings per common share 11028/02 Earnings per preferred share 110
29/01 Sales – Europe 11229/02 Share in sales – Europe 2011 11229/03 Earnings development Europe 112
30/01 Sales – Americas 11330/02 Share in sales – Americas 2011 11330/03 Earnings development Americas 114
31/01 Sales – Asia/Pacific 11431/02 Share in sales – Asia/Pacific 2011 11431/03 Earnings development Asia/Pacific 115
32/01 Sales – Royalties 11532/02 Earnings development – Royalties 115
33 Balance sheet structure 116
34 Inventories 117
35 Trade receivables 118
36 Trade payables 118
37 Trade net working capital 119
38 Total leverage 121
39 Interest cover 122
40 Free cash flow 123
41 Net financial liabilities 124
42 Cash and cash equivalents 124
43 Capital expenditure 125
44 Capital expenditure by investment area 125
45 Capital expenditure by region 126
46 HUGO BOSS risk policy 134
47 Risk categories 135
48 Assessment criteria for company risks 135

264
h u G o b o s s Annual Report 2011 AdditioNAl
Legal Notice
leGAl Notice
huGo boss AG
Dieselstrasse 12
72555 Metzingen, Germany
Phone +49 (0) 7123 94 - 0
Fax +49 (0) 7123 94 - 2014
www.hugoboss.com
coNcept/desiGN
Strichpunkt, Stuttgart / Berlin
photos
Christian Anwander
Stefan Armbruster
Cedric Buchet
Alexei Hay
Wen Hua
Mark Lloyd
Toni Nüsse
Andreas Pohlmann
David X. Prutting
Mario Sorrenti
Jürgen Tap
Michael Tinnefeld
Markus Tretter
HUGO BOSS AG
eNGlish trANslAtioN
EVS Translations, Berlin / Gilbert & Bartlett, Hamburg
priNtiNG
Raff GmbH, Riederich
productioN

HUGO BOSS 5-Year-Overview/ Please oPen here

HUGO BOSS 5-Year-Overview
2011 2010 2009 2008 2007
earnings position (in eUr million)
sales 2,058.8 1,729.4 1,561.9 1,686.1 1,632.0
Gross Profit 1,264.8 1,027.2 847.1 891.0 845.0
eBItDa 467.5 336.1 224.5 236.0 287.1
eBItDa before special items 469.0 349.8 267.2 272.4 274.7
eBIt 394.1 263.9 155.4 175.0 219.7
net income attributable to equity holders of the parent company 284.5 185.9 104.0 112.1 154.2
financial position and dividend (in eUr million)
Cash flow from operating activities 193.3 246.3 299.5 48.1 33.0
net financial liabilities 149.1 201.1 379.1 583.2 173.6
Capital expenditures 108.5 55.6 48.3 118.8 84.7
Depreciation/amortization 73.4 72.2 69.1 61.0 67.4
Dividend 199.1 1 139.7 66.6 94.9 100.4
special dividend – – – – 345.1
asset and liability Structure (in eUr million)
total assets 1,449.0 1,355.4 1,065.4 1,161.6 1,039.3
shareholders’ equity 523.2 361.2 205.5 202.9 550.7
trade net working capital 407.4 322.7 295.6 458.3 421.7
non-current assets 524.9 467.2 435.0 463.0 400.5
Key figures
Gross profit margin in % 61.4 59.4 54.2 52.8 51.8
adjusted eBItDa margin in % 2 22.8 20.2 17.1 16.2 16.8
eBIt margin in % 19.1 15.3 10.0 10.4 13.5
total leverage 3 0.3 0.6 1.4 2.1 0.6
equity ratio in % 36.1 26.6 19.3 17.5 53.0
employees
employees 4 11,004 9,944 9,027 9,593 9,123
Personnel expenses 374.2 368.4 331.4 352.8 299.7
Shares (in eUr)
earnings per share
Common shares 4.12 2.69 1.50 1.62 2.22
Preferred shares 4.13 2.70 1.51 1.63 2.24
Dividend per share
Common shares 2.88 1 2.02 0.96 1.37 1.45
Preferred shares 2.89 1 2.03 0.97 1.38 1.46
special dividend per share
Common shares – – – – 5.00
Preferred shares – – – – 5.00
Common shares 5
last (12/31) 55.19 49.23 20.22 17.30 39.60
high 76.75 49.52 23.15 39.81 53.39
low 43.00 17.78 8.82 11.24 39.00
Preferred shares 5
last (12/31) 56.90 56.50 24.55 14.40 39.00
high 80.00 56.52 28.60 40.65 48.77
low 47.35 22.38 9.03 9.33 37.90
total number of shares 4 70,400,000 70,400,000 70,400,000 70,400,000 70,400,000
Common shares 35,860,000 35,860,000 35,860,000 35,860,000 35,860,000
Preferred shares 34,540,000 34,540,000 34,540,000 34,540,000 34,540,000
1 2011: recommendation for dividend payment.
2 eBItDa before special items/sales.
3 net financial liabilities/eBItDa before special items and expenses for the “stock appreciation rights Program”.
4 at year end.
5 Xetra.
