business services almanac - jefferies group › ... › jefferies.com › files › ...feb17.pdf ·...
TRANSCRIPT
Business Services | February 2017 0
Business Services Almanac
February 2017
CONTACTS: Daniel Frommelt Managing Director European Head of Business Services Investment Banking +44 (0)20 7029 8267 [email protected] Sven Gerlach Vice President Business Services Investment Banking +44 (0)20 7029 8213 [email protected] Levi Glick Analyst Business Services Investment Banking +1 212 323 3973 [email protected]
IN THIS ISSUE
Table of Contents - Business Services Vertical Classification 1
UK Business Services 13
Route Based 15
Facility Management 31
Compliance & Assurance Services 53
Business Process Outsourcing 75
Contingent Services 81
Note: All data sourced from Capital IQ

Business Services | February 2017 1
Table of Contents – Business Services Vertical Classification
Route Based Facility Management
Compliance & Assurance Services
Business Process Outsourcing
Contingent Services
Page 15 Page 31 Page 53 Page 75 Page 81
Cash Services
Security Services
Testing, Inspection & Certification
Diversified BPO
Staffing
Hygiene Services
Cleaning Engineering Consulting
Human Resource
Equipment Rental
Road Side Assistance
Catering Educational
(Training) Services Software
Enabled Services
Vending Services
Technical FM Information
Services CRM
Waste Management
Industrial Services
Accounts
Receivables Management
Distribution Airport
Services Mortgage
BPO
Outsourcing Agent
Route Based Site Based Knowledge / Regulation Based Tech Enabled Demand Based

Business Services | February 2017 3
Business Services Valuation Dashboard
1-Year Daily Indexed Price Performance (LTM) – January 31, 2016 – January 31, 2017
EV / EBITA ’17E (Average)
Note: Indexed share price performance based on equal weights
Trading Multiples & Operating Metrics
Operational KPIs (Average) Trading Multiples (Average)
Rev. CAGR '17E Margins FCF Net Debt / EV / EBITDA EV / EBITA EV / EBITDA - Capex P / E
€m, unless specified '15A-'17E EBITDA EBITA '17E LTM EBITDA '16E '17E '16E '17E '16E '17E '16E '17E
Business Services
Airport Services 7.3% 19.0% 12.2% 71.0% 1.8x 11.5x 10.3x 14.9x 12.3x 16.2x 14.1x 18.8x 16.0x
Business Process Outsourcing 7.6% 21.3% 18.1%n/m 78.7%n/m 1.9xn/m 11.4x 10.5xn/m 13.7x 13.0xn/m 13.3x 12.8xn/m 19.1x 16.1x
Distribution 6.1% 7.5% 6.6% 82.2% 2.1x 11.6x 10.6x 13.7x 12.4x 14.3x 12.8x 20.8x 17.7x
Education 17.2% 17.5% 14.5%n/m 74.4%n/m (1.3x)n/m 11.4x 10.5xn/m 13.9x 11.9xn/m 11.8x 12.0xn/m 18.7x 17.0x
Engineering Consulting 3.9% 10.9% 7.6%n/m 79.7%n/m 1.3xn/m 11.4x 9.6xn/m 12.3x 11.6xn/m 14.6x 12.5xn/m 20.7x 16.8x
Equipment Rental 6.6% 36.3% 16.6% 50.3% 2.8x 5.8x 5.1x 13.4x 12.4x 12.2x 12.7x 17.3x 13.9x
Facility Management 5.5% 7.6% 6.1% 73.7% 1.3x 10.3x 9.3x 13.3x 12.0x 14.6x 13.0x 20.2x 15.8x
Industrial Services (4.4%) 10.3% 5.0% 72.2% 1.4x 10.8x 10.4x 12.2x 13.1x 12.4x 13.1x 18.8x 15.6x
Information Services 7.0% 34.4% 31.0%n/m 83.6%n/m 0.8xn/m 13.7x 11.6xn/m 16.1x 13.2xn/m 17.0x 13.6xn/m 24.3x 19.3x
Route Based 7.6% 21.0% 14.6%n/m 67.9%n/m 1.7xn/m 11.5x 10.3xn/m 15.7x 13.9xn/m 16.5x 15.2xn/m 21.7x 19.2x
Security Services 5.7% 14.6% 11.3% 74.4% 1.4x 11.5x 10.5x 15.0x 13.4x 14.0x 13.6x 22.7x 18.4x
Staffing 5.9% 6.6% 5.6% 87.8% (0.0x) 10.2x 9.3x 12.0x 10.9x 11.9x 10.6x 16.5x 15.2x
TIC 7.4% 20.1% 15.8% 77.2% 1.3x 13.7x 11.9x 18.3x 15.2x 16.3x 15.5x 24.3x 22.2x
Waste Management 1.0% 22.2% 13.1% 55.9% 3.8x 11.6x 9.4x 16.8x 14.6x 14.9x 13.8x 23.8x 18.2x
Median 6.3% 18.3% 12.7% 74.4% 1.4x 11.4x 10.4x 13.8x 12.7x 14.4x 13.1x 20.5x 16.9x x
Mean 6.0% 17.8% 12.7% 73.5% 1.5x 11.2x 10.0x 14.4x 12.9x 14.3x 13.2x 20.5x 17.2x
15.2x14.6x
13.9x13.4x 13.2x 13.1x 13.0x 12.4x 12.4x
12.3x 12.0x 11.9x 11.6x10.9x
Average12.9x
0.0x
2.0x
4.0x
6.0x
8.0x
10.0x
12.0x
14.0x
16.0x
TIC WasteManagement
Route Based SecurityServices
InformationServices
IndustrialServices
BusinessProcess
Outsourcing
Distribution EquipmentRental
Airport Services FacilityManagement
Education EngineeringConsulting
Staffing
80.0%
90.0%
100.0%
110.0%
120.0%
130.0%
140.0%
150.0%
160.0%
170.0%
Vertical 30-Day % Δ YTD % Δ LTM % Δ
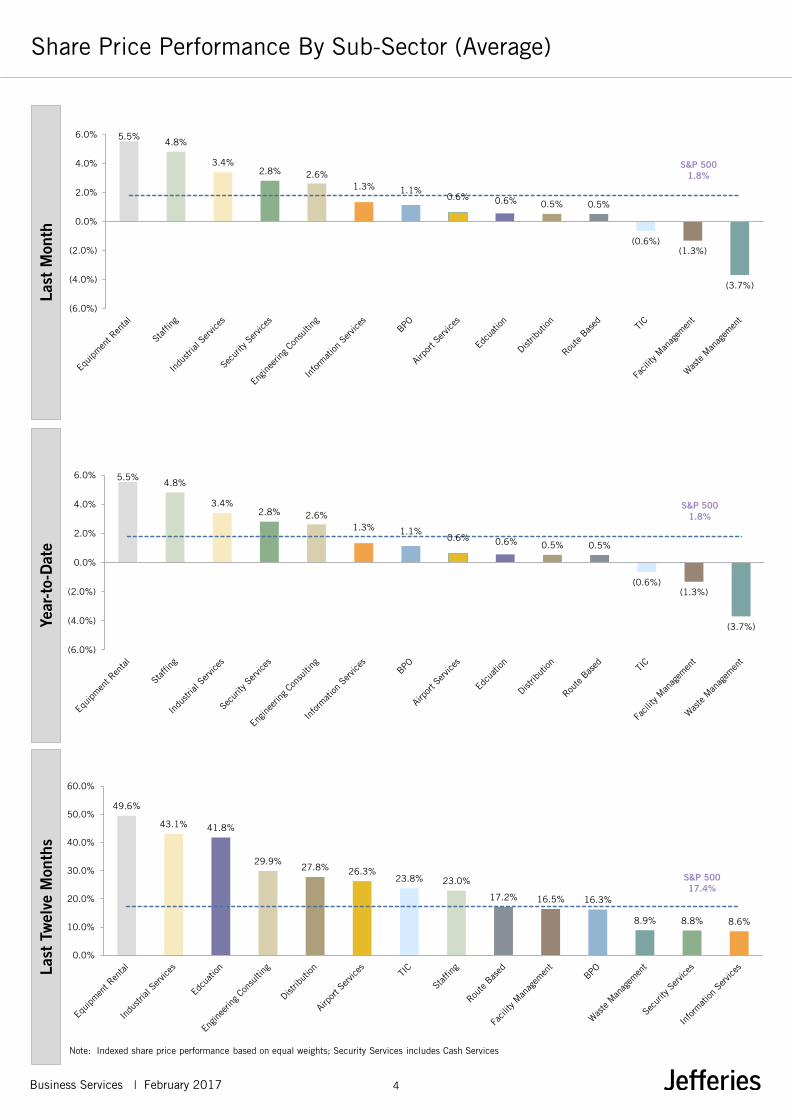
Edcuation 0.0% 0.0% 58.1%
Equipment Rental 5.5% 5.5% 49.6%
Industrial Services 3.4% 3.4% 43.1%
Engineering Consulting 2.6% 2.6% 29.9%
Distribution 0.5% 0.5% 27.8%
Airport Services 0.6% 0.6% 26.3%
TIC (0.6%) (0.6%) 23.8%
Staffing 4.8% 4.8% 23.0%
Route Based 0.5% 0.5% 17.2%
Facility Management (1.3%) (1.3%) 16.5%
BPO 1.1% 1.1% 16.3%
Waste Management (3.7%) (3.7%) 8.9%
Security Services 2.8% 2.8% 8.8%
Information Services 1.3% 1.3% 8.6%
Business Services | February 2017 4
Share Price Performance By Sub-Sector (Average)
Note: Indexed share price performance based on equal weights; Security Services includes Cash Services
Last
Mon
th
Year
-to-
Dat
e La
st T
wel
ve M
onth
s
5.5%4.8%
3.4%2.8% 2.6%
1.3% 1.1%0.6% 0.6% 0.5% 0.5%
(0.6%)(1.3%)
(3.7%)
S&P 5001.8%
(6.0%)
(4.0%)
(2.0%)
0.0%
2.0%
4.0%
6.0%
5.5%4.8%
3.4%2.8% 2.6%
1.3% 1.1%0.6% 0.6% 0.5% 0.5%
(0.6%)(1.3%)
(3.7%)
S&P 5001.8%
(6.0%)
(4.0%)
(2.0%)
0.0%
2.0%
4.0%
6.0%
49.6%
43.1% 41.8%
29.9%27.8% 26.3%
23.8% 23.0%
17.2% 16.5% 16.3%
8.9% 8.8% 8.6%
S&P 50017.4%
0.0%
10.0%
20.0%
30.0%
40.0%
50.0%
60.0%
Business Services | February 2017 5
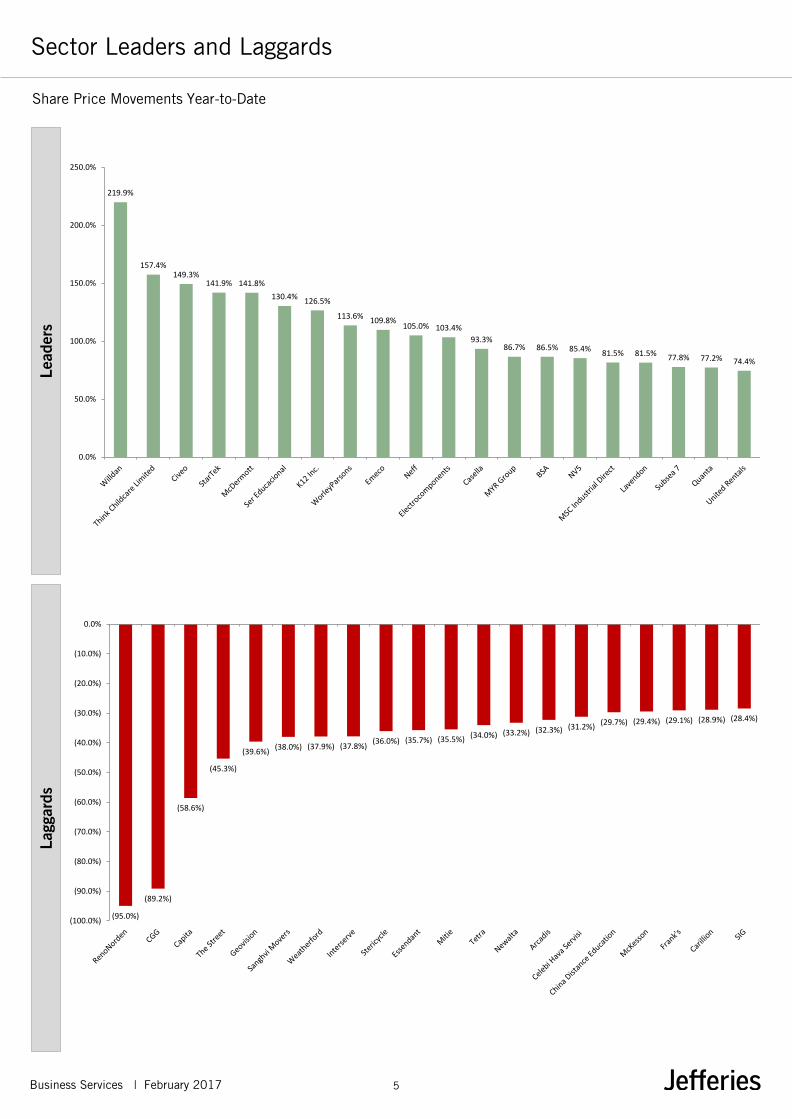
Share Price Movements Year-to-Date
Sector Leaders and Laggards Le
ader
s La
ggar
ds
219.9%
157.4%149.3%
141.9% 141.8%
130.4%126.5%
113.6%109.8%
105.0% 103.4%
93.3%86.7% 86.5% 85.4%
81.5% 81.5% 77.8% 77.2% 74.4%
0.0%
50.0%
100.0%
150.0%
200.0%
250.0%
(95.0%)
(89.2%)
(58.6%)
(45.3%)
(39.6%)(38.0%) (37.9%) (37.8%)
(36.0%) (35.7%) (35.5%) (34.0%) (33.2%) (32.3%) (31.2%)(29.7%) (29.4%) (29.1%) (28.9%) (28.4%)
(100.0%)
(90.0%)
(80.0%)
(70.0%)
(60.0%)
(50.0%)
(40.0%)
(30.0%)
(20.0%)
(10.0%)
0.0%
Business Services | February 2017 6
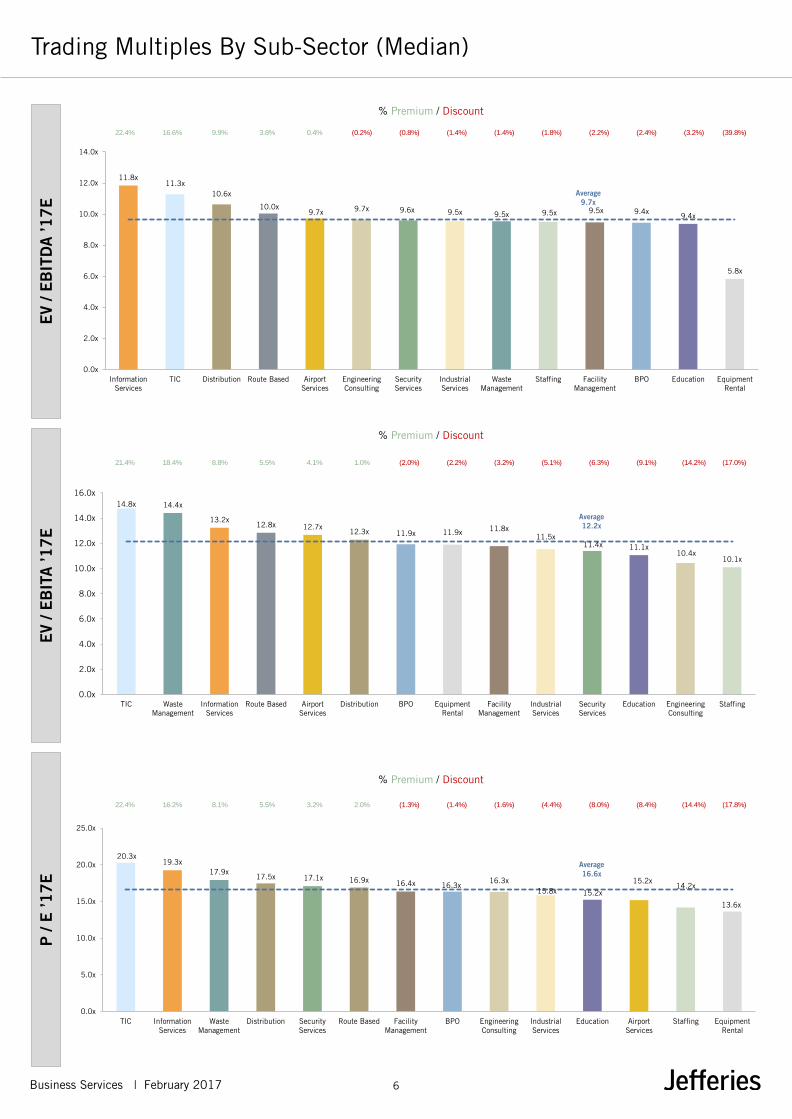
Trading Multiples By Sub-Sector (Median) E
V / E
BIT
DA
’17
E
EV
/ EB
ITA
’17
E
P /
E ’1
7E
% Premium / Discount
% Premium / Discount
% Premium / Discount
11.8x11.3x
10.6x
10.0x9.7x 9.7x 9.6x 9.5x 9.5x 9.5x 9.5x 9.4x
9.4x
5.8x
Average9.7x
0.0x
2.0x
4.0x
6.0x
8.0x
10.0x
12.0x
14.0x
InformationServices
TIC Distribution Route Based AirportServices
EngineeringConsulting
SecurityServices
IndustrialServices
WasteManagement
Staffing FacilityManagement
BPO Education EquipmentRental
22.4% 16.6% 9.9% 3.8% 0.4% (0.2%) (0.8%) (1.4%) (1.4%) (1.8%) (2.2%) (2.4%) (3.2%) (39.8%)
14.8x 14.4x
13.2x12.8x 12.7x
12.3x 11.9x 11.9x 11.8x11.5x
11.4x 11.1x10.4x
10.1x
Average12.2x
0.0x
2.0x
4.0x
6.0x
8.0x
10.0x
12.0x
14.0x
16.0x
TIC WasteManagement
InformationServices
Route Based AirportServices
Distribution BPO EquipmentRental
FacilityManagement
IndustrialServices
SecurityServices
Education EngineeringConsulting
Staffing
21.4% 18.4% 8.8% 5.5% 4.1% 1.0% (2.0%) (2.2%) (3.2%) (5.1%) (6.3%) (9.1%) (14.2%) (17.0%)
20.3x19.3x
17.9x17.5x 17.1x 16.9x 16.4x 16.3x
16.3x15.8x 15.2x
15.2x14.2x
13.6x
Average16.6x
0.0x
5.0x
10.0x
15.0x
20.0x
25.0x
TIC InformationServices
WasteManagement
Distribution SecurityServices
Route Based FacilityManagement
BPO EngineeringConsulting
IndustrialServices
Education AirportServices
Staffing EquipmentRental
22.4% 16.2% 8.1% 5.5% 3.2% 2.0% (1.3%) (1.4%) (1.6%) (4.4%) (8.0%) (8.4%) (14.4%) (17.8%)

Business Services | February 2017 7
Trading Multiples Through Time By Sub-sector (Median) E
V / N
TM E
BIT
DA
E
V / N
TM E
BIT
A
P /
NTM
E
% Premium / Discount
% Premium / Discount
% Premium / Discount
25.6% 17.2% 10.3% 24.8% 30.9% 17.8% 29.1% 32.1% 29.3% 30.7% 14.0% 14.0% 32.1% 20.6%
24.6% 15.8% 15.8% 18.5% 18.5% 18.3% 27.0% 25.9% 14.3% 8.6% 21.3% 5.5% 12.1% 30.7%
20.9x
19.3x 19.3x
17.2x 17.0x 16.9x 16.8x 16.8x 16.8x16.3x 16.1x 15.6x 14.5x
13.9x
18.8x
15.7x15.7x
14.2x12.9x
15.9x
14.7x14.2x
15.6x
13.6x 13.7x14.8x 15.1x
11.5x
0.0x
5.0x
10.0x
15.0x
20.0x
25.0x
TIC Education InformationServices
Distribution EngineeringConsulting
WasteManagement
SecurityServices
FacilityManagement
Route Based AirportServices
IndustrialServices
BPO Staffing EquipmentRental
Current 10 Year Median
13.5x
12.5x11.3x 10.7x
10.4x 9.9x 9.9x 9.8x 9.7x 9.7x 9.6x 9.5x 9.1x
5.9x
10.8x 10.7x10.2x
8.6x8.0x 8.4x
7.7x 7.4x 7.5x 7.4x8.4x 8.3x
6.9x
4.9x
0.0x
2.0x
4.0x
6.0x
8.0x
10.0x
12.0x
14.0x
16.0x
InformationServices
Education TIC Distribution AirportServices
BPO WasteManagement
EngineeringConsulting
Route Based FacilityManagement
Staffing SecurityServices
IndustrialServices
EquipmentRental
Current 10 Year Median
15.0x 14.7x13.9x 12.9x
12.6x 12.4x 12.1x 12.1x 11.8x 11.4x 11.3x 11.0x10.4x 10.3x12.1x
12.7x
11.7x 11.5x10.7x 9.8x 9.6x 9.3x 10.3x
10.5x
9.0x
10.2x
8.6x
9.8x
0.0x
2.0x
4.0x
6.0x
8.0x
10.0x
12.0x
14.0x
16.0x
WasteManagement
TIC InformationServices
Route Based AirportServices
Distribution EquipmentRental
FacilityManagement
BPO SecurityServices
IndustrialServices
Education EngineeringConsulting
Staffing
Current 10 Year Median
24.6% 15.8% 18.5% 12.2% 18.3% 27.0% 25.9% 29.3% 14.3% 8.6% 24.8% 7.6% 21.3% 5.5%

Business Services | February 2017 8
Operating Metrics Through Time By Sub-sector (Median) N
et D
ebt
/ LTM
EB
ITD
A
LTM
RO
CE
FC
F C
onve
rsio
n N
TM (1
)
(1) FCF equals EBITDA minus CapEx
% Premium / Discount
% Premium / Discount
% Premium / Discount
30.2%
16.0% 15.0% 14.1% 13.8% 13.4% 12.2% 11.9% 11.0%10.9%
10.5%7.6% 6.4% 4.8%
14.4%
16.9%
12.2%
13.1%
18.2%
12.8%
12.4%
10.8% 11.2% 10.6%
12.4%
8.3%
11.8%
7.0%
0.0%
5.0%
10.0%
15.0%
20.0%
25.0%
30.0%
35.0%
Staffing TIC SecurityServices
BPO InformationServices
Education Distribution Route Based FacilityManagement
AirportServices
EngineeringConsulting
EquipmentRental
IndustrialServices
WasteManagement
Current 10 Year Median
3.8x
2.3x 2.1x 1.8x 2.0x 1.8x 1.6x 1.5x1.3x 1.4x
1.3x
0.8x
0.3x
(0.2x)
3.1x
1.2x
1.5x
1.9x
1.0x1.2x 1.3x
0.2x
1.3x
1.0x
1.3x
0.6x0.4x
(0.1x)
(0.5x)
-
0.5x
1.0x
1.5x
2.0x
2.5x
3.0x
3.5x
4.0x
WasteManagement
InformationServices
AirportServices
EquipmentRental
TIC Distribution FacilityManagement
IndustrialServices
SecurityServices
Education Route Based EngineeringConsulting
BPO Staffing
Current 10 Year Median
24.1% 93.6% 36.0% 6.5% 95.3% 42.8% 22.0% 574.1% 14.3% 40.4% 0.1% 106.9% 173.0% 84.6%
(2.1%) 0.3% (1.0%) (0.2%) (2.9%) 2.4% (0.8%) 2.7% (3.4%) 3.8% (2.9%) (3.1%) 0.1% 7.4%
110.6% (5.3%) 22.9% 7.8% (23.8%) 5.3% (1.4%) 10.0% (1.5%) 3.0% (15.1%) (8.2%) (45.8%) (30.6%)
88.6% 88.5% 86.1% 86.0% 84.6% 80.9% 80.5% 77.2% 75.4% 71.1% 71.0% 71.0%
56.3%47.4%
90.6%88.3% 87.0% 86.2%
87.1%79.0%
81.1%
75.2%
78.1%
68.6%
73.1%73.2%
56.2%
44.2%
0.0%
20.0%
40.0%
60.0%
80.0%
100.0%
InformationServices
Staffing Education EngineeringConsulting
Distribution SecurityServices
BPO TIC FacilityManagement
IndustrialServices
Route Based AirportServices
WasteManagement
EquipmentRental
Current 10 Year Median

Business Services | February 2017 9
Trading Comparables
Recent IPO Activity In Business Services
Size Share Price Operational KPIs Trading Multiples
Listing IPO Free Float Mkt. Cap EV Share Price % Change Rev. CAGR '16E Margins FCF Net Debt / EV / EBITDA EV / EBITA EV / EBITDA - Capex P / E
€m, unless specified Country Date % LCY Since IPO '15A-'17E EBITDA EBITA '16E LTM EBITDA '16E '17E '16E '17E '16E '17E '16E '17E
Recent IPO
Laureate Education United States 01 Feb 17 n/a 2,208 4,001 $ 13.25 (5.4%) n/a n/a n/a n/a n/a n/m n/m n/m n/m n/a n/a n/a n/a
Biffa United Kingdom 14 Oct 16 n/a 552 1,178 € 1.9 5.6% 4.2% 27.7% 18.9% 63.1% 2.7x 10.8x 10.3x 15.9x 15.0x 16.9x 16.2x 26.0x 22.0x
New Trend Logistics China 04 Aug 16 n/a 657 657 CNY 58.08 255.9% 11.4% 15.1% 14.1% 66.9% 0.0x n/m n/m n/m n/m n/m n/a n/m n/m
Quess India 04 Jul 16 n/a 1,177 1,177 INR 676.1 113.3% 36.3% 5.3% 4.7% 86.6% 0.0x n/m 24.5x n/m 27.1x n/m n/m n/m n/m
AcadeMedia Sweden 15 Jun 16 33.4% 536 779 SEK 53.75 34.4% 6.4% 8.9% 6.9% 65.9% 3.0x 9.2x 8.3x 12.0x 10.5x 14.0x 11.5x 12.9x 10.2x
Resurs Holding Sweden 29 Apr 16 16.8% 1,280 1,281 SEK 60.45 9.9% 25.0% n/a n/a n/a n/a n/m n/m n/m n/m n/a n/a 13.4x 11.8x
Global Dominion Access Spain 26 Apr 16 37.6% 531 428 € 3.16 15.3% 17.6% 7.4% 6.3% 73.9% (2.8x) 9.4x 7.2x 11.0x 8.9x 12.8x 12.7x 24.7x 19.0x
Yintech Investment Holdings USA 26 Apr 16 25.7% 1,094 955 $ 17.29 28.1% 401.9% n/a n/a n/a n/a n/m n/m n/m n/m n/a n/a 1.3x 1.0x
Team Lease India 05 Feb 16 41.0% 211 211 Rs 899 11.5% 24.1% 1.4% 1.2% n/m 0.0x n/m 23.5x n/m n/m n/m n/m n/m 28.9x
Virscend Education Co Ltd Hong Kong 08 Jan 16 44.1% 1,679 1,759 HK$ 4.55 89.6% 15.6% 47.8% 42.5% 21.1% 1.8x n/m 28.1x n/m n/m n/m n/m n/m 33.4x
World-Link Logistics Hong Kong 28 Dec 15 n/a 120 116 HK$ 2.1 320.0% n/a 20.6% 19.2% n/a (2.2x) n/a n/a n/a n/a n/a n/a n/m n/a
China Customer Relations Centers US 18 Dec 15 n/a 302 292 $ 17.77 344.3% n/a n/a n/a n/a n/a n/a n/a n/a n/a n/a n/a n/a n/a
MegaMD Korea 09 Dec 15 n/a 123 111 KRW 6830 127.7% n/a n/a n/a n/a n/a n/a n/a n/a n/a n/a n/a n/a n/a
Openjobmetis Italy 01 Dec 15 42.0% 86 121 € 6.26 (5.2%) 5.9% 3.8% 3.3% 94.1% 2.4x n/a n/a n/a n/a 7.5x 6.5x 9.5x 8.0x
Equiniti UK 27 Oct 15 n/a 655 997 188p 13.9% 4.9% 23.4% 22.5% 76.1% 3.7x 9.4x 9.0x 9.8x 9.3x 12.4x 11.8x 12.8x 11.7x
Bravida Sweden 17 Oct 15 n/a 1,234 1,517 SEK 57.85 44.6% 4.8% 6.6% 6.4% 98.1% 3.3x 14.8x 13.6x 15.2x 13.7x 15.0x 13.9x 17.3x 15.4x
Intertrust Netherlands 15 Oct 15 75.0% 1,587 2,320 € 17.26 11.4% 16.8% 39.7% 28.7% 94.3% 5.1x 15.2x 11.3x 21.0x 12.0x 16.1x 11.8x 30.5x 11.6x
Coor Sweden 16 Jun 15 98.9% 558 645 SEK 55 44.7% 4.3% 6.1% 5.5% 84.1% 2.3x 13.1x 11.5x 14.6x 12.7x 15.6x 12.7x n/m 14.5x
Spie France 09 Jun 15 n/a 3,236 4,742 € 21 27.3% 8.9% 7.5% 7.3% 92.1% 3.6x 12.3x 9.8x 12.5x 10.0x 13.3x 10.7x 17.8x 14.2x
HSS Hire UK 04 Jun 15 17.4% 128 398 £ 0.71 (66.2%) 7.6% 21.1% 6.2% 41.9% 4.0x 4.7x 4.3x 16.1x 12.9x 11.3x 8.7x 21.3x 10.1x
Zhejiang CSS&T China 18 May 15 50.8% 1,051 1,011 CNY 19.25 134.2% 13.9% n/a n/a n/a n/a n/m n/m n/m n/m n/a n/a n/a n/a
BCA Marketplace UK 02 Apr 15 97.6% 1,706 2,098 188p 25.3% 78.1% 6.5% 6.2% 69.1% n/a 18.3x 12.9x 19.3x 13.4x n/m 16.8x 30.5x 18.9x
Sanne UK 27 Mar 15 88.7% 1,001 1,005 £ 6.22 211.0% 52.9% 38.5% 36.8% 95.7% 0.2x n/m 20.5x n/m 23.7x n/m 21.4x n/m 25.9x
Elis France 10 Feb 15 75.5% 1,890 3,486 € 16.59 27.6% 11.3% 30.9% 17.1% 41.9% 3.4x 7.5x 6.4x 13.5x 11.6x 17.9x 14.8x 17.3x 12.6x
PTSG UK 10 Feb 15 30.0% 90 104 87p 67.3% 26.5% 24.2% 22.4% 93.2% 1.8x 10.0x 8.9x 10.8x 9.7x 10.8x 10.0x 12.9x 11.4x
RenoNorden Norway 12 Dec 14 57.0% 5 143 NOK 1.73 (96.3%) 4.1% 3.9% (5.4%) 45.3% 4.2x 17.0x 4.9x n/m 16.1x n/m n/m n/m 1.1x
TechnoPro Japan 04 Dec 14 51.7% 1,095 1,156 ¥ 3895 99.7% 10.1% 9.8% 9.5% 96.5% 0.4x 15.0x 13.3x 15.6x 13.6x 15.6x 13.8x n/a n/a
NEFF US 21 Nov 14 92.0% 130 690 $ 15.7 4.7% 3.0% 47.9% 23.4% 34.5% 7.0x 3.9x 3.9x 8.0x 7.8x 11.3x n/a 13.1x 10.1x
Recruit Japan 06 Oct 14 65.7% 22,636 22,132 ¥ 4945 59.5% 16.6% 12.4% 6.8% 83.3% (0.5x) 12.2x 10.9x 22.3x 19.1x 14.6x 13.6x n/a n/a
Atento US 01 Oct 14 14.2% 622 1,026 $ 9.1 (39.3%) (2.8%) 12.1% 9.1% 65.1% 1.9x 5.1x 4.9x 6.8x 6.2x 7.8x 8.7x 14.0x 10.8x
SSP UK 10 Jul 14 97.5% 2,162 2,590 £ 3.91 86.2% 9.6% 10.0% 6.2% 50.4% 1.9x 10.9x 9.5x 17.5x 15.0x 21.7x 18.2x 24.8x 21.6x
Worldline France 26 Jun 14 29.5% 3,301 3,033 € 24.98 52.3% 14.5% 16.5% 14.8% 60.6% (1.9x) 14.0x 9.4x 15.6x 11.6x 23.2x 13.3x 22.9x 22.2x
ServiceMaster US 25 Jun 14 88.2% 4,618 6,949 $ 36.98 117.5% 5.7% 23.6% 21.4% 91.3% 4.3x 11.6x 10.6x 12.8x 11.3x 12.7x 11.5x 32.2x 16.6x
Zalaris Norway 20 Jun 14 78.7% 72 68 NOK 33.6 46.1% 9.1% 12.4% 12.0% 71.4% (1.1x) 12.2x 8.3x 12.7x 8.8x 17.1x 9.7x 24.6x 19.1x
Elior France 11 Jun 14 67.3% 3,576 5,429 € 20.7 40.3% 5.2% 8.5% 6.3% 59.9% 3.6x 10.7x 9.7x 14.4x 13.1x 17.8x 16.4x 23.1x 16.4x
Spotless Australia 21 May 14 99.0% 725 1,318 A$ 0.94 (41.3%) 3.1% 9.6% 6.8% 57.2% 2.8x 6.2x 5.9x 8.7x 8.9x 10.8x 9.6x 9.2x 9.7x
Baguio Green Hong Kong 12 May 14 20.6% 49 60 HK$ 0.99 (17.5%) n/a n/a n/a n/a n/a n/m n/m n/m n/m n/a n/a n/a n/a
Applus Spain 08 May 14 85.1% 1,371 2,001 € 10.57 (27.1%) (2.9%) 10.8% 8.5% 68.8% 3.1x 11.6x 10.4x 14.8x 11.6x 16.9x 13.9x n/m 15.9x
Exova UK 11 Apr 14 38.7% 566 767 £ 1.94 (11.8%) 7.9% 19.4% 15.1% 72.8% 2.6x 10.3x 9.6x 13.3x 11.9x 14.2x 13.6x 18.6x 14.8x
TriNet US 26 Mar 14 44.2% 1,622 1,877 25.43p 58.9% 13.6% 5.0% 4.6% 74.1% 2.2x 13.2x 10.1x 14.5x 11.8x 17.9x 12.0x 28.5x 17.9x
ISS Denmark 13 Mar 14 84.8% 6,040 7,748 DKK 244.7 52.9% 0.7% 6.4% 5.7% 82.7% 2.2x 11.4x 10.8x 12.8x 11.5x 13.8x 12.8x 20.3x 15.4x
Median 40.3% 9.6% 10.8% 7.3% 72.8% 2.3x 11.5x 9.8x 13.5x 11.7x 14.2x 12.7x 18.2x 14.7x
Mean 58.2% 24.9% 15.9% 12.2% 71.3% 1.9x 11.1x 11.1x 13.8x 12.6x 14.5x 12.7x 18.9x 15.0x

Business Services | February 2017 10
NOK47€14.5
A$1.6
$15
$15
HK$1.2
£2.2
¥3100
16p NOK23
€14.8£2.1
DKK160
€16.4
¥1950
$17
Share Price Performance Since IPO
Recent IPO Activity In Business Services IP
Os
(Sin
ce J
anua
ry 2
01
5)
IPO
s (2
01
4)
Min
Max
IPO Issue Price % Change since IPO Filing Range
NOK 49 € 16.25 A$ 1.85 $ 22 $ 22 HK$ 1.2 £ 2.6 ¥ 3100 17p NOK 26 € 17.5 £ 2.3 DKK 175 € 20 ¥ 1950 $ 21
NOK 43 € 13.25 A$ 1.6 $ 19 $ 20 HK$ 0.8 £ 2.1 ¥ 2800 15p NOK 20 € 14.35 £ 2.1 DKK 140 € 16.4 ¥ 1800 $ 18
(57.9%)
(38.4%) (38.1%) (38.1%) (36.9%)(29.2%)
(9.1%)
25.2% 29.3% 32.6%40.4%
52.4%
70.6% 71.6%76.9%
103.1%
100%£2.1
$14
€6.6
€1.8
SEK55
€15.5
Rs806
165p
€2.7150p
$13.5SEK38
Rs806
52p 52p
CNY8.2
SEK40 INR317HK$2.4
CNY16.3
$4 HK$0.5 CNY16.3
-
(66.2%)
(5.4%)(5.2%)
5.6% 9.9%11.4%
11.5%
13.9%15.3%
25.3%27.3%
27.6%
28.1%
34.4%44.6%
44.7%67.3%
89.6%
113.3%127.7%
134.2%211.0%
255.9%
320.0%344.3%
£ 2.1 $ 20 € 6 € 2.2 SEK 50 € 14.5 Rs 850 165p € 2.6 n/a € 14.5 € 12 $ 10 SEK 40 SEK 36 SEK 32 n/a HK$ 2.92 INR 310 KRW 3600 n/a n/a CNY 16.32
£ 2.62 $ 17 € 7 € 2.7 SEK 60 € 19 Rs 785 200p € 3.2 n/a € 17.5 € 19 $ 12 SEK 40 SEK 44 SEK 39 n/a HK$ 2.18 INR 317 KRW 4600 n/a n/a CNY 16.32

Business Services | February 2017 11
Loan
Recent Financing Activity
High Yield
@ Issue Current Rating
Date Company Industry Sponsor Amount (€m) Coupon Issuance Maturity Price Yield Price (%) YTW (%) Moody's S&P
Feb-17 Gategroup Business Services Not Sponsored 281 3.000% Sr. Notes 28-Feb-22 100.000 3.000% 100.430 2.906 B1 B+
Sep-16 Cognita Education Not Sponsored 52 7.750% Sr. Sec. Notes (Tack-On) 15-Aug-21 104.500 6.020% 105.266 4.719 B2 B
Sep-16 Hertz Equipment Rental Not Sponsored 225 4.125% Sr. Notes 01-Oct-21 100.000 4.125% 99.702 4.194 B2 B
Apr-16 Loxam Business Services Not Sponsored 250 3.500% Sr. Sec. Notes 21-Apr-16 100.000 3.500% 98.761 3.725 NR BB-
Mar-16 Leaseplan Fleet Management TDR Capital 1250 6.875% Sr. Sec. Notes 15-Apr-21 100.000 6.875% 107.988 2.784 B1 B
Mar-16 Leaseplan Fleet Management TDR Capital 358 7.375% Sr. Sec. Notes 15-Apr-21 100.000 7.375% 106.750 4.472 Ba1 BB-
Feb-16 WFS Global Holding Logistics Platinum Equity 100 9.500% Sr. Sec. Notes (Tack-On) 15-Jul-22 101.000 9.290% 104.034 8.120 B2 B
Feb-16 WFS Global Holding Logistics Platinum Equity 140 12.50% Sr. Notes 30-Dec-22 98.000 12.940% 97.150 13.217 Caa1 CCC+
Jan-16 Atalian Business Services Not Sponsored 125 7.250% Sr. Notes (Tack-On) 15-Jan-20 104.750 5.896% 104.455 -2.579 B2 B
Dec-15 Swissport Airport Services HNA Group 400 6.750% Sr. Sec. Notes 15-Dec-21 100.000 6.750% 109.033 3.421 B1 B
Dec-15 Swissport Airport Services HNA Group 290 9.750% Sr. Notes 15-Dec-22 100.000 9.750% 109.683 7.330 Caa1 CCC+
Nov-15 Alliance Data Systems Business Services Not Sponsored 300 5.250% Sr. Notes 15-Nov-23 100.000 5.250% 103.292 4.471 NR NR
Oct-15 Verisure Security Services H&F 700 6.000% Sr. Sec. Notes 01-Nov-22 100.000 6.000% 108.918 2.376 B1 B
Sep-15 Lindorff Business Services Nordic Capital 200 E+550 Sr. Sec. FRNs (Tack-On) 15-Aug-20 99.500 5.581% 98.231 5.985 Ba2 BB-
Sep-14 Iron Mountain Business Services Not Sponsored 502 6.125% Sr. Notes 15-Sep-22 100.000 6.125% 106.095 3.345 Ba1 B+
Jul-14 TMF Group Business Services Doughty Hanson 45 E+537.5 Sr. Sec. FRNs (Tack On) 01-Dec-18 101.000 N/A Called Called B1 B
Jul-14 TMF Group Business Services Doughty Hanson 20 9.875% Sr. Notes (Tack On) 01-Dec-19 108.750 7.837% Called Called Caa1 CCC+
Jul-14 IMO Car Wash Business Services TDR Capital 240 6.625% Sr. Sec. Notes 15-Jul-19 100.000 6.625% 95.125 8.196 B2 B+
Jun-14 Selecta Business Services Allianz 350 6.500% Sr. Sec. Notes 15-Jun-20 100.000 6.500% 91.750 9.436 B2 B+
Jun-14 Selecta Business Services Allianz 201 6.500% Sr. Sec. Notes 15-Jun-20 100.000 6.500% 80.000 13.186 B2 B+
Jan-14 HSS Hire Services & Leasing Exponent 242 6.750% Sr. Sec. Notes 01-Aug-19 100.000 6.750% 101.433 5.199 B2 B
Jul-13 Manutencoop Business Services Not Sponsored 425 8.500% Sr. Sec. Notes 01-Aug-20 98.713 8.750% 84.289 13.679 B2 B+
Jun-13 Equiniti Business Services Advent 222 L+575 Sr. Sec. FRNs 15-Dec-18 100.000 N/A Called Called B3 B
Jun-13 Equiniti Business Services Advent 293 7.125% Sr. Sec. Notes 15-Dec-18 100.000 7.125% Called Called B3 B
May-13 Elis Business Services Eurazeo 450 6.000% Sr. Sec. Notes 24-May-18 100.000 6.000% Called Called B1 B+
Apr-13 Elior Business Services Charterhouse 350 6.500% Sr. Sec. Notes 01-May-20 100.000 6.500% Called Called B3 BB-
Launch Issuer Industry Type Maturity Size (€m) Leverage Pricing
Marketing Apcoa Car Park Operator TLB TBD TBD TBD TBD
Feb-17 Global Blue Payment Process. Sys. TLB Dec-22 630 n/a L+350
Feb-17 Bureau van Dijk Information Services TLB Feb-21 465 5.60x E+350
Feb-17 Bureau van Dijk Information Services TLB Feb-21 $123 5.60x L+325
Feb-17 Genesys Business Services TLB Dec-23 527 n/a E+400
Dec-16 MSX International Business Services TLB Dec-23 323 n/a E+550
Dec-16 Verisure Security Services TLB Dec-22 1375 n/a E+325
Nov-16 Galileo Global Education TL Nov-22 230 n/a E+425
Nov-16 P&I Personal & Infomatik Business Services First Lien TL Nov-23 305 7.00x E+425
Oct-16 Vistra BPO TLB Oct-22 389 n/a E+300
Oct-16 Infinitas Learning Education TLB Oct-23 380 3.60x E+475
Oct-16 Element TIC TLB Oct-22 193 5.20x E+475
Sep-16 TMF BPO TLB Sep-23 660 n/a E+400
Feb-17 Bureau van Dijk Information Services TLB Jul-21 150 n/a E+400
Jul-16 Trigo Inspection Services TLB Jul-23 118 4.25x E+475
Jun-16 Verisure Security Services TLB Jun-22 1,020 n/a E+350
Apr-16 Schenck Technologies Business Services TLB Apr-22 310 3.50x E+550
Apr-16 Diebold Security Services TLB Apr-23 879 4.00x L+450
Apr-16 Diebold Security Services TLB Apr-23 352 4.00x E+450
Mar-16 Betafence Security Services TLB Mar-23 250 3.80x E+475
Feb-16 Solera Data Processing Serv. TLB TBD 950 6.80x E+450-475
Feb-16 Element Materials TIC TLB TBD 147 5.46x E+475
Jan-16 Vermaat Restaurants & Catering TLB TBD 188 n/a n/a
Dec-15 CPA Global BPO TLB Dec-20 52 n/a E+375
Nov-15 Swissport Airport Services TLB Dec-21 660 5.99x E+525
Oct-15 Verisure Security Services TLB Oct-22 1,020 6.80x E+425
Jul-15 Vistra BPO 1st Lien / 2nd Lien Jul-22 / Jul-23 680 n/a n/a
May-15 EEW Energy from Waste Waste Management TLB-2 May-22 90 n/a E+325

Business Services | February 2017 12
Selection Criteria: EV less than €5bn Total Points Awarded greater than 10
Scoring System:
Share Price 3Y Peak to Present (0 points if < 25%; 1 point if <30%; 2 points if < 50%; 3 points if > 50%) Net Debt / LTM EBITDA (0 points if < 0.0x, 1 point if < 1.0x; 2 points if < 2.0x; 3 points if > 2.0x) Net Cash / LTM EBITDA (0 points if < 0.0x, -1 point if < 0.5x; -2 points if < 1.0x; -4 points if > 1.0x) CY15A-17E EBIT CAGR (0 points if < 0%, 2 points if < 10%; 4 points if < 20%; 6 points if > 20%) Discount to Current Sector EV / NTM EBITA (0 points if < 0%, 2 points if < 10%; 4 points if < 20%; 6 points if > 20%) Discount to 10Y Median Company EV / NTM EBITA (0 points if < 0%, 2 points if < 10%; 4 points if < 20%; 6 points if > 20%)
P2P Scanner
Rest of the World
North America
Company Country IndustryTotal Points
Awarded
Enterprise Value ($m)
(31/01/17)
Share Price 3Y Peak to Present Decrease (%)
Net Debt / LTM EBITDA
(x)
CY16A-CY18E EBIT CAGR (%)
Premium / (Discount) to Current Sector EV /
NTM EBITA (%)
EV / NTM EBITA (x)
10Y EV / NTM EBITA
(x)
Premium / (Discount) to 10Y Median Company EV
/ NTM EBITA (%)
Bankrate United States Information Services 19 1,142 (44%) 1.7x 12% (15%) 10.1x 11.9x (16%)
Brink's United States Security Services 14 2,539 (1%) 1.0x 16% 16% 11.1x 10.5x 5%
Builders FirstSource United States Distribution 14 3,123 (35%) 4.7x 13% (5%) 10.1x 11.0x (8%)
Avigilon Canada Security Services 12 541 (56%) 1.6x 38% 72% 16.5x 12.4x 34%
Athenahealth United States BPO 11 5,133 (38%) 1.3x 78% N/A n/a 32.2x n/a
Neff United States Equipment Rental 11 826 (2%) 7.3x 5% 34% 7.8x 6.6x 18%
Essendant United States Distribution 10 1,370 (51%) 3.3x 2% (5%) 10.1x 8.6x 17%
KBR United States Industrial Services 10 2,543 (37%) 6.3x (341%) (5%) 9.0x 5.9x 54%
Company Country IndustryTotal Points
Awarded
Enterprise Value ($m)
(31/01/17)
Share Price 3Y Peak to Present Decrease (%)
Net Debt / LTM EBITDA
(x)
CY16A-CY18E EBIT CAGR (%)
Premium / (Discount) to Current Sector EV /
NTM EBITA (%)
EV / NTM EBITA (x)
10Y EV / NTM EBITA
(x)
Premium / (Discount) to 10Y Median Company EV
/ NTM EBITA (%)
Spotless Australia Route Based 20 1,381 (58%) 3.1x 5% (14%) 8.6x 10.9x (21%)
MetCash Australia Distribution 19 1,729 (30%) 1.1x 29% (30%) 7.4x 8.4x (11%)
Cardno Australia Engineering Consulting 11 450 (74%) (0.5x) (195%) n/a n/a 8.6x n/a
WorleyParsons Australia Engineering Consulting 11 2,515 (43%) 6.0x 34% 17% 11.3x 10.4x 9%
Company Country IndustryTotal Points
Awarded
Enterprise Value ($m)
(31/01/17)
Share Price 3Y Peak to Present Decrease (%)
Net Debt / LTM EBITDA
(x)
CY16A-CY18E EBIT CAGR (%)
Premium / (Discount) to Current Sector EV /
NTM EBITA (%)
EV / NTM EBITA (x)
10Y EV / NTM EBITA
(x)
Premium / (Discount) to 10Y Median Company EV
/ NTM EBITA (%)
Carillion United Kingdom Facility Management 20 1,531 (33%) 1.2x 22% (44%) 5.3x 7.4x (28%)
Celebi Hava Servisi Turkey Airport Services 19 227 (33%) 2.4x 31% (25%) 7.3x 7.5x (3%)
Interserve United Kingdom Facility Management 18 992 (51%) 1.5x (5%) n/a n/a 5.7x n/a
Applus Spain TIC 18 2,166 (35%) 3.5x 26% 28% 14.4x 10.5x 37%
Opus Sweden TIC 17 325 (44%) 2.1x 13% 40% 15.8x 10.3x 54%
Cape UK Industrial Services 17 408 (36%) 2.3x 24% (37%) 6.0x 7.5x (19%)
John Menzies United Kingdom Airport Services 16 748 6% 2.1x 40% (10%) 8.7x 7.8x 11%
SIG United Kingdom Distribution 16 1,098 (48%) 2.6x 9% (13%) 9.3x 9.5x (2%)
Amec Foster United Kingdom Industrial Services 16 3,450 (60%) 3.3x 15% (10%) 8.6x 9.1x (5%)
Rejlers Sweden Engineering Consulting 15 136 (26%) 3.1x 74% (12%) 8.5x 8.4x 2%
Semcon Sweden Engineering Consulting 14 102 (28%) 0.9x 10% (26%) 7.2x 7.1x 2%
WYG United Kingdom Engineering Consulting 14 118 (8%) 1.0x 114% (20%) 8.5x 8.6x (2%)
Berendsen United Kingdom Route Based 12 2,312 (38%) 1.4x 7% 7% 10.8x 9.6x 13%
Gunnebo Sweden Security Services 12 456 (6%) 1.5x 7% (9%) 8.8x 9.6x (8%)
Lavendon United Kingdom Equipment Rental 11 744 (3%) 2.2x 35% 119% 12.8x 9.3x 37%
Mears United Kingdom Facility Management 11 658 1% 0.4x 29% 19% 11.3x 8.0x 40%
Exova United Kingdom TIC 10 799 (21%) 2.3x 6% 7% 12.0x 11.5x 5%
Mitie United Kingdom Facility Management 10 1,197 (33%) 2.2x 1% 15% 10.9x 9.0x 22%
Speedy Hire United Kingdom Equipment Rental 10 431 (35%) 1.5x 28% 209% 18.0x 11.3x 59%
Johnson Service United Kingdom Route Based 10 644 (0%) 1.2x 9% n/a n/a 7.6x n/a

13 Business Services | September 2016
UK Business Services

Business Services | February 2017 14
Trading Comparables
UK Business Services
Size Share Price Operational KPIs Trading Multiples
Industry Mkt. Cap EV Performance Rev. CAGR '16E Margins FCF Net Debt / EV / EBITDA EV / EBITA EV / EBITDA - Capex P / E
£m, unless specified Current YTD LTM '15A-'17E EBITDA EBITA '16E LTM EBITDA '16E '17E '16E '17E '16E '17E '16E '17E
UK Business Services Companies
RELX Group Information Services 28,977 34,249 14.2 9.7% 18.1% 10.9% 30.0% 29.0% 97.5% 2.6x 16.6x 13.1x 17.1x 13.4x 17.0x 15.3x 25.0x 18.2x
Compass Catering 23,211 26,092 14.1 (1.3%) 71.7% 13.7% 9.2% 8.1% 78.9% 1.9x 13.8x 11.8x 15.6x 13.3x 17.5x 17.0x 22.3x 19.3x
Nielsen Holdings Information Services 11,636 17,642 32.6 (2.6%) 19.9% 1.5% 25.7% 22.8% 93.3% 4.8x 13.7x 11.2x 15.4x 13.9x 14.7x 14.4x 29.1x 15.2x
United Utilities Waste Water 6,253 13,303 9.2 2.2% 3.7% 0.8% 56.5% 36.5% 33.4% 7.4x 13.7x 13.1x 21.2x 20.3x n/m n/m 19.2x 20.1x
Severn Trent Waste Water 5,351 10,899 22.7 1.6% 78.6% 1.4% 46.2% 28.5% 42.7% 6.0x 13.1x 12.6x 21.3x 20.8x n/m n/m 20.0x 21.4x
Ashtead Equipment Rental 7,990 10,579 16.1 2.2% 24.8% 18.4% 47.5% 29.3% 47.8% 2.4x 7.6x 6.5x 12.4x 10.7x 16.0x 15.9x 16.6x 14.2x
Bunzl Distribution 6,881 8,210 20.9 8.6% 12.5% 11.5% 7.4% 7.1% 95.4% 2.6x 14.9x 13.7x 15.5x 13.9x 15.6x 14.4x 25.9x 18.8x
Informa plc Information Services 5,369 6,894 6.5 (6.0%) 7.2% 19.9% 32.6% 32.5% 87.7% 4.0x 15.5x 11.8x 15.6x 11.9x 17.7x 13.1x 17.5x 13.7x
Intertek TIC 5,457 6,262 33.9 (6.3%) (2.4%) 13.0% 19.4% 16.3% 76.4% 1.9x 12.6x 11.5x 15.1x 13.7x 16.5x 15.2x 20.8x 18.6x
Pennon Waste Water 3,282 6,280 7.9 1.8% (4.1%) 3.2% 33.5% 20.1% 22.0% 6.6x 13.5x 12.8x 22.5x 20.7x n/m n/m 18.8x 17.7x
G4S Diversified Security Services 3,945 6,127 2.6 (4.4%) (23.5%) 4.2% 8.5% 7.2% 79.6% 3.2x 10.6x 9.5x 12.5x 11.2x 13.3x 11.9x 16.4x 14.2x
Babcock Industrial Services 4,512 6,261 8.9 0.5% 68.7% 14.4% 12.9% 11.9% 76.3% 2.7x 9.9x 9.0x 10.7x 9.5x 13.0x 11.5x 12.1x 10.6x
Capita Diversified BPO 3,330 6,009 5.0 1.7% 131.9% (0.8%) 14.5% 13.8% 74.2% 3.1x 8.6x 8.7x 9.1x 9.2x 11.6x 11.4x 8.1x 8.4x
Rentokil Pest Control 4,172 5,355 2.3 5.5% 15.9% 14.2% 21.9% 13.2% 60.8% 2.9x 11.3x 10.0x 18.7x 15.3x 18.6x 17.3x 24.9x 19.3x
Petrofac Industrial (O&G) 3,120 4,112 9.2 (10.6%) (29.0%) 5.0% 8.8% 6.4% 76.1% 4.2x 7.5x 6.7x 10.2x 9.0x 9.8x 10.4x n/m 9.9x
BBA Aviation Airport Services 2,878 4,018 2.8 0.0% 24.4% 20.3% 16.1% 9.1% 70.7% 5.6x 14.6x 11.0x 25.9x 13.7x 20.6x 14.6x n/m 15.4x
Laureate Education Education 2,208 4,001 0.0 n/a n/an/a n/an/a n/a n/an/a n/an/a n/an/a n/a n/an/a n/a n/an/a n/a n/an/a n/a n/an/a
Aggreko Equipment Rental 2,566 3,250 10.1 (4.3%) 30.3% 4.6% 33.4% 15.8% 48.2% 1.2x 6.1x 5.9x 12.9x 12.5x 12.7x 12.9x 15.9x 16.0x
John Wood Industrial (O&G) 3,118 3,050 8.4 (6.0%) 7.2% 3.1% 7.5% 6.3% 90.6% 0.8x 12.5x 8.9x 14.7x 10.8x 13.8x 11.1x n/m 16.3x
Amec Foster Consulting, EPC, Heavy Engineering 1,723 2,951 4.4 (5.3%) (30.6%) (3.7%) 6.4% 6.4% 91.3% 3.2x 8.6x 9.4x 8.6x 9.6x 9.4x 10.7x 8.8x 8.9x
Subsea 7 Industrial (O&G) 3,524 2,207 10.8 8.3% 12.1% (13.8%) 29.3% 18.4% 66.0% (1.0x) 2.7x 4.3x 4.2x 11.2x 4.0x 6.1x 8.8x 28.0x
Electrocomponents Distribution 2,138 2,414 4.8 (5.7%) (57.4%) 8.9% 9.9% 8.0% 87.5% 1.5x 17.1x 14.3x 21.1x 17.7x 19.5x 17.1x 30.6x 22.1x
SSP Catering 1,857 2,224 3.9 2.8% 45.8% 9.6% 10.0% 6.2% 50.4% 1.9x 10.9x 9.5x 17.5x 15.0x 21.7x 18.2x 24.8x 21.6x
Hays Generalist Staffing 2,198 2,171 1.5 (2.3%) 24.6% 9.2% 5.8% 5.6% 95.1% (0.2x) 8.4x 9.5x 8.7x 9.8x 8.8x 10.2x 17.2x 16.3x
WS Atkins Engineering Consulting 1,422 1,997 14.6 (3.8%) 16.8% 7.2% 8.9% 8.3% 88.6% 0.9x 11.0x 9.9x 11.9x 10.9x 12.4x 11.2x 12.8x 11.9x
Berendsen Textiles & Hygiene 1,423 1,911 8.3 (5.3%) (30.6%) 8.5% 31.1% 15.0% 38.7% 1.4x 5.5x 5.2x 11.4x 10.8x 14.3x 13.0x 13.2x 12.2x
Carillion Facility Management 927 1,837 2.2 2.2% 48.6% 13.5% 4.0% 3.3% 79.0% 1.3x 10.3x 6.9x 12.5x 7.4x 13.1x 7.8x 7.5x 6.4x
Serco Diversified BPO 1,567 1,735 1.4 (0.9%) 11.8% (2.5%) 3.9% 3.1% 85.3% 1.4x 14.9x 14.4x 18.9x 18.2x 17.4x 22.3x n/m n/m
Biffa Waste Management 552 1,178 2.2 6.2% n/a 6.5% 13.8% 8.6% 48.6% 4.4x 7.6x 7.1x 12.7x 11.3x 14.5x 14.5x 16.5x 11.0x
Euromoney Information Services 1,201 1,175 11.2 1.0% 36.4% 2.0% 27.9% 27.4% 96.7% (0.1x) 10.4x 10.6x 10.6x 10.7x 10.7x 11.2x 27.9x 14.7x
Mitie Facility Management 710 1,060 2.0 2.1% 20.0% (1.5%) 4.6% 3.9% 78.9% 1.8x 10.4x 9.7x 12.1x 11.4x 13.2x 12.3x 10.9x 10.9x
Hunting Industrial (O&G) 904 925 5.6 2.4% 0.0% (12.6%) (9.8%) (14.7%) n/m 0.0x n/m 27.6x n/m n/m n/m n/m n/m n/m
Sanne Diversified BPO 860 863 6.2 3.1% (8.1%) 52.9% 38.5% 36.8% 95.7% 0.2x n/m 20.5x n/m 23.7x n/m 21.4x n/m 25.9x
Equiniti Diversified BPO 563 855 1.9 2.2% 48.6% 4.9% 23.4% 22.4% 76.1% 3.6x 9.4x 9.0x 9.8x 9.4x 12.4x 11.8x 12.8x 11.7x
Interserve Facility Management 469 761 3.2 (12.9%) (12.3%) 4.5% (1.0%) (2.1%) n/m 2.4x n/m 4.4x n/m 5.0x n/m 5.9x n/m 4.7x
Exova TIC 486 659 1.9 (8.7%) (21.7%) 7.9% 18.7% 14.4% 71.8% 2.6x 10.7x 9.6x 13.9x 11.9x 14.9x 13.6x 18.6x 14.8x
RPS Engineering Consulting 494 578 2.3 (2.4%) 22.0% (1.5%) 10.9% 10.4% 85.5% 1.3x 10.1x 8.9x 10.6x 9.4x 11.8x 10.4x n/a n/a
Mears Facility Management 520 539 5.1 4.6% 15.4% 6.5% 5.2% 5.0% 78.5% 0.4x 10.8x 8.9x 11.2x 9.2x 13.8x 10.2x 16.1x 13.0x
Johnson Service Textiles & Hygiene 416 533 1.1 2.1% 20.0% 7.6% 32.1% 14.7% 39.3% 1.6x 6.5x 5.9x 14.1x 11.7x 16.4x 14.2x 20.2x 14.8x
Restore Document Management 413 486 3.7 (4.1%) (10.4%) 35.1% 22.1% 20.1% 82.9% 3.8x 16.6x 12.9x 18.3x 13.8x 20.1x 14.8x 22.6x 17.1x
Vp Equipment Rental 313 420 8.0 8.6% 12.5% n/a n/a n/a n/a n/a n/m n/m n/m n/m n/a n/a n/a n/a
SThree Specialist Staffing 410 400 3.2 6.3% 68.0% 11.2% 4.5% 4.3% 91.8% (0.2x) 9.1x 8.3x 9.7x 9.7x 9.9x 10.0x 14.9x 13.7x
Speedy Hire Equipment Rental 265 346 0.5 (4.1%) 2.5% 1.0% 17.4% 5.0% 36.8% 1.4x 5.9x 5.5x 20.5x 15.3x 15.9x 19.6x n/m 18.1x
HSS Hire Equipment Rental 110 341 0.7 2.6% 117.7% 7.6% 21.1% 6.2% 41.9% 4.0x 4.7x 4.3x 16.1x 12.9x 11.3x 8.7x 21.3x 10.1x
Robert Walters Specialist Staffing 266 244 3.7 11.2% 19.3% 11.9% 3.1% 2.7% 81.9% (0.8x) 8.0x 7.3x 9.5x 8.4x 9.8x 9.0x 14.7x 13.4x
Blancco Technology Reverse Logistics 153 158 2.8 (2.5%) (15.1%) 37.6% 25.0% 24.7% n/a 1.4x 23.2x 16.4x 23.5x 16.4x n/a n/a n/a n/a
WYG Engineering Consulting 91 98 1.3 (0.4%) 30.9% 10.2% 7.1% 6.4% 74.6% 1.0x 9.2x 7.3x 10.3x 7.9x 12.4x 9.3x 11.4x 9.1x
PTSG Industrial Services 78 89 0.9 0.2% 1.5% 26.5% 24.2% 22.4% 93.2% 1.8x 10.0x 8.9x 10.8x 9.7x 10.8x 10.0x 12.9x 11.4x
Waterman Consulting, EPC, Heavy Engineering 25 19 0.8 17.8% 45.5% 3.2% 4.8% 4.0% n/a (1.8x) 4.4x 4.0x 5.3x 4.8x n/a n/a n/a n/a
Median 0.7% 15.4% 7.2% 14.5% 9.1% 76.4% 1.8x 10.3x 9.4x 12.6x 11.3x 13.3x 11.9x 16.6x 14.4x
Mean 0.2% 17.8% 8.7% 17.7% 12.7% 71.5% 2.2x 10.5x 9.9x 14.0x 12.3x 13.8x 12.8x 17.3x 14.8x
Company

15 Business Services | September 2016
Route Based
Business Services | February 2017 16
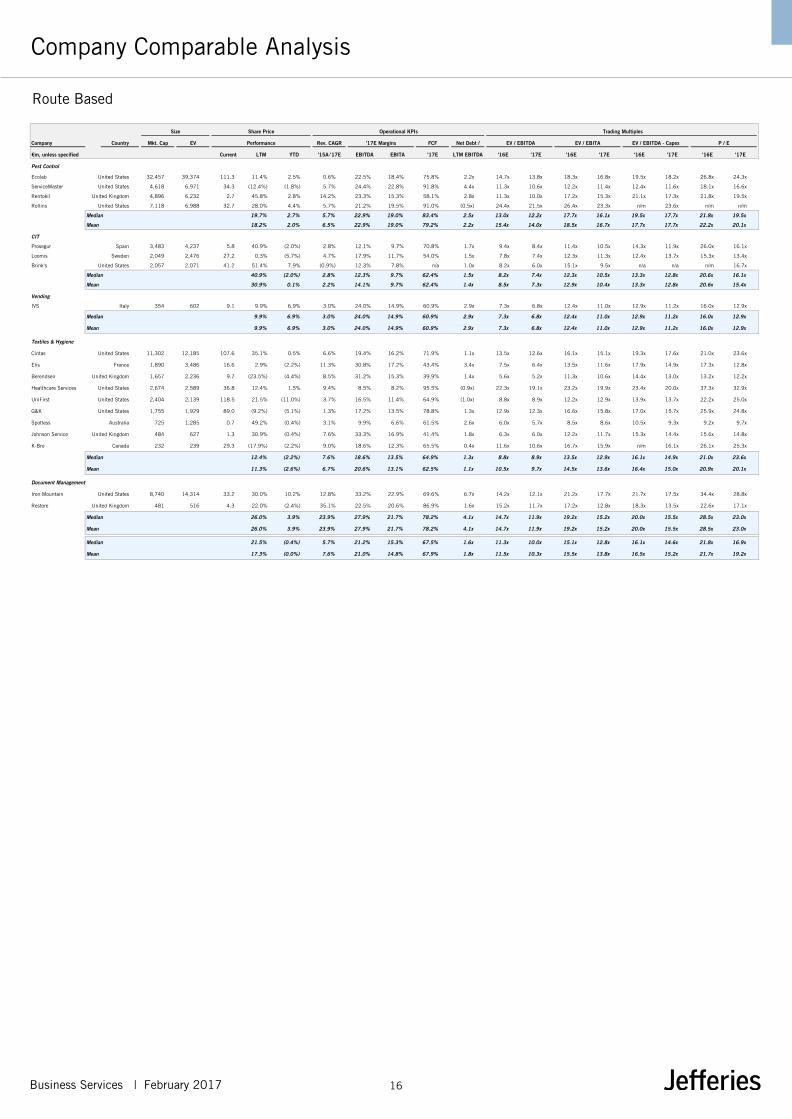
Route Based
Company Comparable Analysis
Size Share Price Operational KPIs Trading Multiples
Country Mkt. Cap EV Performance Rev. CAGR '17E Margins FCF Net Debt / EV / EBITDA EV / EBITA EV / EBITDA - Capex P / E
€m, unless specified Current LTM YTD '15A-'17E EBITDA EBITA '17E LTM EBITDA '16E '17E '16E '17E '16E '17E '16E '17E
Pest Control
Ecolab United States 32,457 39,374 111.3 11.4% 2.5% 0.6% 22.5% 18.4% 75.8% 2.2x 14.7x 13.8x 18.3x 16.8x 19.5x 18.2x 26.8x 24.3x
ServiceMaster United States 4,618 6,971 34.3 (12.4%) (1.8%) 5.7% 24.4% 22.8% 91.8% 4.4x 11.3x 10.6x 12.2x 11.4x 12.4x 11.6x 18.1x 16.6x
Rentokil United Kingdom 4,896 6,232 2.7 45.8% 2.8% 14.2% 23.3% 15.3% 58.1% 2.8x 11.3x 10.0x 17.2x 15.3x 21.1x 17.3x 21.8x 19.5x
Rollins United States 7,118 6,988 32.7 28.0% 4.4% 5.7% 21.2% 19.5% 91.0% (0.5x) 24.4x 21.5x 26.4x 23.3x n/m 23.6x n/m n/m
Median 19.7% 2.7% 5.7% 22.9% 19.0% 83.4% 2.5x 13.0x 12.2x 17.7x 16.1x 19.5x 17.7x 21.8x 19.5x
Mean 18.2% 2.0% 6.5% 22.9% 19.0% 79.2% 2.2x 15.4x 14.0x 18.5x 16.7x 17.7x 17.7x 22.2x 20.1x
CIT
Prosegur Spain 3,483 4,237 5.8 40.9% (2.0%) 2.8% 12.1% 9.7% 70.8% 1.7x 9.4x 8.4x 11.4x 10.5x 14.3x 11.9x 26.0x 16.1x
Loomis Sweden 2,049 2,476 27.2 0.3% (5.7%) 4.7% 17.9% 11.7% 54.0% 1.5x 7.8x 7.4x 12.3x 11.3x 12.4x 13.7x 15.3x 13.4x
Brink's United States 2,057 2,071 41.2 51.4% 7.9% (0.9%) 12.3% 7.8% n/a 1.0x 8.2x 6.0x 15.1x 9.5x n/a n/a n/m 16.7x
Median 40.9% (2.0%) 2.8% 12.3% 9.7% 62.4% 1.5x 8.2x 7.4x 12.3x 10.5x 13.3x 12.8x 20.6x 16.1x
Mean 30.9% 0.1% 2.2% 14.1% 9.7% 62.4% 1.4x 8.5x 7.3x 12.9x 10.4x 13.3x 12.8x 20.6x 15.4x
Vending
IVS Italy 354 602 9.1 9.9% 6.9% 3.0% 24.0% 14.9% 60.9% 2.9x 7.3x 6.8x 12.4x 11.0x 12.9x 11.2x 16.0x 12.9x
Median 9.9% 6.9% 3.0% 24.0% 14.9% 60.9% 2.9x 7.3x 6.8x 12.4x 11.0x 12.9x 11.2x 16.0x 12.9x
Mean 9.9% 6.9% 3.0% 24.0% 14.9% 60.9% 2.9x 7.3x 6.8x 12.4x 11.0x 12.9x 11.2x 16.0x 12.9x
Textiles & Hygiene
Cintas United States 11,302 12,185 107.6 35.1% 0.5% 6.6% 19.4% 16.2% 71.9% 1.1x 13.5x 12.6x 16.1x 15.1x 19.3x 17.6x 21.0x 23.6x
Elis France 1,890 3,486 16.6 2.9% (2.2%) 11.3% 30.8% 17.2% 43.4% 3.4x 7.5x 6.4x 13.5x 11.6x 17.9x 14.9x 17.3x 12.8x
Berendsen United Kingdom 1,657 2,236 9.7 (23.5%) (4.4%) 8.5% 31.2% 15.3% 39.9% 1.4x 5.6x 5.2x 11.3x 10.6x 14.4x 13.0x 13.2x 12.2x
Healthcare Services United States 2,674 2,589 36.8 12.4% 1.5% 9.4% 8.5% 8.2% 95.5% (0.9x) 22.3x 19.1x 23.2x 19.9x 23.4x 20.0x 37.3x 32.9x
UniFirst United States 2,404 2,139 118.5 21.5% (11.0%) 3.7% 16.5% 11.4% 64.9% (1.0x) 8.8x 8.9x 12.2x 12.9x 13.9x 13.7x 22.2x 25.0x
G&K United States 1,755 1,929 89.0 (9.2%) (5.1%) 1.3% 17.2% 13.5% 78.8% 1.3x 12.9x 12.3x 16.6x 15.8x 17.0x 15.7x 25.9x 24.8x
Spotless Australia 725 1,285 0.7 49.2% (0.4%) 3.1% 9.9% 6.6% 61.5% 2.6x 6.0x 5.7x 8.5x 8.6x 10.5x 9.3x 9.2x 9.7x
Johnson Service United Kingdom 484 627 1.3 30.9% (0.4%) 7.6% 33.3% 16.9% 41.4% 1.8x 6.3x 6.0x 12.2x 11.7x 15.3x 14.4x 15.6x 14.8x
K-Bro Canada 232 239 29.3 (17.9%) (2.2%) 9.0% 18.6% 12.3% 65.5% 0.4x 11.6x 10.6x 16.7x 15.9x n/m 16.1x 26.1x 25.3x
Median 12.4% (2.2%)n/m 7.6%n/m 18.6% 13.5%n/m 64.9%n/m 1.3xn/m 8.8x 8.9xn/m 13.5x 12.9xn/m 16.1x 14.9xn/m 21.0x 23.6x
Mean 11.3% (2.6%)n/m 6.7%n/m 20.6% 13.1%n/m 62.5%n/m 1.1xn/m 10.5x 9.7xn/m 14.5x 13.6xn/m 16.4x 15.0xn/m 20.9x 20.1x
Document Management
Iron Mountain United States 8,740 14,314 33.2 30.0% 10.2% 12.8% 33.2% 22.9% 69.6% 6.7x 14.2x 12.1x 21.2x 17.7x 21.7x 17.5x 34.4x 28.8x
Restore United Kingdom 481 516 4.3 22.0% (2.4%) 35.1% 22.5% 20.6% 86.9% 1.6x 15.2x 11.7x 17.2x 12.8x 18.3x 13.5x 22.6x 17.1x
Median 26.0% 3.9%n/m 23.9%n/m 27.9% 21.7%n/m 78.2%n/m 4.1xn/m 14.7x 11.9xn/m 19.2x 15.2xn/m 20.0x 15.5xn/m 28.5x 23.0x
Mean 26.0% 3.9%n/m 23.9%n/m 27.9% 21.7%n/m 78.2%n/m 4.1xn/m 14.7x 11.9xn/m 19.2x 15.2xn/m 20.0x 15.5xn/m 28.5x 23.0x
Median 21.5% (0.4%)n/m 5.7%n/m 21.2% 15.3%n/m 67.5%n/m 1.6xn/m 11.3x 10.0xn/m 15.1x 12.8xn/m 16.1x 14.6xn/m 21.8x 16.9x
Mean 17.3% (0.0%)n/m 7.6%n/m 21.0% 14.8%n/m 67.9%n/m 1.8xn/m 11.5x 10.3xn/m 15.5x 13.8xn/m 16.5x 15.2xn/m 21.7x 19.2x
Company
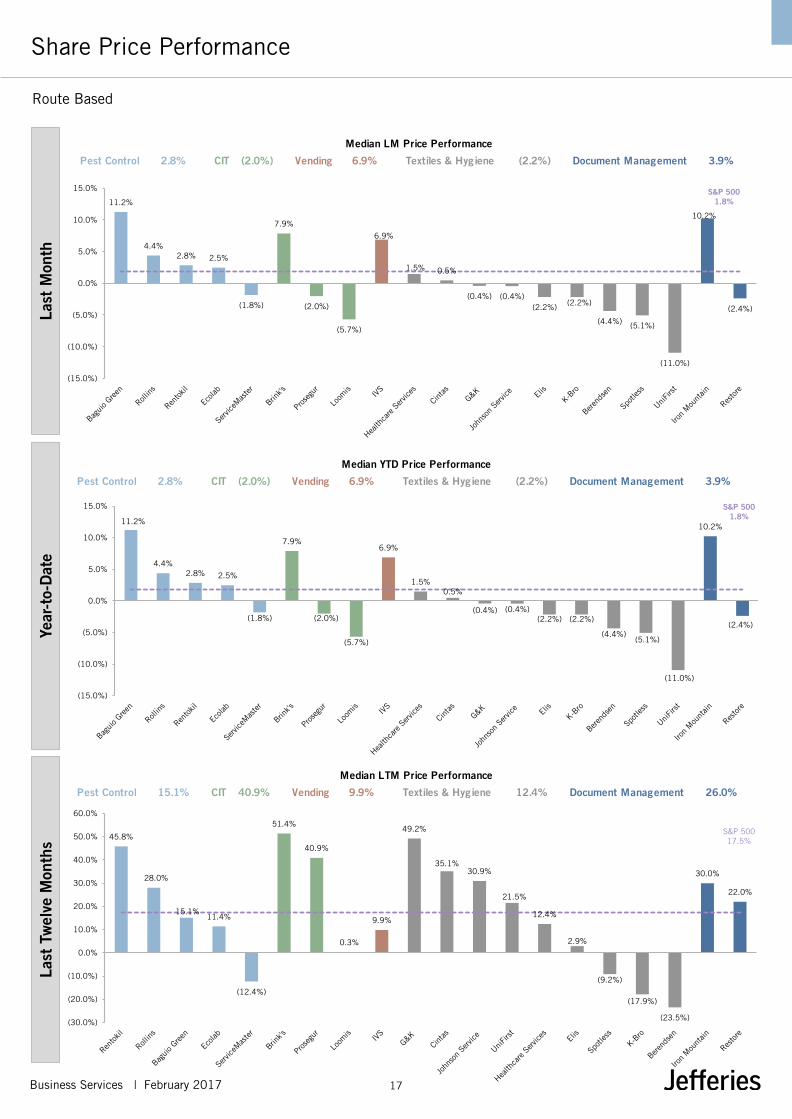
Business Services | February 2017 17
Route Based
Share Price Performance La
st M
onth
Ye
ar-t
o-D
ate
Last
Tw
elve
Mon
ths
11.2%
4.4%2.8% 2.5%
(1.8%)
7.9%
(2.0%)
(5.7%)
6.9%
1.5%0.5%
(0.4%) (0.4%)(2.2%) (2.2%)
(4.4%)(5.1%)
(11.0%)
10.2%
(2.4%)
S&P 5001.8%
(15.0%)
(10.0%)
(5.0%)
0.0%
5.0%
10.0%
15.0%
Pest Control 2.8% CIT (2.0%) Vending 6.9% Textiles & Hygiene (2.2%) Document Management 3.9%
Median YTD Price Performance
11.2%
4.4%2.8% 2.5%
(1.8%)
7.9%
(2.0%)
(5.7%)
6.9%
1.5% 0.5%
(0.4%) (0.4%)(2.2%) (2.2%)
(4.4%) (5.1%)
(11.0%)
10.2%
(2.4%)
S&P 5001.8%
(15.0%)
(10.0%)
(5.0%)
0.0%
5.0%
10.0%
15.0%
Pest Control 2.8% CIT (2.0%) Vending 6.9% Textiles & Hygiene (2.2%) Document Management 3.9%
Median LM Price Performance
45.8%
28.0%
15.1%11.4%
(12.4%)
51.4%
40.9%
0.3%
9.9%
49.2%
35.1%30.9%
21.5%
12.4%
2.9%
(9.2%)
(17.9%)
(23.5%)
30.0%
22.0%
S&P 50017.5%
(30.0%)
(20.0%)
(10.0%)
0.0%
10.0%
20.0%
30.0%
40.0%
50.0%
60.0%
Pest Control 15.1% CIT 40.9% Vending 9.9% Textiles & Hygiene 12.4% Document Management 26.0%
Median LTM Price Performance

Business Services | February 2017 18
Route Based
Operational Benchmarking & Trading Multiples
(1) FCF equals EBITDA minus CapEx
Document Management Textiles & Hygiene Pest Control CIT Vending
Rev
enue
CA
GR
’1
5A –
’17E
EB
ITA M
argi
n ’1
7E
EV
/ EB
ITD
A ’1
7E
E
V / E
BIT
A ’1
7E
P
/ E
’17E
FC
F Con
vers
ion
’17E (1
)
Median
Document Management
Textiles & Hygiene Pest Control CIT Vending
14.2%
5.7% 5.7%0.6% n/a
4.7% 2.8% 3.0%
11.3% 9.4% 9.0% 8.5% 7.6% 6.6%3.7% 3.1%
1.3% n/a
35.1%
12.8%
0.0%
10.0%
20.0%
30.0%
40.0% 5.7%
2.8%
3.0%
7.6%
23.9%
22.8%
18.5% 17.8%
15.2%
n/a
11.7%9.7%
7.7%
14.9%17.2% 16.6% 16.2%
15.2%13.5%
12.3% 11.4%
8.0%6.6%
22.6%20.6%
0.0%
5.0%
10.0%
15.0%
20.0%
25.0%
18.1%
9.7%
14.9%
13.5%
21.6%
91.8% 91.0%
75.8%
58.1%
n/a
70.8%
54.0%
n/a
60.9%
95.5%
78.8%71.9%
65.5% 64.9% 61.5%
43.4% 41.4% 39.9%
86.9%
69.6%
0.0%
20.0%
40.0%
60.0%
80.0%
100.0% 83.4%
62.4%
60.9%
64.9%
78.2%
12.2x
7.4x
6.8x
8.9x
11.9x
21.5x
13.8x10.6x 10.0x
n/a
8.4x 7.4x 6.0x 6.8x
19.1x
12.6x 12.3x10.6x
8.9x6.4x 6.0x 5.7x 5.2x
n/a
12.1x 11.7x
0.0x
5.0x
10.0x
15.0x
20.0x
25.0x
25.5x
16.8x15.4x
11.4x
n/a
11.3x 10.5x 9.7x11.0x
20.4x
15.9x 15.8x 15.1x12.9x 11.9x 11.6x 10.7x
8.6x
n/a
17.9x
12.8x
0.0x
5.0x
10.0x
15.0x
20.0x
25.0x
30.0x16.1x
10.5x
11.0x
12.9x
15.3x
24.3x
19.5x16.6x
n/m n/a
16.7x 16.1x13.4x 12.9x
32.9x
25.3x 25.0x 24.8x 23.6x
14.8x12.8x 12.2x
n/a
28.8x
17.1x
0.0x
10.0x
20.0x
30.0x
40.0x
19.5x
16.1x
12.9x
23.6x
23.0x

Business Services | February 2017 19
Route Based
Trading Multiples Through Time E
V / N
TM E
BIT
DA
E
V / N
TM E
BIT
A
P /
NTM
E
M edian NT M E V / E BIT DA 10 yrs 5 yrs 3yrs 1 yr Current
P est Control 11.0x 11.7x 11.8x 11.8x 12.2x
CIT 6.1x 6.8x 7.6x 7.3x 7.0x
V ending 6.9x 6.9x 6.9x 6.8x 7.2x
T extiles & Hygiene 7.1x 7.5x 8.1x 7.3x 8.4x
Document M anagement 10.0x 11.0x 11.8x 12.8x 13.8x
All Route Based 7.5x 8.1x 8.8x 9.0x 9.7x
M edian NT M E V / E BIT A 10 yrs 5 yrs 3yrs 1 yr Current
P est Control 13.4x 15.0x 15.5x 15.8x 16.2x
CIT 9.1x 9.5x 10.2x 10.6x 11.3x
V ending 13.5x 13.5x 13.3x 11.5x 12.2x
T extiles & Hygiene 10.7x 12.1x 12.8x 13.2x 14.1x
Document M anagement 14.2x 14.1x 16.1x 16.5x 17.8x
All Route Based 11.5x 12.3x 12.9x 13.1x 12.9x
M edian NT M P / E 10 yrs 5 yrs 3yrs 1 yr Current
P est Control 18.7x 18.0x 18.2x 19.2x 20.6x
CIT 13.8x 14.7x 16.2x 16.2x 16.7x
V ending 15.8x 15.8x 15.8x 14.8x 16.0x
T extiles & Hygiene 15.5x 16.1x 17.7x 17.7x 15.1x
Document M anagement 17.5x 17.3x 17.5x 19.3x 22.6x
All Route Based 15.6x 16.1x 17.1x 17.3x 16.8x
-
2.0x
4.0x
6.0x
8.0x
10.0x
12.0x
14.0x
16.0x
Jan-07 Jan-08 Jan-09 Jan-10 Jan-11 Jan-12 Jan-13 Jan-14 Jan-15 Jan-16 Jan-17
Pest Control CIT Vending Textiles & Hygiene Document Management
-
5.0x
10.0x
15.0x
20.0x
25.0x
Jan-07 Jan-08 Jan-09 Jan-10 Jan-11 Jan-12 Jan-13 Jan-14 Jan-15 Jan-16 Jan-17
Pest Control CIT Vending Textiles & Hygiene Document Management
-
5.0x
10.0x
15.0x
20.0x
25.0x
30.0x
Jan-07 Jan-08 Jan-09 Jan-10 Jan-11 Jan-12 Jan-13 Jan-14 Jan-15 Jan-16 Jan-17
Pest Control CIT Vending Textiles & Hygiene Document Management

Business Services | February 2017 20
Route Based
Valuation Decomposition & Re-rating Analysis
(1) Adjusted net debt includes net debt, preferred equity, minority interest and unfunded pension liabilities
% Re-rating (P/E NTM)
NTM EBITDA
EV / NTM EBITDA
% Share Price Δ (LTM) % Re-rating & % Earnings Impact (LTM) EV = Adj. Net Debt + Market Cap (1)
% Earnings Impact (NTM Net Income)
(2.0%)
47.2%
19.2%
25.5%
22.5%
1.7%
12.8%
14.1%
9.5%
37.2%
1.6%
9.7%
7.4%
(5.8%)
(13.3%)
13.2%
(20.5%)
17.7%
54.4%
1.3%
22.4%
12.2%
10.3%
28.8%
15.3%
12.2%
11.4%
(11.5%)
n/a
10.7%
1.5%
2.3%
9.2%
15.7%
(19.8%)
10.2%
(30.2%)
n/a
(100.0%) (50.0%) 0.0% 50.0% 100.0%
Brink's 51%
G&K 49%
Rentokil 46%
Prosegur 41%
Cintas 35%
Johnson Service 31%
Iron Mountain 30%
Rollins 28%
Restore 22%
UniFirst 21%
Baguio Green 15%
Healthcare Services 12%
Ecolab 11%
IVS 10%
Elis 3%
Loomis 0%
Spotless (9%)
ServiceMaster (12%)
K-Bro (18%)
Berendsen (23%)19.7%
-
20.0%
40.0%
60.0%
80.0%
100.0%
120.0%
140.0%
160.0%
Jan-14 Jul-14 Jan-15 Jul-15 Jan-16 Jul-16 Jan-17
Adjusted Net Debt Market Cap EV
10.0%
7.0x
8.0x
9.0x
10.0x
11.0x
Jan-14 Jul-14 Jan-15 Jul-15 Jan-16 Jul-16 Jan-17
EV / NTM EBITDA
13.5%
(4.0%)
(2.0%)
-
2.0%
4.0%
6.0%
8.0%
10.0%
12.0%
14.0%
16.0%
Jan-14 Jul-14 Jan-15 Jul-15 Jan-16 Jul-16 Jan-17
NTM EBITDA
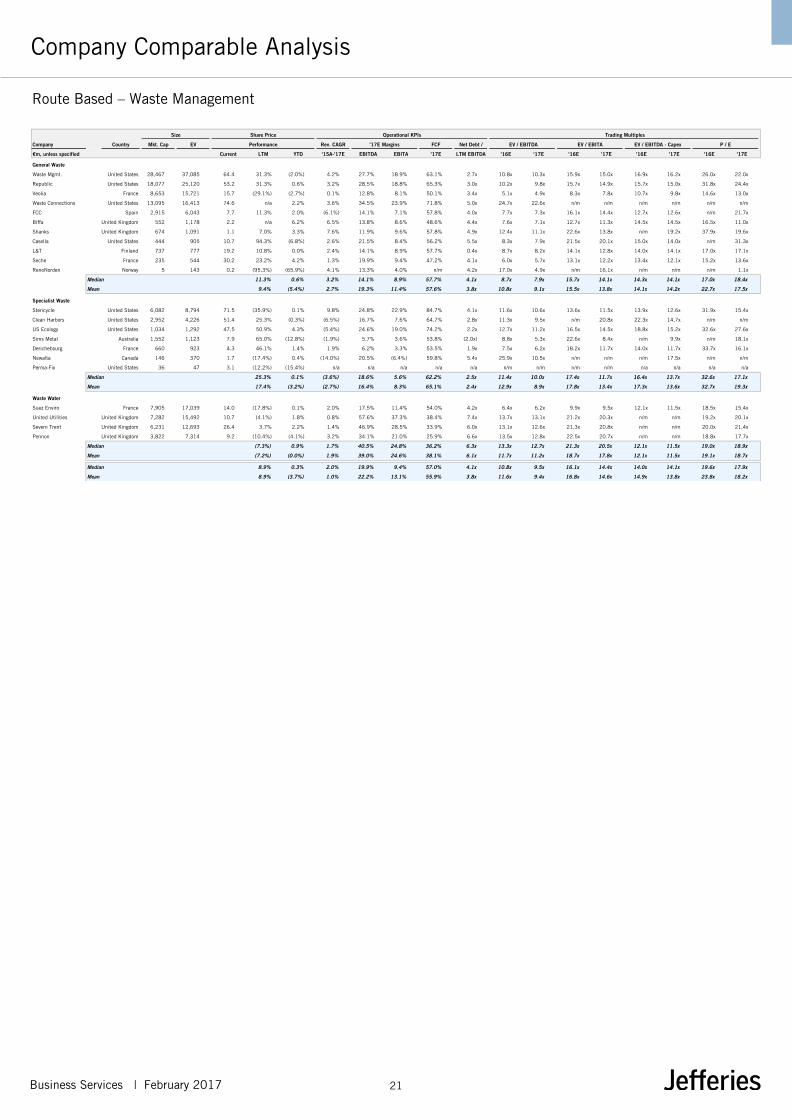
Business Services | February 2017 21
Route Based – Waste Management
Company Comparable Analysis
Size Share Price Operational KPIs Trading Multiples
Country Mkt. Cap EV Performance Rev. CAGR '17E Margins FCF Net Debt / EV / EBITDA EV / EBITA EV / EBITDA - Capex P / E
€m, unless specified Current LTM YTD '15A-'17E EBITDA EBITA '17E LTM EBITDA '16E '17E '16E '17E '16E '17E '16E '17E
General Waste
Waste Mgmt. United States 28,467 37,085 64.4 31.3% (2.0%) 4.2% 27.7% 18.9% 63.1% 2.7x 10.8x 10.3x 15.9x 15.0x 16.9x 16.2x 26.0x 22.0x
Republic United States 18,077 25,120 53.2 31.3% 0.6% 3.2% 28.5% 18.8% 65.3% 3.0x 10.2x 9.8x 15.7x 14.9x 15.7x 15.0x 31.8x 24.4x
Veolia France 8,653 15,721 15.7 (29.1%) (2.7%) 0.1% 12.8% 8.1% 50.1% 3.4x 5.1x 4.9x 8.3x 7.8x 10.7x 9.8x 14.6x 13.0x
Waste Connections United States 13,095 16,413 74.6 n/a 2.2% 3.6% 34.5% 23.9% 71.8% 5.0x 24.7x 22.6x n/m n/m n/m n/m n/m n/m
FCC Spain 2,915 6,043 7.7 11.3% 2.0% (6.1%) 14.1% 7.1% 57.8% 4.0x 7.7x 7.3x 16.1x 14.4x 12.7x 12.6x n/m 21.7x
Biffa United Kingdom 552 1,178 2.2 n/a 6.2% 6.5% 13.8% 8.6% 48.6% 4.4x 7.6x 7.1x 12.7x 11.3x 14.5x 14.5x 16.5x 11.0x
Shanks United Kingdom 674 1,091 1.1 7.0% 3.3% 7.6% 11.9% 9.6% 57.8% 4.9x 12.4x 11.1x 22.6x 13.8x n/m 19.2x 37.9x 19.6x
Casella United States 444 905 10.7 94.3% (6.8%) 2.6% 21.5% 8.4% 56.2% 5.5x 8.3x 7.9x 21.5x 20.1x 15.0x 14.0x n/m 31.3x
L&T Finland 737 777 19.2 10.8% 0.0% 2.4% 14.1% 8.9% 57.7% 0.4x 8.7x 8.2x 14.1x 12.8x 14.0x 14.1x 17.0x 17.1x
Seche France 235 544 30.2 23.2% 4.2% 1.3% 19.9% 9.4% 47.2% 4.1x 6.0x 5.7x 13.1x 12.2x 13.4x 12.1x 15.2x 13.6x
RenoNorden Norway 5 143 0.2 (95.3%) (65.9%) 4.1% 13.3% 4.0% n/m 4.2x 17.0x 4.9x n/m 16.1x n/m n/m n/m 1.1x
Median 11.3% 0.6% 3.2% 14.1% 8.9% 57.7% 4.1x 8.7x 7.9x 15.7x 14.1x 14.3x 14.1x 17.0x 18.4x
Mean 9.4% (5.4%) 2.7% 19.3% 11.4% 57.6% 3.8x 10.8x 9.1x 15.5x 13.8x 14.1x 14.2x 22.7x 17.5x
Specialist Waste
Stericycle United States 6,082 8,794 71.5 (35.9%) 0.1% 9.8% 24.8% 22.9% 84.7% 4.1x 11.6x 10.6x 13.6x 11.5x 13.9x 12.6x 31.9x 15.4x
Clean Harbors United States 2,952 4,226 51.4 25.3% (0.3%) (6.5%) 16.7% 7.6% 64.7% 2.8x 11.3x 9.5x n/m 20.8x 22.3x 14.7x n/m n/m
US Ecology United States 1,034 1,292 47.5 50.9% 4.3% (5.4%) 24.6% 19.0% 74.2% 2.2x 12.7x 11.2x 16.5x 14.5x 18.8x 15.2x 32.6x 27.6x
Sims Metal Australia 1,552 1,123 7.9 65.0% (12.8%) (1.9%) 5.7% 3.6% 53.8% (2.0x) 8.8x 5.3x 22.6x 8.4x n/m 9.9x n/m 18.1x
Derichebourg France 660 923 4.3 46.1% 1.4% 1.9% 6.2% 3.3% 53.5% 1.9x 7.5x 6.2x 18.2x 11.7x 14.0x 11.7x 33.7x 16.1x
Newalta Canada 146 370 1.7 (17.4%) 0.4% (14.0%) 20.5% (6.4%) 59.8% 5.4x 25.9x 10.5x n/m n/m n/m 17.5x n/m n/m
Perma-Fix United States 36 47 3.1 (12.2%) (15.4%) n/a n/a n/a n/a n/a n/m n/m n/m n/m n/a n/a n/a n/a
Median 25.3% 0.1% (3.6%) 18.6% 5.6% 62.2% 2.5x 11.4x 10.0x 17.4x 11.7x 16.4x 13.7x 32.6x 17.1x
Mean 17.4% (3.2%) (2.7%) 16.4% 8.3% 65.1% 2.4x 12.9x 8.9x 17.8x 13.4x 17.3x 13.6x 32.7x 19.3x
Waste Water
Suez Enviro France 7,905 17,039 14.0 (17.8%) 0.1% 2.0% 17.5% 11.4% 54.0% 4.2x 6.4x 6.2x 9.9x 9.5x 12.1x 11.5x 18.5x 15.4x
United Utilities United Kingdom 7,282 15,492 10.7 (4.1%) 1.8% 0.8% 57.6% 37.3% 38.4% 7.4x 13.7x 13.1x 21.2x 20.3x n/m n/m 19.2x 20.1x
Severn Trent United Kingdom 6,231 12,693 26.4 3.7% 2.2% 1.4% 46.9% 28.5% 33.9% 6.0x 13.1x 12.6x 21.3x 20.8x n/m n/m 20.0x 21.4x
Pennon United Kingdom 3,822 7,314 9.2 (10.4%) (4.1%) 3.2% 34.1% 21.0% 25.9% 6.6x 13.5x 12.8x 22.5x 20.7x n/m n/m 18.8x 17.7x
Median (7.3%) 0.9% 1.7% 40.5% 24.8% 36.2% 6.3x 13.3x 12.7x 21.3x 20.5x 12.1x 11.5x 19.0x 18.9x
Mean (7.2%) (0.0%) 1.9% 39.0% 24.6% 38.1% 6.1x 11.7x 11.2x 18.7x 17.8x 12.1x 11.5x 19.1x 18.7x
Median 8.9% 0.3% 2.0%n/m 19.9% 9.4% 57.0% 4.1x 10.8x 9.5x 16.1x 14.4x 14.0x 14.1x 19.6x 17.9x
Mean 8.9% (3.7%) 1.0%n/m 22.2% 13.1% 55.9% 3.8x 11.6x 9.4x 16.8x 14.6x 14.9x 13.8x 23.8x 18.2x
Company

Business Services | February 2017 22
Route Based – Waste Management
Share Price Performance La
st M
onth
Ye
ar-t
o-D
ate
Last
Tw
elve
Mon
ths
6.2%4.2%
3.3% 2.2% 2.0%0.6% 0.0%
(2.0%)(2.7%)
n/a
4.3%
1.4% 0.4% 0.1%(0.3%)
(12.8%)
(15.4%)
2.2%1.8% 0.1%
(4.1%)
S&P 5001.8%
(20.0%)
0.0%
20.0%General Waste 1.3% Specialist Waste 0.1% Waste Water 0.9%
Median YTD Price Performance
6.2%4.2%
3.3% 2.2% 2.0% 0.6%0.0%
(2.0%)(2.7%)
(6.8%)
4.3%
1.4%0.4% 0.1%
(0.3%)
(12.8%)(15.4%)
2.2% 1.8%0.1%
(4.1%)
S&P 5001.8%
(20.0%)
(15.0%)
(10.0%)
(5.0%)
0.0%
5.0%
10.0%
General Waste 1.3% Specialist Waste 0.1% Waste Water 0.9%
Median LM Price Performance
94.3%
31.3%31.3%23.2% 11.3%10.8% 7.0%
(29.1%)
(95.3%)
n/a
65.0%50.9%46.1%
25.3%
(12.2%)(17.4%)(35.9%)
3.7%
(4.1%)(10.4%)(17.8%)
S&P 50017.5%
(150.0%)
(100.0%)
(50.0%)
0.0%
50.0%
100.0%
150.0%General Waste 11.3% Specialist Waste 25.3% Waste Water (7.3%)
Median LTM Price Performance
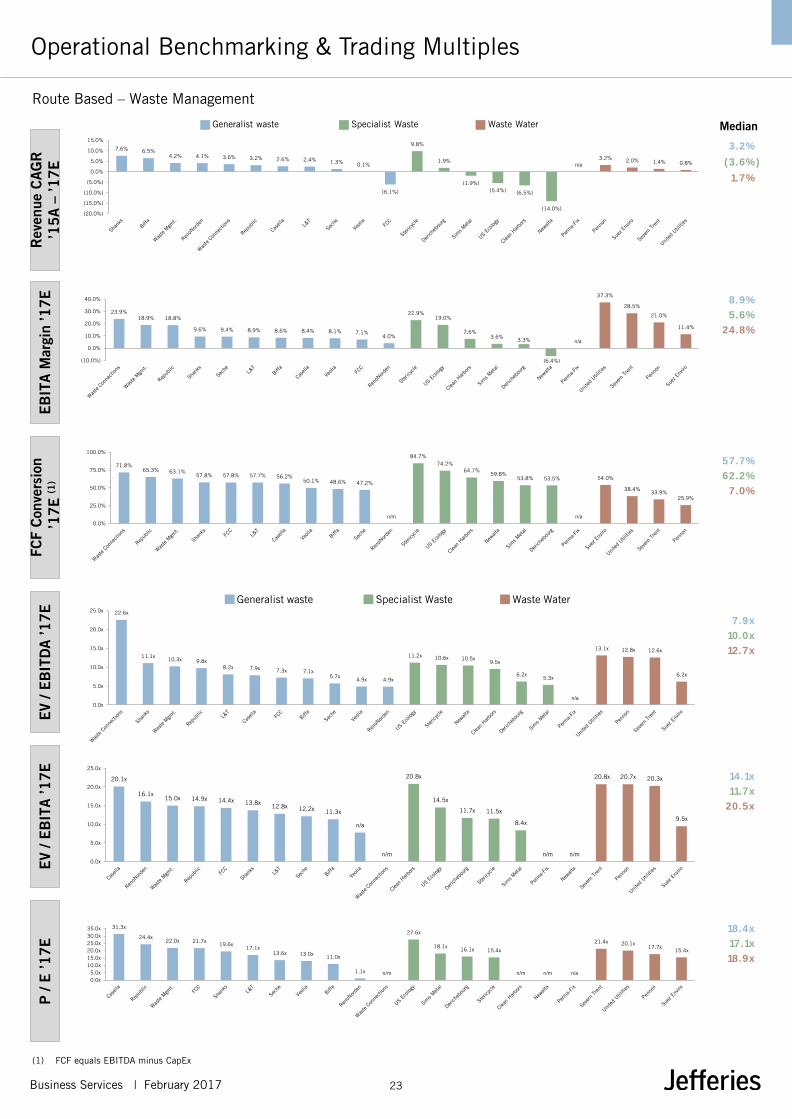
Business Services | February 2017 23
Route Based – Waste Management
Operational Benchmarking & Trading Multiples
(1) FCF equals EBITDA minus CapEx
Generalist waste
Specialist Waste Waste Water
EV
/ EB
ITD
A ’1
7E
E
V / E
BIT
A ’1
7E
P
/ E
’17E
Median
Generalist waste
Specialist Waste Waste Water
Rev
enue
CA
GR
’1
5A
– ’1
7E
E
BIT
A M
argi
n ’1
7E
FCF
Con
vers
ion
’17E
(1)
7.6% 6.5%4.2% 4.1% 3.6% 3.2% 2.6% 2.4% 1.3% 0.1%
(6.1%)
9.8%
1.9%
(1.9%)(5.4%) (6.5%)
(14.0%)
n/a3.2% 2.0% 1.4% 0.8%
(20.0%)
(15.0%)
(10.0%)
(5.0%)
0.0%
5.0%
10.0%
15.0%3.2%
(3.6%)
1.7%
8.9%
5.6%
24.8%
57.7%
62.2%
7.0%
22.6x
11.1x10.3x 9.8x
8.2x 7.9x 7.3x 7.1x5.7x
4.9x 4.9x
11.2x 10.6x 10.5x9.5x
6.2x5.3x
n/a
13.1x 12.8x 12.6x
6.2x
0.0x
5.0x
10.0x
15.0x
20.0x
25.0x
7.9x
10.0x
12.7x
14.1x
11.7x
20.5x
18.4x
17.1x
18.9x
23.9%18.9% 18.8%
9.6% 9.4% 8.9% 8.6% 8.4% 8.1% 7.1%4.0%
22.9%19.0%
7.6%3.6% 3.3%
(6.4%)
n/a
37.3%
28.5%
21.0%
11.4%
(10.0%)
0.0%
10.0%
20.0%
30.0%
40.0%
71.8%65.3% 63.1%
57.8% 57.8% 57.7% 56.2%50.1% 48.6% 47.2%
n/m
84.7%74.2%
64.7%59.8%
53.8% 53.5%
n/a
54.0%
38.4%33.9%
25.9%
0.0%
25.0%
50.0%
75.0%
100.0%
20.1x
16.1x15.0x 14.9x 14.4x 13.8x 12.8x 12.2x 11.3x
n/a
n/m
20.8x
14.5x
11.7x 11.5x
8.4x
n/m n/m
20.8x 20.7x 20.3x
9.5x
0.0x
5.0x
10.0x
15.0x
20.0x
25.0x
31.3x
24.4x22.0x 21.7x 19.6x
17.1x13.6x 13.0x 11.0x
1.1x n/m
27.6x
18.1x 16.1x 15.4x
n/m n/m n/a
21.4x 20.1x17.7x
15.4x
0.0x5.0x
10.0x15.0x20.0x25.0x30.0x35.0x

Business Services | February 2017 24
Route Based – Waste Management
Trading Multiples Through Time E
V / N
TM E
BIT
DA
E
V / N
TM E
BIT
A
P /
NTM
E
2.0x
4.0x
6.0x
8.0x
10.0x
12.0x
14.0x
16.0x
18.0x
Sep-06 Sep-07 Sep-08 Sep-09 Sep-10 Sep-11 Sep-12 Sep-13 Sep-14 Sep-15 Sep-16
General Waste Specialist Waste Waste Water
2.0x
4.0x
6.0x
8.0x
10.0x
12.0x
14.0x
16.0x
18.0x
20.0x
22.0x
Sep-06 Sep-07 Sep-08 Sep-09 Sep-10 Sep-11 Sep-12 Sep-13 Sep-14 Sep-15 Sep-16
General Waste Specialist Waste Waste Water
5.0x
10.0x
15.0x
20.0x
25.0x
30.0x
Sep-06 Sep-07 Sep-08 Sep-09 Sep-10 Sep-11 Sep-12 Sep-13 Sep-14 Sep-15 Sep-16
General Waste Specialist Waste Waste Water
M edian NT M E V / E BIT DA 10 yrs 5 yrs 3yrs 1 yr Current
General W aste 7.0x 7.0x 7.5x 7.7x 8.2x
S pecialist W aste 8.0x 8.0x 8.6x 9.0x 10.2x
W aste W ater 9.8x 11.0x 11.9x 12.8x 12.3x
All W aste M anagement 7.7x 7.7x 8.3x 8.6x 9.9x
M edian NT M E V / E BIT A 10 yrs 5 yrs 3yrs 1 yr Current
General W aste 11.8x 12.3x 12.9x 13.7x 15.1x
S pecialist W aste 11.3x 11.6x 12.7x 12.3x 11.5x
W aste W ater 15.0x 17.1x 19.2x 20.3x 20.0x
All W aste M anagement 12.1x 12.6x 13.4x 14.1x 15.0x
M edian NT M P / E 10 yrs 5 yrs 3yrs 1 yr Current
General W aste 14.6x 14.6x 16.1x 15.5x 14.3x
S pecialist W aste 16.6x 17.5x 19.2x 20.3x 16.6x
W aste W ater 16.5x 18.5x 20.6x 20.8x 19.1x
All W aste M anagement 15.9x 16.7x 18.7x 19.2x 16.9x
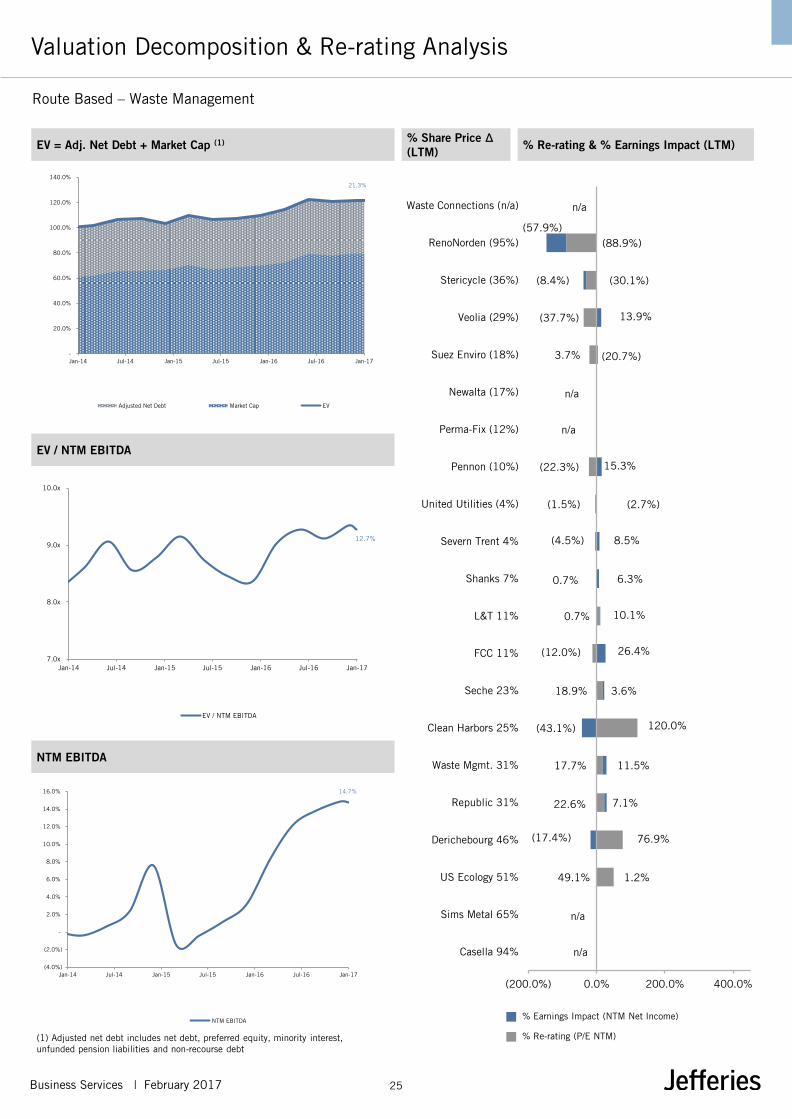
Business Services | February 2017 25
Route Based – Waste Management
Valuation Decomposition & Re-rating Analysis
(1) Adjusted net debt includes net debt, preferred equity, minority interest, unfunded pension liabilities and non-recourse debt
% Re-rating (P/E NTM)
% Earnings Impact (NTM Net Income)
NTM EBITDA
EV / NTM EBITDA
% Share Price Δ (LTM) % Re-rating & % Earnings Impact (LTM) EV = Adj. Net Debt + Market Cap (1)
n/a
49.1%
76.9%
22.6%
17.7%
120.0%
18.9%
(12.0%)
10.1%
0.7%
(4.5%)
(2.7%)
(22.3%)
n/a
(20.7%)
(37.7%)
(30.1%)
(88.9%)
n/a
n/a
1.2%
(17.4%)
7.1%
11.5%
(43.1%)
3.6%
26.4%
0.7%
6.3%
8.5%
(1.5%)
15.3%
n/a
3.7%
13.9%
(8.4%)
(57.9%)
(200.0%) 0.0% 200.0% 400.0%
Casella 94%
Sims Metal 65%
US Ecology 51%
Derichebourg 46%
Republic 31%
Waste Mgmt. 31%
Clean Harbors 25%
Seche 23%
FCC 11%
L&T 11%
Shanks 7%
Severn Trent 4%
United Utilities (4%)
Pennon (10%)
Perma-Fix (12%)
Newalta (17%)
Suez Enviro (18%)
Veolia (29%)
Stericycle (36%)
RenoNorden (95%)
Waste Connections (n/a)
21.3%
-
20.0%
40.0%
60.0%
80.0%
100.0%
120.0%
140.0%
Jan-14 Jul-14 Jan-15 Jul-15 Jan-16 Jul-16 Jan-17
Adjusted Net Debt Market Cap EV
12.7%
7.0x
8.0x
9.0x
10.0x
Jan-14 Jul-14 Jan-15 Jul-15 Jan-16 Jul-16 Jan-17
EV / NTM EBITDA
14.7%
(4.0%)
(2.0%)
-
2.0%
4.0%
6.0%
8.0%
10.0%
12.0%
14.0%
16.0%
Jan-14 Jul-14 Jan-15 Jul-15 Jan-16 Jul-16 Jan-17
NTM EBITDA

Business Services | February 2017 26
Route Based – Distribution
Company Comparable Analysis
Size Share Price Operational KPIs Trading Multiples
Country Mkt. Cap EV Performance Rev. CAGR '17E Margins FCF Net Debt / EV / EBITDA EV / EBITA EV / EBITDA - Capex P / E
€m, unless specified Current LTM YTD '15A-'17E EBITDA EBITA '17E LTM EBITDA '16E '17E '16E '17E '16E '17E '16E '17E
Automotive & Heavy Duty Aftermarket
AutoZone United States 19,228 23,669 671.8 (5.5%) (8.2%) 4.4% 22.6% 19.9% 76.7% 2.1x 10.6x 10.0x 12.1x 11.4x 13.6x 13.0x 16.4x 15.4x
O’Reilly Automotive United States 22,958 24,571 243.0 0.5% (5.8%) 7.4% 22.9% 20.3% 77.9% 1.0x 13.8x 12.6x 15.6x 14.2x 18.4x 16.2x 23.9x 21.8x
Genuine Parts Company United States 13,344 14,051 89.7 12.3% 1.3% 2.0% 8.3% 7.6% 89.6% 0.4x 12.1x 11.4x 13.3x 12.5x 13.6x 12.8x 21.0x 19.9x
LKQ United States 9,093 11,857 29.6 16.5% 4.1% 18.0% 12.1% 10.4% 82.3% 3.5x 12.3x 10.6x 13.9x 12.3x 15.4x 12.9x 17.6x 15.6x
DCC Ireland 6,611 7,132 74.5 18.3% 5.9% 9.4% 3.7% 3.2% 75.5% 1.2x 14.2x 12.9x 16.8x 15.0x 20.6x 17.1x 23.4x 20.1x
Dorman Products United States 2,205 2,117 64.0 59.4% (5.5%) 7.0% 21.2% 19.5% 88.0% (0.6x) 12.5x 11.7x 14.1x 12.8x 14.2x 13.3x 22.9x 20.9x
Uni-Select Canada 890 996 21.1 (2.1%) 0.6% (3.8%) 9.2% 8.6% 87.9% 1.1x 10.4x 9.3x 11.2x 10.0x 11.5x 10.6x 16.5x 15.6x
Median 12.3% 0.6% 7.0% 12.1% 10.4% 82.3% 1.1x 12.3x 11.4x 13.9x 12.5x 14.2x 13.0x 21.0x 19.9x
Mean 14.2% (1.1%) 6.3% 14.3% 12.8% 82.6% 1.3x 12.3x 11.2x 13.9x 12.6x 15.3x 13.7x 20.2x 18.5x
Building & Construction Products
CRH Ireland 26,851 33,546 32.2 32.8% (2.2%) 11.7% 11.9% 8.4% 70.1% 3.3x 10.7x 9.6x 15.9x 13.6x 15.6x 13.6x 21.7x 17.7x
Wolseley Channel Islands 14,352 15,647 57.1 41.7% (1.1%) 11.6% 7.5% 6.8% 82.0% 1.0x 12.0x 10.5x 13.3x 11.5x 14.6x 12.8x 17.6x 15.8x
Watsco United States 4,619 5,030 141.5 31.4% 3.1% 4.3% 9.0% 8.6% 95.0% 0.5x 14.8x 13.5x 15.7x 14.2x 16.8x 14.2x 27.3x 26.0x
Beacon Roofing Supply United States 2,434 3,388 40.6 8.1% (5.0%) 22.3% 8.9% 8.2% 88.6% 4.9x 10.1x 9.4x 11.0x 10.2x 11.0x 10.6x 25.5x 17.8x
Builders FirstSource United States 1,098 2,894 10.0 34.0% (1.9%) 36.4% 6.7% 5.2% 77.5% 11.0x 8.4x 7.0x 11.9x 9.0x 10.7x 9.1x 11.5x 10.5x
SIG United Kingdom 708 1,096 1.2 (23.5%) (0.4%) 5.4% 4.1% 3.4% 68.3% 2.9x 8.1x 8.1x 9.6x 9.6x 12.0x 11.8x 10.6x 10.8x
Boise Cascade United States 881 1,300 23.0 20.0% 10.2% 7.0% 4.6% 2.4% 58.0% 2.9x 8.7x 7.4x 15.9x 13.8x 18.4x 12.7x 22.8x 17.5x
Median 31.4% (1.1%) 11.6% 7.5% 6.8% 77.5% 2.9x 10.1x 9.4x 13.3x 11.5x 14.6x 12.7x 21.7x 17.5x
Mean 20.6% 0.4% 14.1% 7.5% 6.2% 77.1% 3.8x 10.4x 9.3x 13.3x 11.7x 14.2x 12.1x 19.6x 16.6x
Industrial, MRO, Safety
W.W. Grainger United States 13,764 15,659 234.1 28.4% 8.7% 2.8% 14.3% 11.9% 82.7% 1.3x 12.3x 11.2x 15.1x 13.5x 15.6x 13.5x 24.5x 21.4x
Fastenal Comp United States 13,332 13,589 46.0 22.5% 5.7% 3.6% 22.8% 20.3% 87.4% 0.3x 16.3x 15.5x 18.4x 17.4x 20.7x 17.7x 28.8x 27.3x
MSC Industrial Direct United States 5,367 5,842 94.7 57.6% 10.6% (0.1%) 15.6% 13.8% 85.9% 1.1x 14.1x 14.0x 16.1x 15.8x 17.3x 16.3x 25.2x 24.9x
Indutrade Sweden 2,252 2,637 18.8 17.0% (3.1%) 8.1% 13.4% 12.2% 86.8% 2.3x 15.0x 13.4x 16.8x 14.7x 18.6x 15.4x 22.7x 19.9x
Applied Industrial Technologies United States 2,185 2,449 56.0 57.3% 1.8% (1.4%) 8.2% 7.6% n/a 1.2x 13.0x 12.6x 14.1x 13.6x 14.0x n/a 35.8x 22.2x
Essendant United States 716 1,311 19.4 (30.0%) (0.0%) 0.0% 3.3% 2.8% 81.7% 2.3x 8.0x 7.9x 9.6x 9.5x 10.0x 9.7x 11.5x 11.0x
DXP Enterprise United States 608 897 35.0 141.2% 8.9% (12.1%) 5.4% 4.4% 92.4% 3.8x 20.9x 18.4x 28.8x 22.8x 23.4x 19.9x n/m n/m
BB Tools Sweden 597 678 21.2 83.1% 5.0% 3.5% 6.8% 6.5% 89.5% 0.4x 12.2x 11.2x 12.8x 11.7x 13.8x 12.5x 15.1x 14.1x
Median 42.8% 5.4% 1.4% 10.8% 9.7% 86.8% 1.3x 13.6x 13.0x 15.6x 14.2x 16.4x 15.4x 24.5x 21.4x
Mean 47.1% 4.7% 0.6% 11.2% 9.9% 86.6% 1.6x 14.0x 13.0x 16.5x 14.9x 16.7x 15.0x 23.4x 20.1x
Healthcare
McKesson United States 27,344 34,948 129.0 (13.6%) (0.9%) 2.8% 2.3% 2.1% 89.8% 1.5x 8.3x 8.4x 8.6x 8.9x 9.2x 9.4x 11.0x 11.5x
Cardinal Health United States 22,233 25,552 69.5 (7.9%) 4.2% 10.0% 2.5% 2.4% 87.0% 1.2x 8.7x 8.2x 9.3x 8.6x 10.1x 9.4x 15.1x 13.2x
Henry Schein United States 11,924 13,372 148.1 5.6% 5.4% 6.4% 8.8% 8.1% 92.7% 1.1x 14.7x 13.7x 15.9x 14.8x 15.9x 14.8x 23.8x 22.0x
Patterson United States 3,690 4,695 38.6 (2.0%) 1.4% 8.7% 7.5% 7.1% 84.6% 2.6x 11.8x 11.7x 12.6x 12.3x 14.1x 13.9x 19.0x 17.5x
Owens & Minor United States 2,045 2,543 33.2 3.5% 1.7% (0.6%) 2.8% 2.4% 79.5% 1.8x 10.3x 10.1x 11.7x 11.9x 11.1x 12.7x 20.3x 18.6x
Median (2.0%) 1.7% 6.4% 2.8% 2.4% 87.0% 1.5x 10.3x 10.1x 11.7x 11.9x 11.1x 12.7x 19.0x 17.5x
Mean (2.9%) 2.3% 5.5% 4.8% 4.4% 86.7% 1.6x 10.8x 10.4x 11.6x 11.3x 12.1x 12.0x 17.9x 16.5x
Technology
Arrow Electronics United States 6,104 8,178 68.1 42.5% 3.1% 2.6% 4.7% 4.4% 86.6% 2.2x 8.2x 7.7x 9.0x 8.3x 9.6x 8.9x 12.6x 10.2x
Avnet United States 5,493 7,679 43.0 16.3% (2.5%) (19.2%) 4.8% 4.3% 83.7% 2.3x 9.1x 9.7x 10.2x 10.9x 10.9x 11.6x 12.5x 12.8x
Synnex Corp United States 4,430 4,976 111.4 43.2% (0.7%) 5.9% 3.9% 3.6% 81.3% 1.2x 10.3x 9.2x 11.7x 9.9x 13.5x 11.3x 19.9x 15.6x
Tech Data United States 2,793 2,490 79.3 37.1% 1.0% 0.3% 1.5% 1.4% 90.5% (0.9x) 7.1x 6.8x 7.4x 7.1x 7.8x 7.5x 13.7x 13.7x
Addtech Sweden 1,066 1,172 16.0 26.0% (2.0%) 11.4% 10.4% 9.9% 91.3% 1.4x 16.3x 14.2x 17.1x 14.9x 17.9x 15.5x 12.4x 21.0x
ScanSource United States 922 1,011 36.7 28.5% 6.0% 4.3% 3.5% 3.4% 93.8% 0.8x 9.1x 8.4x 9.4x 8.8x 9.9x 9.0x 14.6x 13.0x
Median 32.8% 0.2% 3.5% 4.3% 3.9% 88.6% 1.3x 9.1x 8.8x 9.8x 9.4x 10.4x 10.2x 13.2x 13.4x
Mean 32.3% 0.8% 0.9% 4.8% 4.5% 87.9% 1.2x 10.0x 9.3x 10.8x 10.0x 11.6x 10.6x 14.3x 14.4x
Electrical & Communications
Rexel France 4,856 7,385 16.1 47.7% 3.0% (0.1%) 5.1% 4.4% 83.5% 3.3x 12.8x 10.7x 14.2x 12.5x 16.2x 12.8x 35.2x 15.8x
WESCO United States 3,182 4,361 65.5 75.1% 6.2% (0.3%) 5.5% 4.6% 94.4% 3.0x 11.8x 11.5x 14.2x 13.8x 12.4x 12.2x 33.8x 18.1x
Anixter United States 2,619 3,790 79.2 72.9% 5.5% 12.8% 5.2% 4.9% 88.2% 3.6x 11.3x 9.9x 12.3x 10.6x 12.4x 11.3x 23.5x 16.3x
Electrocomponents United Kingdom 2,490 2,811 5.6 131.9% 1.7% 8.9% 11.0% 9.0% 84.0% 1.5x 17.1x 14.3x 21.1x 17.7x 19.5x 17.1x 30.6x 22.1x
Houston Wire & Cable United States 112 139 6.8 33.4% 13.1% (2.1%) 1.7% 1.4% 42.0% 2.4x n/m n/m n/m n/m n/m n/m n/m n/m
Median 72.9% 5.5% (0.1%) 5.2% 4.6% 84.0% 3.0x 12.3x 11.1x 14.2x 13.1x 14.3x 12.5x 32.2x 17.2x
Mean 72.2% 5.9% 3.8% 5.7% 4.8% 78.4% 2.8x 13.2x 11.6x 15.4x 13.6x 15.1x 13.3x 30.8x 18.1x
Food Distribution
Sysco United States 26,589 33,599 48.6 31.8% (5.3%) 6.4% 5.7% 4.5% 82.6% 3.1x 12.8x 11.3x 16.4x 14.6x 15.8x 13.7x 25.7x 20.5x
Performance Food United States 2,124 3,369 20.5 (5.3%) (7.7%) 4.6% 2.3% 1.8% 63.1% 4.5x 10.5x 9.1x 13.9x 11.7x 16.9x 14.4x 24.7x 17.0x
SPAR South Africa 2,474 2,766 13.1 4.1% (4.1%) 16.3% 3.5% 2.9% 70.6% 1.1x 12.5x 11.0x 15.0x 13.1x 17.2x 15.7x 19.0x 16.3x
United Natural Foods United States 2,142 2,683 42.4 30.5% (4.2%) 7.7% 3.4% 2.6% 80.7% 1.9x 9.3x 8.8x 11.9x 11.6x 11.1x 10.9x 18.2x 17.4x
Core Mark United States 1,494 1,772 32.4 (14.1%) (18.9%) 32.3% 1.1% 0.8% 74.2% 2.3x 12.4x 10.8x 18.7x 15.4x 18.6x 14.5x 28.3x 23.4x
MetCash Australia 1,446 1,530 1.5 1.9% 3.6% 3.5% 2.5% 2.2% 79.2% 1.1x 7.4x 6.0x 8.7x 6.9x 9.8x 7.5x 10.6x 10.5x
SpartanNash United States 1,315 1,764 35.1 84.5% (4.2%) 4.6% 3.1% 2.0% 68.0% 2.0x 7.4x 7.3x 11.5x 11.2x 10.8x 10.7x 16.3x 15.6x
MARR Italy 1,196 1,380 18.0 20.6% (7.5%) 6.2% 7.2% 6.2% 95.1% 1.9x 12.4x 11.8x 14.5x 13.6x 13.1x 12.4x 19.9x 17.9x
Amsterdam Commodities Netherlands 498 590 20.6 (9.0%) (1.6%) 3.1% 7.3% 6.7% 91.7% 1.7x 10.8x 11.2x 11.7x 12.2x 11.7x 12.2x 14.5x 15.0x
Total Produce Ireland 577 709 1.8 27.0% 5.7% 5.3% 2.2% 1.9% 77.3% 1.5x 10.7x 9.9x 12.3x 11.6x 14.5x 12.8x 20.0x 17.8x
Chef’s Warehouse United States 406 690 15.5 30.9% (8.4%) 8.7% 5.2% 4.6% 84.6% 5.1x 13.0x 11.5x 14.5x 12.8x 17.4x 13.5x 39.1x 32.4x
Median 20.6% (4.2%) 6.2% 3.4% 2.6% 79.2% 1.9x 10.8x 10.8x 13.9x 12.2x 14.5x 12.8x 19.9x 17.4x
Mean 18.4% (4.8%) 9.0% 4.0% 3.3% 78.8% 2.4x 10.8x 9.9x 13.6x 12.2x 14.3x 12.6x 21.5x 18.5x
Median 26.0% 1.0% 5.3%n/m 5.5% 4.6% 83.8% 1.8x 11.8x 10.6x 13.6x 12.3x 14.1x 12.8x 20.0x 17.5x
Mean 27.8% 0.5% 6.1%n/m 7.5% 6.6% 82.2% 2.1x 11.6x 10.6x 13.7x 12.4x 14.3x 12.8x 20.8x 17.7x
Company
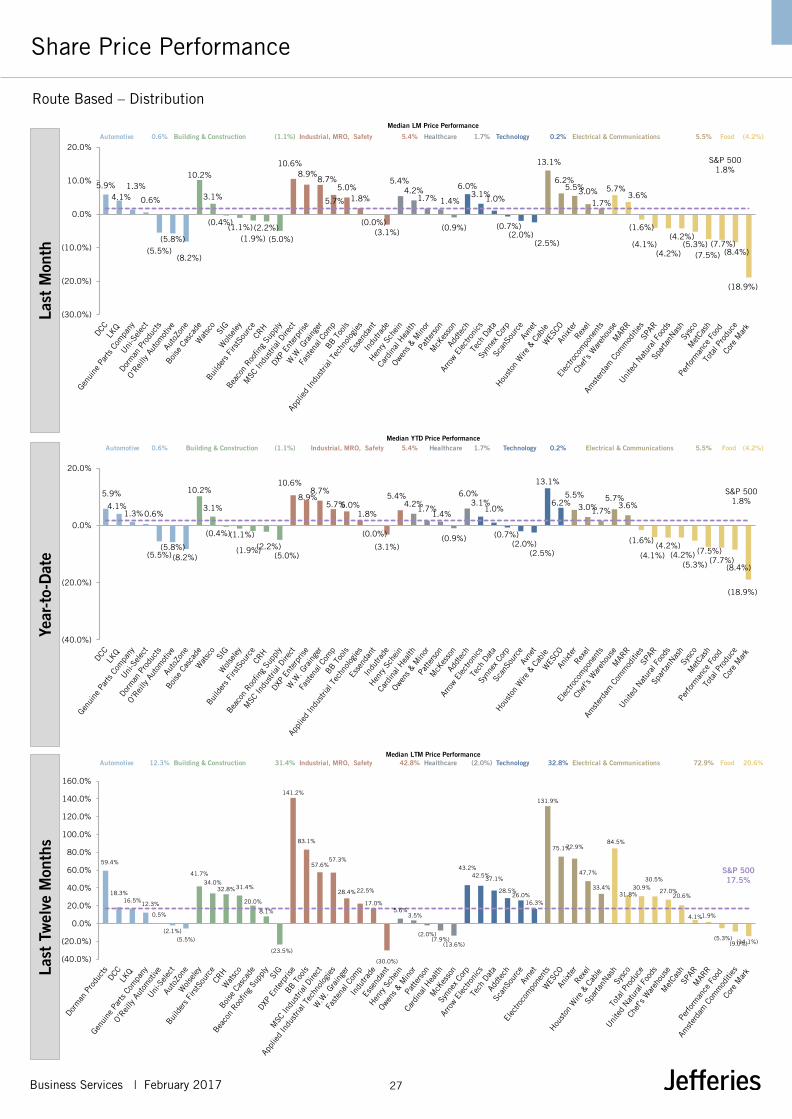
Business Services | February 2017 27
Route Based – Distribution
Share Price Performance La
st M
onth
Ye
ar-t
o-D
ate
Last
Tw
elve
Mon
ths
5.9%4.1%
1.3%
0.6%
(5.5%)(5.8%)
(8.2%)
10.2%
3.1%
(0.4%)(1.1%)
(1.9%)(2.2%)
(5.0%)
10.6%8.9%
8.7%
5.7%
5.0%1.8%
(0.0%)(3.1%)
5.4%4.2%
1.7% 1.4%
(0.9%)
6.0%3.1%1.0%
(0.7%)(2.0%)
(2.5%)
13.1%
6.2%5.5%3.0%
1.7%
5.7%3.6%
(1.6%)
(4.1%)(4.2%)
(4.2%)(5.3%)
(7.5%)(7.7%)
(8.4%)
(18.9%)
S&P 5001.8%
(30.0%)
(20.0%)
(10.0%)
0.0%
10.0%
20.0%Automotive 0.6% Building & Construction (1.1%) Industrial, MRO, Safety 5.4% Healthcare 1.7% Technology 0.2% Electrical & Communications 5.5% Food (4.2%)
Median LM Price Performance
5.9%
4.1%1.3%0.6%
(5.5%)(5.8%)
(8.2%)
10.2%
3.1%
(0.4%)(1.1%)
(1.9%)(2.2%)(5.0%)
10.6%
8.9%8.7%
5.7%5.0%1.8%
(0.0%)
(3.1%)
5.4%4.2%
1.7%1.4%
(0.9%)
6.0%3.1%
1.0%
(0.7%)(2.0%)
(2.5%)
13.1%
6.2%5.5%
3.0%1.7%
5.7%3.6%
(1.6%)
(4.1%)(4.2%)
(4.2%)(5.3%)
(7.5%)(7.7%)
(8.4%)
(18.9%)
S&P 5001.8%
(40.0%)
(20.0%)
0.0%
20.0%
Automotive 0.6% Building & Construction (1.1%) Industrial, MRO, Safety 5.4% Healthcare 1.7% Technology 0.2% Electrical & Communications 5.5% Food (4.2%)Median YTD Price Performance
59.4%
18.3%16.5%
12.3%
0.5%
(2.1%)(5.5%)
41.7%
34.0%32.8%31.4%
20.0%
8.1%
(23.5%)
141.2%
83.1%
57.6%57.3%
28.4%22.5%
17.0%
(30.0%)
5.6%3.5%
(2.0%)(7.9%)
(13.6%)
43.2%42.5%37.1%
28.5%26.0%
16.3%
131.9%
75.1%72.9%
47.7%
33.4%
84.5%
31.8%30.9%
30.5%
27.0%20.6%
4.1%1.9%
(5.3%)(9.0%)(14.1%)
S&P 50017.5%
(40.0%)
(20.0%)
0.0%
20.0%
40.0%
60.0%
80.0%
100.0%
120.0%
140.0%
160.0%
Automotive 12.3% Building & Construction 31.4% Industrial, MRO, Safety 42.8% Healthcare (2.0%) Technology 32.8% Electrical & Communications 72.9% Food 20.6%Median LTM Price Performance
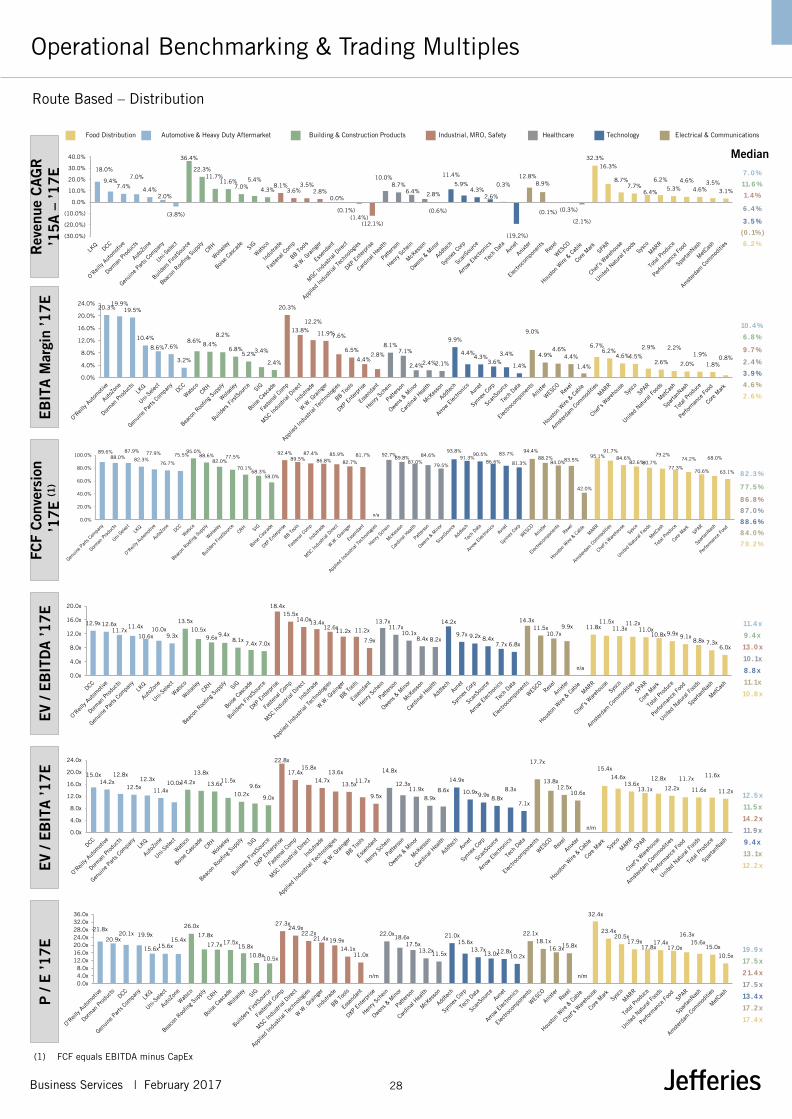
Business Services | February 2017 28
Route Based – Distribution
Operational Benchmarking & Trading Multiples
(1) FCF equals EBITDA minus CapEx
EV
/ EB
ITD
A ’1
7E
EV
/ EB
ITA ’1
7E
P
/ E
’17E
Median
Automotive & Heavy Duty Aftermarket Building & Construction Products Healthcare Industrial, MRO, Safety Technology Electrical & Communications Food Distribution
Rev
enue
CA
GR
’1
5A
– ’1
7E
EB
ITA M
argi
n ’1
7E
FC
F Con
vers
ion
’17E
(1)
18.0%
9.4%7.4%
7.0%
4.4%2.0%
(3.8%)
36.4%
22.3%11.7%
11.6%7.0%
5.4%
4.3%8.1%
3.6%3.5%
2.8%0.0%
(0.1%)(1.4%)
(12.1%)
10.0%8.7%
6.4% 2.8%
(0.6%)
11.4%
5.9%4.3%
2.6%
0.3%
(19.2%)
12.8%8.9%
(0.1%) (0.3%)
(2.1%)
32.3%16.3%
8.7%7.7%
6.4%
6.2%
5.3%4.6%
4.6%3.5%
3.1%
(30.0%)
(20.0%)
(10.0%)
0.0%
10.0%
20.0%
30.0%
40.0%
7 .0 %
11.6 %
1.4 %
6 .4 %
3 .5 %
(0 .1%)
6 .2 %
20.3%19.9%
19.5%
10.4%
8.6%7.6%
3.2%
8.6%8.4%
8.2%
6.8%5.2%3.4%
2.4%
20.3%
13.8%
12.2%
11.9%7.6%
6.5%
4.4%2.8%
8.1%7.1%
2.4%2.4%2.1%
9.9%
4.4%4.3%
3.6%3.4%
1.4%
9.0%
4.9%4.6%
4.4%
1.4%
6.7%6.2%
4.6%4.5%
2.9%
2.6%
2.2%
2.0%
1.9%
1.8%0.8%
0.0%
4.0%
8.0%
12.0%
16.0%
20.0%
24.0%
10 .4 %
6 .8 %
9 .7 %
2 .4 %
3 .9 %
4 .6 %
2 .6 %
89.6%88.0%
87.9%
82.3%77.9%
76.7%
75.5%95.0%
88.6%82.0%
77.5%
70.1%68.3%
58.0%
92.4%89.5%
87.4%
86.8%85.9%
82.7%
81.7%
n/a
92.7%89.8%
87.0%84.6%
79.5%
93.8%91.3%
90.5%
86.6%
83.7%
81.3%
94.4%88.2%
84.0%83.5%
42.0%
95.1%91.7%
84.6%82.6%80.7%
79.2%
77.3%
74.2%
70.6%
68.0%
63.1%
0.0%
20.0%
40.0%
60.0%
80.0%
100.0%
12.9x 12.6x11.7x
11.4x
10.6x10.0x
9.3x
13.5x10.5x
9.6x9.4x8.1x
7.4x 7.0x
18.4x15.5x
14.0x13.4x12.6x
11.2x 11.2x
7.9x
13.7x11.7x
10.1x8.4x 8.2x
14.2x
9.7x 9.2x 8.4x7.7x 6.8x
14.3x11.5x
10.7x9.9x
n/a
11.8x11.5x
11.3x11.2x
11.0x10.8x 9.9x 9.1x
8.8x 7.3x6.0x
0.0x
4.0x
8.0x
12.0x
16.0x
20.0x
11.4 x
9 .4 x
13 .0 x
10 .1x
8 .8 x
11.1x
10 .8 x
8 2 .3 %
7 7 .5 %
8 6 .8 %
8 7 .0 %
8 8 .6 %
8 4 .0 %
7 9 .2 %
15.0x14.2x
12.8x
12.5x12.3x
11.4x10.0x14.2x
13.8x
13.6x11.5x
10.2x9.6x
9.0x
22.8x
17.4x15.8x
14.7x13.6x
13.5x11.7x
9.5x
14.8x
12.3x11.9x
8.9x8.6x
14.9x
10.9x9.9x 8.8x
8.3x
7.1x
17.7x
13.8x12.5x
10.6x
n/m
15.4x
14.6x13.6x
13.1x
12.8x
12.2x
11.7x
11.6x
11.6x
11.2x
0.0x
4.0x
8.0x
12.0x
16.0x
20.0x
24.0x
12 .5 x
11.5 x
14 .2 x
11.9 x
9 .4 x
13 .1x
12 .2 x
19 .9 x
17 .5 x
2 1.4 x
17 .5 x
13 .4 x
17 .2 x
17 .4 x
21.8x
20.9x20.1x 19.9x
15.6x15.6x15.4x
26.0x
17.8x
17.7x 17.5x15.8x
10.8x10.5x
27.3x24.9x
22.2x21.4x 19.9x
14.1x11.0x
n/m
22.0x18.6x
17.5x13.2x11.5x
21.0x15.6x
13.7x13.0x12.8x
10.2x
22.1x18.1x
16.3x15.8x
n/m
32.4x
23.4x20.5x
17.9x17.8x
17.4x17.0x
16.3x15.6x
15.0x
10.5x
0.0x4.0x8.0x
12.0x16.0x20.0x24.0x28.0x32.0x36.0x

Business Services | February 2017 29
Route Based – Distribution
Trading Multiples Through Time E
V / N
TM E
BIT
DA
E
V / N
TM E
BIT
A
P /
NTM
E
2.0x
4.0x
6.0x
8.0x
10.0x
12.0x
14.0x
16.0x
Jan-07 Jan-08 Jan-09 Jan-10 Jan-11 Jan-12 Jan-13 Jan-14 Jan-15 Jan-16 Jan-17
Automotive & Heavy Duty Aftermarket Building & Construction Products Industrial, MRO, SafetyHealthcare Technology Electrical & CommunicationsFood Distribution
4.0x
6.0x
8.0x
10.0x
12.0x
14.0x
16.0x
Jan-07 Jan-08 Jan-09 Jan-10 Jan-11 Jan-12 Jan-13 Jan-14 Jan-15 Jan-16 Jan-17
Automotive & Heavy Duty Aftermarket Building & Construction Products Industrial, MRO, SafetyHealthcare Technology Electrical & CommunicationsFood Distribution
5.0x
7.0x
9.0x
11.0x
13.0x
15.0x
17.0x
19.0x
21.0x
23.0x
Jan-07 Jan-08 Jan-09 Jan-10 Jan-11 Jan-12 Jan-13 Jan-14 Jan-15 Jan-16 Jan-17
Automotive & Heavy Duty Aftermarket Building & Construction Products Industrial, MRO, SafetyHealthcare Technology Electrical & CommunicationsFood Distribution
Median NTM EV / EBITDA 10 yrs 5 yrs 3yrs 1 yr CurrentAutomotive & Heavy Duty Aftermarket 8.9x 10.3x 10.9x 11.6x 11.4xBuilding & Construction Products 8.7x 9.3x 9.3x 9.3x 9.3xIndustrial, MRO, Safety 9.1x 9.9x 10.3x 10.8x 13.6xHealthcare 9.4x 10.0x 11.5x 11.5x 11.8xTechnology 6.7x 6.8x 7.3x 7.6x 9.2xElectrical & Communications 8.4x 8.7x 9.2x 10.2x 11.4xFood Distribution 8.4x 9.6x 10.2x 10.4x 10.7xAll Peers 8.6x 9.4x 10.0x 10.3x 10.7x
Median NTM EV / EBITA 10 yrs 5 yrs 3yrs 1 yr CurrentAutomotive & Heavy Duty Aftermarket 10.5x 11.7x 12.4x 12.8x 12.6xBuilding & Construction Products 10.4x 11.0x 11.2x 10.9x 11.5xIndustrial, MRO, Safety 10.2x 11.0x 11.5x 12.3x 14.9xHealthcare 9.9x 10.8x 12.0x 12.0x 12.3xTechnology 7.2x 7.4x 7.9x 8.0x 9.7xElectrical & Communications 9.1x 9.4x 10.3x 11.6x 13.7xFood Distribution 10.0x 11.3x 12.2x 12.3x 11.8xAll Peers 9.8x 10.7x 11.4x 11.9x 12.4x
Median NTM P / E 10 yrs 5 yrs 3yrs 1 yr CurrentAutomotive & Heavy Duty Aftermarket 16.0x 17.1x 18.0x 18.6x 19.8xBuilding & Construction Products 15.4x 16.2x 15.8x 15.4x 16.2xIndustrial, MRO, Safety 14.6x 16.2x 16.5x 18.4x 21.1xHealthcare 15.8x 16.9x 17.5x 17.3x 17.3xTechnology 10.7x 11.1x 11.7x 12.6x 13.8xElectrical & Communications 12.0x 12.2x 13.3x 14.7x 17.1xFood Distribution 14.3x 15.9x 17.1x 17.5x 17.4xAll Peers 14.2x 15.3x 16.5x 17.0x 17.2x
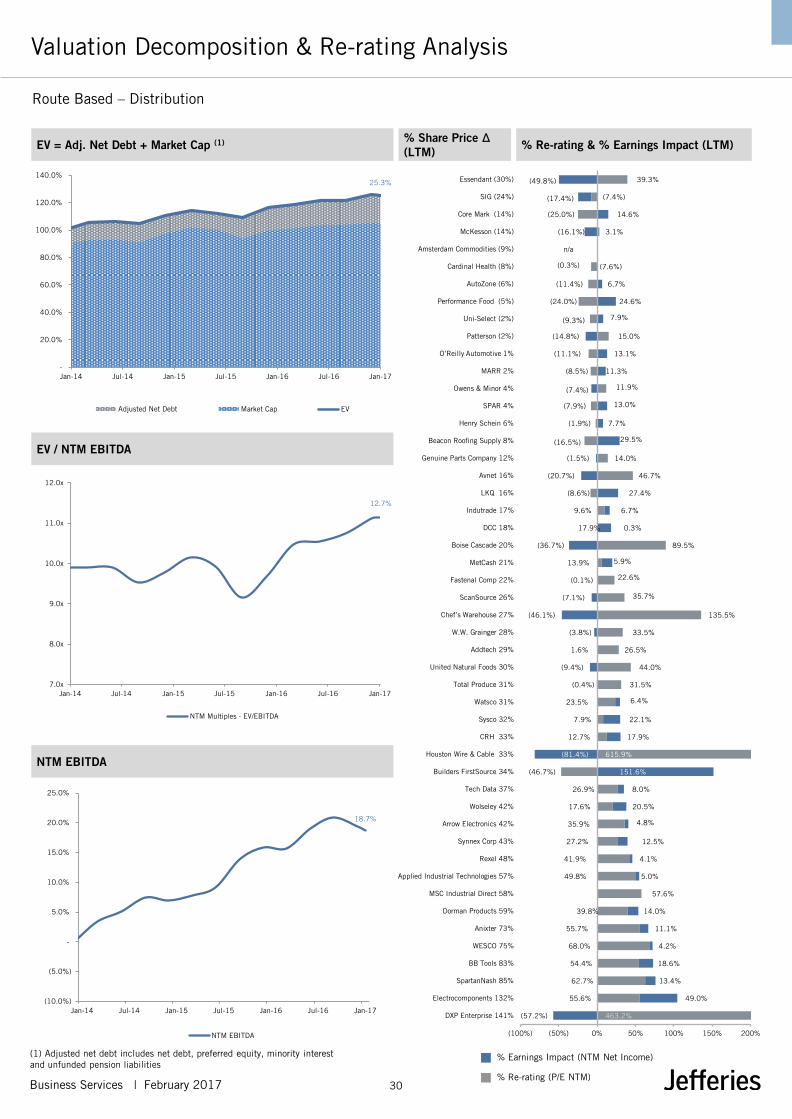
Business Services | February 2017 30
Route Based – Distribution
Valuation Decomposition & Re-rating Analysis
(1) Adjusted net debt includes net debt, preferred equity, minority interest and unfunded pension liabilities
NTM EBITDA
EV / NTM EBITDA
% Share Price Δ (LTM) % Re-rating & % Earnings Impact (LTM) EV = Adj. Net Debt + Market Cap (1)
% Re-rating (P/E NTM)
% Earnings Impact (NTM Net Income)
463.2%
55.6%
62.7%
54.4%
68.0%
55.7%
39.8%
57.6%
49.8%
41.9%
27.2%
35.9%
20.5%
26.9%
(46.7%)
615.9%
12.7%
7.9%
23.5%
31.5%
44.0%
26.5%
33.5%
135.5%
35.7%
22.6%
5.9%
89.5%
0.3%
9.6%
(8.6%)
46.7%
14.0%
(16.5%)
(1.9%)
(7.9%)
11.9%
(8.5%)
(11.1%)
15.0%
(9.3%)
(24.0%)
(11.4%)
(7.6%)
n/a
3.1%
(25.0%)
(7.4%)
39.3%
(57.2%)
49.0%
13.4%
18.6%
4.2%
11.1%
14.0%
5.0%
4.1%
12.5%
4.8%
17.6%
8.0%
151.6%
(81.4%)
17.9%
22.1%
6.4%
(0.4%)
(9.4%)
1.6%
(3.8%)
(46.1%)
(7.1%)
(0.1%)
13.9%
(36.7%)
17.9%
6.7%
27.4%
(20.7%)
(1.5%)
29.5%
7.7%
13.0%
(7.4%)
11.3%
13.1%
(14.8%)
7.9%
24.6%
6.7%
(0.3%)
(16.1%)
14.6%
(17.4%)
(49.8%)
(100%) (50%) 0% 50% 100% 150% 200%
DXP Enterprise 141%
Electrocomponents 132%
SpartanNash 85%
BB Tools 83%
WESCO 75%
Anixter 73%
Dorman Products 59%
MSC Industrial Direct 58%
Applied Industrial Technologies 57%
Rexel 48%
Synnex Corp 43%
Arrow Electronics 42%
Wolseley 42%
Tech Data 37%
Builders FirstSource 34%
Houston Wire & Cable 33%
CRH 33%
Sysco 32%
Watsco 31%
Total Produce 31%
United Natural Foods 30%
Addtech 29%
W.W. Grainger 28%
Chef’s Warehouse 27%
ScanSource 26%
Fastenal Comp 22%
MetCash 21%
Boise Cascade 20%
DCC 18%
Indutrade 17%
LKQ 16%
Avnet 16%
Genuine Parts Company 12%
Beacon Roofing Supply 8%
Henry Schein 6%
SPAR 4%
Owens & Minor 4%
MARR 2%
O’Reilly Automotive 1%
Patterson (2%)
Uni-Select (2%)
Performance Food (5%)
AutoZone (6%)
Cardinal Health (8%)
Amsterdam Commodities (9%)
McKesson (14%)
Core Mark (14%)
SIG (24%)
Essendant (30%)
12.7%
7.0x
8.0x
9.0x
10.0x
11.0x
12.0x
Jan-14 Jul-14 Jan-15 Jul-15 Jan-16 Jul-16 Jan-17
NTM Multiples - EV/EBITDA
18.7%
(10.0%)
(5.0%)
-
5.0%
10.0%
15.0%
20.0%
25.0%
Jan-14 Jul-14 Jan-15 Jul-15 Jan-16 Jul-16 Jan-17
NTM EBITDA
25.3%
-
20.0%
40.0%
60.0%
80.0%
100.0%
120.0%
140.0%
Jan-14 Jul-14 Jan-15 Jul-15 Jan-16 Jul-16 Jan-17
Adjusted Net Debt Market Cap EV

31 Business Services | September 2016
Facility Management

Business Services | February 2017 32
Facility Management – Security Services
Company Comparable Analysis
Size Share Price Operational KPIs Trading Multiples
Country Mkt. Cap EV Performance Rev. CAGR '17E Margins FCF Net Debt / EV / EBITDA EV / EBITA EV / EBITDA - Capex P / E
€m, unless specified Current LTM YTD '15A-'17E EBITDA EBITA '17E LTM EBITDA '16E '17E '16E '17E '16E '17E '16E '17E
CIT
Loomis Sweden 2,049 2,476 27.2 0.3% (5.7%) 4.7% 17.9% 11.7% 54.0% 1.5x 7.8x 7.4x 12.3x 11.3x 12.4x 13.7x 15.3x 13.4x
Brink's United States 2,057 2,071 41.2 51.4% 7.9% (0.9%) 12.3% 7.7% n/a 0.0x 8.2x 6.0x 15.5x 9.7x n/a n/a n/m 16.7x
Median 25.8% 1.1%n/m 1.9%n/m 15.1% 9.7%n/m 54.0%n/m 0.7xn/m 8.0x 6.7xn/m 13.9x 10.5xn/m 12.4x 13.7xn/m 15.3x 15.1x
Mean 25.8% 1.1% 1.9% 15.1% 9.7% 54.0% 0.7x 8.0x 6.7x 13.9x 10.5x 12.4x 13.7x 15.3x 15.1x
Manned Guarding
Securitas Sweden 5,380 6,830 14.7 10.6% (2.9%) 7.5% 6.8% 5.4% 73.8% 2.8x 11.2x 10.2x 14.3x 12.7x 15.3x 13.9x 19.2x 15.5x
Median 10.6% (2.9%)n/m 7.5%n/m 6.8% 5.4%n/m 73.8%n/m 2.8xn/m 11.2x 10.2xn/m 14.3x 12.7xn/m 15.3x 13.9xn/m 19.2x 15.5x
Mean 10.6% (2.9%) 7.5% 6.8% 5.4% 73.8% 2.8x 11.2x 10.2x 14.3x 12.7x 15.3x 13.9x 19.2x 15.5x
Remote Monitoring
Secom Japan 14,644 12,693 67.1 (1.8%) (4.5%) 4.8% 20.7% 14.3% 70.8% (2.1x) 8.1x 7.8x 11.7x 11.3x 11.5x 11.0x n/a n/a
Median (1.8%) (4.5%)n/m 4.8%n/m 20.7% 14.3%n/m 70.8%n/m (2.1x)n/m 8.1x 7.8xn/m 11.7x 11.3xn/m 11.5x 11.0xn/m n/m n/m
Mean (1.8%) (4.5%) 4.8% 20.7% 14.3% 70.8% (2.1x) 8.1x 7.8x 11.7x 11.3x 11.5x 11.0x n/m n/m
Prison Services
CCA United States 3,163 4,468 26.9 0.8% 18.7% (0.3%) 21.2% 13.5% 86.5% 3.2x 10.3x 12.8x 16.0x 20.0x 12.4x 14.8x 15.5x 20.9x
GEO United States 2,850 5,097 38.5 40.4% 15.6% 4.2% 19.0% 14.2% 61.0% 7.0x 14.2x 14.5x 18.9x 19.4x 17.8x 23.7x n/a 21.4x
Median 20.6% 17.1%n/m 1.9%n/m 20.1% 13.9%n/m 73.8%n/m 5.1xn/m 12.2x 13.6xn/m 17.5x 19.7xn/m 15.1x 19.3xn/m 15.5x 21.2x
Mean 20.6% 17.1% 1.9% 20.1% 13.9% 73.8% 5.1x 12.2x 13.6x 17.5x 19.7x 15.1x 19.3x 15.5x 21.2x
Security Products
United Tech United States 83,684 105,972 101.6 25.1% 0.0% 2.3% 18.0% 16.1% 83.0% 1.7x 11.4x 10.8x 12.9x 12.1x 13.7x 13.0x 17.9x 17.3x
Assa Abloy Sweden 19,473 21,729 17.5 (8.4%) (2.1%) 6.3% 18.5% 16.5% 89.4% 1.6x 18.5x 14.4x 21.5x 16.2x 21.3x 16.1x 27.7x 20.5x
Kaba Switzerland 3,012 3,123 717.9 21.6% 1.2% 24.5% 16.2% 14.0% 82.9% (0.7x) 9.9x 8.3x 11.5x 9.6x 12.1x 10.0x 35.9x 24.0x
Axis Sweden 2,647 2,556 38.1 5.3% 5.7% 11.6% 13.8% 12.8% n/a (0.9x) 23.7x 21.2x 27.3x 22.8x n/a n/a 39.2x 31.4x
Gunnebo Sweden 338 478 4.4 10.1% 12.5% 1.8% 8.4% 7.7% 81.0% 1.6x 8.1x 8.6x 9.2x 9.4x 9.9x 10.6x 15.5x 10.6x
Avigilon Canada 447 514 10.2 (1.9%) 8.3% 5.8% 14.0% 10.5% 65.4% 1.4x 11.6x 9.6x 17.3x 12.8x n/m 14.7x 20.7x 17.1x
Geovision Taiwan 101 85 1.3 (38.8%) (10.7%) n/a n/a n/a n/a n/a n/m n/m n/m n/m n/a n/a n/a n/a
Median 5.3% 1.2%n/m 6.0%n/m 15.1% 13.4%n/m 82.9%n/m 1.5xn/m 11.5x 10.2xn/m 15.1x 12.5xn/m 12.9x 13.0xn/m 24.2x 18.9x
Mean 1.8% 2.1% 8.7% 14.8% 12.9% 80.3% 0.8x 13.8x 12.1x 16.6x 13.8x 14.3x 12.9x 26.1x 20.1x
Diversified Security Services
G4S United Kingdom 4,595 7,305 3.0 12.5% 8.6% 4.2% 8.6% 7.4% 80.2% 3.6x 10.8x 9.7x 12.7x 11.4x 13.6x 12.1x 16.4x 14.2x
Sohgo Security Japan 3,506 3,329 34.9 (27.2%) (5.6%) 6.9% 11.5% 8.4% 68.1% (1.9x) 9.1x 8.1x 12.6x 11.1x 14.0x 12.0x n/a n/a
Prosegur Spain 3,483 4,237 5.8 40.9% (2.0%) 2.8% 12.1% 9.7% 70.8% 1.7x 9.4x 8.4x 11.4x 10.5x 14.3x 11.9x 26.0x 16.1x
Median 12.5% (2.0%)n/m 4.2%n/m 11.5% 8.4%n/m 70.8% 1.7xn/m 9.4x 8.4xn/m 12.6x 11.1xn/m 14.0x 12.0xn/m 21.2x 15.1x
Mean 8.8% 0.3% 4.6% 10.7% 8.5% 73.0% 1.1x 9.8x 8.8x 12.3x 11.0x 14.0x 12.0x 21.2x 15.1x
Median 7.7% 0.6% 4.7% 14.0% 11.7% 73.8% 1.6x 10.3x 9.6x 12.9x 11.4x 13.7x 13.0x 19.2x 17.1x
Mean 8.8% 2.8% 5.7% 14.6% 11.3% 74.4% 1.4x 11.5x 10.5x 15.0x 13.4x 14.0x 13.6x 22.7x 18.4x
Company
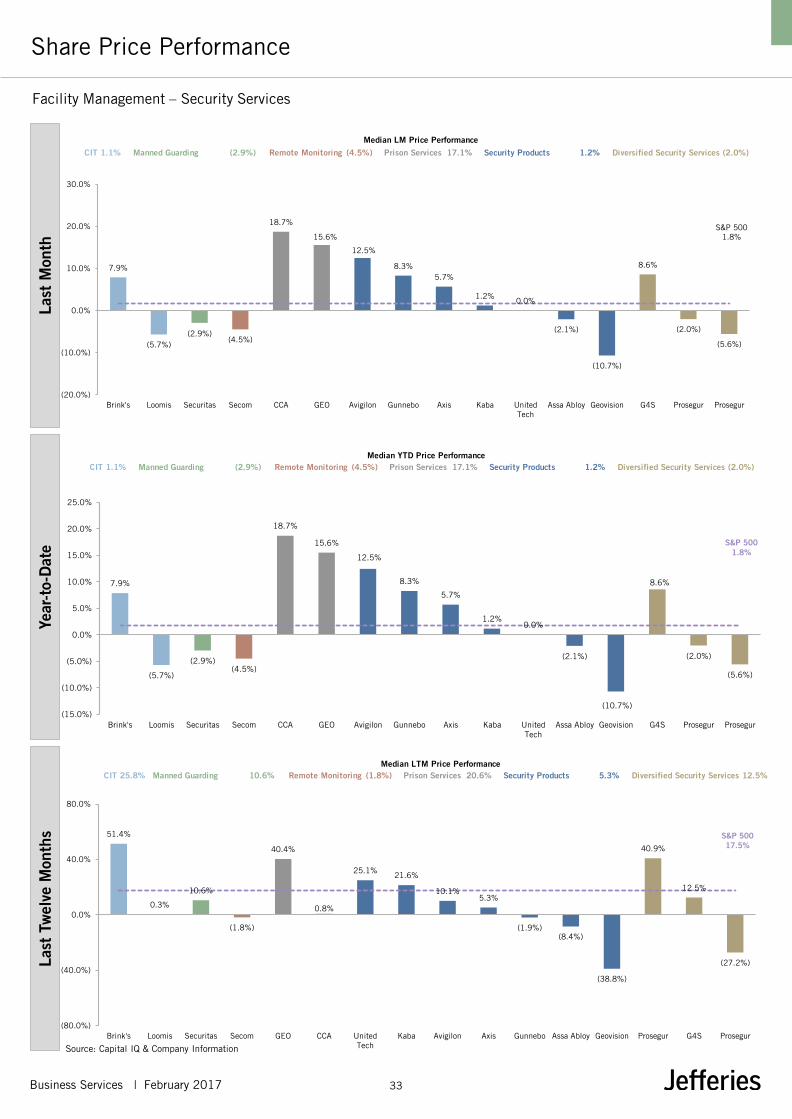
Business Services | February 2017 33
Facility Management – Security Services
Share Price Performance
Source: Capital IQ & Company Information
Last
Mon
th
Year
-to-
Dat
e La
st T
wel
ve M
onth
s
7.9%
(5.7%)
(2.9%)(4.5%)
18.7%
15.6%
12.5%
8.3%
5.7%
1.2%0.0%
(2.1%)
(10.7%)
8.6%
(2.0%)
(5.6%)
S&P 5001.8%
(15.0%)
(10.0%)
(5.0%)
0.0%
5.0%
10.0%
15.0%
20.0%
25.0%
Brink's Loomis Securitas Secom CCA GEO Avigilon Gunnebo Axis Kaba UnitedTech
Assa Abloy Geovision G4S Prosegur Prosegur
CIT 1.1% Manned Guarding (2.9%) Remote Monitoring (4.5%) Prison Services 17.1% Security Products 1.2% Diversified Security Services (2.0%)Median YTD Price Performance
7.9%
(5.7%)(2.9%)
(4.5%)
18.7%
15.6%
12.5%
8.3%5.7%
1.2%0.0%
(2.1%)
(10.7%)
8.6%
(2.0%)
(5.6%)
S&P 5001.8%
(20.0%)
(10.0%)
0.0%
10.0%
20.0%
30.0%
Brink's Loomis Securitas Secom CCA GEO Avigilon Gunnebo Axis Kaba UnitedTech
Assa Abloy Geovision G4S Prosegur Prosegur
CIT 1.1% Manned Guarding (2.9%) Remote Monitoring (4.5%) Prison Services 17.1% Security Products 1.2% Diversified Security Services (2.0%)
Median LM Price Performance
51.4%
0.3%
10.6%
(1.8%)
40.4%
0.8%
25.1%21.6%
10.1%5.3%
(1.9%)(8.4%)
(38.8%)
40.9%
12.5%
(27.2%)
S&P 50017.5%
(80.0%)
(40.0%)
0.0%
40.0%
80.0%
Brink's Loomis Securitas Secom GEO CCA UnitedTech
Kaba Avigilon Axis Gunnebo Assa Abloy Geovision Prosegur G4S Prosegur
CIT 25.8% Manned Guarding 10.6% Remote Monitoring (1.8%) Prison Services 20.6% Security Products 5.3% Diversified Security Services 12.5%Median LTM Price Performance
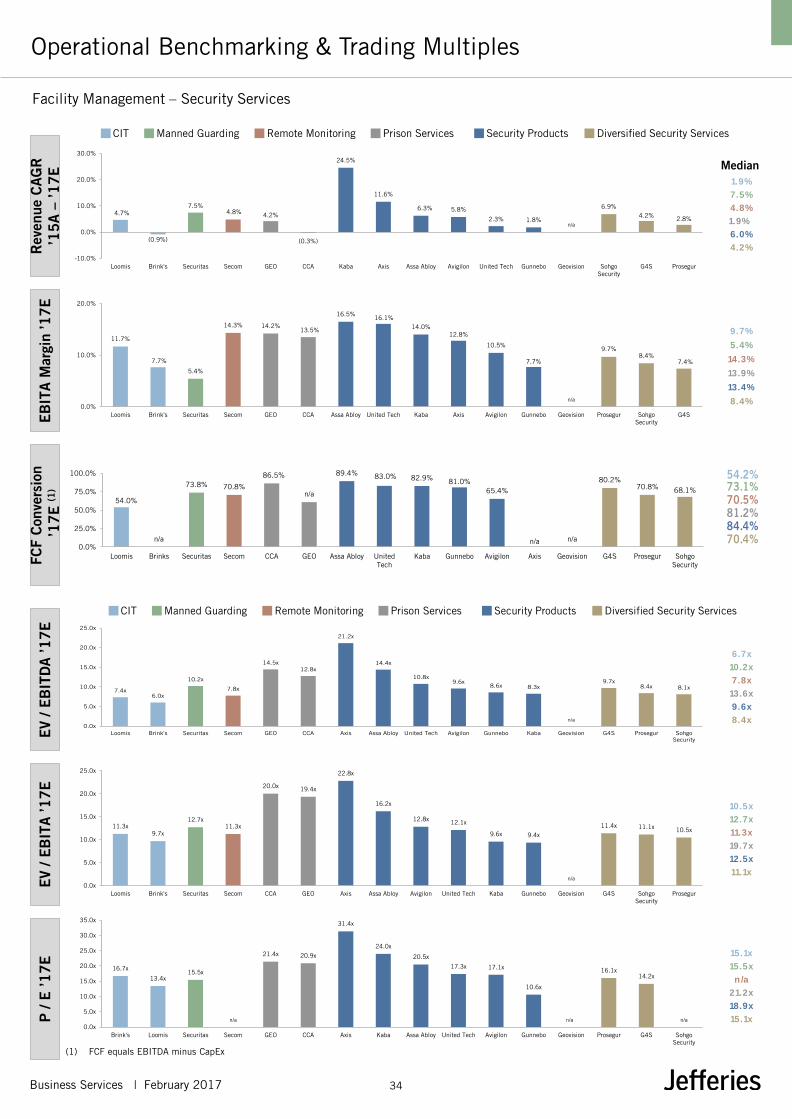
Business Services | February 2017 34
Facility Management – Security Services
Operational Benchmarking & Trading Multiples
(1) FCF equals EBITDA minus CapEx
Median
Security Products Prison Services CIT Manned Guarding Remote Monitoring Diversified Security Services
EV
/ EB
ITD
A ’1
7E
EV
/ EB
ITA ’1
7E
P
/ E
’17E
Security Products Prison Services CIT Manned Guarding Remote Monitoring Diversified Security Services
Rev
enue
CA
GR
’1
5A
– ’1
7E
EB
ITA M
argi
n ’1
7E
FCF
Con
vers
ion
’17E
(1)
54.2%73.1%70.5%81.2%84.4%70.4%
4.7%
(0.9%)
7.5%4.8% 4.2%
(0.3%)
24.5%
11.6%
6.3% 5.8%
2.3% 1.8%n/a
6.9%4.2% 2.8%
-10.0%
0.0%
10.0%
20.0%
30.0%
Loomis Brink's Securitas Secom GEO CCA Kaba Axis Assa Abloy Avigilon United Tech Gunnebo Geovision SohgoSecurity
G4S Prosegur
1.9%
7.5%
4.8%
1.9%
6.0%
4.2%
11.7%
7.7%
5.4%
14.3% 14.2%13.5%
16.5%16.1%
14.0%12.8%
10.5%
7.7%
n/a
9.7%8.4%
7.4%
0.0%
10.0%
20.0%
Loomis Brink's Securitas Secom GEO CCA Assa Abloy United Tech Kaba Axis Avigilon Gunnebo Geovision Prosegur SohgoSecurity
G4S
9.7%
5.4%
14.3%
13.9%
13.4%
8.4%
54.0%
n/a
73.8% 70.8%
86.5%
n/a
89.4% 83.0% 82.9% 81.0%65.4%
n/a n/a
80.2%70.8% 68.1%
0.0%
25.0%
50.0%
75.0%
100.0%
Loomis Brinks Securitas Secom CCA GEO Assa Abloy UnitedTech
Kaba Gunnebo Avigilon Axis Geovision G4S Prosegur SohgoSecurity
7.4x6.0x
10.2x
7.8x
14.5x12.8x
21.2x
14.4x
10.8x9.6x
8.6x 8.3x
n/a
9.7x8.4x 8.1x
0.0x
5.0x
10.0x
15.0x
20.0x
25.0x
Loomis Brink's Securitas Secom GEO CCA Axis Assa Abloy United Tech Avigilon Gunnebo Kaba Geovision G4S Prosegur SohgoSecurity
6.7x
10.2x
7.8x
13.6x
9.6x
8.4x
11.3x9.7x
12.7x11.3x
20.0x 19.4x
22.8x
16.2x
12.8x 12.1x
9.6x 9.4x
n/a
11.4x 11.1x 10.5x
0.0x
5.0x
10.0x
15.0x
20.0x
25.0x
Loomis Brink's Securitas Secom CCA GEO Axis Assa Abloy Avigilon United Tech Kaba Gunnebo Geovision G4S SohgoSecurity
Prosegur
10.5x
12.7x
11.3x
19.7x
12.5x
11.1x
16.7x
13.4x15.5x
n/a
21.4x 20.9x
31.4x
24.0x
20.5x
17.3x 17.1x
10.6x
n/a
16.1x14.2x
n/a0.0x
5.0x
10.0x
15.0x
20.0x
25.0x
30.0x
35.0x
Brink's Loomis Securitas Secom GEO CCA Axis Kaba Assa Abloy United Tech Avigilon Gunnebo Geovision Prosegur G4S SohgoSecurity
15.1x
15.5x
n/a
21.2x
18.9x
15.1x
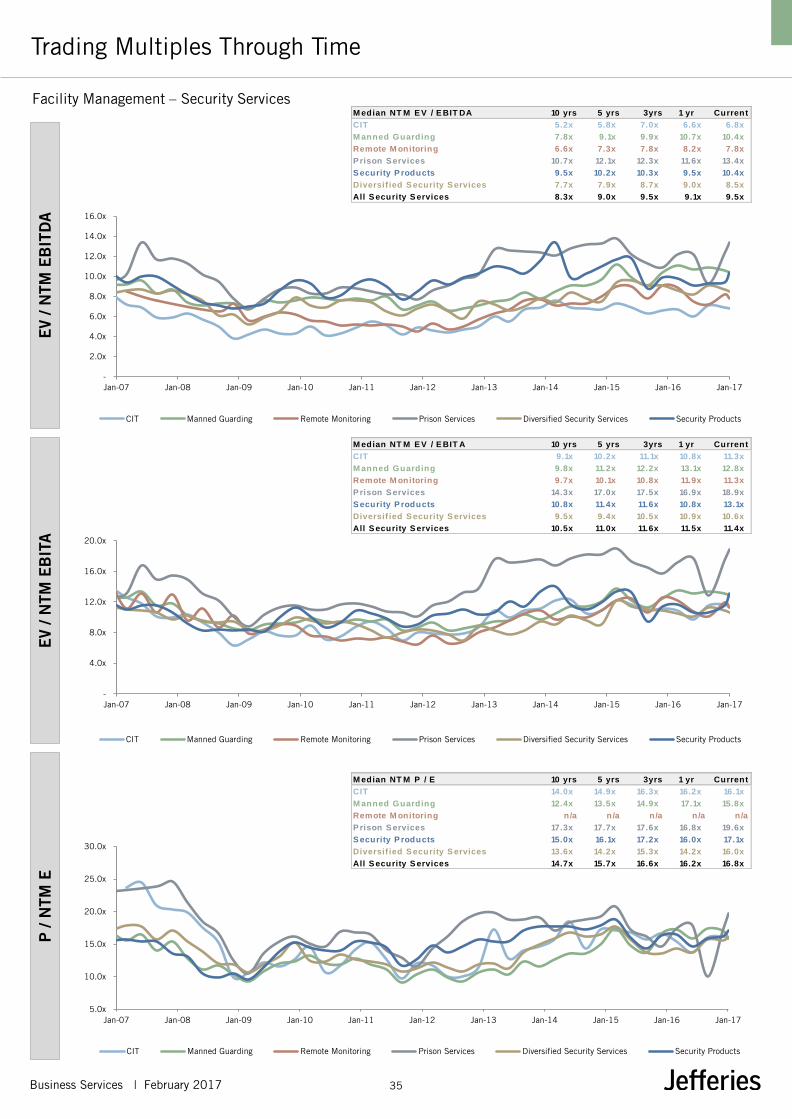
Business Services | February 2017 35
Facility Management – Security Services
Trading Multiples Through Time E
V / N
TM E
BIT
DA
E
V / N
TM E
BIT
A
P /
NTM
E
M edian NT M E V / E BIT DA 10 yrs 5 yrs 3yrs 1 yr Current
CIT 5.2x 5.8x 7.0x 6.6x 6.8x
M anned Guarding 7.8x 9.1x 9.9x 10.7x 10.4x
Remote M onitoring 6.6x 7.3x 7.8x 8.2x 7.8x
P rison S ervices 10.7x 12.1x 12.3x 11.6x 13.4x
S ecurity P roducts 9.5x 10.2x 10.3x 9.5x 10.4x
Diversif ied S ecurity S ervices 7.7x 7.9x 8.7x 9.0x 8.5x
All S ecurity S ervices 8.3x 9.0x 9.5x 9.1x 9.5x
M edian NT M E V / E BIT A 10 yrs 5 yrs 3yrs 1 yr Current
CIT 9.1x 10.2x 11.1x 10.8x 11.3x
M anned Guarding 9.8x 11.2x 12.2x 13.1x 12.8x
Remote M onitoring 9.7x 10.1x 10.8x 11.9x 11.3x
P rison S ervices 14.3x 17.0x 17.5x 16.9x 18.9x
S ecurity P roducts 10.8x 11.4x 11.6x 10.8x 13.1x
Diversif ied S ecurity S ervices 9.5x 9.4x 10.5x 10.9x 10.6x
All S ecurity S ervices 10.5x 11.0x 11.6x 11.5x 11.4x
M edian NT M P / E 10 yrs 5 yrs 3yrs 1 yr Current
CIT 14.0x 14.9x 16.3x 16.2x 16.1x
M anned Guarding 12.4x 13.5x 14.9x 17.1x 15.8x
Remote M onitoring n/a n/a n/a n/a n/a
P rison S ervices 17.3x 17.7x 17.6x 16.8x 19.6x
S ecurity P roducts 15.0x 16.1x 17.2x 16.0x 17.1x
Diversif ied S ecurity S ervices 13.6x 14.2x 15.3x 14.2x 16.0x
All S ecurity S ervices 14.7x 15.7x 16.6x 16.2x 16.8x
-
2.0x
4.0x
6.0x
8.0x
10.0x
12.0x
14.0x
16.0x
Jan-07 Jan-08 Jan-09 Jan-10 Jan-11 Jan-12 Jan-13 Jan-14 Jan-15 Jan-16 Jan-17
CIT Manned Guarding Remote Monitoring Prison Services Diversified Security Services Security Products
-
4.0x
8.0x
12.0x
16.0x
20.0x
Jan-07 Jan-08 Jan-09 Jan-10 Jan-11 Jan-12 Jan-13 Jan-14 Jan-15 Jan-16 Jan-17
CIT Manned Guarding Remote Monitoring Prison Services Diversified Security Services Security Products
5.0x
10.0x
15.0x
20.0x
25.0x
30.0x
Jan-07 Jan-08 Jan-09 Jan-10 Jan-11 Jan-12 Jan-13 Jan-14 Jan-15 Jan-16 Jan-17
CIT Manned Guarding Remote Monitoring Prison Services Diversified Security Services Security Products

Business Services | February 2017 36
Facility Management – Security Services
Valuation Decomposition & Re-rating Analysis
(1) Adjusted net debt includes net debt, preferred equity, minority interest and unfunded pension liabilities
% Share Price Δ(LTM) % Re-rating & % Earnings Impact (LTM) EV = Adj. Net Debt + Market Cap (1)
NTM EBITDA
EV / NTM EBITDA
% Re-rating (P/E NTM)
% Earnings Impact (NTM Net Income)
4.1%
-
20.0%
40.0%
60.0%
80.0%
100.0%
120.0%
Jan-14 Jul-14 Jan-15 Jul-15 Jan-16 Jul-16 Jan-17
Adjusted Net Debt Market Cap EV
5.8%
(4.0%)
(2.0%)
-
2.0%
4.0%
6.0%
8.0%
10.0%
12.0%
14.0%
Jan-14 Jul-14 Jan-15 Jul-15 Jan-16 Jul-16 Jan-17
NTM EBITDA
(4.4%)
9.0x
10.0x
11.0x
12.0x
Jan-14 Jul-14 Jan-15 Jul-15 Jan-16 Jul-16 Jan-17
EV / NTM EBITDA
(2.0%)
25.5%
44.4%
29.0%
8.9%
3.8%
(3.1%)
19.0%
7.4%
13.9%
(13.3%)
(12.1%)
(15.3%)
54.4%
12.2%
(2.8%)
(3.0%)
11.7%
8.4%
14.1%
(7.5%)
(2.0%)
(11.5%)
15.7%
n/a
11.7%
8.1%
n/a
n/a
(50.0%)(25.0%) 0.0% 25.0% 50.0%
Brink's 51%
Prosegur 41%
GEO 40%
United Tech 25%
Kaba 22%
G4S 13%
Securitas 11%
Avigilon 10%
Axis 5%
CCA 1%
Loomis 0%
Secom (2%)
Gunnebo (2%)
Assa Abloy (8%)
Sohgo Security (27%)
Geovision (39%)

Business Services | February 2017 37
Facility Management
Company Comparable Analysis
Size Share Price Operational KPIs Trading Multiples
Country Mkt. Cap EV Performance Rev. CAGR '17E Margins FCF Net Debt / EV / EBITDA EV / EBITA EV / EBITDA - Capex P / E
Current LTM YTD '15A-'17E EBITDA EBITA '17E LTM EBITDA '16E '17E '16E '17E '16E '17E '16E '17E
United States 7,710 12,482 31.4 5.9% (5.3%) 1.6% 9.9% 7.8% 65.1% 4.5x 10.4x 9.2x 13.2x 11.7x 17.3x 14.1x 24.8x 16.9x
Denmark 6,040 7,988 32.9 0.7% 2.6% 0.7% 6.6% 6.2% 83.8% 2.5x 11.4x 11.1x 12.1x 11.9x 13.3x 13.2x 16.1x 15.4x
United States 2,079 2,276 37.4 (21.7%) (8.7%) 4.0% 4.5% 3.8% 74.8% 1.4x 13.9x 10.1x 17.2x 12.0x 19.0x 13.5x 34.5x 21.0x
United Kingdom 1,080 1,872 2.5 34.5% (1.1%) 13.5% 5.2% 4.9% 88.7% 1.7x 6.1x 6.1x 6.4x 6.4x 6.8x 6.8x 6.3x 6.4x
United Kingdom 1,825 2,007 1.7 (9.2%) (5.1%) (2.5%) 4.0% 2.4% 64.6% 1.3x 13.2x 14.3x 19.7x 23.8x 18.9x 22.1x 30.1x n/m
Canada 1,653 1,911 46.2 68.7% 0.5% 12.8% 9.2% 7.5% 80.3% 2.1x 16.2x 14.0x 19.7x 17.1x 20.9x 17.4x n/m 28.2x
Australia 725 1,285 0.7 (29.0%) (10.6%) 3.1% 9.9% 6.6% 61.5% 2.6x 6.0x 5.7x 8.5x 8.6x 10.5x 9.3x 9.2x 9.7x
United Kingdom 827 1,235 2.3 21.4% 1.9% (1.5%) 5.0% 4.3% 78.7% 1.8x 10.4x 9.7x 12.1x 11.4x 13.2x 12.3x 10.9x 10.9x
Finland 929 1,121 7.4 (17.8%) (0.6%) (2.0%) 4.1% 3.7% 76.7% 1.6x n/m 11.8x n/m 12.8x n/m 15.3x n/m 19.0x
United Kingdom 546 830 3.8 (30.6%) (5.3%) 4.5% 4.9% 4.4% 74.0% 2.3x 4.4x 4.1x 4.9x 4.6x 5.8x 5.6x 5.1x 4.7x
Japan 1,401 943 26.7 (15.2%) (6.2%) 6.5% 6.7% 5.9% 86.8% (3.1x) 5.7x 5.4x 6.6x 6.2x 6.6x 6.3x n/a n/a
Sweden 558 664 5.8 19.3% 11.2% 4.3% 6.5% 6.1% 90.5% 2.9x 13.0x 11.9x 14.0x 12.7x 14.3x 13.1x 16.8x 14.5x
United Kingdom 606 628 5.9 59.0% 8.4% 6.5% 6.1% 5.9% 86.7% 0.4x 10.8x 8.9x 11.2x 9.2x 13.8x 10.2x 16.1x 13.0x
United Kingdom 481 516 4.3 22.0% (2.4%) 35.1% 22.5% 20.6% 86.9% 1.6x 15.2x 11.7x 17.2x 12.8x 18.3x 13.5x 22.6x 17.1x
Australia 102 89 0.2 91.7% (6.8%) 4.5% 3.8% 3.1% 87.9% (1.0x) 6.6x 5.8x 8.6x 7.1x 7.4x 6.6x 38.7x 12.6x
Median 5.9% (2.4%) 4.3% 6.1% 5.9% 80.3% 1.7x 10.6x 9.7x 12.1x 11.7x 13.6x 13.1x 16.5x 14.5x
Mean 13.3% (1.8%) 6.1% 7.3% 6.2% 79.1% 1.5x 10.2x 9.3x 12.3x 11.2x 13.3x 12.0x 19.3x 14.6x
United Kingdom 27,031 30,386 16.4 17.4% (5.9%) 13.7% 9.4% 8.4% 69.7% 1.9x 13.8x 11.8x 15.6x 13.3x 17.5x 17.0x 22.3x 19.3x
France 15,322 17,083 102.4 13.5% (6.3%) 3.3% 7.7% 6.8% 77.6% 0.9x 11.6x 10.4x 13.3x 11.7x 15.2x 13.4x 22.3x 19.0x
France 3,576 5,429 20.7 11.8% (4.7%) 5.2% 8.8% 6.5% 59.3% 3.6x 10.7x 9.7x 14.4x 13.1x 17.9x 16.4x 23.1x 16.4x
Italy 2,065 2,632 8.1 4.2% (5.3%) (0.3%) 9.1% 4.8% 46.8% 1.4x 6.4x 6.0x 11.8x 11.3x 14.2x 12.9x 22.3x 20.4x
United Kingdom 2,162 2,590 4.6 36.4% 1.0% 9.6% 10.4% 6.6% 51.9% 1.9x 10.9x 9.5x 17.5x 15.0x 21.7x 18.2x 24.8x 21.6x
Switzerland 1,291 1,866 49.4 39.6% (0.3%) 6.4% 6.7% 5.1% 77.6% 3.2x 9.9x 8.8x 13.3x 11.4x 13.0x 11.3x 18.0x 14.5x
Japan 1,107 940 20.3 15.6% 2.6% (1.1%) 7.9% 3.6% 45.6% (2.8x) 8.8x 8.9x 19.6x 19.8x 18.4x 19.5x n/a n/a
France 157 141 19.6 40.8% 16.0% (1.0%) 5.8% 4.5% 80.5% (1.6x) 11.4x 9.1x 16.0x 11.8x 16.8x 11.3x n/m n/m
Median 16.5% (2.5%) 4.2% 8.4% 5.8% 64.5% 1.7x 10.8x 9.3x 15.0x 12.5x 17.2x 14.9x 22.3x 19.1x
Mean 22.4% (0.4%) 4.5% 8.2% 5.8% 63.6% 1.1x 10.4x 9.3x 15.2x 13.4x 16.8x 15.0x 22.1x 18.5x
Median 15.6% (2.4%) 4.3%n/m 6.7% 5.9% 77.6% 1.7x 10.8x 9.5x 13.3x 11.8x 14.8x 13.2x 22.3x 16.4x
Mean 16.5% (1.3%) 5.5%n/m 7.6% 6.1% 73.7% 1.3x 10.3x 9.3x 13.3x 12.0x 14.6x 13.0x 20.2x 15.8x

Business Services | February 2017 38
Facility Management
Share Price Performance La
st M
onth
Ye
ar-t
o-D
ate
Last
Tw
elve
Mon
ths
11.2%
8.4%
2.6%1.9%
0.5%
(0.6%) (1.1%)
(2.4%)(5.1%) (5.3%) (5.3%)
(6.2%)(6.8%)
(8.7%)
(10.6%)
16.0%
2.6%1.0%
(0.3%)
(4.7%)(5.3%)
(5.9%)
(6.3%)
S&P 5001.8%
(20.0%)
0.0%
20.0%
91.7%
68.7%59.0%
34.5%22.0%
21.4% 19.3%
5.9%0.7%
(9.2%) (15.2%)
(17.8%)(21.7%)
(29.0%)(30.6%)
40.8% 39.6%36.4%
17.4% 15.6%13.5%
11.8% 4.2%
S&P 50017.5%
(40.0%)
(20.0%)
0.0%
20.0%
40.0%
60.0%
80.0%
100.0%
Facility Management (2.4%) Catering (2.5%)
Median YTD Price Performance
Facility Management 5.9% Catering 16.5%
Median LTM Price Performance
Facility Management (2.4%) Catering (2.5%)
Median LM Price Performance
11.2%
8.4%
2.6%1.9%
0.5%
(0.6%) (1.1%)
(2.4%) (5.1%)(5.3%)
(5.3%)
(6.2%) (6.8%) (8.7%)
(10.6%)
16.0%
2.6% 1.0%
(0.3%)
(4.7%)
(5.3%)
(5.9%) (6.3%)
S&P 5001.8%
(15.0%)
(10.0%)
(5.0%)
0.0%
5.0%
10.0%
15.0%
20.0%
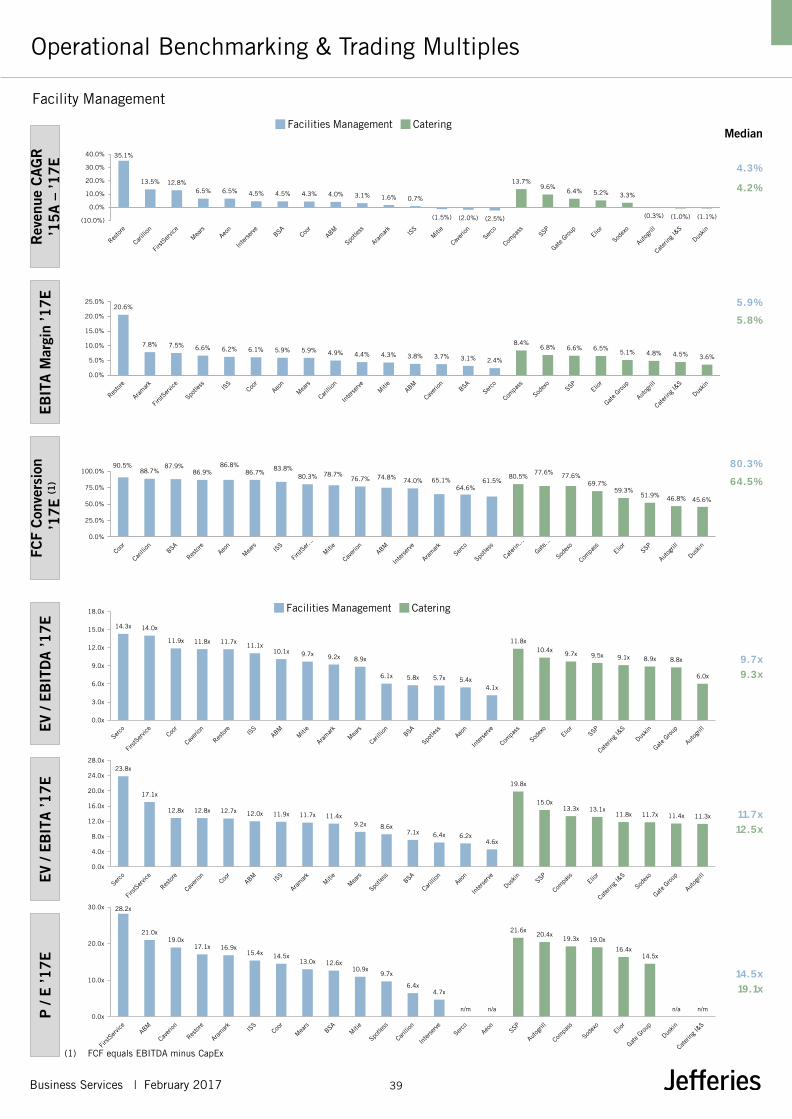
Business Services | February 2017 39
Facility Management
Operational Benchmarking & Trading Multiples
(1) FCF equals EBITDA minus CapEx
Facilities Management Catering
EV
/ EB
ITD
A ’1
7E
EV
/ EB
ITA ’1
7E
P
/ E
’17E
Median
Facilities Management Catering
Rev
enue
CA
GR
’1
5A
– ’1
7E
E
BIT
A M
argi
n ’1
7E
FCF
Con
vers
ion
’17E
(1)
35.1%
13.5% 12.8%6.5% 6.5% 4.5% 4.5% 4.3% 4.0% 3.1% 1.6% 0.7%
(1.5%) (2.0%) (2.5%)
13.7%9.6%
6.4% 5.2% 3.3%
(0.3%) (1.0%) (1.1%)(10.0%)
0.0%
10.0%
20.0%
30.0%
40.0%
4.3%
4.2%
20.6%
7.8% 7.5% 6.6% 6.2% 6.1% 5.9% 5.9% 4.9% 4.4% 4.3% 3.8% 3.7% 3.1% 2.4%
8.4%6.8% 6.6% 6.5%
5.1% 4.8% 4.5% 3.6%
0.0%
5.0%
10.0%
15.0%
20.0%
25.0% 5.9%
5.8%
90.5%88.7%
87.9%86.9%
86.8%86.7%
83.8%80.3% 78.7%
76.7% 74.8% 74.0% 65.1%64.6%
61.5%80.5%
77.6% 77.6%69.7%
59.3%51.9% 46.8% 45.6%
0.0%
25.0%
50.0%
75.0%
100.0%80.3%
64.5%
14.3x 14.0x
11.9x 11.8x 11.7x11.1x
10.1x 9.7x 9.2x 8.9x
6.1x 5.8x 5.7x 5.4x4.1x
11.8x10.4x
9.7x 9.5x 9.1x 8.9x 8.8x
6.0x
0.0x
3.0x
6.0x
9.0x
12.0x
15.0x
18.0x
23.8x
17.1x
12.8x 12.8x 12.7x 12.0x 11.9x 11.7x 11.4x9.2x 8.6x
7.1x 6.4x 6.2x4.6x
19.8x
15.0x13.3x 13.1x
11.8x 11.7x 11.4x 11.3x
0.0x
4.0x
8.0x
12.0x
16.0x
20.0x
24.0x
28.0x
28.2x
21.0x19.0x
17.1x 16.9x15.4x 14.5x
13.0x 12.6x10.9x
9.7x
6.4x4.7x
n/m n/a
21.6x20.4x
19.3x 19.0x
16.4x14.5x
n/a n/m0.0x
10.0x
20.0x
30.0x
14.5x
19.1x
9.7x
9.3x
11.7x
12.5x

Business Services | February 2017 40
Facility Management
Trading Multiples Through Time E
V / N
TM E
BIT
DA
E
V / N
TM E
BIT
A
P /
NTM
E
M edian NT M EV / EBIT DA 10 yrs 5 yrs 3yrs 1 yr Current
Facility M anagement 7.4x 8.0x 8.9x 9.6x 10.2x
Catering 7.3x 7.6x 8.3x 9.0x 9.6x
All Facility M anagement 7.4x 8.0x 8.7x 9.5x 9.7x
M edian NT M EV / EBIT A 10 yrs 5 yrs 3yrs 1 yr Current
Facility M anagement 8.8x 9.4x 10.5x 11.4x 11.5x
Catering 10.0x 11.7x 13.1x 13.2x 13.3x
All Facility M anagement 9.3x 10.1x 11.4x 12.0x 12.1x
M edian NT M P / E 10 yrs 5 yrs 3yrs 1 yr Current
Facility M anagement 12.1x 12.6x 14.4x 14.5x 15.2x
Catering 17.1x 18.3x 19.7x 20.6x 19.5x
All Facility M anagement 14.2x 14.7x 16.4x 17.4x 16.8x
4.0x
5.0x
6.0x
7.0x
8.0x
9.0x
10.0x
11.0x
12.0x
Jan-07 Jan-08 Jan-09 Jan-10 Jan-11 Jan-12 Jan-13 Jan-14 Jan-15 Jan-16 Jan-17
Facility Management Catering
4.0x
6.0x
8.0x
10.0x
12.0x
14.0x
16.0x
Jan-07 Jan-08 Jan-09 Jan-10 Jan-11 Jan-12 Jan-13 Jan-14 Jan-15 Jan-16 Jan-17
Facility Management Catering
5.0x
7.0x
9.0x
11.0x
13.0x
15.0x
17.0x
19.0x
21.0x
23.0x
25.0x
Jan-07 Jan-08 Jan-09 Jan-10 Jan-11 Jan-12 Jan-13 Jan-14 Jan-15 Jan-16 Jan-17
Facility Management Catering
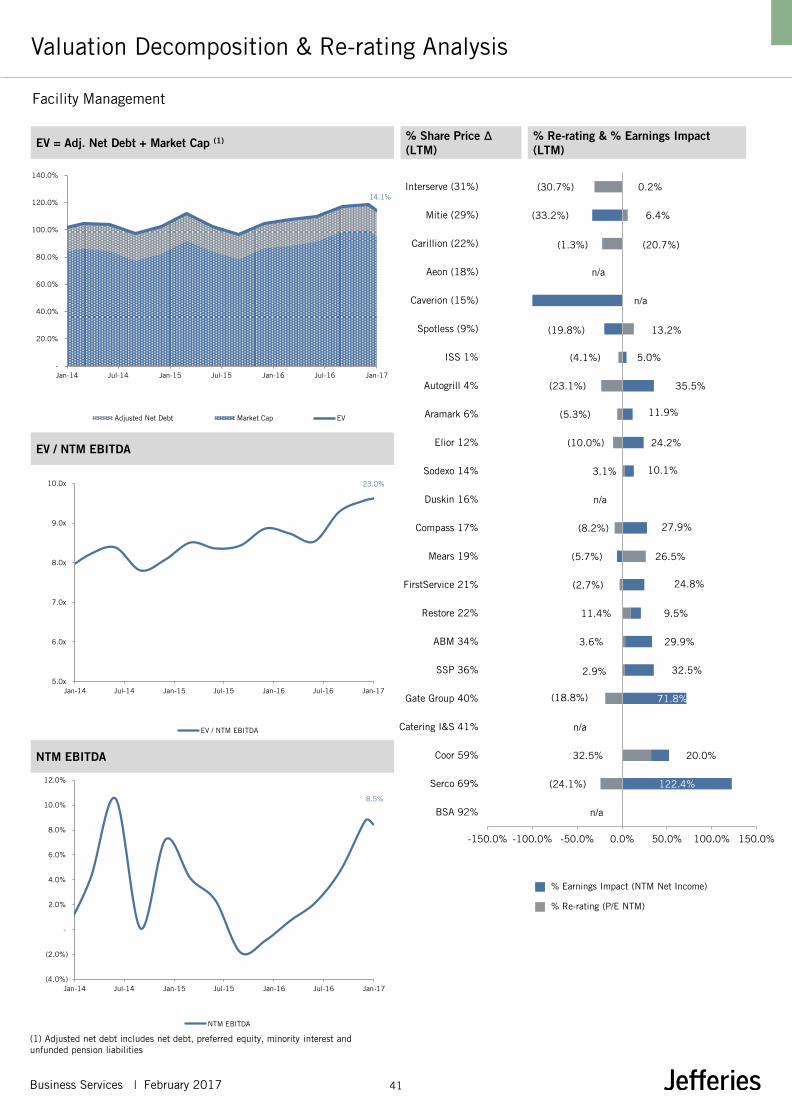
Business Services | February 2017 41
Facility Management
Valuation Decomposition & Re-rating Analysis
(1) Adjusted net debt includes net debt, preferred equity, minority interest and unfunded pension liabilities
NTM EBITDA
EV / NTM EBITDA
% Share Price Δ (LTM)
% Re-rating & % Earnings Impact (LTM) EV = Adj. Net Debt + Market Cap (1)
% Re-rating (P/E NTM)
% Earnings Impact (NTM Net Income)
n/a
(24.1%)
32.5%
n/a
(18.8%)
2.9%
3.6%
9.5%
(2.7%)
26.5%
(8.2%)
n/a
3.1%
(10.0%)
(5.3%)
(23.1%)
(4.1%)
13.2%
n/a
(20.7%)
6.4%
(30.7%)
122.4%
20.0%
71.8%
32.5%
29.9%
11.4%
24.8%
(5.7%)
27.9%
10.1%
24.2%
11.9%
35.5%
5.0%
(19.8%)
n/a
(1.3%)
(33.2%)
0.2%
-150.0% -100.0% -50.0% 0.0% 50.0% 100.0% 150.0%
BSA 92%
Serco 69%
Coor 59%
Catering I&S 41%
Gate Group 40%
SSP 36%
ABM 34%
Restore 22%
FirstService 21%
Mears 19%
Compass 17%
Duskin 16%
Sodexo 14%
Elior 12%
Aramark 6%
Autogrill 4%
ISS 1%
Spotless (9%)
Caverion (15%)
Aeon (18%)
Carillion (22%)
Mitie (29%)
Interserve (31%)14.1%
-
20.0%
40.0%
60.0%
80.0%
100.0%
120.0%
140.0%
Jan-14 Jul-14 Jan-15 Jul-15 Jan-16 Jul-16 Jan-17
Adjusted Net Debt Market Cap EV
23.0%
5.0x
6.0x
7.0x
8.0x
9.0x
10.0x
Jan-14 Jul-14 Jan-15 Jul-15 Jan-16 Jul-16 Jan-17
EV / NTM EBITDA
8.5%
(4.0%)
(2.0%)
-
2.0%
4.0%
6.0%
8.0%
10.0%
12.0%
Jan-14 Jul-14 Jan-15 Jul-15 Jan-16 Jul-16 Jan-17
NTM EBITDA

Business Services | February 2017 42
Facility Management – Industrial Services
Company Comparable Analysis
Size Share Price Operational KPIs Trading Multiples
Country Mkt. Cap EV Performance Rev. CAGR '17E Margins FCF Net Debt / EV / EBITDA EV / EBITA EV / EBITDA - Capex P / E
Current LTM YTD '15A-'17E EBITDA EBITA '17E LTM EBITDA '16E '17E '16E '17E '16E '17E '16E '17E
United Kingdom 5,255 7,311 10.4 (2.4%) (6.3%) 14.4% 12.9% 12.2% 78.2% 2.7x 9.9x 9.0x 10.7x 9.5x 13.0x 11.5x 12.1x 10.6x
Netherlands 3,080 4,740 30.8 (14.5%) 4.6% (10.2%) 8.7% 7.9% 89.0% 1.5x 5.4x 5.6x 5.9x 6.2x 6.0x 6.3x 6.6x 7.3x
United States 2,952 4,226 51.4 28.8% 4.9% (6.5%) 16.7% 7.6% 64.7% 2.8x 11.3x 9.5x n/m 20.8x 22.3x 14.7x n/m n/m
France 3,236 4,739 21.0 n/a n/a 8.8% 7.4% 7.3% 91.9% 3.6x 12.3x 9.9x 12.5x 10.1x 13.3x 10.8x 17.8x 14.2x
United States 5,029 5,374 33.3 91.9% 3.0% 3.9% 8.3% 6.0% 69.5% 0.7x 10.3x 8.6x 15.7x 11.8x 16.3x 12.3x 22.5x 16.8x
Germany 1,702 1,676 38.5 (4.6%) 6.1% (22.3%) 3.4% 1.4% 51.2% 0.0x n/m 12.6x n/m n/m n/m 24.5x 6.3x n/m
United States 992 1,769 12.4 7.1% 4.7% (7.1%) 17.2% 8.8% 67.8% 2.2x 7.5x 7.5x 15.4x 14.6x 10.3x 11.0x 31.9x 26.2x
Sweden 1,234 1,498 6.1 107.3% (1.8%) 4.8% 6.8% 6.7% 97.6% 3.1x 15.1x 13.4x 15.5x 13.6x 15.5x 13.7x 17.4x 15.4x
Panama 1,812 2,093 7.5 193.5% 9.6% (3.7%) 10.0% 6.2% 79.0% 0.9x 7.4x 7.9x 10.6x 12.8x n/m 10.0x 23.7x n/m
United States 893 1,229 31.1 40.0% (14.4%) 18.1% 10.8% 8.1% 73.1% 4.5x 13.3x 9.0x 25.9x 11.9x n/m 12.3x n/m 17.6x
Canada 355 700 3.3 (19.7%) 23.6% (15.9%) 18.0% (16.5%) 69.7% 3.0x 8.7x 11.5x n/m n/m 11.9x 16.4x n/a n/m
Channel Islands 254 401 2.1 227.8% 60.9% 8.6% 8.5% 6.5% 69.2% 1.7x 4.9x 4.8x 6.3x 6.3x 6.9x 7.0x 6.5x 6.3x
United States 573 608 35.7 92.3% 2.1% 6.5% 7.0% 3.7% 66.6% 0.5x 8.8x 7.8x 18.7x 14.9x 13.7x 11.7x 30.9x 23.3x
United States 551 555 20.8 18.1% (1.3%) 2.6% 5.9% 4.4% 75.8% 0.1x 8.7x 7.3x 11.8x 9.7x 11.6x 9.6x 19.3x 16.7x
Isle of Man 363 268 1.1 9.9% (0.8%) (31.8%) 6.2% 4.3% 40.7% (1.4x) 6.4x 11.4x 11.3x 16.5x 11.6x n/m 35.4x n/m
United Kingdom 90 104 1.0 0.0% 2.4% 26.5% 24.3% 22.4% 89.0% 1.8x 10.0x 8.9x 10.8x 9.7x 10.8x 10.0x 12.9x 11.4x
Germany 39 43 2.1 25.4% 18.3% 1.5% 6.2% 3.2% n/a 0.0x 3.0x 2.8x 6.4x 5.6x n/a n/a 23.2x 14.1x
Median 21.8% 3.8% 2.6% 8.5% 6.5% 71.4% 1.7x 8.8x 8.9x 11.5x 11.8x 11.9x 11.5x 18.6x 14.8x
Mean 50.1% 7.2% (0.1%) 10.5% 5.9% 73.3% 1.6x 8.9x 8.7x 12.7x 11.6x 12.6x 12.1x 19.0x 15.0x
Curaçao 107,942 118,239 77.6 15.8% (0.3%) (6.6%) 24.3% 14.3% 70.8% 1.1x 20.0x 16.9x n/m 28.9x n/m 23.9x n/m n/m
United States 45,317 53,267 52.4 77.9% 4.6% (11.2%) 18.7% 10.9% 71.4% 2.0x 26.7x 16.4x n/m 28.3x n/m 23.0x n/m n/m
United States 24,715 23,960 58.5 45.0% (2.9%) (19.8%) 13.6% 5.1% 59.7% (1.0x) n/m 18.8x n/m n/m n/m n/m n/m n/m
Ireland 4,736 10,792 4.8 (22.7%) 4.4% (17.0%) 11.9% (1.0%) 67.0% 8.9x n/m 15.1x n/m n/m n/m 22.5x n/m n/m
Channel Islands 3,633 5,149 10.7 15.9% 5.5% 5.0% 10.3% 7.6% 64.4% 5.8x 7.6x 7.2x 10.8x 9.7x 12.8x 11.2x 11.4x 9.9x
United Kingdom 3,631 3,715 9.8 30.3% (4.3%) 3.1% 8.1% 6.7% 80.3% 0.9x 9.6x 9.3x 11.8x 11.3x 12.0x 11.6x 16.1x 16.3x
Luxembourg 4,104 2,835 12.6 (19.1%) (3.8%) (13.8%) 18.1% 6.9% 70.7% (0.7x) 2.9x 4.8x 4.7x 12.5x 4.4x 6.8x 8.8x 28.0x
Netherlands 1,188 1,782 14.6 117.7% 2.6% (20.0%) 10.8% (0.8%) 38.8% 1.3x 10.6x 10.9x n/m n/m 20.1x n/m n/m n/m
Netherlands 2,440 1,949 11.0 7.2% 0.2% (30.3%) 5.3% (19.3%) n/m (1.8x) n/m n/m n/m n/m n/m n/m n/m n/m
Norway 1,353 1,595 5.0 19.3% 1.9% (15.1%) 6.0% 2.7% 56.8% 0.7x 7.3x 10.2x 10.2x 22.8x 8.7x 18.0x n/m n/m
United States 2,249 2,292 15.8 69.9% 7.2% (6.3%) 6.9% 6.4% 92.3% 0.6x 14.8x 8.0x 20.2x 8.7x 16.1x 8.7x n/m 12.8x
United Kingdom 1,053 1,151 6.5 81.4% (11.5%) (12.6%) 6.8% 3.2% 51.6% 1.4x n/m 29.5x n/m n/m n/m n/m n/m n/m
United States 176 219 2.8 56.2% (6.5%) (7.5%) 2.8% 0.9% 72.4% (2.2x) 29.2x 10.9x n/m n/m n/m 15.0x n/m n/m
Median 30.3% 0.2% (12.6%) 10.3% 5.1% 68.9% 0.9x 10.6x 10.9x 10.8x 12.5x 12.4x 15.0x 11.4x 14.6x
Mean 38.1% (0.2%) (11.7%) 11.1% 3.4% 66.4% 1.3x 14.3x 13.2x 11.5x 17.4x 12.4x 15.6x 12.1x 16.8x
United States 7,162 6,997 51.4 23.6% 5.7% 2.4% 4.9% 3.9% 73.4% (0.3x) 8.5x 8.1x 11.2x 10.1x 11.6x 11.0x 27.5x 18.8x
United States 6,556 6,295 54.3 49.2% 2.7% (3.2%) 6.2% 5.6% 89.3% (0.5x) 10.3x 10.0x 11.7x 11.0x 11.5x 11.1x 28.1x 18.4x
United Kingdom 2,007 3,522 5.1 7.2% (6.0%) (3.7%) 6.2% 6.1% 87.7% 3.2x 8.8x 9.6x 8.8x 9.8x 9.6x 11.0x 8.8x 8.9x
United States 2,320 2,561 40.5 65.0% 1.3% 8.8% 11.8% 10.7% 91.7% 1.4x 13.2x 11.3x 14.7x 12.4x 14.1x 12.3x 27.7x 19.8x
Median 36.4% 2.0% (0.4%) 6.2% 5.8% 88.5% 0.5x 9.5x 9.8x 11.4x 10.5x 11.6x 11.1x 27.6x 18.6x
Mean 36.3% 0.9% 1.1% 7.3% 6.6% 85.5% 1.0x 10.2x 9.7x 11.6x 10.8x 11.7x 11.4x 23.0x 16.5x
Median 25.4% 2.4% (5.0%)n/m 8.4% 6.1% 71.1% 1.2x 9.6x 9.5x 11.3x 11.5x 11.9x 11.5x 17.8x 15.8x
Mean 43.7% 3.5% (4.4%)n/m 10.3% 5.0% 72.2% 1.4x 10.8x 10.4x 12.2x 13.1x 12.4x 13.1x 18.8x 15.6x
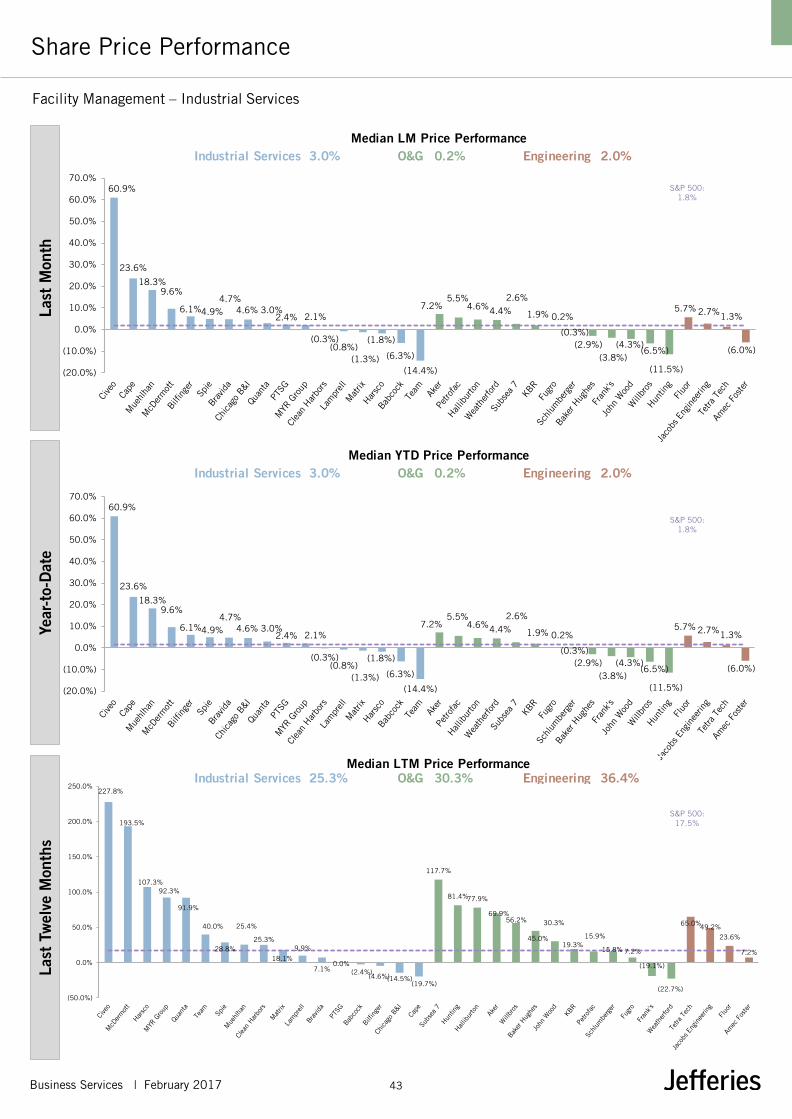
Business Services | February 2017 43
Facility Management – Industrial Services
Share Price Performance La
st M
onth
Ye
ar-t
o-D
ate
Last
Tw
elve
Mon
ths
227.8%
193.5%
107.3%92.3%
91.9%
40.0%
28.8%
25.4%
25.3%
18.1%
9.9%
7.1%0.0%
(2.4%)(4.6%)(14.5%)
(19.7%)
117.7%
81.4%77.9%
69.9%56.2%
45.0%
30.3%
19.3%15.9%
15.8% 7.2%
(19.1%)
(22.7%)
65.0%49.2%
23.6%
7.2%
(50.0%)
0.0%
50.0%
100.0%
150.0%
200.0%
250.0%
60.9%
23.6%
18.3%9.6%
6.1%4.9%4.7%
4.6% 3.0%2.4% 2.1%
(0.3%)(0.8%)
(1.3%)
(1.8%)
(6.3%)
(14.4%)
7.2%5.5%
4.6%4.4%2.6%
1.9% 0.2%
(0.3%)(2.9%)
(3.8%)(4.3%)
(6.5%)
(11.5%)
5.7% 2.7%1.3%
(6.0%)
(20.0%)
(10.0%)
0.0%
10.0%
20.0%
30.0%
40.0%
50.0%
60.0%
70.0%
60.9%
23.6%
18.3%9.6%
6.1%4.9%4.7%
4.6% 3.0%2.4% 2.1%
(0.3%)(0.8%)
(1.3%)
(1.8%)
(6.3%)
(14.4%)
7.2%5.5%
4.6%4.4%2.6%
1.9% 0.2%
(0.3%)(2.9%)
(3.8%)(4.3%)
(6.5%)
(11.5%)
5.7% 2.7%1.3%
(6.0%)
(20.0%)
(10.0%)
0.0%
10.0%
20.0%
30.0%
40.0%
50.0%
60.0%
70.0%
Industrial Services 3.0% O&G 0.2% Engineering 2.0%Median LM Price Performance
Industrial Services 3.0% O&G 0.2% Engineering 2.0%Median YTD Price Performance
Industrial Services 25.3% O&G 30.3% Engineering 36.4%Median LTM Price Performance
S&P 500: 1.8%
S&P 500: 1.8%
S&P 500: 17.5%

Business Services | February 2017 44
Facility Management – Industrial Services
Operational Benchmarking & Trading Multiples
(1) FCF equals EBITDA minus CapEx
Industrial Services O&G Engineering
EV
/ EB
ITD
A ’1
7E
EV
/ EB
ITA ’1
7E
P
/ E
’17E
Median
Industrial Services O&G Engineering
Rev
enue
CA
GR
’1
5A
– ’1
7E
E
BIT
A M
argi
n ’1
7E
FCF
Con
vers
ion
’17E
(1)
2.6%
(12.6%)
(0.4%)
6.5%
5.1%
5.8%
97.6%
91.9%89.0%
89.0%79.0%
78.2%
75.8%
73.1%69.7%
69.5%
69.2%
67.8%
66.6%
64.7%
51.2%
40.7%
n/a
92.3%80.3%
72.4%71.4%70.8%
70.7%
67.0%
64.4%
59.7%56.8%
51.6%
38.8%
n/m
91.7%89.3%
87.7%
73.4%
0.0%
20.0%
40.0%
60.0%
80.0%
100.0% 71.4%
68.9%
88.5%
13.4x 12.6x
11.5x 11.4x9.9x 9.5x
9.0x 9.0x 8.9x 8.6x 7.9x 7.8x 7.5x 7.3x5.6x 4.8x
2.8x
29.5x
18.8x 16.9x16.4x 15.1x
10.9x10.9x
10.2x 9.3x8.0x 7.2x
4.8x
n/m
11.3x 10.0x 9.6x8.1x
0.0x
5.0x
10.0x
15.0x
20.0x
25.0x
30.0x
35.0x
8.9x
10.9x
9.8x
20.8x
16.5x
14.9x14.6x
13.6x
12.8x
11.9x11.8x
10.1x9.7x
9.7x9.5x
6.3x6.2x
5.6x
n/mn/m
28.9x n/a
22.8x
12.5x11.3x
9.7x8.7x
n/m n/mn/m n/m n/m n/m
12.4x11.0x 10.1x 9.8x
0.0x
5.0x
10.0x
15.0x
20.0x
25.0x
30.0x
35.0x
11.8x
12.5x
10.5x
26.2x23.3x
17.6x16.8x
16.7x15.4x
14.2x
14.1x
11.4x10.6x
7.3x6.3x
n/m
n/m
n/mn/m
n/m
28.0x
16.3x
12.8x
9.9x
n/m n/m n/mn/m
n/m n/mn/m n/m n/m
19.8x 18.8x 18.4x
8.9x
0.0x
5.0x
10.0x
15.0x
20.0x
25.0x
30.0x
14.8x
14.6x
18.6x
26.5%
18.1% 14.4%
8.8%8.6%
6.5%4.8%
3.9%2.6%
1.5%
(3.7%)
(6.5%)
(7.1%)
(10.2%)(15.9%)
(22.3%)(31.8%)
5.0%
3.1%
(6.3%) (6.6%) (7.5%)(11.2%)
(12.6%)
(13.8%)
(15.1%)
(17.0%)
(19.8%)
(20.0%)
(30.3%)
8.8%2.4%
(3.2%)(3.7%)
(40.0%)
(30.0%)
(20.0%)
(10.0%)
0.0%
10.0%
20.0%
30.0%
22.4%
12.2%
8.8%
8.1%
7.9%7.6%
7.3%6.7%
6.5%6.2%
6.0%4.4%
4.3%3.7%
3.2%1.4%
(16.5%)
14.3%10.9%
7.6%6.9%
6.7% 6.4% 5.1%3.2%
2.7%
0.9%
(0.8%)(1.0%)
(19.3%)
10.7%6.1%
5.6%3.9%
(25.0%)
(20.0%)
(15.0%)
(10.0%)
(5.0%)
0.0%
5.0%
10.0%
15.0%
20.0%
25.0%

Business Services | February 2017 45
Facility Management – Industrial Services
Trading Multiples Through Time E
V / N
TM E
BIT
DA
E
V / N
TM E
BIT
A
P /
NTM
E
M edian NT M E V / E BIT DA 10 yrs 5 yrs 3yrs 1 yr Current
Industrial S ervices 6.7x 6.4x 6.6x 6.9x 8.7x
O&G 6.7x 6.5x 7.0x 8.7x 10.0x
E ngineering 7.9x 7.7x 7.9x 8.2x 9.3x
All Industrial S ervices 6.9x 6.7x 7.1x 7.6x 9.1x
M edian NT M E V / E BIT A 10 yrs 5 yrs 3yrs 1 yr Current
Industrial S ervices 9.5x 9.5x 10.1x 10.1x 11.4x
O&G 8.7x 8.6x 9.4x 9.6x 10.8x
E ngineering 8.7x 8.5x 8.7x 9.1x 10.7x
All Industrial S ervices 9.0x 8.8x 9.4x 9.8x 11.3x
M edian NT M P / E 10 yrs 5 yrs 3yrs 1 yr Current
Industrial S ervices 14.1x 13.7x 13.9x 13.3x 15.6x
O&G 12.9x 11.8x 13.1x 12.4x 15.8x
E ngineering 15.0x 13.8x 13.9x 14.6x 18.7x
All Industrial S ervices 13.7x 13.3x 13.7x 13.3x 16.1x
-
2.0x
4.0x
6.0x
8.0x
10.0x
12.0x
14.0x
Jan-07 Jan-08 Jan-09 Jan-10 Jan-11 Jan-12 Jan-13 Jan-14 Jan-15 Jan-16 Jan-17
Industrial Services O&G Engineering
-
2.0x
4.0x
6.0x
8.0x
10.0x
12.0x
14.0x
16.0x
Jan-07 Jan-08 Jan-09 Jan-10 Jan-11 Jan-12 Jan-13 Jan-14 Jan-15 Jan-16 Jan-17
Industrial Services O&G Engineering
-
5.0x
10.0x
15.0x
20.0x
25.0x
30.0x
Jan-07 Jan-08 Jan-09 Jan-10 Jan-11 Jan-12 Jan-13 Jan-14 Jan-15 Jan-16 Jan-17
Industrial Services O&G Engineering

Business Services | February 2017 46
Facility Management – Industrial Services
Valuation Decomposition & Re-rating Analysis
(1) Adjusted net debt includes net debt, preferred equity, minority interest and unfunded pension liabilities
% Re-rating (P/E NTM)
NTM EBITDA
EV / NTM EBITDA
% Share Price Δ (LTM)
% Re-rating & % Earnings Impact (LTM) EV = Adj. Net Debt + Market Cap (1)
% Earnings Impact (NTM Net Income)
n/a
92.7%
181.5%
110.7%
40.6%
n/a
(19.5%)
613.4%
53.1%
48.4%
0.0%
41.7%
10.9%
108.3%
120.0%
56.5%
41.6%
50.7%
20.5%
30.3%
26.4%
(6.2%)
(8.2%)
375.6%
(32.1%)
n/a
0.0%
n/a
13.0%
(26.4%)
(8.8%)
36.5%
121.0%
(76.2%)
7.7%
n/a
0.6%
n/a
n/a
(8.0%)
16.1%
(39.8%)
(43.1%)
(21.0%)
(15.7%)
(21.6%)
(3.8%)
(11.1%)
n/a
(15.2%)
n/a
14.2%
n/a
6.3%
(79.9%)
(13.8%)
n/a
18.3%
n/a
(150.0%) (75.0%) 0.0% 75.0% 150.0%
Civeo 228%
McDermott 193%
Subsea 7 118%
Harsco 107%
MYR Group 92%
Quanta 92%
Hunting 81%
Halliburton 78%
Aker 70%
Tetra Tech 65%
Willbros 56%
Jacobs Engineering 49%
Baker Hughes 45%
Team 40%
John Wood 30%
Spie 29%
Muehlhan 25%
Clean Harbors 25%
Fluor 24%
KBR 19%
Matrix 18%
Petrofac 16%
Schlumberger 16%
Lamprell 10%
Amec Foster 7%
Fugro 7%
Bravida 7%
PTSG (0%)
Babcock (2%)
Bilfinger (5%)
Chicago B&I (14%)
Frank's (19%)
Cape (20%)
Weatherford (23%)
Bravida (n/a)
(17.0%)
-
20.0%
40.0%
60.0%
80.0%
100.0%
120.0%
140.0%
Jan-14 Jul-14 Jan-15 Jul-15 Jan-16 Jul-16 Jan-17
Adjusted Net Debt Market Cap EV
36.7%
5.0x
6.0x
7.0x
8.0x
9.0x
10.0x
11.0x
Jan-14 Jul-14 Jan-15 Jul-15 Jan-16 Jul-16 Jan-17
EV / NTM EBITDA
(53.3%)
(60.0%)
(50.0%)
(40.0%)
(30.0%)
(20.0%)
(10.0%)
-
10.0%
Jan-14 Jul-14 Jan-15 Jul-15 Jan-16 Jul-16 Jan-17
NTM EBITDA

Business Services | February 2017 47
Facility Management – Airport Services
Company Comparable Analysis
Size Share Price Operational KPIs Trading Multiples
Country Mkt. Cap EV Performance Rev. CAGR '17E Margins FCF Conv. Net Debt / EV / EBITDA EV / EBITA EV / (EBITDA - Capex) P / E
€m, unless specified Current LTM YTD '15A-'17E EBITDA EBITA '17E LTM EBITDA '16E '17E '16E '17E '16E '17E '16E '17E
Ground HandlingFraport Germany 5,103 8,138 55.3 (0.9%) (1.6%) 2.8% 34.3% 22.5% 55.5% 3.7x 7.8x 8.5x 10.6x 13.0x 10.8x 15.4x 13.3x 17.4xSats Singapore 3,866 3,307 3.5 35.7% 8.9% 2.9% 17.6% 13.7% 78.3% (1.2x) 16.3x 15.7x 21.1x 20.3x 20.8x 20.1x 24.9x 23.6xBBA Aviation United Kingdom 3,352 4,737 3.3 71.7% (1.3%) 20.3% 14.9% 12.0% 75.3% 6.1x 12.2x 11.2x 15.9x 13.8x 17.6x 14.8x 17.9x 15.4xSaudi Ground Services Saudi Arabia 2,555 2,609 13.6 34.5% (16.7%) 8.3% 31.6% n/a 85.8% (0.1x) 11.3x 11.2x n/m n/m 12.7x 13.1x 13.6x 13.3xBangkok Aviation Fuel Services Thailand 619 644 1.0 24.6% 1.4% n/a n/a n/a n/a (0.5x) 12.1x n/a 14.6x n/m 20.2x n/a 21.4x n/aJohn Menzies United Kingdom 572 737 7.0 45.8% 0.2% 10.7% 4.5% 3.6% 68.1% 2.1x 7.9x 6.0x 10.4x 7.6x 13.0x 8.9x 15.2x 13.6xCelebi Hava Servisi Turkey 147 205 6.0 (30.8%) 7.0% 2.3% 20.1% 16.8% n/a 1.5x 8.1x 5.4x 10.6x 6.5x n/a n/a 19.6x 7.9x
Median 6.5 34.5% 0.2% 5.6% 18.9% 13.7% 75.3% 1.5x 11.3x 9.9x 12.6x 13.0x 15.3x 14.8x 17.9x 14.5x
Mean 12.8 25.8% (0.3%)n/m 7.9%n/m 20.5% 13.7%n/m 72.6%n/m 1.7xn/m 10.8x 9.7xn/m 13.9x 12.2x 15.9x 14.5xn/m 18.0x 15.2x
Aircraft MROSIA Engineering Singapore 2,578 1,891 2.3 0.9% 3.6% (0.7%) 12.7% 9.1% 55.1% (3.6x) 21.4x 20.7x n/m n/m n/m n/m 23.5x 24.1xWesco Aircraft United States 1,390 2,130 14.0 34.2% 1.3% 1.5% 13.7% 12.9% 94.3% 7.2x 12.0x 10.9x 12.8x 11.6x 12.9x 11.5x 15.4x 12.8xHong Kong Aircraft Engineering Company Hong Kong 1,063 1,365 6.4 8.5% 3.3% 4.6% 10.3% 6.4% 55.8% 2.4x 10.1x 8.4x 17.8x 13.5x 21.3x 15.0x 17.7x 16.9xAir Transport Services United States 890 1,344 14.9 65.8% 1.1% 20.1% 30.2% 13.1% n/m 2.0x 6.9x 5.4x 20.5x 12.4x n/m n/m 23.7x 15.0x
Median 10.2 21.4% 2.3% 3.0% 13.2% 11.0% 55.8% 2.2x 11.0x 9.6x 17.8x 12.4x 17.1x 13.3x 20.6x 16.0x
Mean 9.4 27.3% 2.3% 6.4% 16.7% 10.4% 68.4% 2.0x 12.6x 11.3x 17.0x 12.5x 17.1x 13.3x 20.1x 17.2x
Total Median 6.4 34.2% 1.3% 3.7% 16.3% 12.9% 71.7% 2.0x 11.3x 9.7x 14.6x 12.7x 15.3x 14.8x 17.9x 15.2x
Total Mean 11.6 26.3% 0.6% 7.3% 19.0% 12.2% 71.0% 1.8x 11.5x 10.3x 14.9x 12.3x 16.2x 14.1x 18.8x 16.0x
Company

Business Services | February 2017 48
Facility Management – Airport Services
Share Price Performance La
st M
onth
Ye
ar-t
o-D
ate
Last
Tw
elve
Mon
ths
8.9%7.0%
1.4% 0.2%
(1.3%)(1.6%)
(16.7%)
3.6% 3.3%1.3% 1.1%
S&P 5001.8%
(20.0%)
0.0%
20.0%
Sats Celebi HavaServisi
BangkokAviation Fuel
Services
John Menzies BBA Aviation Fraport Saudi GroundServices
SIA Engineering Hong KongAircraft
EngineeringCompany
Wesco Aircraft Air TransportServices
Ground Handling 0.2% Aircraft MRO 2.3%
Median YTD Price Performance
8.9%7.0%
1.4% 0.2%
(1.3%) (1.6%)
(16.9%)
3.6% 3.3%
1.3% 1.1%
S&P 5001.8%
(20.0%)
(15.0%)
(10.0%)
(5.0%)
0.0%
5.0%
10.0%
15.0%
Sats Celebi HavaServisi
BangkokAviation Fuel
Services
John Menzies BBA Aviation Fraport Saudi GroundServices
SIA Engineering Hong KongAircraft
EngineeringCompany
Wesco Aircraft Air TransportServices
Ground Handling 0.2% Aircraft MRO 2.3%
Median LM Price Performance
71.7%
45.8%
35.7%34.5%
24.6%
(0.9%)
(30.8%)
65.8%
34.2%
8.5%
0.9%
S&P 50017.5%
(40.0%)
(20.0%)
0.0%
20.0%
40.0%
60.0%
80.0%
BBA Aviation John Menzies Sats Saudi GroundServices
Bangkok AviationFuel Services
Fraport Celebi Hava Servisi Air TransportServices
Wesco Aircraft Hong Kong AircraftEngineeringCompany
SIA Engineering
Ground Handling 34.5% Aircraft MRO 21.4%
Median LTM Price Performance

Business Services | February 2017 49
Facility Management – Airport Services
Operational Benchmarking & Trading Multiples
(1) FCF equals EBITDA minus CapEx
EV
/ EB
ITD
A ’1
7E
E
V / E
BIT
A ’1
7E
P
/ E
’17E
Median
Rev
enue
CA
GR
’1
5A
– ’1
7E
E
BIT
A M
argi
n ’1
7E
FCF
Con
vers
ion
’17E
(1)
5.6%
3.0%
22.5%
16.8%
13.7%12.0%
3.6%
n/a n/a
13.1% 12.9%
9.1%6.4%
0.0%
5.0%
10.0%
15.0%
20.0%
25.0%
Fraport Celebi Hava Servisi Sats BBA Aviation John Menzies Saudi GroundServices
Bangkok AviationFuel Services
Air TransportServices
Wesco Aircraft SIA Engineering Hong Kong AircraftEngineeringCompany
13.7%
11.0%
85.8%78.3% 75.3%
68.1%
55.5%
n/a n/a
94.3%
55.8% 55.1%
n/m0.0%
20.0%
40.0%
60.0%
80.0%
100.0%
Saudi Ground Services Sats BBA Aviation John Menzies Fraport Bangkok Aviation FuelServices
Celebi Hava Servisi Wesco Aircraft Hong Kong AircraftEngineering Company
SIA Engineering Air Transport Services
75.3%55.8%
15.7x
11.2x 11.2x
8.5x
6.0x 5.4x
n/a
20.7x
10.9x
8.4x
5.4x
0.0x
5.0x
10.0x
15.0x
20.0x
25.0x
Sats Saudi Ground Services BBA Aviation Fraport John Menzies Celebi Hava Servisi Bangkok Aviation FuelServices
SIA Engineering Wesco Aircraft Hong Kong AircraftEngineering Company
Air Transport Services
9.9x
9.6x
20.3x
13.8x 13.0x
7.6x6.5x
n/a n/a
13.5x12.4x 11.6x
n/a0.0x
5.0x
10.0x
15.0x
20.0x
25.0x
Sats BBA Aviation Fraport John Menzies Celebi Hava Servisi Saudi Ground Services Bangkok Aviation FuelServices
Hong Kong AircraftEngineering Company
Air Transport Services Wesco Aircraft SIA Engineering
13.0x
12.4x
23.6x
17.4x15.4x
13.6x 13.3x
7.9x
n/a
24.1x
16.9x15.0x
12.8x
0.0x
5.0x
10.0x
15.0x
20.0x
25.0x
30.0x
Sats Fraport BBA Aviation John Menzies Saudi Ground Services Celebi Hava Servisi Bangkok Aviation FuelServices
SIA Engineering Hong Kong AircraftEngineering Company
Air Transport Services Wesco Aircraft
14.5x
16.0x
20.3%
10.7%8.3%
2.9% 2.8%2.3%
n/a
20.1%
4.6%
1.5% (0.7%)
-5.0%
0.0%
5.0%
10.0%
15.0%
20.0%
25.0%
BBA Aviation John Menzies Saudi Ground Services Sats Fraport Celebi Hava Servisi Bangkok Aviation FuelServices
Air Transport Services Hong Kong AircraftEngineering Company
Wesco Aircraft SIA Engineering
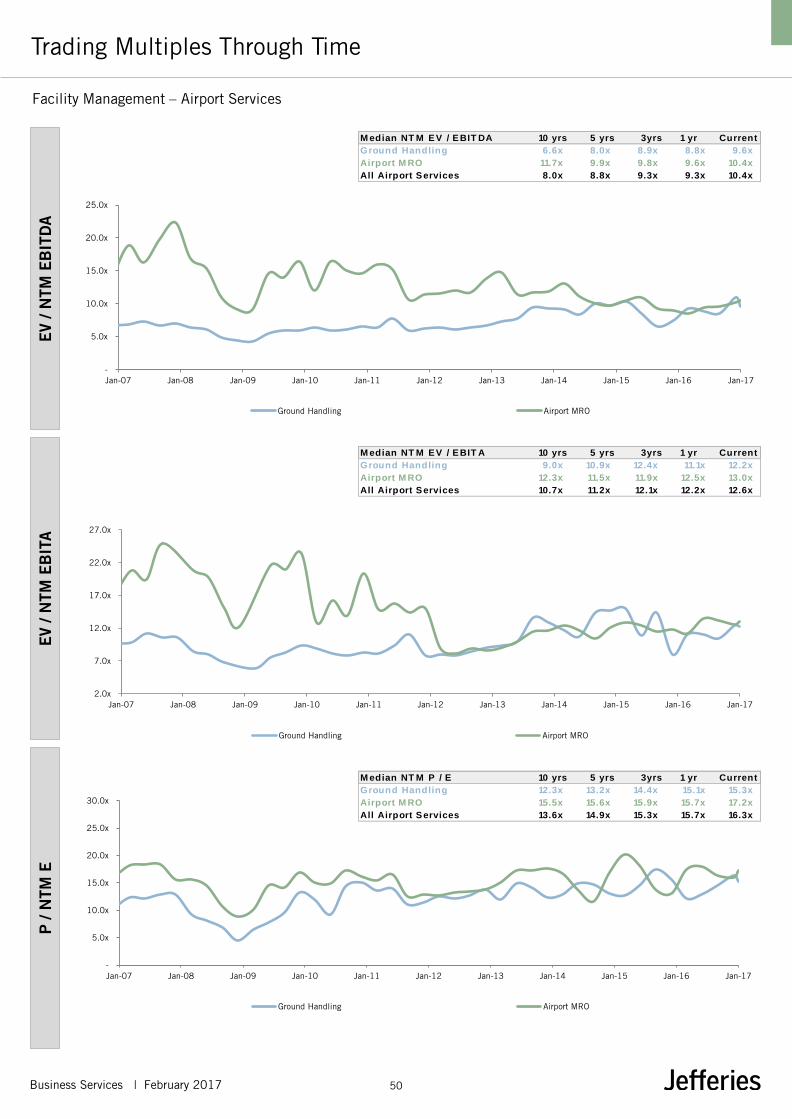
Business Services | February 2017 50
Facility Management – Airport Services
Trading Multiples Through Time E
V / N
TM E
BIT
DA
E
V / N
TM E
BIT
A
P /
NTM
E
M edian NT M EV / EBIT DA 10 yrs 5 yrs 3yrs 1 yr Current
Ground Handling 6.6x 8.0x 8.9x 8.8x 9.6x
Airport M RO 11.7x 9.9x 9.8x 9.6x 10.4x
All Airport Services 8.0x 8.8x 9.3x 9.3x 10.4x
M edian NT M EV / EBIT A 10 yrs 5 yrs 3yrs 1 yr Current
Ground Handling 9.0x 10.9x 12.4x 11.1x 12.2x
Airport M RO 12.3x 11.5x 11.9x 12.5x 13.0x
All Airport Services 10.7x 11.2x 12.1x 12.2x 12.6x
M edian NT M P / E 10 yrs 5 yrs 3yrs 1 yr Current
Ground Handling 12.3x 13.2x 14.4x 15.1x 15.3x
Airport M RO 15.5x 15.6x 15.9x 15.7x 17.2x
All Airport Services 13.6x 14.9x 15.3x 15.7x 16.3x
-
5.0x
10.0x
15.0x
20.0x
25.0x
Jan-07 Jan-08 Jan-09 Jan-10 Jan-11 Jan-12 Jan-13 Jan-14 Jan-15 Jan-16 Jan-17
Ground Handling Airport MRO
2.0x
7.0x
12.0x
17.0x
22.0x
27.0x
Jan-07 Jan-08 Jan-09 Jan-10 Jan-11 Jan-12 Jan-13 Jan-14 Jan-15 Jan-16 Jan-17
Ground Handling Airport MRO
-
5.0x
10.0x
15.0x
20.0x
25.0x
30.0x
Jan-07 Jan-08 Jan-09 Jan-10 Jan-11 Jan-12 Jan-13 Jan-14 Jan-15 Jan-16 Jan-17
Ground Handling Airport MRO

Business Services | February 2017 51
Facility Management – Airport Services
Valuation Decomposition & Re-rating Analysis
(1) Adjusted net debt includes net debt, preferred equity, minority interest (2) and unfunded pension liabilities
NTM EBITDA
EV / NTM EBITDA
% Share Price Δ (LTM) EV = Adj. Net Debt + Market Cap (1) % Re-rating & % Earnings Impact (LTM)
% Re-rating (P/E NTM)
% Earnings Impact (NTM Net Income)
34.7%
25.7%
n/a
(6.4%)
(22.6%)
26.4%
25.3%
49.2%
27.5%
n/a
8.0%
n/a
5.8%
(10.7%)
31.1%
7.1%
(27.3%)
n/a
(75.0%) 0.0% 75.0%
BBA Aviation 72%
John Menzies 46%
Sats 36%
Saudi Ground Services 34%
Bangkok Aviation Fuel Services 25%
Fraport (1%)
Saudi Ground Services (n/a)
Air Transport Services 66%
Wesco Aircraft 34%
Hong Kong Aircraft EngineeringCompany 9%
SIA Engineering 1%
8.6%
-
20.0%
40.0%
60.0%
80.0%
100.0%
120.0%
Jan-14 Jul-14 Jan-15 Jul-15 Jan-16 Jul-16 Jan-17
Adjusted Net Debt Market Cap EV
10.6%
7.0x
8.0x
9.0x
10.0x
11.0x
Jan-14 Jul-14 Jan-15 Jul-15 Jan-16 Jul-16 Jan-17
EV / NTM EBITDA
16.8%
(5.0%)
-
5.0%
10.0%
15.0%
20.0%
Jan-14 Jul-14 Jan-15 Jul-15 Jan-16 Jul-16 Jan-17
NTM EBITDA

Business Services | February 2017 52
PAGE INTENTIONALLY LEFT BLANK
53 Business Services | September 2016
Compliance & Assurance Services

Business Services | February 2017 54
Compliance & Assurance Services – TIC
Company Comparable Analysis
Size Share Price Operational KPIs Trading Multiples
Country Mkt. Cap EV Performance Rev. CAGR '17E Margins FCF Net Debt / EV / EBITDA EV / EBITA EV / EBITDA - Capex P / E
€m, unless specified Current LTM YTD '15A-'17E EBITDA EBITA '17E EBITDA LTM '16E '17E '16E '17E '16E '17E '16E '17E
Majors
SGS Switzerland 14,911 15,816 1,960.5 5.5% 1.0% 4.6% 20.5% 16.1% 75.2% 0.7x 15.0x 13.2x 19.3x 16.8x 20.2x 17.6x 29.3x 24.1x
Bureau Veritas France 7,903 10,228 18.1 3.2% (1.6%) 0.9% 19.2% 17.6% 81.7% 2.4x 11.8x 11.3x 12.8x 12.3x 14.4x 13.8x 19.1x 18.3x
Intertek United Kingdom 6,355 7,461 39.5 19.9% (2.6%) 13.0% 19.7% 16.6% 75.8% 2.2x 12.9x 11.8x 15.3x 13.9x 16.9x 15.5x 20.8x 18.6x
Eurofins Scientific Luxembourg 7,024 7,895 415.0 37.1% 2.5% 21.4% 19.1% 14.7% 61.5% 2.3x 16.4x 14.4x 21.4x 18.7x n/m 23.4x n/m 34.8x
ALS Australia 2,094 2,413 4.2 78.9% (2.0%) 0.5% 22.1% 16.0% 76.4% 1.7x 13.0x 11.2x 18.8x 15.4x 17.5x 14.6x n/m 22.2x
Applus Spain 1,371 2,053 10.6 40.9% 9.5% (2.9%) 12.0% 11.7% 74.4% 3.3x 10.8x 10.6x 11.1x 11.0x 14.8x 14.3x 16.5x 15.9x
Median 28.5% (0.3%) 2.7% 19.4% 16.1% 75.5% 2.3x 13.0x 11.5x 17.1x 14.7x 16.9x 15.1x 20.0x 20.4x
Mean 30.9% 1.1% 6.3% 18.8% 15.5% 74.2% 2.1x 13.3x 12.1x 16.5x 14.7x 16.8x 16.5x 21.4x 22.3x
Minors
Exponent United States 1,377 1,216 53.8 13.1% (3.7%) 2.1% 25.9% 22.2% 94.1% (2.3x) 19.3x 16.4x 21.2x 19.2x 20.7x 17.4x 31.3x 31.8x
Exova United Kingdom 566 777 2.3 n/a n/a 7.9% 19.8% 16.3% 70.8% 2.7x 10.3x 9.8x 12.4x 11.9x 14.4x 13.8x 15.4x 14.8x
Mistras United States 616 694 21.4 48.6% 2.2% (0.5%) 12.4% 8.4% 77.7% 1.2x 9.3x 8.5x 13.7x 12.6x 11.6x 11.0x 26.4x 23.0x
Median n/m n/m 2.1% 19.8% 16.3% 77.7% 1.2x 10.3x 9.8x 13.7x 12.6x 14.4x 13.8x 26.4x 23.0x
Mean n/m n/m 3.2% 19.4% 15.6% 80.9% 0.5x 13.0x 11.6x 15.8x 14.5x 15.6x 14.1x 24.4x 23.2x
Other TIC
CTI China 1,149 1,024 1.4 (4.8%) (11.9%) 26.8% 19.6% 15.1% 79.2% (3.2x) 23.2x 18.7x 29.7x 24.2x n/m 23.7x 35.8x 28.2x
Team United States 893 1,229 31.1 40.0% (14.4%) 18.1% 10.8% 8.1% 73.1% 4.5x 13.3x 9.0x 25.9x 11.9x n/m 12.3x n/m 17.6x
Sporton Taiwan 468 439 5.2 (11.6%) 2.6% 0.1% 38.8% 31.6% 73.6% (0.9x) 13.3x 12.0x 16.1x 14.8x 18.0x 16.4x 23.0x 18.7x
Opus Sweden 238 311 0.8 36.8% 20.0% 4.5% 21.4% 10.6% 90.7% 2.6x 8.8x 7.6x 19.7x 15.4x 14.3x 8.4x 25.9x 20.3x
Median 16.0% (4.6%) 11.3% 20.5% 12.9% 76.4% 0.8x 13.3x 10.5x 22.8x 15.1x 16.2x 14.3x 25.9x 19.5x
Mean 15.1% (0.9%) 12.4% 22.6% 16.4% 79.1% 0.7x 14.7x 11.8x 22.8x 16.6x 16.2x 15.2x 28.2x 21.2x
Median n/m n/m 4.5%n/m 19.7% 16.0% 75.8% 2.2x 13.0x 11.3x 18.8x 14.8x 15.8x 14.6x 24.4x 20.3x
Mean n/m n/m 7.4%n/m 20.1% 15.8% 77.2% 1.3x 13.7x 11.9x 18.3x 15.2x 16.3x 15.5x 24.3x 22.2x
Company

Business Services | February 2017 55
Compliance & Assurance Services – TIC
Share Price Performance La
st M
onth
Ye
ar-t
o-D
ate
Last
Tw
elve
Mon
ths
9.5%
2.5% 1.0%
(1.6%) (2.0%) (2.6%)
2.2%
(3.7%)
(10.1%)
20.0%
2.6%
(11.9%)(14.4%)
S&P 5001.8%
(20.0%)
0.0%
20.0%
40.0%
Applus EurofinsScientific
SGS BureauVeritas
ALS Intertek Exova Exponent Mistras Opus Sporton CTI Team
Majors (0.3%) Minors (3.7%) Other TIC (4.6%)
Median YTD Price Performance
9.5%
2.5%1.0%
(1.6%) (2.0%) (2.6%)
2.2%
(3.7%)
(10.1%)
20.0%
2.6%
(11.9%)
(14.4%)
S&P 5001.8%
(20.0%)
(15.0%)
(10.0%)
(5.0%)
0.0%
5.0%
10.0%
15.0%
20.0%
25.0%
Applus EurofinsScientific
SGS BureauVeritas
ALS Intertek Exova Exponent Mistras Opus Sporton CTI Team
Majors (0.3%) Minors (3.7%) Other TIC (4.6%)
Median LM Price Performance
78.9%
40.9%37.1%
19.9%
5.5% 3.2%
48.6%
13.1%
2.2%
40.0% 36.8%
(4.8%)(11.6%)
S&P 50017.5%
(20.0%)
(10.0%)
0.0%
10.0%
20.0%
30.0%
40.0%
50.0%
60.0%
70.0%
80.0%
90.0%
ALS Applus EurofinsScientific
Intertek SGS BureauVeritas
Exova Exponent Mistras Team Opus CTI Sporton
Majors 28.5% Minors 13.1% Other TIC 16.0%
Median LTM Price Performance

Business Services | February 2017 56
Compliance & Assurance Services – TIC
Operational Benchmarking & Trading Multiples
(1) FCF equals EBITDA minus CapEx
Majors Minors Other TIC
EV
/ EB
ITD
A ’1
7E
EV
/ EB
ITA ’1
7E
P
/ E
’17E
Median
Majors Minors Other TIC
Rev
enue
CA
GR
’1
5A
– ’1
7E
EB
ITA M
argi
n ’1
7E
FCF
Con
vers
ion
’17E
(1)
21.4%
13.0%
4.6%
0.9% 0.5%
(2.9%)
7.9%
2.1%
(0.5%)
26.8%
18.1%
4.5%
0.1%
-5.0%
0.0%
5.0%
10.0%
15.0%
20.0%
25.0%
30.0%
EurofinsScientific
Intertek SGS Bureau Veritas ALS Applus Exova Exponent Mistras CTI Team Opus Sporton
2.7%
2.1%
11.3%
17.6% 16.6% 16.1% 16.0%14.7%
11.7%
22.2%
16.3%
8.4%
31.6%
15.1%
10.6%8.1%
0.0%
5.0%
10.0%
15.0%
20.0%
25.0%
30.0%
35.0%
Bureau Veritas Intertek SGS ALS EurofinsScientific
Applus Exponent Exova Mistras Sporton CTI Opus Team
16.1%
16.3%
12.9%
81.7%76.4% 75.8% 75.2% 74.4%
61.5%
94.1%
77.7%70.8%
90.7%
79.2%73.6% 73.1%
0.0%
20.0%
40.0%
60.0%
80.0%
100.0%
Bureau Veritas ALS Intertek SGS Applus EurofinsScientific
Exponent Mistras Exova Opus CTI Sporton Team
75.5%
77.7%
76.4%
14.4x13.2x
11.8x 11.3x 11.2x 10.6x
16.4x
9.8x8.5x
18.7x
12.0x
9.0x7.6x
0.0x2.0x4.0x6.0x8.0x
10.0x12.0x14.0x16.0x18.0x20.0x
EurofinsScientific
SGS Intertek Bureau Veritas ALS Applus Exponent Exova Mistras CTI Sporton Team Opus
18.7x16.8x
15.4x13.9x
12.3x11.0x
19.2x
12.6x 11.9x
24.2x
15.4x 14.8x
11.9x
0.0x
5.0x
10.0x
15.0x
20.0x
25.0x
30.0x
EurofinsScientific
SGS ALS Intertek Bureau Veritas Applus Exponent Mistras Exova CTI Opus Sporton Team
14.7x
12.6x
15.1x
34.8x
24.1x22.2x
18.6x 18.3x15.9x
31.8x
23.0x
14.8x
28.2x
20.3x 18.7x 17.6x
0.0x
5.0x
10.0x
15.0x
20.0x
25.0x
30.0x
35.0x
40.0x
EurofinsScientific
SGS ALS Intertek Bureau Veritas Applus Exponent Mistras Exova CTI Opus Sporton Team
20.4x
23.0x
19.5x
11.5x
9.8x
10.5x

Business Services | February 2017 57
Compliance & Assurance Services – TIC
Trading Multiples Through Time E
V / N
TM E
BIT
DA
E
V / N
TM E
BIT
A
P /
NTM
E
M edian NT M E V / E BIT DA 10 yrs 5 yrs 3yrs 1 yr Current
M ajors 10.9x 11.8x 11.8x 12.0x 11.9x
M inors 9.0x 9.6x 9.7x 9.7x 9.8x
Others 9.8x 10.2x 10.5x 9.8x 10.6x
All T IC 10.2x 11.2x 11.3x 11.2x 11.3x
M edian NT M E V / E BIT A 10 yrs 5 yrs 3yrs 1 yr Current
M ajors 13.1x 14.1x 14.3x 15.1x 15.3x
M inors 11.7x 12.3x 12.8x 13.5x 12.6x
Others 12.4x 12.7x 13.2x 12.9x 14.9x
All T IC 12.7x 13.4x 13.5x 13.9x 14.7x
M edian NT M P / E 10 yrs 5 yrs 3yrs 1 yr Current
M ajors 18.7x 19.2x 19.0x 19.1x 19.6x
M inors 19.9x 21.0x 19.5x 14.6x 18.8x
Others 18.0x 18.1x 18.9x 18.1x 22.0x
All T IC 18.8x 19.1x 19.0x 18.4x 20.9x
2.0x
4.0x
6.0x
8.0x
10.0x
12.0x
14.0x
16.0x
18.0x
Jan-07 Jan-08 Jan-09 Jan-10 Jan-11 Jan-12 Jan-13 Jan-14 Jan-15 Jan-16 Jan-17
Majors Minors Others
2.0x
4.0x
6.0x
8.0x
10.0x
12.0x
14.0x
16.0x
18.0x
Jan-07 Jan-08 Jan-09 Jan-10 Jan-11 Jan-12 Jan-13 Jan-14 Jan-15 Jan-16 Jan-17
Majors Minors Others
5.0x
10.0x
15.0x
20.0x
25.0x
30.0x
Jan-07 Jan-08 Jan-09 Jan-10 Jan-11 Jan-12 Jan-13 Jan-14 Jan-15 Jan-16 Jan-17
Majors Minors Others

Business Services | February 2017 58
Compliance & Assurance Services – TIC
Valuation Decomposition & Re-rating Analysis
(1) Adjusted net debt includes net debt, preferred equity, minority interest and unfunded pension liabilities % Re-rating (P/E NTM)
NTM EBITDA
EV / NTM EBITDA
% Share Price Δ (LTM) % Re-rating & % Earnings Impact (LTM) EV = Adj. Net Debt + Market Cap (1)
% Earnings Impact (NTM Net Income)
68.7%
33.8%
57.6%
n/a
13.7%
55.3%
1.5%
12.2%
4.5%
9.0%
(17.0%)
(13.5%)
6.0%
11.0%
(10.6%)
20.6%
(11.9%)
18.0%
0.8%
0.9%
(5.4%)
23.1%
n/a
2.2%
(40.0%) 0.0% 40.0% 80.0%
ALS 79%
Exova 49%
Applus 41%
Team 40%
Eurofins Scientific 37%
Opus 37%
Intertek 20%
Exponent 13%
SGS 5%
Bureau Veritas 3%
Mistras 2%
CTI (5%)
Sporton (12%)2.0%
-
20.0%
40.0%
60.0%
80.0%
100.0%
120.0%
Jan-14 Jul-14 Jan-15 Jul-15 Jan-16 Jul-16 Jan-17
Adjusted Net Debt Market Cap EV
(0.6%)
8.0x
9.0x
10.0x
11.0x
12.0x
13.0x
14.0x
Jan-14 Jul-14 Jan-15 Jul-15 Jan-16 Jul-16 Jan-17
EV / NTM EBITDA
(7.6%)
(20.0%)
(18.0%)
(16.0%)
(14.0%)
(12.0%)
(10.0%)
(8.0%)
(6.0%)
(4.0%)
(2.0%)
-
Jan-14 Jul-14 Jan-15 Jul-15 Jan-16 Jul-16 Jan-17
NTM EBITDA
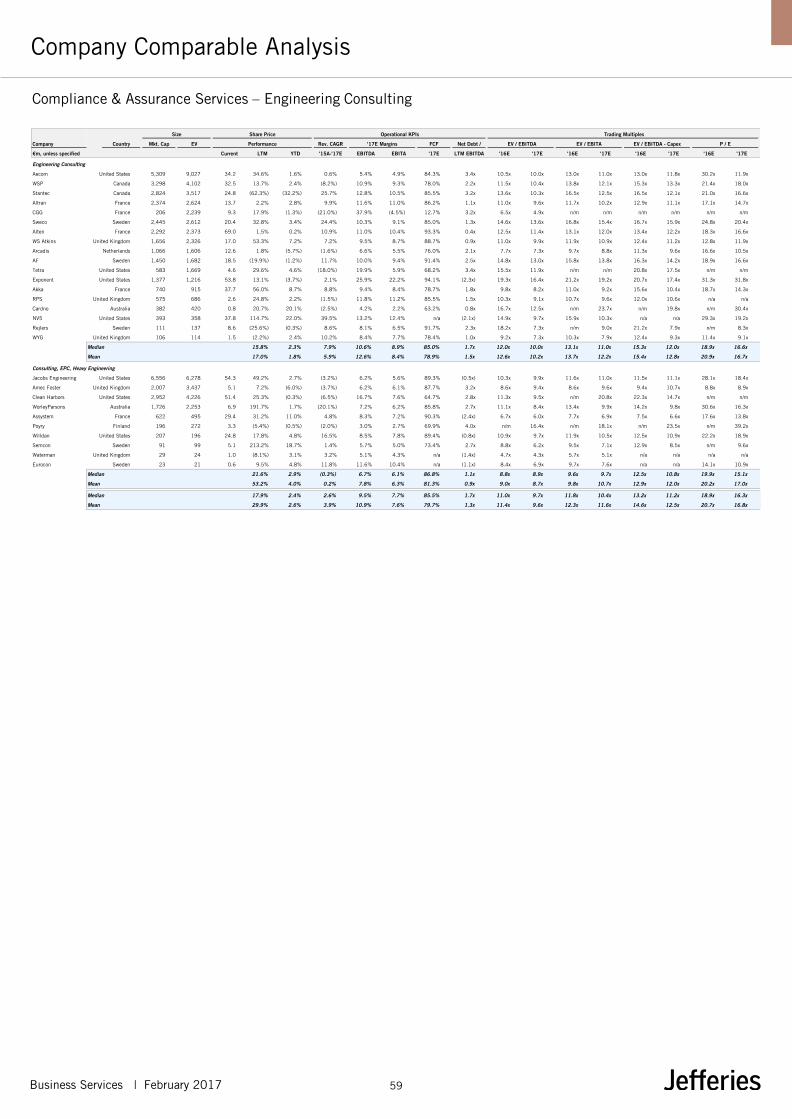
Business Services | February 2017 59
Compliance & Assurance Services – Engineering Consulting
Company Comparable Analysis
Size Share Price Operational KPIs Trading Multiples
Country Mkt. Cap EV Performance Rev. CAGR '17E Margins FCF Net Debt / EV / EBITDA EV / EBITA EV / EBITDA - Capex P / E
€m, unless specified Current LTM YTD '15A-'17E EBITDA EBITA '17E LTM EBITDA '16E '17E '16E '17E '16E '17E '16E '17E
Engineering Consulting
Aecom United States 5,309 9,027 34.2 34.6% 1.6% 0.6% 5.4% 4.9% 84.3% 3.4x 10.5x 10.0x 13.0x 11.0x 13.0x 11.8x 30.2x 11.9x
WSP Canada 3,298 4,102 32.5 13.7% 2.4% (8.2%) 10.9% 9.3% 78.0% 2.2x 11.5x 10.4x 13.8x 12.1x 15.3x 13.3x 21.4x 18.0x
Stantec Canada 2,824 3,517 24.8 (62.3%) (32.2%) 25.7% 12.8% 10.5% 85.5% 3.2x 13.6x 10.3x 16.5x 12.5x 16.5x 12.1x 21.0x 16.6x
Altran France 2,374 2,624 13.7 2.2% 2.8% 9.9% 11.6% 11.0% 86.2% 1.1x 11.0x 9.6x 11.7x 10.2x 12.9x 11.1x 17.1x 14.7x
CGG France 206 2,239 9.3 17.9% (1.3%) (21.0%) 37.9% (4.5%) 12.7% 3.2x 6.5x 4.9x n/m n/m n/m n/m n/m n/m
Sweco Sweden 2,445 2,612 20.4 32.8% 3.4% 24.4% 10.3% 9.1% 85.0% 1.3x 14.6x 13.6x 16.8x 15.4x 16.7x 15.9x 24.8x 20.4x
Alten France 2,292 2,373 69.0 1.5% 0.2% 10.9% 11.0% 10.4% 93.3% 0.4x 12.5x 11.4x 13.1x 12.0x 13.4x 12.2x 18.3x 16.6x
WS Atkins United Kingdom 1,656 2,326 17.0 53.3% 7.2% 7.2% 9.5% 8.7% 88.7% 0.9x 11.0x 9.9x 11.9x 10.9x 12.4x 11.2x 12.8x 11.9x
Arcadis Netherlands 1,066 1,606 12.6 1.8% (5.7%) (1.6%) 6.6% 5.5% 76.0% 2.1x 7.7x 7.3x 9.7x 8.8x 11.3x 9.6x 16.6x 10.5x
AF Sweden 1,450 1,682 18.5 (19.9%) (1.2%) 11.7% 10.0% 9.4% 91.4% 2.5x 14.8x 13.0x 15.8x 13.8x 16.3x 14.2x 18.9x 16.6x
Tetra United States 583 1,669 4.6 29.6% 4.6% (18.0%) 19.9% 5.9% 68.2% 3.4x 15.5x 11.9x n/m n/m 20.8x 17.5x n/m n/m
Exponent United States 1,377 1,216 53.8 13.1% (3.7%) 2.1% 25.9% 22.2% 94.1% (2.3x) 19.3x 16.4x 21.2x 19.2x 20.7x 17.4x 31.3x 31.8x
Akka France 740 915 37.7 56.0% 8.7% 8.8% 9.4% 8.4% 78.7% 1.8x 9.8x 8.2x 11.0x 9.2x 15.6x 10.4x 18.7x 14.3x
RPS United Kingdom 575 686 2.6 24.8% 2.2% (1.5%) 11.8% 11.2% 85.5% 1.5x 10.3x 9.1x 10.7x 9.6x 12.0x 10.6x n/a n/a
Cardno Australia 382 420 0.8 20.7% 20.1% (2.5%) 4.2% 2.2% 63.2% 0.8x 16.7x 12.5x n/m 23.7x n/m 19.8x n/m 30.4x
NV5 United States 393 358 37.8 114.7% 22.0% 39.5% 13.2% 12.4% n/a (2.1x) 14.9x 9.7x 15.9x 10.3x n/a n/a 29.3x 19.2x
Rejlers Sweden 111 137 8.6 (25.6%) (0.3%) 8.6% 8.1% 6.5% 91.7% 2.3x 18.2x 7.3x n/m 9.0x 21.2x 7.9x n/m 8.3x
WYG United Kingdom 106 114 1.5 (2.2%) 2.4% 10.2% 8.4% 7.7% 78.4% 1.0x 9.2x 7.3x 10.3x 7.9x 12.4x 9.3x 11.4x 9.1x
Median 15.8% 2.3% 7.9% 10.6% 8.9% 85.0% 1.7x 12.0x 10.0x 13.1x 11.0x 15.3x 12.0x 18.9x 16.6x
Mean 17.0% 1.8% 5.9% 12.6% 8.4% 78.9% 1.5x 12.6x 10.2x 13.7x 12.2x 15.4x 12.8x 20.9x 16.7x
Consulting, EPC, Heavy Engineering
Jacobs Engineering United States 6,556 6,278 54.3 49.2% 2.7% (3.2%) 6.2% 5.6% 89.3% (0.5x) 10.3x 9.9x 11.6x 11.0x 11.5x 11.1x 28.1x 18.4x
Amec Foster United Kingdom 2,007 3,437 5.1 7.2% (6.0%) (3.7%) 6.2% 6.1% 87.7% 3.2x 8.6x 9.4x 8.6x 9.6x 9.4x 10.7x 8.8x 8.9x
Clean Harbors United States 2,952 4,226 51.4 25.3% (0.3%) (6.5%) 16.7% 7.6% 64.7% 2.8x 11.3x 9.5x n/m 20.8x 22.3x 14.7x n/m n/m
WorleyParsons Australia 1,726 2,253 6.9 191.7% 1.7% (20.1%) 7.2% 6.2% 85.8% 2.7x 11.1x 8.4x 13.4x 9.9x 14.2x 9.8x 30.6x 16.3x
Assystem France 622 495 29.4 31.2% 11.0% 4.8% 8.3% 7.2% 90.3% (2.4x) 6.7x 6.0x 7.7x 6.9x 7.5x 6.6x 17.6x 13.8x
Poyry Finland 196 272 3.3 (5.4%) (0.5%) (2.0%) 3.0% 2.7% 69.9% 4.0x n/m 16.4x n/m 18.1x n/m 23.5x n/m 39.2x
Willdan United States 207 196 24.8 17.8% 4.8% 16.5% 8.5% 7.8% 89.4% (0.8x) 10.9x 9.7x 11.9x 10.5x 12.5x 10.9x 22.2x 18.9x
Semcon Sweden 91 99 5.1 213.2% 18.7% 1.4% 5.7% 5.0% 73.4% 2.7x 8.8x 6.2x 9.5x 7.1x 12.9x 8.5x n/m 9.6x
Waterman United Kingdom 29 24 1.0 (8.1%) 3.1% 3.2% 5.1% 4.3% n/a (1.4x) 4.7x 4.3x 5.7x 5.1x n/a n/a n/a n/a
Eurocon Sweden 23 21 0.6 9.5% 4.8% 11.8% 11.6% 10.4% n/a (1.1x) 8.4x 6.9x 9.7x 7.6x n/a n/a 14.1x 10.9x
Median 21.6% 2.9% (0.3%) 6.7% 6.1% 86.8% 1.1x 8.8x 8.9x 9.6x 9.7x 12.5x 10.8x 19.9x 15.1x
Mean 53.2% 4.0% 0.2% 7.8% 6.3% 81.3% 0.9x 9.0x 8.7x 9.8x 10.7x 12.9x 12.0x 20.2x 17.0x
Median 17.9% 2.4%n/m 2.6%n/m 9.5% 7.7%n/m 85.5%n/m 1.7xn/m 11.0x 9.7xn/m 11.8x 10.4xn/m 13.2x 11.2xn/m 18.9x 16.3x
Mean 29.9% 2.6%n/m 3.9%n/m 10.9% 7.6%n/m 79.7%n/m 1.3xn/m 11.4x 9.6xn/m 12.3x 11.6xn/m 14.6x 12.5xn/m 20.7x 16.8x
Company

Business Services | February 2017 60
Compliance & Assurance Services – Engineering Consulting
Share Price Performance La
st M
onth
Ye
ar-t
o-D
ate
Last
Tw
elve
Mon
ths
Engineering Consulting 2.3% Consulting, EPC, Heavy Engineering 2.9%Median YTD Price Performance
22.0%20.1%
8.7%7.2%
4.6%
3.4%
2.8%
2.4%
2.4%
2.2%
1.6%
0.2%
(0.3%)
(1.2%)
(1.3%)
(3.7%)
(5.7%)
(32.2%)
18.7%11.0%
4.8%4.8%
3.1%2.7%
1.7%
(0.3%)
(0.5%)
(6.0%)
S&P 5001.8%
(40.0%)
(20.0%)
0.0%
20.0%
40.0%
22.0%
20.1%
8.7%7.2%
4.6%3.4%
2.8%2.4%
2.4%2.2%
1.6%0.2%
(0.3%)(1.2%) (1.3%)
(3.7%)(5.7%)
(32.2%)
18.7%
11.0%
4.8%4.8% 3.1%
2.7%
1.7%
(0.3%)
(0.5%)
(6.0%)
S&P 5001.8%
(40.0%)
(30.0%)
(20.0%)
(10.0%)
0.0%
10.0%
20.0%
30.0%
Engineering Consulting 2.3% Consulting, EPC, Heavy Engineering 2.9%Median LM Price Performance
114.7%
56.0%
53.3%34.6%
32.8%
29.6%
24.8%
20.7%
17.9%
13.7%
13.1%2.2%
1.8%1.5%
(2.2%)(19.9%)
(25.6%)
(62.3%)
213.2%
191.7%
49.2%31.2%
25.3%17.8%
9.5%7.2%
(5.4%)(8.1%)
S&P 50017.5%
(100.0%)
(50.0%)
0.0%
50.0%
100.0%
150.0%
200.0%
250.0%
Engineering Consulting 15.8% Consulting, EPC, Heavy Engineering 21.6%Median LTM Price Performance

Business Services | February 2017 61
Compliance & Assurance Services – Engineering Consulting
Operational Benchmarking & Trading Multiples
(1) FCF equals EBITDA minus CapEx
EV
/ EB
ITD
A ’1
7E
E
V / E
BIT
A ’1
7E
P
/ E
’17E
Median Engineering Consulting Consulting, EPC, Heavy Engineering
Engineering Consulting Consulting, EPC, Heavy Engineering
15 .2 x
11.7 x
Rev
enue
CA
GR
’1
5A
– ’1
7E
EB
ITA M
argi
n ’1
7E
FCF
Con
vers
ion
’17E
(1)
26.6%
25.7% 24.4%
11.7% 10.9% 10.2% 9.9% 8.8% 8.6% 7.2%2.1% 0.6%
(1.5%)
(1.6%)
(2.5%) (8.2%)
(18.0%)(21.0%)
16.5%11.8%
4.8% 3.2%1.4%
(2.0%)
(3.2%)
(3.7%)
(6.5%)
(20.1%)(30.0%)(20.0%)(10.0%)
0.0%10.0%20.0%30.0%40.0%50.0%
7.9%
(0.3%)
22.2%
12.4% 11.2%
11.0%
10.5%
10.4%
9.4%
9.3%
9.1%
8.7%
8.4%
7.7%
6.5%
5.9%
5.5%
4.9%
2.2%
(4.5%)
10.4%7.8% 7.6% 7.2%
6.2% 6.1% 5.6% 5.0% 4.3% 2.7%
-10.0%
-5.0%
0.0%
5.0%
10.0%
15.0%
20.0%
25.0%
8.9%
6.1%
94.1%
93.3%91.7%
91.4%88.7%
86.2%85.5%
85.5%85.0%
84.3% 78.7%78.4%
78.0%
76.0%
68.2% 63.2%
12.7%
n/a
90.3%
89.4%89.3%
87.7%85.8%
73.4% 69.9%64.7%
n/a n/a0.0%
20.0%
40.0%
60.0%
80.0%
100.0%
85.0%
86.8%
16.4x
13.6x13.0x
12.5x 11.9x11.4x 10.4x 10.3x 10.0x
9.9x 9.7x 9.6x 9.1x8.2x 7.3x
7.3x 7.3x
4.9x
16.4x
9.9x 9.7x 9.5x9.4x 8.4x
6.9x 6.2x 6.0x4.3x
0.0x
2.0x
4.0x
6.0x
8.0x
10.0x
12.0x
14.0x
16.0x
18.0x
7.0x8.9x
23.7x
19.2x
15.4x13.8x
12.5x 12.1x 12.0x 11.0x 10.9x 10.3x 10.2x 9.6x 9.2x 9.0x 8.8x 7.9x
n/m n/m
20.8x
18.1x
11.0x 10.5x 9.9x 9.6x7.6x 7.1x 6.9x
5.1x
0.0x
4.0x
8.0x
12.0x
16.0x
20.0x
24.0x
28.0x
16.6x
15.1x
31.8x30.4x
20.4x19.2x 18.0x
16.6x 16.6x 16.6x14.7x 14.3x 11.9x 11.9x 10.5x 9.1x
8.3x
n/m n/m n/a
39.2x
18.9x 18.4x16.3x
13.8x10.9x 9.6x 8.9x
n/m n/a0.0x
5.0x
10.0x
15.0x
20.0x
25.0x
30.0x
35.0x
40.0x
45.0x

Business Services | February 2017 62
Compliance & Assurance Services – Engineering Consulting
Trading Multiples Through Time E
V / N
TM E
BIT
DA
E
V / N
TM E
BIT
A
P /
NTM
E
-
2.0x
4.0x
6.0x
8.0x
10.0x
12.0x
14.0x
Jan-07 Jan-08 Jan-09 Jan-10 Jan-11 Jan-12 Jan-13 Jan-14 Jan-15 Jan-16 Jan-17
Engineering Consulting Consulting, EPC, Heavy Engineering
M edian NT M EV / EBIT DA 10 yrs 5 yrs 3yrs 1 yr Current
Engineering Consulting 7.5x 7.7x 8.5x 9.2x 10.5x
Consulting, EPC, Heavy Engineering 7.2x 7.1x 7.2x 7.1x 8.5x
All Engineering Consulting 7.4x 7.6x 7.9x 8.1x 9.8x
M edian NT M EV / EBIT A 10 yrs 5 yrs 3yrs 1 yr Current
Engineering Consulting 8.6x 8.8x 9.6x 10.0x 11.5x
Consulting, EPC, Heavy Engineering 8.6x 8.1x 8.2x 8.5x 9.4x
All Engineering Consulting 8.6x 8.6x 9.1x 9.4x 10.4x
-
2.0x
4.0x
6.0x
8.0x
10.0x
12.0x
14.0x
16.0x
Jan-07 Jan-08 Jan-09 Jan-10 Jan-11 Jan-12 Jan-13 Jan-14 Jan-15 Jan-16 Jan-17
Engineering Consulting Consulting, EPC, Heavy Engineering
-
5.0x
10.0x
15.0x
20.0x
25.0x
Jan-07 Jan-08 Jan-09 Jan-10 Jan-11 Jan-12 Jan-13 Jan-14 Jan-15 Jan-16 Jan-17
Engineering Consulting Consulting, EPC, Heavy Engineering
M edian NT M P / E 10 yrs 5 yrs 3yrs 1 yr Current
Engineering Consulting 12.9x 13.0x 14.0x 15.4x 17.0x
Consulting, EPC, Heavy Engineering 13.0x 12.1x 12.0x 12.3x 17.1x
All Engineering Consulting 12.9x 12.6x 13.4x 13.8x 17.0x
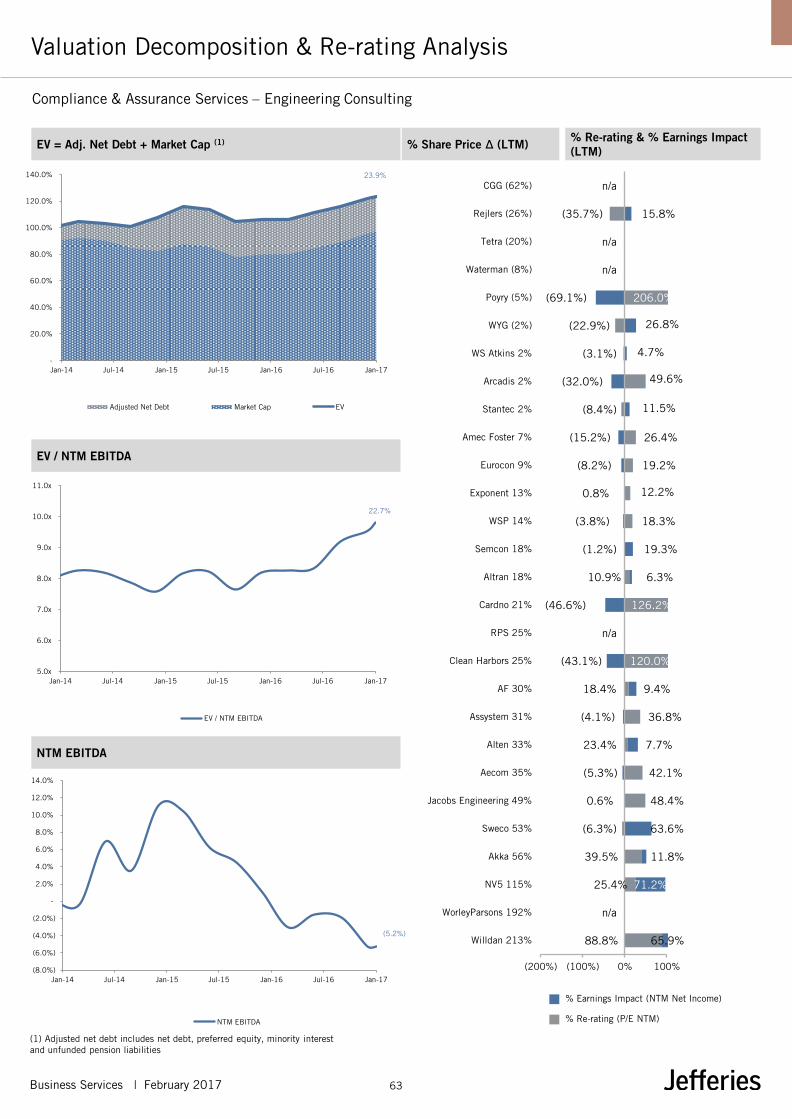
Business Services | February 2017 63
Compliance & Assurance Services – Engineering Consulting
Valuation Decomposition & Re-rating Analysis
(1) Adjusted net debt includes net debt, preferred equity, minority interest and unfunded pension liabilities
% Re-rating (P/E NTM)
NTM EBITDA
EV / NTM EBITDA
% Share Price Δ (LTM) % Re-rating & % Earnings Impact (LTM) EV = Adj. Net Debt + Market Cap (1)
% Earnings Impact (NTM Net Income)
88.8%
n/a
25.4%
39.5%
(6.3%)
48.4%
42.1%
7.7%
36.8%
9.4%
120.0%
n/a
126.2%
10.9%
(1.2%)
18.3%
12.2%
19.2%
26.4%
(8.4%)
49.6%
(3.1%)
(22.9%)
206.0%
n/a
n/a
(35.7%)
n/a
65.9%
71.2%
11.8%
63.6%
0.6%
(5.3%)
23.4%
(4.1%)
18.4%
(43.1%)
(46.6%)
6.3%
19.3%
(3.8%)
0.8%
(8.2%)
(15.2%)
11.5%
(32.0%)
4.7%
26.8%
(69.1%)
15.8%
(200%) (100%) 0% 100%
Willdan 213%
WorleyParsons 192%
NV5 115%
Akka 56%
Sweco 53%
Jacobs Engineering 49%
Aecom 35%
Alten 33%
Assystem 31%
AF 30%
Clean Harbors 25%
RPS 25%
Cardno 21%
Altran 18%
Semcon 18%
WSP 14%
Exponent 13%
Eurocon 9%
Amec Foster 7%
Stantec 2%
Arcadis 2%
WS Atkins 2%
WYG (2%)
Poyry (5%)
Waterman (8%)
Tetra (20%)
Rejlers (26%)
CGG (62%)
22.7%
5.0x
6.0x
7.0x
8.0x
9.0x
10.0x
11.0x
Jan-14 Jul-14 Jan-15 Jul-15 Jan-16 Jul-16 Jan-17
EV / NTM EBITDA
(5.2%)
(8.0%)
(6.0%)
(4.0%)
(2.0%)
-
2.0%
4.0%
6.0%
8.0%
10.0%
12.0%
14.0%
Jan-14 Jul-14 Jan-15 Jul-15 Jan-16 Jul-16 Jan-17
NTM EBITDA
23.9%
-
20.0%
40.0%
60.0%
80.0%
100.0%
120.0%
140.0%
Jan-14 Jul-14 Jan-15 Jul-15 Jan-16 Jul-16 Jan-17
Adjusted Net Debt Market Cap EV
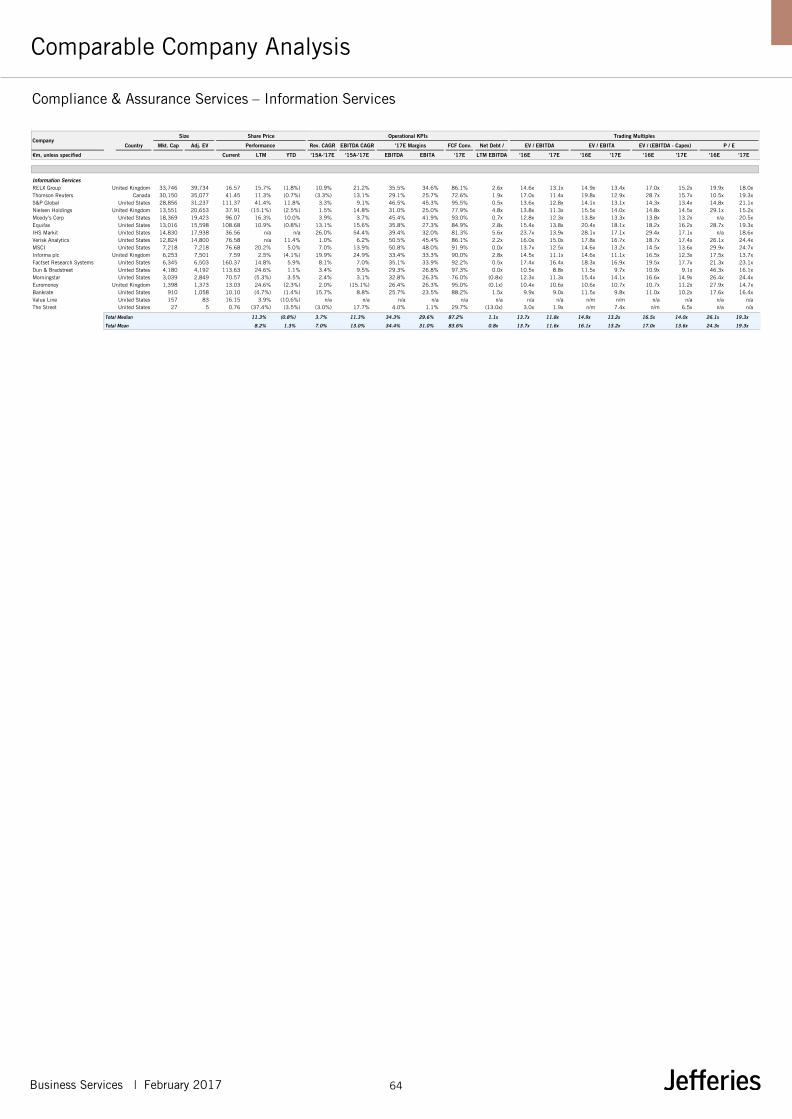
Business Services | February 2017 64
Compliance & Assurance Services – Information Services
Comparable Company Analysis
Size Share Price Operational KPIs Trading Multiples
Country Mkt. Cap Adj. EV Performance Rev. CAGR EBITDA CAGR '17E Margins FCF Conv. Net Debt / EV / EBITDA EV / EBITA EV / (EBITDA - Capex) P / E
€m, unless specified Current LTM YTD '15A-'17E '15A-'17E EBITDA EBITA '17E LTM EBITDA '16E '17E '16E '17E '16E '17E '16E '17E
Information ServicesRELX Group United Kingdom 33,746 39,734 16.57 15.7% (1.8%) 10.9% 21.2% 35.5% 34.6% 86.1% 2.6x 14.6x 13.1x 14.9x 13.4x 17.0x 15.2x 19.9x 18.0xThomson Reuters Canada 30,150 35,077 41.45 11.3% (0.7%) (3.3%) 13.1% 29.1% 25.7% 72.6% 1.9x 17.0x 11.4x 19.8x 12.9x 28.7x 15.7x 10.5x 19.3xS&P Global United States 28,856 31,237 111.37 41.4% 11.8% 3.3% 9.1% 46.5% 45.3% 95.5% 0.5x 13.6x 12.8x 14.1x 13.1x 14.3x 13.4x 14.8x 21.1xNielsen Holdings United Kingdom 13,551 20,653 37.91 (15.1%) (2.5%) 1.5% 14.8% 31.0% 25.0% 77.9% 4.8x 13.8x 11.3x 15.5x 14.0x 14.8x 14.5x 29.1x 15.2xMoody’s Corp United States 18,369 19,423 96.07 16.3% 10.0% 3.9% 3.7% 45.4% 41.9% 93.0% 0.7x 12.8x 12.3x 13.8x 13.3x 13.8x 13.2x n/a 20.5xEquifax United States 13,016 15,598 108.68 10.9% (0.8%) 13.1% 15.6% 35.8% 27.3% 84.9% 2.8x 15.4x 13.8x 20.4x 18.1x 18.2x 16.2x 28.7x 19.3xIHS Markit United States 14,830 17,938 36.56 n/a n/a 26.0% 54.4% 39.4% 32.0% 81.3% 5.6x 23.7x 13.9x 28.1x 17.1x 29.4x 17.1x n/a 18.6xVerisk Analytics United States 12,824 14,800 76.58 n/a 11.4% 1.0% 6.2% 50.5% 45.4% 86.1% 2.2x 16.0x 15.0x 17.8x 16.7x 18.7x 17.4x 26.1x 24.4xMSCI United States 7,218 7,218 76.68 20.2% 5.0% 7.0% 13.9% 50.8% 48.0% 91.9% 0.0x 13.7x 12.5x 14.6x 13.2x 14.5x 13.6x 29.9x 24.7xInforma plc United Kingdom 6,253 7,501 7.59 2.5% (4.1%) 19.9% 24.9% 33.4% 33.3% 90.0% 2.8x 14.5x 11.1x 14.6x 11.1x 16.5x 12.3x 17.5x 13.7xFactset Research Systems United States 6,345 6,503 160.37 14.8% 5.9% 8.1% 7.0% 35.1% 33.9% 92.2% 0.5x 17.4x 16.4x 18.3x 16.9x 19.5x 17.7x 21.3x 23.1xDun & Bradstreet United States 4,180 4,192 113.63 24.6% 1.1% 3.4% 9.5% 29.3% 26.8% 97.3% 0.0x 10.5x 8.8x 11.5x 9.7x 10.9x 9.1x 46.3x 16.1xMorningstar United States 3,039 2,849 70.57 (5.3%) 3.5% 2.4% 3.1% 32.8% 26.3% 76.0% (0.8x) 12.3x 11.3x 15.4x 14.1x 16.6x 14.9x 26.4x 24.4xEuromoney United Kingdom 1,398 1,373 13.03 24.6% (2.3%) 2.0% (15.1%) 26.4% 26.3% 95.0% (0.1x) 10.4x 10.6x 10.6x 10.7x 10.7x 11.2x 27.9x 14.7xBankrate United States 910 1,058 10.10 (4.7%) (1.4%) 15.7% 8.8% 25.7% 23.5% 88.2% 1.5x 9.9x 9.0x 11.5x 9.8x 11.0x 10.2x 17.6x 16.4xValue Line United States 157 83 16.15 3.9% (10.6%) n/a n/a n/a n/a n/a n/a n/a n/a n/m n/m n/a n/a n/a n/aThe Street United States 27 5 0.76 (37.4%) (3.5%) (3.0%) 17.7% 4.0% 1.1% 29.7% (13.0x) 3.0x 1.9x n/m 7.4x n/m 6.5x n/a n/a
Total Median 11.3% (0.8%)n/m 3.7%n/m 11.3%n/m 34.3% 29.6%n/m 87.2%n/m 1.1xn/m 13.7x 11.8xn/m 14.9x 13.2xn/m 16.5x 14.0xn/m 26.1x 19.3x
Total Mean 8.2% 1.3%n/m 7.0%n/m 13.0%n/m 34.4% 31.0%n/m 83.6%n/m 0.8xn/m 13.7x 11.6xn/m 16.1x 13.2xn/m 17.0x 13.6xn/m 24.3x 19.3x
Company

Business Services | February 2017 65
Compliance & Assurance Services – Information Services
Share Price Performance La
st M
onth
Ye
ar-t
o-D
ate
Last
Tw
elve
Mon
ths
11.8% 11.4%10.0%
5.9% 5.0%3.5%
1.8% 1.1%
(0.7%) (0.8%) (1.4%) (1.8%) (2.3%) (2.5%)(3.5%) (4.1%)
(10.6%)
S&P 5001.8%
(20.0%)
0.0%
20.0% Information Services 0.2%
Median YTD Price Performance
11.8% 11.4%10.0%
5.9% 5.0%3.5%
1.8% 1.1%
(0.7%) (0.8%) (1.4%) (1.8%) (2.3%) (2.5%)(3.5%) (4.1%)
(10.6%)
S&P 5001.8%
(15.0%)
(10.0%)
(5.0%)
0.0%
5.0%
10.0%
15.0%Information Services 0.2%
Median LM Price Performance
41.4%
24.6% 24.6%20.2%
16.3% 15.7% 14.8% 13.2% 11.3% 10.9%3.9% 2.5%
(4.7%) (5.3%)
(15.1%)
(37.4%)
n/a
S&P 50017.5%
(50.0%)
(40.0%)
(30.0%)
(20.0%)
(10.0%)
0.0%
10.0%
20.0%
30.0%
40.0%
50.0% Information Services 12.3%
Median LTM Price Performance
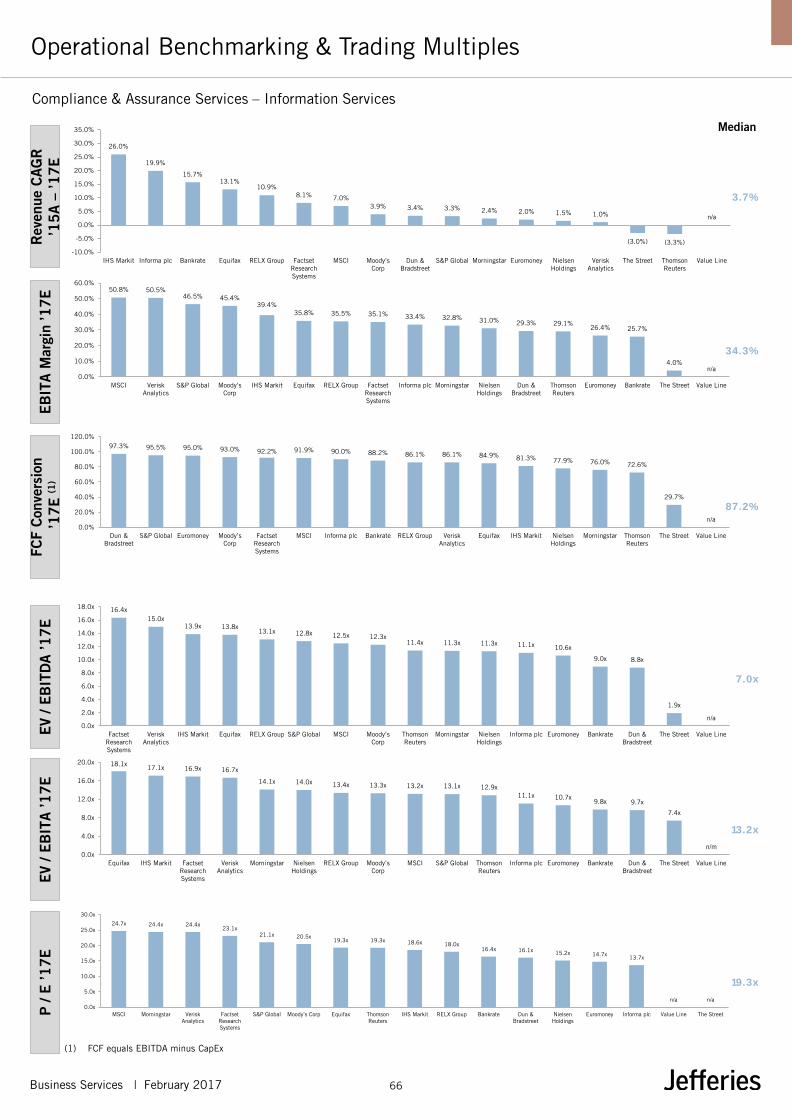
Business Services | February 2017 66
Compliance & Assurance Services – Information Services
Operational Benchmarking & Trading Multiples
(1) FCF equals EBITDA minus CapEx
EV
/ EB
ITD
A ’1
7E
EV
/ EB
ITA ’1
7E
P
/ E
’17E
Median
Rev
enue
CA
GR
’1
5A
– ’1
7E
EB
ITA M
argi
n ’1
7E
FCF
Con
vers
ion
’17E
(1)
3.7%
50.8% 50.5%46.5% 45.4%
39.4%35.8% 35.5% 35.1% 33.4% 32.8% 31.0% 29.3% 29.1%
26.4% 25.7%
4.0%n/a
0.0%
10.0%
20.0%
30.0%
40.0%
50.0%
60.0%
MSCI VeriskAnalytics
S&P Global Moody’s Corp
IHS Markit Equifax RELX Group FactsetResearchSystems
Informa plc Morningstar NielsenHoldings
Dun &Bradstreet
ThomsonReuters
Euromoney Bankrate The Street Value Line
97.3% 95.5% 95.0% 93.0% 92.2% 91.9% 90.0% 88.2% 86.1% 86.1% 84.9% 81.3% 77.9% 76.0% 72.6%
29.7%
n/a0.0%
20.0%
40.0%
60.0%
80.0%
100.0%
120.0%
Dun &Bradstreet
S&P Global Euromoney Moody’s Corp
FactsetResearchSystems
MSCI Informa plc Bankrate RELX Group VeriskAnalytics
Equifax IHS Markit NielsenHoldings
Morningstar ThomsonReuters
The Street Value Line
87.2%
34.3%
16.4x15.0x
13.9x 13.8x13.1x 12.8x 12.5x 12.3x
11.4x 11.3x 11.3x 11.1x 10.6x
9.0x 8.8x
1.9x
n/a0.0x
2.0x
4.0x
6.0x
8.0x
10.0x
12.0x
14.0x
16.0x
18.0x
FactsetResearchSystems
VeriskAnalytics
IHS Markit Equifax RELX Group S&P Global MSCI Moody’s Corp
ThomsonReuters
Morningstar NielsenHoldings
Informa plc Euromoney Bankrate Dun &Bradstreet
The Street Value Line
18.1x 17.1x 16.9x 16.7x
14.1x 14.0x 13.4x 13.3x 13.2x 13.1x 12.9x11.1x 10.7x
9.8x 9.7x
7.4x
n/m0.0x
4.0x
8.0x
12.0x
16.0x
20.0x
Equifax IHS Markit FactsetResearchSystems
VeriskAnalytics
Morningstar NielsenHoldings
RELX Group Moody’s Corp
MSCI S&P Global ThomsonReuters
Informa plc Euromoney Bankrate Dun &Bradstreet
The Street Value Line
24.7x 24.4x 24.4x23.1x
21.1x 20.5x19.3x 19.3x 18.6x 18.0x
16.4x 16.1x 15.2x 14.7x 13.7x
n/a n/a0.0x
5.0x
10.0x
15.0x
20.0x
25.0x
30.0x
MSCI Morningstar VeriskAnalytics
FactsetResearchSystems
S&P Global Moody’s Corp Equifax ThomsonReuters
IHS Markit RELX Group Bankrate Dun &Bradstreet
NielsenHoldings
Euromoney Informa plc Value Line The Street
7.0x
13.2x
19.3x
26.0%
19.9%
15.7%13.1%
10.9%8.1% 7.0%
3.9% 3.4% 3.3% 2.4% 2.0% 1.5% 1.0%
(3.0%) (3.3%)
n/a
-10.0%
-5.0%
0.0%
5.0%
10.0%
15.0%
20.0%
25.0%
30.0%
35.0%
IHS Markit Informa plc Bankrate Equifax RELX Group FactsetResearchSystems
MSCI Moody’s Corp
Dun &Bradstreet
S&P Global Morningstar Euromoney NielsenHoldings
VeriskAnalytics
The Street ThomsonReuters
Value Line
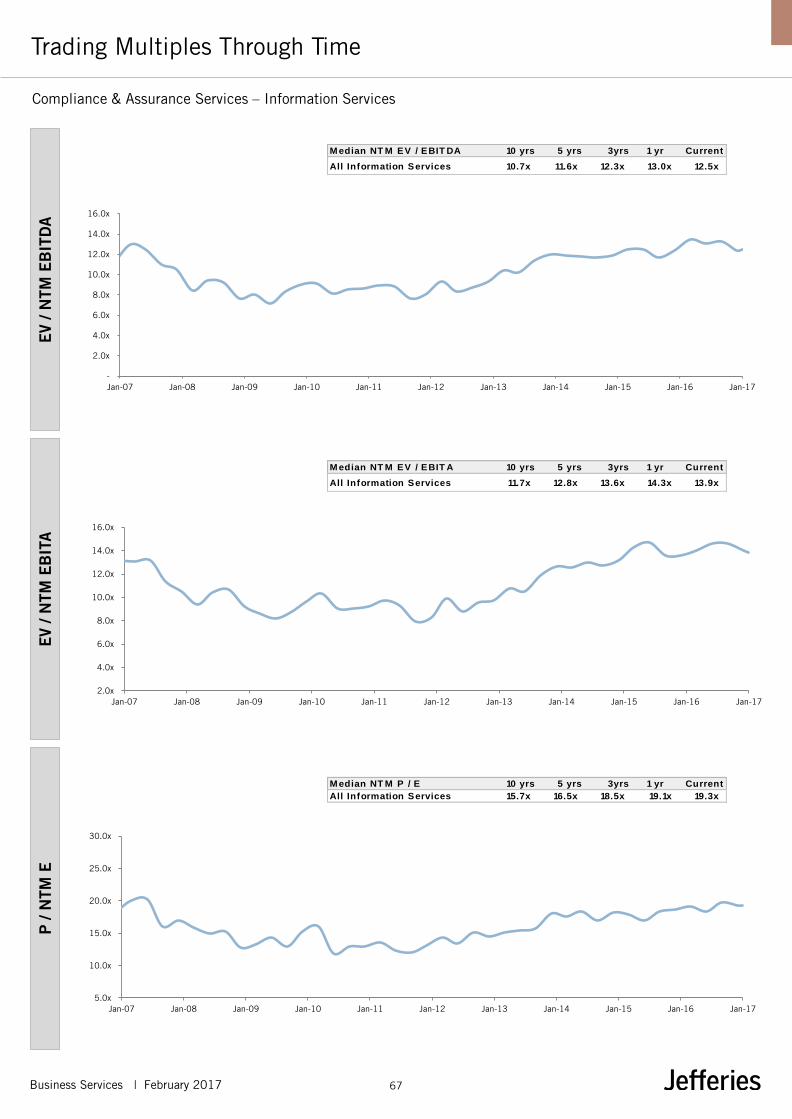
Business Services | February 2017 67
Compliance & Assurance Services – Information Services
Trading Multiples Through Time E
V / N
TM E
BIT
DA
E
V / N
TM E
BIT
A
P /
NTM
E
M edian NT M EV / EBIT DA 10 yrs 5 yrs 3yrs 1 yr Current
All Information Services 10.7x 11.6x 12.3x 13.0x 12.5x
M edian NT M EV / EBIT A 10 yrs 5 yrs 3yrs 1 yr Current
All Information Services 11.7x 12.8x 13.6x 14.3x 13.9x
Median NT M P / E 10 yrs 5 yrs 3yrs 1 yr Current
All Information Services 15.7x 16.5x 18.5x 19.1x 19.3x
-
2.0x
4.0x
6.0x
8.0x
10.0x
12.0x
14.0x
16.0x
Jan-07 Jan-08 Jan-09 Jan-10 Jan-11 Jan-12 Jan-13 Jan-14 Jan-15 Jan-16 Jan-17
2.0x
4.0x
6.0x
8.0x
10.0x
12.0x
14.0x
16.0x
Jan-07 Jan-08 Jan-09 Jan-10 Jan-11 Jan-12 Jan-13 Jan-14 Jan-15 Jan-16 Jan-17
5.0x
10.0x
15.0x
20.0x
25.0x
30.0x
Jan-07 Jan-08 Jan-09 Jan-10 Jan-11 Jan-12 Jan-13 Jan-14 Jan-15 Jan-16 Jan-17

Business Services | February 2017 68
Compliance & Assurance Services – Information Services
Valuation Decomposition & Re-rating Analysis
(1) Adjusted net debt includes net debt, preferred equity, minority interest and unfunded pension liabilities
NTM EBITDA
EV / NTM EBITDA
% Share Price Δ (LTM) % Re-rating & % Earnings Impact (LTM) EV = Adj. Net Debt + Market Cap (1)
% Re-rating (P/E NTM)
% Earnings Impact (NTM Net Income)
24.8%
28.8%
22.0%
3.1%
16.3%
2.5%
16.1%
9.1%
17.7%
(10.6%)
(20.0%)
14.9%
4.7%
n/a
n/a
13.2%
(3.3%)
2.1%
16.5%
12.9%
(1.1%)
3.8%
(5.4%)
23.9%
n/a
28.1%
(17.1%)
(9.6%)
(75.0%) 0.0% 75.0%
S&P Global 41%
Euromoney 25%
Dun & Bradstreet 25%
MSCI 20%
Moody’s Corp 16%
RELX Group 16%
Factset Research Systems 15%
Verisk Analytics 13%
Thomson Reuters 11%
Equifax 11%
Value Line 4%
Informa plc 3%
Bankrate (5%)
Morningstar (5%)
Nielsen Holdings (15%)
The Street (37%)32.6%
-
20.0%
40.0%
60.0%
80.0%
100.0%
120.0%
140.0%
160.0%
Jan-14 Jul-14 Jan-15 Jul-15 Jan-16 Jul-16 Jan-17
Adjusted Net Debt Market Cap EV
0.0%
7.0x
8.0x
9.0x
10.0x
11.0x
12.0x
13.0x
14.0x
Jan-14 Jul-14 Jan-15 Jul-15 Jan-16 Jul-16 Jan-17
EV / NTM EBITDA
11.2%
(6.0%)
(4.0%)
(2.0%)
-
2.0%
4.0%
6.0%
8.0%
10.0%
12.0%
14.0%
Jan-14 Jul-14 Jan-15 Jul-15 Jan-16 Jul-16 Jan-17
NTM EBITDA
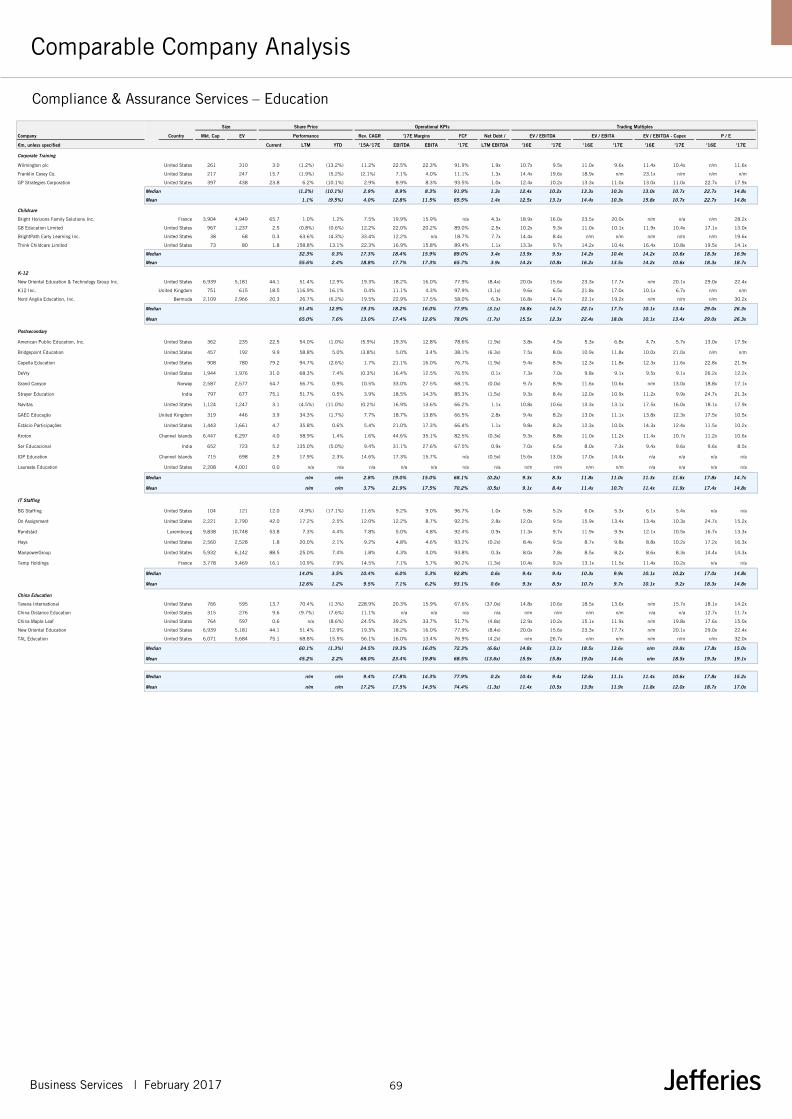
Business Services | February 2017 69
Compliance & Assurance Services – Education
Comparable Company Analysis
Size Share Price Operational KPIs Trading Multiples
Country Mkt. Cap EV Performance Rev. CAGR '17E Margins FCF Net Debt / EV / EBITDA EV / EBITA EV / EBITDA - Capex P / E
€m, unless specified Current LTM YTD '15A-'17E EBITDA EBITA '17E LTM EBITDA '16E '17E '16E '17E '16E '17E '16E '17E
Corporate Training
Wilmington plc United States 261 310 3.0 (1.2%) (13.2%) 11.2% 22.5% 22.3% 91.9% 1.9x 10.7x 9.5x 11.0x 9.6x 11.4x 10.4x n/m 11.6x
Franklin Covey Co. United States 217 247 15.7 (1.9%) (5.2%) (2.1%) 7.1% 4.0% 11.1% 1.3x 14.4x 19.6x 18.9x n/m 23.1x n/m n/m n/m
GP Strategies Corporation United States 397 438 23.8 6.2% (10.1%) 2.9% 8.9% 8.3% 93.5% 1.0x 12.4x 10.2x 13.3x 11.0x 13.0x 11.0x 22.7x 17.9x
Median (1.2%) (10.1%) 2.9% 8.9% 8.3% 91.9% 1.3x 12.4x 10.2x 13.3x 10.3x 13.0x 10.7x 22.7x 14.8x
Mean 1.1% (9.5%) 4.0% 12.8% 11.5% 65.5% 1.4x 12.5x 13.1x 14.4x 10.3x 15.8x 10.7x 22.7x 14.8x
Childcare
Bright Horizons Family Solutions Inc. France 3,904 4,949 65.7 1.0% 1.2% 7.5% 19.9% 15.9% n/a 4.3x 18.9x 16.0x 23.5x 20.0x n/m n/a n/m 28.2x
G8 Education Limited United States 967 1,237 2.5 (0.8%) (0.6%) 12.2% 22.0% 20.2% 89.0% 2.5x 10.2x 9.3x 11.0x 10.1x 11.9x 10.4x 17.1x 13.0x
BrightPath Early Learning Inc. United States 38 68 0.3 63.6% (4.3%) 33.4% 12.2% n/a 18.7% 7.7x 14.4x 8.4x n/m n/m n/m n/m n/m 19.6x
Think Childcare Limited United States 73 80 1.8 158.8% 13.1% 22.3% 16.9% 15.8% 89.4% 1.1x 13.3x 9.7x 14.2x 10.4x 16.4x 10.8x 19.5x 14.1x
Median 32.3% 0.3%n/m 17.3%n/m 18.4% 15.9%n/m 89.0%n/m 3.4xn/m 13.9x 9.5xn/m 14.2x 10.4xn/m 14.2x 10.6xn/m 18.3x 16.9x
Mean 55.6% 2.4%n/m 18.8%n/m 17.7% 17.3%n/m 65.7%n/m 3.9xn/m 14.2x 10.8xn/m 16.2x 13.5xn/m 14.2x 10.6xn/m 18.3x 18.7x
K-12
New Oriental Education & Technology Group Inc. United States 6,939 5,181 44.1 51.4% 12.9% 19.3% 18.2% 16.0% 77.9% (8.4x) 20.0x 15.6x 23.3x 17.7x n/m 20.1x 29.0x 22.4x
K12 Inc. United Kingdom 751 615 18.5 116.9% 16.1% 0.4% 11.1% 4.3% 97.9% (3.1x) 9.6x 6.5x 21.8x 17.0x 10.1x 6.7x n/m n/m
Nord Anglia Education, Inc. Bermuda 2,109 2,966 20.3 26.7% (6.2%) 19.5% 22.9% 17.5% 58.0% 6.3x 16.8x 14.7x 22.1x 19.2x n/m n/m n/m 30.2x
Median 51.4% 12.9%n/m 19.3%n/m 18.2% 16.0%n/m 77.9%n/m (3.1x)n/m 16.8x 14.7xn/m 22.1x 17.7xn/m 10.1x 13.4xn/m 29.0x 26.3x
Mean 65.0% 7.6%n/m 13.0%n/m 17.4% 12.6%n/m 78.0%n/m (1.7x)n/m 15.5x 12.3xn/m 22.4x 18.0xn/m 10.1x 13.4xn/m 29.0x 26.3x
Postsecondary
American Public Education, Inc. United States 362 235 22.5 54.0% (1.0%) (5.9%) 19.3% 12.8% 78.6% (1.9x) 3.8x 4.5x 5.3x 6.8x 4.7x 5.7x 13.0x 17.9x
Bridgepoint Education United States 457 192 9.9 58.8% 5.0% (3.8%) 5.0% 3.4% 38.1% (6.3x) 7.5x 8.0x 10.9x 11.8x 10.0x 21.0x n/m n/m
Capella Education United States 908 780 79.2 94.7% (2.6%) 1.7% 21.1% 16.0% 76.7% (1.9x) 9.4x 8.9x 12.3x 11.8x 12.3x 11.6x 22.8x 21.9x
DeVry United States 1,944 1,976 31.0 68.3% 7.4% (0.3%) 16.4% 12.5% 76.5% 0.1x 7.3x 7.0x 9.8x 9.1x 9.5x 9.1x 26.2x 12.2x
Grand Canyon Norway 2,587 2,577 54.7 56.7% 0.9% 10.5% 33.0% 27.5% 68.1% (0.0x) 9.7x 8.9x 11.6x 10.6x n/m 13.0x 18.8x 17.1x
Strayer Education India 797 677 75.1 51.7% 0.5% 3.9% 18.5% 14.3% 85.3% (1.5x) 9.3x 8.4x 12.0x 10.9x 11.2x 9.9x 24.7x 21.3x
Navitas United States 1,124 1,247 3.1 (4.5%) (11.0%) (0.2%) 16.9% 13.6% 66.2% 1.1x 10.8x 10.6x 13.3x 13.1x 17.5x 16.0x 18.1x 17.9x
GAEC Educação United Kingdom 319 446 3.9 34.3% (1.7%) 7.7% 18.7% 13.8% 66.5% 2.8x 9.4x 8.2x 13.0x 11.1x 13.8x 12.3x 17.5x 10.5x
Estácio Participações United States 1,443 1,661 4.7 35.8% 0.6% 5.4% 21.0% 17.3% 66.4% 1.1x 9.8x 8.2x 12.3x 10.0x 14.3x 12.4x 11.5x 10.2x
Kroton Channel Islands 6,447 6,297 4.0 58.9% 1.4% 1.6% 44.6% 35.1% 82.5% (0.3x) 9.3x 8.8x 11.0x 11.2x 11.4x 10.7x 11.2x 10.6x
Ser Educacional India 652 723 5.2 135.0% (5.0%) 9.4% 31.1% 27.6% 67.5% 0.9x 7.0x 6.5x 8.0x 7.3x 9.4x 9.6x 9.6x 8.5x
IDP Education Channel Islands 715 698 2.9 17.9% 2.3% 14.6% 17.3% 15.7% n/a (0.5x) 15.6x 13.0x 17.0x 14.4x n/a n/a n/a n/a
Laureate Education United States 2,208 4,001 0.0 n/a n/a n/a n/a n/a n/a n/a n/m n/m n/m n/m n/a n/a n/a n/a
Median n/m n/mn/m 2.8%n/m 19.0% 15.0%n/m 68.1%n/m (0.2x)n/m 9.3x 8.3xn/m 11.8x 11.0xn/m 11.3x 11.6xn/m 17.8x 14.7x
Mean n/m n/mn/m 3.7%n/m 21.9% 17.5%n/m 70.2%n/m (0.5x)n/m 9.1x 8.4xn/m 11.4x 10.7xn/m 11.4x 11.9xn/m 17.4x 14.8x
IT Staffing
BG Staffing United States 104 121 12.0 (4.9%) (17.1%) 11.6% 9.2% 9.0% 96.7% 1.0x 5.8x 5.2x 6.0x 5.3x 6.1x 5.4x n/a n/a
On Assignment United States 2,221 2,790 42.0 17.2% 2.5% 12.0% 12.2% 8.7% 92.2% 2.8x 12.0x 9.5x 15.9x 13.4x 13.4x 10.3x 24.7x 15.2x
Randstad Luxembourg 9,838 10,748 53.8 7.3% 4.4% 7.8% 5.0% 4.8% 92.4% 0.9x 11.3x 9.7x 11.9x 9.9x 12.1x 10.5x 16.7x 13.3x
Hays United States 2,560 2,528 1.8 20.0% 2.1% 9.2% 4.8% 4.6% 93.2% (0.2x) 8.4x 9.5x 8.7x 9.8x 8.8x 10.2x 17.2x 16.3x
ManpowerGroup United States 5,932 6,142 88.5 25.0% 7.4% 1.8% 4.3% 4.0% 93.8% 0.3x 8.0x 7.8x 8.5x 8.2x 8.6x 8.3x 14.4x 14.3x
Temp Holdings France 3,778 3,469 16.1 10.9% 7.9% 14.5% 7.1% 5.7% 90.2% (1.3x) 10.4x 9.2x 13.1x 11.5x 11.4x 10.2x n/a n/a
Median 14.0% 3.5%n/m 10.4%n/m 6.0% 5.3%n/m 92.8%n/m 0.6xn/m 9.4x 9.4xn/m 10.3x 9.9xn/m 10.1x 10.2xn/m 17.0x 14.8x
Mean 12.6% 1.2%n/m 9.5%n/m 7.1% 6.2%n/m 93.1%n/m 0.6xn/m 9.3x 8.5xn/m 10.7x 9.7xn/m 10.1x 9.2xn/m 18.3x 14.8x
China Education
Tarena International United States 766 595 13.7 70.4% (1.3%) 228.9% 20.3% 15.9% 67.6% (37.0x) 14.8x 10.6x 18.5x 13.6x n/m 15.7x 18.1x 14.2x
China Distance Education United States 315 276 9.6 (9.7%) (7.6%) 11.1% n/a n/a n/a n/a n/m n/m n/m n/m n/a n/a 12.7x 11.7x
China Maple Leaf United States 764 597 0.6 n/a (8.6%) 24.5% 39.2% 33.7% 51.7% (4.8x) 12.9x 10.2x 15.1x 11.9x n/m 19.8x 17.6x 15.0x
New Oriental Education United States 6,939 5,181 44.1 51.4% 12.9% 19.3% 18.2% 16.0% 77.9% (8.4x) 20.0x 15.6x 23.3x 17.7x n/m 20.1x 29.0x 22.4x
TAL Education United States 6,071 5,684 75.1 68.8% 15.5% 56.1% 16.0% 13.4% 76.9% (4.2x) n/m 26.7x n/m n/m n/m n/m n/m 32.0x
Median 60.1% (1.3%) 24.5% 19.3% 16.0% 72.3% (6.6x) 14.8x 13.1x 18.5x 13.6x n/m 19.8x 17.8x 15.0x
Mean 45.2% 2.2% 68.0% 23.4% 19.8% 68.5% (13.6x) 15.9x 15.8x 19.0x 14.4x n/m 18.5x 19.3x 19.1x
Median n/m n/mn/m 9.4%n/m 17.8% 14.3%n/m 77.9%n/m 0.2xn/m 10.4x 9.4xn/m 12.6x 11.1xn/m 11.4x 10.6xn/m 17.8x 15.2x
Mean n/m n/mn/m 17.2%n/m 17.5% 14.5%n/m 74.4%n/m (1.3x)n/m 11.4x 10.5xn/m 13.9x 11.9xn/m 11.8x 12.0xn/m 18.7x 17.0x
Company
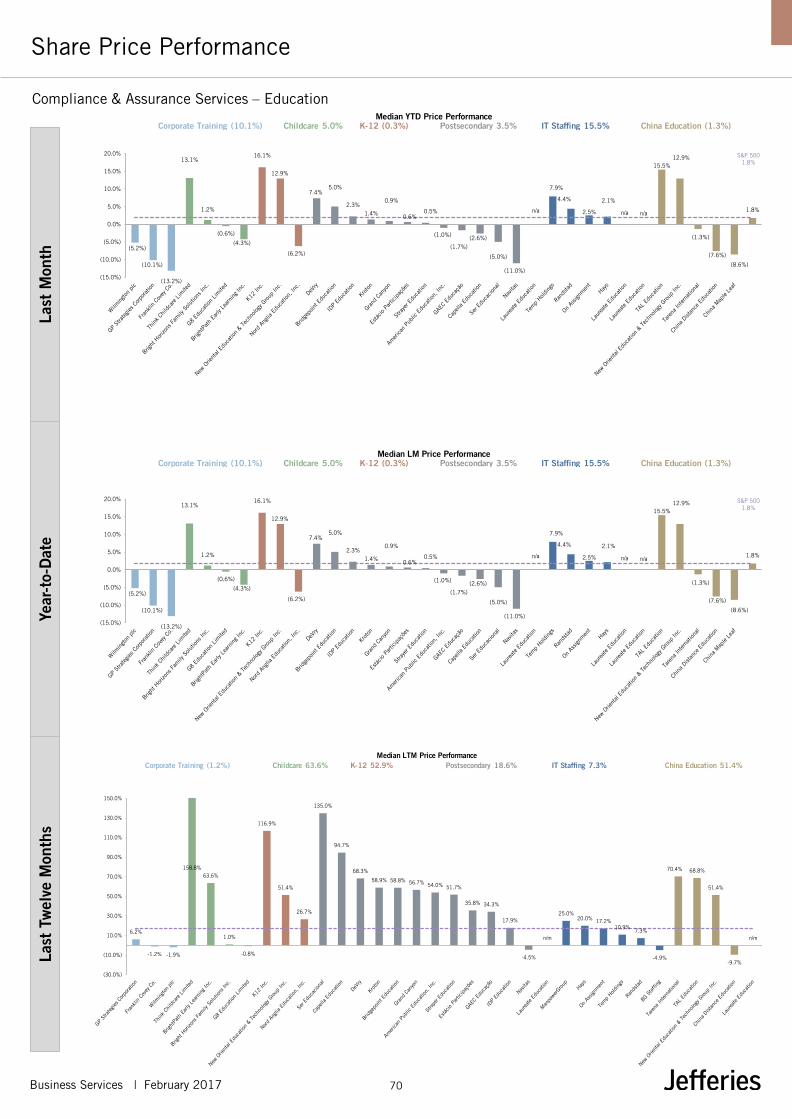
Business Services | February 2017 70
Share Price Performance La
st M
onth
Ye
ar-t
o-D
ate
Last
Tw
elve
Mon
ths
(5.2%)
(10.1%)
(13.2%)
13.1%
1.2%
(0.6%)
(4.3%)
16.1%
12.9%
(6.2%)
7.4%5.0%
2.3%1.4%
0.9%
0.6%0.5%
(1.0%)
(1.7%)(2.6%)
(5.0%)
(11.0%)
n/a
7.9%
4.4%
2.5%
2.1%
n/a n/a
15.5%12.9%
(1.3%)
(7.6%)
(8.6%)
1.8%
S&P 5001.8%
(15.0%)
(10.0%)
(5.0%)
0.0%
5.0%
10.0%
15.0%
20.0%
(5.2%)
(10.1%)
(13.2%)
13.1%
1.2%
(0.6%)
(4.3%)
16.1%
12.9%
(6.2%)
7.4%5.0%
2.3%1.4%
0.9%
0.6%0.5%
(1.0%)
(1.7%)(2.6%)
(5.0%)
(11.0%)
n/a
7.9%
4.4%
2.5%
2.1%
n/a n/a
15.5%12.9%
(1.3%)
(7.6%)
(8.6%)
1.8%
S&P 5001.8%
(15.0%)
(10.0%)
(5.0%)
0.0%
5.0%
10.0%
15.0%
20.0%
Corporate Training (10.1%) Childcare 5.0% K-12 (0.3%) Postsecondary 3.5% IT Staffing 15.5% China Education (1.3%)Median YTD Price Performance
Corporate Training (10.1%) Childcare 5.0% K-12 (0.3%) Postsecondary 3.5% IT Staffing 15.5% China Education (1.3%)Median LM Price Performance
Compliance & Assurance Services – Education
6.2%
-1.2% -1.9%
158.8%63.6%
1.0%
-0.8%
116.9%
51.4%
26.7%
135.0%
94.7%
68.3%
58.9% 58.8% 56.7% 54.0% 51.7%
35.8% 34.3%
17.9%
-4.5%
n/m
25.0%20.0% 17.2%
10.9%7.3%
-4.9%
70.4% 68.8%
51.4%
-9.7%
n/m
(30.0%)
(10.0%)
10.0%
30.0%
50.0%
70.0%
90.0%
110.0%
130.0%
150.0%
Corporate Training (1.2%) Childcare 63.6% K-12 52.9% Postsecondary 18.6% IT Staffing 7.3% China Education 51.4%Median LTM Price Performance
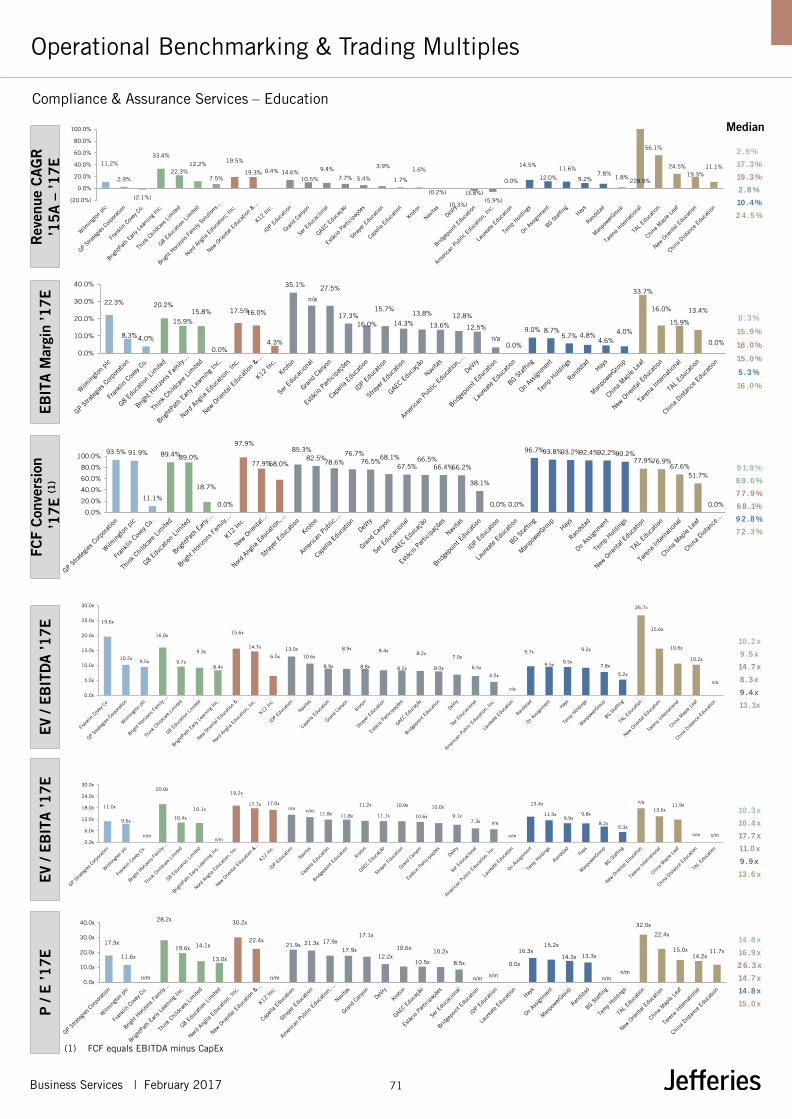
Business Services | February 2017 71
Operational Benchmarking & Trading Multiples
(1) FCF equals EBITDA minus CapEx
EV
/ EB
ITD
A ’1
7E
EV
/ EB
ITA ’1
7E
P
/ E
’17E
Median
Rev
enue
CA
GR
’1
5A
– ’1
7E
EB
ITA M
argi
n ’1
7E
FCF
Con
vers
ion
’17E
(1)
11.2%
2.9%
(2.1%)
33.4%
22.3%12.2%
7.5%
19.5%
19.3% 0.4% 14.6%10.5%
9.4%
7.7% 5.4%
3.9%
1.7%
1.6%
(0.2%)
(0.3%)
(3.8%)(5.9%)
0.0%
14.5%
12.0%
11.6%
9.2%7.8%
1.8%228.9%
56.1%
24.5%19.3%
11.1%
(20.0%)
0.0%
20.0%
40.0%
60.0%
80.0%
100.0%
2 .9 %
17 .3 %
19 .3 %
2 .8 %
10 .4 %
2 4 .5 %
22.3%
8.3%4.0%
20.2%
15.9%15.8%
0.0%
17.5%16.0%
4.3%
35.1%
n/a
27.5%
17.3%16.0%
15.7%
14.3%
13.8%
13.6%12.8%
12.5%
n/a0.0%
9.0% 8.7%5.7% 4.8%
4.6%4.0%
33.7%
16.0%
15.9%
13.4%
0.0%
0.0%
10.0%
20.0%
30.0%
40.0%
8 .3 %
15 .9 %
16 .0 %
15 .0 %
5 .3 %
16 .0 %
93.5% 91.9%
11.1%
89.4%89.0%
18.7%
0.0%
97.9%
77.9%58.0%
85.3%82.5%
78.6%76.7%
76.5%68.1%
67.5%66.5%
66.4%66.2%
38.1%
0.0% 0.0%
96.7%93.8%93.2%92.4%92.2%90.2%77.9%76.9%
67.6%51.7%
0.0%0.0%
20.0%
40.0%
60.0%
80.0%
100.0%
9 1.9 %
8 9 .0 %
7 7 .9 %
6 8 .1%
9 2 .8 %
7 2 .3 %
10 .2 x
9 .5 x
14 .7 x
8 .3 x
9 .4 x
13 .1x
10 .3 x
10 .4 x
17 .7 x
11.0 x
9 .9 x
13 .6 x
14 .8 x
16 .9 x
2 6 .3 x
14 .7 x
14 .8 x
15 .0 x
Compliance & Assurance Services – Education
17.9x
11.6x
n/m
28.2x
19.6x 14.1x
13.0x
30.2x
22.4x
n/m
21.9x 21.3x 17.9x
17.9x
17.1x
12.2x
10.6x
10.5x
10.2x
8.5x
n/m n/m
0.0x
16.3x15.2x
14.3x 13.3x
n/mn/m
32.0x
22.4x
15.0x14.2x
11.7x
0.0x
10.0x
20.0x
30.0x
40.0x
19.6x
10.2x9.5x
16.0x
9.7x
9.3x
8.4x
15.6x
14.7x
6.5x
13.0x
10.6x
8.9x
8.9x
8.8x
8.4x
8.2x
8.2x
8.0x
7.0x
6.5x
4.5x
n/a
9.7x
9.5x 9.5x
9.2x
7.8x
5.2x
26.7x
15.6x
10.6x
10.2x
n/a
0.0x
5.0x
10.0x
15.0x
20.0x
25.0x
30.0x
11.0x
9.6x
n/m
20.0x
10.4x
10.1x
n/m
19.2x
17.7x 17.0xn/a n/m
11.8x 11.8x
11.2x
11.1x
10.9x
10.6x
10.0x
9.1x7.3x n/a
n/m
13.4x
11.5x9.9x
9.8x
8.2x5.3x
n/a
13.6x11.9x
n/m n/m0.0x
6.0x
12.0x
18.0x
24.0x
30.0x
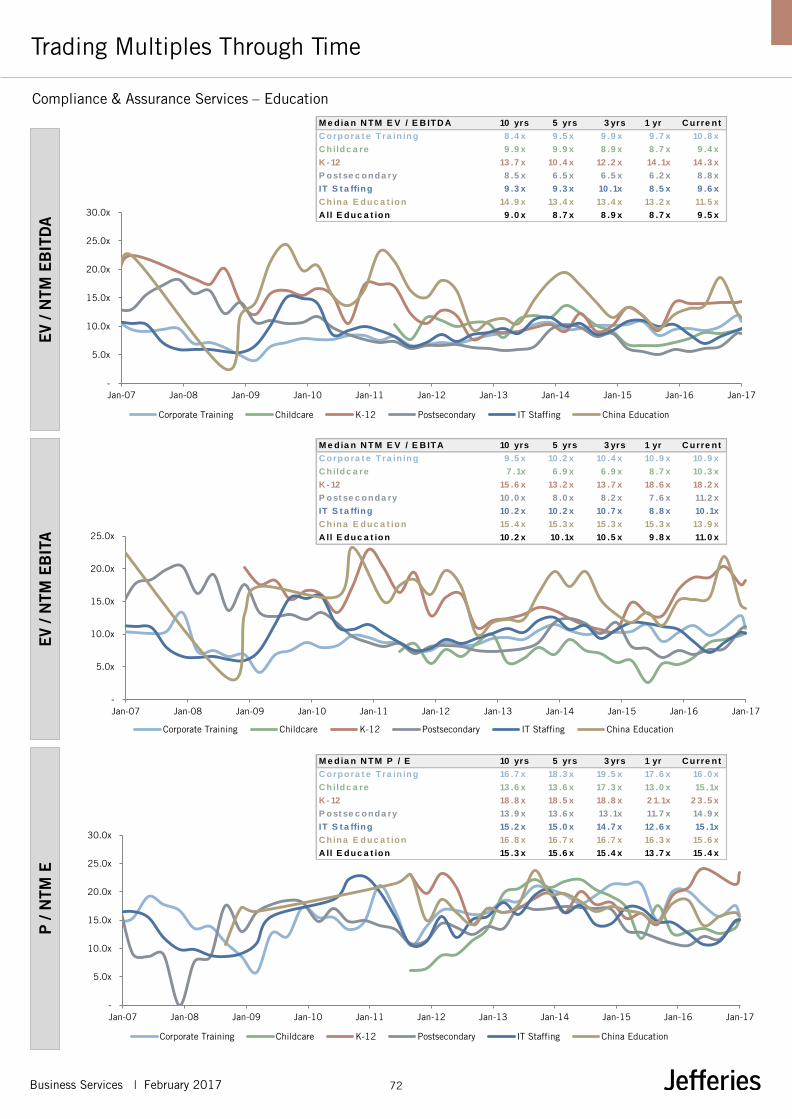
Business Services | February 2017 72
Trading Multiples Through Time E
V / N
TM E
BIT
DA
E
V / N
TM E
BIT
A
P /
NTM
E
Compliance & Assurance Services – Education
-
5.0x
10.0x
15.0x
20.0x
25.0x
30.0x
Jan-07 Jan-08 Jan-09 Jan-10 Jan-11 Jan-12 Jan-13 Jan-14 Jan-15 Jan-16 Jan-17
Corporate Training Childcare K-12 Postsecondary IT Staffing China Education
-
5.0x
10.0x
15.0x
20.0x
25.0x
Jan-07 Jan-08 Jan-09 Jan-10 Jan-11 Jan-12 Jan-13 Jan-14 Jan-15 Jan-16 Jan-17
Corporate Training Childcare K-12 Postsecondary IT Staffing China Education
-
5.0x
10.0x
15.0x
20.0x
25.0x
30.0x
Jan-07 Jan-08 Jan-09 Jan-10 Jan-11 Jan-12 Jan-13 Jan-14 Jan-15 Jan-16 Jan-17
Corporate Training Childcare K-12 Postsecondary IT Staffing China Education
M e dia n N TM E V / E B ITD A 10 yrs 5 yrs 3 yrs 1 yr C urre nt
C orpora t e Tra in ing 8 .4 x 9 .5 x 9 .9 x 9 .7 x 10 .8 x
C hildc a re 9 .9 x 9 .9 x 8 .9 x 8 .7 x 9 .4 x
K - 12 13 .7 x 10 .4 x 12 .2 x 14 .1x 14 .3 x
P ost se c onda ry 8 .5 x 6 .5 x 6 .5 x 6 .2 x 8 .8 x
IT S t a ffing 9 .3 x 9 .3 x 10 .1x 8 .5 x 9 .6 x
C hina E duc a t ion 14 .9 x 13 .4 x 13 .4 x 13 .2 x 11.5 x
A ll E duc a t ion 9 .0 x 8 .7 x 8 .9 x 8 .7 x 9 .5 x
M e dia n N TM E V / E B ITA 10 yrs 5 yrs 3 yrs 1 yr C urre nt
C orpora t e Tra in ing 9 .5 x 10 .2 x 10 .4 x 10 .9 x 10 .9 x
C hildc a re 7 .1x 6 .9 x 6 .9 x 8 .7 x 10 .3 x
K - 12 15 .6 x 13 .2 x 13 .7 x 18 .6 x 18 .2 x
P ost se c onda ry 10 .0 x 8 .0 x 8 .2 x 7 .6 x 11.2 x
IT S t a ffing 10 .2 x 10 .2 x 10 .7 x 8 .8 x 10 .1x
C hina E duc a t ion 15 .4 x 15 .3 x 15 .3 x 15 .3 x 13 .9 x
A ll E duc a t ion 10 .2 x 10 .1x 10 .5 x 9 .8 x 11.0 x
M e dia n N TM P / E 10 yrs 5 yrs 3 yrs 1 yr C urre nt
C orpora t e Tra in ing 16 .7 x 18 .3 x 19 .5 x 17 .6 x 16 .0 x
C hildc a re 13 .6 x 13 .6 x 17 .3 x 13 .0 x 15 .1x
K - 12 18 .8 x 18 .5 x 18 .8 x 2 1.1x 2 3 .5 x
P ost se c onda ry 13 .9 x 13 .6 x 13 .1x 11.7 x 14 .9 x
IT S t a ffing 15 .2 x 15 .0 x 14 .7 x 12 .6 x 15 .1x
C hina E duc a t ion 16 .8 x 16 .7 x 16 .7 x 16 .3 x 15 .6 x
A ll E duc a t ion 15 .3 x 15 .6 x 15 .4 x 13 .7 x 15 .4 x

Business Services | February 2017 73
Valuation Decomposition & Re-rating Analysis
(1) Adjusted net debt includes net debt, preferred equity, minority interest and unfunded pension liabilities
NTM EBITDA
EV / NTM EBITDA
% Share Price Δ (LTM) % Re-rating & % Earnings Impact (LTM) EV = Adj. Net Debt + Market Cap (1)
% Re-rating (P/E NTM)
% Earnings Impact (NTM Net Income)
94.1%
94.5%
97.2%
88.0%
14.9%
8.8%
63.4%
38.2%
108.7%
36.5%
86.5%
64.4%
22.3%
22.3%
101.8%
(8.6%)
33.8%
20.3%
11.6%
26.3%
16.9%
(10.8%)
(4.8%)
(2.9%)
10.0%
3.6%
48.3%
55.1%
3.0%
n/a
15.0%
(23.9%)
14.8%
(17.4%)
(7.7%)
23.8%
23.8%
4.7%
(33.5%)
43.6%
(5.3%)
3.9%
7.5%
n/a
(7.3%)
n/a
6.3%
(9.1%)
13.2%
0.3%
n/a
3.1%
(1.7%)
n/a
(100.0%) 0.0% 100.0%
Think Childcare Limited 159%
Ser Educacional 135%
K12 Inc. 117%
Capella Education 95%
Tarena International 70%
TAL Education 69%
DeVry 68%
BrightPath Early Learning Inc. 64%
Kroton 59%
Bridgepoint Education 59%
Grand Canyon 57%
American Public Education, Inc.54%
Strayer Education 52%
New Oriental Education &Technology Group Inc. 51%
New Oriental Education
Estácio Participações 36%
GAEC Educação 34%
China Maple Leaf 31%
Nord Anglia Education, Inc. 27%
ManpowerGroup 25%
Hays 20%
IDP Education 18%
On Assignment 17%
Temp Holdings 11%
Randstad 7%
GP Strategies Corporation 6%
Bright Horizons Family SolutionsInc. 1%
G8 Education Limited (1%)
Franklin Covey Co. (1%)
Wilmington plc (2%)
Navitas (5%)
BG Staffing (5%)
Compliance & Assurance Services – Education
17.1%
-
20.0%
40.0%
60.0%
80.0%
100.0%
120.0%
140.0%
Jan-14 Jul-14 Jan-15 Jul-15 Jan-16 Jul-16 Jan-17
Adjusted Net Debt Market Cap EV
19.7%
-
5.0%
10.0%
15.0%
20.0%
25.0%
Jan-14 Jul-14 Jan-15 Jul-15 Jan-16 Jul-16 Jan-17
NTM EBITDA
(8%)
5.0x
6.0x
7.0x
8.0x
9.0x
10.0x
11.0x
12.0x
Jan-14 Jul-14 Jan-15 Jul-15 Jan-16 Jul-16 Jan-17
EV / NTM EBITDA

Business Services | February 2017 74
PAGE INTENTIONALLY LEFT BLANK

75 Business Services | September 2016
Business Process Outsourcing

Business Services | February 2017 76
Business Process Outsourcing
Company Comparable Analysis
Size Share Price Operational KPIs Trading Multiples
Country Mkt. Cap EV Performance Rev. CAGR '17E Margins FCF Net Debt / EV / EBITDA EV / EBITA EV / EBITDA - Capex P / E
€m, unless specified Current LTM YTD '15A-'17E EBITDA EBITA '17E LTM EBITDA '16E '17E '16E '17E '16E '17E '16E '17E
Accounts Receivables Management
PRA United States 1,709 3,311 36.9 35.0% 8.0% (0.3%) 37.0% 34.9% n/a 5.1x 11.5x 10.3x 12.3x 10.9x n/a n/a 13.1x 11.9x
Encore United States 708 3,149 27.7 33.8% 1.8% (1.0%) 35.2% 31.5% n/a 6.8x 11.5x 8.8x 14.2x 9.8x n/a n/a 8.8x 7.4x
Performant United States 97 111 1.9 21.6% (11.5%) (11.6%) 4.8% (3.6%) n/m 0.8x 5.3x 19.9x 9.9x n/m 7.9x n/m 26.4x n/m
Median 33.8% 1.8% (1.0%) 35.2% 31.5% n/m 5.1x 11.5x 10.3x 12.3x 10.4x 7.9x n/m 13.1x 9.6x
Mean 30.2% (0.6%) (4.3%) 25.7% 20.9% n/m 4.2x 9.4x 13.0x 12.2x 10.4x 7.9x n/m 16.1x 9.6x
CRM
Teleperformance France 5,611 5,944 99.1 29.1% 4.0% 12.3% 17.1% 13.7% 74.6% 0.7x 10.6x 8.1x 14.0x 10.2x 15.4x 10.9x 21.5x 16.6x
Convergys United States 2,194 2,422 23.0 1.6% 1.1% 0.7% 12.7% 9.3% 69.1% 0.4x 7.1x 6.9x 9.6x 9.4x 9.6x 10.0x 12.4x 12.1x
TeleTech United States 1,275 1,348 27.4 10.8% (3.0%) 1.4% 14.2% 9.3% 64.8% 0.4x 8.9x 7.8x 14.9x 11.8x 13.6x 12.0x 21.1x 17.4x
Sykes United States 1,098 1,088 25.9 (5.1%) (3.2%) 10.0% 11.5% 9.1% 67.6% (0.1x) 7.4x 6.6x 9.4x 8.3x 14.8x 9.7x 15.5x 13.9x
Atento Luxembourg 622 1,026 8.4 (4.1%) 19.0% (2.8%) 12.3% 9.6% 56.1% 1.9x 5.1x 4.9x 6.8x 6.2x 7.8x 8.7x 14.0x 10.8x
Contax Brazil 11 322 2.7 (30.2%) (3.5%) 4.3% 10.3% 5.9% n/a 25.7x 3.4x 3.0x 6.6x 5.3x n/a n/a n/m 1.7x
ServiceSource United States 427 373 4.9 37.0% (6.7%) 4.3% 7.1% 5.2% n/m 3.7x 30.0x 20.7x n/m 28.4x n/m n/m n/m n/m
Hinduja Global India 154 154 7.4 14.1% 3.0% 10.7% 11.2% n/a 51.0% 0.0x 3.0x 2.6x n/m n/m 6.1x 5.0x 7.4x 6.2x
StarTek United States 126 155 8.0 116.0% 2.5% 8.8% 6.5% 3.4% 72.5% 7.0x 10.1x 7.7x 29.0x 14.6x 14.4x 10.6x n/a 17.3x
Median 10.8% 1.1%n/m 4.3%n/m 11.5% 9.2%n/m 67.6%n/m 0.7xn/m 7.4x 6.9xn/m 9.6x 9.8xn/m 13.6x 10.0xn/m 14.7x 13.0x
Mean 18.8% 1.5%n/m 5.5%n/m 11.4% 8.2%n/m 65.1%n/m 4.4xn/m 9.5x 7.6xn/m 12.9x 11.8xn/m 11.7x 9.5xn/m 15.3x 12.0x
Diversified BPO
Xerox United States 6,514 11,794 6.4 (28.9%) (20.6%) (24.6%) 15.2% 13.1% 88.8% 2.3x 5.9x 8.2x 12.3x 9.5x 6.5x 9.2x 11.4x 7.9x
Capita United Kingdom 3,879 6,686 5.8 (57.4%) (5.7%) (0.8%) 14.5% 13.8% 76.1% 2.8x 8.2x 8.3x 8.7x 8.8x 11.1x 10.9x 8.1x 8.4x
Genpact Bermuda 4,591 5,023 22.9 3.2% 1.4% 6.3% 17.5% 16.3% 82.9% 1.1x 12.8x 11.2x 14.7x 12.0x 16.2x 13.5x 18.4x 15.4x
Intertrust Netherlands 1,587 1,587 17.3 (1.0%) 3.2% 16.8% 43.8% 41.2% 95.2% 0.0x 10.4x 7.7x 14.4x 8.2x 11.0x 8.1x 30.5x 11.6x
Serco United Kingdom 1,825 2,007 1.7 68.7% 0.5% (2.5%) 4.0% 2.4% 64.6% 1.3x 13.2x 14.3x 19.7x 23.8x 18.9x 22.1x 30.1x n/m
Exlservice United States 1,427 1,272 42.6 5.2% (8.9%) 9.6% 18.9% 13.7% 78.4% (1.7x) 11.3x 9.6x 15.9x 13.3x 14.5x 12.2x 19.2x 17.2x
WNS Channel Islands 1,316 1,184 26.4 (0.9%) 3.2% 5.0% 19.2% 16.8% 75.1% (1.5x) 12.0x 10.9x 14.5x 12.4x 15.6x 14.5x 17.0x 14.8x
eClerx India 824 824 20.7 6.7% 8.1% 8.8% 36.9% 32.8% 89.0% 0.0x 12.2x 11.2x 13.6x 12.7x 13.7x 12.6x 16.3x 15.2x
Sanne Channel Islands 1,001 1,005 7.2 6.1% 5.3% 52.9% 39.5% 34.2% 95.7% 0.2x n/m 20.5x n/m 23.7x n/m 21.4x n/m 25.9x
Firstsource India 370 370 0.5 68.0% 6.3% 10.9% 12.9% 11.0% 80.3% 0.0x 6.0x 5.3x 6.9x 6.3x 8.5x 6.6x 9.2x 7.9x
Median 4.2% 2.3% 7.5% 18.2% 15.0% 81.6% 0.1x 11.3x 10.2x 14.4x 12.2x 13.7x 12.4x 17.0x 14.8x
Mean 7.0% (0.7%) 8.3% 22.2% 19.5% 82.6% 0.4x 10.2x 10.7x 13.4x 13.1x 12.9x 13.1x 17.8x 13.8x
Human Resource
ADP United States 42,224 41,535 93.6 21.5% (1.7%) 7.2% 21.6% 20.8% 92.2% (0.3x) 17.3x 16.0x 18.0x 16.6x 18.7x 17.4x 28.9x 26.3x
Paychex United States 20,049 19,873 55.9 26.0% (1.0%) 7.3% 43.0% 39.9% 92.5% (0.2x) 16.3x 15.1x 17.6x 16.3x 17.6x 16.4x 27.5x 25.7x
TriNet United States 1,622 1,907 23.6 71.8% (0.7%) 13.6% 5.9% 5.2% 83.7% 2.4x 11.3x 10.2x 12.8x 11.5x 13.9x 12.2x 20.5x 17.9x
Insperity United States 1,410 1,240 66.3 59.1% 0.8% 11.6% 5.1% 4.1% 89.7% (2.0x) 11.2x 8.1x 12.5x 10.1x 15.6x 9.0x 23.1x 17.4x
Zalaris Norway 72 69 3.8 1.8% 2.4% 9.1% 16.3% 14.1% 75.7% (0.9x) 10.5x 8.4x 12.6x 9.7x 13.4x 11.1x 28.4x 19.1x
Median 26.0% (0.7%) 9.1% 16.3% 14.1% 89.7% (0.3x) 11.3x 10.2x 12.8x 11.5x 15.6x 12.2x 27.5x 19.1x
Mean 36.1% (0.0%) 9.7% 18.4% 16.8% 86.8% (0.2x) 13.3x 11.6x 14.7x 12.9x 15.8x 13.2x 25.7x 21.3x
Mortgage BPO
CoreLogic United States 2,823 4,155 32.7 (1.2%) (4.2%) 11.7% 26.2% 19.8% 84.0% 4.7x 9.0x 9.0x 12.3x 11.9x 10.8x 10.7x 14.5x 15.2x
Ellie Mae United States 2,574 2,182 76.7 18.5% (1.1%) 31.2% 34.2% 20.3% 78.2% (8.8x) 28.9x 15.8x n/m 26.6x n/m 20.1x n/m 32.6x
Altisource Luxembourg 499 764 26.4 (1.4%) 7.2% (12.2%) 20.1% 16.4% 69.0% 1.3x 4.6x 5.1x 5.8x 6.2x 5.3x 7.3x 18.8x 7.3x
Median (1.2%) (1.1%)n/m 11.7%n/m 26.2% 19.8%n/m 78.2%n/m 1.3xn/m 9.0x 9.0xn/m 9.1x 11.9xn/m 8.0x 10.7xn/m 16.6x 15.2x
Mean 5.3% 0.6%n/m 10.2%n/m 26.8% 18.8%n/m 77.1%n/m (0.9x)n/m 14.1x 9.9xn/m 9.1x 14.9xn/m 8.0x 12.7xn/m 16.6x 18.4x
Software Enabled Services
Fiserv United States 21,609 25,538 99.6 13.6% 1.1% 5.6% 35.4% 32.6% 84.6% 2.7x 14.8x 13.3x 17.2x 14.4x 17.6x 15.7x 25.1x 21.9x
Fidelity NIS United States 24,157 33,318 73.6 33.0% 5.0% 21.5% 32.7% 29.6% 80.4% 5.8x 14.5x 11.3x 19.0x 12.5x 15.5x 14.0x n/m 18.4x
SS&C Technologies United States 6,039 8,248 29.8 (0.0%) 12.3% 28.7% 42.2% 42.0% 94.4% 7.2x 17.2x 12.7x 18.0x 12.8x 18.2x 13.5x n/m 16.1x
Broadridge United States 7,342 8,241 61.7 24.2% 0.3% 23.6% 18.3% 16.8% 85.3% 1.6x 13.2x 11.4x 14.5x 12.4x 15.3x 13.4x 23.1x 19.5x
Jack Henry United States 6,498 6,485 83.2 10.6% 1.1% 5.8% 35.6% 32.1% 89.8% (0.0x) 14.4x 13.5x 16.0x 14.9x 16.1x 15.0x 28.5x 27.8x
Athenahealth United States 4,607 4,740 116.8 (11.1%) 19.8% 18.8% 23.9% 16.6% 68.7% 2.2x n/m 16.4x n/m 23.6x n/m 23.8x n/m n/m
DST United States 3,415 3,416 106.7 9.2% 7.5% (27.1%) 26.4% 19.4% 76.3% 0.8x 10.4x 9.3x 14.1x 12.7x 12.9x 12.2x 8.3x 19.3x
Worldline France 3,301 2,963 25.0 14.6% (6.7%) 14.5% 20.0% 16.8% 70.8% (2.1x) 11.6x 9.2x 13.7x 10.9x 16.5x 13.0x 24.9x 22.2x
Median 12.1% 3.1% 16.7% 29.6% 24.5% 82.5% 1.9x 14.4x 12.1x 16.0x 12.7x 16.1x 13.8x 24.9x 19.5x
Mean 11.8% 5.1% 11.4% 29.3% 25.7% 81.3% 2.3x 13.7x 12.1x 16.1x 14.3x 16.0x 15.1x 22.0x 20.8x
Median 10.7% 1.1%n/m 8.0%n/m 18.6% 16.4%n/m 78.4%n/m 0.8xn/m 11.2x 9.4xn/m 14.0x 11.9xn/m 14.4x 12.2xn/m 19.0x 16.3x
Mean 16.3% 1.2%n/m 7.6%n/m 21.3% 18.1%n/m 78.7%n/m 1.9xn/m 11.4x 10.5xn/m 13.7x 13.0xn/m 13.3x 12.8xn/m 19.1x 16.1x
Company

Business Services | February 2017 77
Business Process Outsourcing
Share Price Performance La
st M
onth
Ye
ar-t
o-D
ate
Last
Tw
elve
Mon
ths
8.0%
1.8%
(11.5%)
19.0%
4.0%3.0%
2.5%
1.1%
(3.0%)(3.2%)(3.5%)
(6.7%)
8.1%
6.3%
5.3%
3.2%3.2%
1.4%0.5%
(5.7%)
(8.9%)
(20.6%)
2.4%0.8%
(0.7%)(1.0%)
(1.7%)
7.2%
(1.1%)
(4.2%)
19.8%
12.3%
7.5% 5.0%
1.1%1.1%
0.3%
(6.7%)
S&P 5001.8%
(25.0%)
(20.0%)
(15.0%)
(10.0%)
(5.0%)
0.0%
5.0%
10.0%
15.0%
20.0%
25.0%
Accounts Receivables Management 1.8% CRM 1.1% Diversified BPO 2.3% Human Resource (0.7%) Mortgage BPO (1.1%) Software Enabled Services 3.1%Median YTD Price Performance
8.0%
1.8%
(11.5%)
19.0%
4.0%
2.8%2.5%
1.1%
(3.0%)(3.2%)
(3.5%)
(6.7%)
6.3%5.4%
5.3%
3.2%
3.2%1.4%
0.5%
(5.7%)(8.9%)
(20.6%)
2.4%0.8%
(0.7%)(1.0%)
(1.7%)
7.2%
(1.1%)
(4.2%)
19.8%
12.3%7.5%
5.0%1.1%
1.1%
0.3%
(6.7%)
S&P 5001.8%
(30.0%)
(20.0%)
(10.0%)
0.0%
10.0%
20.0%
30.0%
Accounts Receivables Management 1.8% CRM 1.1% Diversified BPO 2.3% Human Resource (0.7%) Mortgage BPO (1.1%) Software Enabled Services 3.1%Median LM Price Performance
Accounts Receivables Management 33.8% CRM 10.8% Diversified BPO 4.2% Human Resource 26.0% Mortgage BPO (1.2%) Software Enabled Services 12.1%Median LTM Price Performance
35.0%
33.8%
21.6%
116.0%
37.0%29.1%
14.1%10.8%
1.6%
(4.1%)(5.1%)
(30.2%)
68.7%
68.0%
6.7%6.1%
5.2%
3.2%
(0.9%)(1.0%)
(28.9%)
n/a
71.8%59.1%
26.0%
21.5%
1.8%
18.5%
(1.2%)(1.4%)
33.0%
24.2%14.6%
13.6%
10.6%
9.2%
(0.0%)
(11.1%)
S&P 50017.5%
(100.0%)
(50.0%)
0.0%
50.0%
100.0%
150.0%
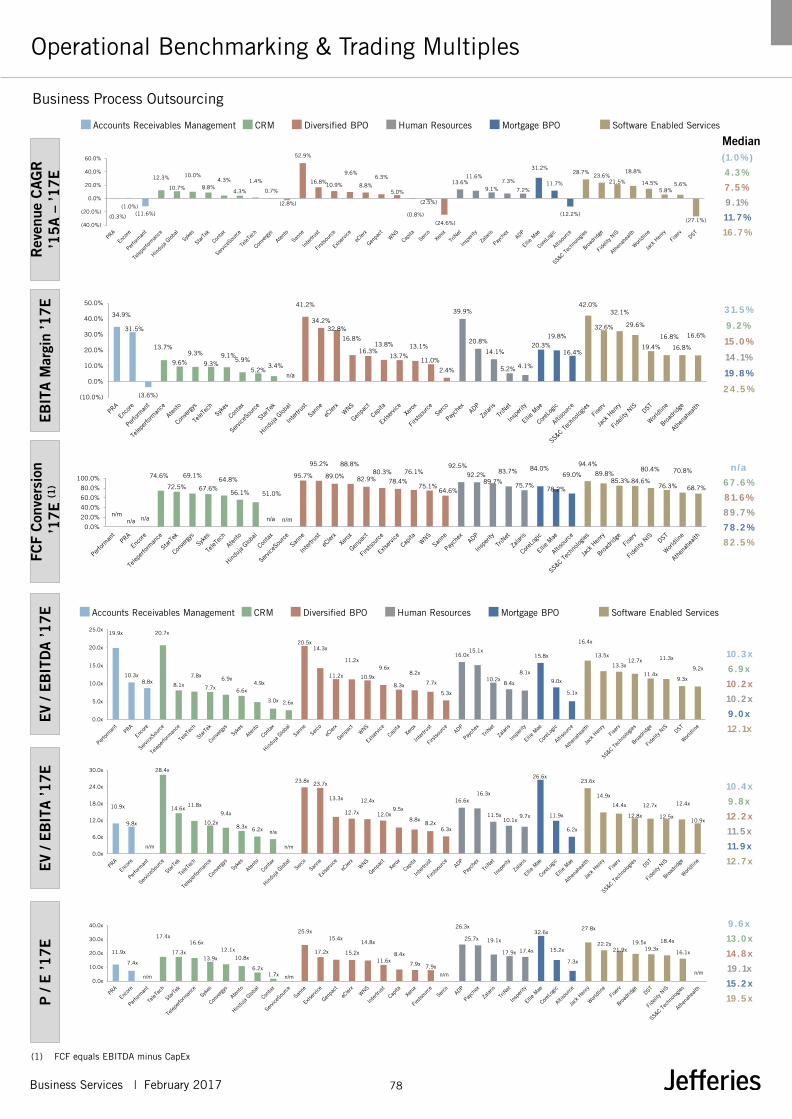
Business Services | February 2017 78
Business Process Outsourcing
Operational Benchmarking & Trading Multiples
(1) FCF equals EBITDA minus CapEx
Accounts Receivables Management Human Resources Mortgage BPO CRM Diversified BPO Software Enabled Services
EV
/ EB
ITD
A ’1
7E
E
V / E
BIT
A ’1
7E
P
/ E
’17E
Median
Accounts Receivables Management Human Resources Mortgage BPO CRM Diversified BPO Software Enabled Services
Rev
enue
CA
GR
’1
5A
– ’1
7E
EB
ITA M
argi
n ’1
7E
FCF
Con
vers
ion
’17E
(1)
(1.0 %)
4 .3 %
7 .5 %
9 .1%
11.7 %
16 .7 %
3 1.5 %
9 .2 %
15 .0 %
14 .1%
19 .8 %
2 4 .5 %
n/a
6 7 .6 %
8 1.6 %
8 9 .7 %
7 8 .2 %
8 2 .5 %
10 .3 x
6 .9 x
10 .2 x
10 .2 x
9 .0 x
12 .1x
10 .4 x
9 .8 x
12 .2 x
11.5 x
11.9 x
12 .7 x
11.9x
7.4x
n/m
17.4x
17.3x
16.6x
13.9x
12.1x
10.8x
6.2x1.7x n/m
25.9x
17.2x
15.4x
15.2x
14.8x
11.6x8.4x
7.9x 7.9xn/m
26.3x
25.7x 19.1x
17.9x 17.4x
32.6x
15.2x
7.3x
27.8x
22.2x21.9x
19.5x19.3x
18.4x
16.1x
n/m
0.0x
10.0x
20.0x
30.0x
40.0x 9 .6 x
13 .0 x
14 .8 x
19 .1x
15 .2 x
19 .5 x
(0.3%)
(1.0%)(11.6%)
12.3%
10.7%
10.0%
8.8%4.3%
4.3%
1.4%
0.7%
(2.8%)
52.9%
16.8%10.9%
9.6%
8.8%
6.3%
5.0%
(0.8%)
(2.5%)
(24.6%)
13.6%11.6%
9.1%7.3%
7.2%
31.2%
11.7%
(12.2%)
28.7%23.6%
21.5%
18.8%
14.5%5.8%
5.6%
(27.1%)(40.0%)
(20.0%)
0.0%
20.0%
40.0%
60.0%
34.9%
31.5%
(3.6%)
13.7%
9.6%
9.3%
9.3%9.1%
5.9%
5.2%3.4%
n/a
41.2%
34.2%32.8%
16.8%
16.3%13.8%
13.7%
13.1%
11.0%
2.4%
39.9%
20.8%
14.1%
5.2% 4.1%
20.3%19.8%
16.4%
42.0%
32.6%
32.1%
29.6%
19.4%
16.8%
16.8%
16.6%
(10.0%)
0.0%
10.0%
20.0%
30.0%
40.0%
50.0%
n/mn/a n/a
74.6%
72.5%
69.1%
67.6%64.8%
56.1% 51.0%
n/a n/m
95.7%
95.2%
89.0%
88.8%
82.9%80.3%
78.4%
76.1%
75.1%64.6%
92.5%92.2%
89.7%
83.7%
75.7%
84.0%
78.2%
69.0%
94.4%
89.8%85.3% 84.6%
80.4%
76.3%
70.8%
68.7%
0.0%
20.0%
40.0%
60.0%
80.0%
100.0%
10.9x
9.8x
n/m
28.4x
14.6x11.8x
10.2x
9.4x
8.3x 6.2x n/a
n/m
23.8x 23.7x
13.3x
12.7x
12.4x
12.0x9.5x
8.8x8.2x
6.3x
16.6x16.3x
11.5x10.1x
9.7x
26.6x
11.9x
6.2x
23.6x
14.9x
14.4x
12.8x
12.7x
12.5x
12.4x
10.9x
0.0x
6.0x
12.0x
18.0x
24.0x
30.0x
19.9x
10.3x8.8x
20.7x
8.1x
7.8x
7.7x
6.9x
6.6x4.9x
3.0x 2.6x
20.5x14.3x
11.2x
11.2x
10.9x
9.6x
8.3x
8.2x
7.7x
5.3x
16.0x15.1x
10.2x8.4x
8.1x
15.8x
9.0x
5.1x
16.4x
13.5x
13.3x12.7x
11.4x
11.3x
9.3x
9.2x
0.0x
5.0x
10.0x
15.0x
20.0x
25.0x
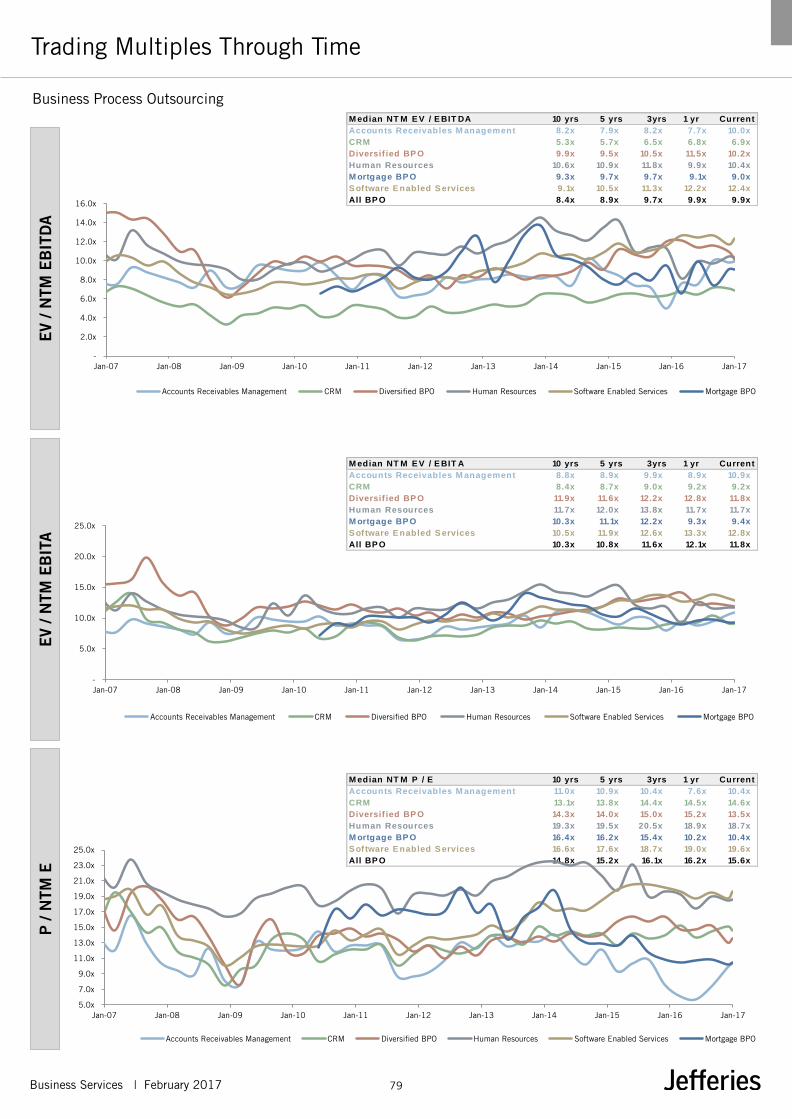
Business Services | February 2017 79
Business Process Outsourcing
Trading Multiples Through Time E
V / N
TM E
BIT
DA
E
V / N
TM E
BIT
A
P /
NTM
E
M edian NT M E V / E BIT DA 10 yrs 5 yrs 3yrs 1 yr Current
Accounts Receivables M anagement 8.2x 7.9x 8.2x 7.7x 10.0x
CRM 5.3x 5.7x 6.5x 6.8x 6.9x
Diversif ied BP O 9.9x 9.5x 10.5x 11.5x 10.2x
Human Resources 10.6x 10.9x 11.8x 9.9x 10.4x
M ortgage BP O 9.3x 9.7x 9.7x 9.1x 9.0x
S oftware E nabled S ervices 9.1x 10.5x 11.3x 12.2x 12.4x
All BP O 8.4x 8.9x 9.7x 9.9x 9.9x
M edian NT M E V / E BIT A 10 yrs 5 yrs 3yrs 1 yr Current
Accounts Receivables M anagement 8.8x 8.9x 9.9x 8.9x 10.9x
CRM 8.4x 8.7x 9.0x 9.2x 9.2x
Diversif ied BP O 11.9x 11.6x 12.2x 12.8x 11.8x
Human Resources 11.7x 12.0x 13.8x 11.7x 11.7x
M ortgage BP O 10.3x 11.1x 12.2x 9.3x 9.4x
S oftware E nabled S ervices 10.5x 11.9x 12.6x 13.3x 12.8x
All BP O 10.3x 10.8x 11.6x 12.1x 11.8x
M edian NT M P / E 10 yrs 5 yrs 3yrs 1 yr Current
Accounts Receivables M anagement 11.0x 10.9x 10.4x 7.6x 10.4x
CRM 13.1x 13.8x 14.4x 14.5x 14.6x
Diversif ied BP O 14.3x 14.0x 15.0x 15.2x 13.5x
Human Resources 19.3x 19.5x 20.5x 18.9x 18.7x
M ortgage BP O 16.4x 16.2x 15.4x 10.2x 10.4x
S oftware E nabled S ervices 16.6x 17.6x 18.7x 19.0x 19.6x
All BP O 14.8x 15.2x 16.1x 16.2x 15.6x
-
2.0x
4.0x
6.0x
8.0x
10.0x
12.0x
14.0x
16.0x
Jan-07 Jan-08 Jan-09 Jan-10 Jan-11 Jan-12 Jan-13 Jan-14 Jan-15 Jan-16 Jan-17
Accounts Receivables Management CRM Diversified BPO Human Resources Software Enabled Services Mortgage BPO
-
5.0x
10.0x
15.0x
20.0x
25.0x
Jan-07 Jan-08 Jan-09 Jan-10 Jan-11 Jan-12 Jan-13 Jan-14 Jan-15 Jan-16 Jan-17
Accounts Receivables Management CRM Diversified BPO Human Resources Software Enabled Services Mortgage BPO
5.0x
7.0x
9.0x
11.0x
13.0x
15.0x
17.0x
19.0x
21.0x
23.0x
25.0x
Jan-07 Jan-08 Jan-09 Jan-10 Jan-11 Jan-12 Jan-13 Jan-14 Jan-15 Jan-16 Jan-17
Accounts Receivables Management CRM Diversified BPO Human Resources Software Enabled Services Mortgage BPO

Business Services | February 2017 80
Business Process Outsourcing
Valuation Decomposition & Re-rating Analysis
(1) Adjusted net debt includes net debt, preferred equity, minority interest and unfunded pension liabilities
NTM EBITDA
EV / NTM EBITDA
% Share Price Δ (LTM) % Re-rating & % Earnings Impact (LTM) EV = Adj. Net Debt + Market Cap (1)
% Re-rating (P/E NTM)
% Earnings Impact (NTM Net Income)
3.7%
7.5x
8.5x
9.5x
10.5x
11.5x
Jan-14 Jul-14 Jan-15 Jul-15 Jan-16 Jul-16 Jan-17
EV / NTM EBITDA
(1.9%)
(8.0%)
(6.0%)
(4.0%)
(2.0%)
-
2.0%
4.0%
6.0%
Jan-14 Jul-14 Jan-15 Jul-15 Jan-16 Jul-16 Jan-17
NTM EBITDA
11.6%
-
20.0%
40.0%
60.0%
80.0%
100.0%
120.0%
Jan-14 Jul-14 Jan-15 Jul-15 Jan-16 Jul-16 Jan-17
Adjusted Net Debt Market Cap EV
n/a
60.9%
(24.1%)
16.2%
n/a
104.9%
100.2%
11.2%
7.8%
15.7%
6.1%
n/a
11.2%
(31.5%)
5.5%
(12.4%)
5.9%
29.1%
2.8%
25.7%
1.6%
(1.5%)
(7.9%)
(2.5%)
(17.2%)
0.0%
(20.4%)
4.5%
(21.5%)
(16.0%)
38.6%
10.3%
(20.2%)
(37.6%)
(16.5%)
n/a
6.8%
122.4%
n/a
36.9%
(34.1%)
(33.2%)
19.5%
19.7%
8.8%
17.1%
9.3%
73.0%
8.7%
30.2%
7.3%
(14.2%)
7.6%
(13.1%)
5.0%
7.7%
14.3%
5.8%
23.0%
1.6%
25.5%
(5.1%)
26.1%
17.7%
(28.8%)
(13.0%)
18.8%
42.4%
(14.9%)
n/a
(100.0%) 0.0% 100.0%
StarTek 116%
TriNet 72%
Serco 69%
Sanne 68%
Insperity 59%
ServiceSource 37%
Encore 35%
PRA 34%
Fidelity NIS 33%
Teleperformance 29%
Paychex 26%
Broadridge 24%
Performant 22%
ADP 22%
Ellie Mae 18%
Worldline 15%
Hinduja Global 14%
Fiserv 14%
TeleTech 11%
Jack Henry 11%
DST 9%
eClerx 7%
Firstsource 6%
Exlservice 5%
Genpact 3%
Zalaris 2%
Convergys 2%
SS&C Technologies (0%)
WNS (1%)
Intertrust (1%)
CoreLogic (1%)
Altisource (1%)
Atento (4%)
Sykes (5%)
Athenahealth (11%)
Xerox (29%)
Contax (30%)
Intertrust (n/a)

81 Business Services | September 2016
Contingent Services

Business Services | February 2017 82
Contingent Services - Staffing
Company Comparable Analysis
Size Share Price Operational KPIs Trading Multiples
Country Mkt. Cap EV Performance Rev. CAGR '17E Margins FCF Net Debt / EV / EBITDA EV / EBITA EV / EBITDA - Capex P / E
€m, unless specified Current LTM YTD '15A-'17E EBITDA EBITA '17E LTM EBITDA '16E '17E '16E '17E '16E '17E '16E '17E
Generalist
Recruit Japan 22,636 22,132 40.6 30.6% 5.4% 16.6% 12.0% 6.8% 80.4% (0.5x) 12.2x 10.9x 22.3x 19.1x 14.6x 13.6x n/a n/a
Adecco Switzerland 11,292 12,521 66.0 12.6% 5.6% 3.2% 5.4% 5.2% 92.6% 1.0x 10.4x 9.9x 10.8x 10.3x 11.1x 10.6x 15.0x 14.0x
Randstad Netherlands 9,838 10,748 53.8 7.3% 4.4% 7.8% 5.0% 4.8% 92.4% 0.9x 11.3x 9.7x 11.9x 9.9x 12.1x 10.5x 16.7x 13.3x
Manpower United States 5,932 6,142 88.5 25.0% 7.4% 1.8% 4.3% 4.0% 93.8% 0.3x 7.9x 7.8x 8.4x 8.3x 8.5x 8.3x 14.4x 14.3x
Temp Holdings Japan 3,778 3,469 16.1 10.9% 7.9% 14.5% 7.1% 5.7% 90.2% (1.3x) 10.4x 9.2x 13.1x 11.5x 11.4x 10.2x n/a n/a
Hays Australia 2,560 2,534 1.8 20.0% 2.1% 9.2% 4.8% 4.6% 93.2% (0.2x) 8.4x 9.5x 8.7x 9.8x 8.9x 10.2x 17.2x 16.3x
Insperity United States 1,410 1,240 66.3 6.2% 10.5% 11.6% 5.1% 4.1% 89.7% (2.0x) 11.2x 8.1x 12.5x 10.1x 15.6x 9.0x 23.1x 17.4x
PageGroup United Kingdom 1,565 1,480 5.0 59.1% 0.8% 9.5% 9.3% 8.0% 87.3% (0.8x) 10.9x 10.7x 12.8x 12.5x 13.0x 12.3x 18.9x 18.3x
Kelly United States 793 912 20.7 35.0% (2.3%) 0.7% n/a n/a n/a n/a n/m n/m n/m n/m n/a n/a 12.7x 12.2x
Groupe CRIT France 818 914 73.7 46.8% 8.4% 7.4% 6.2% 5.7% 77.4% 0.5x 7.4x 6.5x 8.0x 7.2x 9.5x 8.5x 11.0x 9.7x
Synergie France 918 916 38.2 58.5% 9.3% 8.0% 6.3% 5.8% 94.4% (0.1x) 7.9x 6.9x 8.6x 7.5x 8.4x 7.4x 13.0x 11.1x
CDI United States 149 153 8.0 67.3% 16.2% n/a n/a n/a n/a n/a n/m n/m n/m n/m n/a n/a n/a n/a
Median 27.8% 6.5% 8.0% 5.8% 5.4% 91.3% (0.1x) 10.4x 9.4x 11.3x 10.0x 11.3x 10.2x 15.0x 14.0x
Mean 31.6% 6.3% 8.2% 6.5% 5.5% 89.1% (0.2x) 9.8x 8.9x 11.7x 10.6x 11.3x 10.1x 15.8x 14.1x
Specialist
Robert Half United States 5,532 5,292 43.6 7.5% (3.5%) 1.6% 11.4% 10.3% 86.1% (0.4x) 9.2x 9.5x 10.3x 10.5x 10.7x 11.0x 17.4x 17.7x
On Assignment United States 2,221 2,790 42.0 17.2% 2.5% 12.0% 12.2% 8.7% 92.2% 2.8x 12.0x 9.5x 15.9x 13.4x 13.4x 10.3x 24.7x 15.2x
TrueBlue United States 946 1,039 22.9 5.0% 5.5% (3.4%) 5.6% 5.0% 84.5% 0.7x 8.2x 7.9x 9.3x 8.7x 9.8x 9.3x 15.5x 13.0x
Brunel Netherlands 818 682 16.2 8.4% 0.4% (17.7%) 5.4% 4.5% 83.7% (2.3x) 18.3x 15.2x 21.1x 18.2x 22.8x 18.2x n/m 29.1x
Kforce United States 549 654 21.3 3.1% (0.4%) 0.9% 5.2% 4.6% 88.6% 1.4x 10.7x 10.1x 12.1x 11.3x 12.7x 11.4x 18.1x 14.9x
SThree United Kingdom 477 466 3.7 3.7% 2.9% 11.2% 4.5% 4.3% 83.3% (0.2x) 8.5x 8.3x 8.9x 8.8x 9.2x 10.0x 14.9x 13.7x
Robert Walters United Kingdom 310 298 4.3 12.1% 8.3% 11.9% 3.3% 2.8% 82.0% (0.4x) 8.5x 7.7x 9.9x 8.8x 10.3x 9.4x 14.7x 13.4x
Median 7.5% 2.5% 1.6% 5.4% 4.6% 84.5% (0.2x) 9.2x 9.5x 10.3x 10.5x 10.7x 10.3x 16.5x 14.9x
Mean 8.1% 2.2% 2.4% 6.8% 5.8% 85.8% 0.2x 10.8x 9.7x 12.5x 11.4x 12.7x 11.4x 17.5x 16.7x
Median 12.6% 5.4% 7.9%n/m 5.4% 5.0% 88.6% (0.2x) 10.4x 9.5x 10.8x 10.1x 11.1x 10.2x 15.5x 14.2x
Mean 23.0% 4.8% 5.9%n/m 6.6% 5.6% 87.8% (0.0x) 10.2x 9.3x 12.0x 10.9x 11.9x 10.6x 16.5x 15.2x
Company

Business Services | February 2017 83
Contingent Services - Staffing
Share Price Performance La
st M
onth
Ye
ar-t
o-D
ate
Last
Tw
elve
Mon
ths
16.2%
10.5%9.3% 8.4% 7.9%
7.4%5.6% 5.4% 4.4% 2.1%
0.8%
(2.3%)
8.3%
5.5%
2.9% 2.5%
0.4%
(0.4%)
(3.5%)
S&P 5001.8%
(20.0%)
0.0%
20.0%Generalist 6.5% Specialist 2.2%
Median YTD Price Performance
16.2%
10.5%
9.3% 8.4% 7.9% 7.4%
5.6%5.4%
4.4% 2.1%
0.8%
(2.3%)
8.3%
5.5%
2.9% 2.5%
0.4%
(0.4%)
(3.5%)
S&P 5001.8%
(5.0%)
0.0%
5.0%
10.0%
15.0%
20.0%
Generalist 6.5% Specialist 2.2%Median LM Price Performance
67.3%
59.1% 58.5%
46.8%
35.0%
30.6%
25.0%20.0%
12.6%10.9%
7.3% 6.2%
17.2% 12.1%
8.4% 7.5%5.0% 3.7%
3.1%
S&P 50017.5%
0.0%
10.0%
20.0%
30.0%
40.0%
50.0%
60.0%
70.0%
80.0%
90.0%
100.0% Generalist 27.8% Specialist 7.9%Median LTM Price Performance

Business Services | February 2017 84
Contingent Services - Staffing
Operational Benchmarking & Trading Multiples
(1) FCF equals EBITDA minus CapEx
Generalist Specialist
EV
/ EB
ITD
A ’1
7E
EV
/ EB
ITA ’1
7E
P
/ E
’17E
Median
Generalist Specialist
Rev
enue
CAG
R
’15A
– ’1
7E
EB
ITA M
argi
n ’1
7E
FCF
Con
vers
ion
’17E
(1)
16.6% 14.5%11.6%
9.5% 9.2% 8.0% 7.8% 7.4%
3.2% 1.8% 0.7% n/a
12.0% 11.9% 11.2%
1.6% 0.9%
(3.4%)
(17.7%)(20.0%)
(15.0%)
(10.0%)
(5.0%)
0.0%
5.0%
10.0%
15.0%
20.0%
8.0%
1.6%
8.0%6.8%
5.8% 5.7% 5.7% 5.2% 4.8% 4.6% 4.1% 4.0%
n/a n/a
10.3%
8.7%
5.0% 4.6% 4.5% 4.3%2.8%
0.0%
2.0%
4.0%
6.0%
8.0%
10.0%
12.0%
5.4%
4.6%
94.4% 93.8% 93.2% 92.6% 92.4% 90.2% 89.7% 87.3%80.4% 77.4%
n/a n/a
92.2%88.6% 86.1% 84.5% 83.7% 83.3% 82.0%
0.0%
20.0%
40.0%
60.0%
80.0%
100.0%
91.3%
84.5%
9.4x
9.5x
19.1x
12.5x11.5x
10.3x 10.1x 9.9x 9.8x8.3x 7.5x 7.2x
n/a n/a
18.2x
13.4x11.3x 10.5x
8.8x 8.8x 8.7x
0.0x
5.0x
10.0x
15.0x
20.0x
25.0x
10.0x
10.5x
18.3x 17.4x 16.3x14.3x 14.0x 13.3x 12.2x 11.1x
9.7x
n/a n/a n/a
29.1x
17.7x15.2x 14.9x 13.7x 13.4x 13.0x
0.0x
5.0x
10.0x
15.0x
20.0x
25.0x
30.0x
35.0x
14.0x
14.9x
10.9x 10.7x9.9x 9.7x 9.5x 9.2x
8.1x 7.8x6.9x 6.5x
n/m n/m
15.2x
10.1x 9.5x 9.5x8.3x 7.9x 7.7x
0.0x
2.0x
4.0x
6.0x
8.0x
10.0x
12.0x
14.0x
16.0x

Business Services | February 2017 85
Contingent Services - Staffing
Trading Multiples Through Time E
V / N
TM E
BIT
DA
E
V / N
TM E
BIT
A
P /
NTM
E
M edian NT M EV / EBIT DA 10 yrs 5 yrs 3yrs 1 yr Current
Generalist 7.6x 7.6x 8.4x 7.7x 9.6x
Specialist 9.0x 9.4x 9.5x 8.4x 9.5x
All S taf f ing 8.4x 8.5x 8.8x 8.2x 9.6x
M edian NT M EV / EBIT A 10 yrs 5 yrs 3yrs 1 yr Current
Generalist 9.6x 9.4x 10.1x 9.3x 10.1x
Specialist 10.2x 10.8x 11.0x 9.3x 10.5x
All S taf f ing 9.8x 9.9x 10.3x 9.3x 10.3x
M edian NT M P / E 10 yrs 5 yrs 3yrs 1 yr Current
Generalist 14.7x 14.2x 14.3x 12.7x 14.3x
Specialist 15.9x 17.0x 16.3x 13.3x 15.1x
All S taf f ing 15.1x 15.7x 15.4x 13.0x 14.5x
-
2.0x
4.0x
6.0x
8.0x
10.0x
12.0x
14.0x
16.0x
Jan-07 Jan-08 Jan-09 Jan-10 Jan-11 Jan-12 Jan-13 Jan-14 Jan-15 Jan-16 Jan-17
Generalist Specialist
-
2.0x
4.0x
6.0x
8.0x
10.0x
12.0x
14.0x
16.0x
18.0x
20.0x
Jan-07 Jan-08 Jan-09 Jan-10 Jan-11 Jan-12 Jan-13 Jan-14 Jan-15 Jan-16 Jan-17
Generalist Specialist
-
5.0x
10.0x
15.0x
20.0x
25.0x
30.0x
Jan-07 Jan-08 Jan-09 Jan-10 Jan-11 Jan-12 Jan-13 Jan-14 Jan-15 Jan-16 Jan-17
Generalist Specialist
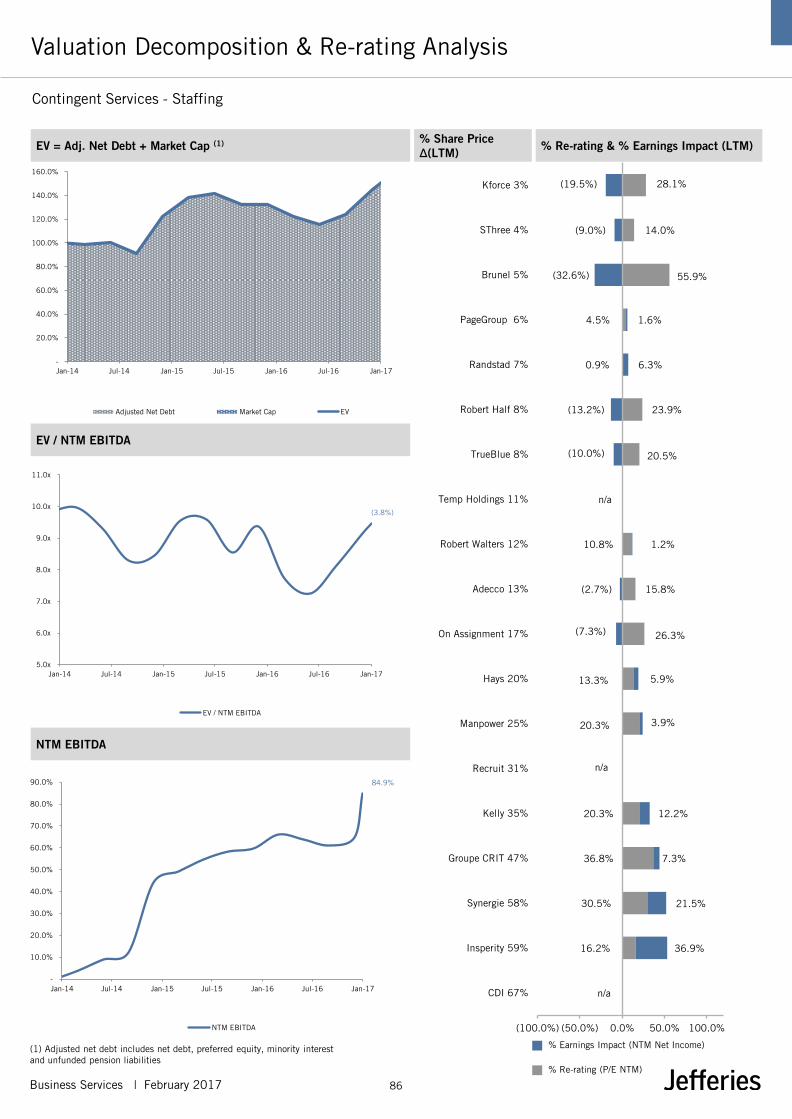
Business Services | February 2017 86
Contingent Services - Staffing
Valuation Decomposition & Re-rating Analysis
(1) Adjusted net debt includes net debt, preferred equity, minority interest and unfunded pension liabilities
NTM EBITDA
EV / NTM EBITDA
% Share Price Δ(LTM) % Re-rating & % Earnings Impact (LTM) EV = Adj. Net Debt + Market Cap (1)
% Re-rating (P/E NTM)
% Earnings Impact (NTM Net Income)
n/a
16.2%
30.5%
36.8%
20.3%
n/a
20.3%
13.3%
26.3%
15.8%
10.8%
20.5%
23.9%
0.9%
4.5%
55.9%
14.0%
28.1%
36.9%
21.5%
7.3%
12.2%
3.9%
5.9%
(7.3%)
(2.7%)
1.2%
n/a
(10.0%)
(13.2%)
6.3%
1.6%
(32.6%)
(9.0%)
(19.5%)
(100.0%) (50.0%) 0.0% 50.0% 100.0%
CDI 67%
Insperity 59%
Synergie 58%
Groupe CRIT 47%
Kelly 35%
Recruit 31%
Manpower 25%
Hays 20%
On Assignment 17%
Adecco 13%
Robert Walters 12%
Temp Holdings 11%
TrueBlue 8%
Robert Half 8%
Randstad 7%
PageGroup 6%
Brunel 5%
SThree 4%
Kforce 3%
(3.8%)
5.0x
6.0x
7.0x
8.0x
9.0x
10.0x
11.0x
Jan-14 Jul-14 Jan-15 Jul-15 Jan-16 Jul-16 Jan-17
EV / NTM EBITDA
84.9%
-
10.0%
20.0%
30.0%
40.0%
50.0%
60.0%
70.0%
80.0%
90.0%
Jan-14 Jul-14 Jan-15 Jul-15 Jan-16 Jul-16 Jan-17
NTM EBITDA
-
20.0%
40.0%
60.0%
80.0%
100.0%
120.0%
140.0%
160.0%
Jan-14 Jul-14 Jan-15 Jul-15 Jan-16 Jul-16 Jan-17
Adjusted Net Debt Market Cap EV

Business Services | February 2017 87
Contingent Services – Equipment Rental
Company Comparable Analysis
Size Share Price Operational KPIs Trading Multiples
Country Mkt. Cap EV Performance Rev. CAGR '17E Margins FCF Net Debt / EV / EBITDA EV / EBITA EV / EBITDA - Capex P / E
€m, unless specified Current LTM YTD '15A-'17E EBITDA EBITA '17E LTM EBITDA '16E '17E '16E '17E '16E '17E '16E '17E
Equipment Rental
United Rentals United States 9,884 16,814 117.2 164.1% 19.8% 0.9% 47.9% 40.8% 47.4% 4.2x 10.6x 6.4x 11.1x 7.5x 20.7x 13.5x 18.8x 13.9x
Ashtead United Kingdom 9,305 12,443 18.7 78.6% 1.6% 18.4% 48.5% 29.7% 41.2% 2.5x 7.7x 6.6x 12.5x 10.8x 16.1x 16.0x 16.6x 14.2x
Aggreko United Kingdom 2,989 3,748 11.7 18.1% 9.7% 4.6% 32.4% 15.2% 45.7% 1.2x 6.1x 5.8x 12.8x 12.4x 12.6x 12.8x 15.9x 16.0x
Cramo Finland 1,025 1,417 23.1 206.0% 11.3% 5.8% 31.4% 16.6% 36.2% 2.3x 7.1x 6.0x 15.1x 11.4x n/m 16.7x 14.9x 12.2x
H&E Equipment United States 852 1,659 24.0 30.4% (3.1%) (3.2%) 30.4% 11.6% 44.3% 5.8x 6.0x 6.0x 16.0x 15.9x 16.7x 13.7x 26.2x 25.4x
Ramirent Finland 743 1,101 6.9 122.0% 11.2% 4.0% 27.2% 10.3% 29.6% 2.2x 6.8x 5.9x 19.0x 15.6x n/m 19.9x 33.7x 16.1x
Nishio Rent Japan 708 896 26.5 4.0% (10.2%) 5.8% 25.9% 10.0% 86.2% 0.6x 3.4x 3.3x 9.1x 8.6x 3.9x 3.9x n/a n/a
Neff United States 130 735 14.5 18.5% 15.8% 3.0% 47.0% 25.9% n/a 7.5x 4.1x 4.1x 7.8x 7.5x n/a n/a 10.6x 10.1x
Zhejiang CSS&T China 1,051 1,011 2.6 12.6% (6.6%) 13.9% n/a n/a n/a n/a n/m n/m n/m n/m n/a n/a n/a n/a
Tat Hong Singapore 148 384 0.2 (22.6%) 4.3% (7.6%) 23.7% 5.5% 81.6% 4.5x 5.9x 5.3x n/m 22.6x 7.2x 6.4x n/m n/m
Vp United Kingdom 364 489 9.3 15.4% 4.6% 8.5% 29.3% 16.3% n/a 1.9x 6.3x 5.9x 11.5x 10.5x n/a n/a 12.1x 11.0x
Lavendon United Kingdom 533 706 3.1 99.6% 1.9% 5.6% 33.1% 17.4% 35.7% 2.3x 6.8x 6.6x 12.7x 12.5x n/m 18.5x 14.4x 13.6x
Silver Chef Australia 228 401 6.3 24.4% 0.0% 25.7% 62.3% 18.8% n/m 1.9x 3.5x 3.0x 10.2x 9.8x n/m n/m 13.8x 11.9x
HSS Hire United Kingdom 128 398 0.8 3.4% 1.6% 7.6% 22.0% 7.3% 49.6% 4.0x 4.7x 4.3x 16.1x 12.9x 11.3x 8.7x 21.3x 10.1x
Speedy Hire United Kingdom 308 403 0.6 (12.3%) (12.9%) 1.0% 18.0% 6.5% 28.0% 1.4x 5.9x 5.5x 20.5x 15.3x 15.9x 19.6x n/m 18.1x
Emeco Australia 34 282 0.1 120.5% 26.5% n/a n/a n/a n/a n/a n/m n/m n/m n/m n/a n/a n/a n/a
Sanghvi Movers India 130 130 3.0 (35.1%) 9.7% 11.7% 65.9% n/a 77.9% 0.0x 2.6x 2.4x n/m n/m 5.2x 3.1x 8.6x 7.8x
Boom Australia 40 74 0.1 44.6% 14.3% n/a n/a n/a n/a n/a n/m n/m n/m n/m n/a n/a n/a n/a
Median 21.4% 4.5% 5.7% 31.4% 15.8% 45.0% 2.3x 6.0x 5.8x 12.7x 11.9x 12.6x 13.6x 15.4x 13.6x
Mean 49.6% 5.5% 6.6% 36.3% 16.6% 50.3% 2.8x 5.8x 5.1x 13.4x 12.4x 12.2x 12.7x 17.3x 13.9x
Company

Business Services | February 2017 88
Contingent Services – Equipment Rental
Share Price Performance La
st M
onth
Ye
ar-t
o-D
ate
Last
Tw
elve
Mon
ths
26.5%
19.8%15.8%
14.3%11.3% 11.2% 9.7% 9.7%
4.6%4.3% 1.9%
1.6% 1.6% 0.0%
(3.1%)(6.6%)
(10.2%)(12.9%)
S&P 5001.8%
(40.0%)
0.0%
40.0%
Equipment Rental 4.5%
M edian YT D Price Performance
26.5%
19.8%
15.8% 14.3%
11.3% 11.2%9.7% 9.7%
4.6% 4.3%1.9% 1.6% 1.6% 0.0%
(3.1%)
(6.6%)(10.2%)
(12.9%)
S&P 5001.8%
(20.0%)
0.0%
20.0%
40.0%
Equipment Rental 4.5%
M edian LM Price Performance
206.0%
164.1%
122.0% 120.5%
99.6%
78.6%
44.6%
30.4% 24.4%18.5%
18.1%
15.4%12.6%
4.0% 3.4%
(12.3%)(22.6%) (35.1%)
S&P 50017.5%
(50.0%)
0.0%
50.0%
100.0%
150.0%
200.0%
250.0%
Equipment Rental 21.4%Median LTM Price Performance
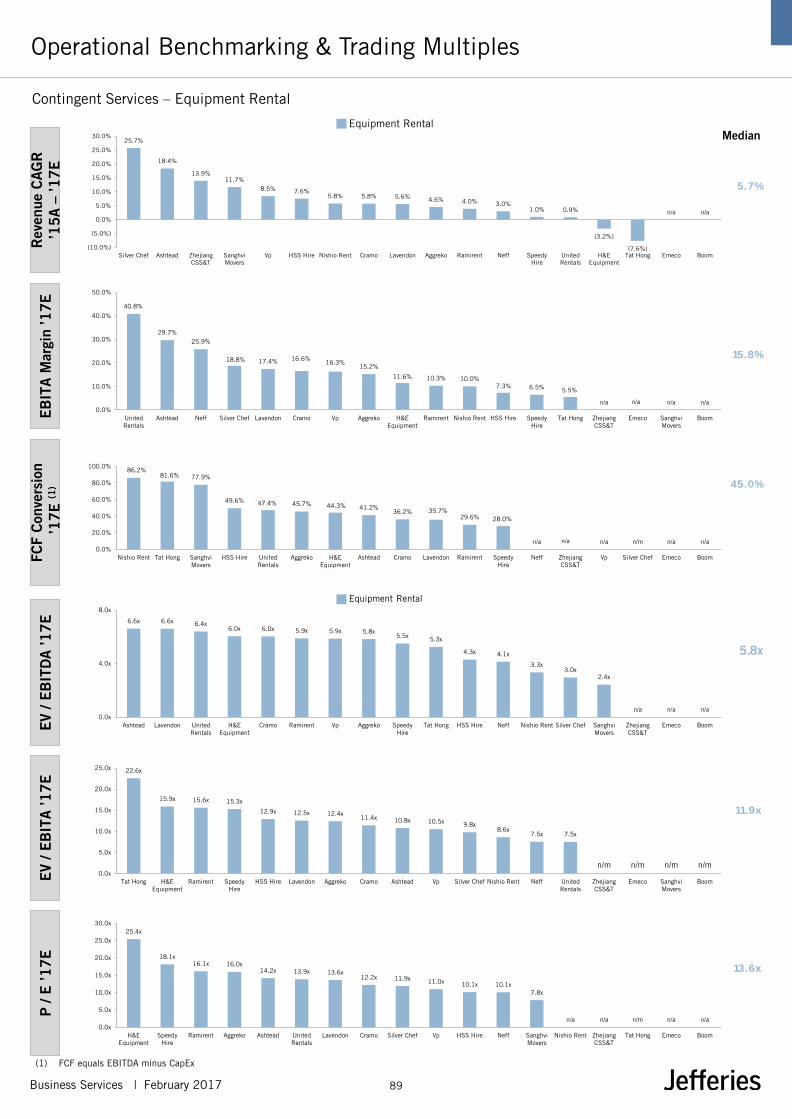
Business Services | February 2017 89
Contingent Services – Equipment Rental
Operational Benchmarking & Trading Multiples
(1) FCF equals EBITDA minus CapEx
Equipment Rental
EV
/ EB
ITD
A ’1
7E
E
V / E
BIT
A ’1
7E
P
/ E
’17E
Median
Equipment Rental
Rev
enue
CA
GR
’1
5A
– ’1
7E
EB
ITA M
argi
n ’1
7E
FCF
Con
vers
ion
’17E
(1)
25.7%
18.4%
13.9%11.7%
8.5% 7.6%5.8% 5.8% 5.6% 4.6% 4.0% 3.0%
1.0% 0.9%
(3.2%)
(7.6%)
n/a n/a
(10.0%)
(5.0%)
0.0%
5.0%
10.0%
15.0%
20.0%
25.0%
30.0%
Silver Chef Ashtead ZhejiangCSS&T
SanghviMovers
Vp HSS Hire Nishio Rent Cramo Lavendon Aggreko Ramirent Neff SpeedyHire
UnitedRentals
H&EEquipment
Tat Hong Emeco Boom
5.7%
40.8%
29.7%25.9%
18.8% 17.4% 16.6%16.3%
15.2%
11.6% 10.3% 10.0%7.3% 6.5% 5.5%
n/a n/a n/a n/a0.0%
10.0%
20.0%
30.0%
40.0%
50.0%
UnitedRentals
Ashtead Neff Silver Chef Lavendon Cramo Vp Aggreko H&EEquipment
Ramirent Nishio Rent HSS Hire SpeedyHire
Tat Hong ZhejiangCSS&T
Emeco SanghviMovers
Boom
15.8%
86.2%81.6% 77.9%
49.6% 47.4% 45.7% 44.3% 41.2%36.2% 35.7%
29.6% 28.0%
n/a n/a n/a n/m n/a n/a0.0%
20.0%
40.0%
60.0%
80.0%
100.0%
Nishio Rent Tat Hong SanghviMovers
HSS Hire UnitedRentals
Aggreko H&EEquipment
Ashtead Cramo Lavendon Ramirent SpeedyHire
Neff ZhejiangCSS&T
Vp Silver Chef Emeco Boom
45.0%
6.6x 6.6x 6.4x6.0x 6.0x 5.9x 5.9x 5.8x
5.5x 5.3x
4.3x 4.1x
3.3x3.0x
2.4x
n/a n/a n/a0.0x
4.0x
8.0x
Ashtead Lavendon UnitedRentals
H&EEquipment
Cramo Ramirent Vp Aggreko SpeedyHire
Tat Hong HSS Hire Neff Nishio Rent Silver Chef SanghviMovers
ZhejiangCSS&T
Emeco Boom
5.8x
22.6x
15.9x 15.6x 15.3x
12.9x 12.5x 12.4x11.4x 10.8x 10.5x 9.8x
8.6x7.5x 7.5x
n/m n/m n/m n/m0.0x
5.0x
10.0x
15.0x
20.0x
25.0x
Tat Hong H&EEquipment
Ramirent SpeedyHire
HSS Hire Lavendon Aggreko Cramo Ashtead Vp Silver Chef Nishio Rent Neff UnitedRentals
ZhejiangCSS&T
Emeco SanghviMovers
Boom
11.9x
25.4x
18.1x16.1x 16.0x
14.2x 13.9x 13.6x12.2x 11.9x 11.0x 10.1x 10.1x
7.8x
n/a n/a n/m n/a n/a0.0x
5.0x
10.0x
15.0x
20.0x
25.0x
30.0x
H&EEquipment
SpeedyHire
Ramirent Aggreko Ashtead UnitedRentals
Lavendon Cramo Silver Chef Vp HSS Hire Neff SanghviMovers
Nishio Rent ZhejiangCSS&T
Tat Hong Emeco Boom
13.6x
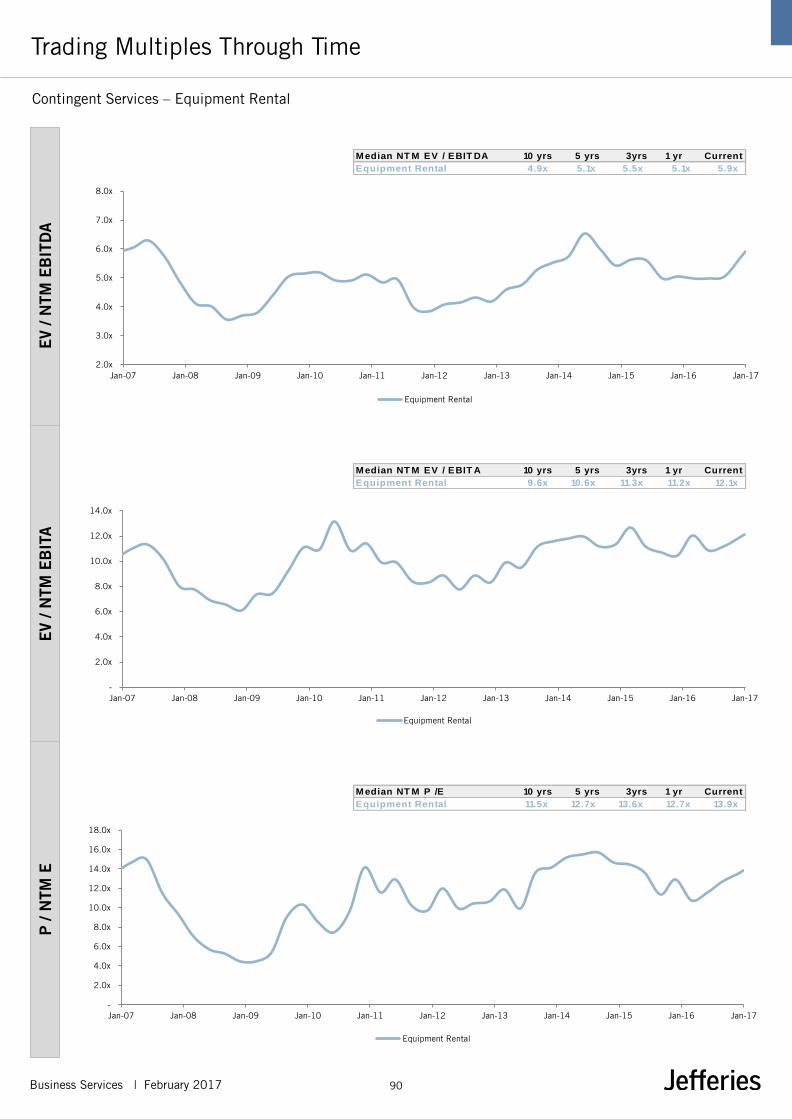
Business Services | February 2017 90
Contingent Services – Equipment Rental
Trading Multiples Through Time E
V / N
TM E
BIT
DA
E
V / N
TM E
BIT
A
P /
NTM
E
2.0x
3.0x
4.0x
5.0x
6.0x
7.0x
8.0x
Jan-07 Jan-08 Jan-09 Jan-10 Jan-11 Jan-12 Jan-13 Jan-14 Jan-15 Jan-16 Jan-17
Equipment Rental
-
2.0x
4.0x
6.0x
8.0x
10.0x
12.0x
14.0x
Jan-07 Jan-08 Jan-09 Jan-10 Jan-11 Jan-12 Jan-13 Jan-14 Jan-15 Jan-16 Jan-17
Equipment Rental
-
2.0x
4.0x
6.0x
8.0x
10.0x
12.0x
14.0x
16.0x
18.0x
Jan-07 Jan-08 Jan-09 Jan-10 Jan-11 Jan-12 Jan-13 Jan-14 Jan-15 Jan-16 Jan-17
Equipment Rental
Median NT M P /E 10 yrs 5 yrs 3yrs 1 yr Current
Equipment Rental 11.5x 12.7x 13.6x 12.7x 13.9x
Median NT M EV / EBIT A 10 yrs 5 yrs 3yrs 1 yr Current
Equipment Rental 9.6x 10.6x 11.3x 11.2x 12.1x
Median NT M EV / EBIT DA 10 yrs 5 yrs 3yrs 1 yr Current
Equipment Rental 4.9x 5.1x 5.5x 5.1x 5.9x
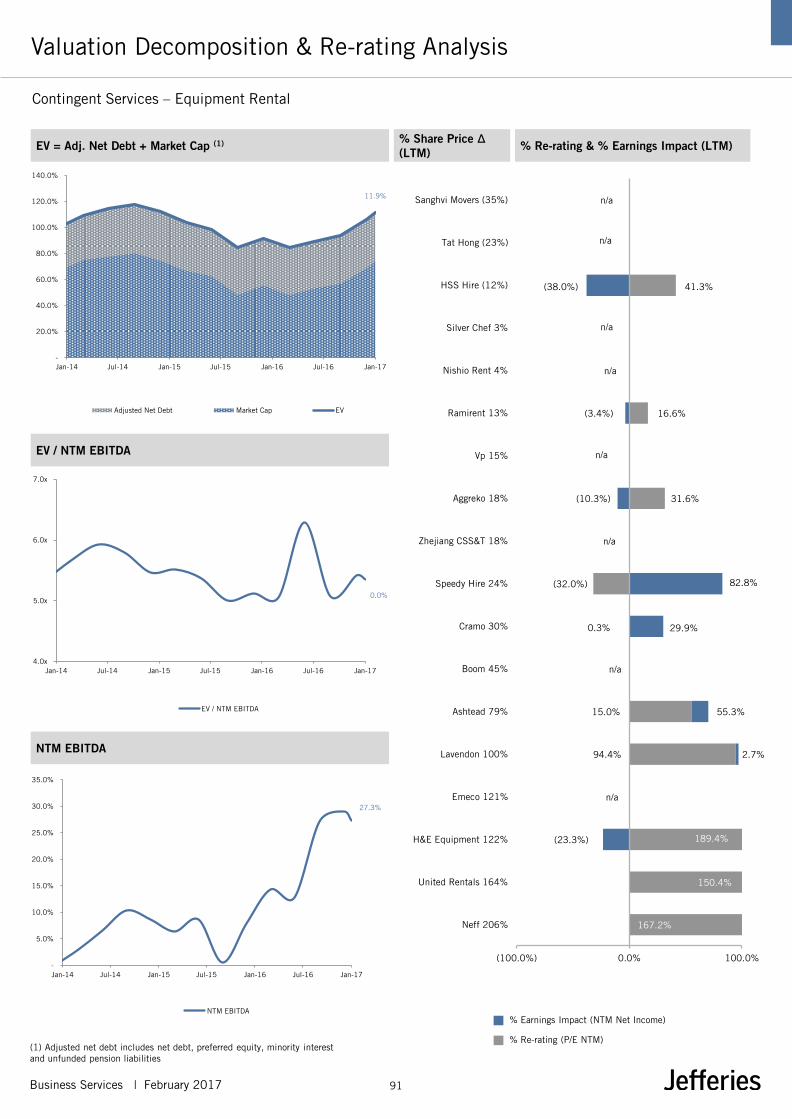
Business Services | February 2017 91
Contingent Services – Equipment Rental
Valuation Decomposition & Re-rating Analysis
(1) Adjusted net debt includes net debt, preferred equity, minority interest and unfunded pension liabilities
% Re-rating (P/E NTM)
NTM EBITDA
EV / NTM EBITDA
% Share Price Δ (LTM) % Re-rating & % Earnings Impact (LTM) EV = Adj. Net Debt + Market Cap (1)
% Earnings Impact (NTM Net Income)
167.2%
150.4%
189.4%
n/a
94.4%
55.3%
n/a
0.3%
(32.0%)
31.6%
16.6%
n/a
41.3%
n/a
n/a
(23.3%)
2.7%
15.0%
29.9%
82.8%
n/a
(10.3%)
n/a
(3.4%)
n/a
(38.0%)
(100.0%) 0.0% 100.0%
Neff 206%
United Rentals 164%
H&E Equipment 122%
Emeco 121%
Lavendon 100%
Ashtead 79%
Boom 45%
Cramo 30%
Speedy Hire 24%
Zhejiang CSS&T 18%
Aggreko 18%
Vp 15%
Ramirent 13%
Nishio Rent 4%
Silver Chef 3%
HSS Hire (12%)
Tat Hong (23%)
Sanghvi Movers (35%)11.9%
-
20.0%
40.0%
60.0%
80.0%
100.0%
120.0%
140.0%
Jan-14 Jul-14 Jan-15 Jul-15 Jan-16 Jul-16 Jan-17
Adjusted Net Debt Market Cap EV
0.0%
4.0x
5.0x
6.0x
7.0x
Jan-14 Jul-14 Jan-15 Jul-15 Jan-16 Jul-16 Jan-17
EV / NTM EBITDA
27.3%
-
5.0%
10.0%
15.0%
20.0%
25.0%
30.0%
35.0%
Jan-14 Jul-14 Jan-15 Jul-15 Jan-16 Jul-16 Jan-17
NTM EBITDA
Business Services | February 2017 92
Important Disclosure
This document is being furnished for informational purposes only and does not constitute an offer to sell or the solicitation of an offer to purchase any security, future or other financial instrument or product. It is not intended to form the basis of an investment decision and has not been verified. Jefferies International Limited (“Jefferies”) makes no recommendation or representation as to, and accepts no responsibility or liability for, the accuracy or completeness of the information contained herein or any other information, whether written or oral, made available and any liability therefore is expressly disclaimed. Such information is presented as of the date and, if applicable, time indicated and Jefferies does not accept any responsibility for updating any such information.
Any simulations, projections, valuations and statistical analyses contained herein have been provided to assist the recipient in the evaluation of the matters described herein; such simulations, projections, valuations and analyses may be based on subjective assessments and assumptions and may utilise one among alternative methodologies that produce differing results; accordingly, such simulations, projections, valuations and statistical analyses are not to be viewed as facts and should not be relied upon as an accurate representation of future events. No representation or warranty is given as to any of the simulations or analyses, or as to the achievement or reasonableness of any future projections or estimates, contained in this document.
Jefferies and its affiliates, officers, directors, employees and agents may from time to time hold long or short positions in, buy or sell (on a principal basis or otherwise), or act as market maker in any securities, futures or other financial instruments or products related to matters discussed herein and may make trading decisions that are different from or contrary to any of those which may be discussed. Jefferies is not an adviser as to legal, taxation, accounting or regulatory matters in any jurisdiction, and is not providing any advice as to any such matter to the recipient. Recipients of this document should take their own independent advice with respect to such matters.
In the UK, this document is intended for use only by persons who have professional experience in matters relating to investments falling within Articles 19(5) and 49(2)(a) to (d) of the Financial Services and Markets Act 2000 (Financial Promotion) Order 2005 (as amended), or by persons to whom it can be otherwise lawfully distributed. Recipients of this document in jurisdictions outside the United Kingdom should inform themselves about and observe any applicable legal requirements in relation to the receipt of this document.
Jefferies International Limited is authorised and regulated in the United Kingdom by the Financial Conduct Authority. Its registered office is at Vintners Place, 68 Upper Thames Street, London EC4V 3BJ; telephone +44 20 7029 8000; facsimile +44 20 7029 8010.