business statistics: a decision-making approach, 7th edition · inferential statistics: consists of...
TRANSCRIPT
QMIS 120, by Dr. M. Zainal
Business Statistics:
Chapter 1
The Where, Why, and How of
Data Collection
Chap 1-2
Chapter Goals
After completing this chapter, you should be
able to:
Describe key data collection methods
Know key definitions:
Population vs. Sample Primary vs. Secondary data types
Qualitative vs. Qualitative data Time Series vs. Cross-Sectional data
Explain the difference between descriptive and
inferential statistics
Describe different sampling methods
QMIS 120, by Dr. M. Zainal
Chap 1-3
What is statistics ? Numerical facts:-
Average income of Kuwaiti families.
Your monthly expenses.
Wedding cost.
Group of methods used to collect, organize,
present, analyze, and interpret data to make
more effective decisions (educated guess vs.
pure guess).
Tools of Business Statistics
QMIS 120, by Dr. M. Zainal

Chap 1-4
Opening a business without assessing the need
for it may affect its success.
Two fields of study:-
Mathematical statistics.
Applied statistics.
Types of statistics Applied statistics can be divided into two areas: descriptive
statistics and inferential statistics.
Tools of Business Statistics
QMIS 120, by Dr. M. Zainal
Chap 1-5
Descriptive statistics
Collecting, presenting, and describing data
Inferential statistics
Drawing conclusions and/or making decisions
concerning a population based only on
sample data
Tools of Business Statistics
QMIS 120, by Dr. M. Zainal

Chap 1-6
Descriptive statistics:
Consists of methods for organizing, displaying, and
describing data in an informative way by using
tables, graphs, and summary measures.
According to bank reports, 20% of the investors in
the KSE declared bankruptcy during 2007. The
statistic 20 describes the number of bankruptcies out
of every 100 KSE investors.
Tools of Business Statistics
QMIS 120, by Dr. M. Zainal
Chap 1-7
Inferential statistics:
Consists of methods that use sample results to help
make decisions or predictions about a population.
One can make some decisions about the political
view of all KU students (around 15000) based on a
sample of 500 students.
Tools of Business Statistics
QMIS 120, by Dr. M. Zainal

Chap 1-8
Descriptive Statistics
Collect data
e.g., Survey, Observation,
Experiments
Present data
e.g., Charts and graphs
Characterize data
e.g., Sample mean = n
x i
QMIS 120, by Dr. M. Zainal
Chap 1-9
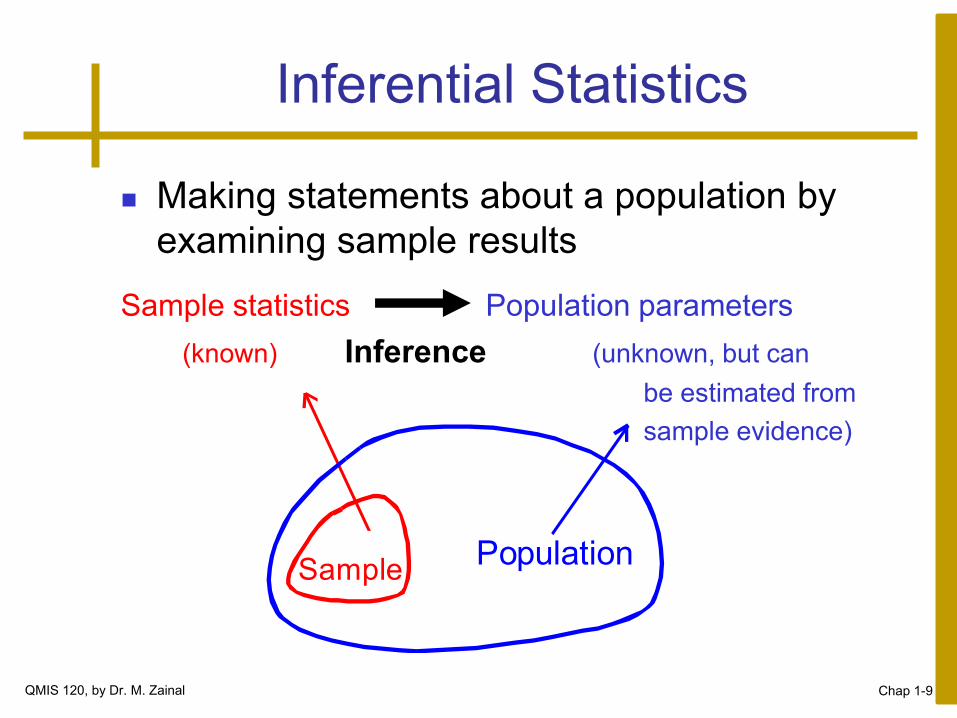
Making statements about a population by
examining sample results
Sample statistics Population parameters
(known) Inference (unknown, but can
be estimated from
sample evidence)
SamplePopulation
Inferential Statistics
QMIS 120, by Dr. M. Zainal
Chap 1-10
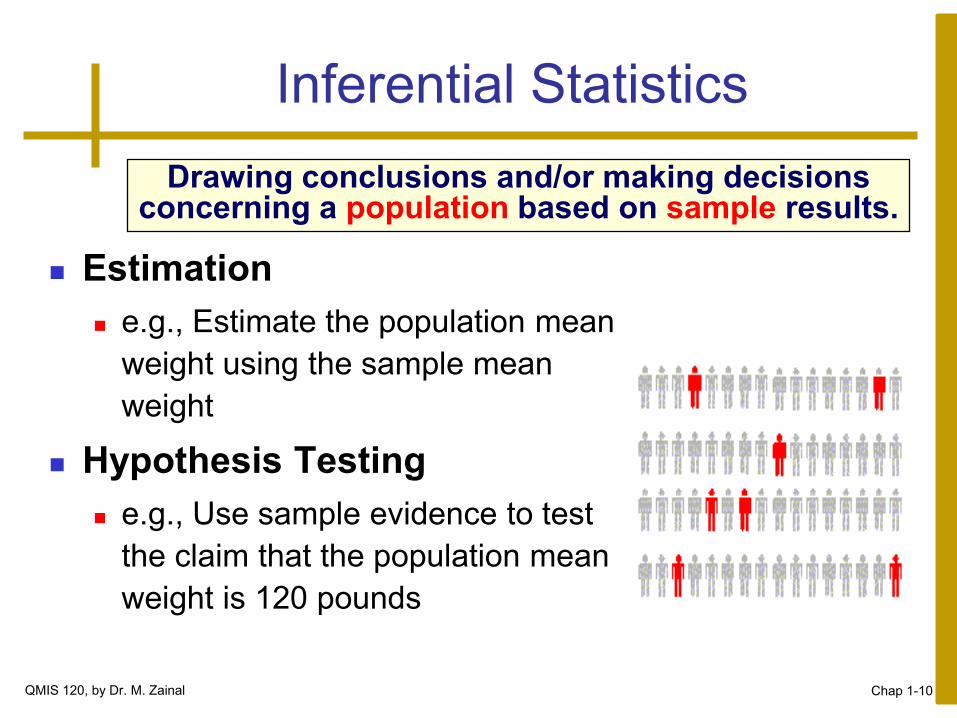
Inferential Statistics
Estimation
e.g., Estimate the population mean
weight using the sample mean
weight
Hypothesis Testing
e.g., Use sample evidence to test
the claim that the population mean
weight is 120 pounds
Drawing conclusions and/or making decisions concerning a population based on sample results.
QMIS 120, by Dr. M. Zainal

Chap 1-11
Tools for Collecting Data
Data Collection Methods
Written
questionnaires
Experiments
Telephone
surveys
Direct observation and
personal interview
QMIS 120, by Dr. M. Zainal

Chap 1-12
Survey Design Steps
Define the issue
what are the purpose and objectives of the survey?
Define the population of interest
Develop survey questions
make questions clear and unambiguous
use universally-accepted definitions
limit the number of questions
QMIS 120, by Dr. M. Zainal

Chap 1-13
Survey Design Steps
Pre-test the survey
pilot test with a small group of participants
assess clarity and length
Determine the sample size and sampling
method
Select sample and administer the survey
(continued)
QMIS 120, by Dr. M. Zainal

Chap 1-14
Types of Questions
Closed-end Questions Select from a short list of defined choices
Example: Major: __business __liberal arts
__science __other
Open-end Questions Respondents are free to respond with any value, words, or
statement
Example: What did you like best about this course?
Demographic Questions Questions about the respondents’ personal characteristics
Example: Gender: __Female __ Male
QMIS 120, by Dr. M. Zainal

Chap 1-15
A Population is the set of all items or individuals of interest
Examples: All likely voters in the next election
All parts produced today
All sales receipts for November
A Sample is a subset of the population
Examples: 1000 voters selected at random for interview
A few parts selected for destructive testing
Every 100th receipt selected for audit
Populations and Samples
QMIS 120, by Dr. M. Zainal
Chap 1-16
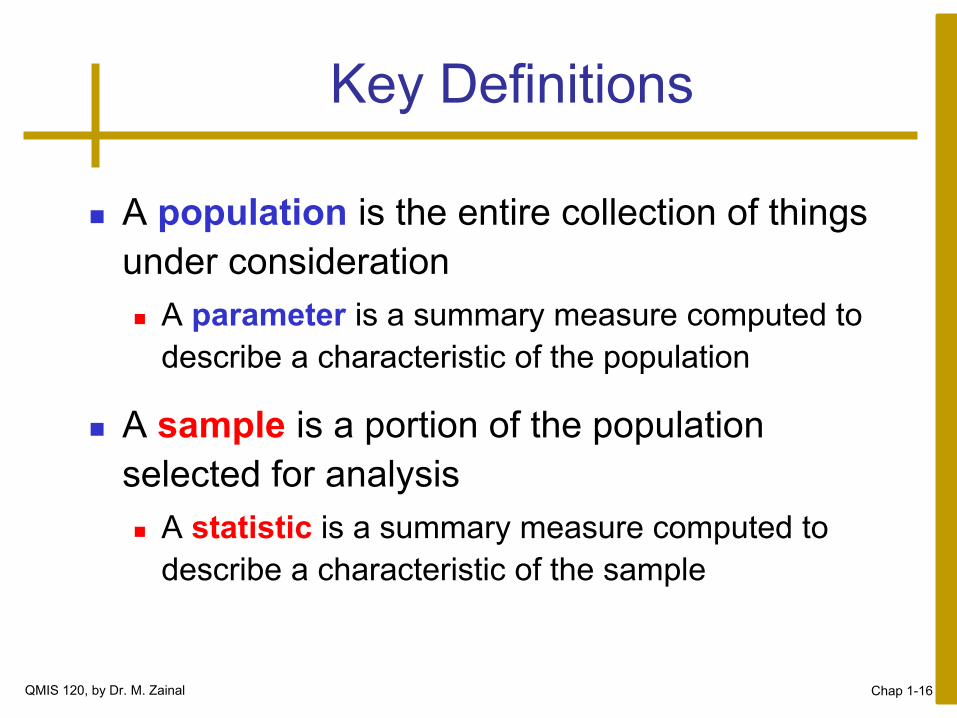
Key Definitions
A population is the entire collection of things
under consideration
A parameter is a summary measure computed to
describe a characteristic of the population
A sample is a portion of the population
selected for analysis
A statistic is a summary measure computed to
describe a characteristic of the sample
QMIS 120, by Dr. M. Zainal
Chap 1-17
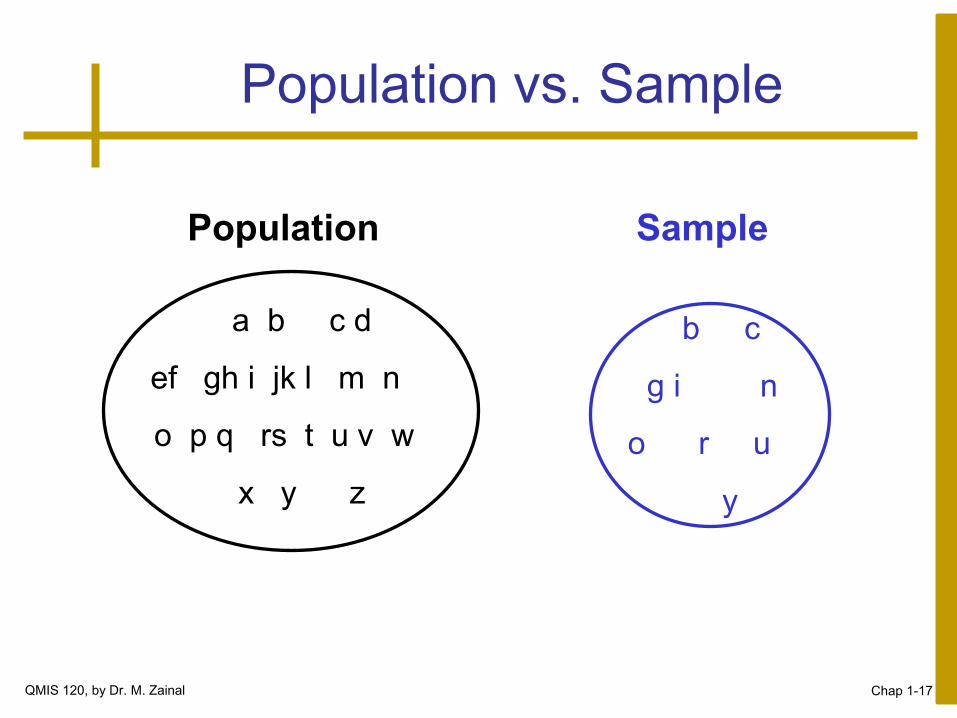
Population vs. Sample
a b c d
ef gh i jk l m n
o p q rs t u v w
x y z
Population Sample
b c
g i n
o r u
y
QMIS 120, by Dr. M. Zainal

Chap 1-18
Why Sample?
Less time consuming than a census
Less costly to administer than a census
It is possible to obtain statistical results of a
sufficiently high precision based on samples.
QMIS 120, by Dr. M. Zainal
Chap 1-19
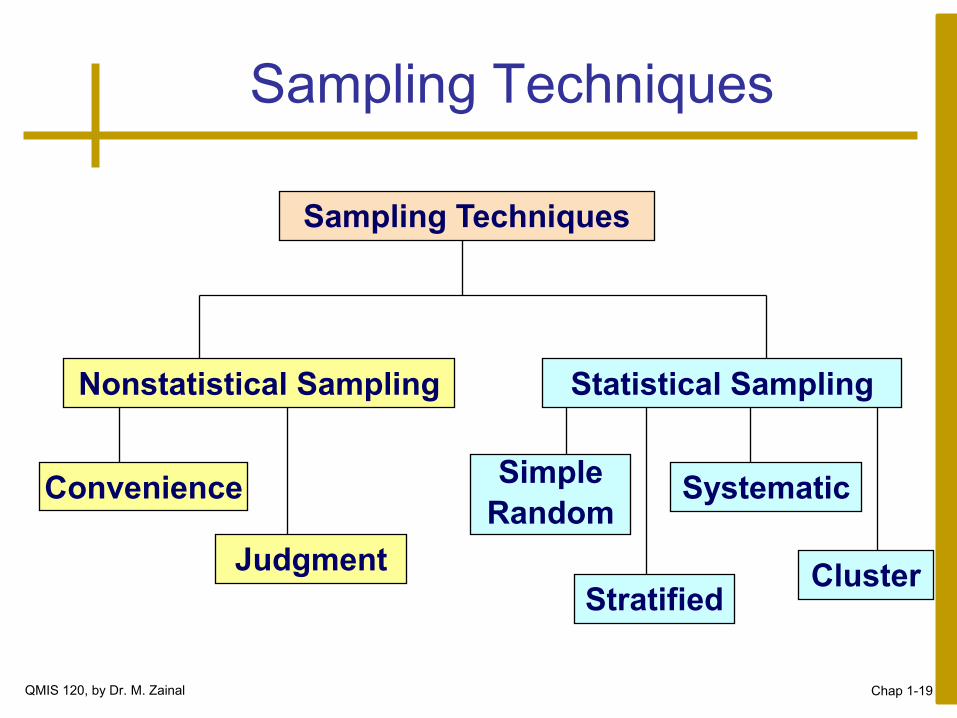
Sampling Techniques
Convenience
Sampling Techniques
Nonstatistical Sampling
Judgment
Statistical Sampling
Simple
Random Systematic
Stratified Cluster
QMIS 120, by Dr. M. Zainal
Chap 1-20
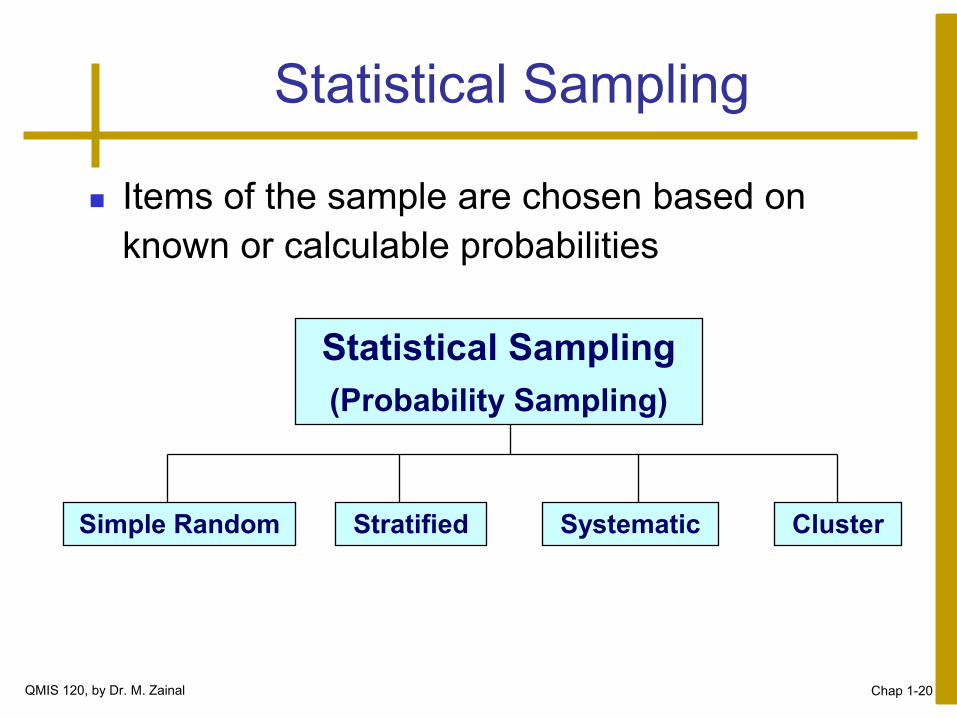
Statistical Sampling
Items of the sample are chosen based on
known or calculable probabilities
Statistical Sampling
(Probability Sampling)
Systematic Stratified Cluster Simple Random
QMIS 120, by Dr. M. Zainal
Chap 1-21
Simple Random Sampling
Every possible sample of a given size has an
equal chance of being selected
Selection may be with replacement or without
replacement
The sample can be obtained using a table of
random numbers or computer random number
generator
QMIS 120, by Dr. M. Zainal

Chap 1-22
Stratified Random Sampling
Divide population into subgroups (called strata)
according to some common characteristic
Select a simple random sample from each
subgroup
Combine samples from subgroups into one
Population
Divided
into 4
strata
Sample QMIS 120, by Dr. M. Zainal
Chap 1-23
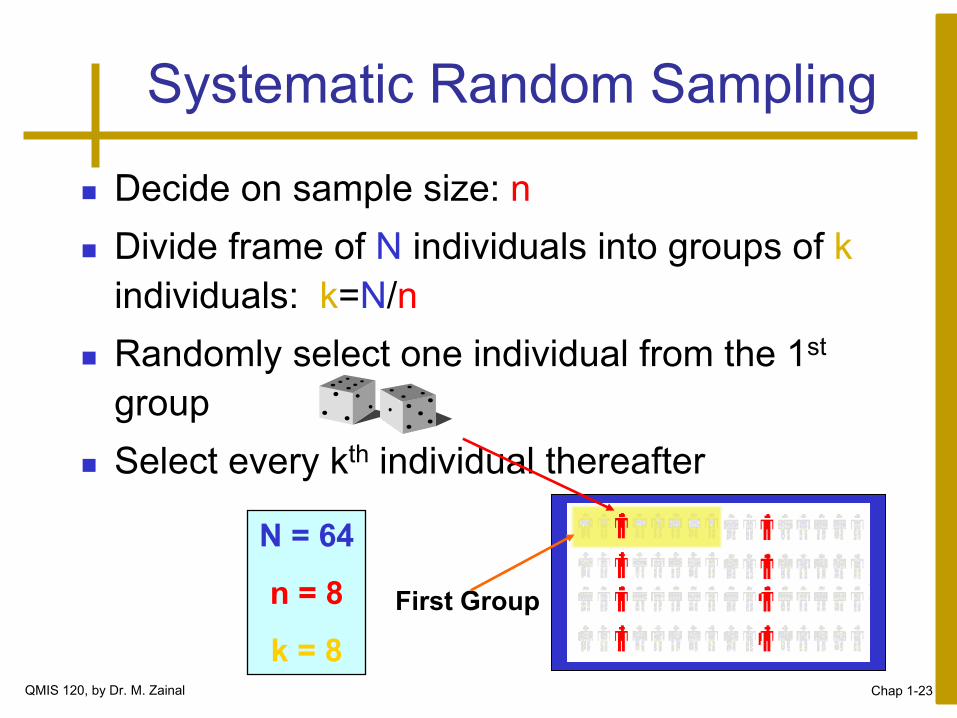
Decide on sample size: n
Divide frame of N individuals into groups of k
individuals: k=N/n
Randomly select one individual from the 1st
group
Select every kth individual thereafter
Systematic Random Sampling
N = 64
n = 8
k = 8
First Group
QMIS 120, by Dr. M. Zainal
Chap 1-24
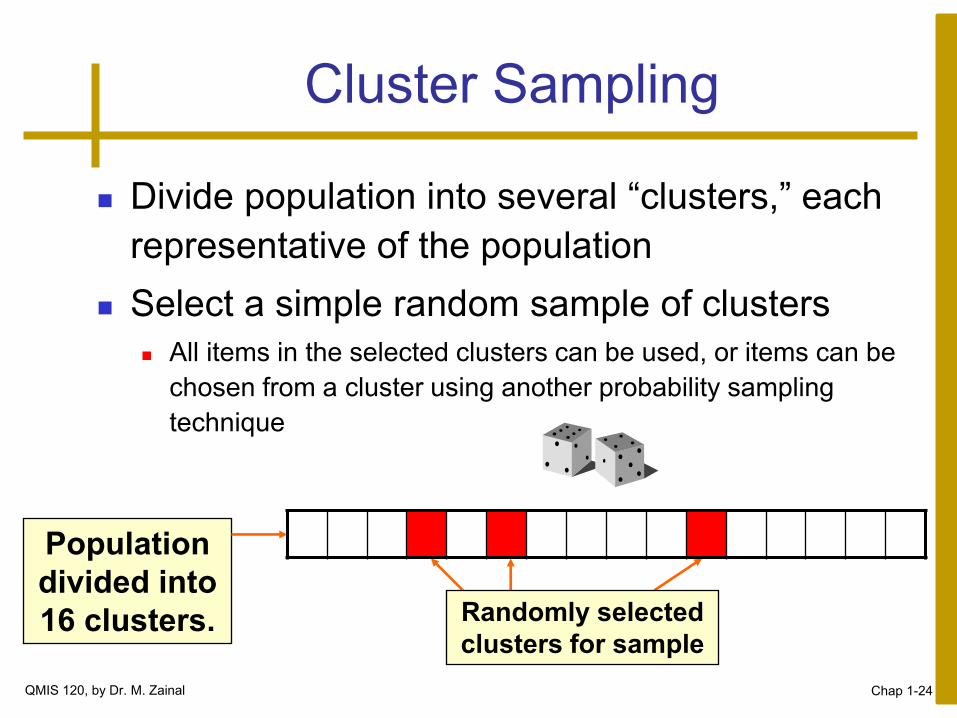
Cluster Sampling
Divide population into several “clusters,” each
representative of the population
Select a simple random sample of clusters
All items in the selected clusters can be used, or items can be
chosen from a cluster using another probability sampling
technique
Population
divided into
16 clusters. Randomly selected
clusters for sample
QMIS 120, by Dr. M. Zainal
Chap 1-25
Basic Terms
Element, Variable, observation, and data
set
An element or member of a sample or population
is a specific subject or object (person, firm, item,
country…etc.).
A variable is a characteristic under study that
assumes different values for different element.
The value of a variable for an element is called
observation or measurement.
QMIS 120, by Dr. M. Zainal
Chap 1-26
Basic Terms
QMIS 120, by Dr. M. Zainal
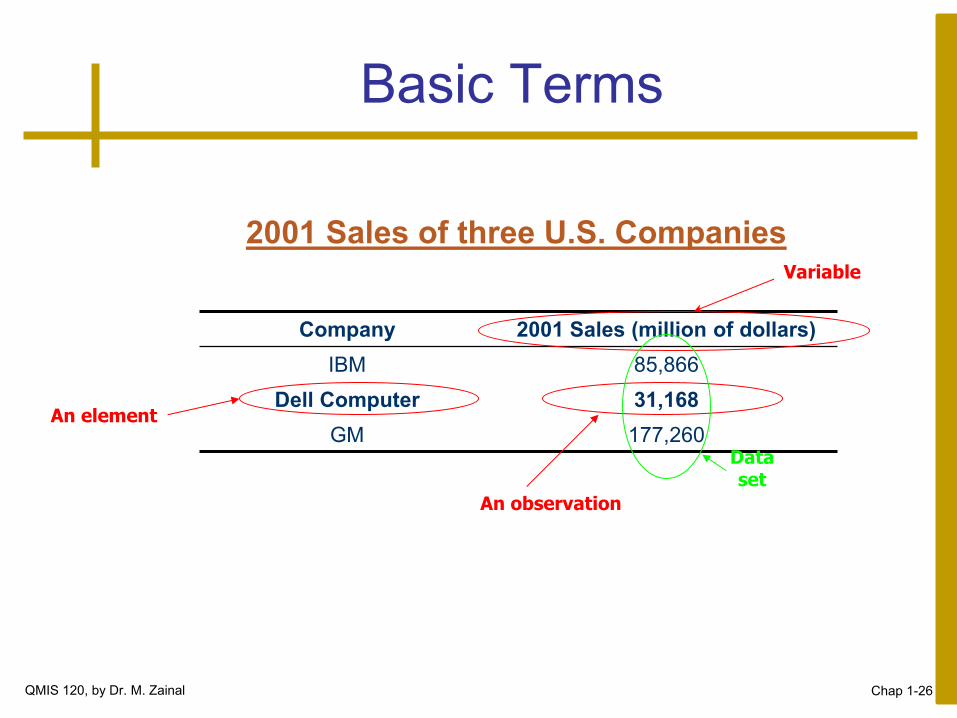
2001 Sales (million of dollars) Company
85,866 IBM
31,168 Dell Computer
177,260 GM An element
An observation
Variable
Data set
2001 Sales of three U.S. Companies
Chap 1-27
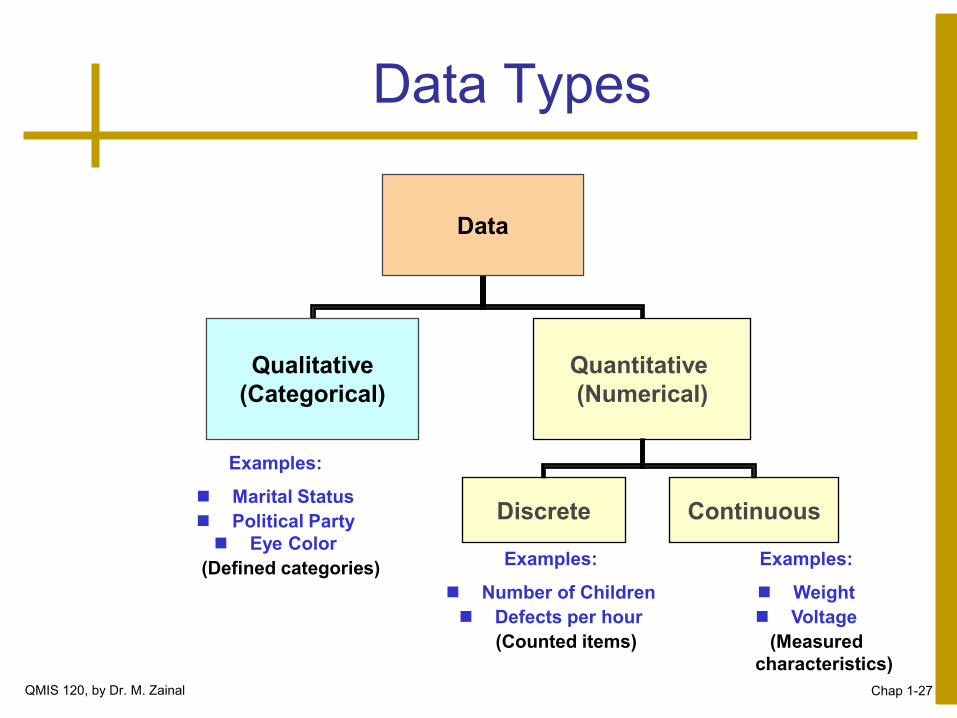
Data Types
Data
Qualitative
(Categorical)
Quantitative
(Numerical)
Discrete Continuous
Examples:
Marital Status
Political Party
Eye Color
(Defined categories) Examples:
Number of Children
Defects per hour
(Counted items)
Examples:
Weight
Voltage
(Measured
characteristics)
QMIS 120, by Dr. M. Zainal
Chap 1-28
Data Types
Time Series Data
Ordered data values observed over time
Cross Section Data
Data values observed at a fixed point in time
QMIS 120, by Dr. M. Zainal
Chap 1-29
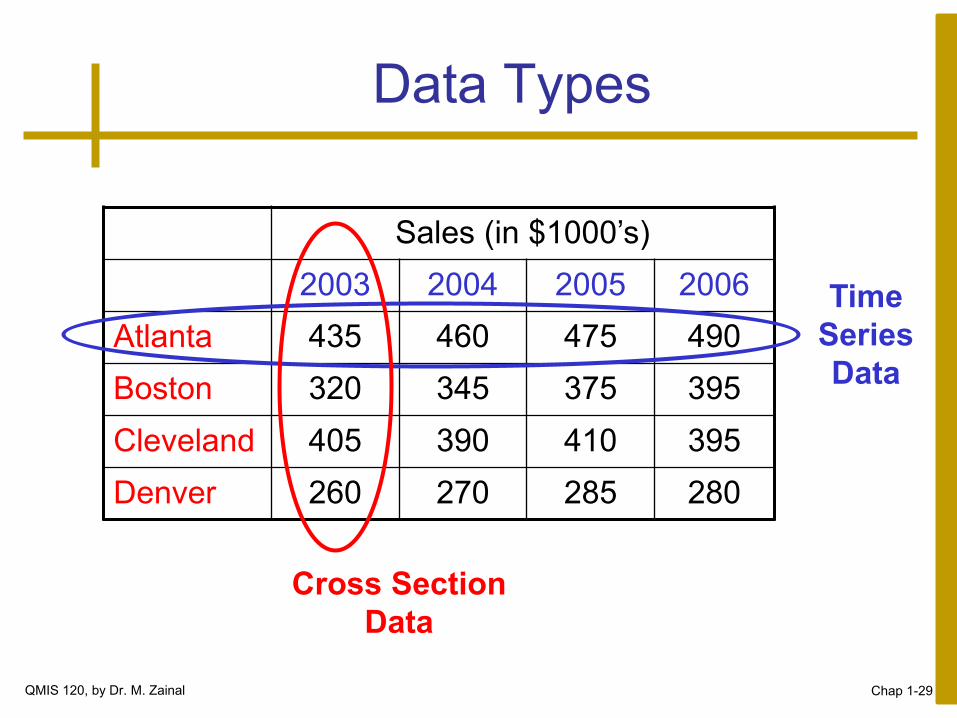
Data Types
Sales (in $1000’s)
2003 2004 2005 2006
Atlanta 435 460 475 490
Boston 320 345 375 395
Cleveland 405 390 410 395
Denver 260 270 285 280
Time
Series
Data
Cross Section
Data
QMIS 120, by Dr. M. Zainal

Data Measurement Levels
Ratio/Interval Data
Ordinal Data
Nominal Data
Highest Level
Complete Analysis
Higher Level
Mid-level Analysis
Lowest Level
Basic Analysis
Categorical Codes
ID Numbers
Category Names
Rankings
Ordered Categories
Measurements
Chap 6-30
Chap 1-31
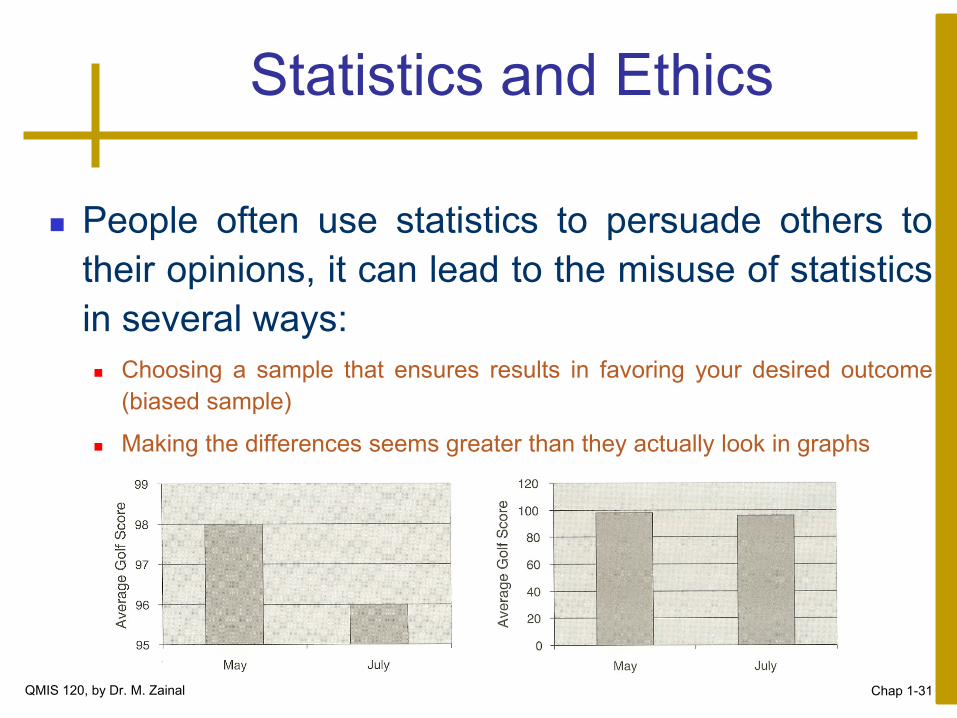
Statistics and Ethics
People often use statistics to persuade others to
their opinions, it can lead to the misuse of statistics
in several ways:
Choosing a sample that ensures results in favoring your desired outcome
(biased sample)
Making the differences seems greater than they actually look in graphs
QMIS 120, by Dr. M. Zainal

Chap 1-32
Chapter Summary
Reviewed key data collection methods
Introduced key definitions:
Population vs. Sample Primary vs. Secondary data types
Qualitative vs. Quanitative data Time Series vs. Cross-Sectional data
Examined descriptive vs. inferential statistics
Described different sampling techniques
Reviewed data types and measurement levels
QMIS 120, by Dr. M. Zainal
Copyright
The materials of this presentation were mostly
taken from the PowerPoint files accompanied
Business Statistics: A Decision-Making Approach,
7e © 2008 Prentice-Hall, Inc.
Chap 6-33 QMIS 120, by Dr. M. Zainal