business valuation for closely-held and family businesses · business valuation for closely-held...
TRANSCRIPT
Business Valuation for Closely-Held and Family Businesses
Integra International Webinar SeriesJune 8, 2017
Donald J. DeGrazia, CPA/ABV /CFF +1.1.856.727.0100Kristen Matkowsky, CPAGold Gerstein Group LLC www.g3cpa.com

Donald J. DeGrazia, CPA/ABV/CFFGold Gerstein Group LLC [email protected]
Education• Graduate of LaSalle University, Philadelphia, PA, Bachelor of Science Degree in Business Administration
Experience• Partner in the accounting and business valuation firm of Gold Gerstein Group LLC with two offices in NJ;
Expert testimony in court and arbitration proceedings relating to matrimonial and minority stockholder litigation, fraud, economic damages, and bankruptcy proceedings; Qualified as an expert witness by Federal, NJ and PA courts; Preparation of valuation reports for businesses and professional practices; Preparation of damage study reports; Accounting, tax and succession planning services for closely-held and family businesses.
Professional Affiliations and Credentials• Certified Public Accountant (CPA) in NJ and PA; Accreditation in Business Valuation (ABV) and Certified
in Financial Forensics (CFF) by the AICPA; Member of Integra International, Inc., worldwide association of independent accounting and consulting firms; Member of Expert Resource Connection, LLC (ERC), national alliance of business valuation and forensic accounting professionals.
Professional Activities• American Institute of CPAs: Past conference chairman – National Litigation Support Services
Conference; Conference Steering Committee member – National Business Valuation Conference and Family Law Conference; Accredited in Business Valuation Examination Committee Virtual Subcommittee to formulate exam questions; Family Law Task Force; “Ask the Experts” panel member of the ABV E-Valuation Alert electronic newsletter.
• New Jersey Society of CPAs: Chairman – Valuation & Litigation Services Resource Group; Past Chairman – Business Valuation Interest Group and Matrimonial Accounting Interest Group; Conference Chair – Valuation and Litigation Services Conf.
• Integra International, Inc: Executive Board member and Past Chairman – Global Board; Past President – Americas, Asia & Australia Division.
• Liberty USO of Philadelphia & Southern New Jersey: Vice-chairman & Treasurer.• Family Law Services Handbook: John Wiley & Sons, Inc. Co-author/Editor.• PPL Guide to Divorce Engagements: Editor

Kristen Matkowsky, CPAGold Gerstein Group LLC [email protected]• Graduate of Stockton University, Galloway Township, NJ, Bachelor of Science Degree in
Business Administration with a concentration in Accounting
Experience• Senior Accountant in the accounting and business valuation firm of Gold Gerstein Group LLC
with two offices in NJ.• Preparation of valuation reports for businesses and professional practices. Business valuation
services also includes forensic accounting, economic damages, and litigation support for a wide range of businesses and professional practices for purposes such as estate and gift tax planning and compliance, divorce, business succession planning, and shareholder litigation
• Accounting and tax services for closely-held and family businesses including financial statement preparation, business and personal income tax planning and compliance, estate and business succession planning.
Professional Affiliations and Credentials• Certified Public Accountant (CPA) in NJ • Member of Integra International, Inc., worldwide association of independent accounting and
consulting firms• Member of the New Jersey Society of Certified Public Accountants• Member of the American Institute of Certified Public Accountants
Professional Activities• New Jersey Society of CPAs – Pay It Forward program presenter

DisclaimerViews expressed in these written materials and in the related live presentation do not necessarily reflect the professional opinions or positions that the presenter would take in an actual business appraisal assignment, or in providing services in connection with an actual litigation matter.
Nothing contained in these written materials, or as orally expressed in the related presentation, shall be construed to constitute the rendering of appraisal advice; the rendering of an opinion as to the propriety of taking a particular position; or the rendering of any other professional opinion or service.
Business appraisal and related litigation services are necessarily fact sensitive. Therefore, participants are urged to apply their expertise to particular fact patterns that they encounter, and to seek competent professional assistance as warranted in the circumstances.

Business Valuation is about one thing …
• How we identify risk.
• How we measure risk.
• How we compensate for risk.
RISK

What is Risk?
• The likelihood that an investor receives the cash flow they expect to receive from the investment.
• In the time period they expect to receive it.

Risk and value are inversely related.
Higher risk companies generally sell at lower multiples of earnings.
Exceptions???
Risk Analysis

Steps in the Valuation Process
Determine premise of
valueSelect the
standard of value
Determine the purpose
of engagement
Select the appropriate
method of valuation
Value the business
entity
Value the ownership
interest

• Stockholder Agreements• Merger & Acquisition• Estate & Gift Tax planning & compliance• Stockholder Litigation• Damage Study• Divorce
Many Reasons for Valuing a Business


Valuation Date Issues
• What are the right dates?
SEPTEMBER
• Subsequent events??

Standards of Value
• Fair Market Value
• Fair Value
• Investment Value
• Intrinsic Value

Fair Market Value IRS Revenue Ruling 59-60
• Price at which property would change hands
• Between a hypothetical willing buyer and a hypothetical willing seller
• Not under compulsion to buy or sell
• Both having reasonable knowledge of all relevant facts

Value of an asset or business to a specificowner or prospective owner. Accordingly, this type of value considers the owner’s or prospective owner’s knowledge, abilities, expectations of risks and earning potential, and other factors.
Investment Value

Buyer Motivations Indicating“Investment Value”
• Differences in estimates of future earning power
• Differences in perception of the degree of risk
• Differences in tax status• Synergies with other operations owned
or controlled

Intrinsic Value
Valuation based on “fundamental analysis”
of the company by a securities analyst

Premise of Value
• Going Concern– Operating business– Trained & experienced
work force– Capital equipment in
place
• Liquidation– Orderly closing & liquidation– Fire sale

$ Cost Approach
$ Income Approach
Primary Approaches to Value
$ Market Approach

Capitalizing a single period economic benefits stream (net income, pretax income, cash flows, etc.)
Discounting discrete future years expected earnings stream
Income Approaches to Valuation
Methods of Valuation

• Net income
• Earnings before tax (EBT)
• Earnings before interest taxesdepreciation & amortization (EBITDA)
• Gross cash flow
• Net cash flow
Defining the Earnings Stream

Discount Rate = risk adjusted rate of return required by an investor to make the investment
Capitalization Rate = discount rate reduced by a long-term sustainable growth rate
Discount Rates and Capitalization Rates

Converting an Earnings Stream into a Value
• Determine discount rate (Investors desired rate of return)
• Determine a long-term sustainable growth rate
• Determine normalized earnings– Economic earnings for valuation
• Capitalization Rate is a divisor, applied to an earnings stream, to compute a value
Shannon Pratt, Valuing a Business, 1st edition

Size vs Risk
• Empirical evidence shows that small companies tend to get higher rates of return than large companies
• Academic research• Duff & Phelps’ Risk Premium Report
(Annual Valuation Handbook – U.S. Guide to Cost of Capital)
• Smaller “size” indicates a higher discount rate

Size & Return from Risk Premium Report: Smaller Size=Higher Rate of Return

Size & Private Firm Acquisition Multiples• If there is validity to the claim that smaller
companies have higher discount rates, then we should expect to see this reflected in market prices of companies. In fact, we do…
Multiples of EBIT for Manufacturing Companies.
Revenue 1997 1998 1999 2000$50 Million + 6.5 6.1 6.5 7.5$20-50 Million 6.0 5.3 5.5 7.4$10-20 Million 5.5 5.3 5.5 6.6Under $10 Million 5.1 4.8 4.5 5.4Source: IMAP surveys, various years

Discount Rate – Build Up Method
k = Rf + RPm +Si + SPi
• Rf = risk-free rate of return• ERPm = Equity Risk Premium:
expected premium on the market index- Expected return on market minus risk free rate
• Si = Company size premium• SPi = Company specific risk premium

Duff & Phelps Risk Premium ReportEquity Risk Premium over Risk-Free Rate Using Guideline Portfolios
Data through December 31, 2015
Subject Co.
Relevant Exhibit in Risk Premium Report
Portfolio Ranking
Smoothed Average
Equity Risk Premium
Used (1=Yes, 0=No)
Selected Relevant
Smoothed Average
Equity Risk Premium1
Market value of equity N/A A-1 25 13.07% 0
Book value of equity A-2 25 11.36% 1 11.36%
5 year average net income A-3 25 12.26% 1 12.26%
Market value of invested capital N/A A-4 25 12.64% 0
Total assets A-5 25 12.21% 1 12.21%
5 year average EBITDA A-6 25 12.01% 1 12.01%
Sales A-7 25 11.95% 1 11.95%
Number of Employees A-8 25 11.93% 1 11.93%
Median equity risk premium 12.11% 11.98%
Average equity risk premium 12.18% 11.95%
1Smoothed average equity risk premium times Used (if "1")
* Risk Premium Report Includes Size Premium

Discount Rate – Build Up MethodCost of equity (Ke) = Rf + Rm + Rsc
Assumptions:
Risk-free investment rate (Rf) 1 2.95%Equity risk premium (Rm) 2 11.95%Specific company risk (Rsc) 3 8.10%
Discount rate for equity (Ke) 23.0%
Growth rate -3.0%
Capitalization rate 20.0%
1 Long-term (20-year) U.S. Treasury Coupon Bond Rate(Source: H.15 Statistical Release of the Federal Reserve, Monthly Averageof Constant Maturity Rates, September 29, 2015)
2 Duff and Phelps Risk Premium Report 2016 based on 2015 data3 Valuator's judgment
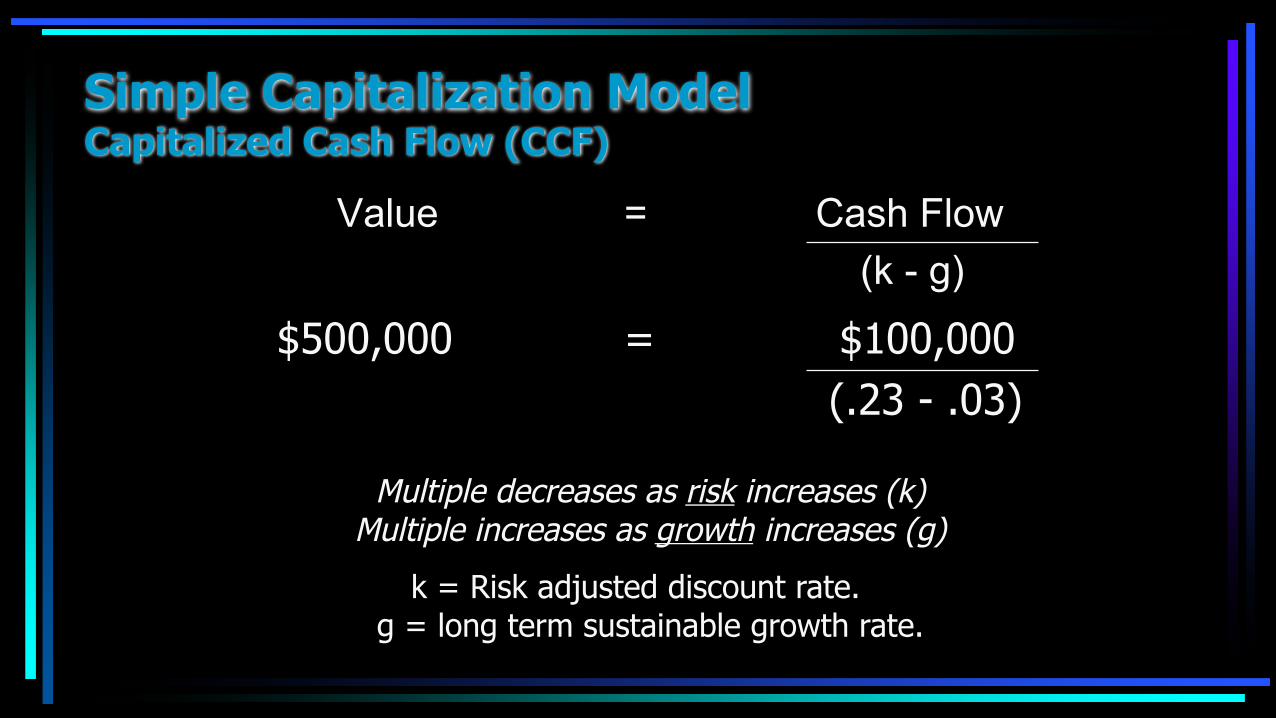
Simple Capitalization ModelCapitalized Cash Flow (CCF)
Value = Cash Flow(k - g)
$500,000 = $100,000(.23 - .03)
Multiple decreases as risk increases (k)Multiple increases as growth increases (g)
k = Risk adjusted discount rate.g = long term sustainable growth rate.

Discounted Cash Flow Method (DCF)
DCF Formula:Present Value of
Present Value of Cash Flows Terminal Period
NCF1 NCF2 NCFn NCFn
(1+k)1 (1+k)2 (1+k)n (k-g)
(1+k)n
where,NCF : Normalized Pretax Debt Free Cash Flowk : Discount Rateg : Growth Raten : Number of periods
+ + + … +

Discounted Cash Flow Method (DCF)Example
Discrete Projection Period Calculation
Year
Normalized Pre-Tax Debt-
Free Cash Flow
Normalized Income Taxes Cash flow
Present Value Factor
Present Value of
Cash Flows
2010 1,245,000$ (249,000)$ 996,000$ 0.93741 933,659$ 2011 1,024,000 (204,800) 819,200 0.82373 674,802 2012 1,336,000 (267,200) 1,068,800 0.72384 773,643 2013 1,398,500 (279,700) 1,118,800 0.63607 711,630 2014 1,454,500 (290,900) 1,163,600 0.55893 650,375 2015 1,511,500 (302,300) 1,209,200 0.49115 593,903
4,338,013
Terminal Value CalculationCash flow per period into perpetuity 1,209,200 Capitalization rate 10.30%Terminal value 11,739,806 0.49115 5,766,051
Market value of invested capital 10,104,064

Next Time: More on the Income Method
• CAPM - Capital Asset Pricing Model• Conditional & unconditional equity risk
premiums (ERP)• More on the DCF Method• Does capital structure matter?
– Unlevering beta– WACC - Weighted Average Cost of Capital– Complex capital structures

The Market Approach
If the same house in the neighborhood sells for $500,000, about how much is yours worth?

Market Approach Methods
• Guideline Company Method
• Transaction Method
• Industry Method (Rules of Thumb)
• Prior Transaction of Subject Company Stock

Support for guideline method comes from IRS (Revenue Ruling 59-60)
Guideline Company Method
“...market price of stocks of corporations engaged in the same or similar line of business having their stocks actively traded in a free and open market either on an exchange or over the counter.”

• Price to revenue
• Price to earnings
• Price to cash flow
• Price to book value
Possible Valuation Multiples

• Size
• Growth rates
• Products & Services
• Capital structure
• Geographic territory
• Depth of management• Profitability ratios
Analyze the qualitative and quantitative differences:
Selection of Guideline Companies and Comparison to Subject Company

Pitchbook/BVR Guideline Public Company Tools
• All inclusive tool that allows you to build a list of similar public companies comparable to your subject company.
• Criteria can be based on SIC codes, industry, location, financial data, multiples, ratios, and more.
• Allows you to export to excel to create schedules to be used with valuation reports.
Search criteria: Location: United States; Revenue: Max: 1,000B; SIC Code: Manufacturing > Chemicals & Associated Products > Pharmaceutical preparations;
Financial amounts in thousands, USD. Stock price in USD
Data as of: 31-Dec-2016
Company Name Country Market Cap Stock Price Date - Price Close
Enterprise Value (FQ)
Revenue (TTM)
Net Income (TTM)
EBITDA (TTM)
Earnings per Share, Basic
(TTM)
EV/Revenue (TTM)
EV/EBITDA (TTM)
Total Assets (FYE)
Total Debt (FYE)
Elite PharmaceuticalsUnited States 110,690 0.15 30-Dec-16 133,433 13,346 1,598 1,756 0.02 9.4x 71.5x 31,879 3,126
Reliv InternationalUnited States 8,566 4.64 30-Dec-16 8,769 47,170 (1,103) 54 (0.66) 0.2x 161.3x 24,261 3,941
Sucampo PharmaceuticalsUnited States 579,205 13.55 30-Dec-16 624,638 212,400 13,354 89,221 0.31 2.9x 7.0x 457,181 252,360
TeligentUnited States 350,500 6.61 30-Dec-16 467,579 62,017 (12,929) 2,901 (0.24) 7.5x 161.2x 184,762 107,061
CambrexUnited States 1,723,176 53.95 30-Dec-16 1,372,354 468,965 62,108 126,318 1.95 2.9x 10.9x 505,539 30,000
© PitchBook Data, Inc. 2017
Public Fundamental Data provided by Morningstar, Inc.

Transaction Method
• Valuation based on sales, mergers, acquisitions of similar companies
• Private or public company transactions can be considered
• Apply multiples developed from transactions to the subject company

Valuation Multiples for the Transaction Method
$ Price to gross sales
$ Price to earnings
$ Price to gross profit

“Rules of Thumb”
Industry Methods

Be wary of taking a whack at valuation using a “rule of thumb” method.

Sales price 600,000Inventory 100,000Business asset value $700,000
Sales-last 12 months $2,000,000Multiple of sales 30%
Rules of Thumb Valuation Based on Sales $ ~ Liquor Store

Net Income Matters
Lost $100,000 this year
Are two businesses in the same industry with the same sales worth the same amount?
Would you pay the same for each?
Earned $100,000 this year
Liquor Store
Liquor Store

2+2
5 ???
but, not as the only methods of computing value.
Often Rules of Thumb are Good Sanity Checks of Other Valuation Methods...

• The best proof of value is usually a recent sale
• Analyze foundation for price at which prior transaction occurred
Prior Transactions of the Subject Company Stock

Normalized Income
• Normalized income:The Holy Grail of Business Appraisers
• Normalized income is economic income• Discovery and analysis allows us to make
the adjustments
In Search of...
2002 2003 2004 2002 2003 2004

Appraisers Convert Various Measures of Income into Economic or Normalized Income
• GAAP - Generally accepted accounting principals
• IFRS – International Financial ReportingStandards
• National Income Tax Regulations

Possible Adjustments
• Unreported Income• Accelerated Depreciation• Inventory• Rent• Nonrecurring or personal expenses

• Officers’ Compensation– Impacts valuation of the enterprise under
examination– Impacts level of available spousal and child
support• Factors accountants use when
assessing level of reasonablecompensation for the officers of a closely-held business
Determining a ReasonableLevel of Compensation

• No set criteria for reasonable compensation
• Factors that impact level of compensation include industry, revenue base, product mix, profitability and geographic locale
• On the individual level, the officer’s job description, formal and on-the-job experience and entrepreneurial initiative generally impact the level of compensation
Reasonable Compensation - Criteria

The amount of available external information for certain companiesoperating in different industries can vary significantly
• Business valuation of a controlling ownership– Excess compensation adjusted out of the
expense category and into income
• Business valuation of a minority ownership– Excess compensation of the owner generally
not added back to the income statement
Reasonable CompensationBusiness Valuation

Forms of Compensation
Salary or wages
Stock optionsDividends Perquisites
(automobile, life insurance, dues and expenses, travel and entertainment, personal expenses, etc.)
Pension and/orprofit sharing plans
Compensation of management in a closely-held business

Determination of Reasonable Compensation
Number of officers Responsibility of each officer
Sales volume Level of profitability

or
The sum of the parts doesn’t always equal the whole.
Achieving Fair Market Value Through the Application of
Valuation Adjustments

Control or Minority Position
49%51%
What’s 2% worth?

Marketable or Non-Marketable
Publicly-held Closely-held

• Discount for lack of marketability
• Minority Discount
• Key Man Discount
Types of Valuation Adjustments

“The ability to convert the asset to cash very quickly, at
minimal cost, and with a high degree of certainty of realizing the
anticipated amount of proceeds.”
“Valuing a Business” 3rd edition, Pratt et al.
Marketability Defined

Publicly Traded
“How long?”
Closely-Held

• Restricted stock studies• Pre-IPO stock transactions• Volatility - Options Theory• Quantitative Marketability
Discount Method - QMDM
Empirical Studies & QA Help Quantifythe Size of the Discount

• Financial statement analysis• Company’s dividend policy
• Nature of company, its history and position in the industry, and its economic outlook
• Company’s management
Factors to Consider in Determining the Need for a Discount

• Amount of control in transferred shares
• Restrictions on transferability of stock
• Holding period of the stock
• Company’s redemption policy
• Costs associated with making a public offering

Minority - 25 to 45%Control - 5 to 15%
Control vs.
Minority Ownership Interests
Marketability Discounts

Recognizes that minority interests lack control power.
Minority Interest Discount

• Declare/pay dividends• Sell, acquire, merge, or liquidate the company• Appoint and terminate management and
establish compensation levels• Determine strategic corporate goals• Appoint corporate directors• Award and terminate business contracts
Some Control Prerogatives Minority Stockholders Lack:

Is an ownership interest without
these control rights just as valuable, proportionately as an interest
withthe control rights?
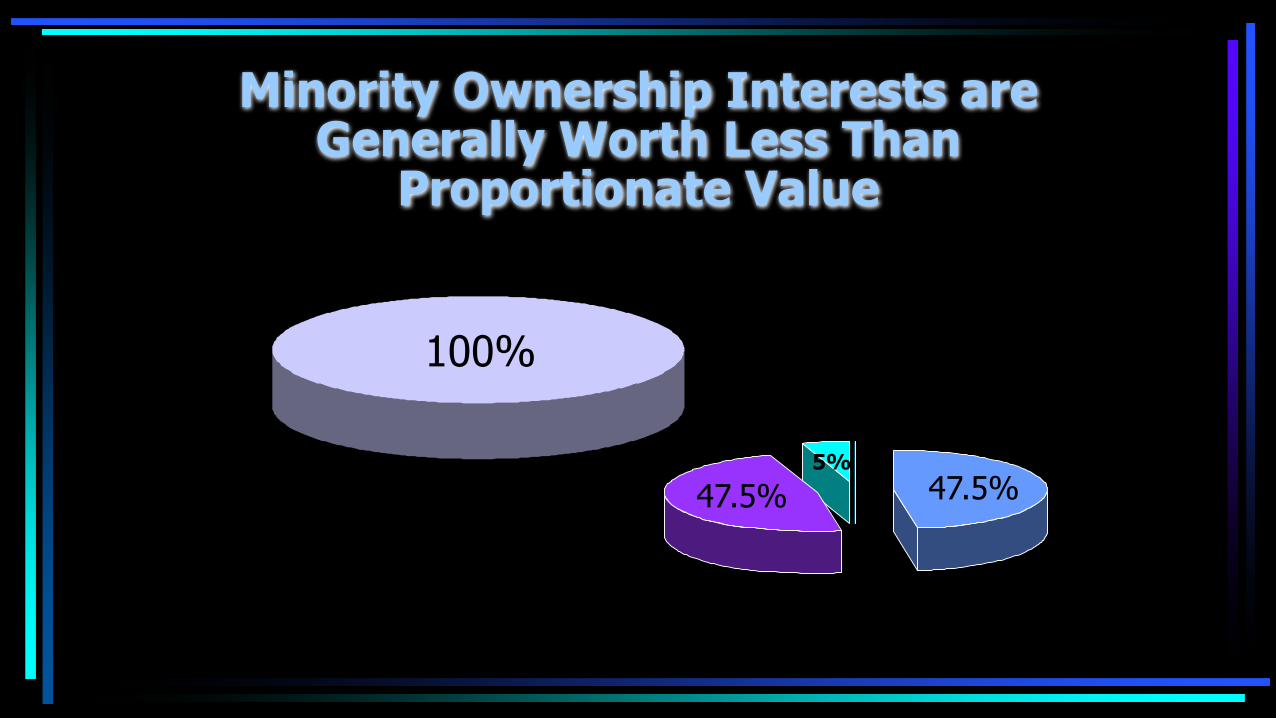
Minority Ownership Interests are Generally Worth Less Than
Proportionate Value
100%
47.5% 47.5%5%

How much control and value doesthis 5% stockholder have?
Majority Stockholder 95%Minority Stockholder 5%
100%
Size does matter!Size does matter!Size does matter!
Swing Vote Issues

Stockholder 1 47.5%Stockholder 2 47.5%Stockholder 3 5.0%
100.0%
Which 5% stockholder has more value?
Compared to this 5% stockholder?

International Valuation Issues

International Valuation Standards
• International Valuation Standards Council (IVSC)
• Current Publication: – International Valuation Standards 2017

Valuation in the USA
• The American capital markets have reliable trading information dating back to at least 1926 at the Center for Research in Security Prices (CRSP) and 1963 with Standard and Poor’s Compustat database.
• Relatively transparent market• Mature markets• Stable government• World’s reserve currency• Observable data• Single business language

Focus – International• Issues Europe, Asia and Latin America face in business
valuation – Fragmented market – causes:
• Language barriers• Different government
goals & policies• Debt burden/sovereign interest rates• Cross-border regulation
– Fragmented markets – symptoms • Little cross-border historical data• Lack of empirical data…there are no databases except in
the UK:– Pratt’s Stats– Duff & Phelps– PitchBook GPC Comps– Premium & Discount Studies
¥ £€
75
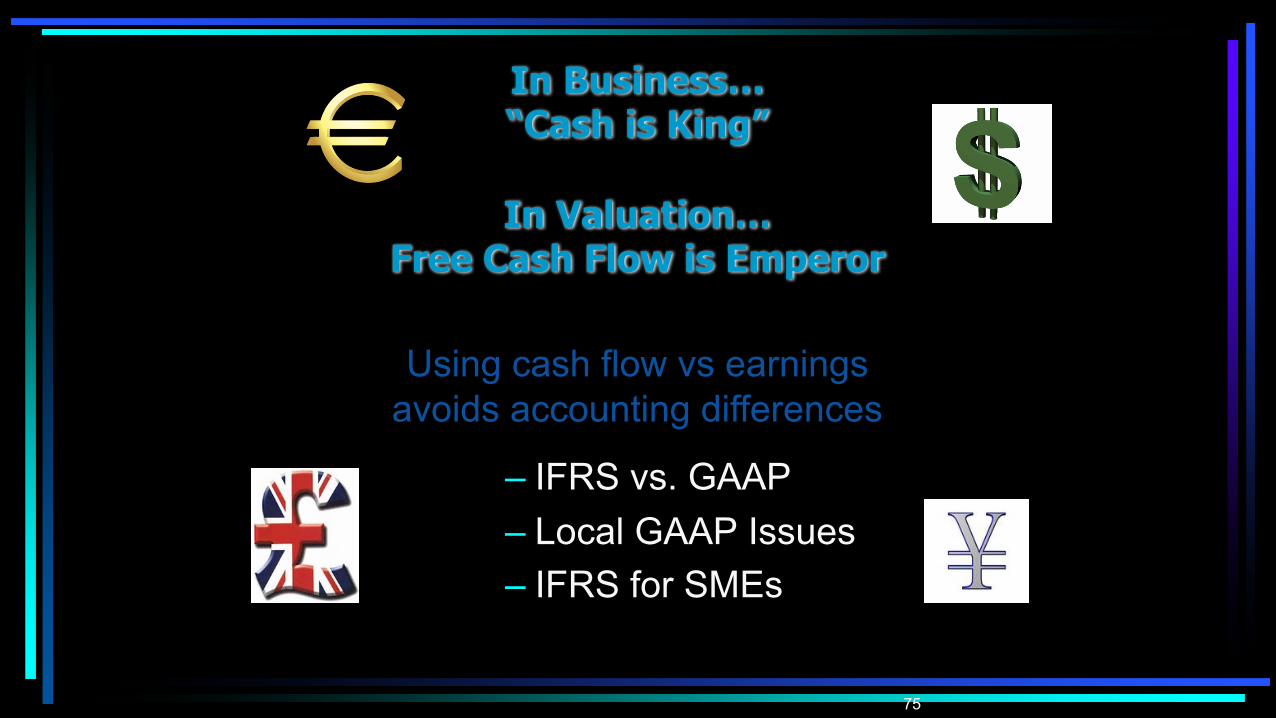
In Business…“Cash is King”
In Valuation…Free Cash Flow is Emperor
– IFRS vs. GAAP– Local GAAP Issues– IFRS for SMEs
Using cash flow vs earnings avoids accounting differences

76
Riskfree Rate
• On a risk free asset, the actual return is equal to the expected return. Therefore, there is no variance around the expected return.For an investment to be risk free, it has to have– No default risk– No reinvestment risk
• So, after 2008 maybe “Least Risk” should be considered instead of “Risk Free”??

Riskfree Rate• Time horizon matters:
– The riskfree rates in valuation will depend upon when the cash flow is expected to occur and will vary across time.
• Not all government securities are riskfree:– Some governments face default risk and the rates
on bonds issued by them will not be riskfree.
• Currency of cash flows dominates:– Best to use the risk-free rate which corresponds to
the currency in which the cash flows are denominated
Prof. Aswath Damodaran – NYU Stern School of Business

Risk Free Rate in the United States
U.S. Treasuries
20 Year Maturities
Investor’s Time Horizonfor Closely Held Businesses

International Risk Free Rate• Relevant substitute for US Treasuries???
– Sovereign credit default swaps? …not likely
– Interest rate swaps…a good proxy?Maybe…
US $ Euro € Yen ¥Sterling £ Swiss Franc CHF
Source – Financial Times (Market Data)
Greece Venezuela

Interest Rates SwapsEuro € Stlg. £ SwFr US $ Yen

Interest Rates Swaps
• How they were calculated:– US $ quoted annual money actual / 360 basis against 3 month
Libor– £ and ¥ quoted on a semi-annual / 365 basis against Libor– Euro/Swiss Franc quoted on annual bond 30/360 basis against
6 month Euribor/Libor with exception on the 1 year rate which is quoted against 3 month Euribor/Libor
• How are you feeling about Libor these days?
• Do we have concerns about the Euro € or British £?

Interest Rates Swap Calculation
• Series of cash flows occurring at known future dates
• Valued by summing the present value of the cash flows• Necessary to first estimate the correct discount factor (df),
which is typically LIBOR, for each period (t) on which a cash flow occurs
• Swap Rate Formula: • Σ PV of floating rate payments• Σ PV of notional principal• Rates can easily be found in the Financial Times or
Bloomberg.

A new model gaining consensus in Europe…“Svensson Procedure”
Recommended by the Germen Institute of CPAs (IDW)
Development of a risk free yield curvefrom published bond yields:
ECBFED
Bundesbank
Rate %
Years

Comparing Riskfree Rates
Prof. Aswath Damodaran – NYU Stern School of Business

85
Market Data Sources Available in the USA
• Duff & Phelps’ Valuation Handbook – U.S. Guide to Cost of Capital (issued annually)
• Damodaran Online (Aswath Damodaran –NYU Stern School of Business)
• Business Valuation Resources –BVMarketData
• Jim Hitchner’s Valuation Products and Service
• PitchBook / BVR Guideline Public Company Comps Tool

• American macroeconomic factors cannot be applied to companies that are located outside of the USA. – Adjustments for country and currency risk have to be made.– US Cost of Equity + Risk Premium for Foreign Country
Cost of Capital Outside of the USA
≠
• More difficult to find data sources, but there are sources available…

Data Sources
• Country Risk Ratings– Economist Intelligence Unit
• Provides risk assessment for 120 countries.• Produces 2 year forecast for the economic variables that are most important for
sovereign risk assessment.
– Euromoney Country Risk Rating• Biannual survey of 186 countries.• Ratings based on factors such as, political risk, access to bank finance, credit
ratings, etc.

• Country Risk Ratings (cont.)
– Institutional Investor Country Credit Rating
• Annual survey of 178 countries.• Based on information provided by senior economists and sovereign risk analysts
at leading financial institutions.
– International Country Risk Guide• Published by the PRS Group• Provides ratings for 140 countries
on a monthly basis.
Data Sources

Data Sources• Government Ratings (ratings of bonds issued
by local government) – Moody’s– Standard & Poors
• Duff & Phelps’ Handbook Guide to International Cost of Capital– Estimates COE for 188 countries– Uses 2 models:
1. Country Credit Rating Model2. Country Yield Spread Model

Data Sources• BVB Insights – Data & Analysis on UK Private
Multiples– Details on transaction multiples on sold
businesses in the UK
• Morgan Stanley Capital International (MSCI)– Barra products– Industry-standard models to predict risk
• Damodaran Online– White papers on risk free rate, ERP has
international component– http://pages.stern.nyu.edu/~adamodar/

• Political risk– Unstable government– Free market or Central
party rule?– Property Rights
• Currency / Exchange rate volatility– Purchasing power parity
(law of one price)– Big Mac Index…
Country Risk Factors
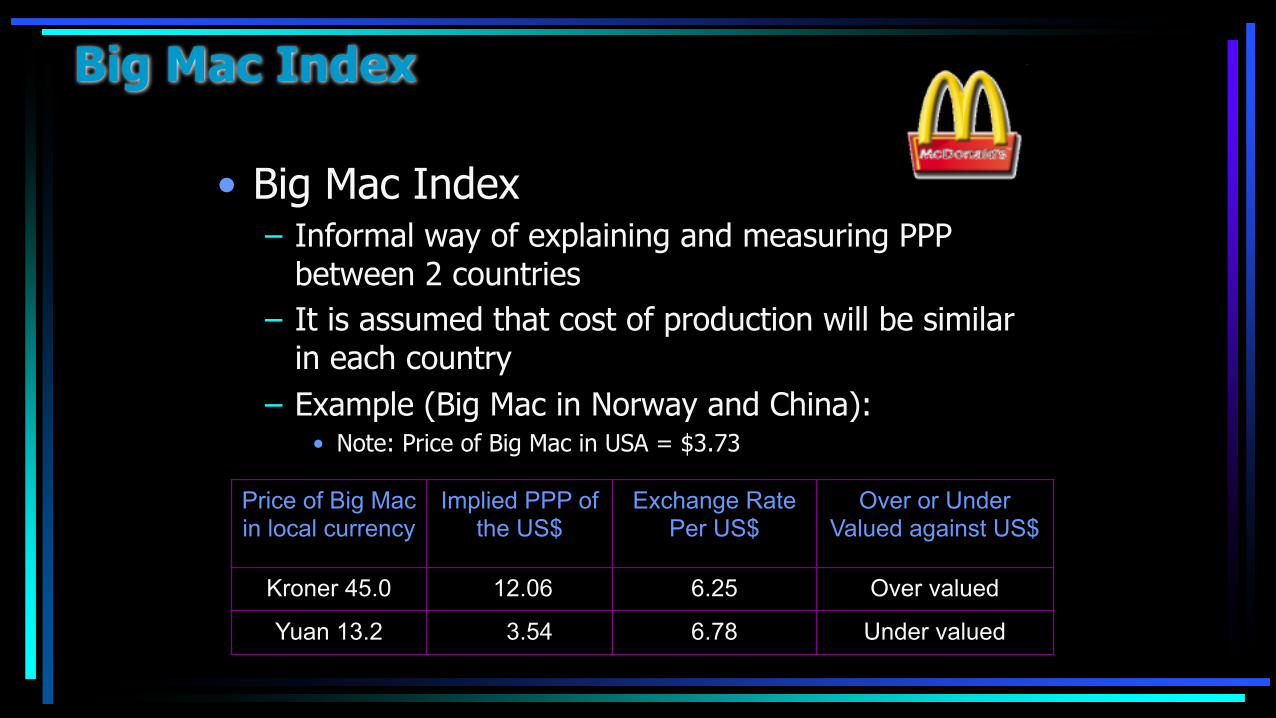
Big Mac Index
• Big Mac Index– Informal way of explaining and measuring PPP
between 2 countries– It is assumed that cost of production will be similar
in each country– Example (Big Mac in Norway and China):
• Note: Price of Big Mac in USA = $3.73
Price of Big Mac in local currency
Implied PPP of the US$
Exchange Rate Per US$
Over or Under Valued against US$
Kroner 45.0 12.06 6.25 Over valued
Yuan 13.2 3.54 6.78 Under valued

Country Risk Factors• Industrial development
– Highly dependent on one or two industries– E.g. extractive industry
• Poor financial institutions– Difficult to access credit– Corruption– Sovereign Interest Rate
• Monetary / Fiscal Policy– High / Hyper inflation– E.g. Venezuela inflation rate,
800% (2016) GDP shrunk 19%– Reliability of Accounting Information

• Infrastructure– Transportation / Distribution– Urban development– Utilities– Maintenance
• Ability to withstand natural and man made disasters– Earthquakes / Volcanoes– Weather related
(drought, flooding, etc.)– War or threat of war
Country Risk Factors

Additional Country Risk?
• Even if we accept the proposition that an equity risk premium of about 6% is reasonable for a mature market, you would expect a larger risk premium when investing in an emerging market.
• Consider Peru. There is clearly more risk investing in Peruvian equities than there is in investing in a mature market. To estimate the additional risk premium that should be charged, we follow a 3-step process:
Prof. Aswath Damodaran – NYU Stern School of Business

• Obtain a measure of country risk for Peru. For instance, the sovereign rating for Peru is Baa3 and the default spread associated with that rating in early 2010 was 2%.
• Estimate how much riskier equities are, relative to bonds. The standard deviation in weekly returns over the preceding 2 years for Peruvian equities was 26% and the standard deviation in the bond was 17%.
• Additional risk premium for Peru = 2% (26/17) = 3%= Total equity risk premium for Peru = 6%+3%=9%
Prof. Aswath Damodaran – NYU Stern School of Business

How to Calculate International Cost of Capital?
• Many models are available such as:– International / World CAPM – Country risk rating model
– Country spread model – The Erb-Harvey-Viskanta Model – Damodaran model
– Others

Quantifying Additional Country Risk
• Damodaran:1. Global Betas (denominator)
2. Cash Flows (numerator)
3. Additional risks in the Equity Risk Premium (denominator)
• Country Risk PremiumERP = Base ERP for mature country and Country Risk Premium

• Damodaran (cont.)
Does the market assist us?– Bond Default Spreads
(US$ denominated only)
– Credit Default Swap Spreads(net of US spread)

Prof Damodaran’s Methodology in His Spreadsheets
Enter the current risk premium for a mature equity market 6.00%
Do you want to adjust the country default spread for the additional volatility of the equity market to get to a country premium? Yes
If yes, enter the multiplier to use on the default spread (See worksheet for volatility numbers for selected emerging markets) 1.73
Must adjust
Country Region
Local Currency
Rating
Rating-based Default Spread
Total Equity Risk
Premium
Country Risk
Premium
CDS Defaul
t Sprea
d
Total Equity Risk
Premium
Country Risk
Premium
BrazilCentral and South America Baa2 1.75% 9.03% 3.03% 2.07% 8.37% 2.37%
RussiaEastern Europe & Russia Baa1 1.50% 8.60% 2.60% 2.91% 9.82% 3.82%
VenezuelaCentral and South America B1 4.00% 12.92% 6.92% 9.46% 21.15% 15.15%
Vietnam Asia B1 4.00% 12.92% 6.92% 3.89% 11.52% 5.52%
Estimating Country Risk Premiums

• Should all companies in a country with substantial country risk be equally exposed to country risk?...
Damodaran
• Country risk exposure should be scaled to a parameter such as, λ (lamda)− λ: proportion of company’s risk to country risk
No!

Damodaran
Typical Cost of Equity =Rf Rate + β*(Mature Market Premium) + Country Risk Premium(β: proportion of company’s risk to all other market risk)
Need to adjust for proportion of company risk to country risk:
Modified Cost of Equity =RF Rate + β*(Mature Market Premium) + λ*(Country Risk
Premium)
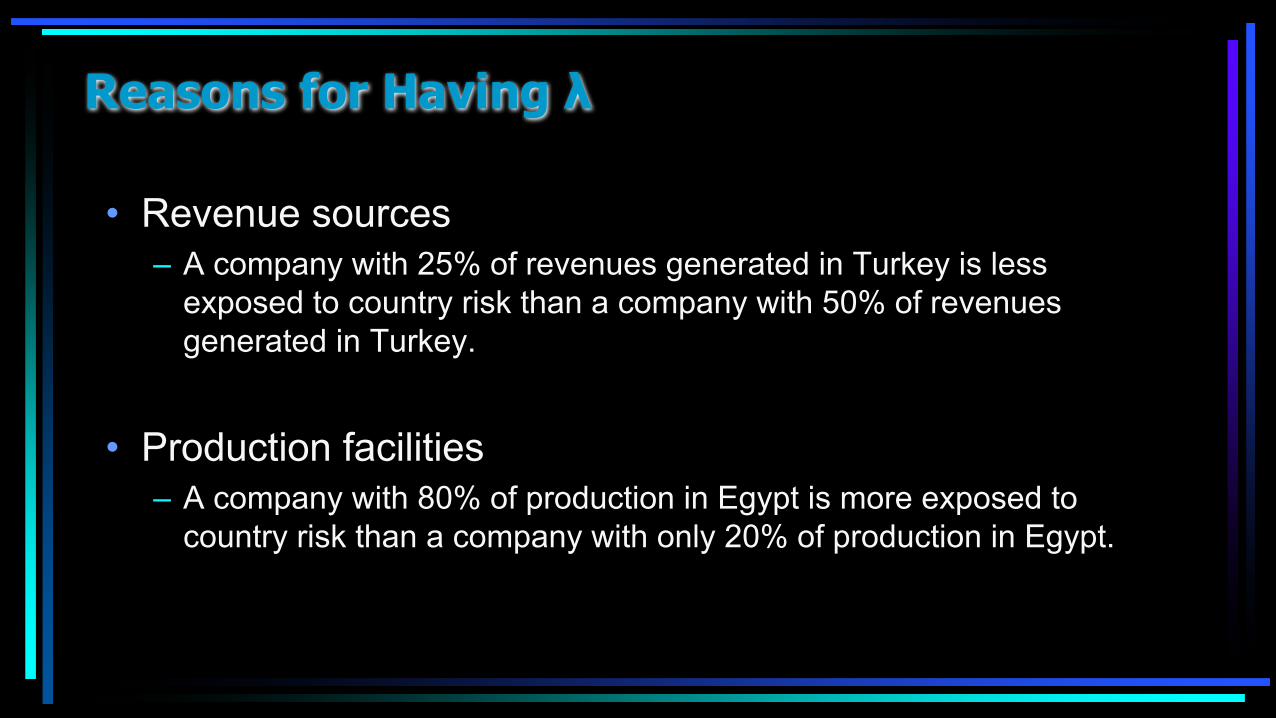
Reasons for Having λ
• Revenue sources– A company with 25% of revenues generated in Turkey is less
exposed to country risk than a company with 50% of revenues generated in Turkey.
• Production facilities– A company with 80% of production in Egypt is more exposed to
country risk than a company with only 20% of production in Egypt.

How to Calculate λ• Regression Analysis• Regress company stock prices against
foreign country’s government issued bond prices
• Result: y=mx + b, where m= λ
• Problems:– Large standard errors – Bonds should be liquid and widely circulated– Bonds should preferably be in a stable currency,
for example US $, UK £ or Euro €

Survey Methods for Establishing ERP’s…
• One quarterly survey comes from three finance professors from IESE Business School in Madrid, Spain.
Prof. Pablo FernandezProf. Vitaly PershinProf. Isabel Fernandez Acin
“Market Risk Premium used in 41 countries in 2017”A survey with 4368 answers issued April 17,2017
(There were responses from 68 countries but 27 had less than 25 answers and were excluded)

Survey Selected Answers…
• Via email from:
• Professors
• Analysts• Company CFOs / Treasury• Financial Companies

Sources Cited by Survey Respondents
– Damodaran– Morningstar/Ibbotson– Internal Estimate– Historical Data– Bloomberg– Analysts / Investment Bankers– Experience, subjective / own judgment– Fernandez Survey– DMS– Duff & Phelps

Survey Results (Sample of Countries, not complete)
April 17, 2017
US 8.2 2.5 5.7Spain 8.8 2.2 6.6Germany 7.2 1.4 5.8UK 8.1 2.2 5.9Italy 9.0 2.6 6.4China 10.8 3.3 7.5Argentina 26.7 10.4 16.3Greece 20.9 4.8 16.1Russia 16.5 8.7 7.8India 15 6.5 8.5South Africa 15 7.5 7.5
Km Rf MRPCountry
Remember ECB Quantitative Easing is in effect

Fernandez cautions readers to recognize differences in usage of the
Market Risk Premium (MRP) or Equity Premium (EP)
HEP Historical Equity Premium
EEP Expected Equity Premium
REP Required Equity PremiumIEP Implied Equity Premium


Thank You.
Kristen Matkowsky, [email protected]
Don DeGrazia, CPA/ABV/[email protected]
Gold Gerstein Group LLC • +1 856.727.0100
And remember…“...often wrong, but never in doubt!”