bustinza, o., vendrell-herrero, f., parry, g. and ...eprints.uwe.ac.uk/18716/8/music business models...
TRANSCRIPT

Bustinza, O., Vendrell-Herrero, F., Parry, G. and Myrthianos, V.(2013) Music business models and piracy. Industrial Management &
Data Systems, 113 (1). pp. 4-22. ISSN 0263-5577
We recommend you cite the published version.The publisher’s URL is http://dx.doi.org/10.1108/02635571311289638
Refereed: Yes
(no note)
Disclaimer
UWE has obtained warranties from all depositors as to their title in the materialdeposited and as to their right to deposit such material.
UWE makes no representation or warranties of commercial utility, title, or fit-ness for a particular purpose or any other warranty, express or implied in respectof any material deposited.
UWE makes no representation that the use of the materials will not infringeany patent, copyright, trademark or other property or proprietary rights.
UWE accepts no liability for any infringement of intellectual property rightsin any material deposited but will remove such material from public view pend-ing investigation in the event of an allegation of any such infringement.
PLEASE SCROLL DOWN FOR TEXT.

Paper for IMDS
Bustinza, O.F., Vendrell-Herrero, F., Parry, G.C., Myrthianos, V. (2013) “Music business
models and piracy”, Industrial Management and Data Systems, 113(1) 4-22

Music Business Models and Piracy
Abstract
Purpose –An estimate of the scale of illegal file sharing activity across 10 countries is made and
a correlation of this activity with country revenues. The work elucidates an under explored
business model challenge which exists in parallel with a music piracy challenge.
Design/methodology/approach–The study data draws from a number of sources, including a
data set of a survey of more than 44,000 consumers in ten different countries undertaken in
2010. Following analysis all findings are validated by a panel of industry experts.
Findings –Results show that non-legitimate file sharing activity is a heterogeneous issue across
countries. The scale of activity varies from 14 per cent in Germany to 44 per cent in Spain, with
an average of 28 per cent. File-sharing activity negatively correlates to music industry revenue
per capita. This research finds many consumers are not engaging with online business models.
Almost one fourth of the population claim that they do not consume digital music in either legal
or illegal forms. This phenomenon is also negatively correlated with sales per capita.
Research limitations/implications –The comparative analysis in this work focuses upon
business models which sell music as tracks or albums. Music streaming business models are
excluded from this study which creates a limitation. Legal streaming accounts for ~1 per cent of
revenue and is expected to grow significantly. A file sharer is taken to be an individual who
illegally downloads music very often or often and a non-file sharer one who only does this
occasionally, rarely or never. Technically, respondents may illegally stream music and state
they do not illegally download. The exclusion of streaming coupled with the definition of file
sharers mean figures presented are very conservative. The majority of the sample data, 60 per
cent, is from European countries.
Practical implications –Results support the need for policy makers to introduce strong
Intellectual Property Rights (IPR) regulation which reduces file-sharing activity. The work also
identifies a large percentage of non-participants in the digital market who may be re-engaged
with music through business model innovation.
Originality/value –This research presents a map of the current file sharing activity in 10
countries using a rich and unique dataset. The work identifies that a countries’ legal origin
correlates to data on file sharing activity, with countries from a German legal origin illegally file
sharing least. Approximately half of the survey respondents chose not to answer the question
related to file sharing activity. Different estimates of the true scale of file-sharing activity are
given based upon three different assumptions of the file sharing activity of non-respondents to
this question. The challenge of engaging consumers in the digital market through different
business models is discussed in light of digital music’s high velocity environment.
Keywords– Music Industry, File Sharing, Business Models, Cross-Country analysis.

1. Introduction
Revenues in the global music industry have been shrinking since the start of the twenty
first century (Liebowitz and Watt, 2006; Liebowitz, 2006, 2008; Elberse, 2010; IFPI,
2011). Firms in this sector are moving from a focus on selling music as a physical
product towards creating value from selling music in digital formats (Parry et al., 2012)
which gives rise to different business models (Balocco et al., 2010). A clear correlation
exists between digitalization (i.e. MP3 format, broadband availability, online file
sharing) and revenue decline in the music industry, with the most common explanation
for this decline being the role of illegal file sharing, often referred to as piracy
(Liebowitz, 2008). The piracy phenomena may be a form of purchase substitution,
where music consumers substitute illegal downloads for legal purchase (Liebowitz and
Watt, 2006; Liebowitz, 2006). Widespread availability of broadband internet facilitates
the growth of file sharing. As physical distance is largely irrelevant for internet based
file sharing, individuals from across the world can participate (Siwek, 2007; RIAA,
2011). To counter act illegal file sharing some countries have introduced stronger
legislation. Analysis shows a correlation between stronger legislation protecting
Intellectual Property Rights (IPR) and increases in revenues (Bhattacharjee et al., 2006;
Adermon and Liang, 2010; IFPI, 2011; Danaher et al., 2012).
Preventing piracy through legislation is not the sole response available to the
music industry. The fall in revenue is partially attributed to a reduction in consumption
as a result of the consumer’s unfamiliarity with new digital sales formats, as time is
needed to learn and adapt to new digital technologies (Parry et al., 2012). In this new
product-service system, in which market information is scarce, customers play a central
role in creating value (Hilletofth, 2011) and to be successful firms need to adopt a
customer-oriented perspective (Öztaysi et al., 2011). Analyzing the digital music
market, there are two groups of consumers identified that represent potential sources of
new digital revenues that may be recovered: (1) those consumers currently engaged in
illegal file sharing and (2) those consumers who have become disenfranchised with
currently available digital business models.
This paper uses empirical analysis of a rich and unique dataset of more than
44,000 surveys conducted in 2010 in 10 different countries. The objective is twofold.
First to direct the strategic approach of the music industry by estimating both the scale
of illegal file sharing and the size of the market of those not engaging with digital
business models for the 10 countries studied. Second, to understand how value is

created using correlation analysis at the country level between illegal file sharing and
digital business models against total music revenues per capita. This paper calls for
both improved regulation to limit piracy and the development of new business models.
The paper will continue with a literature review and construction of hypotheses.
Following this is an explanation of the data used, empirical analysis undertaken and a
presentation of the results. The work concludes with a discussion of the results and
future research.
2. Digital business models and piracy
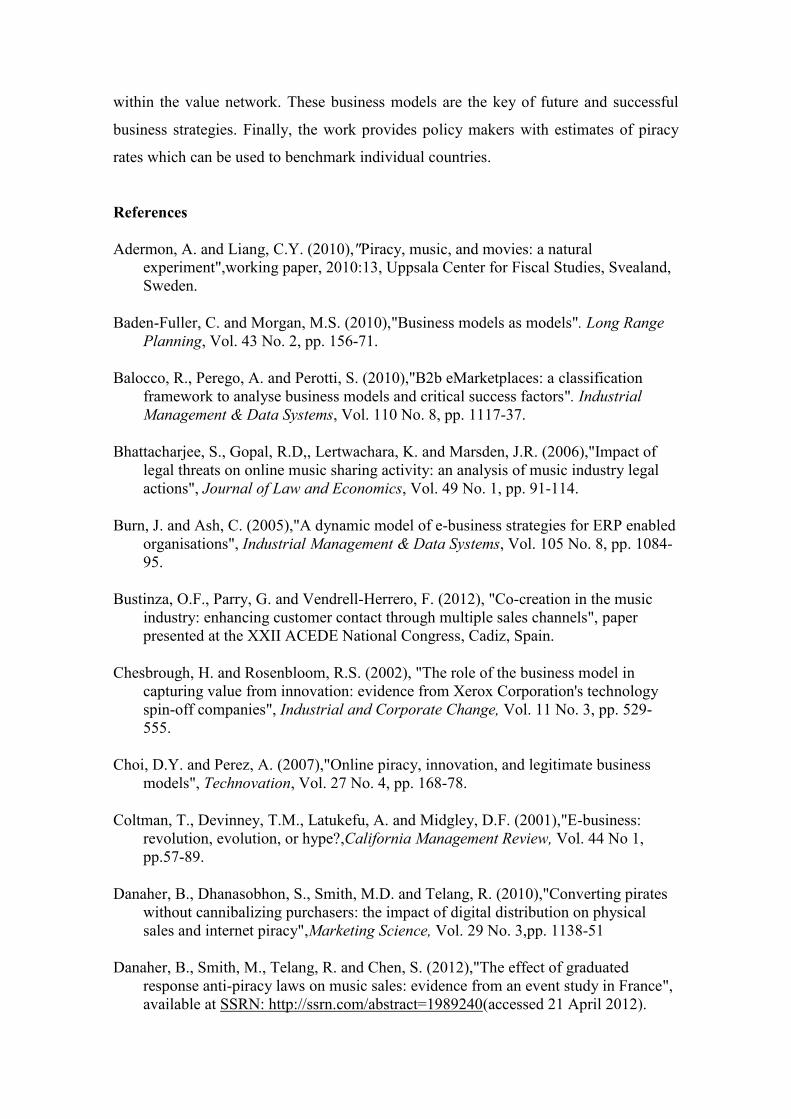
Revenues from the total music industry have decreased substantially since the beginning
of the twenty-first century, Figure 1. The total sales from the 10 countries analyzed
decreased from US$22bn (thousand million) in 2000 to US$13bn in 2010. From the
literature two scenarios are identified which may be contributing towards the decrease
in revenue: illegal file sharing of digital music and business models which are
unfamiliar to the consumer. This paper attempts to quantify and disentangle the two
scenarios and identify which may be the most significant in different contexts.
[Insert Figure 1]
2.1 The file sharing challenge
In economic terms file sharing reduces music sales when the market price of songs are
higher than its consumer utility (Waldfogel, 2010). In this sense, piracy is a form of
purchase substitution (Liebowitz and Watt, 2006; Liebowitz, 2006), where music
consumers substitute illegal downloads for legal purchases. Empirical evidence supports
the premise that illegal file sharing reduces music industry revenue, which supports
calls for greater IPR protection (Hong, 2004; Rob and Waldfogel, 2004; Liebowitz,
2008; Michel, 2006; Zentner, 2006; IFPI, 2011). IPR protection takes two forms, either
technological constraint on the user e.g. Digital Rights Management [DRM], or the
introduction of legislative instruments.
Vernik et al. (2011) show that DRM is ineffective in preventing piracy as those
who suffer most inconvenience from usage restrictions are legal purchasers. On the
contrary, empirical studies of legislative reforms in different countries suggest that this
is an effective approach (E.g. in the US Battacharjee et al., 2006; in Sweden Adermon
and Liang, 2010; and in France Danaher et al., 2012). Special relevance should be given
to the study of Danaher et al. (2012) who explored how the Hadopi (2009) legislation

affects digital music sales in the iTunes music store in France. They use a broad set of
European countries as a control group. The results suggest that increased consumer
awareness of the Hadopi law causes iTunes song and album sales to increase by 23 and
25 per cent respectively relative to changes in the control group.
The first hypothesis is constructed to test the theory that piracy in music industry
results in purchase substitution:
H1: There is an inverse relationship between file sharing activity and revenues in
the music industry
2.2 Business model development
The term Business Model here refers to the design of the value creation, delivery and
capture mechanisms employed by an enterprise to entice customers to pay for value, and
convert those payments to profit (Teece, 2010). Differences between the business model
and strategy lies within three areas (Chesbrough and Rosenbloom, 2002): business
models start at value creation for the customer whereas strategy places more emphasis
upon value capture and sustainability; financing may not be as prominent in business
models as in strategy; the business model assumes knowledge is cognitively limited and
biased by a firms previous success, whereas strategy assumes careful analytics based
upon reliable and available information with little recognition of cognitive limitations.
Analysis of music business models (Molteni and Ordanini, 2003; Choi and Perez,
2007) shows that mp3 technology provided a turning point in the music market, as this
file format facilitated the development of online offerings which increased the
availability and choice for consumers (Graham et al., 2004). Prior to this innovation a
firm’s competitive advantage was heavily dependent on high-street shops with limited
stock space, competing on managerial capabilities in balancing stock and consumer
demand. Digital music removed much of the supply side challenge, deliver operating
efficiencies across the supply chain (Coltman et al., 2001) and allowed the development
of business models which integrate customer and supplier in a relationship (Sommer,
2003). This requires a re-evaluation of organizational strategies and learning capabilities
of music vendors (Lin et al., 2011). Music vendors need to differentiate their offerings
to clearly demonstrate their value propositions to their customers (Burn and Ash, 2005).
Digital music business models may encompass traditional physical unit sales, digital
unit sales, streamed music, online radio and forums for consumer engagement and

comment on content (Bustinza et al., 2012). These additions to the product offering are
likened to the servitization process, where firms are increasingly seeking revenue from
services associated with their product (Vandermerwe and Rada, 1988).
Industry revenue decline suggests that the ‘recipe’ for a successful music business
model has yet to be achieved (Baden-Fuller and Morgan, 2010). ‘Unbundling’, a
common facet of the digital music business model where each individual track from an
album may be bought separately, produces a decrease in total industry revenue (Elberse,
2010). Danaher et al. (2010) show that file sharing of NBC content increased
substantially when it was removed from iTunes in 2007. File sharing activity decreased
and revenues were recovered once the content was restored to the iTunes catalogue in
2008. Therefore, digital stores such iTunes may provide revenue gains from those who
may currently be non-buyers or illegally share files. Consequently customer demand
may be stimulated through evolution and new business model development (Hilletofth,
2011; O'Cass and Ngo, 2011).
The online market is a high-velocity environment as demand, competition and
technology are constantly changing (Wirtz et al., 2007). Music distributors have begun
to establish new business models where they are part of the value chain (i.e. cloud
music services) being necessary for that a close analysis of customers behaviour.
Business models are built around delivering customer value but knowledge of
innovation management in the music industry may be limited, exemplified by the
negative impact of mp3 technology on revenue. To better understand how business
models create value for customers firms have begun to more closely customers' analyse
behaviour (Parry et al., 2012). Understanding and development of successful business
models may be seen as part of a more complex strategy, which would include lobbying
for IPR protection, to recover revenues. For all these reasons, a second hypothesis is
created to test whether new business models can increase revenues:
H2: There is a positive relationship between new business models and recovering
revenues in the music industry
3. Empirical analysis
3.1 Data

A unique cross section questionnaire with 44,206 valid observations from 10 countries
is exploited. Four continents are represented with a recognised bias towards Europe as 6
European countries are represented, with 2 countries from North America and 1country
each for Asia and Oceania. The questionnaire and responses formed part of a global
survey conducted between September and December 2010 by one of the ‘Big 3’ global
music companies with the objective of gaining insight into music consumer behaviour
(Informa Telecoms & Media, 2010). A representative sample of the general population
is given by random sampling. The survey extends to over 300 questions, using Likert
scales, open and closed questions. Analysis takes into account a subset of responses
relating to consumer purchasing behaviour. This sample has been proved to be valid in a
recent study by Parry et al. (2012).
Available comparisons between digital file sharing activities and business models
are shown in Table 1. Data from different sources attempts to quantify and measure file
sharing activity. In the sample period IFPI (2011) data for illegal file sharing is
available only for Spain, but is similar to the primary data used in this paper.
[Insert Table 1]
Waldfogel (2010) surveyed 500 US graduate students in 2010 and showed that of
a sample of 50 popular songs students on average possess 7.63 legally purchased and
7.20 illegally downloaded songs, suggesting piracy in the US accounts for half of music
consumption. Compared to other estimates of US piracy this figure is consistent with
Peitz and Waelbroeck (2004) who estimate levels in 2001 at 40 per cent and is
inconsistent with Liebowitz (2006) who estimate 13 per cent during 2005. The author’s
conservative estimation, 27 per cent, falls between previous studies.
In the primary data 53.5 per cent of the individuals responding to all the questions
chose not to answer the question related to their music file sharing activity. This leaves
a question: is the behaviour of the 46.5 per cent that chose to respond to this question
representative of the whole population, or do they differ? If they differ the usual
methodology employed for missing data, of taking into consideration only the
respondents of each question, could create errors within the given estimate. Further
analysis of the non-respondent group was undertaken to give different estimates of file
sharing activity dependent on the assumptions made regarding the distribution and
attitudes of this group.
3.2 Estimates of file sharing activity and the business models challenge
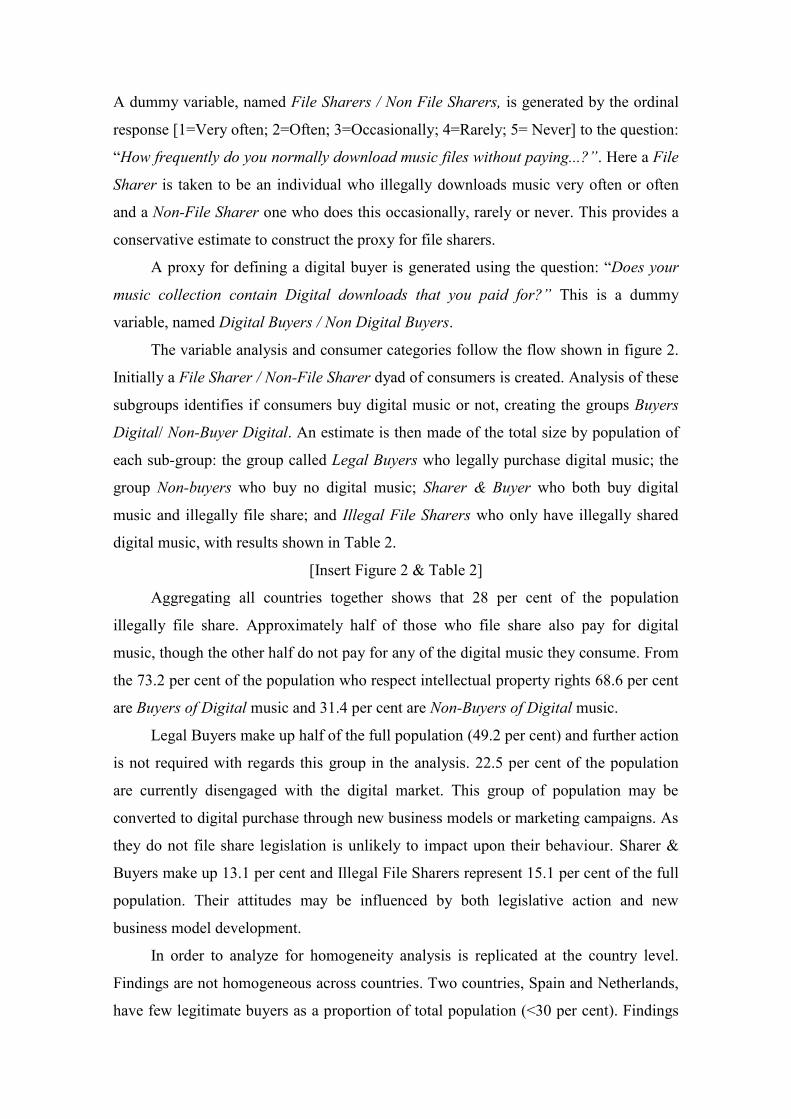
A dummy variable, named File Sharers / Non File Sharers, is generated by the ordinal
response [1=Very often; 2=Often; 3=Occasionally; 4=Rarely; 5= Never] to the question:
“How frequently do you normally download music files without paying...?”. Here a File
Sharer is taken to be an individual who illegally downloads music very often or often
and a Non-File Sharer one who does this occasionally, rarely or never. This provides a
conservative estimate to construct the proxy for file sharers.
A proxy for defining a digital buyer is generated using the question: “Does your
music collection contain Digital downloads that you paid for?” This is a dummy
variable, named Digital Buyers / Non Digital Buyers.
The variable analysis and consumer categories follow the flow shown in figure 2.
Initially a File Sharer / Non-File Sharer dyad of consumers is created. Analysis of these
subgroups identifies if consumers buy digital music or not, creating the groups Buyers
Digital/ Non-Buyer Digital. An estimate is then made of the total size by population of
each sub-group: the group called Legal Buyers who legally purchase digital music; the
group Non-buyers who buy no digital music; Sharer & Buyer who both buy digital
music and illegally file share; and Illegal File Sharers who only have illegally shared
digital music, with results shown in Table 2.
[Insert Figure 2 & Table 2]
Aggregating all countries together shows that 28 per cent of the population
illegally file share. Approximately half of those who file share also pay for digital
music, though the other half do not pay for any of the digital music they consume. From
the 73.2 per cent of the population who respect intellectual property rights 68.6 per cent
are Buyers of Digital music and 31.4 per cent are Non-Buyers of Digital music.
Legal Buyers make up half of the full population (49.2 per cent) and further action
is not required with regards this group in the analysis. 22.5 per cent of the population
are currently disengaged with the digital market. This group of population may be
converted to digital purchase through new business models or marketing campaigns. As
they do not file share legislation is unlikely to impact upon their behaviour. Sharer &
Buyers make up 13.1 per cent and Illegal File Sharers represent 15.1 per cent of the full
population. Their attitudes may be influenced by both legislative action and new
business model development.
In order to analyze for homogeneity analysis is replicated at the country level.
Findings are not homogeneous across countries. Two countries, Spain and Netherlands,
have few legitimate buyers as a proportion of total population (<30 per cent). Findings

show that Italy, Spain and the Netherlands have relatively high piracy rates. The
population who only engage in illegal file sharing in Spain is 31.4 per cent, Netherlands
27.6 per cent and Italy 21.2 per cent. In recognition of this issue Spain has introduced
The Law on the Sustainable Economy, also known as the Sinde-Wert Act, to protect
intellectual property rights (Batuecas-Caletrio and Aparicio-Vaquero, 2012; Spain IIPA,
2012). Italy’s Regulatory Communication Authority (AGCOM) was formed in
December 2010 and is developing legal reforms to protect IPR (Italy IIPA, 2012).
Netherlands have not announced any intent to legislate.
Germany is the country with the lowest relative piracy, 14.1 per cent, lower than
France where piracy is at 22.7 per cent, despite France having introduced the Hadopi
(2010) law to tackle illegal file sharing one year before the survey was undertaken.
Germany may be used as a target benchmark for an achievable rate of illegal file
sharing under current market conditions. Japan has the second lowest file sharing
activity and in exploring links it was found that Japan and Germany share legal origin,
(Djankov et al. 2002). They are the only 2 countries with German legal origin included
in the analysis. The other countries have either French Legal Origin (France, Spain,
Netherlands and Italy) or English Legal Origin (UK, US, Australia and Canada) which
cluster into distinct groups when percentage file sharing is plotted against revenue (see
figure 3.1.2). Further analysis is required to test how meaningful this correlation is.
The UK is the country with the most successful revenue and business model mix,
with 69 per cent legal buyers and 20.5 per cent level of piracy. Only 10.4 per cent of the
population have left the music market. Whilst the US, Canada and Australia share
similarities in terms of language, economic development, legal origin and culture as a
group they differ from the UK. Piracy is 25-30 per cent in the population, 50-60 per
cent are legitimate buyers, leaving 15-20 per cent as a potential business model
challenge.
3.3 Digital market outsiders
The group of non file sharers and non digital buyers are currently described as excluded
from the digital market but not necessarily as a consequence of a business model
challenge. Table 3 provides analysis of this group which make up 22.5 per cent of the
sample. The smallest sub-group, 1.2 per cent, are identified as financially constrained,
disclosing that they are unemployed, and so have no disposable income to spend on
music. A second group are those who claim to have no interest in music, making up 5.6

per cent of the sample. 4.2 per cent of the aggregate sample buy music, but only in
physical format, reflecting the low revenues generated by physical sales. The remaining
11.4 per cent are those with a latent passion for music but who are currently not
engaged, representing a challenge for those developing business models.
[Insert Table 3]
An issue within this analysis is that the question disclosing File sharing is
answered only by 20,550 consumers, while digital buying is answered by 44,206. The
difference is large and whilst we do not have evidence as to their motivation, it is likely
a result of respondents resisting self-incrimination though answering this question
(Mercado-Kierkegaard, 2005). This privilege is recognised by the European Court of
Human Rights (Funke v. France 1993; Ernest Saunders v. United Kingdom 1997). An
analysis of them introduces a new group (Don’t Respond) detailed in data section.
‘What happens with the group of population that doesn’t want to disclose their
piracy behaviour?’ In Table 4 the sample is split into consumers that claim to be file
sharers, consumers that claim to be non-file sharers and consumers that avoid answering
this question. 53.5 per cent of the population avoids answering this question, with
homogeneity across countries ranging from 44.2 per cent in Spain to 59 per cent in
Japan. Three options are considered here as to why people avoided answering this
question: First, they do not want to self-incriminate as they are file sharers. In this
scenario total file sharing activity will equal the sum of the non-respondents and
explicitly recognized file sharers. Homogeneity would exist across countries and file
sharing activity would be between ~63 per cent (Australia, UK and Germany) and ~72
per cent (Netherlands and Italy); second, non-respondents follow a similar distribution
to the rest of the sample. If this is the case the results remain the same as offered in
Table 2; finally, they are not familiar with digital products and services and are Non-
File Sharers. The Business Model challenge thus rises on average to ~65 per cent of
population and piracy is a smaller issue, with a Spain the maximum of 24.6 per cent
and Germany the minimum with 6 per cent of the population.
[Insert Table 4]
With the objective of clarifying the general reason for not responding to the
question on file sharing behaviour Table 5 analyzes the characteristics of File Sharers,
Non-File Sharers and Don’t Respond groups, reporting mean values and standard
deviation for the following set of variables:
Dummy Variables: Digital and Physical buying behaviour.

Counting variables: Hours listen voluntarily per week and age.
Likert Scale Variables: Consumers were asked about for their passion for
music, their willingness for buying music legitimately, and their willingness
to acquire music without paying.
[Insert Table 5]
The percentage of buying physical is 30.1 per cent and digital at 31.2 per cent in
the total sample. However, the distribution is quite different. As shown in Table 5, only
3 per cent of the group that don’t respond to the file sharing question buy digital music,
but 30.1 per cent buy music in physical format. This percentage is close to that for Non-
File Sharers, 33.3 per cent and larger than the File Sharers, 25.1 per cent. Therefore it
cannot be concluded that the Don’t Respond group are non buyers, they simply have
different preferences when buying and they listen to fewer hours of music per week; 2.5
hrs in comparison with 2.9 hrs of Non-File Sharers and 3.8 hrs for File Sharers. The
Don’t Respond group is less passionate about music than the other groups, which
correlates with their average age ~45 years; older than File Sharers at 31.1 and Non-File
Sharers at 38.5 years old. To explore the view that the Don’t Respond group may be not
be illegal file sharers two control variables were included; their willingness to buy
music legitimately and download music without paying. On average the group place
greatest value on buy music legitimately, a value of 3.8 compared to 2.6 for File
Sharers. The group also has the lowest value for acquiring music without paying: 2.2
compared to 3.7 for File Sharers.
3.4 File sharing activity, business model issues and sales per capita
In this analysis, illegal file sharing has been related to an individual’s attitude towards
buying music, but does not include average spending. IFPI data presents national
average expenditure per capita for the year 2010. Figures range from US$4 in Italy to
US$31 in Japan. In Figures 3.1 to 3.6 the different measures of file sharing activity and
business model issues are related to the true value of sales per capita. As with Table 2,
figures 3.1.1, 3.1.2 and 3.2 assume that the Don’t Respond group follow the same
distribution of those who answered the question. Figures 3.3 and 3.4 assume non-
respondents are File Sharers and Figures 3.5 and 3.6 assume they are Non-File Sharers.
[Insert Figures 3.1 to 3.6]
In Figure 3.1 a negative relationship is seen between file sharing activity and sales
per capita (R2>0.5) supporting the literature (Hong, 2004; Rob and Waldfogel, 2004;

Bhattacharjee et al., 2006; Michel, 2006; Zentner, 2006; Liebowitz, 2008). The line of
best-fit has a highly negative slope, -60, such that a reduction of 1 per cent in file
sharing gives a rise of US$0.6 in expenditure per capita. Therefore, Hypothesis 1 is
accepted. In Figure 3.2, a negative relationship exists between business model issues
and sales per capita (0.1>R2>0.2), supporting the literature (Burn and Ash, 2005; O'Cass
and Ngo, 2011; Parry et al., 2012). Therefore, Hypothesis 2 is accepted.
When it is assumed that non- respondents to the file sharing question are Non-File
Sharers (Figure 3.6) a quadratic relationship is observed, casting doubt upon the validity
of the assumption. It seems illogical to suggest that the country with highest sales per
capita (i.e. Japan) is faced with a significant business model challenge. However, this is
a high velocity environment and may indicate future challenges for this market. Future
work including data on streamed services, both illegal and legal, may better inform this
argument.
4. Discussion
The empirical literature analyzing the music industry during the last decade has
emphasized the role of piracy in the decrease of music industry revenues. Drawing upon
a sample of more than 44,000 surveys from 10 countries this work supports the previous
findings and suggests that illegal file sharing decreases sales per capita and is a common
problem around the world. Based upon conservative assumptions an estimated 28.2 per
cent of the population participates in illegal file sharing.
However, the work challenges the assumption that piracy is solely responsible for
the revenue decline in the music industry. With the digitalization of music the dynamics
of the music market have dramatically changed. Many new music business models
reflect a theoretical shift in understanding what music retail is, presenting music to
consumers not as a product but as a service (Parry et al., 2012). Examples include pay
as you go business models exemplified by Apples iTunes and pay monthly models
exemplified by Spotify (Osterwalder and Pigneur, 2010). The transformation may have
excluded some consumers from the market, described in this paper as a Business Model
Challenge. According to the analysis presented this challenge accounts for ~22.5 per
cent of the population, only six percentage points below the level of file sharing at
~28.2 per cent. Of the 50.7 per cent of the consumers who find themselves outside the
legal market, only 28.2 per cent of them may be recovered through legislation aimed at
reducing piracy; supporting H1 and calling for a stronger IPR regulation. The remainder

of the sample must be recovered through business model innovation, providing access
to music in a way that better suits this groups requirements; supporting H2.
A correlation was observed between piracy level and the legal origins of the
country (Djankov et al., 2002). Countries with German legal origin seem less inclined
to illegally file share than other countries. However, in discussions with industry experts
they recognised that in Germany there have been numerous lawsuits against file-sharers
over many years whilst in Japan piracy is seen as a growing issue with regards
streaming over smart phones. Future research will explore this correlation and related
issues.
This paper also makes a methodological contribution. Only 46.5 per cent of the
survey respondents are willing to answer the question regarding their file sharing
activities. This opens a debate: do the non-respondents follow a similar distribution to
the respondents with regards their attitude to file sharing? Three scenarios are used to
enable the redistribution of respondents. First, as with previous research (Peitz and
Waelbroeck, 2004; IFPI, 2011) it is assumed that non-respondents follow a similar
distribution to respondents. Second, it is assumed that non-respondents are File Sharers.
Third, non-respondents are assumed to be Non-File Sharers. The evidence would
suggest that non-respondents tend to be closer to non-file sharing groups, the third
assumption, as they are older and would appear to favour physical music purchases.
However, accepting this assumption raises a paradox (see Figure 3.6): why would
Japan, the country with the highest sales per capita, have the greatest business model
challenge? This requires future research, as Japan may have a particular issue with
piracy and streaming over mobile networks.
A limitation of this study is the analysis of business models as applied to music
services as the analysis of the digital market is undertaken without data on the usage of
streaming services. Streaming accounts for ~1 per cent of revenue, but this is set to
grow. Future research will correct for this gap.
Finally, this paper has also managerial and policy implications. The results
suggest the exploitation of business models, rather than traditional business strategy, to
manage music industry uncertainty. In this sense, customers play a central role, and
managers in the music industry may be aware that there is a proportion of the
population that could be recovered using new business models. Music distributors have
begun to understand customers’ behaviour which will increase their targeting of value
propositions, clarifying market segments and better describing the position of the firm
within the value network. These business models are the key of future and successful
business strategies. Finally, the work provides policy makers with estimates of piracy
rates which can be used to benchmark individual countries.
References
Adermon, A. and Liang, C.Y. (2010),"Piracy, music, and movies: a natural
experiment",working paper, 2010:13, Uppsala Center for Fiscal Studies, Svealand,
Sweden.
Baden-Fuller, C. and Morgan, M.S. (2010),"Business models as models". Long Range
Planning, Vol. 43 No. 2, pp. 156-71.
Balocco, R., Perego, A. and Perotti, S. (2010),"B2b eMarketplaces: a classification
framework to analyse business models and critical success factors". Industrial
Management & Data Systems, Vol. 110 No. 8, pp. 1117-37.
Bhattacharjee, S., Gopal, R.D,, Lertwachara, K. and Marsden, J.R. (2006),"Impact of
legal threats on online music sharing activity: an analysis of music industry legal
actions", Journal of Law and Economics, Vol. 49 No. 1, pp. 91-114.
Burn, J. and Ash, C. (2005),"A dynamic model of e-business strategies for ERP enabled
organisations", Industrial Management & Data Systems, Vol. 105 No. 8, pp. 1084-
95.
Bustinza, O.F., Parry, G. and Vendrell-Herrero, F. (2012), "Co-creation in the music
industry: enhancing customer contact through multiple sales channels", paper
presented at the XXII ACEDE National Congress, Cadiz, Spain.
Chesbrough, H. and Rosenbloom, R.S. (2002), "The role of the business model in
capturing value from innovation: evidence from Xerox Corporation's technology
spin-off companies", Industrial and Corporate Change, Vol. 11 No. 3, pp. 529-
555.
Choi, D.Y. and Perez, A. (2007),"Online piracy, innovation, and legitimate business
models", Technovation, Vol. 27 No. 4, pp. 168-78.
Coltman, T., Devinney, T.M., Latukefu, A. and Midgley, D.F. (2001),"E-business:
revolution, evolution, or hype?,California Management Review, Vol. 44 No 1,
pp.57-89.
Danaher, B., Dhanasobhon, S., Smith, M.D. and Telang, R. (2010),"Converting pirates
without cannibalizing purchasers: the impact of digital distribution on physical
sales and internet piracy",Marketing Science, Vol. 29 No. 3,pp. 1138-51
Danaher, B., Smith, M., Telang, R. and Chen, S. (2012),"The effect of graduated
response anti-piracy laws on music sales: evidence from an event study in France",
available at SSRN: http://ssrn.com/abstract=1989240(accessed 21 April 2012).

Djankov, S., La Porta, R., Lopez-de-Silanes, F. and Shleifer, A. (2002),"The regulation
of entry", The Quarterly Journal of Economics, Vol. 117 No. 1, pp. 1-37.
Elberse, A. (2010),"Bye-bye bundles: the unbundling of music in digital channels".
Journal of Marketing, Vol. 74 No. 3, pp. 107-23.
Graham, G., Burnes, B., Lewis, G.J. and Langer, J. (2004),"The transformation of the
music industry supply chain: a major label perspective", International journal of
operations & production management, Vol. 24 No 11, pp. 1087-103.
Hadopi(2009). LOI n° 2009-669 du 12 juin 2009 favorisant la diffusion et la protection
de la création sur internet, available at:www.legifrance.gouv.fr(accessed 4
November 2012).
Hilletofth, P. (2011),"Demand-supply chain management: industrial survival recipe for
new decade", Industrial Management & Data Systems, Vol. 111 No. 2, pp. 184-
211.
Hong, S.H. (2004). "The effect of digital technology on the sales of copyrighted goods:
evidence from Napster",working paper, Stanford University.
IFPI(2011), "Digital Music Report 2011: music at the touch of a button", available
athttp://www.ifpi.org/content/library/DMR2011.pdf (accessed 8October 2011).
Informa Telecoms & Media (2010), "Universal music group reasserts its recorded-
music dominance in 2010", available at:
http://musicandcopyright.wordpress.com/2011/03/23/universal-music-group-
reasserts-its-recorded-music-dominance-in-2010/(accessed 26 May 2011)
Italy IIPA (2012), "Italy: International Intellectual Property Alliance (IIPA). 2012
special 301 report on copyright enforcement and protection", available online:
http://www.iipa.com/rbc/2012/2012SPEC301ITALY.PDF(accessed 15 June 2012)
Liebowitz, S.J. (2006),"File sharing: creative destruction or just plain
destruction?",Journal of Law and Economics, Vol. 49 No. 1, pp. 1-16.
Liebowitz, S.J. (2008),"Research note: testing file-sharing’s impact on music album
sales in cities", Management Science, Vol. 54 No. 4, pp. 852-9.
Liebowitz, S.J. and Watt, R. (2006),"How to best ensure remuneration for creators in
the market for music? Copyright and its alternatives", Journal of Economic
Surveys, Vol. 20 No. 4, pp. 513-45.
Lin, R.J., Chen, R.H. and Ting, C.Y. (2011),"Turning knowledge management into
innovation in the high-tech industry", Industrial Management & Data Systems,
Vol. 112 No. 1, pp. 42-63.
Mercado-Kierkegaard, S. (2005), " Taking a sledgehammer to crack the nut: the EU
Enforcement Directive", Computer Law & Security Review, Vol. 21 No. 6, pp. 488-
495.Michel, N.J. (2006),"The impact of digital file sharing on the music industry:

an empirical analysis", The BE Journal of Economic Analysis & Policy, Vol. 6 No.
1, pp. 1-18.
Molteni, L. and Ordanini, A. (2003),"Consumption patterns, digital technology and
music downloading", Long Range Planning, Vol. 36 No. 4, pp. 389-406.
O'Cass, A, and Ngo, L.V. (2011),"Examining the firm's value creation process: a
managerial perspective of the firm's value offering strategy and performance",
British Journal of Management, Vol. 22 No. 4, pp. 646-71.
Osterwalder, A. and Pigneur, Y. (2010) Business Model Generation: A Handbook for
Visionaries, Game Changers, and Challengers, Wiley, New York.
Öztaysi, B., Sezgin, S. and Özok, A.F. (2011),"A measurement tool for customer
relationship management processes", Industrial Management & Data Systems, Vol.
111 No. 6, pp. 943-60.
Parry, G., Bustinza, O.F. and Vendrell-Herrero, F. (2012),"Servitisation and value co-
production in the UK music industry: an empirical study of consumer attitudes",
International Journal of Production Economics, Vol. 135 No. 1, pp. 320-32.
Peitz, M. and Waelbroeck, P. (2004),"The effect of internet piracy on CD sales: cross-
section evidence",Review of Economic Research on Copyright Issues, Vol. 1, pp.
71–9.
RIAA (2011), "What is online piracy?", available at:
http://www.riaa.com/physicalpiracy.php?content_selector=What-is-Online-Piracy
(accessed 19 January 2012).
Rob, R. and Waldfogel, J. (2004), "Piracy on the high C's: music downloading, sales
displacement, and social welfare in a sample of college students,working paper,
University of Pennsylvania, PA.
Siwek, S.E. (2007),"The true cost of sound recording piracy to the US economy",IPI
Centre For Technology Freedom, Institute for Policy Innovation, available at:
http://www.ipi.org/ipi%5CIPIPublications.nsf(accessed 25 April 2011)..
Sommer, R.A. (2003),"Business process flexibility: a driver for outsourcing", Industrial
Management & Data Systems, Vol. 103 No. 3, pp. 177-83.
Spain IIPA (2012), "Spain: International Intellectual Property Alliance (IIPA), special
301 report on copyright enforcement and protection, available at:
http://www.iipa.com/rbc/2012/2012SPEC301SPAIN.PDF (accessed 6 February
2012).
Teece, D.J. (2010),"Business models, business strategy and innovation", Long Range
Planning, Vol. 43 No. 2-3, pp. 172-94.
Vandermerwe, S. and Rada, J. (1988),"Servitization of business: adding value by adding
services", European Management Journal, Vol. 6 No. 4, pp. 314-24.

Vernik, D.A., Purohit, D. and Desai, P.S. (2011),"Music downloads and the flip side of
digital rights management", Marketing Science, Vol. 30 No. 6, pp. 1011-27.
Waldfogel, J. (2010), "Music file sharingand sales displacement in the iTunes era",
Information Economics and Policy, Vol. 22 No. 4, pp. 306-314.
Wirtz, B.W., Mathieu, A. and Schilke, O. (2007),"Strategy in high-velocity
environments", Long Range Planning, Vol. 40 No. 3, pp. 295-313.
Zentner, A. (2006),"Piracy and file sharing: measuring the effect of file sharing on
music purchases", Journal of Law & Economics, Vol. 49, pp. 63-681.
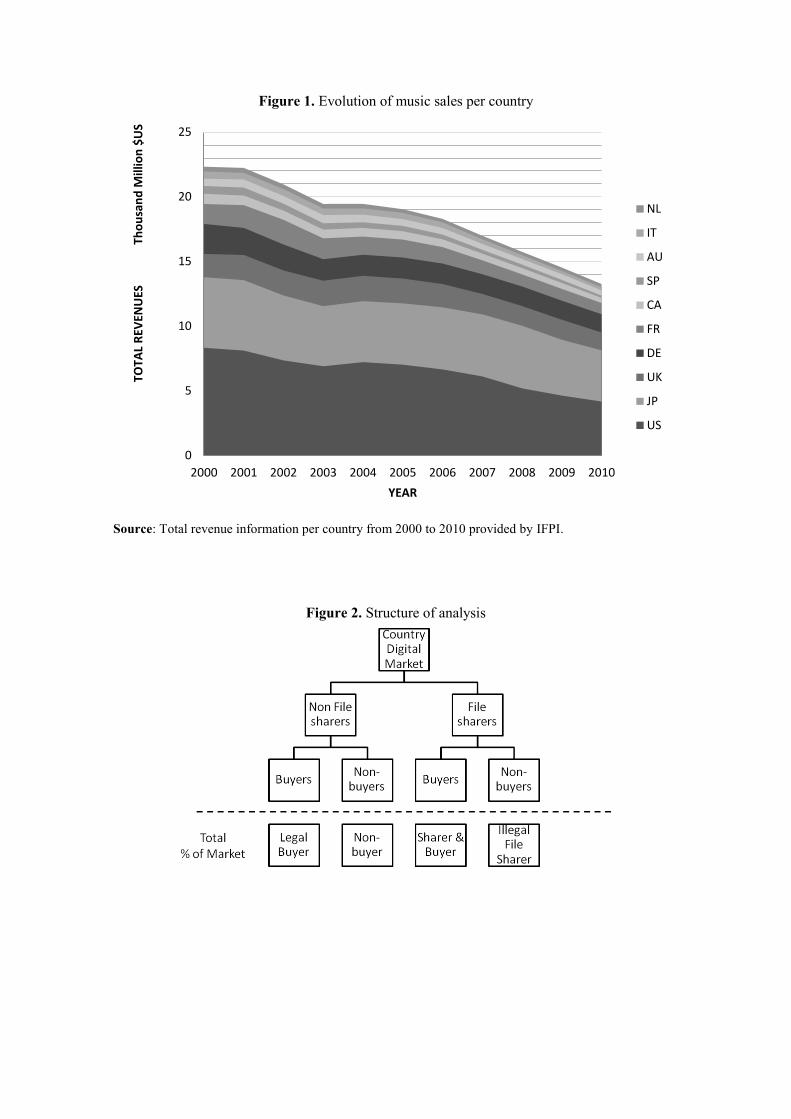
Figure 1. Evolution of music sales per country
Source: Total revenue information per country from 2000 to 2010 provided by IFPI.
Figure 2. Structure of analysis
0
5
10
15
20
25
2000 2001 2002 2003 2004 2005 2006 2007 2008 2009 2010
TOTA
L R
EVEN
UES
Th
ou
san
d M
illio
n $
US
YEAR
NL
IT
AU
SP
CA
FR
DE
UK
JP
US

Figure 3.1.1. File sharing challenge (Subsample)
Figure 3.1.2. File sharing challenge (Subsample) with legal origins
SP
US
GE FR
IT
JP
NL
UK
AU
CAN y = -60,146x + 31,737 R² = 0,5241
0 $
5 $
10 $
15 $
20 $
25 $
30 $
35 $
10% 15% 20% 25% 30% 35% 40% 45% 50%
REV
ENU
ES P
ER C
AP
ITA
% FILE SHARERS
SP
US
GE FR
IT
JP
NL
UK
AU
CAN y = -60,146x + 31,737 R² = 0,5241
0 $
5 $
10 $
15 $
20 $
25 $
30 $
35 $
10% 15% 20% 25% 30% 35% 40% 45% 50%
REV
ENU
ES P
ER C
AP
ITA
% FILE SHARERS
German Legal Origin
English Legal Origin
French Legal Origin
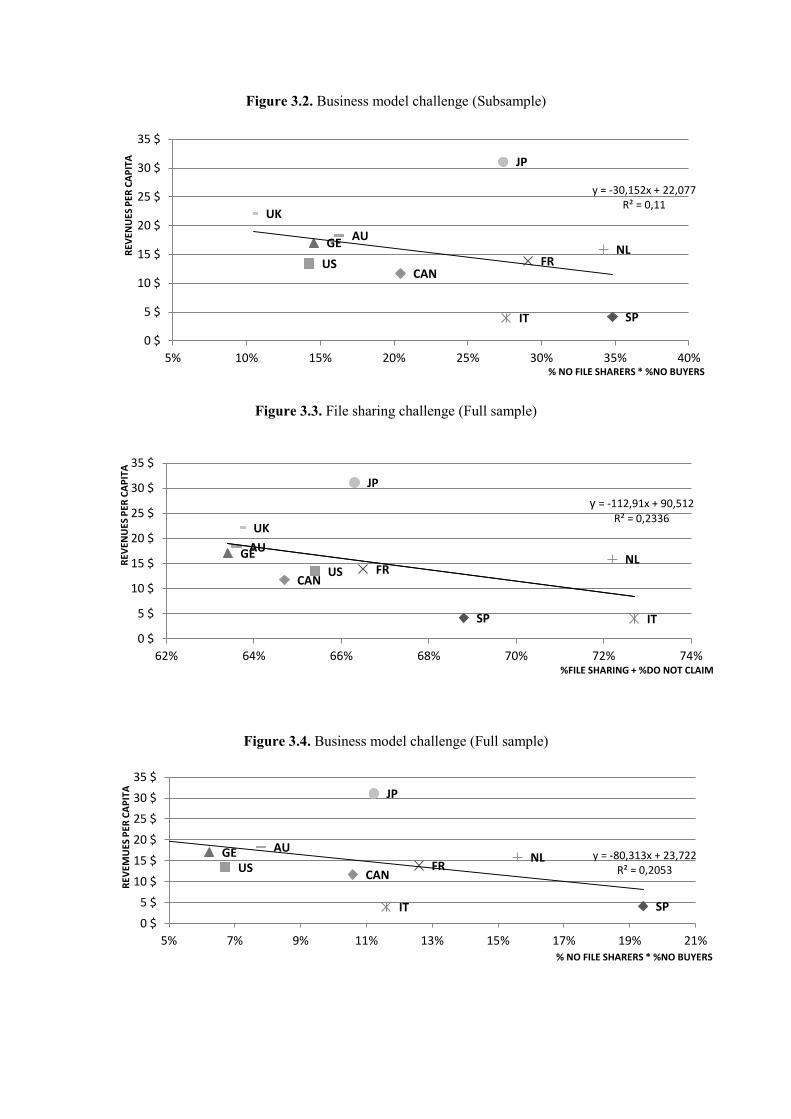
Figure 3.2. Business model challenge (Subsample)
Figure 3.3. File sharing challenge (Full sample)
Figure 3.4. Business model challenge (Full sample)
SP
US
GE
FR
IT
JP
NL
UK
AU
CAN
y = -30,152x + 22,077 R² = 0,11
0 $
5 $
10 $
15 $
20 $
25 $
30 $
35 $
5% 10% 15% 20% 25% 30% 35% 40%
REV
ENU
ES P
ER C
AP
ITA
% NO FILE SHARERS * %NO BUYERS
SP
US
GE FR
IT
JP
NL
UK
AU
CAN
y = -112,91x + 90,512
R² = 0,2336
0 $
5 $
10 $
15 $
20 $
25 $
30 $
35 $
62% 64% 66% 68% 70% 72% 74%
REV
ENU
ES P
ER C
AP
ITA
%FILE SHARING + %DO NOT CLAIM
SP
US GE
FR
IT
JP
NL AU
CAN
y = -80,313x + 23,722 R² = 0,2053
0 $
5 $
10 $
15 $
20 $
25 $
30 $
35 $
5% 7% 9% 11% 13% 15% 17% 19% 21%
REV
EMU
ES P
ER C
AP
ITA
% NO FILE SHARERS * %NO BUYERS
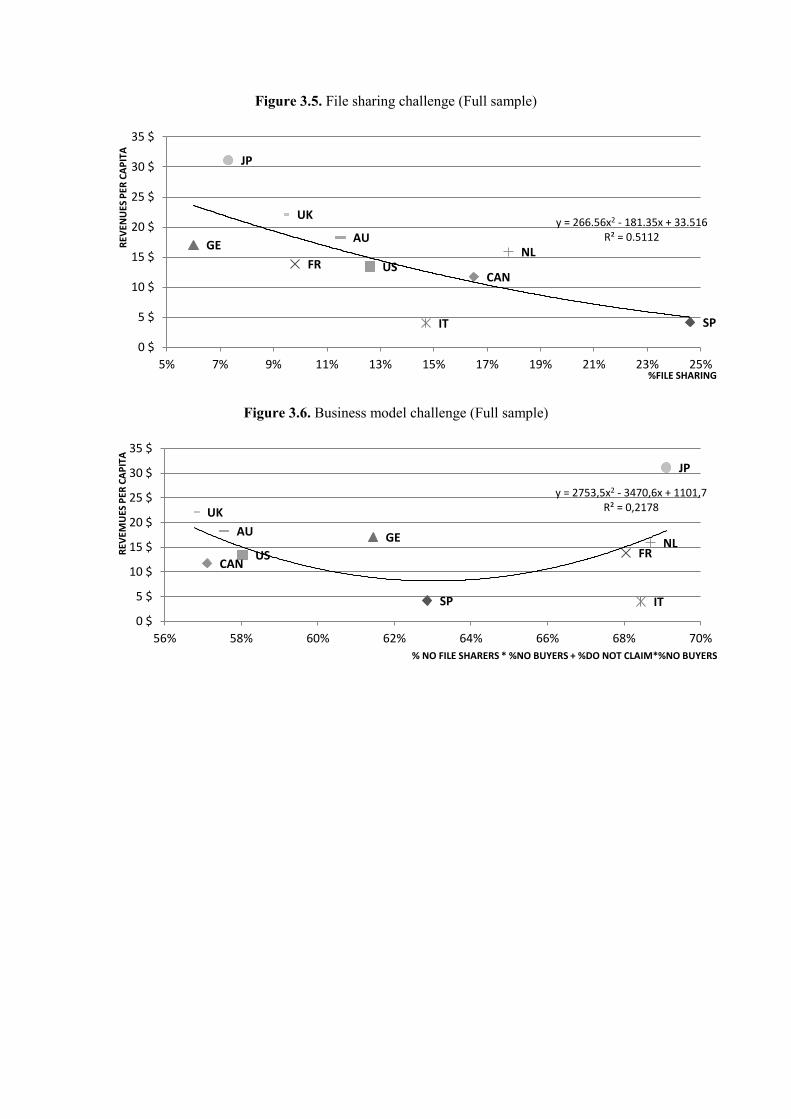
Figure 3.5. File sharing challenge (Full sample)
Figure 3.6. Business model challenge (Full sample)
SP
US
GE
FR
IT
JP
NL
UK
AU
CAN
y = 266.56x2 - 181.35x + 33.516 R² = 0.5112
0 $
5 $
10 $
15 $
20 $
25 $
30 $
35 $
5% 7% 9% 11% 13% 15% 17% 19% 21% 23% 25%
REV
ENU
ES P
ER C
AP
ITA
%FILE SHARING
SP
US
GE FR
IT
JP
NL
UK
AU
CAN
y = 2753,5x2 - 3470,6x + 1101,7 R² = 0,2178
0 $
5 $
10 $
15 $
20 $
25 $
30 $
35 $
56% 58% 60% 62% 64% 66% 68% 70%
REV
EMU
ES P
ER C
AP
ITA
% NO FILE SHARERS * %NO BUYERS + %DO NOT CLAIM*%NO BUYERS

Table 1. Estimations of the scale of music piracy
DIGITAL PIRACY
Peitz&Waelbroeck
(2004)
Period:
2001-2002*
Liebowitz
(2006)
Period:
2005**
Waldfogel
(2010)
Period:
2010***
IFPI
Period:
2011
Industry Data
Period:
2010
Spain 39% -- -- 45% 44%
Netherlands 40% -- -- -- 39%
Italy 46% -- -- -- 34.9%
Canada 44% -- -- -- 31.8%
US 40% 13% 48.6% -- 26.7%
Australia 37% -- -- -- 23.9%
France 34% -- -- -- 22.7%
UK 28% -- -- -- 20.5%
Japan 20% -- -- -- 17.7%
Germany 34% -- -- -- 14.1%
Total 38% -- -- -- 28.2%
*Martin Peitz & Patrick Waelbroeck 2004, Review of Economic Research on Copyright Issues, 2004, vol. 1(2), pp. 71-
79, Source: ifpi 2001-2002
**Liebowitz 2006, Source: Pew Internet Project, Source Usage over Time
***Waldfogel 2010, Source: Original survey of 517 students asked for the number of songs legally purchased or illegally
download out of 50 ex-ante selected popular songs. Of an average 14.83 songs owned 7.2 were illegally downloaded
Table 2. Digital sales; Business models vs. Piracy (Only respondents all survey)
Non-File Sharers File Sharers 71.8% 28.2% AGGREGATE Buyers Digital
68.6%
Non-Buyers Digital
31.4%
Buyers Digital
46.5%
Non-Buyers Digital
53.5% Observations: 20,550
Market total Legal Buyers
49.3%
Non-buyers
22.5%
Sharer & Buyer
13.1%
Illegal File Sharer
15.1%
Non-File Sharers File Sharers 56% 44% SPAIN Buyers Digital Non-Buyers Digital Buyers Digital Non-Buyers Digital Observations: 2,514 37.8% 62.2% 28.6% 71.4% Market total Legal Buyers Non-buyers Sharer & Buyer
Illegal File Sharer 21.2% 34.8% 12.6% 31.4%
Non-File Sharers File Sharers 61% 39% NETHERLANDS Buyers Digital Non-Buyers Digital Buyers Digital Non-Buyers Digital Observations: 1,388 43.9% 56.1% 29.2% 70.8% Market total Legal Buyers Non-buyers Sharer & Buyer
Illegal File Sharer 26.8% 34.2% 11.4% 27.6%
Non-File Sharers File Sharers 65.1% 34.9% ITALY Buyers Digital Non-Buyers Digital Buyers Digital Non-Buyers Digital Observations 2,119 57.6% 42.4% 39.4% 60.6% Market total Legal Buyers Non-buyers Sharer & Buyer
Illegal File Sharer

37.4% 27.6% 13.8% 21.2%
Non-File Sharers File Sharers 68.2% 31,8% CANADA Buyers Digital Non-Buyers Digital Buyers Digital Non-Buyers Digital Observations: 2,638 70% 30% 54.9% 45.1% Market total Legal Buyers Non-buyers Sharer & Buyer
Illegal File Sharer 47.7% 20.4% 17.5% 14.4%
Non-File Sharers File Sharers 73.3% 26.7% US Buyers Digital Non-Buyers Digital Buyers Digital Non-Buyers Digital Observations: 2,364 80.6% 19.4% 61.1% 38.9% Market total Legal Buyers Non-buyers Sharer & Buyer
Illegal File Sharer 59.1% 14.2% 16.3% 10.4%
Non-File Sharers File Sharers 76.1% 23.9% AUSTRALIA Buyers Digital Non-Buyers Digital Buyers Digital Non-Buyers Digital Observations:2,422 78.6% 21.4% 59.1% 40.9% Market total Legal Buyers Non-buyers Sharer & Buyer
Illegal File Sharer 59.8% 16.3% 14.1% 9.8%
Non-File Sharers File Sharers 77.3% 22.7% FRANCE Buyers Digital Non-Buyers Digital Buyers Digital Non-Buyers Digital Observations: 1,774 62.4% 37.6% 38.8% 61.2% Market total Legal Buyers Non-buyers Sharer & Buyer
Illegal File Sharer 48.2% 29.1% 8.8% 13.9%
Non-File Sharers File Sharers 79.5% 20.5% UK Buyers Digital Non-Buyers Digital Buyers Digital Non-Buyers Digital Observations: 2,021 86.9% 13.1% 68% 32% Market total Legal Buyers Non-buyers Sharer & Buyer
Illegal File Sharer 69% 10.4% 14% 6.6%
Non-File Sharers File Sharers 82.3% 17.7% JAPAN Buyers Digital Non-Buyers Digital Buyers Digital Non-Buyers Digital Observations: 1,682 66.7% 33.3% 56.7% 43.3% Market total Legal Buyers Non-buyers Sharer & Buyer
Illegal File Sharer 54.9% 27.4% 10% 7.7%
Non-File Sharers File Sharers 85.8% 14.2% GERMANY Buyers Digital Non-Buyers Digital Buyers Digital Non-Buyers Digital Observations: 1,628 83% 17% 54.6% 45.4% Market total Legal Buyers Non-buyers Sharer & Buyer
Illegal File Sharer 71.3% 14.6% 7.7% 6.4%
Table 3. Disentangling Non File Sharers - Non Digital Buyers
Country
Non File
Sharers - Non
Digital Buyers
Financially
Constrained Not Interested Buy Physical
Pure Business
Model Challenge
Spain 34.8% 2.9% 5.4% 5.6% 20.9%
Netherlands 34.2% 1.4% 11.2% 3.6% 18%
Italy 27.6% 1.6% 7.1% 5% 13.9%
Canada 20.4% 1.4% 5.6% 4.1% 9.3%
US 14.2% 0.5% 3.1% 2.9% 7.7%
Australia 16.3% 0.0% 4.1% 3.8% 8.4%
France 29.1% 2% 7.6% 6.6% 13%
UK 10.5% 0.4% 3.2% 2.6% 4.4%
Japan 27.4% 1.2% 10.1% 3.7% 12.4%
Germany 14.6% 0.6% 2.1% 4.2% 7.7%
Aggregate 22.5% 1.2% 5.7% 4.2% 11.4%

Table 4. Business models vs. Piracy (All respondents)
Non-File Sharers Don´t Respond File Sharers 33.4% 53.5% 13.1%
AGGREGATE Buyers Digital Non-Buyer Digital Buyers Digital Non-Buyer Digital Buyers Digital Non-Buyer Digital
Observations: 44,206
68.6% 31.4% 2.9% 97.1% 46.5% 53.5%
Market total Legal Buyers
Digital
Non-Buyers Buyers Digital No-Buyers Digital Buyers & Sharers Illegal File-Sharer
22.9% 10.5% 1.5% 52% 6,1% 7%
Non-File Sharers Don t́ Respond File Sharers
31.2% 44.2% 24.6%
SPAIN Buyers Digital Non-Buyer Digital Buyers Digital Non-Buyer Digital Buyers Digital Non-Buyer Digital
Observations: 4,509 37.8% 62.2% 1.7% 98.3% 28.5% 71.5%
Market total Legal Buyers
Digital
Non-Buyers Buyers Digital Non-Buyers
Digital
Buyers & Sharers Illegal File-Sharer
11.8% 19.4% 0.7% 43.5% 7% 17.6%
Non-File Sharers Don t́ Respond File Sharers
27.8% 54.4% 17.8%
NETHERLANDS Buyers Digital Non-Buyer Digital Buyers Digital Non-Buyer Digital Buyers Digital Non-Buyer Digital
Observations: 3,045 43.9% 56.1% 2.4% 97.6% 29.2% 70.8%
Market total Legal Buyers
Digital
Non-Buyers
Digital
Buyers Digital Non-Buyers
Digital
Buyers & Sharers Illegal File-Sharer
12.2% 15.6% 1.3% 53.1% 5.2% 12.6%
Non-File Sharers Don t́ Respond File Sharers
27.3% 58% 14.7%
ITALY Buyers Digital Non-Buyer Digital Buyers Digital Non-Buyer Digital Buyers Digital Non-Buyer Digital
Observations 5,045 57.5% 42.5% 2% 98% 39.4% 60.6%
Market total Legal Buyers
Digital
Non-Buyers Buyers Digital Non-Buyers
Digital
Buyers & Sharers Illegal File-Sharer
15.7% 11.6% 1.2% 56.8% 5.8% 8.9%
Non-File Sharers Don t́ Respond File Sharers
35.3% 48.2% 16.5%
CANADA Buyers Digital Non-Buyer Digital Buyers Digital Non-Buyer Digital Buyers Digital Non-Buyer Digital
Observations: 5,097 70% 30% 3.5% 96.5% 54.9% 45.1%
Market total Legal Buyers
Digital
Non-Buyers
Digital
Buyers Digital Non-Buyers
Digital
Buyers & Sharers Illegal File-Sharer
24.7% 10.6% 1.7% 46.5% 9.1% 7.4%
Non-File Sharers Don t́ Respond File Sharers
34.6% 52.8% 12.6%
US Buyers Digital Non-Buyer Digital Buyers Digital Non-Buyer Digital Buyers Digital Non-Buyer Digital
Observations: 5,008 80.6% 19.4% 2.8% 97.2% 61.1% 38.9%
Market total Legal Buyers
Digital
Non-Buyers Buyers Digital Non-Buyers
Digital
Buyers & Sharers Illegal File-Sharer
27.9% 6.7% 1.5% 51.3% 7.7% 4.9%
Non-File Sharers Don t́ Respond File Sharers
36.4% 52.1% 11.5%
AUSTRALIA Buyers Digital Non-Buyer Digital Buyers Digital Non-Buyer Digital Buyers Digital Non-Buyer Digital
Observations:5,065 78.6% 21.4% 4.5% 95.5% 59.1% 40.9%
Market total Legal Buyers
Digital
Non-Buyers
Digital
Buyers Digital Non-Buyers
Digital
Buyers & Sharers Illegal File-Sharer
28.6% 7.8% 2.3% 49.8% 6.8% 4.7%
Non-File Sharers Don t́ Respond File Sharers
33.5% 56.7% 9.8%
FRANCE Buyers Digital Non-Buyer Digital Buyers Digital Non-Buyer Digital Buyers Digital Non-Buyer Digital
Observations: 4,090 62.4% 37.6% 2.2% 97.8% 38.8% 61.2%
Market total Legal Buyers
Digital
Non-Buyers Buyers Digital Non-Buyers
Digital
Buyers & Sharers Illegal File-Sharer
20.9% 12.6% 1.3% 55.4% 3.8% 6%
Non-File Sharers Don t́ Respond File Sharers
36.3% 54.3% 9.4%
UK Buyers Digital Non-Buyer Digital Buyers Digital Non-Buyer Digital Buyers Digital Non-Buyer Digital
Observations: 4,420 86.9% 13.1% 4.2% 95.8% 68% 32%
Market total Legal Buyers
Digital
Non-Buyers
Digital
Buyers Digital Non-Buyers
Digital
Buyers & Sharers Illegal File-Sharer
31.5% 4.8% 2.3% 52% 6.4% 3%
Non-File Sharers Don t́ Respond File Sharers
33.7% 59% 7.3%
JAPAN Buyers Digital Non-Buyer Digital Buyers Digital Non-Buyer Digital Buyers Digital Non-Buyer Digital
Observations: 4,106 66.7% 33.3% 1.9% 98.1% 56.7% 43.3%
Market total Legal Buyers
Digital
Non-Buyers Buyers Digital Non-Buyers
Digital
Buyers & Sharers Illegal File-Sharer
22.5% 11.2% 1.1% 57.9% 4.1% 3.2%
Non-File Sharers Don t́ Respond File Sharers
36.6% 57.4% 6%
GERMANY Buyers Digital Non-BuyerDigital Buyers Digital Non-Buyer Digital Buyers Digital Non-Buyer Digital
Observations: 3,821 83% 17% 3.8% 96.2% 54.5% 45.5%
Market total Legal Buyers
Digital
Non-Buyers Buyers Digital Non-Buyers
Digital
Buyers & Sharers Illegal File-Sharer
30.4% 6.2% 2.2% 55.2% 3.3% 2.7%
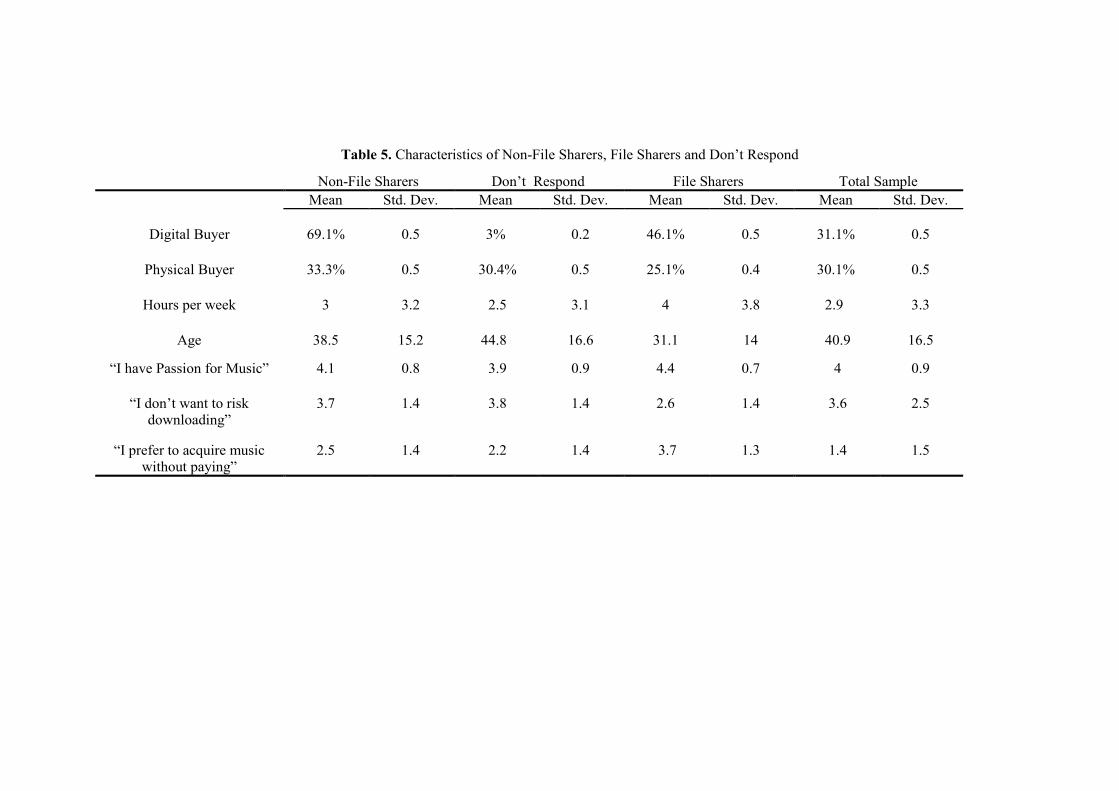
Table 5. Characteristics of Non-File Sharers, File Sharers and Don’t Respond
Non-File Sharers Don’t Respond File Sharers Total Sample
Mean Std. Dev. Mean Std. Dev. Mean Std. Dev. Mean Std. Dev.
Digital Buyer 69.1% 0.5 3% 0.2 46.1% 0.5 31.1% 0.5
Physical Buyer 33.3% 0.5 30.4% 0.5 25.1% 0.4 30.1% 0.5
Hours per week 3 3.2 2.5 3.1 4 3.8 2.9 3.3
Age 38.5 15.2 44.8 16.6 31.1 14 40.9 16.5
“I have Passion for Music” 4.1 0.8 3.9 0.9 4.4 0.7 4 0.9
“I don’t want to risk
downloading”
3.7 1.4 3.8 1.4 2.6 1.4 3.6 2.5
“I prefer to acquire music
without paying”
2.5 1.4 2.2 1.4 3.7 1.3 1.4 1.5