bvk ivdc 20-10-2009
TRANSCRIPT

8/8/2019 BVK IVDC 20-10-2009
http://slidepdf.com/reader/full/bvk-ivdc-20-10-2009 1/25

8/8/2019 BVK IVDC 20-10-2009
http://slidepdf.com/reader/full/bvk-ivdc-20-10-2009 2/25
N am e of Presentation | S pea ker | D ate | Pa ge 2
Talking about US Housingbubble since 2004

8/8/2019 BVK IVDC 20-10-2009
http://slidepdf.com/reader/full/bvk-ivdc-20-10-2009 3/25
- -H ou sing b ub ble | Ivan Va n de C loot | 2 0 1 0 2 00 9 | Pag e3
Exuberant expectations

8/8/2019 BVK IVDC 20-10-2009
http://slidepdf.com/reader/full/bvk-ivdc-20-10-2009 4/25
- -H ou sing b ub ble | Ivan Va n de C loot | 2 0 1 0 2 00 9 | Pag e4
Markets are not efficient
=bubbles exist
8/8/2019 BVK IVDC 20-10-2009
http://slidepdf.com/reader/full/bvk-ivdc-20-10-2009 5/25
5
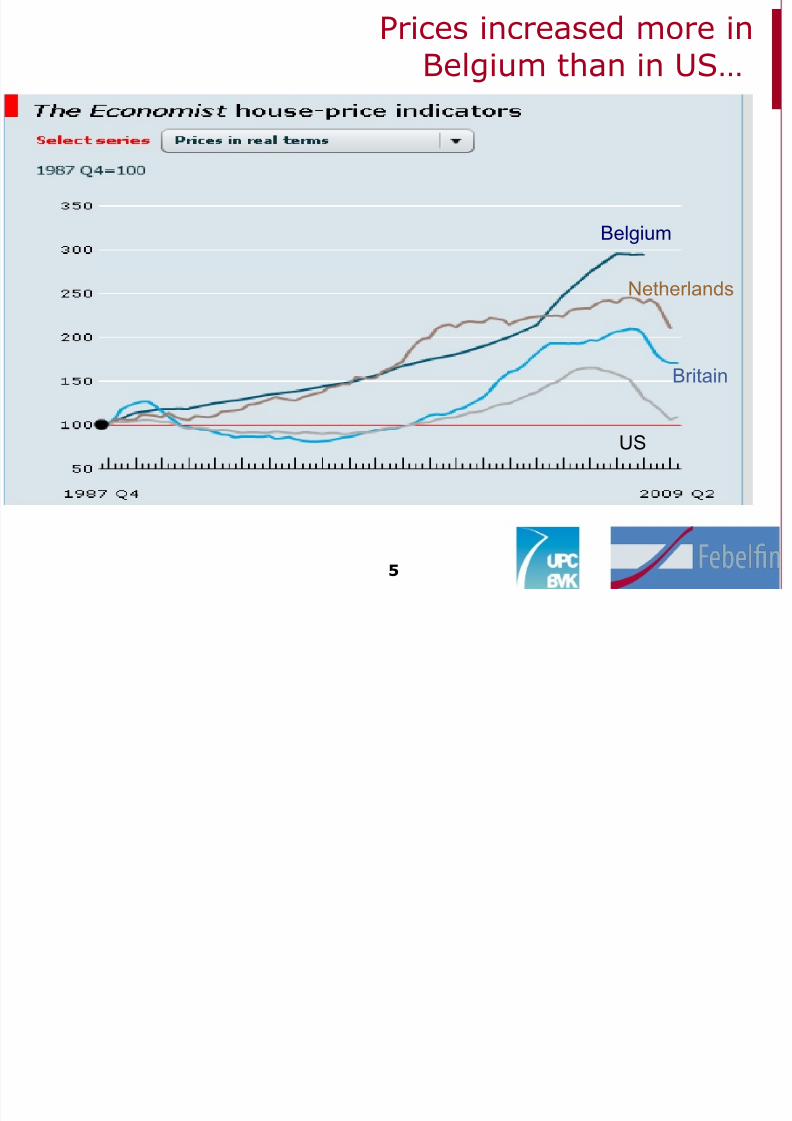
Prices increased more inBelgium than in US…
Belgium
Netherlands
US
Britain

8/8/2019 BVK IVDC 20-10-2009
http://slidepdf.com/reader/full/bvk-ivdc-20-10-2009 6/25
6
…much more in fact.

8/8/2019 BVK IVDC 20-10-2009
http://slidepdf.com/reader/full/bvk-ivdc-20-10-2009 7/257
House price-income ratioexploded in Belgium
Belgium
Netherlands
Britain
US
Japan

8/8/2019 BVK IVDC 20-10-2009
http://slidepdf.com/reader/full/bvk-ivdc-20-10-2009 8/258
Macro-econometric research: eg. IMF, ING
Asset-pricing approach: eg. OESO
Eventstudies: Helbling (BIS)- House price bubbles-a tale based on housing price booms and busts
Vector Autoregressive Models (VAR): eg. 1)
Christopher Otrok Marco E. Terrones: House Prices,
Interest Rates and Macroeconomic Fluctuations:International Evidence 2) World Economic Outlook
•
•
•
Fundamentals?

8/8/2019 BVK IVDC 20-10-2009
http://slidepdf.com/reader/full/bvk-ivdc-20-10-2009 9/25
- -Housing bubble | Ivan Van de Cloot | 20 10 2009 | Page9
Strong collateral?

8/8/2019 BVK IVDC 20-10-2009
http://slidepdf.com/reader/full/bvk-ivdc-20-10-2009 10/2510
Macroeconometric
research
nInteresting to look at “average reactions”
n= Bell Curve economics: won’t be able to detectbubbles
nEven this conservative research: overvaluation of Belgian real estate
IMF (2006): 17%
ING (2009): 16% probable, 44% if in line with previous
correction
n
8/8/2019 BVK IVDC 20-10-2009
http://slidepdf.com/reader/full/bvk-ivdc-20-10-2009 11/2511
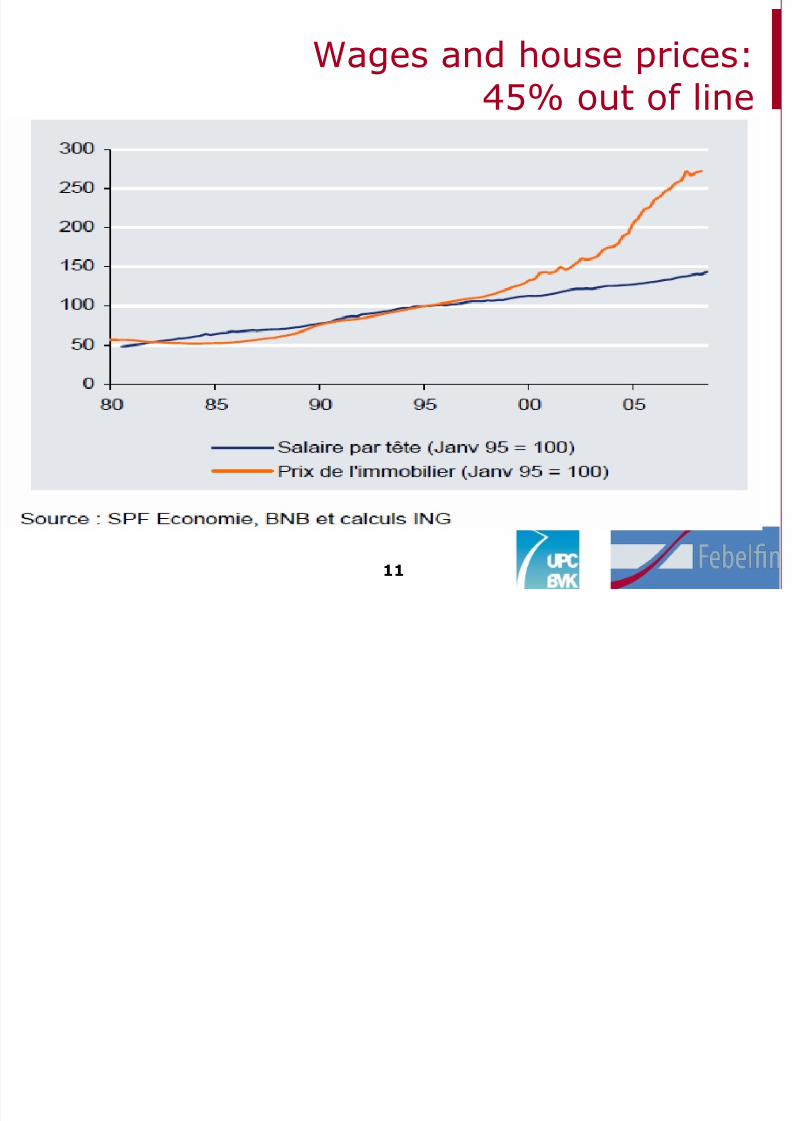
Wages and house prices:
45% out of line

8/8/2019 BVK IVDC 20-10-2009
http://slidepdf.com/reader/full/bvk-ivdc-20-10-2009 12/2512
IMF: Macroeconometric
study
-10
-5
0
5
10
15
20
25
30
35
I r e l a
n d
N e
t h e r l a n
d s
U K
A u s
t r a
l i a
F r a n
c e
N o r w
a y
D e n m a
r k
B e
l g i u
m
S p a
i n
S w e d e n
I t a l y
J a p
a n
U S A
F i n l a
n d
G e r m a
n y
C a n a
d a
A u s
t r i a

8/8/2019 BVK IVDC 20-10-2009
http://slidepdf.com/reader/full/bvk-ivdc-20-10-2009 13/25
13
Upward shock in realinterest rates
9

8/8/2019 BVK IVDC 20-10-2009
http://slidepdf.com/reader/full/bvk-ivdc-20-10-2009 14/25
14
Overvaluation measures sensitive
to choice of “equilibrium”
30 0%
40,0%

8/8/2019 BVK IVDC 20-10-2009
http://slidepdf.com/reader/full/bvk-ivdc-20-10-2009 15/25
15
Belgium is not cheap if corrected for bubbles
8/8/2019 BVK IVDC 20-10-2009
http://slidepdf.com/reader/full/bvk-ivdc-20-10-2009 16/25
- -Housing bubble | Ivan Van de Cloot | 20 10 2009 | Page16
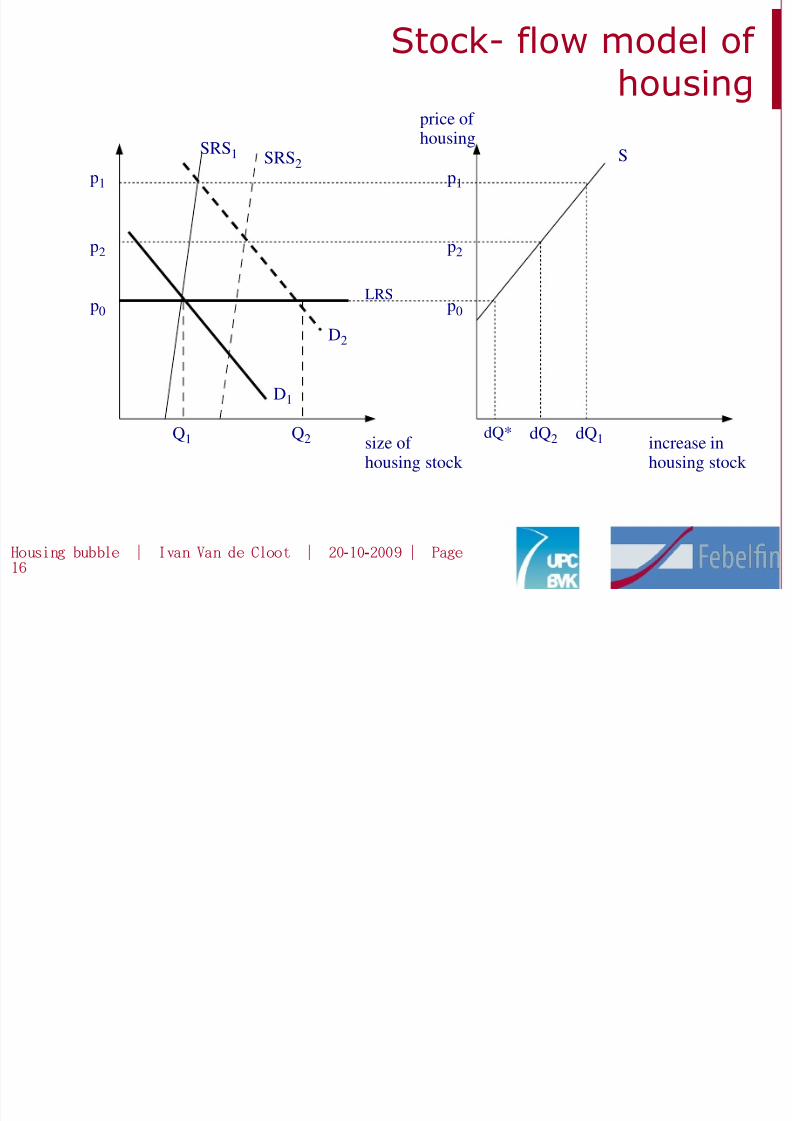
Stock- flow model of
housing
size of housing stock
increase inhousing stock
price of
housing
LRS
SRS1
D1
p0 p0
Q1 dQ*
S
D2
p1 p1
dQ1
SRS2
Q2
p2 p2
dQ2

8/8/2019 BVK IVDC 20-10-2009
http://slidepdf.com/reader/full/bvk-ivdc-20-10-2009 17/25
17
Dynamics
t0
P
Demand shock:overshooting
t0
P
Supply shock:undershooting

8/8/2019 BVK IVDC 20-10-2009
http://slidepdf.com/reader/full/bvk-ivdc-20-10-2009 18/25
18
Asset pricing approach:expectations matter

8/8/2019 BVK IVDC 20-10-2009
http://slidepdf.com/reader/full/bvk-ivdc-20-10-2009 19/25
19
OECD: Asset pricingapproach

8/8/2019 BVK IVDC 20-10-2009
http://slidepdf.com/reader/full/bvk-ivdc-20-10-2009 20/25
20
User cost of housing= P*(i+t+f-p)i=mortgage rate, t=tax, f= depreciation,
p=Expected capital gain
Equilibrium: rent=buy, E= P*(i+t+f-p) / = /(P E 1 i+t+f-p)So: as long as we come across exuberant
people, … (the market can stay irrationallonger than you can stay solvent, Keynes)
Expectations matter

8/8/2019 BVK IVDC 20-10-2009
http://slidepdf.com/reader/full/bvk-ivdc-20-10-2009 21/25
21
... It has been argued that the striking housing
price increases in some countries in recentyears were a response to the sharp decreasesin interest rates, as central banks eased theirmonetary policy stance during the downturn...Monetary policy tightening appears to have
played a role in triggering housing price bustsafter booms, as short-term rates typicallyincreased toward the end of a boom andremained high into the first year of a bust.
•
•
•
Helbling (BIS)-Event study

8/8/2019 BVK IVDC 20-10-2009
http://slidepdf.com/reader/full/bvk-ivdc-20-10-2009 22/25
22
Helbling (BIS)-Event study

8/8/2019 BVK IVDC 20-10-2009
http://slidepdf.com/reader/full/bvk-ivdc-20-10-2009 23/25
23
House Prices and Monetary
Policy: A Cross-Country Study,Federal Reserve
IMF World Economic Outlook

8/8/2019 BVK IVDC 20-10-2009
http://slidepdf.com/reader/full/bvk-ivdc-20-10-2009 24/25
24
“The dynamic factor model/FAVAR analysis
assumes that house prices are driven byfundamentals and is not designed to test forthe existence of potential bubbles.”
“In cases where house prices may have
exceeded fundamentals— which may includeAustralia, Ireland, Spain, and the UnitedKingdom-, there is a danger that higherinterest rates could trigger a much larger
downward adjustment in house prices, withconsiderably more severe consequences forreal activity.
•
•
•
IMF, World Economic Outlook,
September 2004

8/8/2019 BVK IVDC 20-10-2009
http://slidepdf.com/reader/full/bvk-ivdc-20-10-2009 25/25
- -Housing bubble | Ivan Van de Cloot | 20 10 2009 | Page25
Mortgage indebtness at
an all time high
90%
100%
Debt to disposable income