by elizabeth hund november 7, 2005 international opportunities
TRANSCRIPT

By Elizabeth Hund
November 7, 2005
International Opportunities

Rabobank International 2
Coöperatieve Centrale Raiffeisen-Boerenleenbank

Rabobank International 3
Rabobank
2005 ● Only AAA rated non-government bank
● 100 + years of agricultural/community banking experience
● 57,000 employees in 35 countries

Rabobank International 4
Rabobank International Network
Toronto Toronto
New YorkNew York
ChicagoChicago
AtlantaAtlanta
DallasDallas
San FranciscoSan Francisco
Washington Washington D.C.D.C.
Toronto Toronto
New YorkNew York
ChicagoChicago
AtlantaAtlanta
DallasDallas
San FranciscoSan Francisco
Washington Washington D.C.D.C.
Mexico CityMexico City
Curaçao Curaçao
São PauloSão Paulo
Santiago Santiago
Buenos AiresBuenos Aires
Mexico CityMexico City
Curaçao Curaçao
São PauloSão Paulo
Santiago Santiago
Buenos AiresBuenos Aires
LondonLondon
DublinDublin
AntwerpAntwerp
Frankfurt Frankfurt
ParisParis
MadridMadrid
MilanMilan
LondonLondon
DublinDublin
AntwerpAntwerp
Frankfurt Frankfurt
ParisParis
MadridMadrid
MilanMilan
Singapore Singapore
MumbaiMumbai
New DelhiNew Delhi
JakartaJakarta
BangkokBangkok
TaipeiTaipei
Hong Kong Hong Kong
BeijingBeijing
ShanghaiShanghai
TokyoTokyo
Singapore Singapore
MumbaiMumbai
New DelhiNew Delhi
JakartaJakarta
BangkokBangkok
TaipeiTaipei
Hong Kong Hong Kong
BeijingBeijing
ShanghaiShanghai
TokyoTokyo
SydneySydney
MelbourneMelbourne
BrisbaneBrisbane
PerthPerth
SydneySydney
MelbourneMelbourne
BrisbaneBrisbane
PerthPerth
Warsaw Warsaw
PoznanPoznan
MoscowMoscow
IstanbulIstanbul
Warsaw Warsaw
PoznanPoznan
MoscowMoscow
IstanbulIstanbul
AucklandAucklandAucklandAuckland

Rabobank International 5
The global FAR team has 74 members in 12 different countries
Utrecht (Global HQ)
Mumbai
Sydney
Mexico City
São Paulo
New YorkBeijing
Shanghai
Bangkok
Hong Kong
Tokyo
Singapore
New Delhi
Jakarta

Rabobank International 6
Rabobank Locations in the United States
Corporate BankRabobank NARabo AgriFinanceRabo AgServices

Rabobank International 7
Rabobank International
“The financial link in the global food chain”®

Rabobank International 8
Contents
Section 1:
Section 2:
Section 3:
Consumer Progression
Production Trends
International Opportunities

Section I
Consumer Progression
Setting the stage

Rabobank International 10
Key Drivers Behind Global Food Demand– Income and Total Population
AUSTRALIA
CANADA
JAPAN
US
CHINA
INDIA
EUROPE-25
EAST ASIA
MIDDLE EAST& NORTH AFRICA
SUBSAHARANAFRICA
0.0%
2.0%
4.0%
6.0%
8.0%
10.0%
-0.2% 0.2% 0.6% 1.0% 1.4% 1.8% 2.2% 2.6%
Population growth 2002 (annual %)
GD
P g
row
th 2
002
(an
nu
al %
)
SOUTHASIA
0%

Rabobank International 11
Asia is Key to Future Consumer Demand
China and India
• most populated countries
• highest annual GDP growth
Source: Rabobank analysis based on UN data
1.50.7
1.2
5.6
8.3
2.6
0
1
2
3
4
5
6
7
8
9
India China World
Per
cen
tag
e (%
)
Population GDP
Low income levels of those countries show enormous markets that are emerging.

Rabobank International 12
ChinaEconomic Superpower?
Source: United Nations, Rabobank
GDP Growth by Country/Bloc
-
2,000
4,000
6,000
8,000
10,000
12,000
14,000
16,000
18,000
20,000
US
Bln
s D
olla
rs (
1990
Pri
ces)
EU-25 United States China Japan India Asia-7
EU-25
USA
Japan China
India
Asia-7

Rabobank International 13
DemographicsWe are getting older!
Higher interest in functional foods
Require different serving sizes & packaging
In the western hemisphere, health becomes progressively more important.
Population aged 60+ years in selected regions 2000 - 2015
0
5
10
15
20
25
30
World Europe US and Canada Asia Latin America Africa
Per
cen
tag
e
2000 2010 2015
Source: Rabobank analysis based on UN data
%

Rabobank International 14
Industry Consolidation
Turnover of top-10 retailers
0
100
200
300
400
500
600
1998 2001
Tot
al s
ales
in U
SD b
illio
n
Turnover of top-10 food service
0
25
50
75
100
125
150
1998 2001
Tot
al s
ales
in U
SD b
illi
on
USD 473bn
USD 604bn
USD 106bn
USD 130bn

Rabobank International 15
Top Ten 2001 Ranked by total sales (in USD billion)Retailers
1. Wal-Mart Stores
218 2. Carrefour (France)
62 3. Ahold (Dutch)
60 4. Kroger
50 5. Metro AG(Germany)
44 6. Albertson’s
38 7. Safeway (US)
34 8. Leclerc* (France)
34 9. Auchan * (France)
3310. Intermarché*(France) 31*2000Total above
USD 605
Food Service 1. McDonald’s
41 2. Tricon
22 3. Compass (England)
13 4. Burger King
11 5. Sodexho Alliance(Fr.) 11 6. Wendy’s
8 7. Aramark
8 8. Accor (France)
7 9. Six Contintents (UK)
610. Whitbread (UK)
4
Total above
USD 131
GlobalizationMajor players have become huge global companies

Section II
Production Trends

Rabobank International 17
South America is poised to take over North America
as the world’s largest beef producing regionSource: FAO
05
101520253035
N.AM
ERICA
C.AM
&CARIBBEAN
S.AM
ERICA
W.E
UROPE
E.EUROPE
AFRIC
A
S.ASIA
&CHINA
S.E.A
SIA
OCEANIA
Pro
du
cti
on
(%
)
1970 1990 2003
World Beef Production

Rabobank International 18
China accounts for almost half of world pork production
Source: FAO
World Pork Production
0
10
20
30
40
50
Pro
duct
ion
(%)
1970 1990 2003

Rabobank International 19Source: FAO
World Poultry Production
05
10152025303540
Pro
du
ctio
n (%
)
1970 1990 2003
Poultry production has shifted from North America & Europe to South America &
Asia

Rabobank International 20
World Dairy Production
Source : CFCE / FAO/Rabobank
05
101520253035
N.AM
ERICA
C.AM
&CARIBBEAN
S.AM
ERICA
W.E
UROPE
E.EUROPE
AFRIC
A
S.ASIA
&CHINA
S.E.A
SIA
OCEANIA
Pro
du
cti
on
(%
)
1984 2001 2005
Developing regions are becoming more important for dairy production
Rabobank International 21
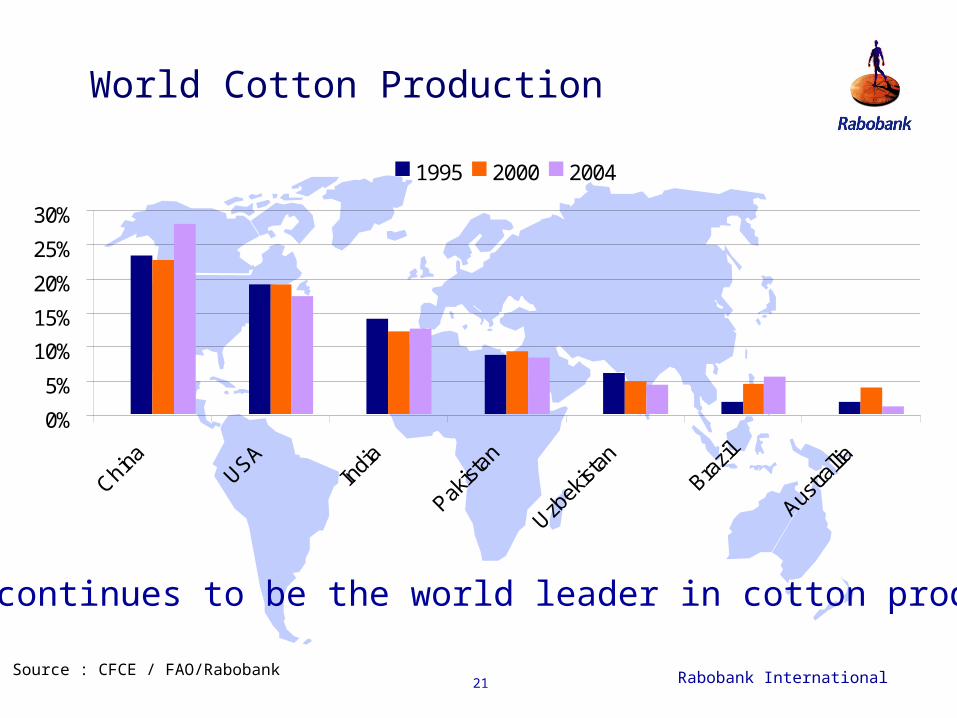
World Cotton Production
Source : CFCE / FAO/Rabobank
0%
5%
10%
15%
20%
25%
30%
China
USAIn
dia
Pakist
an
Uzbek
istan
Brazil
Austra
llia
1995 2000 2004
China continues to be the world leader in cotton production

Rabobank International 22
Consolidation of U.S. Farmers
Consolidation has been driven by:
1. Cost
2. Product sales advantages
3. Regulatory and policy considerations
U.S. Farm numbers and Gross income 1978-2002
1900
2000
2100
2200
2300
2400
2500
2600
1978 1982 1987 1992 1997 2002
Nu
mb
er
of
farm
s '0
00
0
50
100
150
200
250
300
Gro
ss
fa
rm in
co
me
$ b
illio
n
Farm numbers Gross farm income
Rabobank analysis based on US Census data

Rabobank International 23
Farmers are Moving!
Access to labor
Environmental regulations
Water availability– Shift in focus of crops
Market access and non tariff barriers
Rabobank International 24
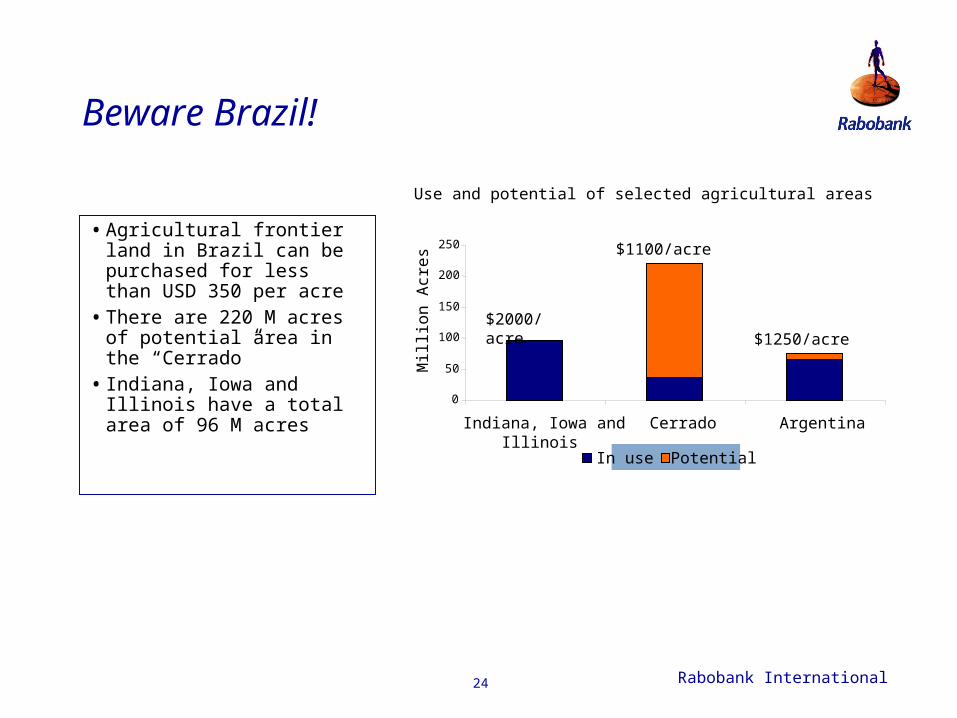
Beware Brazil!
•Agricultural frontier land in Brazil can be purchased for less than USD 350 per acre
•There are 220 M acres of potential area in the “Cerrado”
• Indiana, Iowa and Illinois have a total area of 96 M acres
Use and potential of selected agricultural areas
0
50
100
150
200
250
Indiana, Iowa andIllinois
Cerrado ArgentinaM
illio
n A
cre
s
In use Potential
$2000/acre
$1100/acre
$1250/acre

Section IIIInternational Opportunities

Rabobank International 26
Top 5 Exporters
1.United States 15.50%
2.Netherlands 10.60%
3.France 8.60%
4.Germany 7.40%
5.Canada 7.30%
% World Market Share in 2002

Rabobank International 27
Top 5 Growth Exporters
1. United States
2. Netherlands
3. France4. Germany5. Canada6. Belgium7. Spain8. Brazil9. Italy10.China
• The next 5 exporters are gaining
• U.S. is still the largest exporter but is consistently losing market share:
1990 = 18.2% of the world exports2002 = 15.5% of the world exports
• Australia and Argentina have been growing rapidly.
Top 10 Exporters (2002)

Rabobank International 28
ExportsWhat are they exporting?
Source: Rabobank analysis based on UN data
Top 6 Exports(USD 193.8 Billion)
Cereals, 15%
Meat, 21%
Beverages, 20%
Fruits & Nuts 14%
Fish & fish products
16%
Dairy, Eggs 14%

Rabobank International 29
U.S. Export Trends

Rabobank International 30
Don’t Forget Exchange Rates
Exchange rate index for selected currencies, 2000 - April 2005
70
80
90
100
110
120
130
140
Jan-00
Apr-00
Jul-00
Oct-00
Jan-01
Apr-01
Jul-01
Oct-01
Jan-02
Apr-02
Jul-02
Oct-02
Jan-03
Apr-03
Jul-03
Oct-03
Jan-04
Apr-04
Jul-04
Oct-04
Jan-05
Apr-05
Ind
ex
CAD EUR GBP AUD YEN

Rabobank International 31
Tools of the Trade
Political risk
Rule of law
Local financing

Rabobank International 32
Joint VenturesIf you can’t beat ‘em, join ‘em
Difficult but not impossible Loads of opportunities Key success factors are:
– Partner selection
– Careful structuring of the deal
– Cost control
– Attracting and retaining local talen
– Branding

Rabobank International 33
Summary
Consumer Progression– Income– Demographics– Trends
Production Trends– Consolidation– Globalization– New Major Players
Expansion of international trade