by george mungah ruirie d61/63047/2010
TRANSCRIPT

TF.RMINANTS OF GROWTH OF MANUFACTURING SMES IN KENYA: A CASE STUDY OF INDUSTRIAL AREA IN NAIROBI
BY
GEORGE MUNGAH RUIRIE D61/63047/2010
A RESEARCH PROJECT PRESENTED IN PARTIAL FULFILLMENT OF THE REQUIREMENTS FOR THE AWARD OF MASTER OF BUSINESS ADMINISTRATION
DEGREE, SCHOOL OF BUSINESS OF THE UNIVERSITY OF NAIROBI
OCTOBER, 2012

D E C L A R A T IO N
This research project is my original work und has not been presented to any university for any
award or anywhere else for academic purposes.
Signature Date
Name: George Mungoh Ruiric
D61/63047/2010
This project has been submitted for examination purposes with my approval as University
Supervisor.
Signature
Dr. Sifunjo KUaku
Department of Accounting and Finance
School of Business.
University of Nairobi
ii

DEDICATION
This study is dedicated to my loving parents. Mr. and Mrs. Ruiric and my brother Samuel Miti
Ruiric who continuously inspired me and supported my efforts throughout this study; he could
confirm every step throughout my study and encourage me. Thanks Brother.
m

ACKNOWLEDGEMENT
l wish to express my sincere appreciation to my supervisor. Dr. Sifunjo, for having agreed to
supervise this research paper, he has been a mentor to me. Without him the study would not have
been a success.
I would also like to express my sincere thanks to my family especially my dear parents. Mr. and
Mrs. Ruirie, for their love, understanding and support during the project.
iv

TABLE OF CONTENTS
DECLARATION— ................................ ........... iiDEDICATION................................................................................................................................iiiACKNOWLEDGEMENT..............................................................................................................ivUST OF TABLES.......................................................................................................................... ivLIST OF FIGURES........................................................................................................................ iv
CHAPTER ONE: INTRODUCTION..................................................;........................................ I1.1 Background of the study............................................................................................................ 11.1.1 Factors that Determine SMEs Growth....................................................................................21.2 Statement of the Problem...........................................................................................................41.3 Objective of the Study...............................................................................................................51.4 Value of the Study.....................................................................................................................S
CHAPTER TWO: LITERATURE REVIEW................................................................................ 62.1 Introduction............................................................................................................................... 62.2 Theories of the Growth of the Firm...........................................................................................62.2.1 Theory of the Growth of the Firm..........................................................................................62.2.2 Behavioral Theory of the Firm...............................................................................................82.2.3 Gihrat's I.aw on Growth of the Firm.......................................................................................92.2.4 Stochastic Firm Growth Theory........................................................................................... II2.3 Empirical Review.................................................................................................................... 122.4 Growth of Manufacturing Sector in Kenya.............................................................................132.5 Summary........................................................................................ :........................................ 16
CHAPTER THREE: RESEARCH METHODOLOGY............................................................... 173.1 Introduction.............................................................................................................................. 173.2 Research Design...................................................................................................................... 173.3 Population.............................................................................................................................. 173.4 Data and Data Collection......................................................................................................... 173.4.1 Data Reliability and Validity................................................................................................ 183.5 Data Analysis............................................................................................................................183.5.1 Conceptual Model................................................................................................................. 193.5.2 Analytical Model..................................................................................................................20
CHAPTER FOUR DATA: ANALYSIS, RESULTS AND DISCUSSION................................ 214.1 Introduction..............................................................................................................................214.2 Summary of Statistics..............................................................................................................214.2.1 Location of Business and Age of the Businesses.................................................................214.2.2 Source of Raw Materials......................................................................................................224.2.3Firm’s New Investments........................................................................................................234.2.4Borrowing Limit....................................................................................................................244.2.5 Financial Constraints............................................................................................................264.3 Regression Statistics..............................................................................................................294.4. Average SMEs Growth...................................................... ;..................................................32
v

4.5 Summury 33
CHAPTER FIVE: SUMMARY. CONCLUSIONS AND RECOMMENDATION.................... 345.1 Introduction........................................................................................... 345.2 Summary of key findings......................................................................................................... 345.3 Conclusions.............................................................................................................................. 355.4 Recommendations for Further Research.................................................................................37APPENDICES...............................................................................................................................42
LIST OF TABLESTable 1.1: European Commission Categorization of SME.............................................................1Toble.4.1: Location of Business....................................................................................................22Table.4.2: Age of Business............................................................................................................23Table 4.3: Source Of Finance........................................................................................................24Table 4.4: Frequency Table Of Factors Constraining Growth..................................................... 25Table 4.5: Regression Statistics.....................................................................................................29fable 4.6: Anova Table................................................................................................................. 30Table 4.7: Coefficient Matrix .......................................................................................................30
LIST OF FIGURESFigure 3.1: Conceptual Framework...............................................................................................19Figure 4.1: Source of Raw Materials.............................................................................................23Figure 4.2: Firm’s new Investments..............................................................................................24Figure 4.3: Borrowing Limit..........................................................................................................25Figure 4.4: Cause of Limitation................................................................................................... 26Figure 4.5: Percentage Frequency Polygon on Factors Constraining Growth............................. 27Figure 4.6 SMES Average Growth................................................................................................32
LIST OF ABBREVIATIONS
AGOA : African Growth and Opportunity Act AMT : Association for Manufacturing TechnologyANOVA : Analysis of varianceCBK : Central Bank of KenyaCOMESA : Common Market for Eustem and Southern Africa DOHS : Directorate of Occupational Health and SafetyEAC : Fast African CommunityFP7. : Export Processing ZonesEU : European UnionICT : Information and Communications TechnologyKAM : Kenya Association of ManufacturersLDC : Least Developed CountrySMEs : Small and Medium Term Enterprises
vi
a b s t r a c t
This research aims lo give an overview of determinants SMES growth in Kenya. The analysis
covers a period of five ycarsfrom 2006 to 2011. A range of approaches and results are discussed
within a unified framework; regression analysis was used to analyses the factors. To
comparatively examine the individual impact of ten “key factors” influencing business failure
within the small and medium-sized enterprises (SMEs) in Kenya; A surveyinstrument testing ten
key variables was developed and data was generated by conducting a census in industrial area.
Forty nine questionnaires were administered to manufacturing SMEs in industrial area to fill.
The results showed tlutt interest rates, dollar rate, fuel Cost, business skills and political
instability were the major factors found to influence SMEs growth into large business
enterprises. This study adopteda census of a small area due lo the short time frame for
conducting the study. The results of this study reveal that finance cost, manufacturing cost
factors and politicalstabilily are responsible for SMFsfailurcs in the Kenya hence more effort
needs to be focused in these areas.This study attempted to fill the gap in comparative studies on
factors influencing manufacturing SMEs failure inKenyu
via

CHAPTER ONE
INTRODUCTION1.1 Background of the study
Small and medium enterprises (SMEs) arefirms whose personnel numbers fall below certain
limits. The abbreviation "SME" is used in the European Union and by international organizations
such os the World Bank, the United Nations und the World Trade Organization (WTO).
European Union (2011) classified a business with a headcount of fewer than 250 employees as a
medium-sized; a business with a headcount of fewer than 50 employees is classified as small,
and a business with a headcount of fewer than 10 employees is considered microbusiness. The
European system also takes into account a business’s turnover rate and its balance sheet. These
ceilings apply to the figures for individual linns only. A firm, which is part of larger grouping,
may need to include employcc/tumover/balance sheet data from that grouping too as tabulated
below.
Table 1.1: European Commission Categorization of SMEs
Company category Employees Turnover or Balance sheet total
Medium-sized <250 < € 50 m < € 43 m
Small <50 <€ 10m < € 10 m
Micro < 10 <€ 2 m < € 2 m
Source (European commission, 2011)
According to Investopedia (2009).growth of any business depends largely on it’s financial
performance. Financial performance is a subjective measure of how well a firm can use assets
from its primary mode of business and generate revenues. This term is also used as a general
measure of a firm's overall financial health over a given period o f time, and can be used to
compare similar firms across the same industry or to compare industries or sectors in
aggregation.
Ihere are many different ways to measure financial performance, but all measures should be
luken in aggregation. Line items such as revenue from operations, operating income or cash flow
from operations can be used, as well as total unit sales (Investopedia. 2009). Furthermore, the
l

analyst or investor may wish to look deeper into financial statements and seek out margin growth
rates or any declining debt.
According to Churchill and Lewis (1983) any firm whose business generates significant positive
cash flows or earnings, which increase at significantly faster rates than the overall economy is
growing. A growth oriented company tends to have very profitable reinvestment opportunities
for its own retained earnings. Thus, it typically pays little to no dividends to stockholders, opting
instead to plow most or all of its profits back into its expanding business to lap the investment
opportunities.
Koech (2011) observed that in practice, sales growth is also easier to measure compared with
some other indices and is much more likely to be recorded. Sales are a good indicator of size
and. therefore, growth. Sales may also be considered a precise indicator of how a firm is
competing relative to their market.
1.1.1 Factors that DctcrmincS.MKs Growth
It is generally recognized that SMFs face unique issues which affect their financial performance,
hence diminish their ability to contribute effectively to sustainable growth (Rohai,2006). There
are those factors that are common to all SMFs and those that are unique to Manufacturing SMFs.
These factors can be broadly classified in four, manufacturing sector context;financial costs
factors, manufacturing cost factors, manufacturing efficiency factors and others (political
instability und government policies).
Financial costs factors arc factor that increases the finance cost of afirm; these factors are interest
rales andcollateral for loan. Interest rate is a fee charged as a percentage of the total amount
borrowed from a financial institution.
According to Mworia (2011), the increasing borrowing rates for the last few months have been
incredible and unprecedented and pose a grave risk to the momentum of Kenya’s industrial
growth. According to (CBK.2012). most banks interest rate are above 22% per annum an
2

increase by over 60% from the year 2010.This can result to decline in borrowing to finance
investments through loan by the firms.
According to Wisegcck (2002). collateral is an asset where in exchange the creditor may sell that
which is offered for collateral if the loan is unpaid. Some firms may have no collateral to secure
a loan especially microbusincsscs, this may result to slow growth as a result of lack of funds to
finance desired investments.
Manufacturing costs factors includes; cost o f energy (electricity), raw materials, cost o f fuel and
exchange rates.
Increasing electricity cost increase the manufacturing cost and as a result reduce the profitability
of a firm. Economists and manufacturers have expressed concern that the increase in cost of
electricity is bound to push up the cost of production, dampen economic growth prospects and
make Kenya an uncompetitive investment destination (Aron. 2012).
Another major expense incurred in manufacturing sector is the purchase of fuel used to power its
machines and transport it’s products. Increase in fuel prices results to an increase in
manufacturing cost, these costs are transferred to the final consumer by increase in price of the
productlcading to reduction in sales volumes as the products becomes less competitive hence
decline in performance. Manufacturers depend on outside suppliers for the raw materials used in
the business. Any significant decrease in supplies, any increase in costs or a greater increase in%
delivery costs for these materials could result in a decrease in profit margins, which could harm
financial performance (Wisegeek, 2002).
A foreign currency exchange rate is the amounts of one currency required to purchase or sell
another currency. For the manufacturing industries which rely on importation of raw material,
they are constrained to grow when the shilling is weaker to the dollar as the raw materials will be
more expensive. This will result to increase in price of the product. A rise in the price of
manufactured goods will often translate into fewer sales, and can often cut into the profits of
manufacturing companies hurting the industry growth (KAM. 2012
3

Manufacturing efficiency is determined by how well a firm embraces technology und the
required skills and competence in operation of a business, the factors associated to efficiency are
technology and skilled labour.
Technology is a broad term that refers to both artifacts created by humans, such as machines, and
the methods used to create those artifacts (AMT. 2011). ICT is key to every firm today; if a firm
is not computerized as may be the case of SMRs.it's financial performance will be affected as
result of inefficiency in manual operations. Those firms than embrace the latest technology grow
rapidly as opposed to firms resistant to change.
According toWanjohi (2009), inadequate business skills affect the performance of business as
the investment decision may not be viable because decision makers arc not skilled .When
machines arc operated by inexperienced workers a lot of waste during production may be
realized and low output per worker may be low. The firm may fail to completed customers orders
as are result of its internal inefficiencies hence reducing its confidence in customers; this can
result to reduction of its market share hence declined growth.
1.2 Statement of the Problem
The subject of financial performance has received significant attention from scholurs in the
various arcus of finance and strategic management. It has also been the primary concern of
business practitioners in all types of organizations since financial performance has
animplieations to organization’s health and ultimately it'sgrowlh. High performance reflects
management clTcctiveness and efficiency in making use of company’s resources and this in turn
contributes to the country’s economy at large (Nuscr, and Mokhtar. 2004). Prior research by
(Robai, 2006),(Koech. 2011). (Clawale and Garwe. 2010) and (Khang'ati, 2011) focused
onfactors inhibiting SMEs growth in a general perspective but did not focus more on
manufacturing sector which is key to Kenya.
According to Vision 2030. Kenya will shift from agricultural economy to industrial economy by
year 2030. After several technological revolutions, the industrial sector has gained weight in
national production. However, there is a gap as the literature on firm growth has not evolved at
4

the same speed, sometimes for lack of information or interest and the number of studies of
manufacturing sector has not matched their economic development. In fact, it is important to
note the lack of empirical studies related to the manufacturing sector.
rhis study aimed to fill the gaps by conducting comprehensive research including more factors
affecting SMFs performance. The study focuscdon manufacturing sector which is critical to
Kenya asit is looking forward to become newly industrialized country by year 2030. In this area
few studies have been conducted. In filling the research gaps identified, this study answered the
following research question; what arc the basic factors that determinegrowth of manufacturing
SMEs in Kenya? The expected result of the study was a strong correlation between financial
factors and manufacturing SMEs growth.
1.3 Objective of the Study
Objective w as to analyze factors that determines growth of manufacturing SMEs in Kenya
1.4 Value of the Study
llie study will be of significance in the following w-ays:
The SMEs will find this research useful for they are interested in growth to large companies. The
research findings on determinants of growth in manufacturing sector will be useful to the
management of SMFs to deal with factors hindering firm's performance.
The government of Kenya will benefits from the findings and can utilize the results to promote
growth of manufacturing sector to rcalizevision 2030. In order to be newly industrialized by
2030 a country needs to deal will the hindranceof growth, this study will be of help to policy
makers to formulate policies to promote growth of small businesses.
Scholars will find this research useful as it will provide a contribution to the scholarly dialogue
concerning manufacturing SMEs in I.DC like Kenya. This will be important to such future
researchers who may want to use the findings of this research as a basis for advancing their
arguments.
5

CHAPTER TWO
LITERATURE REVIEW
2.1 Introduction
jhis chapter will explore the literature that is relevant to understanding the development of. and
interpreting the results of this study. Since this study focus on SMIis growth, the literature
review will focus on theories of growth of the firm in details in section two of the chapter. The
section will summarize the assumptions and major findings of the theories of growth, empirical
review of prior studies will he covered in section three. The research topic focuses on
manufacturing sector in Kenya, for better understanding of the study section four coversgrowth
of manufacturing Sector in Kenya.
2.2 Theories of the Growth of the Firm
This wide range of determinants of growth is represented by several theories. These different
theories are the result of the relevance of the topic and the difficulty in analysing it (Correa,
1999). The main schools of thought can he divided into four groups: (i) classical economists: (ii)
behaviourist economists, who emphasis the role of managers on increases in firm size; iii)
stochastic theory, which assumes that firm growth follows a stochastic process; and (iv). models
of learning and selection, which arc linked to the stochastic firm growth theory.
2.2.1 Theory of the Grow th of the Firm
Theory of the Growth of the Firm byPenrose (1959) employs the resource based view. The
theory differentiated between resources and the services they render. Resources can provide a
variety of productive services. In turn, the provision of these services can modify the attributes of
the resources and enable the provision of new services. In this sense, the firm is considered as a
collection of productive resources the disposal of which between different uses and over time is
determined by administrative decisions (Penrose. 1959). The fact that there is heterogeneity
rather than homogeneity of both human and material productive services implies that firms arc
unique.
6

In the years post-1992 Penrose’s contribution nnd the resource based view have acquired
significant recognition, arguably challenging transaction costs, as the leading economics-based
theory of the firm. For Penrose (1959), moreover, one cannot even start analysing the external
environment of the firm (to include the market) without a prior understanding of the nature of the
firm, which is its human and non-human resources, and their interaction. In theory of growth of
die firm emphasis is on the internal resources of the firm and it is at the organisation as a whole
that we must look to discover the reasons for its growth.
Motivation to innovation according to Penrose, focus is on the analysis of the expansion of the
innovating multi-product, flesh and blood, organisations that businessmen call firms, not on
optimal pricc/output equilibrium of neo-classical theory. Such firms consist of human and non
human resources, under administrative authoritative co-ordination and communication. Human,
and especially managerial, resources are most important. Resources cun provide multiple
services. Finns use their resources to perform activities that result in products for sale in the
market for a profit. Firms differ from markets, their boundaries defined by the reach of
authoritative co-ordination and communication.
For reasons related to resource indivisibility and the balance of processes, firms always have
excess resources. Importantly, moreover, the very performance of activities within firms creates
new knowledge through specialisation, division of labour, resource-combination, teamwork and
learning. This reduces the time required for the implementation of current activities, thus
generating further excess recourses, which urc not fully utilized ut any given point in time.
According to theory on the dynamics of early firm growth, very new firms urc subject to high
infant mortality and their survival chances increase as they age. while for a whole cohort of
firms, the proportion continuing to grow falls over time us events take their course. Theory und
evidence suggest that no more than half of a cohort of new firms will grow to the point of
achieving self-sufficiency, at most a quarter will expand beyond the plateau stage, and among
these, few will be unable to sustain their growth performance or recover from reversal following
early expansion. It is to be expected that under five percent of the cohort will experience the
sustained growth amplification effects required if they arc to become major players in their
7

industry (Storey. 1994). Nevertheless, surviving firms may grow sufficiently to capture
increasing market share (Baldwin, 1995).
2.2.2 Behavioral Thcoryof the Firm
According to Cycrt and March (1963) in order to understand contemporary economic decision
making. we need to supplement the study of market factors with an explanation of the internal
operation of the firm. The theory summarizes the three core ideas of behavior of the growth of
the firm to be; those bounded rationality, imperfect environmental matching and unresolved
conflict.
Bounded rationality refers to limitations of information and calculation. It implies the need to set
targets and try to satisfy these, as opposed to optimising the best imaginable solution. Firms
attend to goals sequentially, and follow ‘rules of thumb’ and ‘standard operating procedures'.
Imperfect environmental matching suggests that human agency is not uniquely determined by an
exogenously given structure. Accordingly, history matters, pointing to the importance of
organisational adaptation. Unresolved conflict is bused on the assumption that in organisations
there exist multiple actors, with potentially conflicting interests, that arc not entirely alleviated
by contracts. Instead, individual and sub-group interests are continuously renegotiated, with
consistency being hard to obtain and sustain.
Important insights in behavioral theory of the firm, among many, concern ‘organisational slack’,
learning and innovation. ‘Organisational slack’ refers to the difference between the resources
required to maintain an organisation and the resources received by a coalition within the
organisation.
Concerning learning and innovation, behavioral theory of the firm attaches significance to the
concept of problcmistic search. Search can be induced by problems, and lead to the finding of
solutions, inviting the prediction that relatively unsuccessful firms would be more likely to
innovate than relatively successful firms.
8

phis prediction. Cycrt and March observed, was not supported by available evidence at the time.
A possible solution to this problem of the theory was to reconsider ‘slack’. By providing a source
cf funds, ‘slack’ could enable innovation. As ‘slack’ is normally present in successful firms, the
latter would also be expected to innovate. Both ‘problem-orientated innovation’ and ‘slack
innovation’ may therefore exist, the former being most justifiable in the short run. and linked
directly to a problem, while the luttcr in the longer run. and related to major organisational
problems.
Phe idea and role of imperfect environmental matching and productive opportunity according to
this theory the modem firm has control of the market; it has discretion within the market; it sees
the market through un organisational filter. Discretion over the market implies on interaction
between external and internal. Productive opportunity of firms refers to the dynamic interaction
between the perceived by management internal and external environments.
Unresolved conflict is based on the assumption that in organisations there exist multiple actors,
with potentially conflicting interests, that are not entirely alleviated by contracts. Instead,
individual and sub-group interests rue continuously re-negotiated, with consistency being hard to
obtain and sustain.
2.2J Gibrnt's Law on Growth of the Firm
Gibrat (1931) suggested that there is no relationship between the size of a firm and its growth.
This is known as Gibrat’s Law or the l,aw of Proportionate Effect In fact, firm growth is the
result of a multiplicative process that affects the initial size. The factors that can affect firm
growth relate not only to the firm, but also to its environment.
The main consequences of Gibrat’s Law are as follows (Sutton, 1997): There is no optimum size
to which firms will converge, the likelihood of growth is independent of initial size, so expected
growih and its variability arc the same for all firms, past growth docs not affect current growth
since there is no serial correlation (both between firms and over time), firm size dispersion
increases over time, so market concentration is higher if the number of firms remuins constant
9

nnd the variance of firm growth rates is equal for all sizes. This means that the variance of firm
growth rates for small firms is equal to the variance of firm growth rotes for large firms.
*n other words. Gibrat's Law postulates that the “probability that the next opportunity is taken up
by particular active firm is proportional to the current size of the firm” (Sutton, 1997).
Ihe law of proportionate growth gives rise to a distribution that is log-normal.Gibrat's law is also
applied to cities size and growth rate, where proportionate growth process may give rise to a
distribution of city sizes that is log-normal, as predicted by Gibrat's law. While the city size
distribution is often associated with Zipfs law, this holds only in the upper tail, because
empirically the tail of a log-normal distribution cannot be distinguished from Zipfs law. A study
using administrative boundaries (places) to define cities finds that the entire distribution of cities,
not just the largest ones, is log-normal.
However, it has been argued that it is problematic to define cities through their arbitrary legal
boundaries (the places method treats Cambridge and Boston. Massachusetts, as two separate
units). A clustering method to construct cities from the bottom up by clustering populated areas
obtained from high-resolution data finds a power-law distribution of city size consistent with
Zipfs law in almost the entire range of sizes. Note that populated areas arc still aggregated rather
than individual based. A new method based on individual street nodes for the clustering processu
lends to the concept of natural cities. It has been found that natural cities exhibit a striking Zipfs
law. Furthermore, the clustering method allows for a direct assessment of Gibrat's law. It is
found that the growth of agglomerations is not consistent with Gihrat’s law: the mean and
standard deviation of the growth rales of cities follows a power-law with the city size.
In general, processes characterized by Gibrat's law converge to a limiting distribution, which
may be log-normal or powrer law, depending on more specific assumptions about the stochastic
growth process.
In the study of the firms (business), the scholars do not agree that the foundation and the
outcome of Gibrat's law are empirically correct.
10

2.2.4 Stochastic Firm Growth Theory
More recently, the learning theory has appeared in the economic literature. Geroski (1995)
emphasized that firm growth and survival depend on a firm’s capacity to Icam. Empirical
evidence shows that the survival and post-entry performance of new firms depends on their
capacity to adapt to the environment und upply the correct strategies. The learning and selection
approach emphasizes the ability of firms to Icam, their capacity for innovation and sectorial
features. There are several outstanding models of the learning and selection processes. These
include those of Jovanovic (1982), Ericson and Fakes (1995) and Pakes and Ericson (1998). The
muin characteristics of these models are the fact that they take into account the dynamics of firms
and their level of efficiency, which determine their chances to survive.
Jovanovic (1982) provided a model in which firms do not know their level of efficiency until
they enter the market. This learning process is called a Bayesian or passive learning process.
Once in the market, the most efficient firms grow faster until they reach a minimum efficient
size. Inefficient firms disappear with the course of time. This is the Theory of “noisy" selection.
These types of model introduce variables such as age to measure this ability of a firm to leam its
economic efficiency.
Specifically, firms are created with a number of workers and are affected by n reductive shock,
[he distribution of the probability of profits is unknown at the initial moment and does not vary
with lime.
The main result is that firms whose size is inferior to the minimum efficient size do not accept
Gibrat’s Law. If these small firms survive, they will increase their size. However, for firms
above the minimum efficient scale (MLS). Gibrat’s Law is accepted. Jovanovic (1982) therefore
models the heterogeneous behaviour of firm growths depending on firm size and their level of
efficiency.
Ericson and Pakes (1995) and Pakes and Ericson (1998). on the other hand, presented an active
learning process in which firms not only know their efficiency level when they participate in the
market but can also can modify it through investment. During each period of time, firms Ericson
II

and Fakes (1995) and Pakes and F.ricson (1998). on the other hand, presented an active learning
process in which firms not only know their efficiency level when they participate in the market
but can also can modify it through investment. During each period, firms decide whether to
continue in the market or to leave it, depending on both their own und their competitors’
investment.
2.3 Empirical Review
A study by (Kocch. 2011) examined the financial factors affecting growth of SMEs in Kenya,
she found out that Small und Medium Enterprise (SME) Sector has continued to play an
important role in the Kenyan economy. The sector’s contribution to the Gross Domestic Product
(GDP) has increased from 13.8 per cent in 1993 to about 20 per cent in 2007. Many
entrepreneurs have limited ways to grow their business into large enterprises. There arc many to
constraints hindering their growth , so it is important for an entrepreneur to fully understand all
financial constraints.The study involved a survey of the financial constraints hindering growth of
SME’s : a ease study of Kamukunji District. Descriptive research design was applied with
questionnaires as the main instrument of data collection from the 100 Small and Medium
Enterprises within Kamukunji District. According to (Kocch 2011), sales data are usually readily
available und business owners themselves attach high importance to sales as an indicator of
business performance. In addition, sales growth is also easier to measure compared with some
other indices and is much more likely to be recorded. Sales may also be considered a precise
indicator of how a firm is competing relative to their market (Barringer et al., 2005).
A study by Yuanyi. (2011) found out that, theoretical models of financial institution theory
predict that firm access to credit depends onfinuncial market structure. But empirical studies
ofi'er mixed results. Some studies find that highcrconccntration is associated with higher credit
availability consistent with the information hypothesis that lesscompetitive banks have more
incentive to invest in sofi information. Ollier empirical studies, however, iindsupports for the
competitive financial market hypothesis that credit can be easily got in competitive creditmarket.
Ihe paper choosing China's financial market os a research sample, studies on the
rclationshipbctween financial market structure and SME’s financial constraint in China. The
12

fcsttlt shows that when moreSME banks were built up in China’s financial market and more
foreign banks were allowed to open busincssin China, SME’s are easier to get credit.
Lee (2008) examined the effect of equity ownership structure on firm financial performance in
South Korea. It focused on the role o f two main dimensions of the ownership structure:
Ownership concentration (i.e.. the distribution of shares owned by majority shareholders) and
identity of owners (especially, foreign investors and institutional investors). Using panel data for
South Korea in 2000-2006. the study found that firm performance measured by the accounting
rate of return on assets generally improved as ownership concentration increases, but the effects
of foreign ownership and institutional ownership arc insignificant. The study also found that
there exists a hump-shuped relationship between ownership concentration and firm performance,
in which firm performance peaks at intermediate levels of ownership concentration. The study
provided some empirical support for the hypothesis that as ownership concentration increases;
the positive monitoring effect of concentrated ownership first dominates but later is outweighed
by the negative effects, such as the expropriation of minority shareholders. The empirical
findings shed light on the role ownership structure plays in corporate performance, and thus offer
insights to policy makers interested in improving corporate governance systems in an emerging
economy such as South Korea.
Aticno (2001) in her study assessed the role of institutional lending policies among formal andv
informal credit institutions in determining the access of small-scale enterprises to credit in
Kenya. The results of the study show ihut the limited use of credit reflects lack of supply,
resulting from the rationing behaviour of both formal and informal lending institutions. The
study concludes that given the established network of formal credit institutions, improving
lending terms and conditions in favour of small-scale enterprises would provide an important
avenue for facilitating their access to credit.
2.4 Grow th of Manufacturing Sector in Kenya
Small and medium enterprises (SMEs) are increasingly seen as playing an important role in the
economies of many countries. The SMEs sector provided 78% of total employment and
contributed over 57% of the new jobs created in 2005/06 according to the Economic survey of
13

Kenya 2007. The economic survey of 2010 sluted that of the 503.000 jobs in year 2010.440.400.
or 80.6 per cent were in the SMEs. Only 62,600 or 12.4 percent were created in the formal
sector. These indicators send a strong message to policy makers regarding solutions to the
unemployment situation in Kenya. The survey indicated that a crucial element in the
development of the SML's sector is access to finance to enhance growth. Manufacturing SMFs
have unique factors affecting their growth us most of them import raw materials so affected by
fluctuation in foreign currency, availability of raw materials, tariffs and oil price changes (Kenya Association of Manufacturers. 1959)
Turning a small business into a big one is never easy. The statistics are grim. Research suggests
that only one-tenth of 1 percent of companies will ever reach S250 million in annual revenue.
Even more microscopic group, just 0.036 percent, will reach $1 billion ih annual sales. In other
words, most businesses start small and stay there (Inc.com.2010. December 21).
The manufacturing sector is a major sector of growth, with its share in GDP having risen from 13
percent in 2002 to 15.7 percent in 2007. Kenya, as the most politically stable country in East
Africa has attracted a large number of investors who now thrive in many sectors of
manufacturing (Embassy Of The Republic Of Kenya In Japan. 2012). The sector is dominated
by subsidiaries of multi-national corporations, large manufacturing firms and SMEs. Improved
power supply, increased supply of agricultural products for agro processing, favourable tax
reforms and tax incentives, more vigorous export promotion and liberal trade incentives to lake
advantage of the expanded market outlets through African Growth and Opportunity Act
(AGOA), COMESA and East African Community (EAC) arrangements, have all resulted in a
modest expansion in the sector of 1.4 % percent in 2009 as compared to 1.2% in 2010.
Ihc rising levels of poverty coupled w ith the general slowdown of the economy has continued to
inhibit growth in the demund of locally manufactured goods, as effective demand continues to
shift more in favour of relatively cheaper imported manufactured items. In addition, the high cost
of inputs as a result of poor infrastructure has led to high prices of locally manufactured products
thereby limiting their competitiveness in the regional markets and hampering the sector's
capacity utilisation. However, the recent introduction of the EAC Customs Union provides
Kenya’s manufacturing sector, the most developed within the region, a greater opportunity for
14

growth by taking advantage of the enlarged market size, economics of scale, and increased intrarcgionol trade.
In addition, Kenya Association of Manufacturers (KAM)cstablishcd in 1959 has evolved into a
dynamic, vibrant, credible and respected business association that unites industrialists and olTcrs
a common voice for businesses in Kenya.
PriccwatcrhouscCoopcrs has unsurpassed experience serving the major enterprises in the
manufacturing sector in the Hast African region. They are also at the forefront of developments
within the manufacturing sector through their close partnership and membership of the Kenya
Association of Manufacturers.
The manufacturing sector comprises of more than 700 established enterprises and employed over
218.000 people in 2000. According to the Economic Recovery Strategy for F.mploymcnt and
Wealth Creation Report for 2007, the manufacturing sector is a major source of growth, with still
high potential of grow th and investment.
Some key Kenyan manufacturing sub-sectors include galvanized iron sheets, cement, cigarettes,
and beer and wheat flour. All of these have increased in production between 2005 und 2010;
particularly cement which has always been a good indicator of economic activity. On the
consumer goods side, products manufactured locally include stationery and grooming products.
The table in appendix one show the growth of the sector for variety of commodities selected until
2007 (Central Durcau of Statistics. 2007).
According Kenya's Export Processing Zones Authority (EPZA) (2004), Africa was the number
one recipient of Kenyan exports with 47.5 percent. Europe was next with 27.9 percent, followed
by Asia with 15.8 und America with 2.8 percent.
The largest industrial sector contribution to exports in 2005 was garments (74.4 percent),
followed by chemicals (7.2 percent) and agro-processing (5.2 percent). Despite the challenges
15

facing the textile trade. Kenya maintained its position as the leading exporter of ready-made
garment in Last Africa.
fhe production of Kenyan manufactured goods has improved in the last years, although the
growth has slowed due to both internal and external factors that are greatly affecting the
manufacturing sector in SMlis.
2.5 Summary
From literature review, finance affects firm's growth in different ways. At the micro economic
level, there is a widely held view thut the slow growth of firms is the result of lack of access to
financial resources; however other factors may come to play.Kenya has an intention by 2030 to
become a newly industrialized country, a shift from agricultural economy. However, there is u
gap as the literature on firm growth has not evolved at the same speed, sometimes for lack of
Information or interest and the number of studies of manufacturing sector has not matched their
economic development. To lill the research gaps, the study will focus on the manufacturing
sector in Kenya to identify key factors which affects SMEs performance.
16

CHAPTER THREERESEARCH METHODOLOGY
3.1 Introduction
This chapter outlines the methodology used to conduct the study. It specifics the research design,
target population, data and data collection method and how analysis of the data will he done.
3.2 Research Design
This study was exploratory and descriptive in nature and the researcher usedeensus method. A
census was conducted in industrial area as the population is not large to wurrant sampling,
primary data collected from the census is more reliable and up-to-date and hence the choice of
this method. The descriptive research was used to enhance a systematic description that is as
accurate, valid and reliable regarding the responses on the growth of SMEs and the factors
considered to be affecting firm’s performance. This research design was applied by Koech
(2011) to survey financial constraints hindering Growth of SME's in Kenya she sampled 100
firms of similar nature of this study and come up with reliable findings.This study covcrcdu
period of five years from 2006 to 2011
3.3 Population
A censuswas conducted in industrial area: this means that all the manufacturing SMLsin the
population were includcdin the study, therefore no sampling was donc.For ease of the study theii r l i f
firms included in the populationwcrc classifiedas shown in table 4.3according to location not to
omit any firm during the study.
3.4 Data and Data Collection
The study used primary data. Primary data is data observed or collected directly from first-hand
experience (Davies, 2002). In this study data was obtained from census ofmunufacturing SMEs
in industrial area.
For data collection a formal list of questionnaire was prepared. The
questionnairccontainedqucstions ofopinion on factors that hinder SMEs growth to large
organization. The respondents were required to indicutc the weight they attach to each factor
17

perceived to be affecting their growth. The questionnaire consisted both open ended and closed
ended questions covering issues on the factors that determine growth of manufacturing SMEs
in Kenya.
In this study manufacturing SMEs were visited in their business premises and questionnaire were
administered to them to fill. Once the completion of the questionnaires was through, they were
collected in readiness for data analysis.
3.4.1 Data Reliability and Validity
Reliability and validity is a major issue when it comes to research, indeed failure to assure the
validity and/or reliability of the findings may cause the research to be questioned even worse
rejected as invalid. (Wallen and Fracnkcl, 2001)
According to Cooper and Donald (2008) reliabilityreferstoconsistency and/or
rcpcatabilityofihemeusurcmcnt. Since the study use questionnaire as a method of data collection,
to enhance reliability questionnaire wereclear and wclldefinc in ordemot to confuse
thercspondents.Rcpcatnbilityhcrcmcansthat if researchers have findingsfrom a group
thcyshouldbeabletorepeatthesurvcy and gclcxactlythesameresults.
Validity refers to the degree to which the measurement procedure actually measures the concept
that it is intended to measure (Cooper and Donald. 2008). Validity wasaddressed when writing
lire questionnaires in order to measure what the study is intended to; relevant questions to the
area of study were asked. In addition, respondents chosen to fill the questionnaire were guided
on filling the questionnaire and had good background of the company. Due to limited intellectual
sophistication of the subjects, questions were clarified and even translated to Kiswahili as
deemed necessary. Field editing was conducted before departure from the field.
3*$ Data Analysis
After performing the field survey, rawdata was obtained which needed to be analysed to make
sc,lsc to the users of the information. The raw form may look unrecognizable and be nearly

meaningless without processing, hut it may also be in a form that some can interpret!Davies,
2002).
Responses to the questionnaire were recorded, coded, exported in a spreadsheet, and transferred
to a statistical software package for in-depth analysis. Descriptive statistics was calculated and
data relationships were analyzed in accordance with the objectives of the study. Factor analysis
was used to rank factors considered in order of importance, while descriptive analysis used
frequency distribution and percentages. The statistical package for social sciences (SPSS) and
Excel was used to analyze the data.
3.5.1 Conceptual Model
According to Kumar (2005) conceptual modeling develops the representation of entities and their
relationships in a format that is easy to read and understand. The conceptual framework below
shows diagrummutic relationship between independent and dependent variable.
Figure 3.1: Conceptual Framework
Below is the conceptual model function showing the relationship between dependent variable O
°nd independent variables X.'=f(X i+X,+XJ+X4+X)rt-X*+X7+X8)
19r

Where:0 : Growth in sales and InvestmentsXI: Interest Rates X5: I ligh Cost of EnergyX2: Collateral for Loans X6: High fuel pricesX3: Inadequate Technology X7: Exchange ratesX4: Inadequate Business Skills X8: Unavailability Raw Material
| or analysis purposes, the variableswerc measured quantitatively. The result from the census was
quantified and then analysed to come up with factors that affect SMEs in order of their
importance. For open ended question Content Analysis was applied. Content analysis creates a
structure to organize open-ended information. (Kumar. 2005)
The expected relationship of the factors is a negative linear relationship, that is when the factors
ure not favorable the SMEs will have a stagnant growth or exit from operation as a result of
adverse selection and vice versa
3.5.2 Analytical Model
C .J = a + P |X i+ P 2 X |+ P j * J + p4X4+ 0*X*+ frX 6 + P ? * ? + P«X«+ £
Where(*2; Growth in sales and investments a:Autonomous growth 0: Slopes: Error
Determination of Strength of Relationship
Independent t-tests and simple unalysis of variance (ANOVA) was used to look for significant
differences between growth and financial constraints grouped into four: financial factors,
manufacturing costs, manufacturing efficiency und others. A statistical software program, SPSS
(Statistical Package for Social Sciences) was used for in-depth data analyses
20

CHAPTER FOUR
DATA ANALYSIS, RESULTS AND DISCUSSION
4 .1 Introduction
This chapter shows findings of the study and discusses these findings in length. The stud)
targeted the SME’s within industrial area. 43 Small and Medium Enterprises were studied by use
of census. Section 4.2 shows summary statistics, section 4.3 is estimated model, section 4.4
discusses the average SMB* growth 4.5 summarizes the chapter.
4.2 Summary of Statistics
4.2.1 Location of business and Age of the Businesses
The primary source of information for the study was a census of manufacturing SMEs conducted
in industrial urea in Nuirobi Kenya. A population 43 firms wasstudied. Of the 43 firms stud io
7% arc located in Nanyuki Road. 23% Lusaka Road 23. 14% Likoni Road. 33% Enterprise Road
and 10% I.ungal.unga Road
Tab!c.4:l: Location of Business
SME Location Frequency PercentNanyuki Road 3 7Lusaka Road 10 23Likoni Road 6 14Enterprise Road 14 33LungaLunga Road 10 23GRAND TOTAL 43 100
Source: Author’s Computation
Most of the manufacturing SMEs in industrial areahuve been in operation for more than l* 'e
year. Only 9% of the firms were in operation for 2 years and below. 5 % were in operation fo r 4
years. 86% were above five ycur.thisgavc a good picture of the study which covered u period of* five year.
21

Table 4:2: Age of the Buiinns
[“n u m b e r o f y e a r NUMBER OF FIRMS PERCENT2 4 94 3 5
Above 5 Years 37 86Grand Total 43 l(N)
4.2.2 Source of Raw Material*
The businesses in industrial area import and purchase raw materials locally for production. 75%
do both, import and export. 19% rely on importation of raw materials and do not purchase local
inputs, only 9 of manufacturing firms depend solely on local purchase. Figure 4.1 shows the graphical representation
Figure 4.1: Source of Raw Materials
Source of Raw Materials
0 20 40 60
JA<TJ
* C LOCAL01AtoE
% IMPORT
oataD BOTH
80
BOTH IMPORT LOCAL■ Series 1 72 19 9
‘'ource: Author’s Computation
22

4.2J Firms New Investments and Sources
the study sought to Find out during the lost five years the firm has been in operation whether the
firm made any new investment or expenditure intended to result in growth. The outcome was
that 70% made new investment, 30% didn’t not make any new investment intended to result to
growth w ithin that period.This was as a result of financial challenges which will be discussed in
latter. Figure4:2 show a graphical representation of the findings.
Figiire4:2Firm's New Investments
SMEs Investments■ Made new Investments ■ No New Investments
Source: Author's Computation
Source of Investments
30% of the firms made no new investment for a period of five years, 16% of the firms financed
their investments solely on long term bank loans, 5% of the firms financed through retained
earnings. 5 % finance through shares (own capital)
firms, due to financial constraints, choose to combine different forms of financing. 23% of the
firms combined long term bank loans & retained earnings. 12% combined long term bank loans.
Gained earnings and informal finance. There arc those firms which combined long term bank
loans, retained eamings (profits), informal finance and shares (own capital) that is 2% .2 % also
combined long term hank loans and informal finance. 2% combined long term hank loans and
23

informal finance and finally 2% used retained earnings (profits) combined with informal finance,
•pie table below shows die combination of sources of finance to finance investment.
Table 4.3: Source of Finance
Source of Finance Number Of Firms Percentage
'So investment 1330
"Long Term Bank l oans 716
R̂etained tamings (profits) 25
i Shares ( own capital) 25
Tong Term Bank Loans & Retained tamings 1023
Tong Loons. Retained Earnings (profits) and Informal finance 512
| Long Loans. Retained tamings Informal finance and Shares 12
Long I'crm Bank Loans and Informal finance 12
Long Term Bank Loans and Informal finance 12
Retained tamings (profits) & Informal finance 12
(irand Total 43100
Source: Researcher
4.2.4 Borrowing Limitation and Cause
Figure 4:3 Borrowing limit
Borrowing limit
■ Not limited to borrow
■ Limited to borrow
24

Vhc combination of financing options shown in tahlc4.3 above was as a result of hindrance to
(sorrowing from commercial banks.The above figure show that 53% of the firms included in this
5tudy were limited to borrow from commercial banks. 47% of the firms did not experience any
challenge in borrowing behavior. Figure 4.4 shows the cause of hindrance to finance investment
through loan 100%.
Figure 4.4:Causr of Limitation
Few Small SMbs with few on no fixed assets to oiler as collateral for a load found it hard to
secure any loan from the banks xs they had no collateral, this amounted to a small percentage of
5%. Bigger SMbs that is 30% were affected by collateral even though they could be awarded
loan but not enough to finance the whole project; they were also affected by interest rates. Only
19% said that they were not affected by rates or collateral because they did not reduce their
25
borrowing. The greatest percentage o f SMBs was affected greatly by interest rates. They had the
collateral to secure loan but the interest rates which has sky rocketed put them off and the
finance through combination of sources discussed in 4.2.3
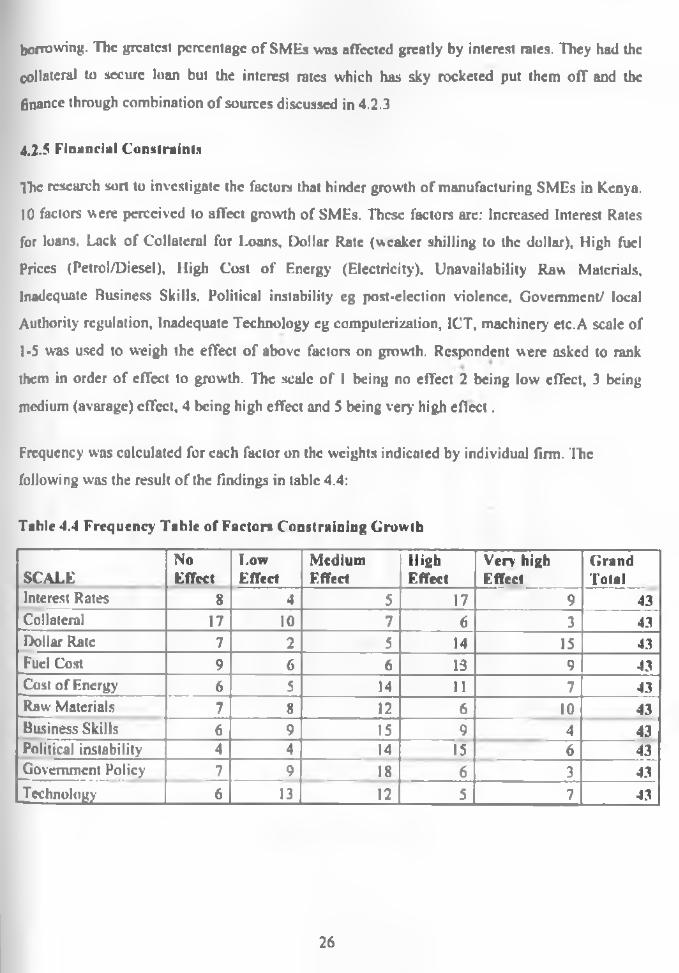
4.2.5 Financial Constraints
The research sort to investigate the factors that hinder growth of manufacturing SMEs in Kenya.
10 factors were perceived to affect growth of SMEs. These factors are: Increased Interest Rates
for loans. Lack of Collateral for Loons, Dollar Rate (weaker shilling to the dollar). High fuel
Prices (Petrol/Diesel), High Cost of Energy (Electricity). Unavailability Raw Materials.
Inadequate Business Skills. Political instability eg post-election violence. Government/ local
Authority regulation. Inadequate Technology eg computerization, ICT, machinery etc.A scale of
1-5 was used to weigh the effect of above factors on growth, Respondent were asked to rank
them in order of effect to growth. The scale of I being no effect 2 being low effect, 3 being
medium (avarage) effect, 4 being high effect and 5 being very high effect.
Frequency was calculated for each factor on the weights indicated by individual firm. The
following was the result of the findings in table 4.4:
Table 4.4 Frequency Table of Factors Constraining Growth
SCALENoEffect
LowEffect
MediumEffect
HighEffect
Very high Effect
GrandTotal
Interest Rates 8 4 5 17 9 43Collateral 17 10 7 6 3 43Dollar Rate 7 2 5 14 15 43Fuel Cost 9 6 6 13 9 43Cost of Energy 6 5 14 11 7 43Raw Materials 7 8 12 6 10 43Business Skills 6 9 15 9 4 43Political instability 4 4 14 15 6 43Government Policy 7 9 18 6 3 43Technology 6 13 12 5 7 43
26

Perc
enta
ge F
requ
ency
Figure 4:5 Percentage Frequency Polygon on Factors Constraining Growth
45
40
35
30
25
20
15
10
■ No Effect
■ low Effect
Medium Effect
■ High Effect
■ Very high Effect
J
/ J / / < / / J ’ / ✓ < / ̂V //yV sr < /
Factors of Growth
Source: Author’s Computation
27
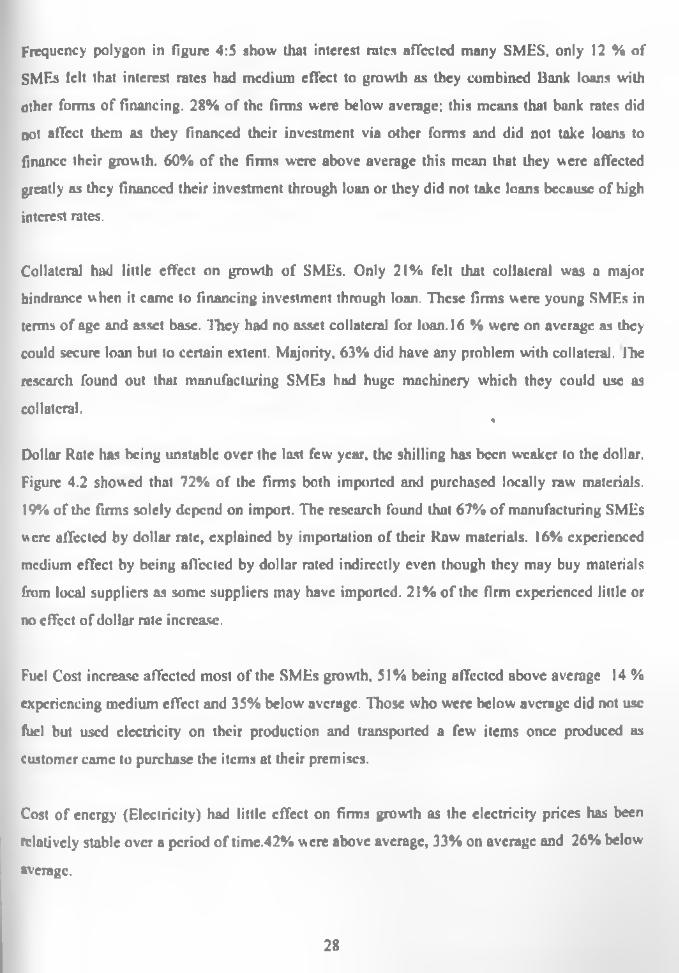
Frequency polygon in figure 4:5 show that interest rates affected muny SMES. only 12 % of
SMEs lelt that interest rates had medium effect to growth as they combined Bank loans with
other forms of financing. 28% of the firms were below average; this means that bank rates did
not affect them as they financed their investment via other forms and did not take loans to
finance their growth. 60% of the firms were above average this mean that they were affected
greatly as they financed their investment through loan or they did not take loans because of high
interest rates.
Collateral had little effect on growth of SMBs. Only 21% felt that collateral was a major
hindrance when it came to financing investment through loan. These firms were young SMEs in
terms of age and asset base. They had no asset collateral for loan. 16 % were on average as they
could secure loan but to certain extent. Majority. 63% did have any problem with collateral. Ihe
research found out that manufacturing SMEs hud huge machinery which they could use as
collateral. *
Dollar Rate has being unstable over the last few year, the shilling has been weaker to the dollar.
Figure 4.2 showed that 72% of the firms both imported and purchased locally raw materials.
19% of the firms solely depend on import. The research found that 67% of manufacturing SMEs
were affected by dollar rate, explained by importation of their Raw materials. 16% experienced
medium effect by being affected by dollar rated indirectly even though they may buy materials
from local suppliers as some suppliers may have imported. 21% of the firm experienced little or
no effect of dollar rate increase.
Fuel Cost increase affected most of the SMEs growth. 51% being affected above average 14 %
experiencing medium effect and 35% below average. Those who were below average did not use
fuel but used electricity on their production and transported a few items once produced as
customer came to purchase the items at their premises.
Cost of energy (Electricity) had little effect on firms growth as the electricity prices has been
relatively stable over a period of timc.42% were above average, 33% on average and 26% below
average.
28
Raw Materials also did not have great effect as the SMEs said that most of the materials were
readily available.35% were below average, 28% on average and 37% above average.
Business Skills affected the growth of SMFs because SMEs employed both skilled and manual
laborers. Munuul laborers were not experienced and a lot of wastage was experienced during
production. 35% were below average, 35% at medium effect and 30% above average.
Political instability affected almost all the SMEs. Industrial area was hard hit by post-election
violence in 2007 and early 2008. Respondent said the most laborers who are employed in the
area mostly stay in low income Estates like Kayolc, Ndandora, Botclakaloleni among other
places. During the period they could not report to work hence production was put to a halt.
Customer also did not pick their orders, some places were looted leading to low sales in
2008.19% o f SMEs were below average. 33% were on average and 49% were above average.
Government Policy had no impact on growth of SMEs. 37% being below average. 42% being
medium level and 21% being above average. ‘
Finally technology had a moderate effect, where 44% were below average, 28% were on
average and 28% being above average.
4.3Eslimatcd Model
For statistical analysis, multiple regression was used, dependent variable being sales growth (Y)
and independent variable being financial constraints factors(Xi), explained in analytical model.
Below are the regression output.
Table 4.5: Regression statistics
Regression StatisticsMultiple R 0.74R Square 0.55Adjusted R Square Standard Error
0.4110.10
Observations 43.00Source: Author's Computation
29

R-sqiiarerncasures ihc proportion of the variation in the dependent variable (Growth) that was
explained by variations in the independent variables (financial factors). From regression
analysisR-Square tells us that 55% of the variation was explained. R‘ = 0.55% means that 55%
of the variation of y, around yA (its mean) is explained by the regressors xj X2.....xn
Adjusted R-square Measures the proportion of the variance in the dependent variable that was explained
by variations in the independent variables. Adjusted RSquare of 0.41 shows that 0.41% of the variance
was explained.
Table 4.6:Anova fable
ANOVA
Regressiond f 55 M S F
S ig n ifica n ceF
10.0000 3965.6589 396.5659 3.8900 0.0016Residual 32.0000 3262.2586 101.9456Total 42.0000 7227.9175
Source: Author’s Computation
The column labeled F gives the overall F-test of HO: ft = 0 versus Ha: at least one of fydoes not equal zero. The column labeled significance F has the associated P-value. Since0.0016 > 0.05. wc do not reject HO at significance level 0.05.
Table 4.6: Coefficient Matrix
Coefficientt Standard Error 1 Slat P-value
Lower9S%
Vppe r 95%
x, Intercept 26.52 11.02 2.41 0.02 4.05 18.99XI Interest Rates •2.47 1.65 -1.50 0.14 -5.83 0.89X2 Collateral -0.52 1.55 -0.34 0.74 -3.68 2.64X3 Dollar Rate -0.89 1.40 -0.63 0.53 -3.74 1.96X4 Fuel Cost -0.47 1.57 -0.30 0.76 -3.66 2.72X5 Cost o f Energy 0.06 1.76 0.04 0.97 -3.52 3.64X6 Raw Materials 0.69 1.42 0.49 0.63 -2.20 3.58X7 Business Skills i x: 1.88 -0.97 0.34 -5.66 2.02X8 Political instability -6.90 2.20 -3.14 0.30 -11.38 -2.42X9 Government Policy 1.77 1.66 1.07 0.29 -1.61 5.15XI0 Technology -0.87 1.58 -0.55 0.58 -4.10 2.35
Source: Author’s Computation
30

Column "Coefficient" gives the least squures estimates of P,. Column "Standard error" gives the
standard errors (i.c.the estimated standard deviation) of the least squares estimates b, of p,.
Column "t Stat" gives the computed t-statistic for HO: P, = 0 against Ha: P, i O.This is the
coefficient divided by the standard error. It is compared to a t with (n-k) degrees of freedom
where here n r 43 and k ■ 10. Column "P-value" gives the p-value for test of HO: Pj • 0 against
Ha: pj * 0. Iliis equals the Pr{|t| > t-Stat)whcrc t is u t-distributed random variable with n-k
degrees of freedom and t-Stat is the computed value of the t-statistic given in the previous
column. This p-value is for a two-sided test. For a one-sided test divide this p-value by 2 (also
checking the sign of the t-Stat). Columns "Lower 95%" and "Upper 95%" values define a 95%
confidence interval for P,.
A simple summary of the above output is thut the fitted line is
Y= 26.52-2.47X, -0.52Xj-0.89X 3-0.470*, +.06X«+0.69X*-1.82 Xt-6.90X,+1.77X*-0.87X,0
The 95% confidence interval for slope coefficient Pi is from figure 4.4 is (-5.83,0.89) P2 -3.68- 2.64.......pn
Test of Statistical Significance
The coefficient of Interest Rates has estimated standard error of 1.65. t-statistic of -1.50 and p-
valuc of 0.14. It is therefore statistically significant at significance level a 1 .05 as p > 0.05. The
coefficient of Collateral lias estimated standard error of 1.55, t-statistic of -0.34 and p-value of
0.74 .It is therefore statistically insignificant at insignificance level ex = .05 as p > 0.05. The
coefficient of Dollar Rate has estimated standard error o f 1.40, t-statistic of -0.63 and p-value of
0.53.It is therefore statistically insignificant at significance level a “ .05 as p > 0.05. The
coefficient of Fuel Cost has estimated standard error of 1.57, t-statistic of -0.30 and p-value of
0.76.It is therefore statistically insignificant at significance level u - .05 as p > 0.05.
The coefficient of Cost of Energy has estimated stundurd error of 1.76, t-statistic of -0.04and p-
valuc of 0.97.1t is therefore statistically insignificant at significance level a “ .05 as p > 0.05.
The coefficient of Raw Materials has estimated standard error of 1.42, t-statistic of 0.49 and p-
value of 0.63 .It is therefore statistically insignificant at significance level a - .05 as p > 0.05.
31

The coefficient of Raw Materials has estimated standard error of 1.88. (-statistic of -0.97 and p-
value of 0J4.lt is therefore statistically insignificant at significance level a * .05 as p > 0.05.
The coefficient of Political instability has estimated standard error of 2.20, t-statistic of -3.14 and
p-value of 0.003.It is therefore statistically significant at significance level a ■ .05 as p > 0.05,
The coefficient of Government Policy has estimated standard error of 1.66. t-statistic of l.07and
p-value of 0.29.11 is therefore statistically significant at significance level a - .05 as p > 0.05.
The coefficient of Government Policy has estimated standard error of 1.58, t-statistic of -0.55
and p-value of 0.58.It is therefore statistically insignificant at significance level a 3 .05 as p >
0.05.
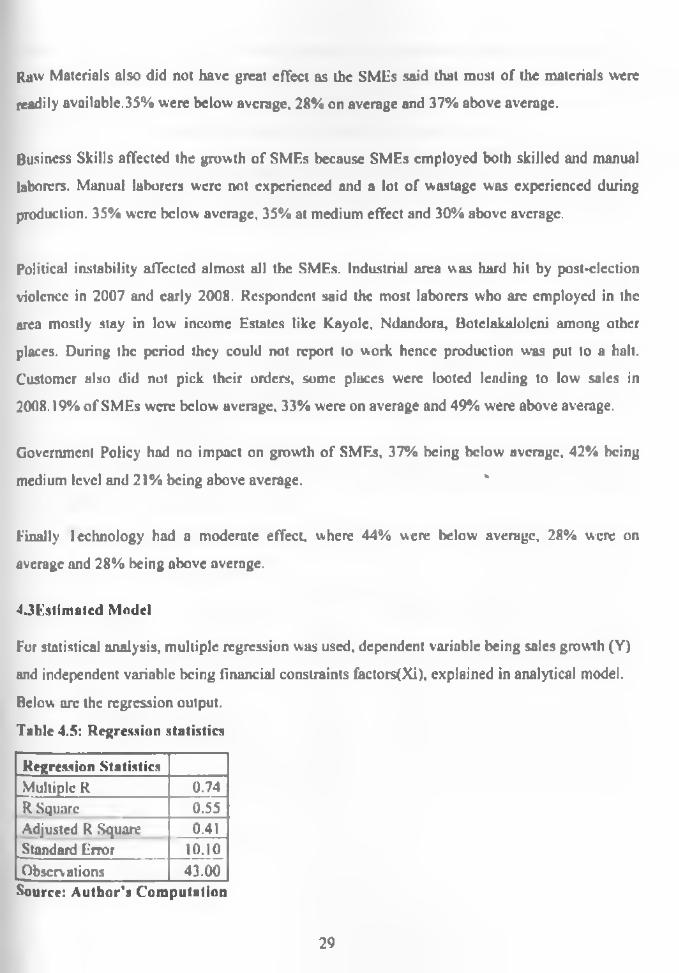
4.4. Average SMF.t Growth
Figure 4.6: SMF.* Average Growth
SMEs AVERAGE GROWTH
-♦ -G R O W TH
32

Figure 4.6 above shows the summary’ of SMEs growth, it was noted that on ovarnge SMEs sales
grew by 4% in 2006 financial year, in 2007 sale grew by 3.83 %, in 2008 sale declined by 10.33
%. in 2009 sale grew by 3.74 % in 2010 sale grew by 4.07% and finally in 2011 sole grew by3.34%.
The study showed that sales grew at a declining rate. For new firms sale grew very fast for the
first few years then the sale grew at a declining rate after some time. Sales grew very slowly as
the firm age some growth even starts declining. It is at this time that a firm invests to diversify,
so old firms experienced slow growth in sale as opposed to new firms. In year 2008 most firms
experienced decline in sales on average by 10%, this was as a result post-election violence
experienced in late 2007 and 2008. After 2008 sales grew rapidly to a positive value in 2009, and
from there sale has been growing at a declining rate.
4.5 Summitry
The data collected was useful in answering the research question: what factors influcncc/affcci
manufacturing SMEs growth into large business enterprises? From the analysis of data collected,
interest rates, dollar rale. Fuel Cost, business skills and political instability were the factors found
to influence SMEs growth into large business enterprises
Government Policy, Technology, Cost of Energy, Raw Materials and collateral affected the
growth marginally that is to say that they dint not influence growth greatly.
The expected relationship of the factors is a negative linear relationship, that is when the factors
arc not favorable the SMEs will have a stagnant growth or exit from operation as a result of
adverse selection and vice versa, this was proved by the regression analysis. Regression show a
significant relationship between dependent variable (Sales) and independent variables Xi
33

CHAPTER FIVE
SUMMARY, CONCLUSIONSAND RECOMMENDATION
5.1 Introduction
Section 5.2 of this chapter provides the summary o f key findings, section 5.3 provides the
research conclusions, 5.4 explains limitations of the study and section 5.5 gives
recommendations for farther research.
5.2 Summitry of key findings
The objective of the study was to find out financial constraints to growth of manufacturing
SME’s in Kenya. In order to realize the objectives of the study, survey design was adopted to
facilitate the collection of original data necessary for the study. The target population included
manufacturing SMES within industrial area Nairobi Kenya.Quantitative primary data was
collected using structured questionnaires. Data collected was first edited in order to check for
completeness. Thereafter, it was coded and formatted before being analyzed to obtain
percentages and frequency distribution tables.
The research found out that the businesses in industrial area import and purchase raw materials
locally for production, 75% do both, import and export. 19% rely on importation of raw
materials and do not purchase local inputs, only 9 of manufacturing firms depend solely on local
purchase. Only 70% of SMLis interviewed made new investment. 30% didn’t not make any new
investment intended to result to growth within a period of live years.
For the investment, 16% of the firms financed their investments solely on long term bunk loans,
5 % of the firms financed though retained earnings. 5 % finance through Shares ( own capital)
. 23% of the firms combined Long Term Bank Loiuis & Retained Earnings, 12% combined lx>ng
Term Bank Loans, Retained Huntings and Informal finance. There those firms which combined
Long Term Bank Loans, Retained Earnings (profits), Infonnal finance and Shares (own capitul)
that is 2% .2 % also combined Long Term Bank Loans and Informal finance, 2% combined long
Term Bank Loons and Informal finance and finally 2% used Retained Famings (profits)
34

combined with Informal finance. The table below shows the combination of sources of finance to finance investment
lltc research intended to find out the factors that affect SMEs growth. It was found bank rates
affected 60% of the firms, this mean that they were affected greatly as they financed their
investment through loan or they did not lake loans because of high interest rates.63% of SMEs
said they had no problem with collateral for loan so that had no significant cfTcct to growth. The
research found that 67% of manufacturing SMEs were affected by dollur rate, explained by
importation of their Raw materials. 51% of SMEs were affected by fuel prices this shows an
average effect. Cost of energy (Electricity) had little effect of firms growth as the electricity
prices has being relatively stable over a period of time.42% were above average. 33% on average and 26% below average.
For Business Skills it was found that Manual labourers were not experienced and a lot of wastage
was experienced during production. 35% were below average. 35% at medium effect and 30%
above average. Political instability affected almost all the SMEs. Industrial area was hard hit by
post-election violence. 19% of SMEs were below average, 33% were on average and 49% were
above average. Government Policy had no impact on growth of SMEs. 37% being below
average. 42% being medium level and 21% being above average.
Finally Technology had a moderate effect, where 44% were below average, 28% were on
average und 28% being above average.
5.3 Conclusions
Ten factors affecting SMF.'s growth were identified, and measured with a scale of very high,
high, medium, low and no effect. In order of contribution, the factors influencing growth of
SMEs arc: political instability, interest rates, business skills, dollar rate, technology, collateral,
fuel cost, and cost of energy, raw-materiuls and government policy. (Arranged from very high
effect to no effect)
35

It was however noted that these factors, when further analyzed, grouped into five, financial costs
factors, manufacturing costs factors, manufacturing efficiency, political and government factors.
Political factors affect the growth of SMEs more but is not common in Kenya is a one off
occurrence. Financial factors were identified to have a great impact, manufacturing cost second
and manufacturing efficiency last.
Some factor had little or no effect at all; collateral for loan had little effect as manufacturing
SMF.s had assets to secure their loans. Because most firms imported raw materials they were
greatly affected by fluctuation in exchange rate.
Firm needs is depended on their age. newly established firms have a problem with collateral for
loans as they don't have a healthy balance sheet. As they age they can he able to take loans with
ought any problem as the will have accumulated some assets. Growth in sales increased at a
decreasing rale and thereafter sales starts to decrease.
5.4 Limitations of the Study
This research did not go without challenges. The research was faced by various unexpected
interferences which sometimes ended into premature discontinuation. These interferences were
caused by respondents who needed to attend to their businesses like serving customers. Some
respondents opted not to respond to some questions, increasing the number of missing values.
Some respondents treated us with suspicion because they thought perhaps we were spies from
the government. Some denied access to their premises thinking that I was there to seek for
employment
Language barrier especially in industrial area was one of the limitations as most firms were
owned by Indian who found it hard to communicate in Fnglish. We had to interpret the questions
which sometimes look a lot of time to get information from the respondents. It was very evident
that some respondents expected compensation for the information they diverged. Some even
asked openly whether they would get ‘something' for their information.
36

5.5 Recommendation* for Further Research
The results of this study reveal that finance cost, manufacturing cost factors und political stability
arc responsible for SMEs failures in the Kenya. Hence more effort needs to be focused in the
area of management development for SMEs and peace in Kenya
Stimulate additional research on the impact of capital provision to SMEs on economic indicators
at the micro- and macro-level. There is a large amount of anecdotal information on impact, but
few systematic, controlled studies.
Future researchers can consider topics which intends to analyse the cfleet of access to finance on
the financial (growth and profitability) and operational characteristics of individual firms
.analyse the aggregated effect of increased capital on the sectoral and macro-economic levels
(e.g. GDP. output, employment), including different socio-economic groups
Analyse the cflcct on organizational behaviours (c.g. innovation) und on social impact (e.g.
female participation in the workforce, minority inclusion, etc.).Work toward a differentiated
understanding of the impact of SME financing on different sectors (c.g. agriculture, services) and
lending channels
Support initiatives to harmonize SME definitions among stakeholders to facilitate collecting and
comparing data
37

REFERENCE
Adam Smith. (1776). An Enquiry into the Nature and Causes ot the W ealth of Nations. Padstow;
PJ international Ltd.
Aron. M. (2012).High Cost of Flectricity to Stall Economic Growth. Nairobi: Standard Group Limited.
Beynon-Davies (2002). Information Systems: An introduction to informatics in organisations.
Basingstoke, UK: Palgravc Macmillan.Bokea, C., andMullei. A. (l999).Micro and small enterprises in Kenya. Nairobi: 1CEG. Africa
Program.
Bums. R.. & Bums, A. (2008).Business research Methods and Statistics Using SPSS. New
Delphi: Sage Publication Inc.
Business Dictionary. (2010, December 12). DuiinessDictiunary.com. Retrieved July 12, 2012, from BusinessDictionary.com: http://wYvw.busincssdictionary.com/dcfinition/ccnsus.hlinl
Central Bank of Kenya. (2008, December 31). The Annual Economic Report. Retrieved April
13, 201. front Central Bank of Kenya: http://goo.gl/BXWKG
Central Bank of Kenya. (2008, December 12). Interest rates: News and predictions. Interest
rates: News and predictions, pp. 1-1.
Chiranjibi, N. B., andNiraula, K. (2008). Technology Transfer In SMEs:ProbIems And Issues In
The Context Of Nepal. Published MBA Project, 1-3.
Cohen, J., Cohen, P., West. S. G.. and Aiken. L. S. (2003).Applied multiple
rcgrcssion/corrclulion unulysis for the behavioral sciences, 3rd Ed. Mahwah, NJ:
Lawrence Erlbaum Associates
Cooper, and Donald R, (2008).Busincss Research Method. Columbus,: McGraw-Hill
Companies.
Cyert, R. M.. J. G. March. 1963/1992.A Behavioral Theory of the Firm. 2nd cd. Prentice Hall.
Englewood Cliffs. NJ.
Dawson, Catherine. 2002. Practical Research Methods, New Delhi. UBS Publishers Distributors
European commission. (2011, December 23). European Union website, the official EU website.
Retrieved 2012 13. March, from Definition of SMF.s: http://goo.gl/nc8Bx
Fracnkcl, J., and Wallen, N. (2008). H ow To Design A n d Evaluate Research In Education. London: McGraw-Hill,.
38
Invcstopcdia. (2009, January 12). Financial Performance. Retrieved July 22,2012, from Google
Maps: http://goo.gl/vU6GR
Industry Canada. (2011. December 12). Industry Canada. Retrieved June 12, 2012, from
Industry Canada: http://goo.gl/5BHI9
Jabara. C. (2009). How Do Exchange Rates Affect Import Prices. Office of industries working paper, 1-20.
J1CA.(2004). Japan International Corporation Agency. Japan International Corporation Agency .
1-30.
Kenya Association of Manufacturers. (2012, January 12). Kenya Association of Manufacturers.
Retrieved April 27,2012, from latest News: http://www.kum.co.kc/
Kenya Association of Manufacturers^ 2012). High cost of electricity to stall economic growth.
Nairobi: Standard Group Limited.
Kenya's Export Processing Zones Authority. (2004). Export Growth InKenya. Export Growth In
Kenya. 1-2.
Khang'ati, A. (2011). Daily Nation Kenya Newspaper. AllAfrica - All the Time , AllAfrica - All
the l ime
Koech, B. C. (2011). A Survey Of The Financial Constraints Hindering Growth OlSmc’s In
Kenya: The Case O f Kamukunji District In Nairobi County. Unpublished MBA project
University of Nairobi.
Kothari. C.R.,1985, Research Methodology- Methods and Techniques, New Delhi.Wiley Eastern
Limited.
Kraus. A., Robert, andl.itzenbcrgcr.(1972). A State-preference Model of Optimal f inancial
Leverage. Los Angeles: Graduate School of Business. Stanford University.
Kumar. Kanjit, 2005, Research Mcthodology-A Step-by-Step Guide for
Bcginncrs.(2nd.ed.).Singapore. Pearson Education.
Lee, S. (2008). Ownership Structure and Financial Performance: Evidence from Panel Data of South Korea. Corporate Ownership and Cntrol, 6(2), 1-30.
Leedy. P., and Ormrod, J. (2001). Practical Research: Planning a n d D esign Chicago: Pearson Education.
Ministry of State for Planning. National.(2009). 2009 Population and Housing Census Results.
2009 Population and Housing Census Results, 1-3.
39
Mocality. (2012, January 1). Kenya’s largest Business Directory. Retrieved June 21, 2012, from
Kenya’s largest Business Directory: http://wwAV.mocality.co.kc/
Mugenda M. O. and Mugenda G. A., (2003) Quantitative and Qualitative Approaches, ACTS Press. Nairobi, Kenya
Mworia. J. (2011, January 3). Interest rate increase poses a grave risk to Kenya's economic
prospects. Daily Nation 2011, pp. 3-5.
Naser, K., &Mokhtar, M. (2004). Determinants of Corporate Performance of Malaysian Companies. Fourth Asia Pacific Interdisciplinary Research in Accounting Conference, Singapore
Nesbary, D. (2000). Survey research a n d the World Wide Web. Pennsylvania State University: Allyn and Bacon.
Olawale, F.. andGarwc, D. (2010).Obstacles to the growth of new SMFs in South Africa.
Published MBA Project South Africa:, 3-4.
Penrose. E. (2009). The Theory of the Growth of the Firm. Oxford: 2009.
Ricardo, D. (1823). On die principles of political economy, and taxation. London: John Murray.
Robai, V. (2006. Dec 12). Informal finance as a Source of Fund lor SME In Kenya: Dandora.
Published MBA Project University of Nairobi, pp. 1-57.
SME Network. (20112, June 12). SM E Network. Retrieved June 30 15, 2012, from SME Network: http://smcnctwork.co.kc/
The Association for Manufacturing Technology. (2011). What is Manufacturing Technology .
Virginia: West park McLean.
United Nation Industrial Development organization (UNIDO) (2002).Stimulating SME
environment. Retrieved July 5th 2010 from www.unido.org
University of Southern California. (2012, January 12). Organizing Your Social Sciences Research Pai>er. Retrieved June 12, 2012, from Organizing Your Social Sciences Research Paper: http://tinyurl.com/bwah673
Wanjohi, A. (2009). Challenges Facing SMEs in Kenya. Retrieved July 10, 2010 from
http://www.buzzle.com/articles/challenges-facing-smes-in-
Wikipcdia. (2012, Januury 27). Manufacturing. Retrieved April 6, 2012, from Wikimedia
foundation. Inc.: http://en.wikipedia.org'wiki/Manufacturing
Wisegeek. (2002). What is a Collateral Loan. London: Conjecture Corporation.
40

W olte. M. (2010). How Docs the Fuel Price Affect Manufacturing. Chicago: Demand Media, Inc.
V in. R. K. (1984).Cave study research: Design and methods. Newbury Park, CA: Sage.
41

APPENDICESSURVEY QUESTIONNAIRE
GENERAL INFORMATION
1. What docs the firm manufacture or sell:_________________________________
2. Number of employees both permanent and Casual: Permanent (3 ) Casual ( 5)
Others specify________________
3. How many years has the firm been in business? 0-1 Year ( ) 2 years ( ) 3 Years ( ) 4
yearf ) 5 years und above ( + )
4. Do the firm import raw material or purchase locally: import ( ) local ( ) both ( )
DETERMINANTS OF GROWTH/F1NANCIAL PERFORMANCE
1. In a scale of 1-5 how would you rank the following factors that affect performance of your
firm's and inhibits growth. I being no effect and 5 being very high effect.
FINANCIAL CONSTRAINTS NoEffect
LowEffect
Medium F. fleet
HighEffect
Very High Effect
Increased Interest RatesLack of Collateral for Loans
Dollar Rate (weaker shilling)
High fuel Prices (Pctrol/Dicscl)High Cost of Energy (Electricity)
Unavailability' Raw MaterialsInadequate Business SkillsPolitical instability eg postelection violenceGovernment/ local Authority regulation eg licensing, fees, rates.... etcInadequate Technology eg computerization, ICT, muchincrv etc
42

m e a s u r e o f g r o w t h /p e r f o r m a n c e
1. During the last five years has your firm made any new investment or expenditure intended to result in growth?
Ycs( ) No( ) (Go to question 3)
2. How were new investments financed as a percentage of the total investments?SOURCE OF FINANCE PERCENTAGEl.ong 1 erm Bank LoansRetained Earnings (profits)Informal finance eg loan from friends Merry go round etcShares ( own capital)OthersTOTAL 100%
3. Did an inability to borrow sufficient funds prevent the firm from making all or part of the
desired growth investments and expenditures
Yes ( ) (go to 4) No ( )
4. What was the main hindrance for growth in 3 above _____
5. Kindly indicate the your sales volume for the last five years in your firm (If your firm has
not been in operation for five years fill from the year your started the business).
YEAR SALES IN SHILLINGS200620072008200920102011
6. In your opinion what could be the major cause of lack of growth or slow grow th in sales in
your firm___________________________________________________________
T1IANK YOU FOR YOU RESPONSES
43