by judy yu wu a thesis submitted in partial fulfillment … · sub-lethal effects of pesticide...
TRANSCRIPT

SUB-LETHAL EFFECTS OF PESTICIDE RESIDUES IN BROOD COMB ON WORKER
HONEY BEES (APIS MELLIFERA L.)
By
JUDY YU WU
A thesis submitted in partial fulfillment of the requirements for the degree of
MASTER of SCIENCES in ENTOMOLOGY
WASHINGTON STATE UNIVERSITY Department of Entomology
MAY 2010

ii
To the Faculty of Washington State University:
The members of the Committee appointed to examine the thesis of
JUDY YU WU find it satisfactory and recommend that it be accepted.
___________________________________ Walter S. Sheppard, Ph.D., Chair
___________________________________ Carol M. Anelli, Ph.D.
___________________________________ John D. Stark, Ph.D.
iii
ACKNOWLEDGMENT
This research project would not have been possible without the support of
several people. The author wishes to express her deepest gratitude to her advisers
and committee members, Drs. Walter S. Sheppard, Carol M. Anelli, and John D. Stark,
for their invaluable assistance, support and guidance. A special thanks to all her
graduate student colleagues, especially Matthew D. Smart, Samuel Hapke, and
Benton Horwath for their undivided support and encouragement. The author would
also like to convey thanks to the department faculty, in particular Barbara Smith, Doris
Lohrey-Birch, and Sally Hasher for providing assistance and direction with
administrative matters and for being there for the students whenever possible. The
author wishes to express her love and gratitude to her beloved family and friends; for
their understanding and love through the duration of her studies.
iv
SUB-LETHAL EFFECTS OF PESTICIDE RESIDUES IN BROOD COMB ON WORKER
HONEY BEES (APIS MELLIFERA L.)
Abstract
by Judy Yu Wu, M.S. Washington State University
May 2010
Chair: Walter S. Sheppard
The European honey bee, Apis mellifera L., is an important
pollinator for many agricultural crops. The United States Department of
Agriculture estimates one-third of our diet comes from insect-pollinated
plants. Of that, 80% are pollinated by honey bees (Thapa, 2006 J. Inst.
Agric. Anim. Sci 27:1-23). Unfortunately, honey bees are faced with
challenges including mites, microsporidia, viruses, poor nutrition and
exposure to pesticides.
Miticides have been used since the late 1980’s in the U.S. to treat
the problematic mite Varroa destructor (Varroidae) in bee colonies. Honey
bees are often exposed to high frequent doses of miticides as beekeepers
seek to counter the mite’s rapidly developing resistance to chemical
treatments (Elzen et al.,1999 Apidologie 30: 17-19; Elzen et al. 2000
Apidologie 31: 437-441). In addition, exposure to agrochemicals occurs
during flight and foraging activities (Rortais et al., 2005 Apidologie 36: 71-
83). Returning foragers may further contaminate nest-mates and

v
resources. Current risk assessments for pesticides examine lethality of
adult bees to a single active ingredient in a laboratory setting. However,
sub-lethal effects of pesticide on immature bees and effects from mixtures,
used in the field, are not routinely used to assess the toxicity of pesticides
during the registration process.
This study examined pesticide residue contamination found in
brood comb and investigated sub-lethal effects of pesticide residues on
larval survivability, adult longevity, and susceptibility to Nosema ceranae
(Nosematidae) infection. Worker bees were reared in contaminated
comb, containing high levels of pesticide residues, or in relatively “clean”
comb within the same colony. Comparisons of survivability from egg to
adult and larval development rates yielded lower survivability and
evidence of delayed development for bees reared in contaminated combs.
Adult longevity was. On average, four days shorter for bees reared in
contaminated combs compared to control bees. In a field experiment, a
significantly higher proportion of bees reared in contaminated comb were
infected with Nosema ceranae spores at a younger age and with higher
infections than bees reared in clean comb. This suggests early exposure
to pesticide residues during development can have serious effects on
larval survivability and subtle delayed effects in the adult stage.

vi
TABLE OF CONTENTS
Page
ACKNOWLEDGEMENTS ……………………………………………………..iii
ABSTRACT ……………………………………………………………………..iv
LIST OF TABLES ………………………………………………………..…….ix
LIST OF FIGURES ……………………………………………………………..x
MANUSCRIPT
1. A SURVEY OF PESTICIDE RESIDUE CONTAMINATION IN HONEY
BEE, APIS MELLIFERA L. (HYMENOPTERA: APIDAE), BROOD COMB
IN THE PACIFIC NORTHWEST…………………...………………….1
ABSTRACT ……………..……………………………………....1
INTRODUCTION …………………………...…………………..2
MATERIALS & METHODS ……………………………………4
Sampling procedure ……………………………………4
Chemical analysis ……………………………………...4
Description of data set …………………………………5
Statistical analysis ……………………………………...6
RESULTS ……………………………………………………….7
Brood comb samples in categories ………...…..…...8
Brood comb samples from dead & live colonies ……9
DISCUSSION ………………………………………………....10
Varroa mite problem ………………………………….10
vii
Beekeeper applied chemicals …………………….…11
Chemical interactions.…………………………………13
Metabolites ………………………………………….…14
Fungicides ……………………………………………..15
New foundation wax made from recycled comb …..17
Synergists ……………………………………………...18
CONCLUSIONS ………………………………………..……..18
REFERENCES …………………………………………….….20
2. SUB-LETHAL EFFECTS OF PESTICIDE RESIDUES IN BROOD
COMB ON WORKER HONEY BEE (APIS MELLIFERA)
DEVELOPMENT AND LONGEVITY………………………………...33
ABSTRACT ……………………………………………………33
INTRODUCTION ……………………………………………...34
MATERIALS & METHODS…………………………………...36
Treatment combs………………………………...........36
Experimental design ………………………………….37
Measurements ………………………………………...38
Statistical analysis …………………………………….39
RESULTS ……………………………………………………...39
Brood effects …………………………………………..39
Chemical analysis of comb …………………………..41
Adult emergence and longevity ……………………...42
viii
DISCUSSION ………………………………………………….43
Brood effects of pesticide exposure ………………...45
Adult longevity ………………………………………...47
REFERENCES ………………………………………………..48
3. INCREASED SUSCEPTIBILITY TO NOSEMA SPORES
(MICROSPORIDIA) INFECTION IN HONEY BEES (APIS
MELLIFERA) REARED FROM BROOD COMBS CONTAINING
HIGH LEVELS OF PESTICIDE RESIDUES ……………………….60
ABSTRACT ……………………………………………………60
SHORT COMMUNICATION ….……………………………..60
REFERENCES ………………………………………………..65

ix
LIST OF TABLES
MANUSCRIPT ONE
1ab. Characteristics of surveyed pesticides …………………………….25
MANUSCRIPT TWO
1. Pesticide residues detected in treatment combs (n=13) used to rear
treatment worker bees in experiments………………………………..58
2. Pesticide residues contained in treatment brood comb with observed
delayed development of worker honey bees ………………………..59
MANUSCRIPT THREE
1. Characteristics of pesticide residues detected in experimental
treatment combs Y & G ……………………………………………….68
x
LIST OF FIGURES
MANUSCRIPT ONE
1. Residue contributions based on pesticide groups in five categories of
honey bee brood comb………………………………………………... …27
2. Mean coumaphos & fluvalinate residue levels in five categories of
brood comb ..………………………………………………………………28
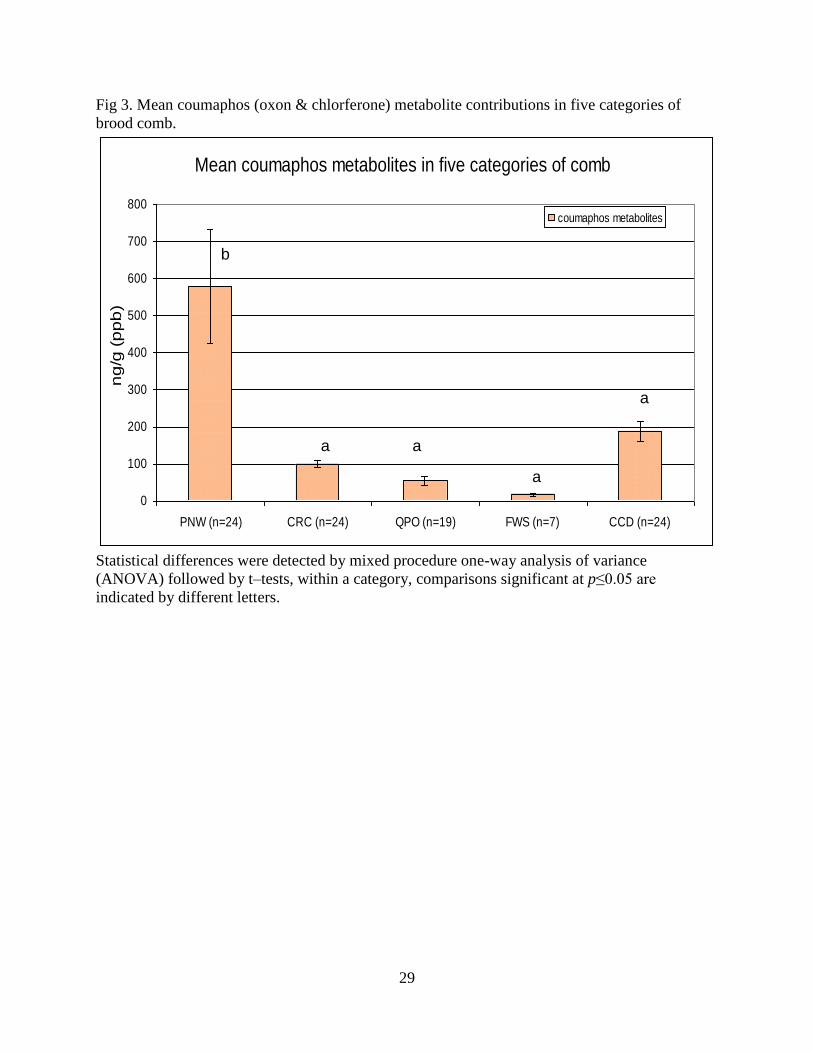
3. Mean coumaphos (oxon & chlorferone) metabolite contributions in five
categories of brood comb ……………………………………………….29
4. Mean amitraz (2,4 dimethylaniline & 2, 4 dimethylphenyl formamide)
metabolite contributions in five categories of brood comb …………..30
5. Mean insect/acaricide levels in brood comb from dead & live honey
bee colonies……………………………………………………………….31
6. Binary detections of coumaphos & fluvalinate in brood comb from dead
& live honey bee colonies ……………………………………………….32
MANUSCRIPT TWO
1. Percent and total larval mortality for bees reared in control vs.
treatment comb over time ……………………………………………….52
2. Percent larval mortality each sample date for bees reared in control
comb over multiple replications ……….………………………………..52
3. Percent larval mortality each sample date for bees reared in treatment
comb over multiple replications ………...………………………………53

xi
4. Percent larval mortality in larvae reared in control vs. treatment brood
comb over multiple replications ………………………………………..53
5. Average quantity (ppb) differences between pre & post experiment
analysis for control vs. treatment brood combs ………………………54
6a-c. Adult emergence of bees reared in control vs. treatment brood comb
(rep 1), (rep 2), and (rep 3) ………………………………………………….54
7a. Larval development of bees reared in control brood comb …………56
7b. Larval development of bees reared in brood comb containing 17
different pesticides ………………………………………………………..….56
7c. Worker brood reared in brood comb containing 17 different pesticides
at day 8 of development …………………………………………………….57
MANUSCRIPT THREE
1. Proportion of N. ceranae infected bees (x-axis) and mean spore level
within infected bees (y-axis) reared from control & treatment combs at
week 2, 3, 4 post adult emergence …………………………………...67
xii
Dedication
This thesis is dedicated to my mother and father who provided support
and encouragement throughout my life

1
MANUSCRIPT ONE
ABSTRACT
Honey bees, Apis mellifera L., are beneficial insects, providing pollinating
services for 130 crops and contributing $15 billion in added crop value in the US.
Recently, pesticides have been implicated in the phenomenon, colony collapse disorder
(CCD), responsible for major colony losses worldwide. Honey bee exposure to
pesticides and contamination of resources can occur from agricultural and beekeeper-
applied chemical treatments; therefore it is important to monitor the level of pesticide
contamination in brood comb where larval bees develop. In our survey, we detected 62
different pesticides, 12 metabolites, and 1 synergist (piperonyl butoxide) from five
categories of brood comb (n=98). Further analysis revealed significantly high levels of
insecticide residues in comb sampled from dead colonies compared to comb sampled
from live colonies (p=0.0338). Brood combs sampled from colonies identified with CCD
symptoms, had significantly high levels of coumaphos, a common beekeeper-applied
organophosphate acaricide (p=0.0008). While comb sampled from dead Pacific
Northwest migratory colonies (PNW) and collaborative research colonies (CRC), had
significantly high levels of fluvalinate, a common beekeeper-applied pyrethroid acaricide
(p=0.0003). Further research on possible effects of pesticide residues in brood comb
should be investigated given the gravity of pesticide contamination found in this survey.
Keywords Apis mellifera / pesticides / residues / brood comb

2
INTRODUCTION
The honey bee, Apis mellifera L. is widely regarded as an important pollinator,
contributing $15 billion in added crop value for 130 crops, annually in the U.S.
Beginning the winter of 2006-2007, U.S. beekeepers reported colony losses of 31.8%
due to a phenomenon called colony collapse disorder (CCD). Symptoms of CCD
include rapid colony decline, the presence of hives void of worker bees with only a few
young bees to care for the brood and the queen present. Evidence of sick, dead, or
dying bees were absent in and around the hives. Beekeepers also observed delayed
robbing or complete avoidance of CCD colonies and hive equipment by common hive
pests, such as small hive beetles (Aethina tumida) and wax moths (Achroia grisella,
Galleria mellonella). Currently, colony health continues to decline with estimated losses
at 35.8 and 28.6% for 2007-2008 and 2008-2009, respectively [1]. Several factors have
been implicated in the rapid decline of colony health, such as pesticide exposure, poor
nutritional value of crop, low diversity and abundance of forage, and migratory stress.
These factors along with numerous bee pests, pathogens, and viruses have all been
identified as possible contributing factors of colony collapse disorder [2].
Pesticides have been widely used, in agricultural and non-agricultural settings,
for many years. Market estimates of pesticide expenditure in the U.S. were reportedly
over $11 billion, or about 35% of world market pesticide expenditures, in 2001.
Worldwide, 5 billion pounds of pesticides were used annually, and over 20% or 1.2
billion pounds of active ingredients were used in the U.S. [3]. Heavy use and
dependence on chemical treatments increases the risk of pesticide exposure and
potential adverse effects on non-target organisms, such as honey bees, and their

3
environment. Chemical drift, persistent residues, leeching action, and contaminated
water sources are known risks to foraging honey bees and are examined during risk
assessments. Synergistic effects caused by chemical mixtures, effects of metabolites,
and sub-lethal effects, however, are often overlooked and unaccounted for when
assessing potential risks of pesticides to non-target organisms [4]. Acute poisoning
may cause apparent physical effects, such as trembling motion, dizziness,
uncoordinated movements, and feeding inhibition, while sub-lethal exposures may
cause less apparent neurological, physical, behavioral and or developmental problems
in honey bees. Honey bees and their products are effective biological indicators or
environmental sentinels due to frequent exposure to environmental pollutants during
foraging or flight activities [5]. Given the importance of honey bee pollination services
there should be regular testing and monitoring of contamination on bees and their
products. In order to investigate environmental risk pesticide residues on honey bees,
we must first assess the contaminant exposure honey bees are faced with by examining
the strength of the bees and the quality of bee products. A recent study examining
pesticide levels in bees and bee products in more than a dozen U.S. states revealed
astoundingly high levels of pesticide residues [6]. To compare, in this study, we
focused mainly on migratory beekeeping operations based in the Pacific Northwest
region, queen-producing operations and colonies that have succumb to CCD during
almond pollination. We sampled brood comb to determine the level of contamination
developing worker larvae are exposed to and established a baseline understanding of
the level of contamination, specifically which, how many, and at what concentrations are
pesticide residues found in honey bee comb according to the sample categories. We

4
also examined possible correlations between pesticide contamination in brood comb
and colony strength.
MATERIALS AND METHODS Sampling procedure
Standard Langstroth frames of brood comb (24.3 x 48.3 x 2.9-cm) were collected
from Pacific Northwest beekeeping operations. A single comb sample was collected
each from a separate colony. Comb samples were separated into five categories. The
first category consisted of combs (n=24) from migratory operations based in the Pacific
Northwest region (Washington, Montana, Oregon). These combs were selected from
dead or failing colonies (PNW). The second group of combs (n=24) were sampled from
collaborative research colonies (CRC) which were embedded within a migratory
operation and monitored monthly for pests by Washington State University diagnostics
lab. The third category of combs (n=19) were attained from six California queen-
producing operations (QPO). Commercial foundation wax sheets (n=7), used by
beekeepers to draw new comb, purchased from seven commercial suppliers (FWS)
constitutes the fourth category. The last category of combs (n=24), originated from
colonies suspected to have died from colony collapse disorder, were selected and
provided by Dr. Jeff Pettis USDA-ARS Beltsville, MD (CCD).
Chemical analysis
Ninety-eight brood comb samples were sent to Roger Simonds USDA-AMS-
National Science Laboratory, Gastonia, NC to be analyzed using QuEChERS method.
5
Pesticide residue extraction and analysis was accomplished using liquid
chromatography combined with tandem mass spectrometry (LC/MS/MS - Agilent 1100
LC equipped with a Thermo Quantum Discovery Max Triple Quadrupole Mass
Spectrometer or equivalent), gas chromatography coupled with mass selective
detection in electron impact mode (GC/MS-EI - Agilent 6890 GC equipped with a Agilent
5975 Mass Selective Detector in EI mode or equivalent), and gas chromatography
coupled with mass selective detection in negative chemical ionization mode (GC/MS-
NCI - Agilent 6890 GC equipped with a Agilent 5975 Mass Selective Detector in NCI
mode or equivalent). Pesticide residues extracted from comb samples were quantified
using matrix matched calibration standards of known concentrations prepared from neat
standard reference material. Measurements were reported in nanograms of active
ingredient per gram of wax (ng/g) or parts per billion (ppb). Identification of extracted
residues was achieved through mass spectral comparison of ion ratios with standards,
171 of the most commonly used pesticides and their metabolites, of known identity.
Limits of detection were low in the parts per billion (ppb).
Description of data set
Pesticide residue concentration and frequency of detection were considered for
samples within five defined categories of brood comb. Mean residue concentrations
were determined, for individual active ingredients and pesticide groups or classes,
within each category. Insecticide and acaricide pesticides were grouped together due
to the use of some active ingredients as either in different formulations. Residue
concentrations are reported in parts per billion (ppb) or percent concentration. We

6
describe frequency of an active ingredient as the number of positive detections divided
by the total number of detections within a category.
Statistical analysis
Statistical tests were conducted on mean pesticide content of a single active
ingredient, such as coumaphos or fluvalinate, or a group of active ingredients of the
same pesticide class or group, for example insecticide, fungicide, and metabolite
groups. Frequencies of positive detections were determined but not used for
statistically analysis. We used a linear mixed model one-way analysis of variance
(ANOVA) to analyze the relationship between pesticide content and the category from
which the comb was sampled. Category of comb was the independent variable while
each brood comb sampled was treated as an experimental unit. Mixed proc procedure
was used to account for the unequal variance in sample size between the five
categories of comb. Likelihood ratio and type III tests were used to estimate the
coefficient of the model. Indicators revealed that the effect (pesticide content and
sample categories) was significant. Further multiple pairwise comparison procedures
were performed using Fischer’s least-significant-difference (LSD) test.
Statistical analysis was also performed on mean pesticide content and the binary
response variable (dead or alive) representing colony strength at time of sampling.
Overall insecticide, metabolite, and coumaphos oxon levels were found to be significant
using one-way ANOVA procedure. Logistic regressions and Pearson correlation tests
were performed to analyze maximum likelihood estimates for coumaphos, fluvalinate,

7
and overall insecticide content. Significance was determined at 5% (p-value ≤ 0.05).
All tests were performed using SAS System, version 9.1.3.
RESULTS
Within 98 brood comb samples, residues of 62 different pesticides, 12
metabolites, and 1 synergist were found. The number of pesticides within a single
comb ranged from 3 to 22, averaging 8.9 different residues in each sample.
Insecticides (acaricides included) were the most frequent group of pesticide detected,
constituting 51 to 70% of the total number of pesticide detected among the five
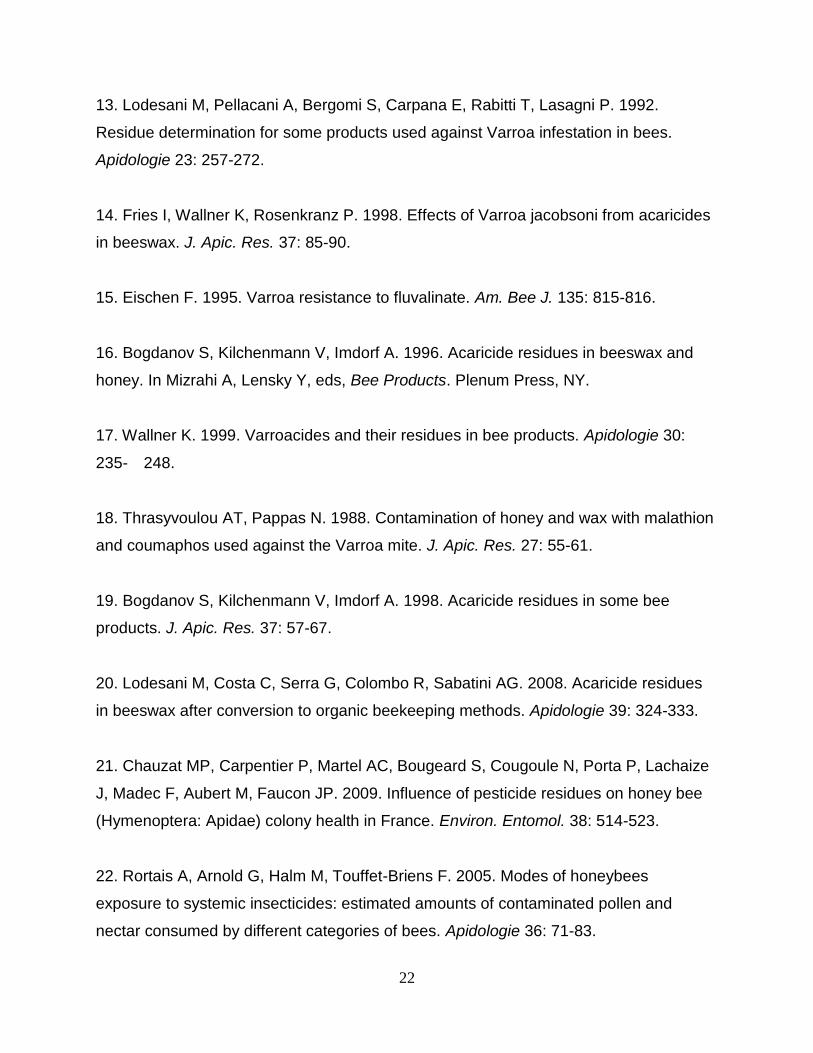
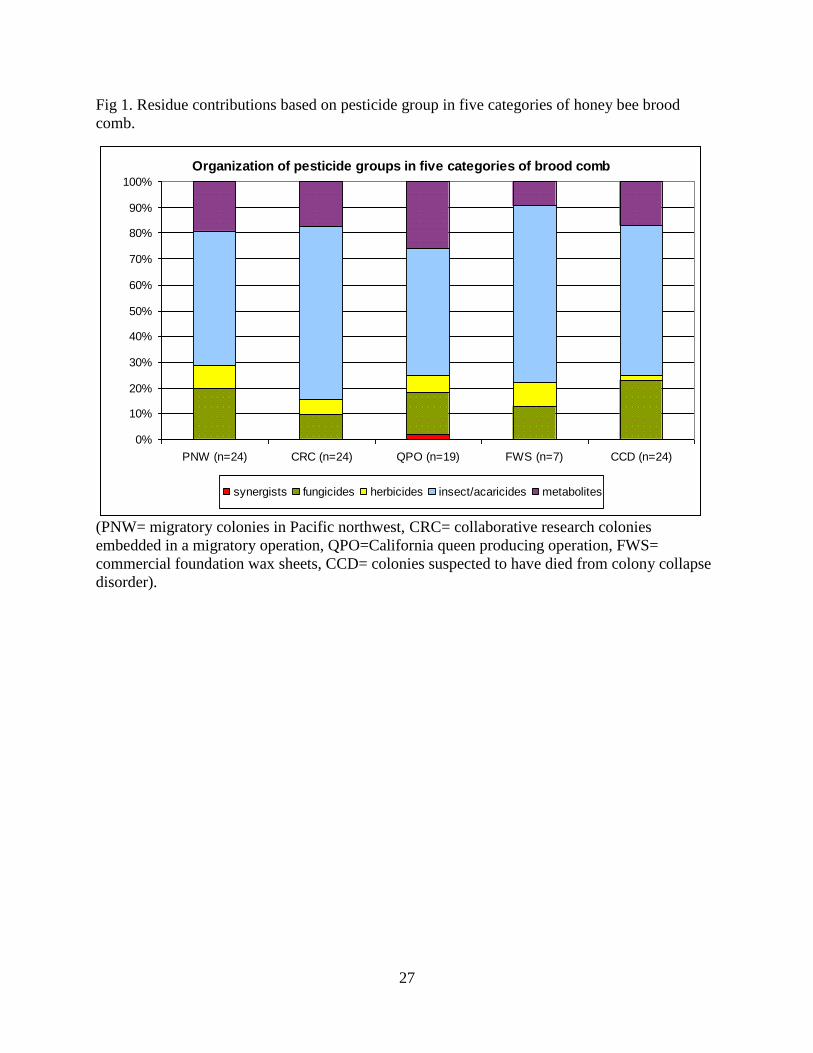
categories of combs and an overall mean of 61% (Fig 1). Of the 38 different
insecticides identified in the samples, 31 (82%) are categorized as either highly or
moderately toxic to honey bees by U.S. Environmental Protection Agency (EPA)
standards (table 1). The most frequent residue in combs consisted of two insecticide
classes: pyrethroids or synthetic pyrethrin compounds targeting voltage-sensitive
sodium channels, and organophosphates which are cholinesterase inhibitors.
Fluvalinate, a pyrethroid acaricide used by beekeepers, contributed 98% of the overall
pyrethroid concentration and was detected in 97% of the comb samples analyzed. The
concentration of fluvalinate residue detected ranged from 130 to 92,600 ppb in
individual combs. Coumaphos, an organophosphate acaricide applied by beekeepers,
contributed 97% of the overall average organophosphate quantity among all categories
and was detected in 99% of the combs. Individual samples varied in coumaphos
residue levels from 60 to 226,000 ppb. Positive detection of fluvalinate and coumaphos,
concurrently, was found in 96% of the total comb samples. Pesticide metabolites were
8
the second most commonly detected group of compounds after insecticides, averaging
15% of the total number of pesticide detections and ranging from 9 to 26% within the
five categories of combs. Of the 12 different metabolites detected, coumaphos oxon
was the most frequently found, present in 92% of all comb samples. Individual
samples, positive for coumaphos oxon, ranged from 9 to 3,140 ppb. Fungicide
residues, from 16 different active ingredients, constituted 11% of the total number of
pesticide detections and were the third most frequently detected pesticide group in
brood combs. Eight different herbicide residues were detected representing an average
of 6.6% of the total pesticides detected across all categories. Only one synergist,
piperonyl butoxide (PBO), was detected in two QPO samples, constituting 2 % of the
total QPO pesticide residue profile.
Brood comb samples in categories
The number of different pesticides detected within each category was not
significant. However, brood comb sampled from colonies with CCD had significantly
higher insecticide levels than QPO and FWS combs (p=0.0163) but was not statistically
different from PNW and CRC samples. PNW and CRC samples had significantly
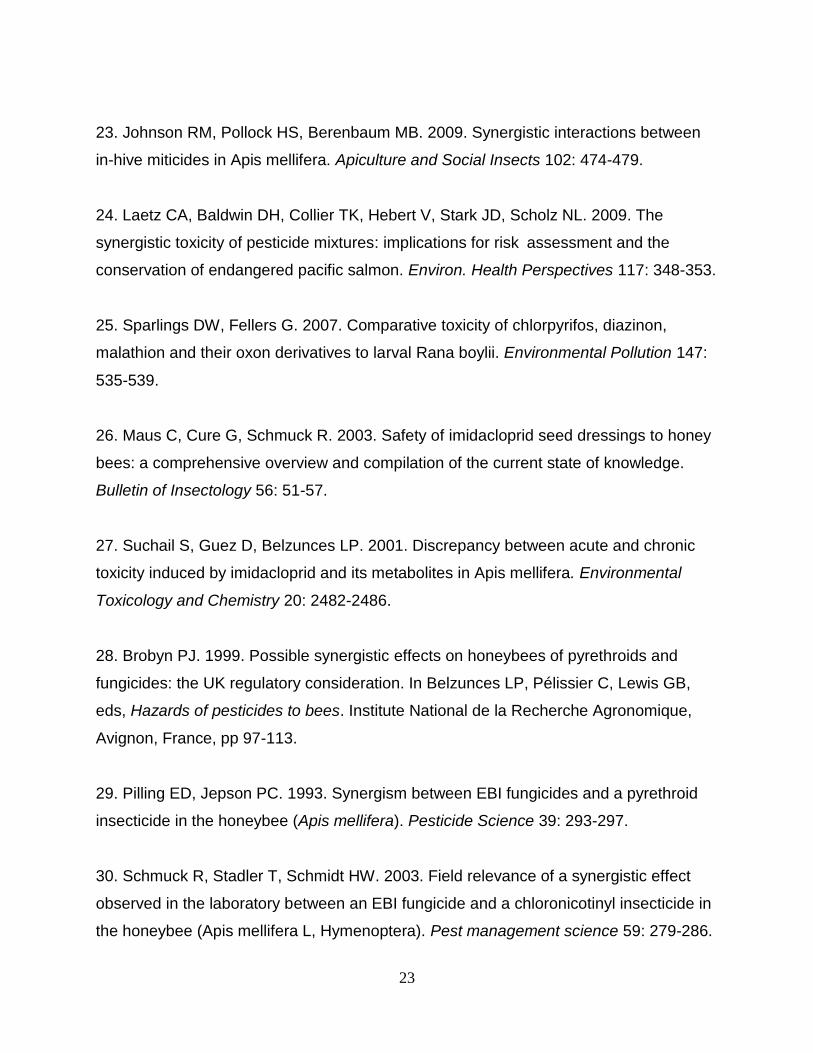
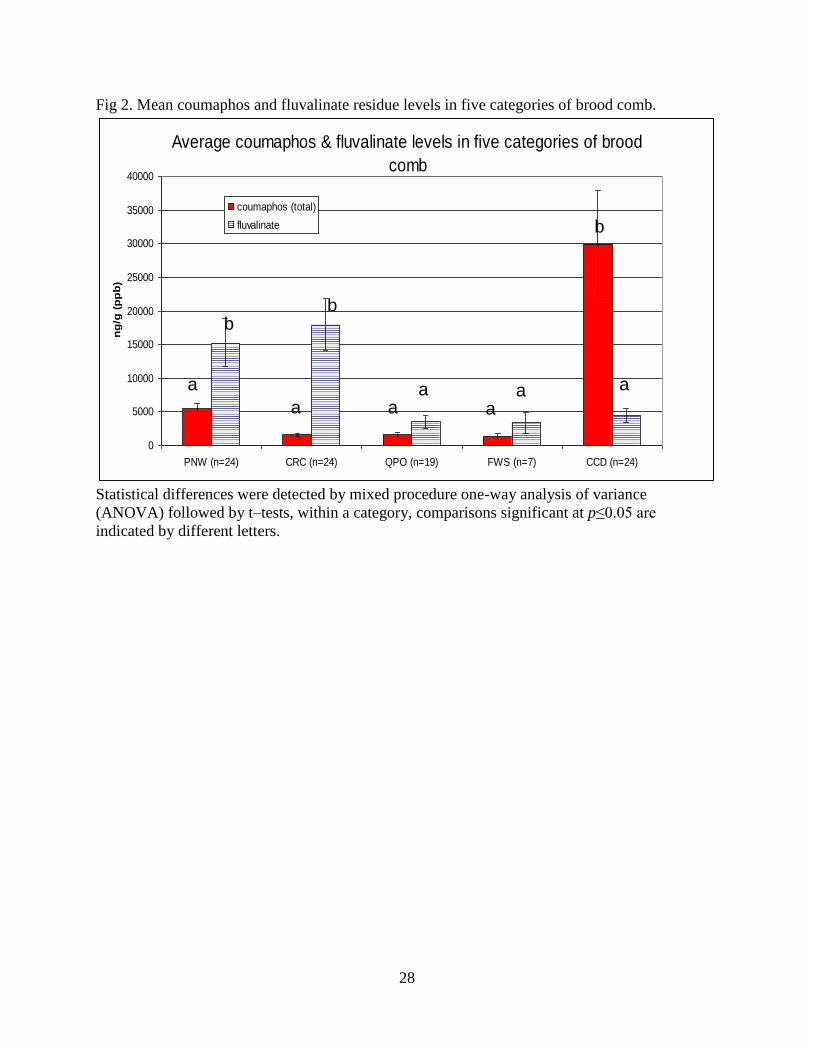
higher fluvalinate levels compared to the other categories of comb (p=0.0003).
Commercial wax foundation or FWS samples had the lowest fluvalinate average (510
ppb), while combs sampled from CRC had the highest average (17,900 ppb) (Fig. 2).
Combs from colonies suspected to have suffered from CCD had the highest average
(29,730 ppb) coumaphos levels than the other categories (p=0.0008), while QPO brood
comb had the lowest average (1,240 ppb) (Fig. 2). PNW and CCD samples had 54.2

9
and 45.8% of samples with concurrent detections of fluvalinate and coumaphos levels
exceeding 3,500 ppb, a concentration in which fluvalinate residues have shown adverse
sub-lethal effects [7]. In addition, PNW brood combs had the highest mean coumaphos
metabolite contributions, (oxon and chlorferone) (578 ppb) while the overall metabolite
residue level was significantly higher in QPO comb samples (p=0.0035) due to high
concentrations of 2,4 dimethylphenyl formamide (DMPF) and 2,4 dimethylaniline, two
major break-down products of amitraz, a beekeeper-applied triazapentadiene acaricide
not currently registered in the U.S. for the control of Varroa mites in honey bee hives
(Fig. 3). Fungicide residue levels were significantly higher in FWS samples (p=0.0063).
Brood comb samples from dead and live colonies
Collaborative research colonies were observed to be alive and strong when we
first sampled brood combs. Pesticide residue analysis revealed surprisingly high levels
of contaminates in CRC samples. Both fluvalinate and coumaphos residues were
detected in 100% of the samples and fluvalinate levels, in particular, was significantly
high (17,900 ppb). One year after the original sampling of combs, we found 67% of the
CRC colonies had died. To examine a possible correlation between pesticide residue
levels in brood comb and colony health we re-examined the combs based on whether
the colonies were dead (n=62) or alive (n=29) at the time of sampling (commercial
foundation wax sheets were not included in this grouping). Combs from dead colonies
(colonies sampled after death) had significantly higher insecticide levels than combs
from living colonies, while the number of different pesticides detected was not significant
(p=0.0338). In fact, 50% of brood combs from live colonies had less than 9,000 ppb of

10
insecticide residues compared with 50% of comb sampled from dead colonies which
had nearly twice the insecticide level, 17,000 ppb (Fig. 4). Fluvalinate and coumaphos
residue levels were not significantly different in dead and live colonies (p=0.429,
p=0.059). However, the proportion of samples with fluvalinate and coumaphos residue
levels simultaneously exceeding 3,500 ppb was 33.9 % for brood comb sampled from
dead colonies compared with 3.4% of combs sampled from live colonies (Fig. 4).
Additionally, comb samples from living colonies had significantly lower levels of
coumaphos oxon than combs from dead colonies (p=0.0389). Although fluvalinate and
coumaphos levels were not significant (p=0.429, p=0.0586), Pearson’s correlation
coefficients revealed coumaphos and insecticide predictors were highly correlated
(0.87912; p<0.0001) and fluvalinate was also correlated with the variable response, or
dead colonies (0.32109; p=0.0019). Fluvalinate and coumaphos residues contribute a
major portion of the total contamination in brood comb; however, there were many other
insecticide, fungicide, and herbicide residues present. While there was no difference in
the quantity of herbicide or fungicide residues between comb from dead and live
colonies, there is still potential for interaction.
DISCUSSION
Varroa mite problem
Varroa destructor (Anderson & Trueman) mites have been one of the most
problematic pests since their introduction to the U.S. in the 1980s. The small external
parasite feeds off bodily fluids or hemolymph of larval, pupal, and adult honey bees.

11
Puncture wounds in the integument of the host caused by feeding mites has been
suggested as means of introduction of other pathogens. Varroa parasitism causes
reduction of weight and longevity in bees while early infection can cause wing
deformities, permanently inhibiting bees from flight. Beekeeper applied pesticide
treatments including fluvalinate, coumaphos, amitraz, organic acids and essential oils
such as formic acid and thymol, have been the primary control method for suppressing
mite levels. However, mites have become increasingly resistant to registered pesticides
such as Apistan (fluvalinate), Checkmite (coumaphos), and the currently unregistered
amitraz [8-12]. Development of chemical-resistant mites is likely with sub-lethal
concentrations of residues persisting in wax, especially when mites are in close
proximity to contaminated wax for long periods of time [13]. In addition, cuticle layers
shed by developing brood within comb cells may serve as a barrier protecting mites
from concentrated exposure levels and potential effects from residual acaricides in wax,
furthering the opportunity of developing resistance [14].
Beekeeper applied chemicals
High colony losses result from uncontrolled mite infestations. Development of
chemical resistance to available acaricides develops rapidly, causing treatments to be
ineffective and leads to concerns about overdosing, misuse of applications, and or
improper timing and frequency of applications. The suggested control method to avoid
or delay chemical resistance in mites, in the past, was alternating acaricide treatments
of different pesticide classes and target sites [15]. Unfortunately, once in wax lipophilic
pesticides residues do not easily degraded, become more stable, and accumulate over

12
time [16]. The risk of greater distribution of contaminants and measurable levels of
residues in wax increases with higher concentrations, more frequent applications, and
greater residual persistence of active ingredients applied to hives [17]. Comb analysis
from this study illustrates the gravity of pesticide use and accumulation of residues in
brood comb. Contamination of beekeeper applied pesticide residues, in wax, from other
countries has revealed lower residue concentrations of fluvalinate (220 to 7,370 ppb)
and coumaphos (648 to 5,000 ppb) [7, 13, 18-21]. To compare, in this study, CCD
brood comb had over 4 times the average coumaphos level (29,730 ppb) and comb
samples from PNW and CRC had over 3 times the fluvalinate levels (15,202 and 17,907
ppb, respectively). Concerns over potential effects of accumulating residues in
beeswax are supported by studies that have reported adverse effects of sub-lethal
exposure to pesticides in wax on honey bees [7, 12]. The extent of transfer of
pesticides from comb wax to bees is not well studied; however, there are reports of
residue levels as high as 0.1 µg of tau-fluvalinate per bee from exposure to a standard
dose of Apistan from the previous year’s treatment [7]. Toxicity testing on honey bees
typically occurs on adult bees, although, all life stages of the honey bee are susceptible
to pesticide exposure [22]. Immobile soft-bodied larvae are potentially more vulnerable
than adult bees to exposure from contaminated comb during development. Studies on
developing queen bees have shown significant queen weight and ovary reduction with
fluvalinate and coumaphos levels in queen wax cells of 3,550 ppb and 50,000 ppb,
respectively [7]. Queen cell rejection, up to 50%, was also observed when coumaphos
was present in wax at 100,000 ppb [12]. Of the 92 samples positive for fluvalinate
residue in this study, 65 (71%) had levels exceeding 3,550 ppb.
13
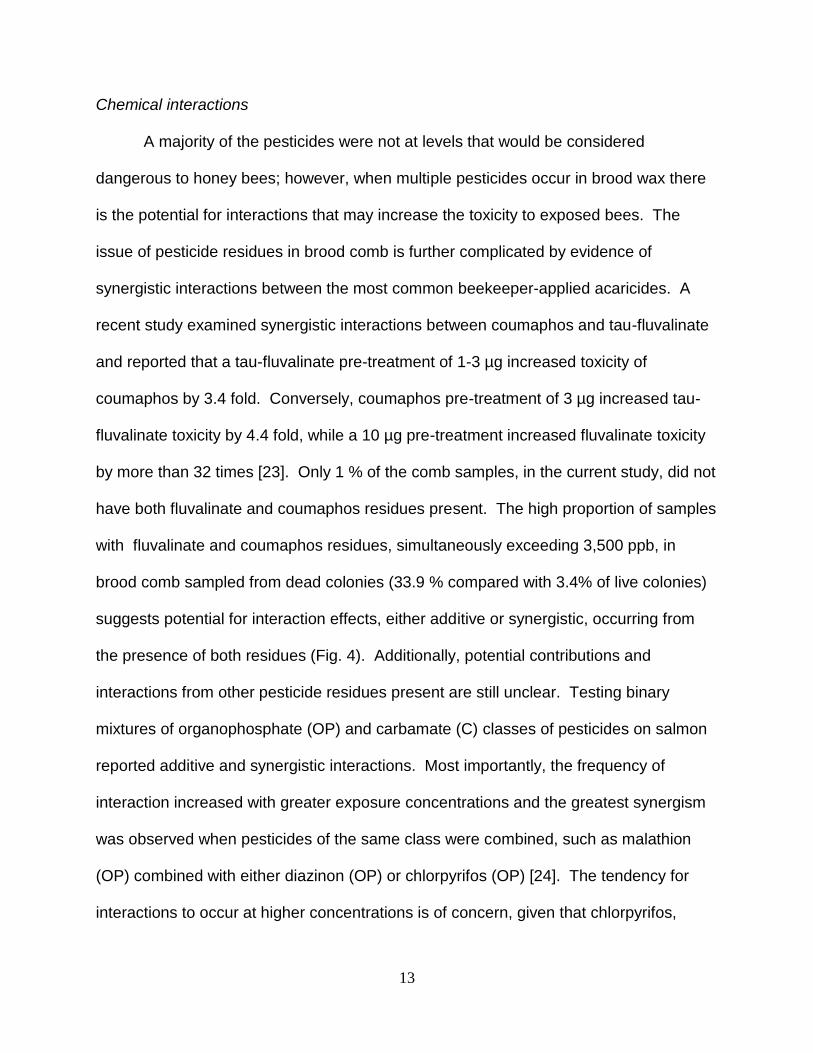
Chemical interactions
A majority of the pesticides were not at levels that would be considered
dangerous to honey bees; however, when multiple pesticides occur in brood wax there
is the potential for interactions that may increase the toxicity to exposed bees. The
issue of pesticide residues in brood comb is further complicated by evidence of
synergistic interactions between the most common beekeeper-applied acaricides. A
recent study examined synergistic interactions between coumaphos and tau-fluvalinate
and reported that a tau-fluvalinate pre-treatment of 1-3 µg increased toxicity of
coumaphos by 3.4 fold. Conversely, coumaphos pre-treatment of 3 µg increased tau-
fluvalinate toxicity by 4.4 fold, while a 10 µg pre-treatment increased fluvalinate toxicity
by more than 32 times [23]. Only 1 % of the comb samples, in the current study, did not
have both fluvalinate and coumaphos residues present. The high proportion of samples
with fluvalinate and coumaphos residues, simultaneously exceeding 3,500 ppb, in
brood comb sampled from dead colonies (33.9 % compared with 3.4% of live colonies)
suggests potential for interaction effects, either additive or synergistic, occurring from
the presence of both residues (Fig. 4). Additionally, potential contributions and
interactions from other pesticide residues present are still unclear. Testing binary
mixtures of organophosphate (OP) and carbamate (C) classes of pesticides on salmon
reported additive and synergistic interactions. Most importantly, the frequency of
interaction increased with greater exposure concentrations and the greatest synergism
was observed when pesticides of the same class were combined, such as malathion
(OP) combined with either diazinon (OP) or chlorpyrifos (OP) [24]. The tendency for
interactions to occur at higher concentrations is of concern, given that chlorpyrifos,
14
diazinon, and malathion are three of the eleven organophosphate forms detected in
honey bee brood comb. In addition to the organophosphate compounds, there were
twelve different pyrethroid compounds, five neonicotinoid, six chlorinated hydrocarbon,
and six carbamate contributions detected in brood comb (table 1).
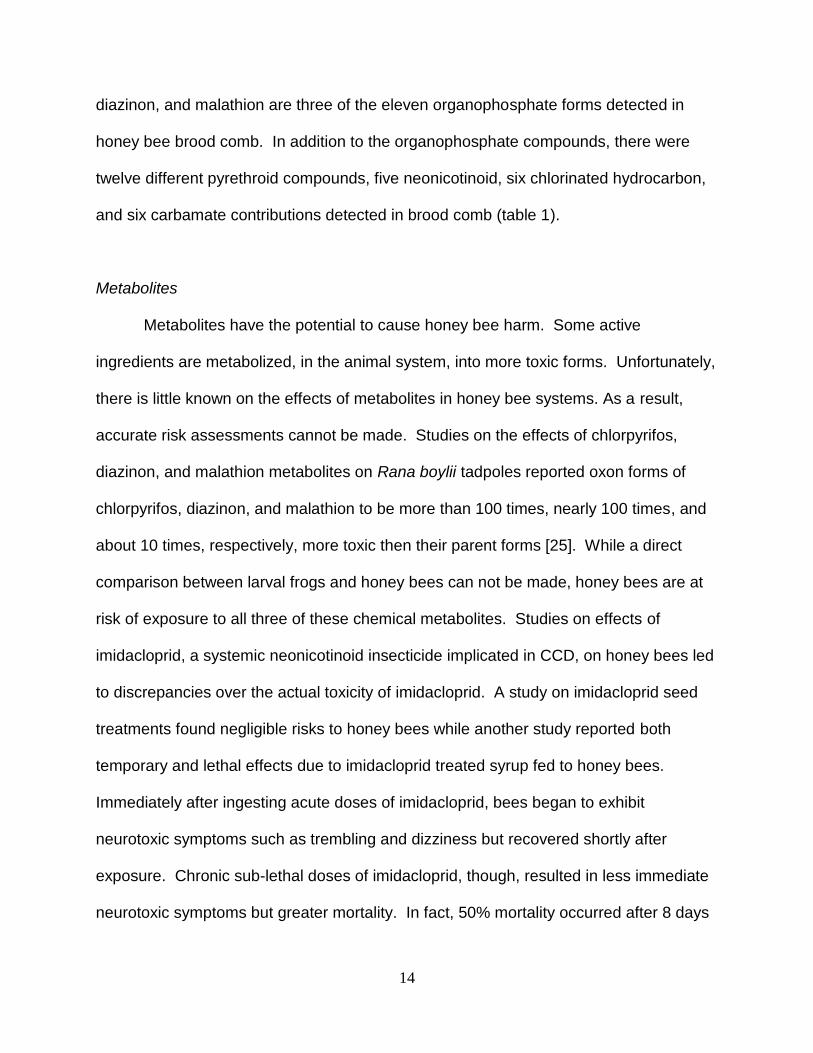
Metabolites
Metabolites have the potential to cause honey bee harm. Some active
ingredients are metabolized, in the animal system, into more toxic forms. Unfortunately,
there is little known on the effects of metabolites in honey bee systems. As a result,
accurate risk assessments cannot be made. Studies on the effects of chlorpyrifos,
diazinon, and malathion metabolites on Rana boylii tadpoles reported oxon forms of
chlorpyrifos, diazinon, and malathion to be more than 100 times, nearly 100 times, and
about 10 times, respectively, more toxic then their parent forms [25]. While a direct
comparison between larval frogs and honey bees can not be made, honey bees are at
risk of exposure to all three of these chemical metabolites. Studies on effects of
imidacloprid, a systemic neonicotinoid insecticide implicated in CCD, on honey bees led
to discrepancies over the actual toxicity of imidacloprid. A study on imidacloprid seed
treatments found negligible risks to honey bees while another study reported both
temporary and lethal effects due to imidacloprid treated syrup fed to honey bees.
Immediately after ingesting acute doses of imidacloprid, bees began to exhibit
neurotoxic symptoms such as trembling and dizziness but recovered shortly after
exposure. Chronic sub-lethal doses of imidacloprid, though, resulted in less immediate
neurotoxic symptoms but greater mortality. In fact, 50% mortality occurred after 8 days
15
of exposure, an observation that is neglected by short-term acute toxicity tests. Upon
further examination of imidacloprid metabolism in honey bees, rapid neurotoxic
symptoms appear to be the effect of imidacloprid, the parent compound; while mortality
was delayed, suggesting that the prolonged action was due to breakdown products of
imidacloprid. As the honey bee metabolized the toxin, the chemical was breaking into
compounds with greater toxicological consequences than the parent compound,
imidacloprid [26, 27].
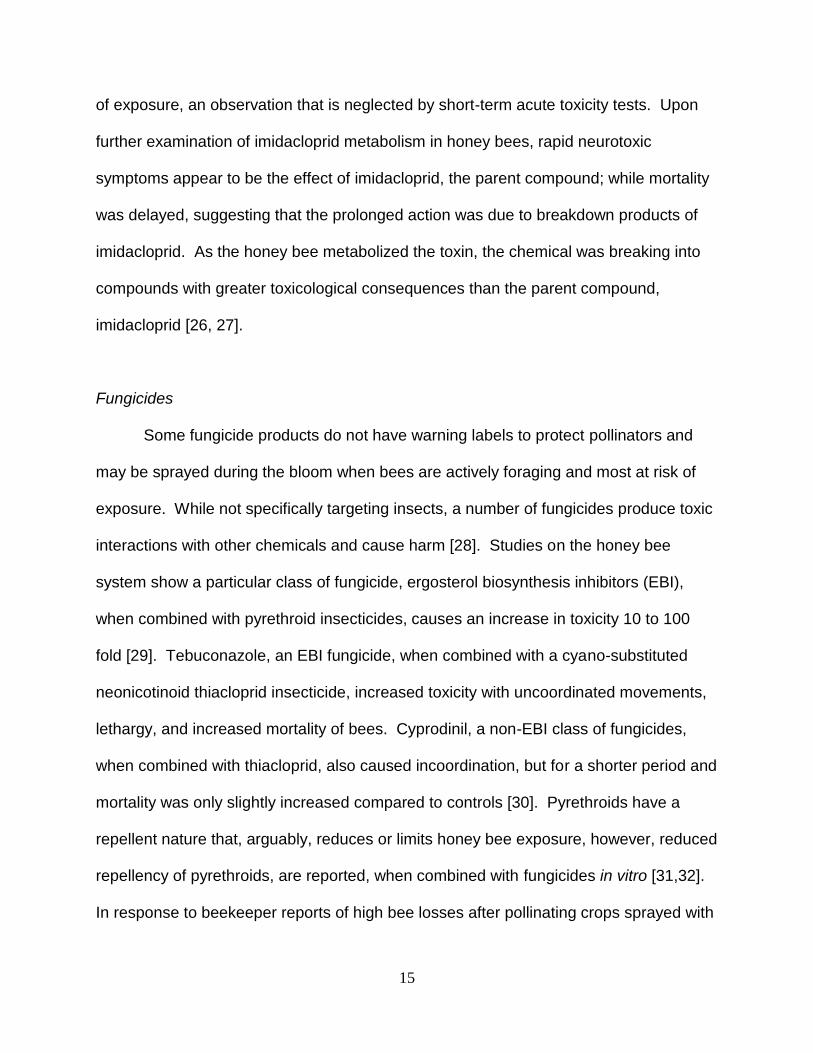
Fungicides
Some fungicide products do not have warning labels to protect pollinators and
may be sprayed during the bloom when bees are actively foraging and most at risk of
exposure. While not specifically targeting insects, a number of fungicides produce toxic
interactions with other chemicals and cause harm [28]. Studies on the honey bee
system show a particular class of fungicide, ergosterol biosynthesis inhibitors (EBI),
when combined with pyrethroid insecticides, causes an increase in toxicity 10 to 100
fold [29]. Tebuconazole, an EBI fungicide, when combined with a cyano-substituted
neonicotinoid thiacloprid insecticide, increased toxicity with uncoordinated movements,
lethargy, and increased mortality of bees. Cyprodinil, a non-EBI class of fungicides,
when combined with thiacloprid, also caused incoordination, but for a shorter period and
mortality was only slightly increased compared to controls [30]. Pyrethroids have a
repellent nature that, arguably, reduces or limits honey bee exposure, however, reduced
repellency of pyrethroids, are reported, when combined with fungicides in vitro [31,32].
In response to beekeeper reports of high bee losses after pollinating crops sprayed with

16
particular fungicides, one-day old larvae were fed diets containing the fungicides captan
(8.0 µg/bee), iprodione (0.5 µg/bee), and ziam (8.0 µg/bee) and significant mortality was
found in brood fed fungicides [33]. Another study assessed toxicity of five fungicides to
Osmia lignaria Say and Apis mellifera L. and found greater susceptibility of O. lignaria
bees to fungicide poisoning than honey bees, reinforcing greater need to study effects
of pesticides on other pollinators. Toxicity assessments, 72 hours after a single
exposure dose on O. lignaria bees (122.5 µg /bee), were low enough to consider captan
fungicide harmless (LD50contact = 269.7 µg/bee; LD50oral = 47.3 µg/bee) while
assessments 7 days after the same exposure was 3 to 4 times more toxic, suggesting
delayed toxicity [34]. The delayed effects, some would argue is due to sub-lethal
interaction effects, interruption of nesting and foraging behavior of O. lignaria bees for
several days post spraying, of tank mixtures containing fungicides, adjuvants, and
fertilizers. Standard pre-mixing procedures, in which fungicides and insecticides are
combined in large tanks and co-currently sprayed, are commonly used to reduce cost
and time. This practice increase efficacy of the pesticide mixture but is unregulated and
can increase the risk to bees and other pollinators. Risk to non-target organisms for
tank mixtures can not be assessed accurately because toxicity tests, required for
registration, focus on singular active ingredients in laboratory settings. There were 19
different fungicides identified, in this study, with several detected at relatively high
levels, including iprodione (878 ppb), cyprodinil (838 ppb), and hydroxychlorothalonil
(729 ppb), a degradation product of the active ingredient chlorothalonil. Chlorothalonil,
an organochlorine fungicide, was the most frequently detected fungicide and residues
constituted 37% of the total number of fungicide detections. Fungicide residues, in this

17
study, were detected more frequently in FWS samples (p=0.0063) with an average
concentration of 773 ppb.
New foundation wax made from recycled comb
Commercial foundation wax sheets are typically made from recycled capping
wax from extracted honey comb cells and can often be contaminated with pesticides
residues. Honey bees produce wax to cap or cover honey cells ready for storage.
During honey extraction, wax caps are removed to allow access to honey cells and wax
caps are processed and recycled to make foundation wax sheets. High levels of
fungicide residues in wax caps supports the prevalence of agricultural pesticide
exposure of foraging bees and the need to better assess risk of fungicides, fungicide
mixtures, and timing of sprays. A study in which wax was embedded with known
amounts of pesticides was heated, melted, and processed to be recycled into
foundation wax revealed acaricide residues to be on average 1.7 times higher then the
original comb. Boiling contaminated wax for varying durations and temperatures also
had no effect in reducing residue levels in old beeswax [16]. Analysis of foundation wax
from other countries revealed contamination ranges of 200-3,500 ppb and 500-8,000
ppb for coumaphos and fluvalinate, respectively [17, 35-37]. In this study, foundation
wax available for purchase from commercial suppliers, was positive for coumaphos
residues on average 3,357 ppb (236 -12,500 ppb) and for fluvalinate on average 1,243
ppb (64 – 2620 ppb). In addition to coumaphos and fluvalinate, residues of 19 other
insecticides, 7 fungicides, 4 herbicides, and 4 metabolites were detected in commercial
foundation wax samples
18
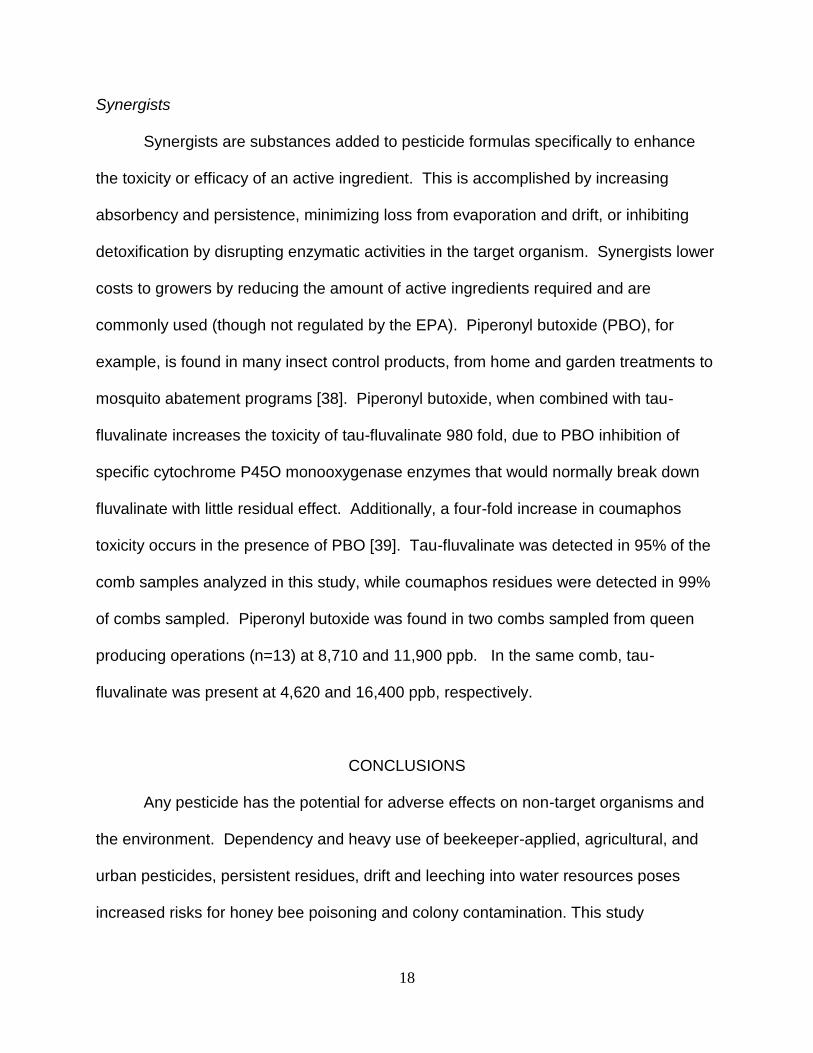
Synergists
Synergists are substances added to pesticide formulas specifically to enhance
the toxicity or efficacy of an active ingredient. This is accomplished by increasing
absorbency and persistence, minimizing loss from evaporation and drift, or inhibiting
detoxification by disrupting enzymatic activities in the target organism. Synergists lower
costs to growers by reducing the amount of active ingredients required and are
commonly used (though not regulated by the EPA). Piperonyl butoxide (PBO), for
example, is found in many insect control products, from home and garden treatments to
mosquito abatement programs [38]. Piperonyl butoxide, when combined with tau-
fluvalinate increases the toxicity of tau-fluvalinate 980 fold, due to PBO inhibition of
specific cytochrome P45O monooxygenase enzymes that would normally break down
fluvalinate with little residual effect. Additionally, a four-fold increase in coumaphos
toxicity occurs in the presence of PBO [39]. Tau-fluvalinate was detected in 95% of the
comb samples analyzed in this study, while coumaphos residues were detected in 99%
of combs sampled. Piperonyl butoxide was found in two combs sampled from queen
producing operations (n=13) at 8,710 and 11,900 ppb. In the same comb, tau-
fluvalinate was present at 4,620 and 16,400 ppb, respectively.
CONCLUSIONS
Any pesticide has the potential for adverse effects on non-target organisms and
the environment. Dependency and heavy use of beekeeper-applied, agricultural, and
urban pesticides, persistent residues, drift and leeching into water resources poses
increased risks for honey bee poisoning and colony contamination. This study

19
illuminates the high contamination of brood comb by pesticide residues and thereby a
constant source of chemical exposure for honey bees of all life stages and castes within
the hive. Beeswax acts as a sink for lipophilic pesticides, stabilizing compounds and
allowing residues to persist, even accumulate over time. The impact of contamination in
comb on honey bees is still unclear however, analysis of samples revealed significantly
high levels of insecticides in brood combs sampled from dead colonies. While this
survey can not conclude that there is evidence for sub-lethal effects from residues in
wax, it does suggest a correlation between the quantity of pesticides detected in brood
comb and the ultimate fate of colonies living with chronic pesticide exposure. This
correlation warrants further research specifically examining the effects of pesticide
residues in comb on developing and adult honey bees. Many of the pesticide residues
were detected infrequently or at low levels; therefore the analysis of brood comb, in this
study, elucidates which chemicals are of concern and merit further examination. In
addition to the importance of providing a relatively uncontaminated environment for
honey bees to live and breed, honey bee products are being readily used worldwide in
food storage, cosmetics, pharmaceuticals and apitherapy. Other industries also depend
on the wholesome image honey bee products have maintained for years. The quality of
beeswax, determined by the amount of measurable pesticide residues detected, should
be assessed and monitored for human consumption and use. Standards and maximum
residues limits for wax have been establish for beekeeper-applied acaricides in other
countries and should be determined for the United States. In addition to beekeeper-
applied pesticide standards, maximum residue limits should also be established for
agrochemicals commonly detected in wax. Production of commercial foundation wax

20
sheets should be tested regularly for adulterations and practices in recycling old comb
should be reduced or eliminated. Lastly, establishing a comb replacement schedule to
remove old combs will reduce the amount of measurable pesticide residues and
minimize chemical exposure to bees in the hive. Suppressing accumulation of residues
in comb may delay mite resistance to treatments and may allow applied pesticides to be
more effective to naïve mites. Reducing the concentration and frequency of beekeeper-
applied pesticides would help ensure the quality of beeswax and bee products sold in
the market and help protect honey bee health.
REFERENCES
1. VanEngelsdorp D, Hayes Jr. J, Underwood RM, Pettis J. 2010. A survey of honey
bee colonies losses in the United States, fall 2008 and spring 2009. J. Apic. Res 49: 7-
14.
2. VanEngelsdorp D, Evans J, Saegerman C, Mullin C, Haubruge E, Nguyen BK,
Frazier M, Frazier J, Cox-Foster D, Chen Y, Underwood R, Tarpy DR, Pettis JS. 2009.
Colony collapse disorder: a descriptive study. PLosONE 4: e6481.
3. U.S. Environmental Protection Agency. Pesticide industry sales and usage: 2000 and
2001 market estimates. (accessed May 2008)
http://www.epa.gov/oppbead1/pestsales/01pestsales/market_estimates2001.pdf.
4. Lappé M, Bailey B. 2002. New considerations for evaluating pesticide impacts to
endangered/threatened species. U.S. Fish and Wildlife Service and National Marine
Fisheries Service report to the Environmental Protection Agency. Case No. C00-3150
CW: 1-64.

21
5. Porrini C, Sabatini AG, Girotti S, Ghini S, Medrzycki P, Grillenzoni F, Bortolotti L,
Gattavecchia E, Celli G. 2003. Honey bees and bee products as monitors of the
environmental contamination. Apiacta 38: 63-70.
6. Mullin CA, Frazier M, Frazier JL, Ashcraft S., Simonds R, vanEngelsdorp D, Pettis
JS. 2010. High levels of miticides and agrochemicals in North American apiaries:
implications for honey bee health. PLOS one 5: e9754
7. Haarmann T, Spivak M, Weaver D, Weaver B, Glenn T. 2002. Effects of fluvalinate
and coumaphos on queen honey bees (Hymenoptera: Apidae) in two commercial queen
rearing operations. J. Econ. Entomol. 95: 28-35.
8. Baxter J, Eischen F, Pettis J, Wilson WT, Shimanuki H. 1998. Detection of
fluvalinate-resistant Varroa mites in US honey bees. Am. Bee J. 138: 291.
9. Elzen PJ, Eischen FA, Baxter JR, Elzen GW, Wilson WT. 1999. Detection of
resistance in US Varroa jacobsoni Oud. (Mesostimata: Varroidae) to the acaricide
fluvalinate. Apidologie 30: 17-19.
10. Elzen PJ, Baxter JR, Spivak M, Wilson WT. 2000. Control of Varroa jacobsoni Oud.
resistant to fluvalinate and amitraz using coumaphos. Apidologie 31: 437-441.
11. Elzen PJ, Westervelt D. 2002. Detection of Coumaphos resistance in Varroa
destructor in Florida. Am. Bee J. 142: 291-292.
12. Pettis JS, Collins AM, Wilbanks R, Feldlaufer MF. 2004. Effects of coumaphos on
queen rearing in the honey bee, Apis mellifera. Apidologie 35: 605-610.
22
13. Lodesani M, Pellacani A, Bergomi S, Carpana E, Rabitti T, Lasagni P. 1992.
Residue determination for some products used against Varroa infestation in bees.
Apidologie 23: 257-272.
14. Fries I, Wallner K, Rosenkranz P. 1998. Effects of Varroa jacobsoni from acaricides
in beeswax. J. Apic. Res. 37: 85-90.
15. Eischen F. 1995. Varroa resistance to fluvalinate. Am. Bee J. 135: 815-816.
16. Bogdanov S, Kilchenmann V, Imdorf A. 1996. Acaricide residues in beeswax and
honey. In Mizrahi A, Lensky Y, eds, Bee Products. Plenum Press, NY.
17. Wallner K. 1999. Varroacides and their residues in bee products. Apidologie 30:
235- 248.
18. Thrasyvoulou AT, Pappas N. 1988. Contamination of honey and wax with malathion
and coumaphos used against the Varroa mite. J. Apic. Res. 27: 55-61.
19. Bogdanov S, Kilchenmann V, Imdorf A. 1998. Acaricide residues in some bee
products. J. Apic. Res. 37: 57-67.
20. Lodesani M, Costa C, Serra G, Colombo R, Sabatini AG. 2008. Acaricide residues
in beeswax after conversion to organic beekeeping methods. Apidologie 39: 324-333.
21. Chauzat MP, Carpentier P, Martel AC, Bougeard S, Cougoule N, Porta P, Lachaize
J, Madec F, Aubert M, Faucon JP. 2009. Influence of pesticide residues on honey bee
(Hymenoptera: Apidae) colony health in France. Environ. Entomol. 38: 514-523.
22. Rortais A, Arnold G, Halm M, Touffet-Briens F. 2005. Modes of honeybees
exposure to systemic insecticides: estimated amounts of contaminated pollen and
nectar consumed by different categories of bees. Apidologie 36: 71-83.
23
23. Johnson RM, Pollock HS, Berenbaum MB. 2009. Synergistic interactions between
in-hive miticides in Apis mellifera. Apiculture and Social Insects 102: 474-479.
24. Laetz CA, Baldwin DH, Collier TK, Hebert V, Stark JD, Scholz NL. 2009. The
synergistic toxicity of pesticide mixtures: implications for risk assessment and the
conservation of endangered pacific salmon. Environ. Health Perspectives 117: 348-353.
25. Sparlings DW, Fellers G. 2007. Comparative toxicity of chlorpyrifos, diazinon,
malathion and their oxon derivatives to larval Rana boylii. Environmental Pollution 147:
535-539.
26. Maus C, Cure G, Schmuck R. 2003. Safety of imidacloprid seed dressings to honey
bees: a comprehensive overview and compilation of the current state of knowledge.
Bulletin of Insectology 56: 51-57.
27. Suchail S, Guez D, Belzunces LP. 2001. Discrepancy between acute and chronic
toxicity induced by imidacloprid and its metabolites in Apis mellifera. Environmental
Toxicology and Chemistry 20: 2482-2486.
28. Brobyn PJ. 1999. Possible synergistic effects on honeybees of pyrethroids and
fungicides: the UK regulatory consideration. In Belzunces LP, Pélissier C, Lewis GB,
eds, Hazards of pesticides to bees. Institute National de la Recherche Agronomique,
Avignon, France, pp 97-113.
29. Pilling ED, Jepson PC. 1993. Synergism between EBI fungicides and a pyrethroid
insecticide in the honeybee (Apis mellifera). Pesticide Science 39: 293-297.
30. Schmuck R, Stadler T, Schmidt HW. 2003. Field relevance of a synergistic effect
observed in the laboratory between an EBI fungicide and a chloronicotinyl insecticide in
the honeybee (Apis mellifera L, Hymenoptera). Pest management science 59: 279-286.

24
31. Rieth JP, Levin MD. 1989. The repellent effects of two pyrethroid insecticides on the
honey bee. J. Apicult. Res. 28: 175-179.
32. Thompson H, Wilkins S. 2003. Assessment of the synergy and repellency of
pyrethroid/fungicide mixtures. Bulletin of Insectology 56: 133-134.
33. Mussen EC, Lopez JE, Peng CYS. 2004. Effects of selected fungicides on growth
and development of larval honey bees, Apis mellifera L. (Hymenoptera: Apidae).
Environ. Entomol. 33: 1151-1154.
34. Ladurner E, Bosch J, Kemp WP, Maini S. 2005. Assessing delayed and acute
toxicity of five formulated fungicides to Osmia lignaria Say and Apis mellifera.
Apidologie 36: 449-460.
35. Bogdanvo S, Kilchenmann V. 1995. Acaricide residues in beeswax: long-term
studies in Switerland. Apidologie 26: 319-321.
36. Wallner K. 1997. The actual beeswax quality in foundations from the market.
Apidologie 28: 168-170.
37. Tremolada P, Bernardinelli I, Colombo M, Spreafico M, Vighi M. 2004. Coumaphos
distribution in the hive ecosystem: case study for modeling applications.
Ecotoxicology 13: 589-601.
38. Cox C. 2002. Insecticide synergist factsheet: piperonyl butoxide. Journal of
Pesticide Reform 22: 12-20.
39. Johnson RM, Wen Z, Schuler MA, Berenbaum MR. 2006. Mediation of pyrethroid
insecticide toxicity to honey bees (Hymenoptera: Apidae) by cytochrome P450
monooxygenases. Journal of Economic Entomology 99: 1046-1050.

Azoxystrobin FUNG s Strobilurin >200 16.3% 2.4 2.0 36.0 2
Boscalid FUNG s Carboxamide 100.0 10.2% 6.3 19.4 128.0 4
Chlorothalonil FUNG Chloronitrile >100 37.8% 61.1 3.3 4170.0 1
Cyprodinil FUNG s Anilinopyrimidine 113.0 25.5% 21.4 10.0 838.0 16
Dicloran FUNG Nirtoaniline 181.0 1.0% 0.0 * 2.5 1
Fenhexamid FUNG Hydroxyanilide >200 1.0% 0.5 * 46.3 6
Flutolanil FUNG s Benzanilide - 7.1% 17.1 81.6 584.0 4
Hexachlorobenzene (HCB) FUNG Chlorinated hydrocarbon 1.0% 0.0 * 4.5 1
Iprodione FUNG Dicarboximide >400 10.2% 17.4 37.6 297.0 20
Pyraclostrobin FUNG Strobilurin >73.1 6.1% 2.0 9.0 46.1 15
Pyrimethanil FUNG Anilinopyrimidine >100 7.1% 1.4 5.4 46.4 3
Quintozene (PCNB) FUNG Organochlorine 100.0 1.0% 0.0 * 4.8 1
Thiabendazole FUNG s Benzimidazole 50.0 4.1% 0.2 1.6 7.6 4
Trifloxystrobin FUNG s Strobilurin 200.0 4.1% 0.3 5.6 10.4 1
Triticonazole FUNG s Triazole >100 2.0% 4.5 27.4 409.0 10
Vinclozolin FUNG Dicarboximide 100.0 4.1% 0.1 1.1 1.4 1
Ethofumesate HERB s Benzofuranyl alkylsulfonate > 50,000 1.0% 2.0 * 200.0 5
Fluridone HERB s aquatic 363.0 7.1% 0.4 1.2 10.6 50
Norflurazon HERB s Fluorinated pyridazinone >235 2.0% 0.1 5.0 5.6 6
Oxyfluorfen HERB Diphenyl ether 100.0 26.5% 1.2 1.1 26.5 1
Pendimethalin HERB Dinitroaniline 59.0 10.2% 1.8 5.8 63.0 6
Sethoxydim HERB s Cyclohexadione 10.0 m 78000 1.0% 0.1 * 14.2 8
Tribufos (DEF) HERB SYN Organophosphate 44.2 1.0% 0.0 * 4.2 2
Trifluralin HERB Dinitroaniline 100.0 7.1% 0.2 1.1 8.6 1
Aldicarb INSECT s Carbamate 0.09 h 702 1.0% 0.2 * 20.0 4
Bifenthrin INSECT Pyrethroid 0.02 h 117 3.1% 0.2 4.8 12.0 1
Carbaryl INSECT ps Carbamate 1.5 h 11700 2.0% 0.3 9.2 16.1 30
Carbofuran INSECT s Carbamate 0.16 h 1248 1.0% 0.3 * 32.0 5
Chlorpyrifos INSECT Organophosphate 0.11 h 858 84.7% 7.1 1.0 49.7 1
Clothianidin INSECT s Neonicotinoid 0.004 h 31.2 1.0% 0.4 * 35.0 20
Coumaphos INSECT Organophosphate 4.6 m 36114 99.0% 9193.6 63.5 226000.0 1
Cyfluthrin INSECT Pyrethroid 37.0 3.1% 0.2 3.6 7.9 2
Cyhalothrin total INSECT Pyrethroid 0.90 h 7020 4.1% 0.1 0.2 6.6 1
Cypermethrin INSECT Pyrethroid 0.03 h 195 19.4% 2.1 1.4 28.8 2
Diazinon INSECT Organophosphate 0.09 h 702 6.1% 0.6 1.4 24.4 1
Dicofol INSECT Chlorinated hydrocarbon 30.0 13.3% 3.4 1.7 240.0 1
Dinotefuran INSECT s Neonicotinoid 0.02 h 179.4 1.0% 1.0 * 97.0 30
Diphenylamine INSECT Amine - 3.1% 4.6 20.0 281.0 1
Endosulfan I INSECT Chlorinated hydrocarbon 7.0 m 54600 45.9% 2.8 1.0 80.9 1
Endosulfan II INSECT Chlorinated hydrocarbon 7.0 m 54600 37.8% 1.7 1.0 46.2 1
LODmaxminAvgr%ppb/beeToxicityLD50/LC50Chemical familys/psPurposeActive ingredient
Active ingredient, purpose of use (FUNG, fungicide; HERB, herbicide; INSECT, insect/acaricide), systemic compound (s)
or partially systemic (ps), synergist (SYN), chemical family, LD50/LC50 values for honey bees, toxicity category (h, highly
toxic; m, moderately toxic to bees), *LD50/LC50 converted to ppb/bee, % positive detections, Avgr (average concentration
of residue (ng/g)), minimum and maximum ranges of residue, LOD (limit of detection)
Table 1a. Characteristics of surveyed pesticides
* ppb/bee (based on LD/LC50-bee and average fresh weight per bee (128 mg) (Pollinator protection: a bee & pesticide handbook. 1990. C.A Johansen, D.F. Mayer)

Table 1b. Characteristics of surveyed pesticides cont.
LODmaxminAvgr%ppb/beeToxicity LD50/LC50Chemical familys/psPurposeActive ingredient
* ppb/bee (based on LD/LC50-bee and average fresh weight per bee (128 mg) (Pollinator protection: a bee & pesticide handbook. 1990. C.A Johansen, D.F. Mayer)
Esfenvalerate INSECT Pyrethroid 0.41 h 3198 38.8% 7.7 1.0 215.0 1
Fenpropathrin INSECT Pyrethroid 0.05 h 390 3.1% 0.5 4.2 39.4 1
Fluvalinate INSECT Pyrethroid 0.88 h 6864 96.9% 10102.6 127.4 92600.0 1
Heptachlor INSECT Chlorinated hydrocarbon 0.53 h 4134 1.0% 0.0 * 3.1 4
Lindane INSECT Chlorinated hydrocarbon <2 h 2106 2.0% 0.2 2.1 16.0 4
Malathion INSECT Organophosphate 0.27 h 2106 7.1% 1.1 2.4 51.6 4
Methidathion INSECT Organophosphate 0.24 h 1872 1.0% 0.2 * 17.7 10
Oxamyl INSECT s Carbamate 0.38 h 2964 1.0% 0.2 * 22.0 5
Parathion methyl INSECT Organophosphate 0.11-0.24 h 858-1872 1.0% 0.1 * 7.7 2
Permethrin total INSECT Pyrethroid 0.029-0.16 h 226-1248 7.1% 38.0 83.3 1220.0 10
Phenothrin INSECT Pyrethroid 0.03 h 234 3.1% 0.9 19.5 44.8 10
Prallethrin INSECT Pyrethroid 0.028 h 218.4 1.0% 0.0 * 3.3 4
Propargite INSECT ps Organosulfur 47.9 1.0% 26.9 * 2640.0 10
Pyrethrins INSECT Pyrethroid 0.022 h 171.6 7.1% 78.6 50.0 3570.0 50
Tetradifon INSECT mitochondrial ATP synthase inhibitor 11.0 m 85800 1.0% 0.1 * 9.6 1
Tetramethrin INSECT Pyrethroid 0.16 h 1248 4.1% 0.7 4.2 29.9 10
Thiacloprid INSECT s Neonicotinoid 17.32 1.0% 1.2 * 113.0 8
Imidacloprid INSECT s Neonicotinoid 0.02 h 185 1.0% 0.5 * 45.0 20
Phosalone INSECT Organophosphate 4.5 m 35100 5.1% 1.3 12.7 49.0 10
Pyriproxyfen INSECT Juvenile hormone mimic 100 1.0% 0.0 * 1.2 1
Fenpyroximate INSECT s Phenoxypyrazole 15.8 4.1% 2.9 9.6 201.0 5
Thiamethoxam INSECT s Neonicotinoid 0.024 h 187.2 1.0% 0.4 * 38.0 20
1-Naphthol ps Metabolite of carbaryl 1.0% 0.4 * 41.6 10
2,4 Dimethylaniline Metabolite of amitraz 6.1% 33.8 77.0 1550.0 50
2,4 Dimethylphenyl formamide (DMPF) Metabolite of amitraz 44.9% 137.9 18.5 3180.0 4
3-hydroxycarbofuran s Metabolite of carbofuran 1.0% 0.2 * 23.0 4
Carbendazim (MBC) s Metabolite of benomyl (benzimidazole) fungicide 13.3% 2.8 4.0 100.0 5
Chlorpyrifos methyl Metabolite of chlorpyrifos 1.0% 0.0 * 1.2 1
Coumaphos oxon Metabolite of coumaphos 91.9% 179.6 9.0 3140.0 5
Endosulfan sulfate Metabolite of endosulfan 22.4% 1.2 1.0 60.0 1
Hydroxychlorothalonil Metabolite of chlorothalonil (tetrachloroisophthalonitrile) fungicide 1.0% 7.4 * 729.0 50
Malathion Oxon Metabolite of malathion 1.0% 0.2 * 22.0
THPI s Metabolite of captan (dicarboximide) fungicide 7.1% 7.7 7.1 299.0 50
Chlorferone Metabolite of coumaphos 5.1% 43.9 80.5 1890.0 50
Piperonyl butoxide Synergist SYN 2.0% 210.3 8710.0 11900.0 6
Active ingredient, purpose of use (FUNG, fungicide; HERB, herbicide; INSECT, insect/acaricide), systemic compound (s)
or partially systemic (ps), synergist (SYN), chemical family, LD50/LC50 values for honey bees, toxicity category (h, highly
toxic; m, moderately toxic to bees), *LD50/LC50 converted to ppb/bee, % positive detections, Avgr (average concentration
of residue (ng/g)), minimum and maximum ranges of residue, LOD (limit of detection)
27
Fig 1. Residue contributions based on pesticide group in five categories of honey bee brood
comb.
(PNW= migratory colonies in Pacific northwest, CRC= collaborative research colonies
embedded in a migratory operation, QPO=California queen producing operation, FWS=
commercial foundation wax sheets, CCD= colonies suspected to have died from colony collapse
disorder).
Organization of pesticide groups in five categories of brood comb
0%
10%
20%
30%
40%
50%
60%
70%
80%
90%
100%
PNW (n=24) CRC (n=24) QPO (n=19) FWS (n=7) CCD (n=24)
synergists fungicides herbicides insect/acaricides metabolites
28
Fig 2. Mean coumaphos and fluvalinate residue levels in five categories of brood comb.
Statistical differences were detected by mixed procedure one-way analysis of variance
(ANOVA) followed by t–tests, within a category, comparisons significant at p≤0.05 are
indicated by different letters.
Average coumaphos & fluvalinate levels in five categories of brood
comb
0
5000
10000
15000
20000
25000
30000
35000
40000
PNW (n=24) CRC (n=24) QPO (n=19) FWS (n=7) CCD (n=24)
ng
/g (
pp
b)
coumaphos (total)
fluvalinate
a
a a a
a a
b
b b
a
29
Fig 3. Mean coumaphos (oxon & chlorferone) metabolite contributions in five categories of
brood comb.
Statistical differences were detected by mixed procedure one-way analysis of variance
(ANOVA) followed by t–tests, within a category, comparisons significant at p≤0.05 are
indicated by different letters.
Mean coumaphos metabolites in five categories of comb
0
100
200
300
400
500
600
700
800
PNW (n=24) CRC (n=24) QPO (n=19) FWS (n=7) CCD (n=24)
ng
/g (
pp
b)
coumaphos metabolites
b
a
a
a a

30
Fig 4. Mean amitraz (2,4 dimethylaniline & 2, 4 dimethylphenyl formamide) metabolite
contributions in five categories of brood comb.
Statistical differences were detected by mixed procedure one-way analysis of variance
(ANOVA) followed by t–tests, within a category, comparisons significant at p≤0.05 are
indicated by different letters.
Mean amitraz metabolites in five categories of brood comb
0
100
200
300
400
500
600
700
800
900
1000
PNW (n=24) CRC (n=24) QPO (n=19) FWS (n=7) CCD (n=24)
ng/g
(ppb)
amitraz metabolites
b
a
a
a
a

31
Fig 5. Mean insect/acaricide levels in brood comb from dead & live honey bee colonies.
The percent of samples, with insect/acaricide levels greater than the specified value, detected in
brood comb from dead (n=62) and live (n=29) colonies. (At 50% positive detection, samples
from dead colonies had over 2x the amount of residues than combs from live colonies).
Mean insect/acaricide levels in brood comb from dead & live colonies
0%
20%
40%
60%
80%
100%
>200
0
>400
0
>600
0
>800
0
>100
00
>120
00
>140
00
>160
00
>180
00
>200
00
>220
00
>240
00
>260
00
>280
00
>300
00
ng/g (ppb)
dead
live

32
Fig 6. Binary detections of coumaphos & fluvalinate in brood comb from dead & live honey bee
colonies.
The number of samples with binary detections of fluvalinate & coumaphos residues at various
concurrent levels. (34% of samples from dead colonies and 3% of from live colonies had
fluvalinate and coumaphos each at 3,500 ppb).
Binary detections of coumaphos & fluvalinate in brood comb from
dead & live colonies
0%
10%
20%
30%
40%
50%
60%
70%
80%
90%
100%
0
>250
>500
>100
0
>200
0
>300
0
>400
0
>500
0
>750
0
>100
00
>200
00
amount of residues (ppb) detected for both
% o
f sa
mp
les p
ositiv
e w
ith
bo
th
dead
live

33
MANUSCRIPT TWO
SUB-LETHAL EFFECTS OF PESTICIDE RESIDUES IN BROOD COMB ON WORKER
HONEY BEE (APIS MELLIFERA) DEVELOPMENT AND LONGEVITY
ABSTRACT
Numerous surveys on bee products reveal high levels of pesticide residue
contamination in honey bee comb. To study possible effects from pesticide exposure
from contaminated brood comb, bees were reared in brood comb containing high levels
of known pesticide residues versus brood comb relatively uncontaminated. Overall
brood mortality was generally higher in bees reared in contaminated comb although
there was no statistical difference. Comb age confounded early mortality in bees reared
from newly drawn control comb compared to bees reared from old control comb or
comb that had been used for only a few brood cycles. Pesticide residue migration and
metabolism from comb containing high pesticide residues caused contamination of
control comb after multiple brood cycles and provided insight on how quickly residues
move through wax. Higher brood mortality and delayed adult emergence occurred
after multiple brood cycles in contaminated control combs. In contrast, survivability
increased in bees reared in treatment comb after multiple brood cycles when pesticide
residues had been reduced in treatment combs due to residue migration into
uncontaminated control combs, supporting comb replacement efforts. Chemical
analysis after the experiment confirmed the migration of pesticide residues from
treatment combs into previously uncontaminated control comb. Delayed development

34
was observed in bees reared from treatment comb containing high levels of pesticides
particularly in the early stages (day 4 and 8) of worker bee development. Adult
longevity was reduced by 4 days in bees exposed to pesticide residues in contaminated
brood comb during development. These results suggest that sub-lethal effects of
pesticide residues in brood comb can have serious effects on honey bee colony
structure and health. (266 words)
INTRODUCTION
Managed honey bee (Apis mellifera) colonies in the United States have
experienced high over-wintering losses and sudden crashes in colony population since
the winter of 2006 (Van Engelsdorp et al. 2007). Over 60 contributing factors of the
phenomenon known as colony collapse disorder (CCD) have been identified, including
Varroa destructor mites, poor nutrition, pesticide exposure to both agrochemicals and
beekeeper-applied chemicals, and various other pests and pathogens (Van Engelsdorp
et al. 2009). Honey bee health decline and colony losses are not limited to the U. S.
Many European studies attribute major recent bee losses to pesticide exposure,
particularly, the class of neonicotinoid insecticides (Bonmatin et al. 2003; Ramirez-
Romero et al. 2005; Chauzat et al. 2006). Studies from Spain focus mainly on the
effects of Nosema ceranae, a microsporidian pathogen that targets the honey bee
midgut, depriving infected bees of nutrients (Higes et al. 2009). There is some
disagreement about which factors are more causative, and a few researchers have
focused on interaction effects of combined factors. For example, the harmful effects of

35
pesticide exposure increases susceptibility to Nosema ceranae spore infection and vice
versa (Ladas 1972; Alaux et al. 2009).
Honey bees are equipped with social behavioral and physiological defenses to
protect against pests and pathogens, including grooming and other hygienic behaviors
to remove mites and dead or diseased brood. Honey bees also collect and use
propolis, a substance made from plant resins and wax that contains antibiotic, antiviral,
and antifungal properties (Burdock 1998). Social immunity provides significant
protection for honey bee colonies and as a result, individual honey bees are
immunologically deficient and have only about half as many detoxifying enzymes as
pesticide resistant insects (Claudianos et al. 2006). This deficiency increases the
sensitivity of honey bees to pesticides and bacterial or viral toxins and reduces their
ability to fight infections. Sensitivity to pesticides may also vary among honey bees due
to varying individual detoxification capabilities (Suchail et al. 2001). Other factors such
as age and nutrition also can influence pesticide sensitivity. Older forager bees are
more susceptibility to pesticide exposure because of flight and foraging activity than
younger bees that remain safely in the hive, while over-wintering adults are the most
susceptible to pesticide exposure (Wahl and Ulm 1983, Rortais et al 2005). Honey
bees fed high quality pollen are less susceptible to pesticide exposure than bees fed
low quality pollen or pollen substitutes, due to protein deficiencies in low quality pollen
(Wahl and Ulm 1983). Unfortunately, commercial beekeepers typically must provide
pollen substitute to colonies during transport and seasonal dearth to maximize brood
production prior to and during pollination services. Adult honey bees are also more
susceptible to pesticides when reared at lower temperatures (33ºC) (Medrzycki et al.

36
2009), a consideration potentially contributing to stress associated with the
transportation of honey bee colonies.
In this study we examined the sub-lethal effects of developmental exposure to
pesticide residues in brood comb on worker bees. Worker bees were reared in brood
comb containing high levels of known pesticide residues or brood comb relatively free of
pesticide residues. Larval development from egg to adult emergence was monitored at
days 4, 8, 12 and 19 and newly emerged adults from both treatments were subjected to
cage longevity tests. Bees reared from treatment comb contaminated with high levels
of pesticides exhibited delayed larval development and reduced adult longevity. We
discuss implications of sub-lethal and indirect effects of pesticide residues in brood
comb on colony health and structure.
MATERIALS & METHODS
Treatment combs
Frames of brood comb were sampled from migratory Pacific Northwest
beekeeping operations using miticides and from colonies suspected to have failed from
colony collapse disorder. Pesticide residue analyses for 171 of the most commonly
used pesticides were performed on brood comb samples. Thirteen frames of brood
combs positive for high levels of pesticide residues were cut into treatment blocks
(11x11-cm), containing roughly 450 cells. The number of different pesticide residues
detected in treatment combs ranged from 4 to 17, averaging 10. The total number of
pesticides detected in all treatments was 39, including 7 fungicides, 2 herbicides, 23
insecticides (miticides included) and 7 metabolites (Table 1). The three most frequently

37
detected pesticide residues in treatment combs were the beekeeper applied miticides
fluvalinate, coumaphos, and coumaphos oxon metabolite. Fluvalinate, a pyrethroid
pesticide, was detected in treatment combs at levels as high as 24,340 ppb and
averaged 6,712 ppb. Coumaphos and its oxon metabolite were detected at levels as
high as 22,100 ppb and 1,850 ppb, averaging 8,079 ppb and 596 ppb, respectively.
Control brood combs were newly drawn out from a single colony or sampled from feral
colonies that tested negative for pesticide residue contamination. Coumaphos was the
only residue detected in newly drawn out control combs (21 ppb).
Experimental design
Standard Langstroth frames, with the center area (22x11-cm) of the frame
removed, were used as frame supports containing a pair of comb blocks, i.e., one
control comb adjacent to a treatment comb block containing high pesticide levels
(n=17). Three colonies of similar strength were used from May through August of 2008
and 2009 to host experimental frames supporting paired comb blocks. Hosting control
and treatment combs within the same colony during larval development normalized
possible effects of colony activity and quality of resources fed to brood, emphasizing
potential effects of pesticide residue exposure from contaminated brood comb. Laying
sister queens from each colony were caged for 24 hours over experimental frames,
allowing access to both control and treatment combs. Queens were released the
following day and excluded to the bottom box for the duration of the experiment.
Frames containing a patch of 224 eggs on control and treatment blocks were
photographed and frames with insufficient number of eggs were removed from the

38
experiment. The same patch of eggs was monitored for larval mortality on days 4, 8,
12, and 19 of development and photographs taken of larvae developing in control and
treatment comb were mapped using Microsoft paint. On day 19, experimental frames
containing pupae reared in control and treatment comb were incubated at 33±1ºC with
push-in cages separating treatment blocks. Emergence of adult bees was recorded
daily and bees were counted, tagged with Testor’s enamel, and placed in a 1/8ʺ mesh
metal cage (11 x 9 x 5-cm). Worker bees were fed water and 50% sucrose syrup ad
libtum and mortality was recorded daily. Some experimental frames (n=9), containing a
pair of control and treatment comb blocks, were reused up to three times during the
experiment. Experimental frame supports containing comb blocks that had not yet been
used in the experiment (rep 1) were introduced to host colonies at the same time as
other frames that had gone through multiple brood cycles (rep 2 & 3) to minimize
seasonal effects of larval survivability during late summer months.
Measurements
To assess the sub-lethal effects of exposure to pesticide residues, biologically
meaningful parameters were measured throughout the main stages of the honey bee
life cycle. Egg eclosion, or successful hatching was measured at day 4; larval mortality
and development time from egg to pupae were recorded at day 8; pupation was
recorded at day 12 and 19; adult emergence rate was recorded on day 20 and
continued daily until emergence was no longer observed; and adult longevity was
recorded daily until all caged bees were dead. Observations of abnormal larval
development and signs of disease or pest infection were also recorded. Taken
39
together, these life cycle parameters provide insight and enable assessment of
exposure to sub-lethal pesticide residues in brood comb on honey bee colony health.
Statistical analysis
Pairwise comparisons with repeated measures were performed on larval
mortality, adult longevity, and adult emergence rate of worker bees reared in relatively
uncontaminated brood comb and brood comb containing high levels of pesticide
residues. Comparisons of both treatments were made by sample day (4, 8, 12 and 19)
and by the number of brood cycles (rep 1, 2, 3). Differences in pesticide analyses,
specifically the number of pesticide residues and the levels, detected in control and
treatment comb used multiple times were compared before and after the experiment.
Statistical differences were detected by one-way analysis of variance (ANOVA) followed
by paired two-tailed t-tests on control and treatment combs with significance determined
at p≤0.025.
RESULTS
Brood effects
Larval mortality was generally higher in worker bees reared from comb
containing high levels of mixed pesticide residues; however, there was no statistical
difference in total larval mortality between bees reared in control and treatment combs
(26 and 28.3%, respectively)(Fig 1). Evidence of delayed development at day 4 and 8
was observed in bees reared from four different combs containing high levels of
40
pesticide residues sampled from colonies suspected to have CCD (7 a-c). Confounding
factors may have contributed to these results, one of which was the comb age affect
from newly drawn out control combs. Brood pheromones, contained within previously
molted larvae cuticle or exuviae residing in old comb cells, indicate brood presence to
nurse bees (Berry and Delaplane 2001). Newly drawn comb lacks the presence of
exuviae and thus pheromone cues. Significantly higher brood mortality was observed in
eggs laid in control combs on day 4 than larvae on days 8, 12, and 19 (p=0.0243;
p=0.0005; p<0.0001, respectively). Day four of worker bee development represents a
critical time, when nurse bees must provide resources to newly hatched eggs or larvae
will not survive. Furthermore, total survivability from egg to adult emergence was higher
for bees reared in older control comb (78%) compared to bees reared in newly drawn
controls (69%), although not statistically significant. Another factor in this experiment
was the repeated use of experimental frames this allowed the unintended migration of
pesticide residues in wax which reduced the difference in contamination between
treatment and control combs and differences between treatment effects. Mortality was
significantly higher in control bees reared from frames that were used in the experiment
more than once and had experienced multiple brood cycles (Fig 2). Total larval
mortality increased with repeated use of experimental frames in control combs from
13% through the first brood cycle (rep 1) to 28 and 39% through the second (rep 2) and
third (rep 3) brood cycles, respectively (Fig 2). In fact, brood mortality in bees reared
through the third brood cycle was significantly higher than in the first and second brood
cycles (p=0.023; p=0.048, respectively). In treatment brood comb containing high levels
of pesticide residues, overall mean larval mortality increased from 17 % to 37% then

41
decreased to 22% for the first, second, and third brood cycles respectively (Fig 4).
Mortality for bees reared in treatment combs was significantly higher for the second
brood cycle on day 8 of larval development than treatment bees reared in the first and
third brood cycles (Fig 3).
Chemical analysis of comb
Comparisons of chemical analyses, performed on control and treatment combs
before and after the experiment, confirmed pesticide residue transfer and contamination
of control combs over 3 months time. Four additional new pesticide residues were
detected in control comb, on average, compared to a reduction of 3 pesticide residues
in treatment combs after the experiment Fig 5). The quantity or concentration of active
ingredients also increased in control combs and decreased in treatment combs after the
experiment, further evidence supporting pesticide residue transfer from contaminated
areas of comb to uncontaminated areas (Fig 5). Fungicides were the only pesticide
group that was detected at higher concentrations in treatment combs after the
experiment than before the experiment, an increase that is not statistically significant
averaging 280 ppb. Insecticides, including the 3 most frequently detected compounds
(coumaphos, coumaphos oxon, and fluvalinate) initially in treatment combs, increased
in concentration in control combs and decreased in treatment combs after the
experiment. Concentrations for coumaphos oxon, fluvalinate and combined insecticides
were significantly higher in control comb after the experiment than before (p<0.025;
p<0.01; p< 0.025; respectively). High levels of metabolites were also detected in control
combs after the experiment suggesting possible metabolism of active compounds as a
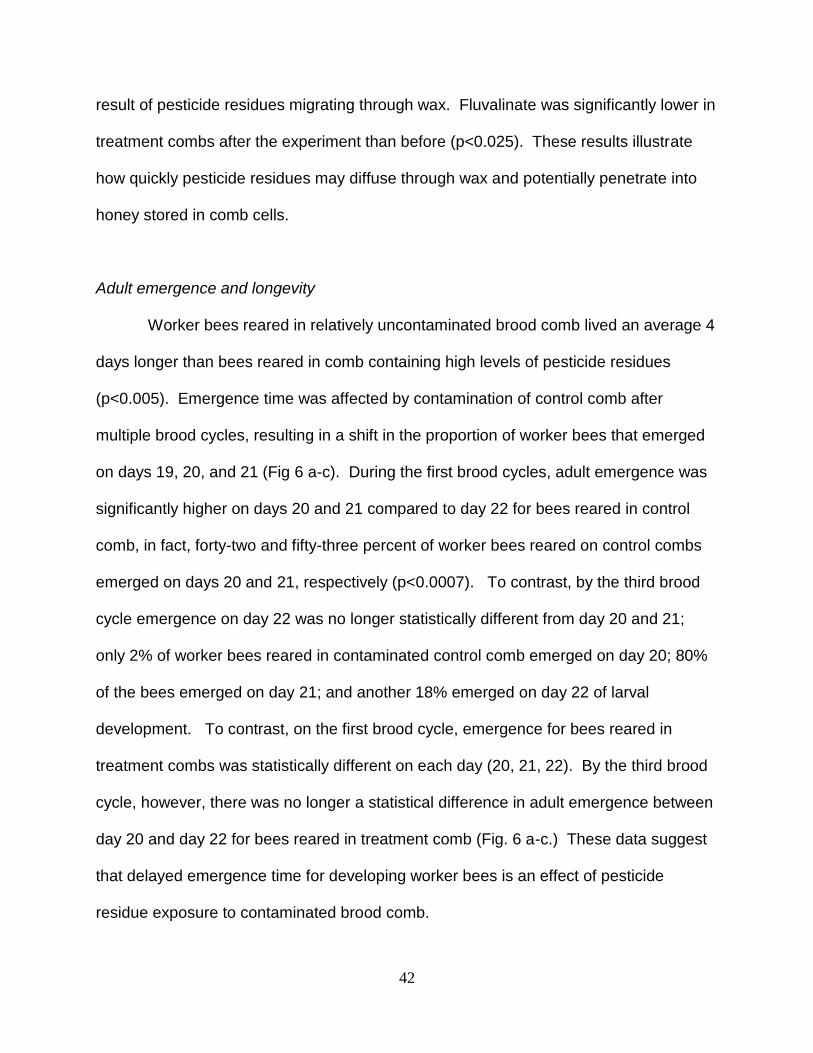
42
result of pesticide residues migrating through wax. Fluvalinate was significantly lower in
treatment combs after the experiment than before (p<0.025). These results illustrate
how quickly pesticide residues may diffuse through wax and potentially penetrate into
honey stored in comb cells.
Adult emergence and longevity
Worker bees reared in relatively uncontaminated brood comb lived an average 4
days longer than bees reared in comb containing high levels of pesticide residues
(p<0.005). Emergence time was affected by contamination of control comb after
multiple brood cycles, resulting in a shift in the proportion of worker bees that emerged
on days 19, 20, and 21 (Fig 6 a-c). During the first brood cycles, adult emergence was
significantly higher on days 20 and 21 compared to day 22 for bees reared in control
comb, in fact, forty-two and fifty-three percent of worker bees reared on control combs
emerged on days 20 and 21, respectively (p<0.0007). To contrast, by the third brood
cycle emergence on day 22 was no longer statistically different from day 20 and 21;
only 2% of worker bees reared in contaminated control comb emerged on day 20; 80%
of the bees emerged on day 21; and another 18% emerged on day 22 of larval
development. To contrast, on the first brood cycle, emergence for bees reared in
treatment combs was statistically different on each day (20, 21, 22). By the third brood
cycle, however, there was no longer a statistical difference in adult emergence between
day 20 and day 22 for bees reared in treatment comb (Fig. 6 a-c.) These data suggest
that delayed emergence time for developing worker bees is an effect of pesticide
residue exposure to contaminated brood comb.

43
DISCUSSION
Honey bees of all ages and castes are susceptible to effects from pesticide
exposure (Rortais et al. 2005). Adult bees may be exposed to pesticides during flight
and foraging; younger adults remain in the hive but may be exposed to incoming
contaminated pollen and nectar; immature bees are immobile and remain in comb cells
for up to 22 days of development and may be exposed to pesticide residues through
contaminated comb cell walls or food sources. Queen bees may be exposed to
pesticides by contact with contaminated bees, wax, and food. Egg laying and repeated
contact of the abdomen to contaminated comb increases the risk of sub-lethal effects
from pesticide residue exposure on queen bees. Pesticide exposure to bees can have
adverse reproductive consequences such as reduced egg laying behavior, early
supercedure, increased queen cell rejection, and reduced ovarian weight in queen bees
(Haarman et al. 2002; Pettis et al. 2004).
Widespread pesticide use and contamination is illustrated in numerous surveys
of pesticide residue detected in honey bee comb from around the world (Thrasyvoulou
and Pappas 1988, Van Buren et al. 1992; Bogdanov et al. 1996, Wallner 1999, Chauzat
and Faucon, 2007; Mullin et al. 2010). Honey bees are biological indicators, picking up
chemicals and other pollutants from their surrounding environment. Pesticide analyses
of bees and bee products provides information about the pesticide treatments being
used in the hive and in surrounding field crops and can be essential information for
assessment of potential risk to bees and, by extension, the safety of consumers and
industries utilizing bee products such as honey, wax, or propolis (Porrini et al. 2003).
The high level of pesticide contamination in brood comb is disconcerting and reflects the
44
urgent need for better management of pests, among both to growers and beekeepers,
including safer alternative control methods.
Worker bees reared in comb containing high levels of pesticide residues had
lower survivability than bees reared in relatively uncontaminated comb. Comb age was
a factor in this experiment and brood mortality was higher in newly drawn control comb
than older control comb sampled from feral colonies. Older brood comb, or comb which
has had a few brood cycles, contains brood pheromones which attract nurse bees and
increase larval survivorship. Unfortunately, Varroa destructor mites, serious external
parasites of honey bees, are also attracted to the brood pheromones, exuviae, and
other larval compounds absorbed into old brood comb (Piccirillo and De Jong, 2004;
Free and Winder, 1983). Pesticide residues, bacteria, viruses and Nosema spp. spores
are also contained and persist in old brood combs and can be a source of disease or
pest transmission (Bailey and Ball, 1991; Gilliam, 1985). Even though initial larval
survivability may be lower in bees reared in new comb, overall colony health in hives
using old brood comb, is compromised by higher incidences of pests and pathogens
and bacterial or viral infections (Berry and Delaplane 2001).
Pesticide residues accumulate in wax and may persist for years (Bogdanov et al.
1996). Contamination of control brood combs in this experiment, illustrated how quickly
pesticide residues penetrate and migrate through brood comb wax. The presence of
additional pesticide residues in control combs detected after the experiment confirmed
pesticide residue transfer and contamination of control combs. High levels of
metabolites also detected in control combs after the experiment suggests possible
metabolism of active compounds as a result of pesticide residues migrating through

45
wax. In the paired comb blocks, detection of increasing mortality for bees reared in
control blocks and decreasing mortality for treatment blocks, over time, suggests there
were toxicological consequences, such as lower larval survivability and delayed
emergence, from pesticide residue migrating in wax from contaminated treatment comb
to relatively clean control comb (Fig 4). In addition, during the third brood cycle greater
mortality was observed in worker bees reared in contaminated control comb versus
treatment combs. This may have been caused by exposure to newly formed
metabolites as pesticides migrated into control combs. Metabolites can be more
harmful than parent compounds and can have delayed effects (Suchail et al. 2001;
Sparlings and Fellers 2007). These results suggest that there are physiological
consequences of pesticide contamination in brood comb to developing worker bees.
Brood effects of pesticide exposure
Sub-lethal effects of pesticides such as delayed adult emergence, observed in
worker bees reared in contaminated control combs, may seem inconsequential.
However, delayed adult emergence of bees provides a reproductive advantage for
Varroa mites. A pregnant foundress mite will invade a comb cell occupied by a
developing bee larva and lay four eggs in 30 hour intervals. The first eggs become
male followed by multiple daughter mites. The most injurious effects of Varroa mites
occur when the foundress and her multiple offspring are feeding on the hemolymph of a
pupating bee, causing reductions in emergence weight and metabolic reserves and
physical deformities on host bees (Bowen-Walker and Gunn 2001, Amdam et al. 2004).
The third daughter mite only has a 13% chance of reaching maturity before the pupating
46
bee emerges from the cell, typically after 20 to 21 days of development. Mites that have
not reached maturity do not have cuticles hardened to protect against emerging bees
actively kicking and pushing themselves out from cells. The likelihood that the third
daughter mite will successfully reach maturity and mate within the cell increases with
delayed emergence of bees reared in contaminated comb. Drone-brood trapping and
removal is an effective alternative mite control method because Varroa mites naturally
prefer drone brood, which require a longer development period, 24 days from egg to
adult emergence (Charriere et al. 2003; Calderone and Kuenen 2001; Calderone 2005).
Delayed development of worker bees occurred in bees reared in treatment comb
containing 17 different pesticides, including 9 systemic compounds and 5 neonicotinoid
insecticides (Table 2). The normal growth pattern is expected to be uniform, as eggs
were laid on both control and treatment comb within a 24 hour period. However, by
day 4, 23% of eggs were unhatched in the treatment comb and by day 8, over 46% of
remaining larvae reared in the contaminated treatment comb were small and their
development visually stunted or delayed (Figs. 7a-c). Another three treatment combs,
sampled from colonies suspected to have colony collapse disorder (CCD), had similar
effects on egg hatching and development. An average of 19% of eggs laid in comb
sampled from CCD colonies containing high levels of pesticides, remained unhatched
on day 4 and 60-90% of unhatched eggs were removed by the next sampling date.
Whether unhatched eggs are removed from cells by nurse bees or eventually hatch, but
become developmentally delayed, high brood mortality places energetic stress on
queens and increase the demand for brood production. In addition, “spotty” brood
patterns have previously been used to indicate failing or poor queen quality. However,
47
this experiment illustrates that a spotty brood pattern can result from pesticide residue
exposure in contaminated brood comb wax rather than poor queen quality. Efficiency in
brood production is reduced when eggs or larvae remain in brood comb cells only to be
later removed. Egg-laying efficiency is furthermore reduced when queen bees are
unable to deposit eggs in a general area but, instead, must seek empty cells scattered
throughout the hive (Mackensen 1950).
Adult longevity
Worker bees reared in treatment comb containing high levels of pesticide
residues lived on average 4 days less than bees reared in relatively uncontaminated
control combs in cage trials (p<0.005). Reduced adult longevity causes premature
foraging activity by replacement bees, which further shortens hive duties, such as brood
care, food processing and storage, queen care, and hygienic behavior. Combined
effects from exposure to pesticide residue in brood comb, such as reduced adult
longevity, increased brood mortality, higher fecundity of Varroa mites (due to longer
development and emergence time of bees) and increased susceptibility to other
pathogens such as Nosema spp. may lead to a decline in honey bee colonies (Ladas
1972; Alaux et al. 2009). Queens and worker bees may not be able to keep up with the
demand for brood production and resources needed to sustain large populations of
adult bees while beekeepers, researchers and other stakeholders may disagree on the
primarily pest and pathogen contributing to colony collapse disorder and honey bee
health decline worldwide, our findings suggest that one of the underlying commonalities
is the problem of pesticide contamination and exposure in bees and bee products. This
48
study illustrates that sub-lethal effects from pesticide residues through developmental
exposure of contaminated brood comb may be subtle and indirect but can have serious
colony level consequences.
REFERENCES
Alaux C., Brunet, J., Dussaubat, C., Mondet, F.,Tchamitchan, S., Cousin, M., Brillard, J., Baldy, A., Belzunces, L.P., Le Conte, Y. 2009. Interactions between Nosema microspores and a neonicotinoid weaken honeybees (Apis mellifera). Envirnomental microbiology. 12: 774-782. Amdam GV, Hartfelder K, Norberg K, Hagen A, Omholt SW. 2004. Altered physiology in worker honey bees (Hymenoptera: Apidae) infested with the mite Varroa destructor (Acari: Varroidae): a factor in colony loss during overwintering? J. Econ. Entomol. 97: 741-747. Bailey L and Ball BV. 1991. Honey bee pathology. Harcourt Brace Jovanovich; Sidcup, Kent, UK, p. 193. Berry JA, Delaplane KS. 2001. Effects of comb age on honey bee colony growth and brood survivorship. J. Apic. Res. 40: 3-8 Bogdanov S, Kilchenmann V, Imdorf A. 1996. Acaricide residues in beeswax and honey. In Mizrahi A, Lensky Y, eds. Bee Products. Plenum Press, NY. Bonmatin, J. M., I. Moineau, R. Charvet, M. E. Colin, C. Fleche, E. R. Bengsch. 2003. Fate of imidacloprid in fields and toxicity for honeybees. Environ Chem. Bowen-Walker PL and Gunn A. 2001. The effect of the ectoparasitic mite, Varroa destructor on adult worker honeybee (Apis mellifera) emergence weights, water, protein, carbohydrate, and lipid levels. Entomol. Exp. Appl. 101: 207-217. Burdock GA. 1998. Review of the biological properties and toxicity of bee propolis (propolis). Food Chem. Toxicol. 36: 347-363. Calderone, N. W. 2005. Evaluation of drone brood removal for management of Varroa destructor (Acari: Varroidae) in colonies of Apis mellifera (Hymenoptera: Apidae) in the northeastern United States. J. Econ. Entomol. 98: 645-650.
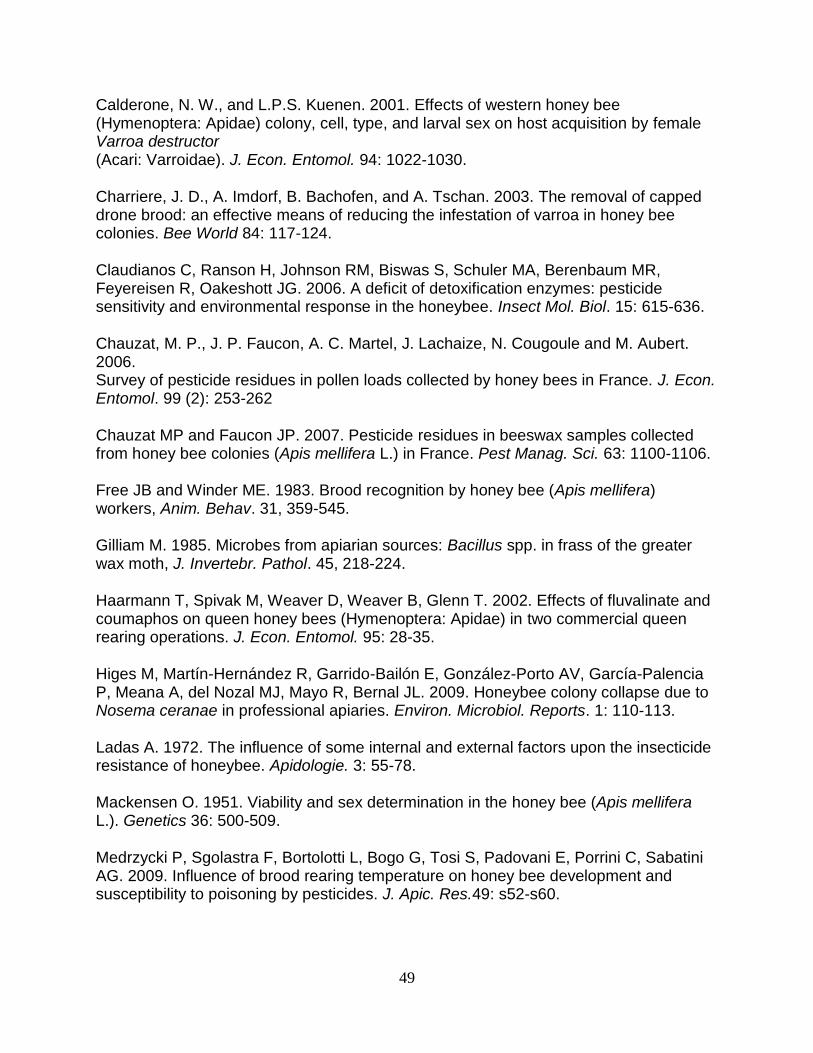
49
Calderone, N. W., and L.P.S. Kuenen. 2001. Effects of western honey bee (Hymenoptera: Apidae) colony, cell, type, and larval sex on host acquisition by female Varroa destructor (Acari: Varroidae). J. Econ. Entomol. 94: 1022-1030. Charriere, J. D., A. Imdorf, B. Bachofen, and A. Tschan. 2003. The removal of capped drone brood: an effective means of reducing the infestation of varroa in honey bee colonies. Bee World 84: 117-124. Claudianos C, Ranson H, Johnson RM, Biswas S, Schuler MA, Berenbaum MR, Feyereisen R, Oakeshott JG. 2006. A deficit of detoxification enzymes: pesticide sensitivity and environmental response in the honeybee. Insect Mol. Biol. 15: 615-636. Chauzat, M. P., J. P. Faucon, A. C. Martel, J. Lachaize, N. Cougoule and M. Aubert. 2006. Survey of pesticide residues in pollen loads collected by honey bees in France. J. Econ. Entomol. 99 (2): 253-262 Chauzat MP and Faucon JP. 2007. Pesticide residues in beeswax samples collected from honey bee colonies (Apis mellifera L.) in France. Pest Manag. Sci. 63: 1100-1106. Free JB and Winder ME. 1983. Brood recognition by honey bee (Apis mellifera) workers, Anim. Behav. 31, 359-545. Gilliam M. 1985. Microbes from apiarian sources: Bacillus spp. in frass of the greater wax moth, J. Invertebr. Pathol. 45, 218-224. Haarmann T, Spivak M, Weaver D, Weaver B, Glenn T. 2002. Effects of fluvalinate and coumaphos on queen honey bees (Hymenoptera: Apidae) in two commercial queen rearing operations. J. Econ. Entomol. 95: 28-35. Higes M, Martín-Hernández R, Garrido-Bailón E, González-Porto AV, García-Palencia P, Meana A, del Nozal MJ, Mayo R, Bernal JL. 2009. Honeybee colony collapse due to Nosema ceranae in professional apiaries. Environ. Microbiol. Reports. 1: 110-113. Ladas A. 1972. The influence of some internal and external factors upon the insecticide resistance of honeybee. Apidologie. 3: 55-78. Mackensen O. 1951. Viability and sex determination in the honey bee (Apis mellifera L.). Genetics 36: 500-509. Medrzycki P, Sgolastra F, Bortolotti L, Bogo G, Tosi S, Padovani E, Porrini C, Sabatini AG. 2009. Influence of brood rearing temperature on honey bee development and susceptibility to poisoning by pesticides. J. Apic. Res.49: s52-s60.
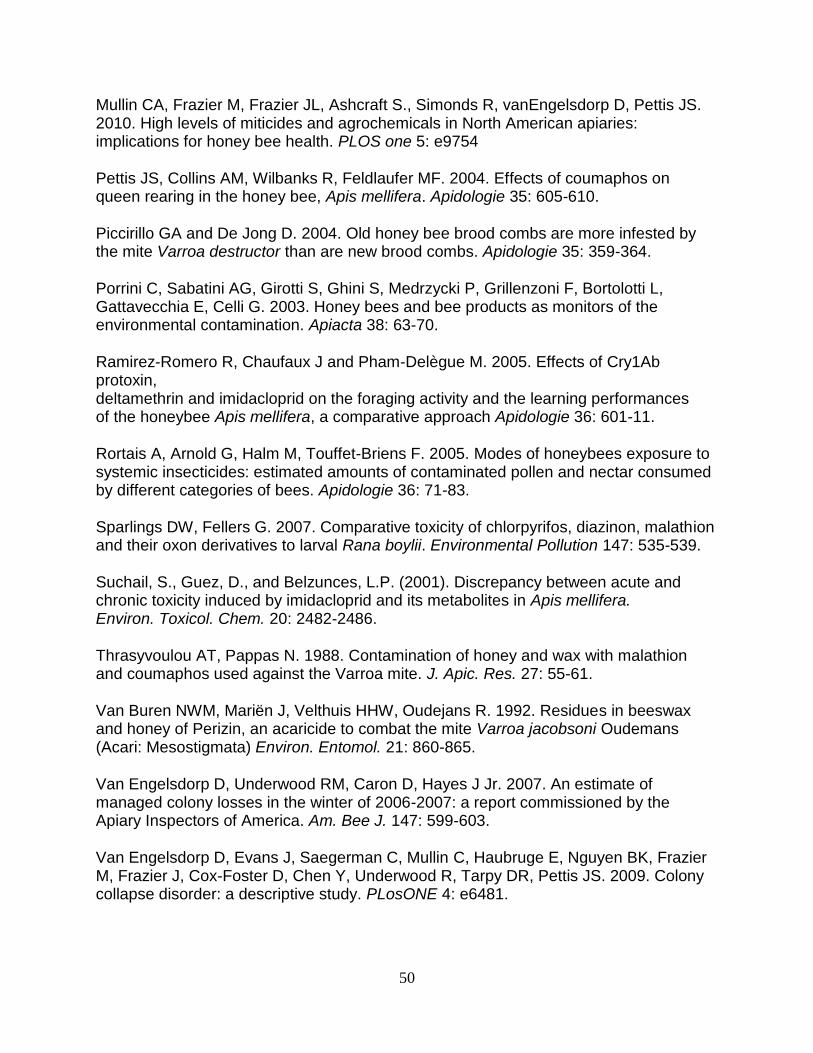
50
Mullin CA, Frazier M, Frazier JL, Ashcraft S., Simonds R, vanEngelsdorp D, Pettis JS. 2010. High levels of miticides and agrochemicals in North American apiaries: implications for honey bee health. PLOS one 5: e9754 Pettis JS, Collins AM, Wilbanks R, Feldlaufer MF. 2004. Effects of coumaphos on queen rearing in the honey bee, Apis mellifera. Apidologie 35: 605-610. Piccirillo GA and De Jong D. 2004. Old honey bee brood combs are more infested by the mite Varroa destructor than are new brood combs. Apidologie 35: 359-364. Porrini C, Sabatini AG, Girotti S, Ghini S, Medrzycki P, Grillenzoni F, Bortolotti L, Gattavecchia E, Celli G. 2003. Honey bees and bee products as monitors of the environmental contamination. Apiacta 38: 63-70. Ramirez-Romero R, Chaufaux J and Pham-Delègue M. 2005. Effects of Cry1Ab protoxin, deltamethrin and imidacloprid on the foraging activity and the learning performances of the honeybee Apis mellifera, a comparative approach Apidologie 36: 601-11. Rortais A, Arnold G, Halm M, Touffet-Briens F. 2005. Modes of honeybees exposure to systemic insecticides: estimated amounts of contaminated pollen and nectar consumed by different categories of bees. Apidologie 36: 71-83. Sparlings DW, Fellers G. 2007. Comparative toxicity of chlorpyrifos, diazinon, malathion and their oxon derivatives to larval Rana boylii. Environmental Pollution 147: 535-539. Suchail, S., Guez, D., and Belzunces, L.P. (2001). Discrepancy between acute and chronic toxicity induced by imidacloprid and its metabolites in Apis mellifera. Environ. Toxicol. Chem. 20: 2482-2486. Thrasyvoulou AT, Pappas N. 1988. Contamination of honey and wax with malathion and coumaphos used against the Varroa mite. J. Apic. Res. 27: 55-61. Van Buren NWM, Mariën J, Velthuis HHW, Oudejans R. 1992. Residues in beeswax and honey of Perizin, an acaricide to combat the mite Varroa jacobsoni Oudemans (Acari: Mesostigmata) Environ. Entomol. 21: 860-865. Van Engelsdorp D, Underwood RM, Caron D, Hayes J Jr. 2007. An estimate of managed colony losses in the winter of 2006-2007: a report commissioned by the Apiary Inspectors of America. Am. Bee J. 147: 599-603. Van Engelsdorp D, Evans J, Saegerman C, Mullin C, Haubruge E, Nguyen BK, Frazier M, Frazier J, Cox-Foster D, Chen Y, Underwood R, Tarpy DR, Pettis JS. 2009. Colony collapse disorder: a descriptive study. PLosONE 4: e6481.

51
Wahl O and Ulm K. 1983. Influence of pollen feeding and physiological condition on pesticide sensitivity of the honey bee Apis mellifera carnica. Oecologia.59: 106-128. Wallner K. 1999. Varroacides and their residues in bee products. Apidologie 30: 235-248. Acknowledgements We thank E. Olson and numerous other beekeepers, and J. Pettis from USDA, Beltsville, MD who provided comb samples, R. Simonds from the USDA-AMS-National Science Laboratory in Gastonia, NC for chemical residues analysis, M. Evans for assistance with statistics, and J. Stark for comments that improved the manuscript. Funding was provided in part by Washington State and California State Beekeeper’s Association research grants.

52
Fig. 1 Percent and total larval mortality for bees reared in control vs. treatment comb over time.
Fig. 2 Percent larval mortality each sample date for bees reared in control comb over multiple
replications.
0.0
5.0
10.0
15.0
20.0
25.0
30.0
Day 4 Day 8 Day 12 Day 19 total
Percent & total larval mortality for bees reared in control vs treatment comb over time
control
treatment
0.0
5.0
10.0
15.0
20.0
25.0
30.0
35.0
40.0
Day 4 Day 8 Day 12 Day 19
Precent mortality each sample date for bees reared in control comb over multiple replications
Rep 1
Rep2
Rep 3
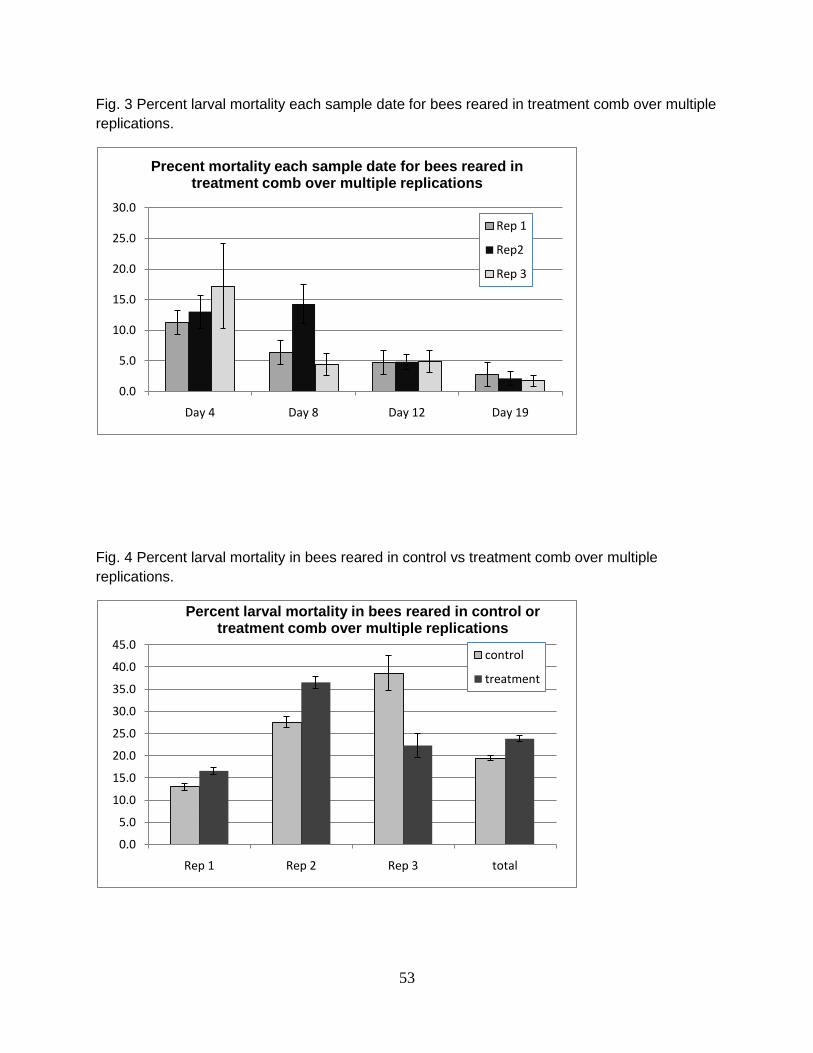
53
Fig. 3 Percent larval mortality each sample date for bees reared in treatment comb over multiple
replications.
Fig. 4 Percent larval mortality in bees reared in control vs treatment comb over multiple
replications.
0.0
5.0
10.0
15.0
20.0
25.0
30.0
Day 4 Day 8 Day 12 Day 19
Precent mortality each sample date for bees reared in treatment comb over multiple replications
Rep 1
Rep2
Rep 3
0.0
5.0
10.0
15.0
20.0
25.0
30.0
35.0
40.0
45.0
Rep 1 Rep 2 Rep 3 total
Percent larval mortality in bees reared in control or treatment comb over multiple replications
control
treatment

54
Fig. 5 Average quantity (ppb) differences between pre & post experiment analyses for control
vs. treatment brood combs.
Fig. 6a Adult emergence for bees reared in control vs. treatment brood comb after the first
brood cycle (Rep 1).
-7000
-5000
-3000
-1000
1000
3000
5000
Coumaphos Coumaphos oxon
Fluvalinate Fungicides Insecticides metabolites
Average quantity (ppb) differences between pre & post experiment analysis for control & treatment combs
control
treatment
0
0.1
0.2
0.3
0.4
0.5
0.6
0.7
0.8
0.9
19 20 21 22 23
age (days)
Adult emergence of bees reared in control vs. treatment bromb comb (rep 1)
Control
Treatment
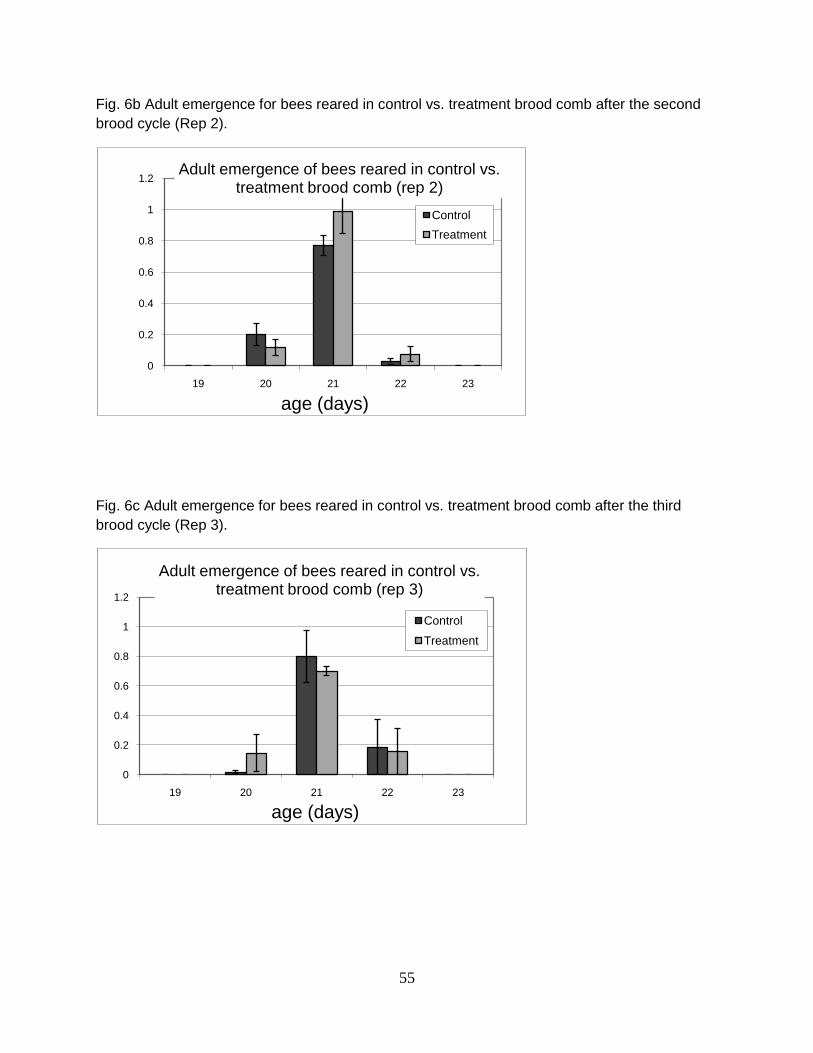
55
Fig. 6b Adult emergence for bees reared in control vs. treatment brood comb after the second
brood cycle (Rep 2).
Fig. 6c Adult emergence for bees reared in control vs. treatment brood comb after the third
brood cycle (Rep 3).
0
0.2
0.4
0.6
0.8
1
1.2
19 20 21 22 23
age (days)
Adult emergence of bees reared in control vs. treatment brood comb (rep 2)
Control
Treatment
0
0.2
0.4
0.6
0.8
1
1.2
19 20 21 22 23
age (days)
Adult emergence of bees reared in control vs. treatment brood comb (rep 3)
Control
Treatment
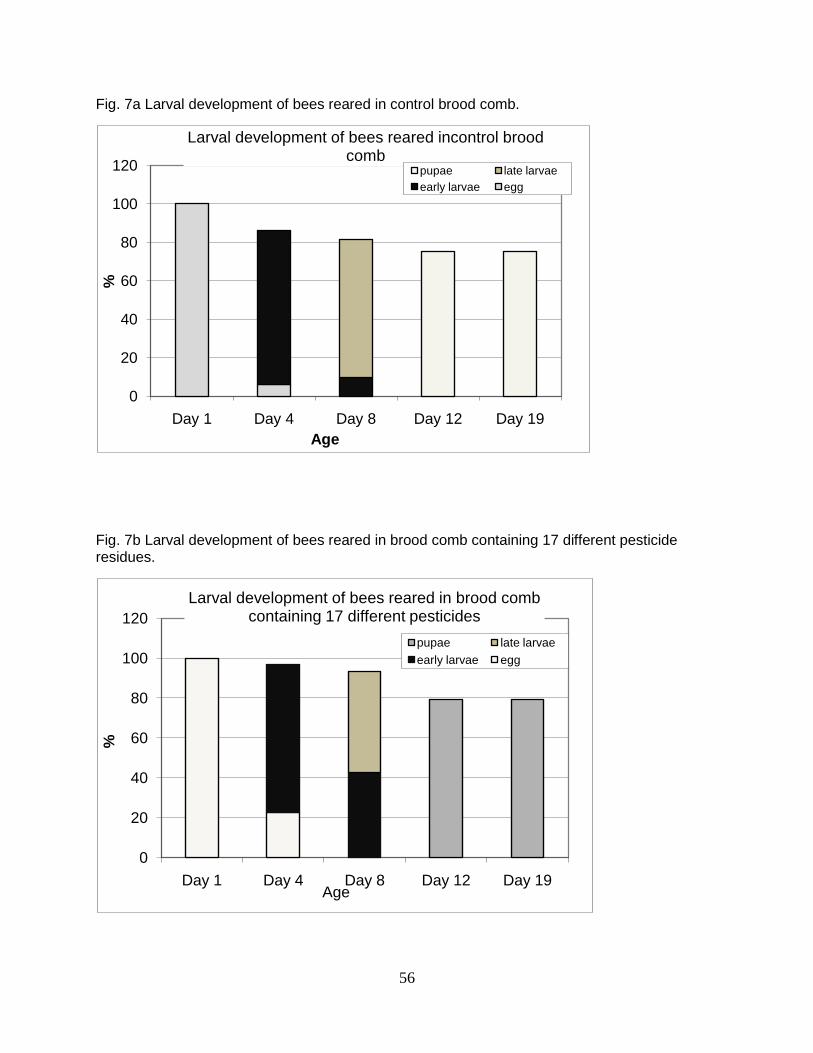
56
Fig. 7a Larval development of bees reared in control brood comb.
Fig. 7b Larval development of bees reared in brood comb containing 17 different pesticide residues.
0
20
40
60
80
100
120
Day 1 Day 4 Day 8 Day 12 Day 19
%
Age
Larval development of bees reared incontrol brood comb
pupae late larvae
early larvae egg
0
20
40
60
80
100
120
Day 1 Day 4 Day 8 Day 12 Day 19
%
Age
Larval development of bees reared in brood comb containing 17 different pesticides
pupae late larvae
early larvae egg
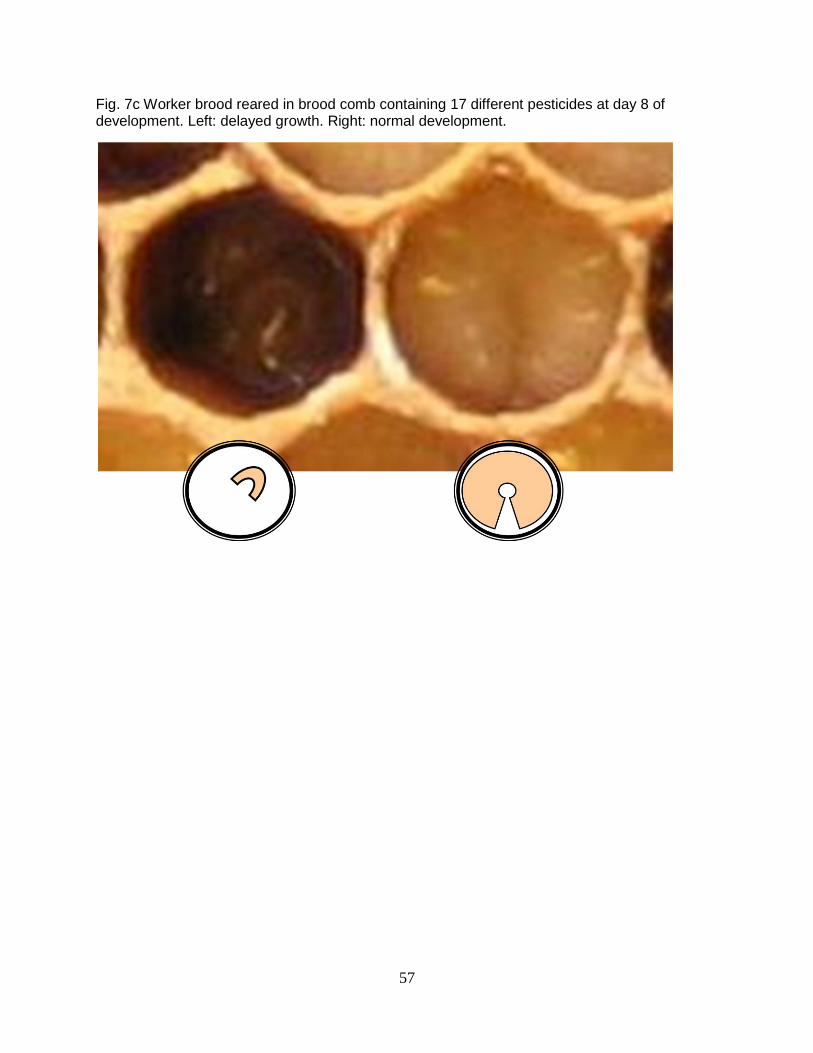
57
Fig. 7c Worker brood reared in brood comb containing 17 different pesticides at day 8 of development. Left: delayed growth. Right: normal development.
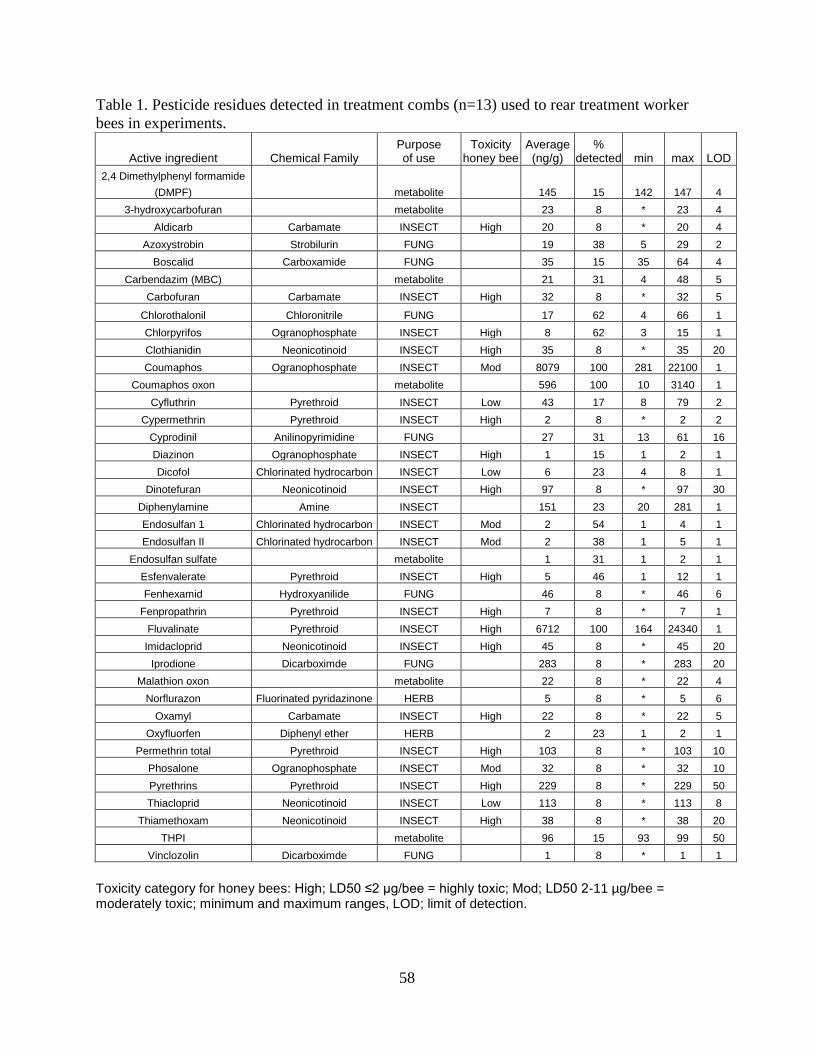
58
Table 1. Pesticide residues detected in treatment combs (n=13) used to rear treatment worker
bees in experiments.
Active ingredient Chemical Family Purpose of use
Toxicity honey bee
Average (ng/g)
% detected min max LOD
2,4 Dimethylphenyl formamide
(DMPF) metabolite
145 15 142 147 4
3-hydroxycarbofuran metabolite
23 8 * 23 4
Aldicarb Carbamate INSECT High 20 8 * 20 4
Azoxystrobin Strobilurin FUNG
19 38 5 29 2
Boscalid Carboxamide FUNG
35 15 35 64 4
Carbendazim (MBC) metabolite
21 31 4 48 5
Carbofuran Carbamate INSECT High 32 8 * 32 5
Chlorothalonil Chloronitrile FUNG
17 62 4 66 1
Chlorpyrifos Ogranophosphate INSECT High 8 62 3 15 1
Clothianidin Neonicotinoid INSECT High 35 8 * 35 20
Coumaphos Ogranophosphate INSECT Mod 8079 100 281 22100 1
Coumaphos oxon metabolite
596 100 10 3140 1
Cyfluthrin Pyrethroid INSECT Low 43 17 8 79 2
Cypermethrin Pyrethroid INSECT High 2 8 * 2 2
Cyprodinil Anilinopyrimidine FUNG
27 31 13 61 16
Diazinon Ogranophosphate INSECT High 1 15 1 2 1
Dicofol Chlorinated hydrocarbon INSECT Low 6 23 4 8 1
Dinotefuran Neonicotinoid INSECT High 97 8 * 97 30
Diphenylamine Amine INSECT
151 23 20 281 1
Endosulfan 1 Chlorinated hydrocarbon INSECT Mod 2 54 1 4 1
Endosulfan II Chlorinated hydrocarbon INSECT Mod 2 38 1 5 1
Endosulfan sulfate metabolite
1 31 1 2 1
Esfenvalerate Pyrethroid INSECT High 5 46 1 12 1
Fenhexamid Hydroxyanilide FUNG
46 8 * 46 6
Fenpropathrin Pyrethroid INSECT High 7 8 * 7 1
Fluvalinate Pyrethroid INSECT High 6712 100 164 24340 1
Imidacloprid Neonicotinoid INSECT High 45 8 * 45 20
Iprodione Dicarboximde FUNG
283 8 * 283 20
Malathion oxon metabolite
22 8 * 22 4
Norflurazon Fluorinated pyridazinone HERB
5 8 * 5 6
Oxamyl Carbamate INSECT High 22 8 * 22 5
Oxyfluorfen Diphenyl ether HERB
2 23 1 2 1
Permethrin total Pyrethroid INSECT High 103 8 * 103 10
Phosalone Ogranophosphate INSECT Mod 32 8 * 32 10
Pyrethrins Pyrethroid INSECT High 229 8 * 229 50
Thiacloprid Neonicotinoid INSECT Low 113 8 * 113 8
Thiamethoxam Neonicotinoid INSECT High 38 8 * 38 20
THPI metabolite
96 15 93 99 50
Vinclozolin Dicarboximde FUNG
1 8 * 1 1
Toxicity category for honey bees: High; LD50 ≤2 µg/bee = highly toxic; Mod; LD50 2-11 µg/bee = moderately toxic; minimum and maximum ranges, LOD; limit of detection.

59
Table 2. Pesticide residues contained in treatment brood comb with observed delayed development of worker honey bees
Pesticides Chemical family
Systemic Toxicity
honey bee (ng/g) ppb LOD
3-hydroxy-carbofuran metabolite Systemic
23 4
Aldicarb Carbamate Systemic High 20 4
Carbofuran Carbamate Systemic High 32 5
Chlorothalonil Fungicide --- 4 1
Clothianidin Neonicotinoid Systemic High 35 20
Coumaphos Organphosphate Moderate 22100 1
Coumaphos oxon metabolite
1850 5
Cyfluthrin Pyrethroid High 7.9 2
Dinotefuran Neonicotinoid Systemic High 97 30
Diphenylamine Amine --- 281 1
Endosulfan 1 Organochlorine Moderate 1 1
Fluvalinate Pyrethroid High 164 1
Imidacloprid Neonicotinoid Systemic High 45 20
Malathion Oxon metabolite
22 4
Oxamyl Carbamate Systemic High 22 5
Thiacloprid Neonicotinoid Systemic High 113 8
Thiamethoxam Neonicotinoid Systemic High 38 20
Toxicity category for honey bees: High; LD50 ≤2 µg/bee = highly toxic; Mod; LD50 2-11 µg/bee = moderately toxic; LOD; limit of detection.
60
MANUSCRIPT THREE
Increased susceptibility to Nosema spore (Microsporidia) infection in honey bees (Apis
mellifera) reared from brood combs containing high levels of pesticide residues
ABSTRACT
Nosema ceranae and pesticides are factors contributing to honey bee health
decline. Bees reared from brood comb containing high or low levels of pesticide
residues were placed in common colony environments. Treatment colonies were
inoculated with N. ceranae spores weekly and, subsequently, workers were sampled
from treatment and control colonies and analyzed for Nosema spores. A higher
proportion of bees reared from contaminated comb were infected with N. ceranae and
spore infectivity occurred at a younger age then compared to bees reared from control
comb. These data suggest that developmental exposure to pesticides in brood comb
increases the susceptibility of bees to Nosema spore infection. (105 words)
SHORT COMMUNICATION
Nosema ceranae is an obligate intracellular parasite that infects the honey bee
midgut, robbing nutrients and causing energetic stress (Higes et al. 2006, Mayack and
Naug 2009). Spore infection is considered highly pathogenic and widespread in
European honey bees (Apis mellifera). Nosema ceranae spores have been found in
honey bee samples collected as early as 1995 in the United States and N. ceranae
infection was recently identified as a potential contributing factor in the phenomenon
61
known as colony collapse disorder, CCD (Chen et al. 2008, van Engelsdorp et al. 2009).
Transmission and distribution of Nosema ceranae in the hive is still unclear, although
high spore levels are generally found in older foraging bees than in young adult bees
(Higes et al. 2008). Infected bees have difficulty absorbing nutrients and may consume
more resources to compensate for deficiencies (Naug and Gibbs 2009). Forager bees
collected from infected colonies and allowed to feed on sucrose ad libitum showed no
difference in mortality from uninfected bees, while infected bees with restricted food
excess had significantly lower survivability and shortened longevity (Mayack and Naug
2009). Colonies infected with Nosema spores typically have reduced nectar and pollen
stores and reduced colony population, possibly due to insufficient resources resulting
from compensatory feeding or less productive foraging by infected bees. In addition to
behavioral changes, Nosema ceranae infection can suppress individual and social
immunity in honey bees leaving bees more vulnerable to other pest and pathogen
invasions (Antúnez et al. 2009).
Pesticide exposure has also been identified as a potential factor in CCD and
some studies have reported high levels of pesticide residues in bees and bee products,
such as bee bread, honey, and wax comb (Bogdanov et al 1996, Mullin et al. 2010).
Pesticide exposure can have sub-lethal effects on honey bees, impairing memory,
communication, and flight navigation, which are important aspects of foraging and social
organization (Haynes 1988, Bortolotti 2003, Desneux et al. 2007). Exposure to
pesticides during queen bee development yielded weight and ovary reduction,
increased queen cell rejection, early supercedure, and reduced egg-laying (Haarmann
2002). Other studies have shown increased susceptibility to Nosema ceranae infections
62
in adult bees fed imidacloprid, a neonicotinoid insecticide (Alaux et al. 2009).
Conversely, adult bees artificially infected with Nosema spores were more susceptible
to DDT and trichlorfon, an organochlorine and an organophosphate insecticide,
respectively (Ladas 1972).
In this study, we examined potential effects of developmental exposure to
pesticide residues and subsequent susceptibility to Nosema ceranae spore infection in
adult worker honey bees. Two full-sized colonies (numbered 295 and 103) were
monitored for N. ceranae infection status weekly by regular sampling of forager bees,
collected on outer food frames. N. ceranae spore inoculant (50 million spores in 10 ml
of 50% sucrose syrup) was fed to colony 103 each week, while 10 ml of 50% syrup
(without spores) was fed to colony 295.
Two brood comb frames (labeled Y and G) from separate apiaries were sampled
and analyzed for pesticide residues. The brood combs were screened for 171 of the
most commonly used pesticides, including several pesticide metabolites. Comb Y was
positive was 10 different pesticide residue detections, including 7 insecticides and 3
metabolites. In comb G there were 4 insecticides, 1 fungicide, and 2 metabolites,
totaling 7 detections (Table 1). A single comb source was used for control treatments
(paired with either comb Y or G). The control comb was positive for one pesticide;
coumaphos residues at 20.9 ppb. Treatment comb frames were cut into blocks (11x11-
cm) containing roughly 450 cells. A standard Langstroth frame, with the center area
(22x11-cm) removed, was used as a frame support for a pair of treatment comb blocks,
one control comb adjacent to either Y or G comb blocks.

63
The two experimental frame supports, containing paired block treatments (comb
Y/control; comb G/control) were kept in a single colony, under the same environmental
conditions. A laying queen was caged over each frame containing the pair of comb
blocks for 24 hours. Eggs were monitored through development at day 4, 8, 12, and 19.
Paired block treatments were separated with push-in cages and incubated at day 19 at
30-33ºC. Newly emerged adult workers reared from brood combs (Y & G) with high
levels of known pesticide residue levels (n=547) and from relatively uncontaminated
control comb (n=468) were tagged with Testor’s enamel and placed into colony 295 with
normal Nosema spore levels (no inoculants) and colony 103 where Nosema spore
inoculants (50 mil spores) were added each week. Twenty painted bees from each
treatment were sampled from both colonies at week 2, 3, and 4 post-release. Sampling
error for week 4 was large due to the limited number of painted bees that remained
available from each treatment. A total of 178 bees were sampled from colony 295
(controls = 87, comb Y & G = 91) and 211 bees from colony 103 (controls = 104, comb
Y & G = 107). Bees were individually examined for the presence of N. ceranae spores
and spore levels were quantified using a haemocytometer (Cantwell 1970).
Our results revealed a higher proportion of bees reared from contaminated
combs Y & G were infected with Nosema ceranae spores, compared to bees reared
from relatively uncontaminated control comb for both colonies (p<0.0001)(Fig. 1).
Nosema ceranae spore inoculants had no effect on the proportion of infected bees.
However, infected bees sampled from colony 103 (added Nosema) had higher mean
spore counts for both control and treatment combs, compared to infected bees sampled
from colony 295. Infected bees from treatment comb Y & G had spore counts

64
averaging 5,059,000 and 142,000 in colonies 103 and 295, respectively. To compare,
infected control bees had spore levels averaging 1,925,000 and 67,000 in colonies 103
and 295, respectively. Similarities in the proportion of infected bees among treatments
between the two experimental colonies suggest that, while spores may be readily
available in the hive or environment, individual susceptibility to spore infection is an
important factor in driving epidemiological consequences of N. ceranae infection.
Additionally, N. ceranae spores were detected in a greater proportion of comb Y & G
bees at 2 weeks old than in control bees and infectivity continued to increase over time
for comb Y & G bees. Two percent of control bees were infected with spores at week 2
compared to 20% infection in comb Y & G bees. Although Nosema spore infection is
typically detected in older forager bees, these results suggest that bees exposed to
pesticide residues in brood comb during larval development are more susceptible to
Nosema ceranae infection and at a younger age.
Comparisons of Nosema infection between bees reared from comb Y and G
revealed higher mean spore counts (overall and by week) in bees reared from comb G
had than compared to bees from comb Y (Fig. 1). Although the quantity and
identification of the mixed pesticide residues contained in comb Y and G are known, we
cannot definitively pinpoint causative active ingredients. Nonetheless, interaction
effects between pesticide exposure and Nosema ceranae infection need to be
investigated further, especially when considering the level of pesticide contamination
found in brood comb (Mullin 2010).
65
REFERENCES
Alaux C., Brunet, J., Dussaubat, C., Mondet, F.,Tchamitchan, S., Cousin, M., Brillard, J., Baldy, A., Belzunces, L.P., Le Conte, Y. 2009. Interactions between Nosema microspores and a neonicotinoid weaken honeybees (Apis mellifera). Envirnomental microbiology. 12, 774-782. Antúnez K., Martín-Hernández R., Prieto L., Meana A., Zunino P., Higes M. 2009. Immune suppression o=in the honey bee (Apis mellifera) following infection by Nosema ceranae (Microsporidia). Environmental Microbiology. 11, 2284-2290. Bogdanov S, Kilchenmann V, Imdorf A. 1996. Acaricide residues in beeswax and honey. In Mizrahi A, Lensky Y, eds, Bee Products. Plenum Press, NY. pp. 239-247. Bortolotti L., Montanari R., Marcelino J., Medrzycki P., Maini S., and Porrini C. 2003. Effects of sub-lethal imidacloprid doses on the homing rate and foraging activity of honey bees. Bulletin of Insectology 56 (1): 63-67. Cantwell G.E (1970). Standard methods for counting Nosema spores. Am. Bee. J. 110, 222-223. Chen Y., Evans J.D. Smith B.I., Pettis J.S. 2008. Nosema ceranae is a long-present and wide-spread microsporidian infection of the European honey bee (Apis mellifera) in the United States. J. Invertebr. Pathol. 97, 186-188. Desneux N., Decourtye A., and Delpuech J. M. 2007. The sublethal effects of pesticides on beneficial arthropods. Ann. Rev. Entomol. 52: 81-106. Haarmann T., Spivak M., Weaver D., Weaver B., and Glenn T. 2002. Effects of fluvalinate and coumaphos on queen honey bees (Hymenoptera: Apidae) in two commercial queen rearing operations. J. Econ. Entomol. 95: 28-35. Haynes K.F. 1988. Sublethal effects of neurotoxic insecticides on insect behavior. Ann. Rev. Entomol. 33: 149-68. Higes M., Martín R., Meana A., 2006. Nosema ceranae, a new microsporidian parasite in honeybees in Europe. J. Invertebr. Pathol. 92, 93-95. Higes M., Martín-Hernández R., Botías C., Bailón E.G., González-porto A.V., Barrios L., Nozal M.J.D., García-Palencia P., Meana A. 2008. How natural infection by Nosema ceranae causes honey bee colony collapse. Environmental Microbiology 10: 2659-2669. Ladas A. 1972. The influence of some internal and external factors upon the insecticide resistance of honeybee. Apidologie. 3: 55-78.
66
Mayack C. and Naug D. 2009. Energetic stress in the honeybee Apis mellifera from Nosema ceranae infection. J. Invertebr. Pathol. 100, 185-188. Mullin CA, Frazier M, Frazier JL, Ashcraft S., Simonds R, van Engelsdorp D, Pettis JS. 2010. High levels of miticides and agrochemicals in North American apiaries: implications for honey bee health. PLOS one 5: e9754 Naug D. and Gibbs A. 2009. Behavioral changes mediated by hunger in honeybees infected with Nosema ceranae. Apidologie. 40, 595-599. Taylor K.S., Waller G.D., and Crowder L.A. 1987. Impairment of a classical conditioned response of the honey bee (Apis mellifera L.) by sublethal doses of synthetic pyrethroid insecticides. Apidologie 18 (3): 243-252. van Engelsdorp D., Evans J., Saegerman C., Mullin C., Haubruge E., Nguyen B.K., Frazier M., Frazier J., Cox-Foster D., Chen Y., Underwood R., Tarpy D.R., Pettis J.S. 2009. Colony collapse disorder: a descriptive study. PLosONE 4: e6481.
Acknowledgements We thank E. Olson, all other beekeepers, and J. Pettis from USDA, Beltsville, MD for providing comb samples; R. Simonds from the USDA-AMS-National Science Laboratory in Gastonia, NC for chemical residues analysis; M. Evans for assistance with statistics; J. Stark for comments that improved the manuscript. Funding was provided in part by Washington State and California State Beekeeper’s Association research grants.
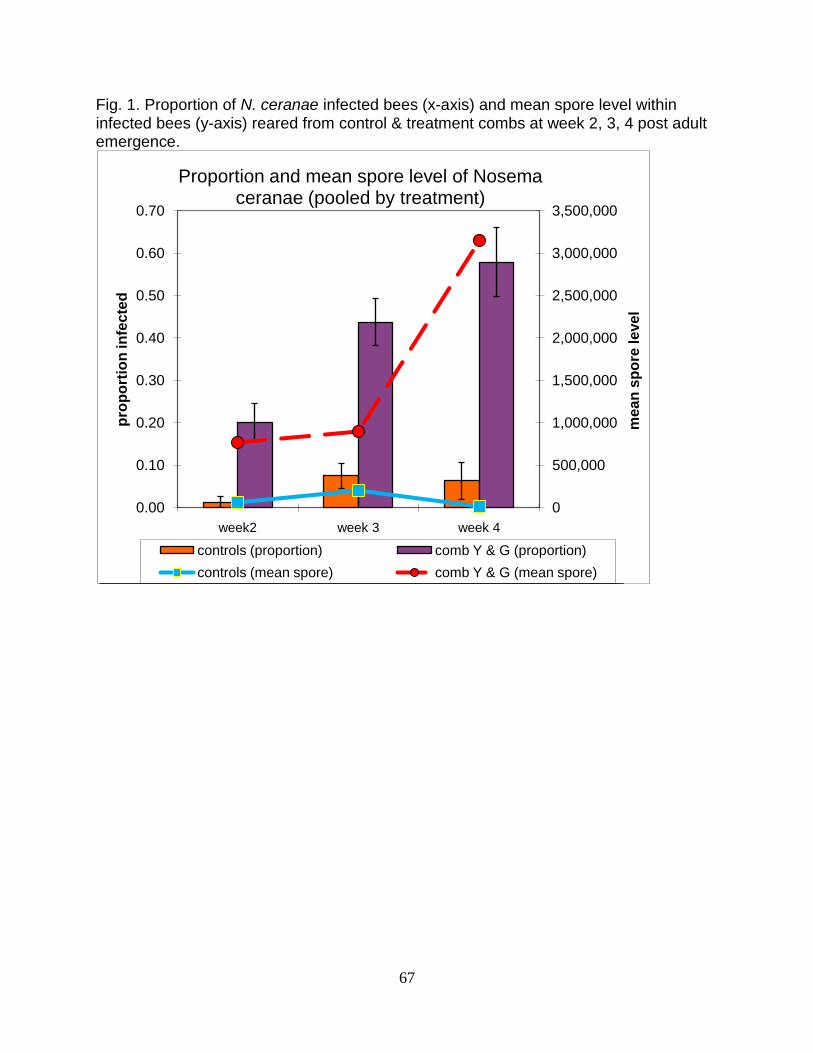
67
Fig. 1. Proportion of N. ceranae infected bees (x-axis) and mean spore level within infected bees (y-axis) reared from control & treatment combs at week 2, 3, 4 post adult emergence.
0
500,000
1,000,000
1,500,000
2,000,000
2,500,000
3,000,000
3,500,000
0.00
0.10
0.20
0.30
0.40
0.50
0.60
0.70
week2 week 3 week 4
me
an
sp
ore
le
ve
l
pro
po
rtio
n in
fec
ted
Proportion and mean spore level of Nosema ceranae (pooled by treatment)
controls (proportion) comb Y & G (proportion)
controls (mean spore) comb Y & G (mean spore)

39
Active ingredient Purpose of use Chemical family
Toxicity LD50-bee (µg/g)
ppb/bee Detection (ng/g)
LOD (ng/g)
Comb Y 2,4 Dimethylphenyl formamide (DMPF)
Metabolite of INSECT (amitraz)
Amidine 142 4
Chlorpyrifos INSECT OP High 0.11 858 8.5 1
Coumaphos INSECT OP Mod 4.6 36114 7230 1
Coumaphos oxon
Metabolite of INSECT (coumaphos) OP
231 5
Endosulfan I INSECT OC Mod 7.0 54600 2.1 1
Endosulfan II INSECT OC Mod 7.0 54600 1.6 1
Esfenvalerate INSECT PYR High 0.41 3198 12.3 1
Fluvalinate INSECT PYR High 0.88 6864 6800 1
Phosalone INSECT OP Mod 4.5 35100 31.7 1
THPI Metabolite of FUNG (captan)
Thiophthalimide 98.7 50
Comb G 2,4 Dimethylphenyl formamide (DMPF)
Metabolite of INSECT (amitraz)
Amidine 147 4
Coumaphos INSECT OP Mod 4.6 36114 281 1
Coumaphos oxon
Metabolite of INSECT (coumaphos) OP
10.2 5
Chlorothalonil FUNG Chloronitrile
65.7 1
Fluvalinate INSECT PYR High 0.88 6864 11280 1
Permethrin total INSECT PYR High 0.11-0.24 226-1248 103 10
Pyrethrins INSECT PYR High
0.02 172 229
50
Table 1. Characteristics of pesticide residues detected in experimental treatment combs Y & G
Active ingredient, purpose of use (FUNG, fungicide; INSECT, insect/acaricide), chemical family (OC, organochlorine; OP, organophosphate; PYR, pyrethroid), toxicity to honey bees (High, highly toxic LD50<2µg/bee; Mod, moderately toxic LD50= 2-11 µg/bee), LD50 values for honey bees, *ppb/bee (converted LD50), detections (ng/g), LOD (limit of detection) * ppb/bee (based on LD/LC50-bee and average fresh weight per bee (128 mg) (Pollinator protection: a bee & pesticide handbook. 1990. C.A Johansen, D.F. Mayer)