c a;b y a;b c p a łi Ìw a arxiv:1611.09128v2 [physics.ins
TRANSCRIPT

Study of linearity of LYSO crystal for HERD calorimeter *
Zheng Quan (权征)a,b Zhi-gang Wang (王志刚)c;1) Ming Xu (徐明)a
Yong-wei Dong (董永伟)a Jun-jing Wang (王俊静)a,b Guang-peng An (安广朋)c
Xin Liu (刘鑫)a Tian-wei Bao (鲍天威)a Li Zhang (张力)a Rui-jie Wang (王瑞杰)a
Jun-guang Lv (吕军光)c Bo-bing Wu (吴伯冰)a Shuang-nan Zhang (张双南)a
a Key Laboratory of Particle Astrophysics, Institute of High Energy Physics, CAS, Beijing 100049, Chinab University of Chinese Academy of Sciences, Beijing 100049, China
c State Key Laboratory of Particle Detection and Electronics, Institute of High Energy Physics, CAS, Beijing 100049, China
Abstract: The High Energy cosmic Radiation Detection (HERD) facility is a space mission designed for detecting
cosmic ray (CR) electrons, γ-rays up to tens of TeV and CR nuclei from proton to iron up to several PeV. The main
instrument of HERD is a 3-D imaging calorimeter (CALO) composed of nearly ten thousand cubic LYSO crystals. A
large dynamic range of single HERD CALO Cell (HCC) is necessary to achieve HERD’s PeV observation objectives,
which means that the response of HCC should maintain a good linearity from minimum ionizing particle (MIP)
calibration to PeV shower maximum. In order to study the linearity of HCC over such a large energy range, a beam
test has been implemented at the E2 and E3 beam lines of BEPC. High intensity pulsed electron beam provided by
E2 line are used for producing high energy density within HCC; π+/proton provided by E3 line are used for HCC
calibration. The results show that no saturation effect occurs and the linearity of HCC is better than 10% from 30
MeV (1 MIP) to 1.1×10³ TeV (energy density is 93 TeV/cm3), which can meet the requirement mentioned above.
Key words: HERD, Calorimeter, LYSO, Linearity, Beam test
PACS: 29.40.Vj, 29.40.Mc
1 Introduction
HERD is one of the space astronomy payloads of thecosmic light house program onboard the China’s SpaceStation. The main scientific objectives of HERD are in-direct dark matter search, precise CR spectrum and com-position measurements up to the knee energy and highenergy γ-ray monitoring and survey [1]. To achieve thesescientific objectives, a 3-D imaging and five-side activecalorimeter is designed to perform high energy resolutionand high statistics measurements of the CR nuclei, elec-trons and positrons, and γ-rays in space. HERD CALOconsists of 21×21×21 cells corresponding to 55 radiationlengths (X0) and 3 nuclear interaction lengths (λI) longi-tudinal, separately. Each HCC is made of a 3×3×3 cm3
cubic LYSO crystal and two spiral WLSFs (Saint GobainBCF91A) as the fluorescence readout. All the WLSF sig-nals are collected by two image intensified CCDs (ICCD)[1, 2].LYSO (Lutetium Yttrium Orthosilicate with Cerium
doping) crystal is one of the best candidates for CALOmaterial. It has the advantages of high density, highlight output, short decay time, and application of thiscrystal in space would be quite easier thanks to the non-hygroscopicity and small temperature coefficient. Thegeneral properties of LYSO are described in Ref. [3–5]Theoretically, the fluorescence intensity of LYSO crystalshould be linear with the energy deposition induced byincident particles. However, saturation effect may occurat high ionization density of the crystal. The linearityof LYSO crystal light output should be studied and un-derstood before application. Results from Monte Carlosimulation show that a dynamical range of 2×10⁶ is re-quired for HCC [1]: A minimum detectable signal downto 30 MeV is required for calibration using MIP; mean-while, the maximum energy deposition induced by PeVproton shower is up to 60 TeV (energy density is about8 TeV/cm3, Fig. 1).
∗ Supported by National Natural Science Foundation of China, Grant No.11327303, Grant No. 11473028 and Grant No. 11675196;International Science and Technology Cooperation Program of China, Grant No. 2015DFA10140; Interdisciplinary Innovation TeamProject of Chinese Academy of Sciences (Research Team of The High Energy cosmic-Radiation Detection); Qianren start-up grant292012312D1117210; Strategic Pioneer Program in Space Science, Chinese Academy of Sciences, Grant No. XDA04075600; YouthInnovation Promotion Association of CAS, Grant NO. 2014009
1) E-mail: [email protected]
2016
1
arX
iv:1
611.
0912
8v2
[ph
ysic
s.in
s-de
t] 1
1 D
ec 2
016
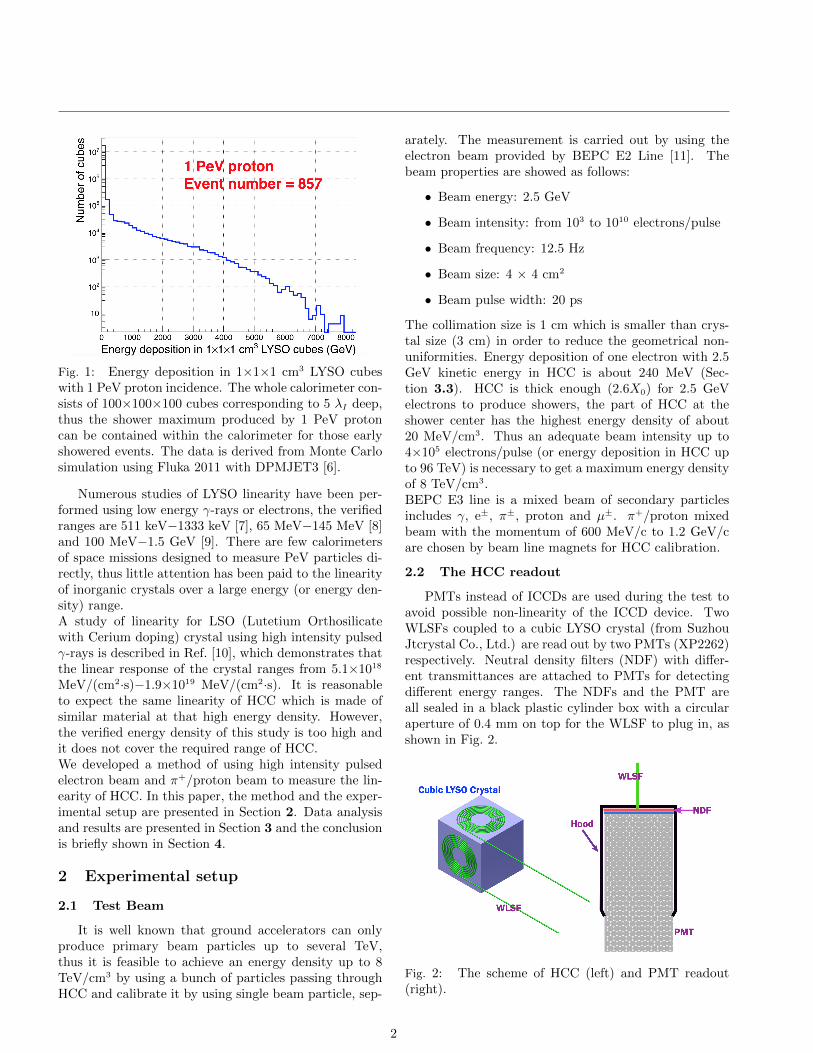
Fig. 1: Energy deposition in 1×1×1 cm3 LYSO cubeswith 1 PeV proton incidence. The whole calorimeter con-sists of 100×100×100 cubes corresponding to 5 λI deep,thus the shower maximum produced by 1 PeV protoncan be contained within the calorimeter for those earlyshowered events. The data is derived from Monte Carlosimulation using Fluka 2011 with DPMJET3 [6].
Numerous studies of LYSO linearity have been per-formed using low energy γ-rays or electrons, the verifiedranges are 511 keV−1333 keV [7], 65 MeV−145 MeV [8]and 100 MeV−1.5 GeV [9]. There are few calorimetersof space missions designed to measure PeV particles di-rectly, thus little attention has been paid to the linearityof inorganic crystals over a large energy (or energy den-sity) range.A study of linearity for LSO (Lutetium Orthosilicatewith Cerium doping) crystal using high intensity pulsedγ-rays is described in Ref. [10], which demonstrates thatthe linear response of the crystal ranges from 5.1×10¹⁸
MeV/(cm2·s)−1.9×1019 MeV/(cm2·s). It is reasonableto expect the same linearity of HCC which is made ofsimilar material at that high energy density. However,the verified energy density of this study is too high andit does not cover the required range of HCC.We developed a method of using high intensity pulsedelectron beam and π+/proton beam to measure the lin-earity of HCC. In this paper, the method and the exper-imental setup are presented in Section 2. Data analysisand results are presented in Section 3 and the conclusionis briefly shown in Section 4.
2 Experimental setup
2.1 Test Beam
It is well known that ground accelerators can onlyproduce primary beam particles up to several TeV,thus it is feasible to achieve an energy density up to 8TeV/cm3 by using a bunch of particles passing throughHCC and calibrate it by using single beam particle, sep-
arately. The measurement is carried out by using theelectron beam provided by BEPC E2 Line [11]. Thebeam properties are showed as follows:
• Beam energy: 2.5 GeV
• Beam intensity: from 103 to 1010 electrons/pulse
• Beam frequency: 12.5 Hz
• Beam size: 4 × 4 cm2
• Beam pulse width: 20 ps
The collimation size is 1 cm which is smaller than crys-tal size (3 cm) in order to reduce the geometrical non-uniformities. Energy deposition of one electron with 2.5GeV kinetic energy in HCC is about 240 MeV (Sec-tion 3.3). HCC is thick enough (2.6X0) for 2.5 GeVelectrons to produce showers, the part of HCC at theshower center has the highest energy density of about20 MeV/cm3. Thus an adequate beam intensity up to4×105 electrons/pulse (or energy deposition in HCC upto 96 TeV) is necessary to get a maximum energy densityof 8 TeV/cm3.BEPC E3 line is a mixed beam of secondary particlesincludes γ, e±, π±, proton and µ±. π+/proton mixedbeam with the momentum of 600 MeV/c to 1.2 GeV/care chosen by beam line magnets for HCC calibration.
2.2 The HCC readout
PMTs instead of ICCDs are used during the test toavoid possible non-linearity of the ICCD device. TwoWLSFs coupled to a cubic LYSO crystal (from SuzhouJtcrystal Co., Ltd.) are read out by two PMTs (XP2262)respectively. Neutral density filters (NDF) with differ-ent transmittances are attached to PMTs for detectingdifferent energy ranges. The NDFs and the PMT areall sealed in a black plastic cylinder box with a circularaperture of 0.4 mm on top for the WLSF to plug in, asshown in Fig. 2.
Fig. 2: The scheme of HCC (left) and PMT readout(right).
2

2.3 Experimental setup at E2 line
Three detectors are used to calibrate the beam inten-sity(Fig. 3):
• Faraday Cup (FC): FC is the only device whichcan measure the absolute beam intensity directly.However, FC is not sensitive enough, it is designedto monitor the beam with intensity >106 elec-trons/pulse;
• Ionization Chamber (IC): designed to monitor thebeam intensity from 104 to 107 electrons/pulse;
• Thin Plastic Scintillator (PS): placed in front ofthe HCC and attached with 2 PMTs for readoutpurpose. The effective detecting range is from 102
to 105 electrons/pulse.
With cross calibration between the three detectors, awide beam intensity from 102 to 109 electrons/pulse canthen be monitored and precisely measured.
Fig. 3: Schematic diagram of experimental setup forlinearity measurement at E2 line.
A lead wall is built for shielding the detectors from thecontamination caused by secondaries from the interac-tion of beam particles with surrounding materials. Sig-nals from FC and IC are recorded by a 12-bit peak sens-ing ADC (Mod. V785N), while signals from 4 PMTs arereadout by a 4-channel digitizer (Mod. DT5751). BothDAQ modules share a common trigger signal from theaccelerator.
2.4 Experimental setup at E3 line
Fig. 4: Schematic diagram of experimental setup forHCC calibration at E3 line, the NDFs are removed andthe high voltages for PMTs are raised to detect the MIPsignal which is much weaker than electron signal.
In the configuration at E3 line, a time of flight sys-tem (TOF) consists of two plastic scintillators are usedfor π+/proton separation as shown in Fig. 4. The triggeris the coincidence of two PMTs attached to the plasticscintillators. DT5751 which can work at a sampling rateof 1 GS/s provides a high time resolution to distinguishproton signals and π+ signals from TOF (Section 3.3).
3 Data analysis
3.1 Calibration of beam intensity monitoringdevices
A cross-calibration between FC, IC and PS is per-formed as shown in Fig. 5.
Fig. 5: Principle of beam intensity calibration. Overlapsbetween the detecting ranges of FC, IC and PS are largeenough for a cross-calibration.
3

3.1.1 FC Calibration
ADC channel0 500 1000 1500 2000 2500 3000 3500
Ele
ctro
n nu
mbe
r
0
20
40
60
80
100
610×
/ ndf 2χ 0.6048 / 13
Slope 185± 2.576e+04
Constant 1.445e+05± 3.911e+05
/ ndf 2χ 0.6048 / 13
Slope 185± 2.576e+04
Constant 1.445e+05± 3.911e+05
Fig. 6: Relationship between injected electron numberand FC output, the x axis is ADC channel; the y axis isnumber of electrons.
Fig. 6 shows good linearity in ADC’s counting range, thecalibration factor is obtained by fitting a straight line todata points:
1 FC Channel= 2.58×10⁴±185 electrons (1)
3.1.2 IC and PS Calibration
The IC and PS detectors are calibrated by study-ing the relationship between FC output and IC output(Fig. 7), IC output and PS output (Fig. 8).
/ ndf 2χ 11.14 / 15
Constant 0.38±7.22 − Slope 0.0008± 0.1433
IC output (ADC channel)0 200 400 600 800 1000 1200 1400 1600
FC
out
put (
AD
C c
hann
el)
0
50
100
150
200 / ndf 2χ 11.14 / 15
Constant 0.38±7.22 − Slope 0.0008± 0.1433
Fig. 7: Profile histogram of IC calibration for displayingthe relationship between FC output and IC output.
ADC channels of IC from 200 to 750 are chosen for fit-ting, because when ADC(IC)>750, rare events wouldlead large fluctuations, and when ADC(IC)<200, signalswould be too close to the baseline.
/ ndf 2χ 177.8 / 52
Constant 0.0381±0.1832 − Slope 0.000007± 0.005748
PS output (Digitizer channel)2000 3000 4000 5000 6000 7000 8000 9000 10000 11000
IC o
utpu
t (A
D c
hann
el)
0
10
20
30
40
50
60 / ndf 2χ 177.8 / 52
Constant 0.0381±0.1832 − Slope 0.000007± 0.005748
Fig. 8: PS calibration, the x axis represents PS out-put (Digitizer channel); the y axis is IC output (ADCchannel), the histogram shows good linearity.
The calibration factors of IC and PS are obtained byfitting to the data:
1 IC Channel= 3697±26 electrons (2)
1 FC Channel= 21.25±0.15 electrons (3)
3.2 NDF Calibration
A measurement of transmittance of NDFs was per-formed before the beam test, we used an optical fiberirradiated by a LED as the light source and a PMT forreadout. The NDF was installed on a linear stage whichcould provide high precision linear movement. The orig-inal signal and attenuated signal could be obtained bymoving the NDF to the position between the light sourceand the PMT. Fig. 9 shows the calibration result of oneNDF.
Output with attenuation (Digitizer channel)
410 510
Out
put w
ithou
t atte
nuat
ion
(Dig
itize
r ch
anne
l)
310
410
/ ndf 2χ 14.01 / 11
p0 0.001901± 0.2326
/ ndf 2χ 14.01 / 11
p0 0.001901± 0.2326
Fig. 9: Calibration result of one NDF with 0.6 opticaldensity(O.D., Transmittance= 10−O.D.).
4

Table 1: Calibration results of the NDFs used in the test.
No. Attached PMT Diameter (mm) Optical density Nominal transmittance Calibrated transmittance
1 L 504 0.6 0.251 0.2326
2 L 504 2 0.01 0.0118
3 H 504 1 0.1 0.0828
4 H 504 3 0.001 0.0010
The total transmittance of attached NDFs are2.8×10−3 and 8.3×10⁻⁵ (Table 1) for the two PMTs (de-fined as PMT L, PMT H), thus the intensity of lightreached to the windows of PMT L is about 34 timeshigher than that reached to PMT H. The dynamic rangeof the HCC readout system is then extended naturallyby combining the two PMTs.
3.3 HCC Calibration using E3 beam
Most of E3 beam particles are protons and π+, TOFdata which clearly illustrates the difference between themin Fig. 10 is needed to separate π+ from proton to get aclean spectrum as shown in Fig. 11.
E3BeamtestEntries 60688Mean 19.62Std Dev 5.929
Time of flight (ns)0 5 10 15 20 25 30 35 40 45 50 55 60
Cou
nt
1
10
210
310
410
E3BeamtestEntries 60688Mean 19.62Std Dev 5.929
Proton
+π
Fig. 10: Time of flight distribution measured by TOFsystem for E3 beam at 800 MeV/c. The unmarked peaksare caused by accidental coincidences.
/ ndf 2χ 3436 / 148
Width 20.5± 180.4
MP 28.6± 4079
Area 3.126e+03± 9.515e+04
GSigma 33.4± 428.2
PMT_H output (Digitizer channel)0 2000 4000 6000 8000 10000 12000 14000 16000 18000 20000
Cou
nt
1−10
1
10
210
310
410 / ndf 2χ 3436 / 148
Width 20.5± 180.4
MP 28.6± 4079
Area 3.126e+03± 9.515e+04
GSigma 33.4± 428.2 +π
proton
Fig. 11: Use the TOF data to separate π+ from protonsand use landau convoluted Gaussian function to fit π+
peak. The incident particle is identified as a π+ when 10ns<TOF<15 ns or a proton when 16 ns<TOF<21 ns.
Energy deposition in HCC for different particles isthen calculated by Monte Carlo simulation using Geant4.9.6 [12]. The simulation environment is built based onthe experimental setup. The results are shown in Fig. 12and Table 2.
Energy deposition is nearly constant for π+ in thecase of normal incident when its momentum >400MeV/c; for 2.5 GeV electrons, energy deposition is muchhigher because electromagnetic showers are initiated in-side the crystal.
Energy Deposition in HCC(GeV)0 0.02 0.04 0.06 0.08 0.1 0.12 0.14 0.16 0.18 0.2 0.22 0.24 0.26 0.28 0.3
Nor
mal
ized
cou
nt
0
0.02
0.04
0.06
0.08
0.1
0.12
0.14 2.5GeV electron+π1.2GeV/c
1.2GeV/c proton0.8GeV/c proton0.6GeV/c proton
Fig. 12: Energy deposition in HCC for π+, protons andelectrons derived from Mote Carlo simulation data.
3.4 Results and Discussions
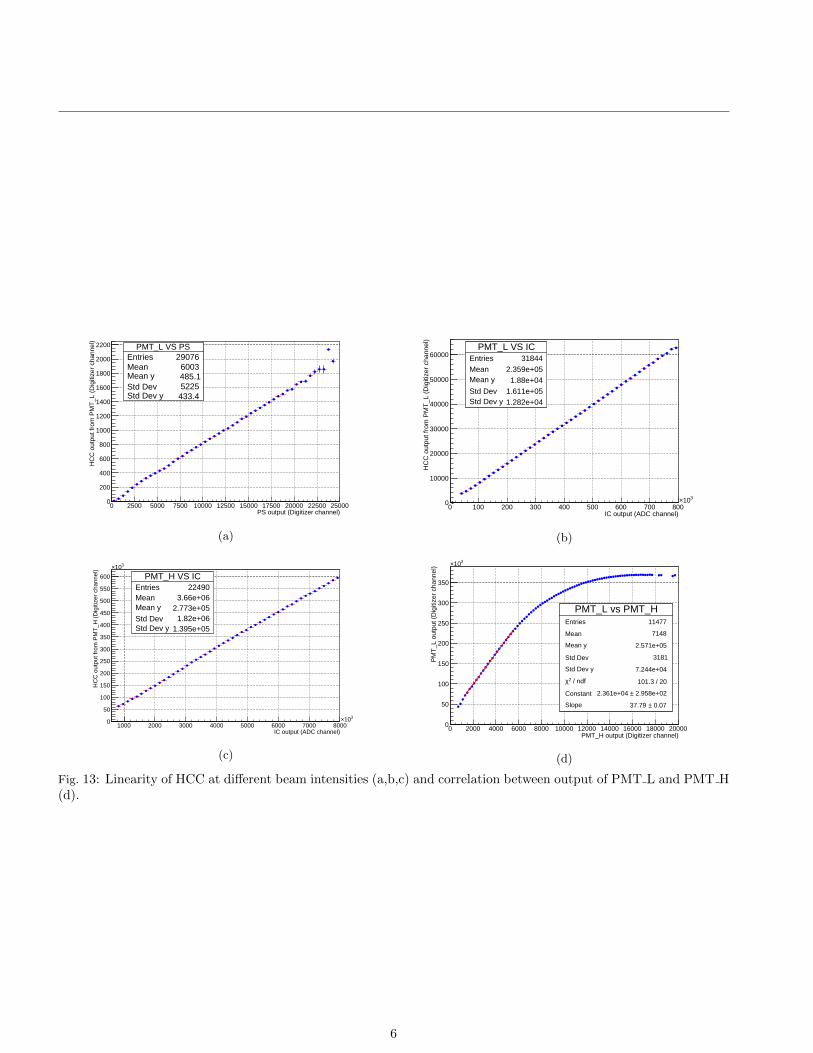
The results of linearity at different beam intensitiesas well as correlation between output of PMT L andPMT H are illustrated in Fig. 13.To calculate the equivalent HCC output for proton andπ+, the NDFs’ attenuate effect and the change of highvoltage for PMTs should be taken into account:
HCCπ+,proton =AHVAFSπ+,proton (4)
Where AHV represents the high voltage correctionfactor which is defined as the ratio of two gains of PMTsused by E2 test and E3 test; AF represents the totaltransmittance of NDFs used in E2 test; Sπ+,proton repre-sents the PMT output given by E3 test (Table 2). Fig. 14shows the profile histogram which combines all the re-sults for different intensity ranges as well as π+ and pro-tons.
5
PMT_L VS PSEntries 29076Mean 6003Mean y 485.1Std Dev 5225Std Dev y 433.4
PS output (Digitizer channel)0 2500 5000 7500 10000 12500 15000 17500 20000 22500 25000
HC
C o
utpu
t fro
m P
MT
_L (
Dig
itize
r ch
anne
l)
0
200
400
600
800
1000
1200
1400
1600
1800
2000
2200 PMT_L VS PSEntries 29076Mean 6003Mean y 485.1Std Dev 5225Std Dev y 433.4
(a)
PMT_L VS ICEntries 31844Mean 2.359e+05Mean y 1.88e+04Std Dev 1.611e+05Std Dev y 1.282e+04
IC output (ADC channel)0 100 200 300 400 500 600 700 800
310×
HC
C o
utpu
t fro
m P
MT
_L (
Dig
itize
r ch
anne
l)
0
10000
20000
30000
40000
50000
60000PMT_L VS IC
Entries 31844Mean 2.359e+05Mean y 1.88e+04Std Dev 1.611e+05Std Dev y 1.282e+04
(b)
PMT_H VS ICEntries 22490Mean 3.66e+06Mean y 2.773e+05Std Dev 1.82e+06Std Dev y 1.395e+05
IC output (ADC channel)1000 2000 3000 4000 5000 6000 7000 8000
310×
HC
C o
utpu
t fro
m P
MT
_H (
Dig
itize
r ch
anne
l)
0
50
100
150
200
250
300
350
400
450
500
550
600
310×
PMT_H VS ICEntries 22490Mean 3.66e+06Mean y 2.773e+05Std Dev 1.82e+06Std Dev y 1.395e+05
(c)
PMT_L vs PMT_HEntries 11477
Mean 7148
Mean y 2.571e+05
Std Dev 3181
Std Dev y 7.244e+04
/ ndf 2χ 101.3 / 20
Constant 2.958e+02± 2.361e+04
Slope 0.07± 37.79
PMT_H output (Digitizer channel)0 2000 4000 6000 8000 10000 12000 14000 16000 18000 20000
PM
T_L
out
put (
Dig
itize
r ch
anne
l)
0
50
100
150
200
250
300
350
310×
PMT_L vs PMT_HEntries 11477
Mean 7148
Mean y 2.571e+05
Std Dev 3181
Std Dev y 7.244e+04
/ ndf 2χ 101.3 / 20
Constant 2.958e+02± 2.361e+04
Slope 0.07± 37.79
(d)
Fig. 13: Linearity of HCC at different beam intensities (a,b,c) and correlation between output of PMT L and PMT H(d).
6

Table 2: Summary of simulation results and experimental results of beam test at E3.
Particle type Momentum (MeV/c)Energy deposition from
MC simulation data(MeV)
Peak Value from experimental
data (Digitizer channel)
Sigma from experimental
data (Digitizer channel)
π+ 600-1200 28.0 4079 428.2
Proton 600 80.4 11644.6 783.1
Proton 800 52.0 7796.4 630.9
Proton 1200 36.6 5715.4 564.8
Electron Ekinetic= 2.5GeV 236.7
Energy Deposition(GeV)2−10 1−10 1 10 210 310 410 510 610 710 810
HC
C o
utpu
t
2−10
1−10
1
10
210
310
410
510
610
710Electron beam(E2 line)
(E3 line)+π1.2GeV/c proton(E3 line)0.8GeV/c proton(E3 line)0.6GeV/c proton(E3 line)
(a)
Energy Deposition(GeV)2−10 1−10 1 10 210 310 410 510 610 710
Dev
iatio
n fr
om fi
tting
line
0.5−
0.4−
0.3−
0.2−
0.1−
0
0.1
0.2
0.3
0.4
0.5 Electron beam(E2 line)
(E3 line)+π1.2GeV/c proton(E3 line)
0.8GeV/c proton(E3 line)
0.6GeV/c proton(E3 line)
(b)
Fig. 14: Linearity of HCC (a) and deviations from the fit-ting line (b) for all ranges. The magnets at E2 cannot beprecisely controlled to achieve an intensity lower than 200electrons/pulse, thus a huge gap without measurementpoints is located in between electrons and π+/protons.
The maximum deviation is defined as linearity ofHCC. Fig. 14 shows the linearity is better than 10% whenenergy deposition (energy density) in HCC are from 205GeV (17 GeV/cm3 ) to 1.1×10³ TeV (93 TeV/cm3) whichcovers the requirement. The π+ and proton signals agreewell with the fitting function.
There are some factors that may affect the measure-ment result of linearity:
a) Non-linearity of PMTs: Non-linearity of two PMTswas studied before the beam test. The details of
measurement are described in [13]. Result showsthe non-linearity of PMT is less than 2% when theoutput signal is not higher than 2 V. NDFs withhigh attenuation are used in the beam test to en-sure the output signals are lower than 2 V.
b) Stability of PMTs: Before data acquisition, thehigh voltage of PMTs are usually switched on atleast two hours in advance, the response of PMTsgradually become stable in this period. The tem-perature variation may also cause a drift. To min-imize such effect, one full data acquisition is com-pleted within 3 hours and the data acquisition isrepeated several times. The temperature variationduring the beam test is smaller than 2℃. There-fore, this residual influence is negligible comparingto the calibration error.
c) Backgrounds at E2 line: The backgrounds are sec-ondary particles from the interaction of beam elec-trons with shielding material. Most of the back-grounds are X-rays and γ-rays. One part of themare absorbed by the LYSO crystal. But the ratioof signal to background is lower than 2% (Fig. 15)which do not have significant impacts on the mea-surement.
Fig. 15: The background data is obtained by mov-ing HCC 3 cm away from the beam line. In thiscase, only secondary particles can hit on HCC.Both beam signal and background have a linearrelationship with the beam intensity, the ratio ofsignal to background is about 1.7%.
7

d) Calibration Error: Because the FC has a largesize, perfect shielding is nearly impossible. Pri-mary electrons may hit on FC directly and leadto an overestimation of beam intensity. The largefluctuation of FC response can also have an influ-ence on the accuracy of IC and PS calibration.
4 Conclusion
In this paper, the linearity of LYSO crystal for HCCis studied by measuring the relationship between HCCoutput and electron beam intensity given by faradaycup, ionization chamber and plastic scintillator. Thelinearity is better than 10% from 205 GeV to 1.1×10³
TeV (or from 17 GeV/cm3 to 93 TeV/cm3) which meetsthe requirement of PeV hadron detection. The linear
range can be extrapolated to π+ (MIP, 30MeV) and pro-tons. No obvious saturation effect of HCC is observed inthis range. The uncertainty of linearity measurement ismainly dominated by the measurement system and beammonitoring system.From this work, we get a preliminary conclusion that theLYSO has a good linearity and can be used in HERDCALO for detecting high energy particles. A beam testat CERN SPS, which can supply electrons and protonswith energies up to 300 GeV, is planned to verify mainperformances of HERD CALO.
Acknowledgement
We are thankful to Jianchao Sun, Xuan Zhang, Xi-aofeng Zhang and Zhe Ning for their support.
References
1 S.N. Zhang, O. Adriani, S. Albergo, et al., The high energycosmic-radiation detection (HERD) facility onboard China’sSpace Station, in proceedings of SPIE 9144, Space Tele-scopes and Instrumentation 2014: Ultraviolet to Gamma Ray,91440X (July 31, 2014), edited by Tadayuki Takahashi, Jan-Willem A. den Herder and M. Bautz.
2 Yongwei Dong, Zheng Quan, Junjing Wang, et al., Experi-mental verification of the HERD prototype at CERN SPS, inproceedings of SPIE 9905, Space Telescopes and Instrumen-tation 2016: Ultraviolet to Gamma Ray, 99056D (July 11,2016), edited by Jan-Willem A. den Herder; Tadayuki Taka-hashi; Marshall Bautz.
3 Jianming Chen, Liyuan Zhang, Ren-yuan Zhu, Nuclear Instru-ments and Methods in Physics Research Section A: Acceler-ators, Spectrometers, Detectors and Associated Equipment,572(1): 218-224 (2007)
4 Fan Yang, Rihua Mao, Liyuan Zhang, Ren-Yuan Zhu, Nu-clear Instruments and Methods in Physics Research Section A:Accelerators, Spectrometers, Detectors and Associated Equip-ment, 784: 105-110 (2015)
5 Ren-Yuan Zhu, Physics Procedia, 37(2), 372-383 (2012).6 A. Ferrari, P. Sala, A. Fasso, J. Ranft, FLUKA: A multi-
particle transport code (Program version 2005), CERN-2005-
10, INFN/TC-05/11, SLAC-R-773.7 K. G. Afanaciev, A. M. Artikov, V. Yu. Baranov, et al., Physics
of Particles and Nuclei Letters, 12(2): 319-324 (2015).8 A. Berra, V. Bonvicini, C. Cecchi, et al., Nuclear Instruments
and Methods in Physics Research Section A: Accelerators,Spectrometers, Detectors and Associated Equipment, 763: 248-254 (2014)
9 Kou Oishi on behalf of the COMET Collaboration, Devel-opment of electromagnetic calorimeter using GSO and LYSOcrystals for the J-PARC muon-to-electron conversion search ex-periment, in proceedings of Nuclear Science Symposium andMedical Imaging Conference (NSS/MIC), 2014 IEEE (8-15November, 2014).
10 X.Y. GUAN, Z.C. ZHANG, W.Y. ZHANG, Atomic Energy Sci-ence and Technology, 43(10): 942-945 (2009) (in Chinese).
11 http://english.ihep.cas.cn/rh/rd/dep/sywlbtbf/sywlbtbf_
articles/201110/W020120606406778866830.pdf, retrieved Oc-tober 2011.
12 S. Agostinelli, J. Allison, K. Amako, et al., Nuclear Instrumentsand Methods in Physics Research, Section A: Accelerators,Spectrometers, Detectors and Associated Equipment, 506(3):250-303 (2003).
13 HAMAMATSU PHOTONICS K. K., PHOTOMULTIPLIERTUBES: Basics and Applications, Third edition (HAMA-MATSU PHOTONICS K. K., 2007), p. 54-58.
8